
CryptoJargon69
2.1k Posts

CryptoJargon69
 Square Verified
Report
Block User
6 Following
2.4K+ Followers
693 Liked
Posts
All
Videos
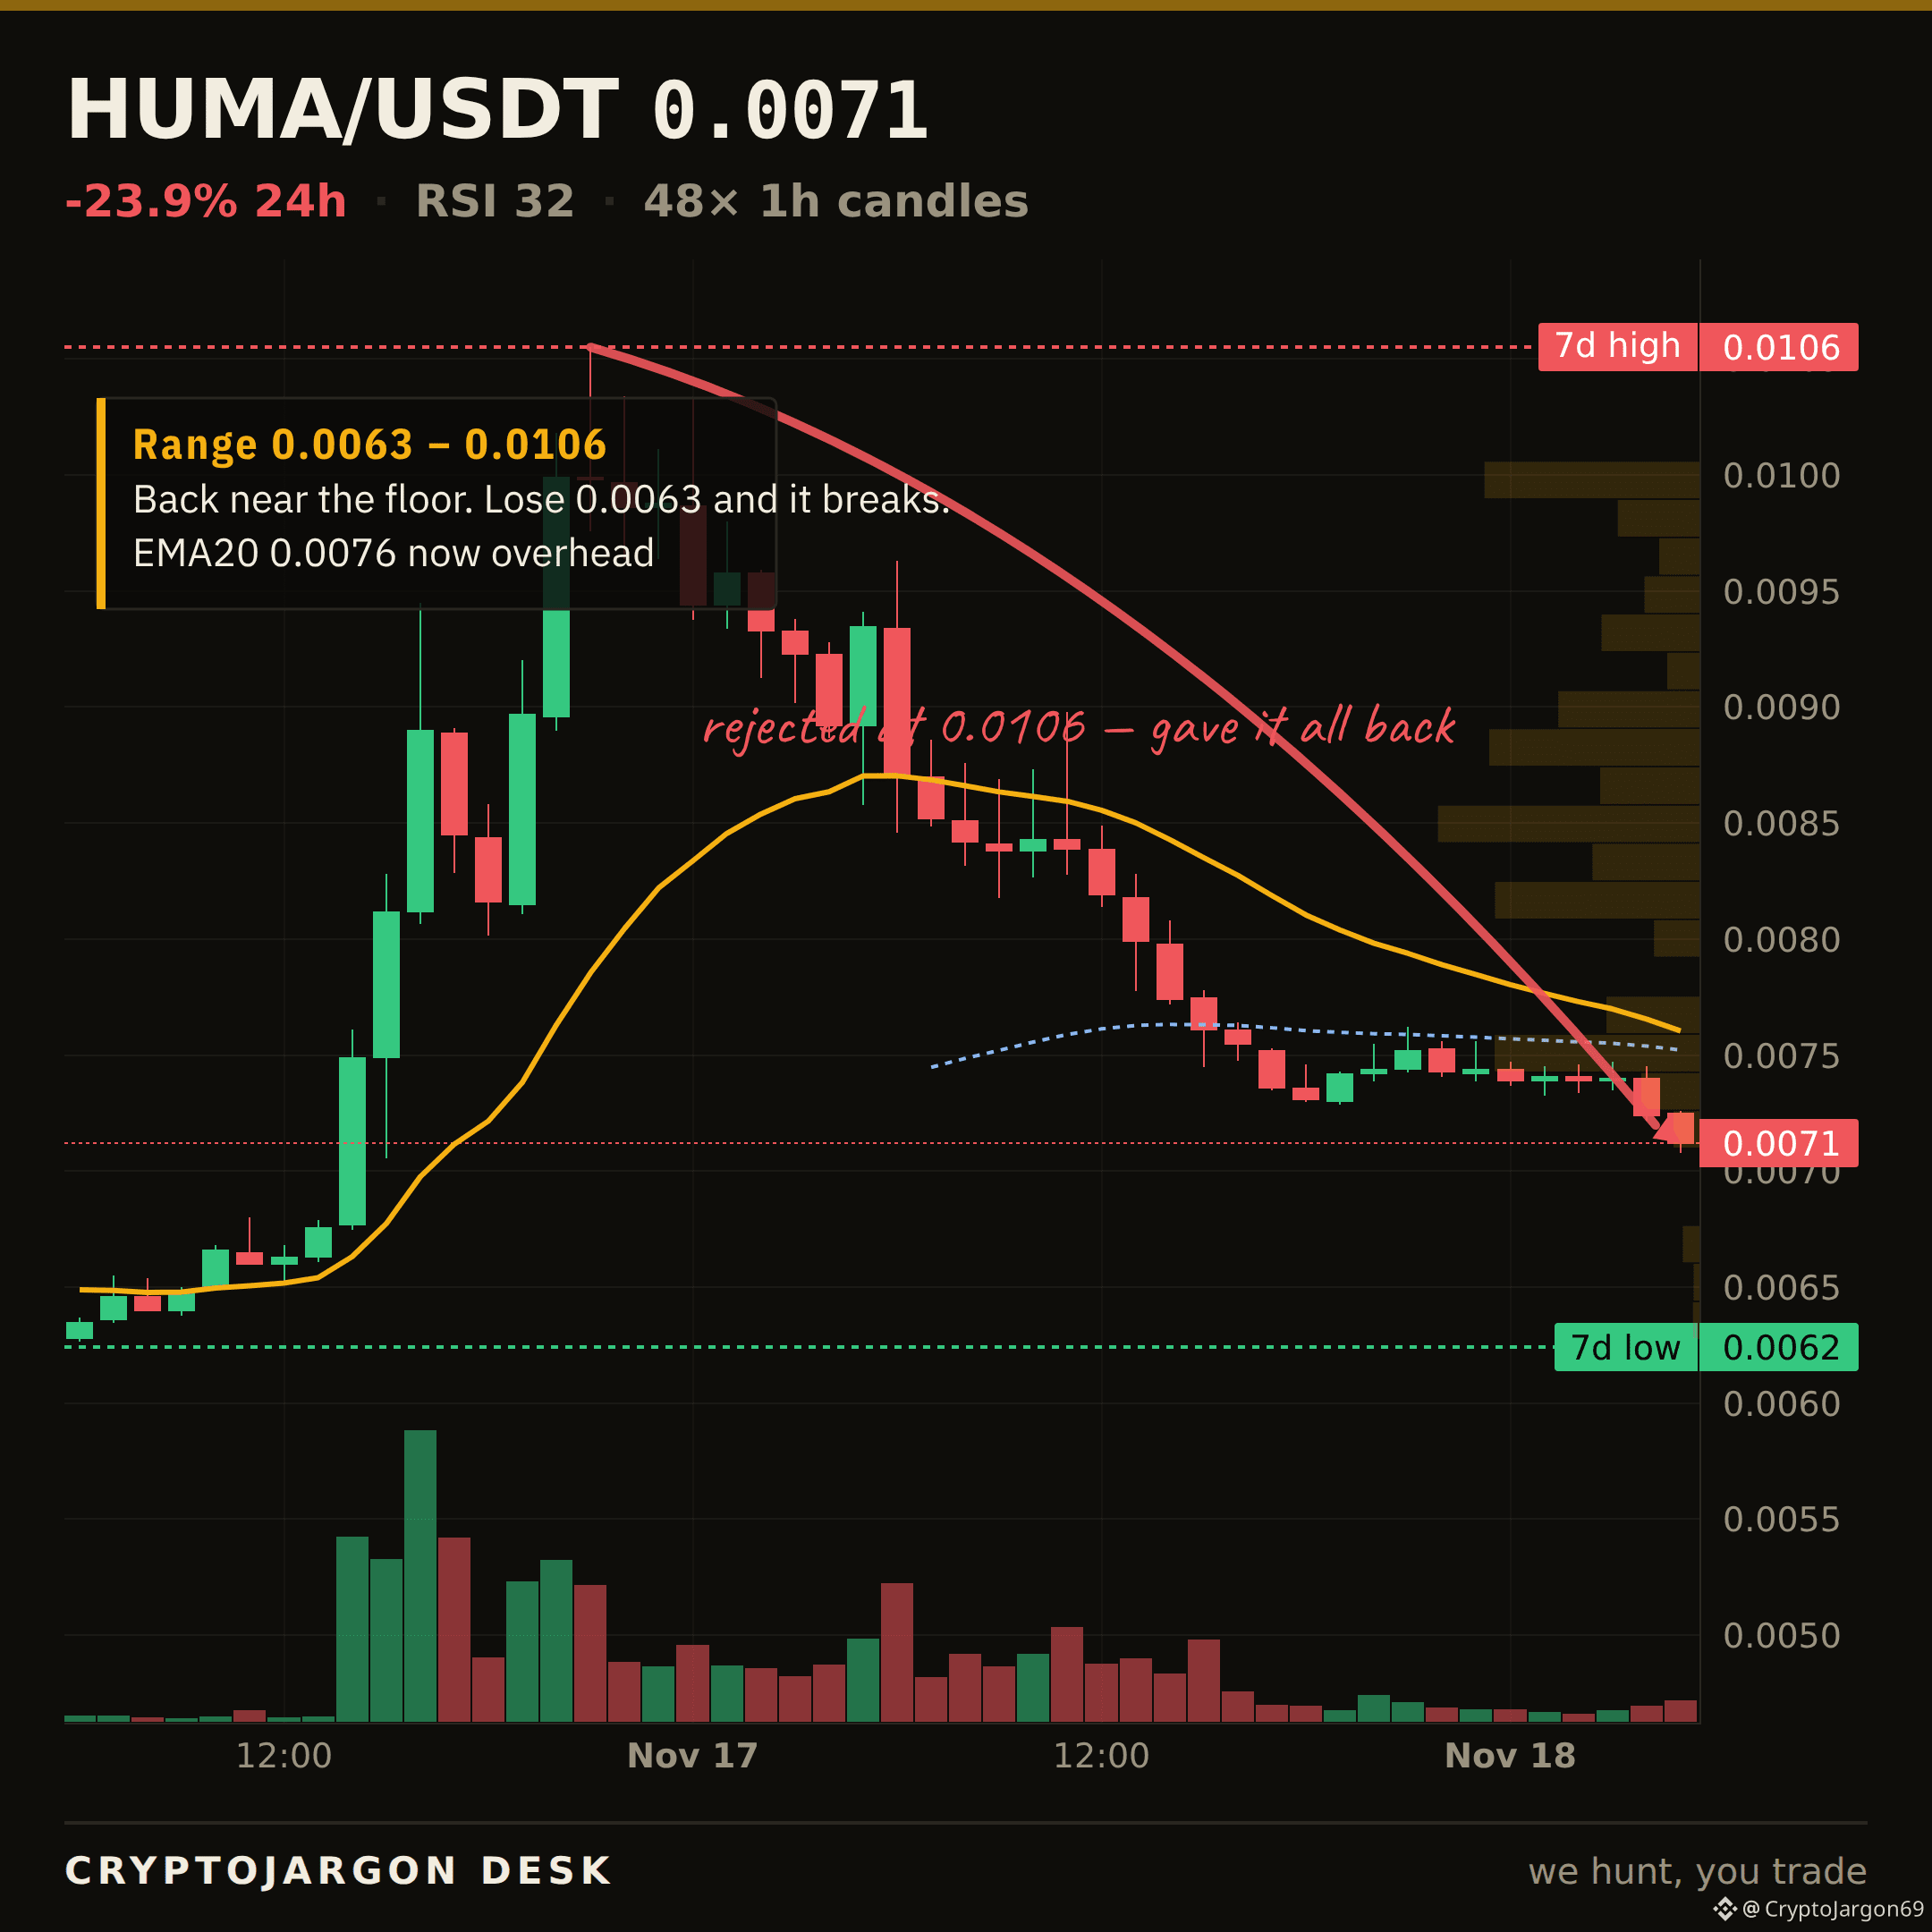
$HUMA · THE LEVEL BROKE
It gave way.
$0.00729 was the floor we flagged on $HUMA. Price closed below it — $0.00712 now. The range beneath opens up, and that line flips into the ceiling it has to win back.
Reclaim from here, or is this the start of the next leg down?
$HUMA
$HUMA · THE LEVEL BROKE
It gave way.
$0.00729 was the floor we flagged on $HUMA . Price closed below it — $0.00712 now. The range beneath opens up, and that line flips into the ceiling it has to win back.
Reclaim from here, or is this the start of the next leg down?
$HUMA
It gave way.
$0.00729 was the floor we flagged on $HUMA . Price closed below it — $0.00712 now. The range beneath opens up, and that line flips into the ceiling it has to win back.
Reclaim from here, or is this the start of the next leg down?
$HUMA
2
2
1k
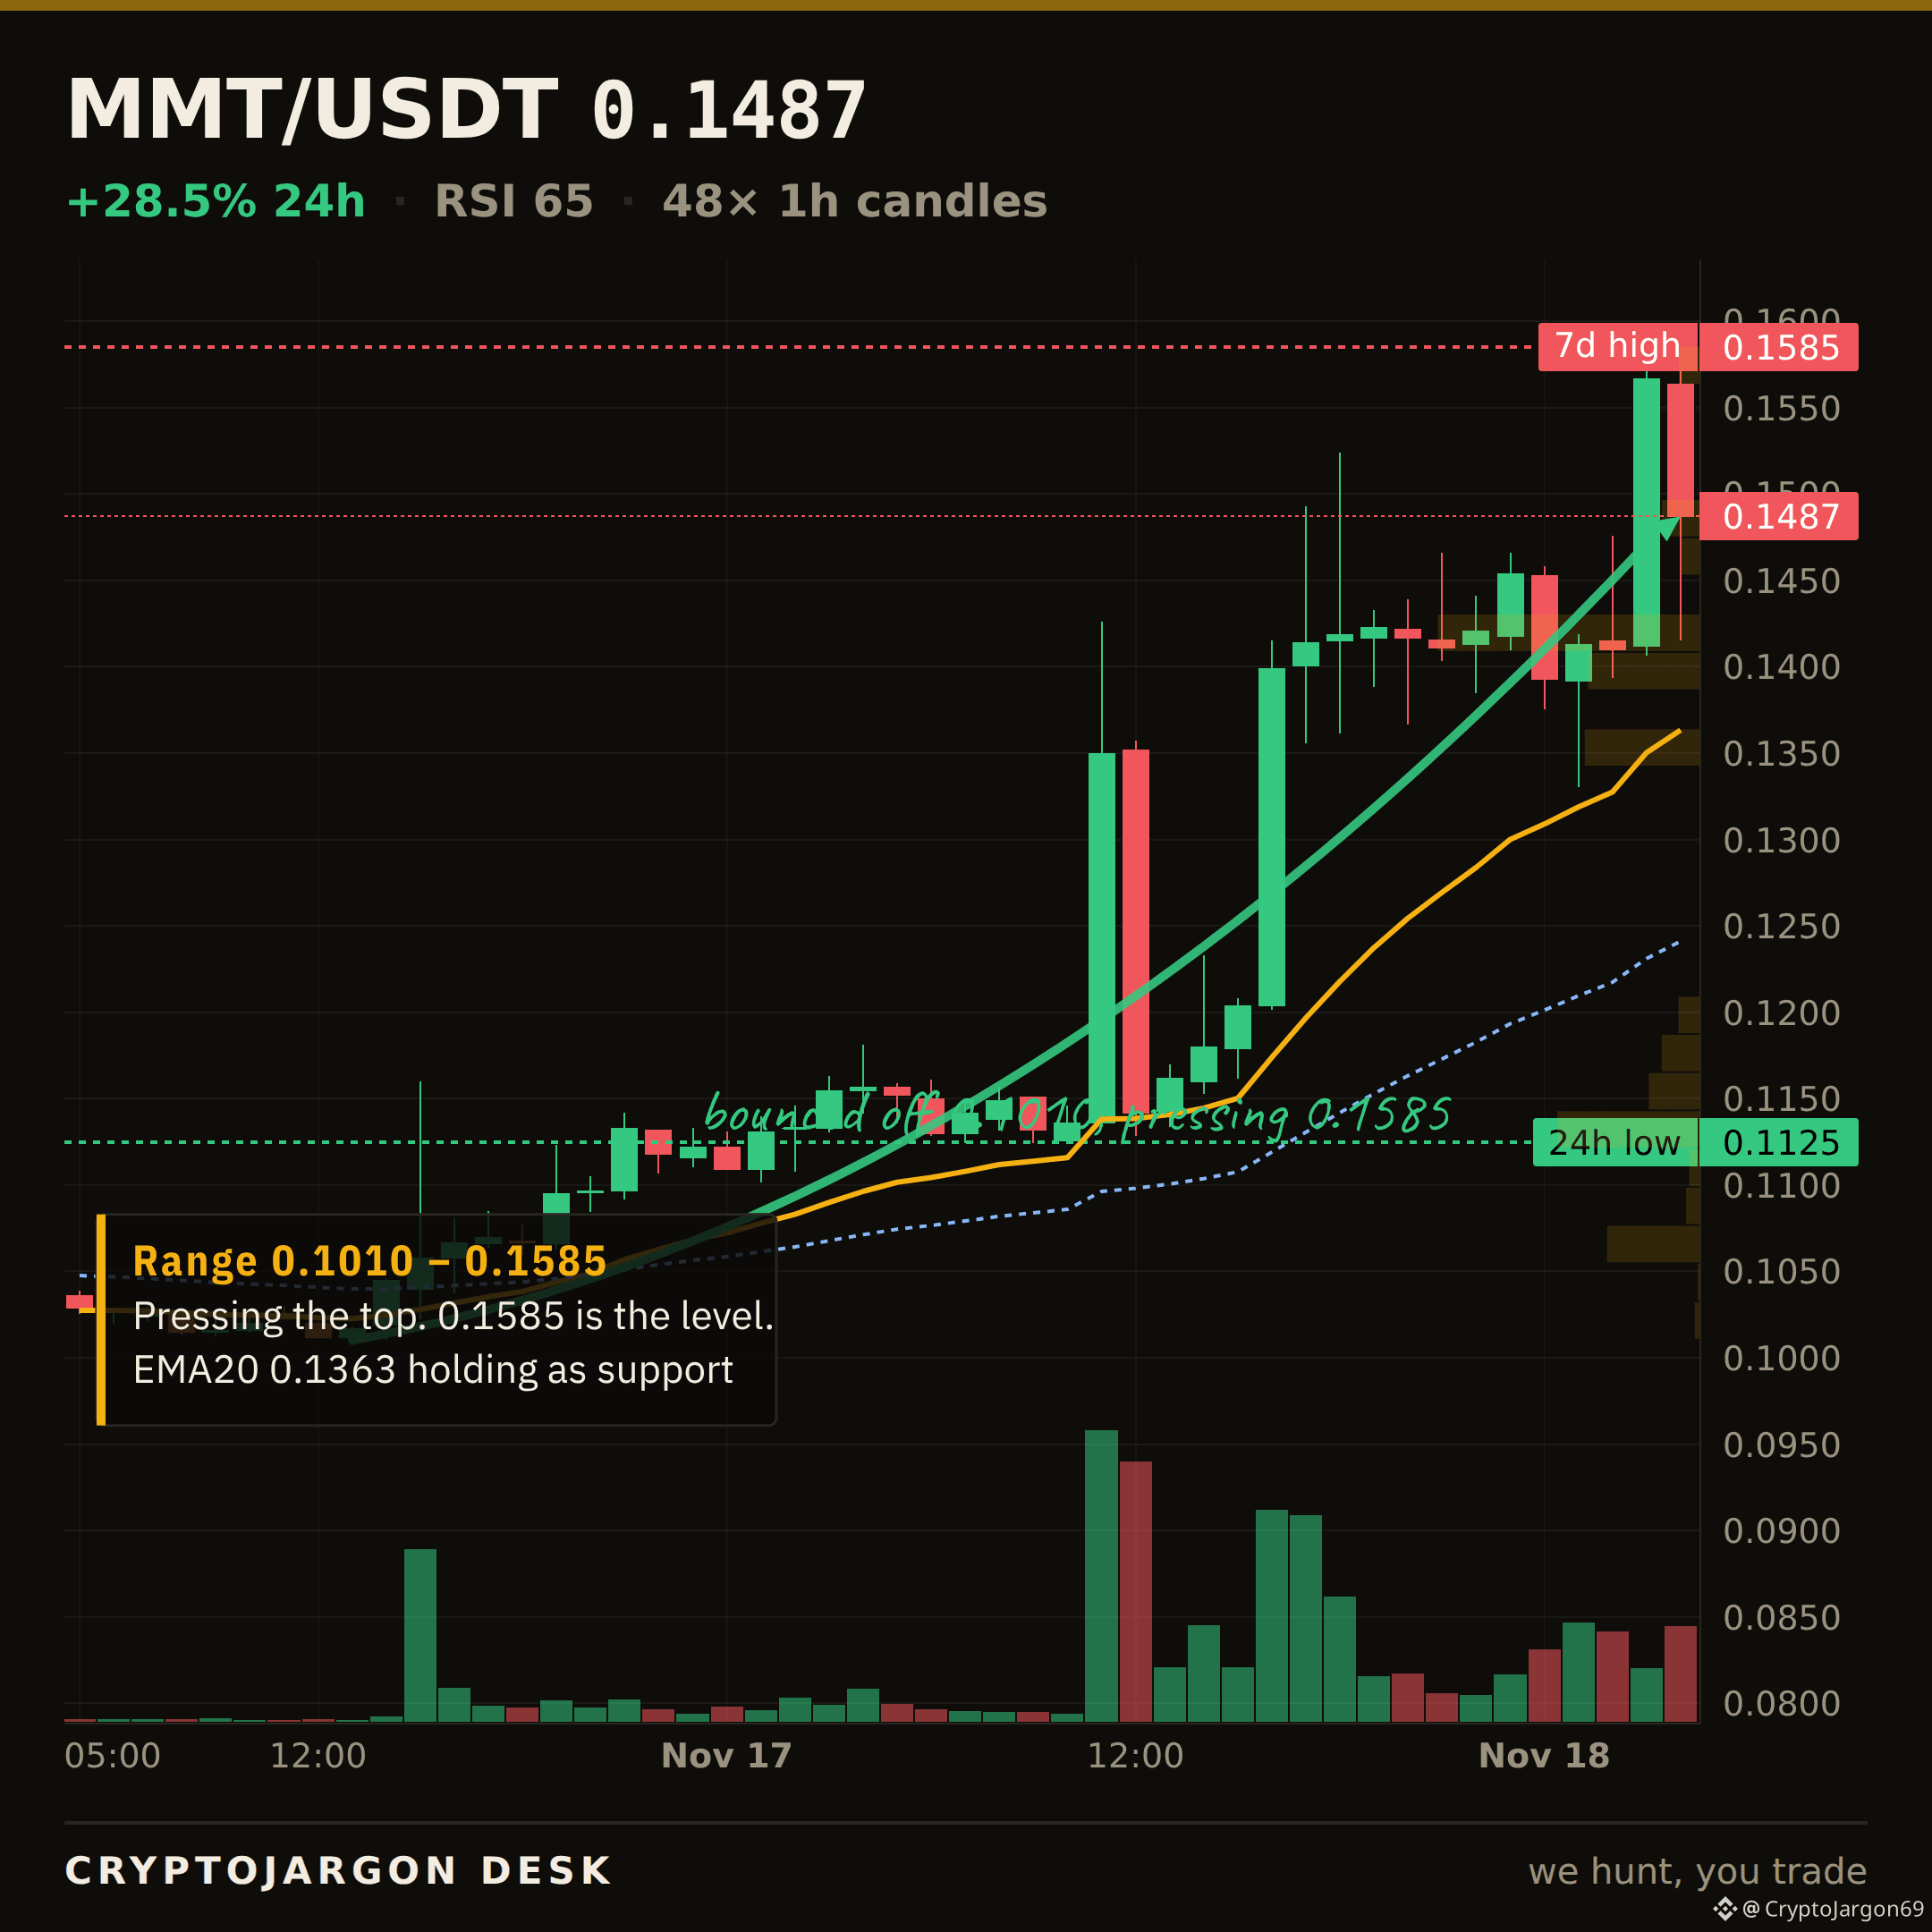
$MMT · MARKET STRUCTURE
$0.149, +28.5% on the day.
Trend — price above both EMAs, the 20 over the 50.
Momentum — RSI 65.
Range — 79% up its 24h range ($0.113–$0.159).
Trend, momentum and range mostly point the same way — an aligned tape to the upside.
Levels: $0.159 24h high (ceiling) · $0.113 24h low (support) · 7d range $0.0945–$0.159.
Chart: 1H candles, EMA20/50 + levels marked. $MMT
$MMT · MARKET STRUCTURE
$0.149, +28.5% on the day.
Trend — price above both EMAs, the 20 over the 50.
Momentum — RSI 65.
Range — 79% up its 24h range ($0.113–$0.159).
Trend, momentum and range mostly point the same way — an aligned tape to the upside.
Levels: $0.159 24h high (ceiling) · $0.113 24h low (support) · 7d range $0.0945–$0.159.
Chart: 1H candles, EMA20/50 + levels marked. $MMT
$0.149, +28.5% on the day.
Trend — price above both EMAs, the 20 over the 50.
Momentum — RSI 65.
Range — 79% up its 24h range ($0.113–$0.159).
Trend, momentum and range mostly point the same way — an aligned tape to the upside.
Levels: $0.159 24h high (ceiling) · $0.113 24h low (support) · 7d range $0.0945–$0.159.
Chart: 1H candles, EMA20/50 + levels marked. $MMT
1
141
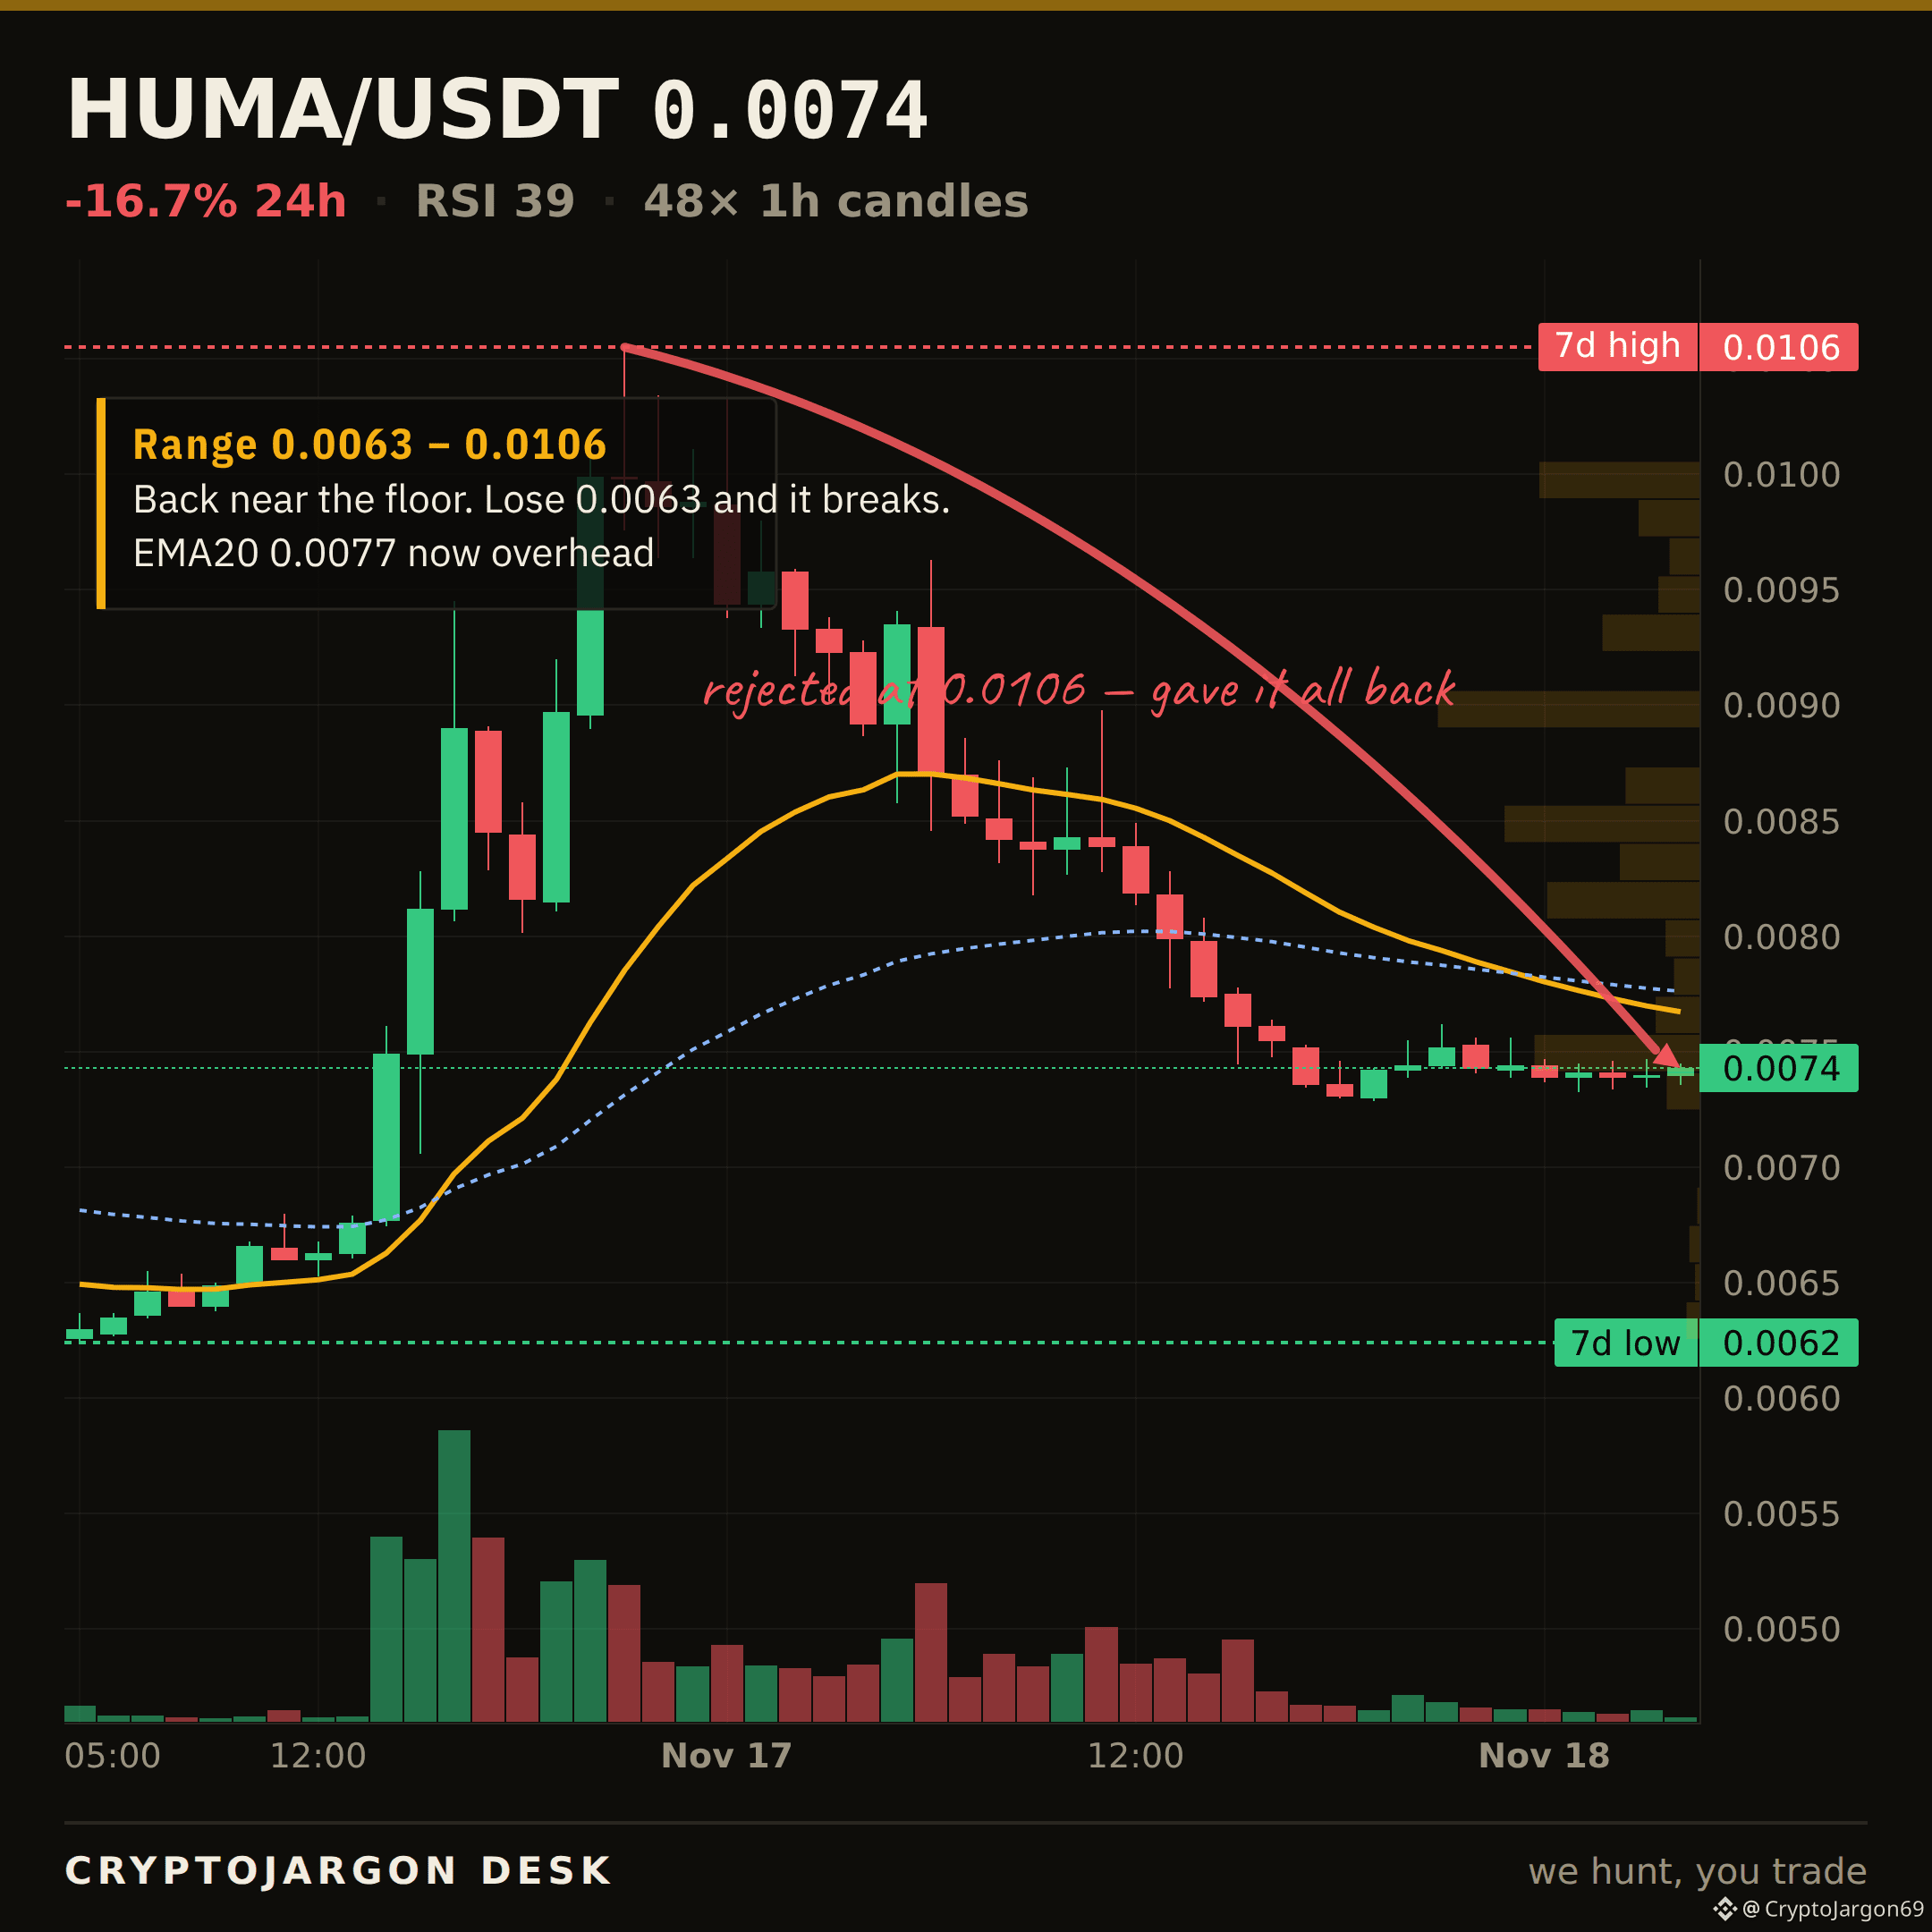
$HUMA · LEVEL TO WATCH
$0.00743 now.
The line that matters is $0.00729 — the 24h low, the floor the tape is sitting on.
Holding $0.00729 keeps the structure intact; a clean close below opens the range beneath it. I'll follow up when it resolves.
Chart: the level is on it. $HUMA
$HUMA · LEVEL TO WATCH
$0.00743 now.
The line that matters is $0.00729 — the 24h low, the floor the tape is sitting on.
Holding $0.00729 keeps the structure intact; a clean close below opens the range beneath it. I'll follow up when it resolves.
Chart: the level is on it. $HUMA
$0.00743 now.
The line that matters is $0.00729 — the 24h low, the floor the tape is sitting on.
Holding $0.00729 keeps the structure intact; a clean close below opens the range beneath it. I'll follow up when it resolves.
Chart: the level is on it. $HUMA
1
2
548
Article
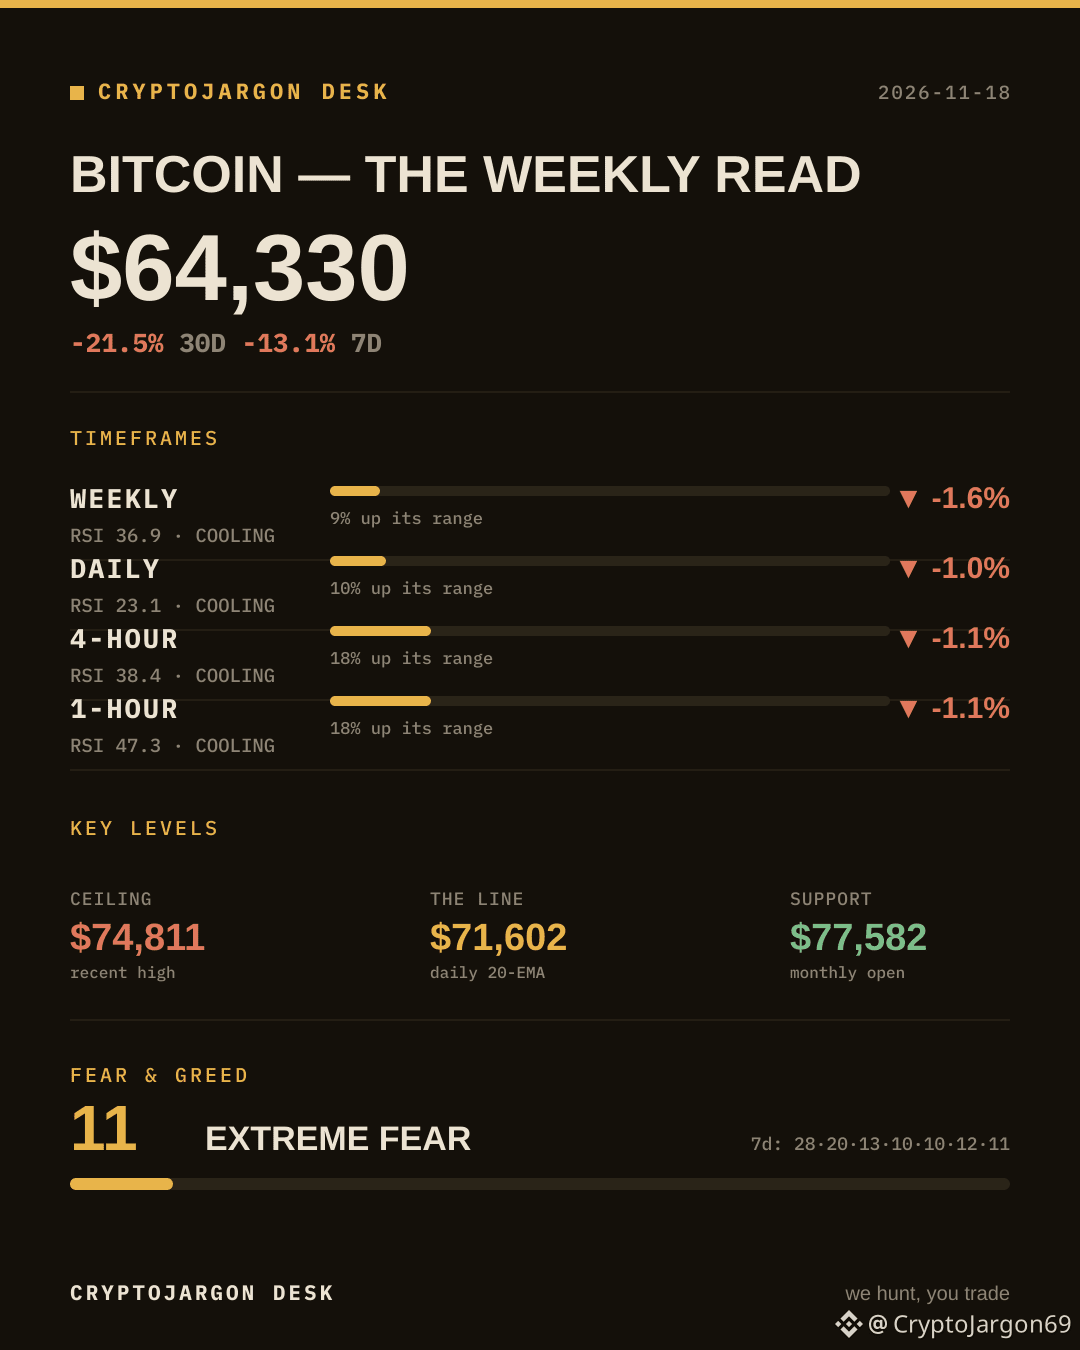
Bitcoin: The Weekly Read — Every Timeframe on One MapBitcoin sits at $64,330 after a slide that has it 21.5% lower over thirty days and -13.1% on the week. Fear & Greed reads 11 (Extreme Fear). Here is what every timeframe is actually saying, top down.
THE 30-DAY / 7-DAY FRAME
-21.5% over thirty days, -13.1% on the week. The month is the trend; the week is the noise around it. Keep both in view — the higher timeframes carry the weight, the lower ones carry the swings.
WEEKLY
RSI 36.9 — soft. The trend here reads cooling: price is below the 20-EMA ($74,562) and below the 50-EMA ($79,705), with the 20 still under the 50. It is sitting 9% up its range ($62,006–$87,396); the last closed candle came on a heavy 1.45x its average volume. On the weekly, the $79,705 50-EMA is the line the longer trend pivots on.
DAILY
RSI 23.1 — washed out. The trend here reads cooling: price is below the 20-EMA ($71,602) and below the 50-EMA ($76,142), with the 20 still under the 50. It is sitting 10% up its range ($62,006–$84,898); the last closed candle came on a heavy 1.57x its average volume. The daily is the structure that matters most for the swing.
4-HOUR
RSI 38.4 — soft. The trend here reads cooling: price is below the 20-EMA ($65,300) and below the 50-EMA ($68,223), with the 20 still under the 50. It is sitting 18% up its range ($62,006–$74,811); the last closed candle came on a light 0.84x its average volume. This is where the intraday chop lives.
1-HOUR
RSI 47.3 — neutral. The trend here reads cooling: price is below the 20-EMA ($64,449) and below the 50-EMA ($64,579), with the 20 still under the 50. It is sitting 18% up its range ($62,006–$74,811); the last closed candle came on a light 0.75x its average volume. Shortest-term, this is momentum, not trend — treat it as timing, not direction.
THE LEVELS THAT MATTER
$74,811 — the recent high, the ceiling to clear.
$71,602 — the daily 20-EMA, the line price is riding. Hold above it and the trend is fine; lose it and momentum shifts.
$77,582 — the monthly open, the first real support below. Lose it and the $62,006 area comes into play.
SENTIMENT
Fear & Greed at 11 (Extreme Fear), tracing 28, 20, 13, 10, 10, 12, 11 across the week. Fear this deep is usually closer to a floor than a top.
THE SYNTHESIS
The higher timeframes have lost their edge here. Until the daily reclaims its moving averages and the $71,602 line, rallies are corrective, not trend. $77,582 is the level that decides whether this is a pause or a turn.
For now: watch $71,602 on the way down and $74,811 on the way up. Everything in between is range.
Where are you leaning from here — continuation, or a retest of $77,582?
$BTC
Bitcoin: The Weekly Read — Every Timeframe on One Map
Bitcoin sits at $64,330 after a slide that has it 21.5% lower over thirty days and -13.1% on the week. Fear & Greed reads 11 (Extreme Fear). Here is what every timeframe is actually saying, top down.
THE 30-DAY / 7-DAY FRAME
-21.5% over thirty days, -13.1% on the week. The month is the trend; the week is the noise around it. Keep both in view — the higher timeframes carry the weight, the lower ones carry the swings.
WEEKLY
RSI 36.9 — soft. The trend here reads cooling: price is below the 20-EMA ($74,562) and below the 50-EMA ($79,705), with the 20 still under the 50. It is sitting 9% up its range ($62,006–$87,396); the last closed candle came on a heavy 1.45x its average volume. On the weekly, the $79,705 50-EMA is the line the longer trend pivots on.
DAILY
RSI 23.1 — washed out. The trend here reads cooling: price is below the 20-EMA ($71,602) and below the 50-EMA ($76,142), with the 20 still under the 50. It is sitting 10% up its range ($62,006–$84,898); the last closed candle came on a heavy 1.57x its average volume. The daily is the structure that matters most for the swing.
4-HOUR
RSI 38.4 — soft. The trend here reads cooling: price is below the 20-EMA ($65,300) and below the 50-EMA ($68,223), with the 20 still under the 50. It is sitting 18% up its range ($62,006–$74,811); the last closed candle came on a light 0.84x its average volume. This is where the intraday chop lives.
1-HOUR
RSI 47.3 — neutral. The trend here reads cooling: price is below the 20-EMA ($64,449) and below the 50-EMA ($64,579), with the 20 still under the 50. It is sitting 18% up its range ($62,006–$74,811); the last closed candle came on a light 0.75x its average volume. Shortest-term, this is momentum, not trend — treat it as timing, not direction.
THE LEVELS THAT MATTER
$74,811 — the recent high, the ceiling to clear.
$71,602 — the daily 20-EMA, the line price is riding. Hold above it and the trend is fine; lose it and momentum shifts.
$77,582 — the monthly open, the first real support below. Lose it and the $62,006 area comes into play.
SENTIMENT
Fear & Greed at 11 (Extreme Fear), tracing 28, 20, 13, 10, 10, 12, 11 across the week. Fear this deep is usually closer to a floor than a top.
THE SYNTHESIS
The higher timeframes have lost their edge here. Until the daily reclaims its moving averages and the $71,602 line, rallies are corrective, not trend. $77,582 is the level that decides whether this is a pause or a turn.
For now: watch $71,602 on the way down and $74,811 on the way up. Everything in between is range.
Where are you leaning from here — continuation, or a retest of $77,582?
$BTC
THE 30-DAY / 7-DAY FRAME
-21.5% over thirty days, -13.1% on the week. The month is the trend; the week is the noise around it. Keep both in view — the higher timeframes carry the weight, the lower ones carry the swings.
WEEKLY
RSI 36.9 — soft. The trend here reads cooling: price is below the 20-EMA ($74,562) and below the 50-EMA ($79,705), with the 20 still under the 50. It is sitting 9% up its range ($62,006–$87,396); the last closed candle came on a heavy 1.45x its average volume. On the weekly, the $79,705 50-EMA is the line the longer trend pivots on.
DAILY
RSI 23.1 — washed out. The trend here reads cooling: price is below the 20-EMA ($71,602) and below the 50-EMA ($76,142), with the 20 still under the 50. It is sitting 10% up its range ($62,006–$84,898); the last closed candle came on a heavy 1.57x its average volume. The daily is the structure that matters most for the swing.
4-HOUR
RSI 38.4 — soft. The trend here reads cooling: price is below the 20-EMA ($65,300) and below the 50-EMA ($68,223), with the 20 still under the 50. It is sitting 18% up its range ($62,006–$74,811); the last closed candle came on a light 0.84x its average volume. This is where the intraday chop lives.
1-HOUR
RSI 47.3 — neutral. The trend here reads cooling: price is below the 20-EMA ($64,449) and below the 50-EMA ($64,579), with the 20 still under the 50. It is sitting 18% up its range ($62,006–$74,811); the last closed candle came on a light 0.75x its average volume. Shortest-term, this is momentum, not trend — treat it as timing, not direction.
THE LEVELS THAT MATTER
$74,811 — the recent high, the ceiling to clear.
$71,602 — the daily 20-EMA, the line price is riding. Hold above it and the trend is fine; lose it and momentum shifts.
$77,582 — the monthly open, the first real support below. Lose it and the $62,006 area comes into play.
SENTIMENT
Fear & Greed at 11 (Extreme Fear), tracing 28, 20, 13, 10, 10, 12, 11 across the week. Fear this deep is usually closer to a floor than a top.
THE SYNTHESIS
The higher timeframes have lost their edge here. Until the daily reclaims its moving averages and the $71,602 line, rallies are corrective, not trend. $77,582 is the level that decides whether this is a pause or a turn.
For now: watch $71,602 on the way down and $74,811 on the way up. Everything in between is range.
Where are you leaning from here — continuation, or a retest of $77,582?
$BTC
1
660
$BREV · MARKET STRUCTURE
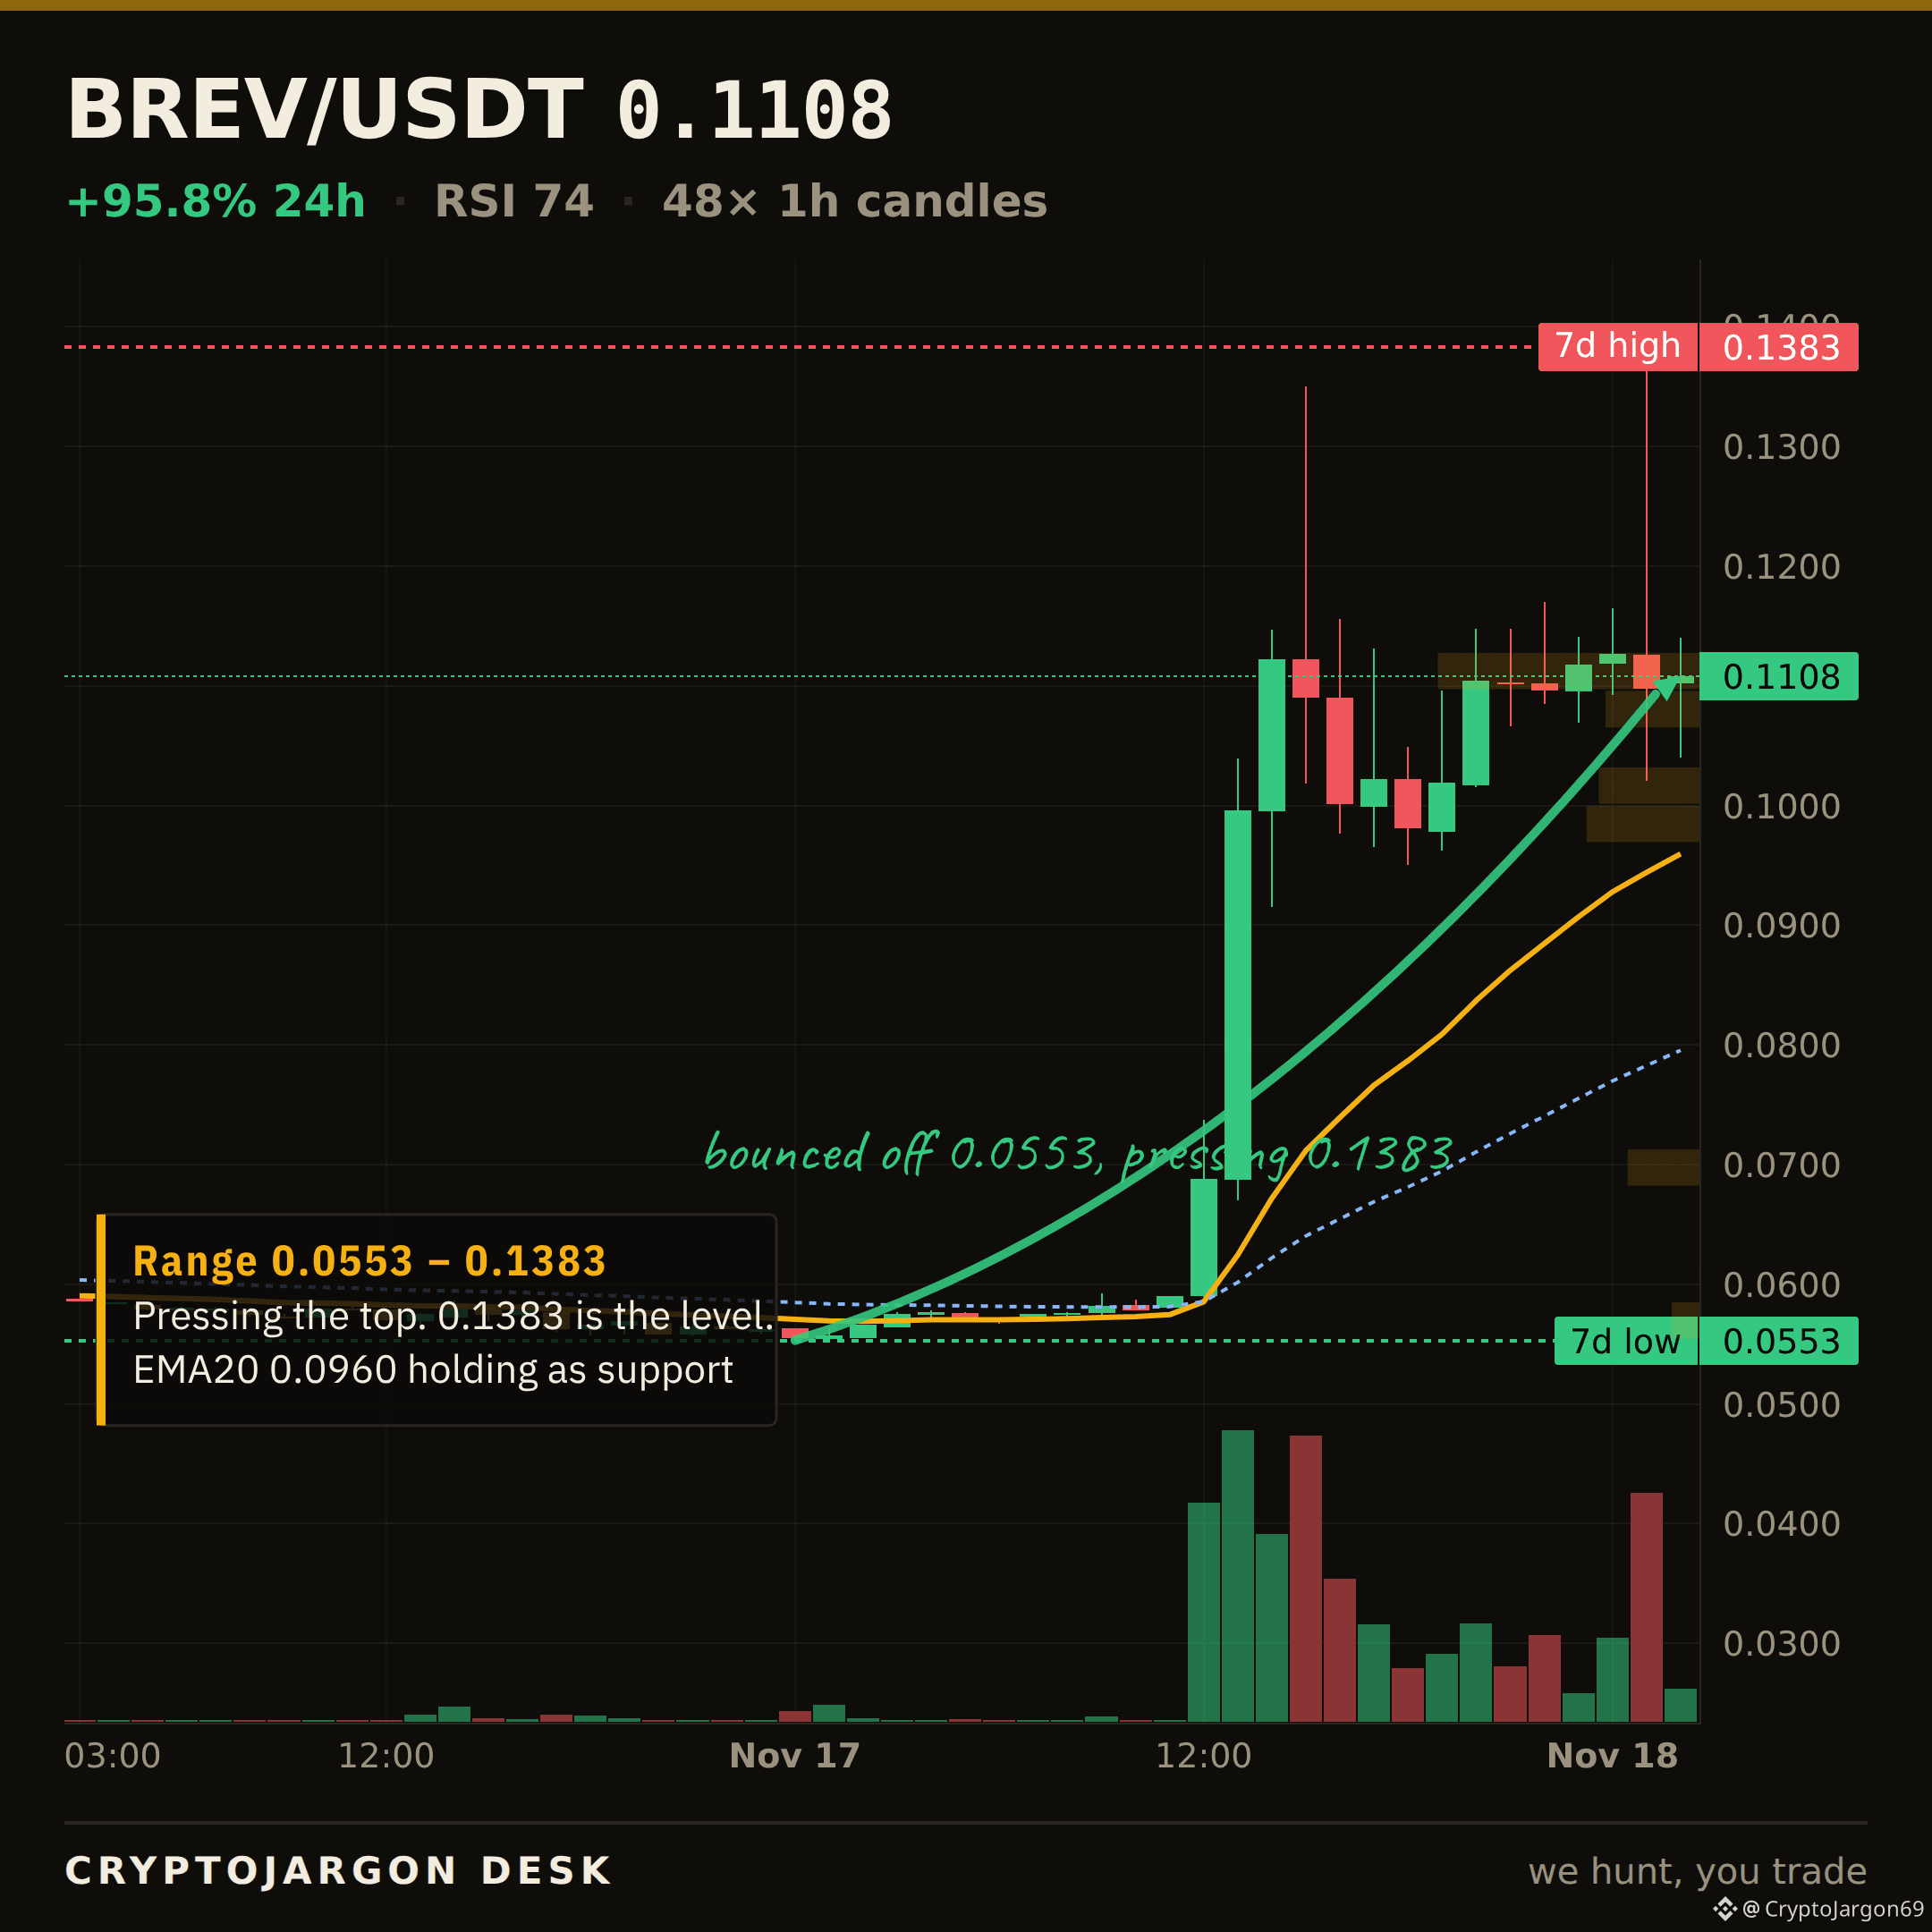
$0.111, +95.8% on the day.
Trend — price above both EMAs, the 20 over the 50.
Momentum — RSI 74.
Range — 66% up its 24h range ($0.0565–$0.138).
Trend, momentum and range mostly point the same way — an aligned tape to the upside.
Levels: $0.138 24h high (ceiling) · $0.0565 24h low (support) · 7d range $0.0553–$0.138.
Chart: 1H candles, EMA20/50 + levels marked. $BREV
$BREV · MARKET STRUCTURE
$0.111, +95.8% on the day.
Trend — price above both EMAs, the 20 over the 50.
Momentum — RSI 74.
Range — 66% up its 24h range ($0.0565–$0.138).
Trend, momentum and range mostly point the same way — an aligned tape to the upside.
Levels: $0.138 24h high (ceiling) · $0.0565 24h low (support) · 7d range $0.0553–$0.138.
Chart: 1H candles, EMA20/50 + levels marked. $BREV
$0.111, +95.8% on the day.
Trend — price above both EMAs, the 20 over the 50.
Momentum — RSI 74.
Range — 66% up its 24h range ($0.0565–$0.138).
Trend, momentum and range mostly point the same way — an aligned tape to the upside.
Levels: $0.138 24h high (ceiling) · $0.0565 24h low (support) · 7d range $0.0553–$0.138.
Chart: 1H candles, EMA20/50 + levels marked. $BREV
1.1k
$LIT · THE LEVEL BROKE
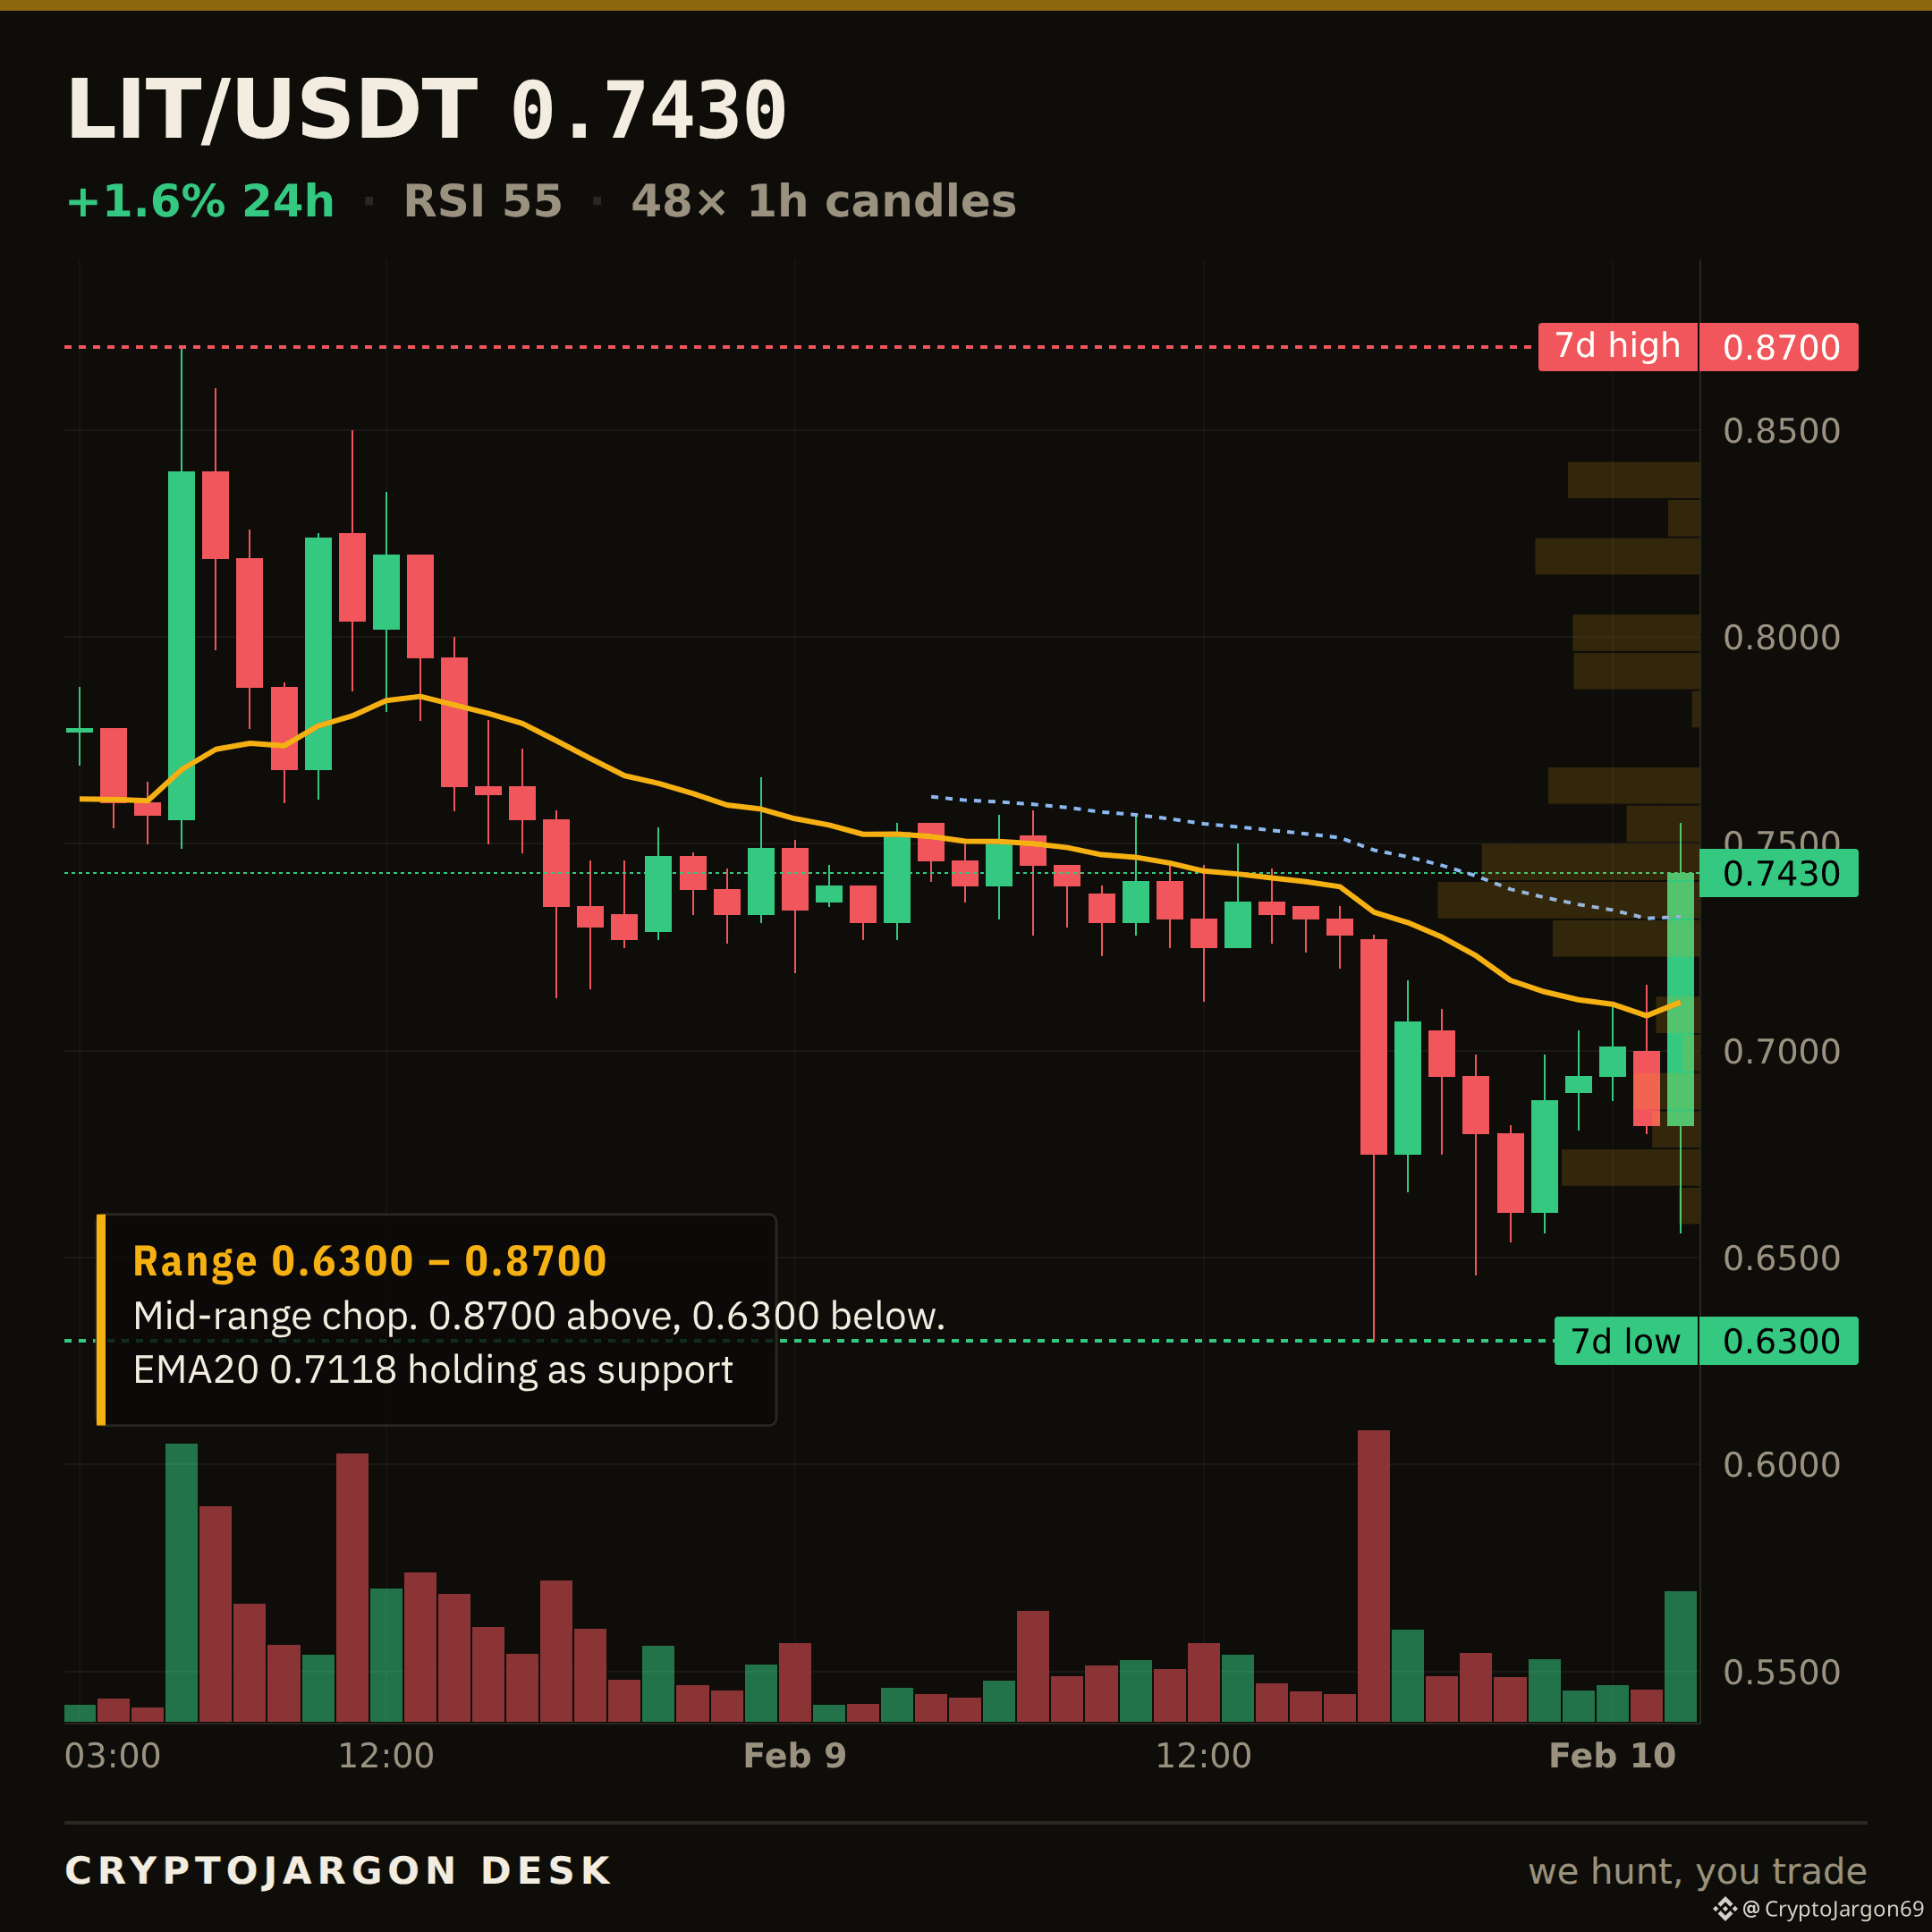
It gave way.
$0.734 was the floor we flagged on $LIT. Price closed below it — $0.743 now. The range beneath opens up, and that line flips into the ceiling it has to win back.
Reclaim from here, or is this the start of the next leg down?
$LIT
$LIT · THE LEVEL BROKE
It gave way.
$0.734 was the floor we flagged on $LIT . Price closed below it — $0.743 now. The range beneath opens up, and that line flips into the ceiling it has to win back.
Reclaim from here, or is this the start of the next leg down?
$LIT
It gave way.
$0.734 was the floor we flagged on $LIT . Price closed below it — $0.743 now. The range beneath opens up, and that line flips into the ceiling it has to win back.
Reclaim from here, or is this the start of the next leg down?
$LIT
362
$LIT · LEVEL TO WATCH
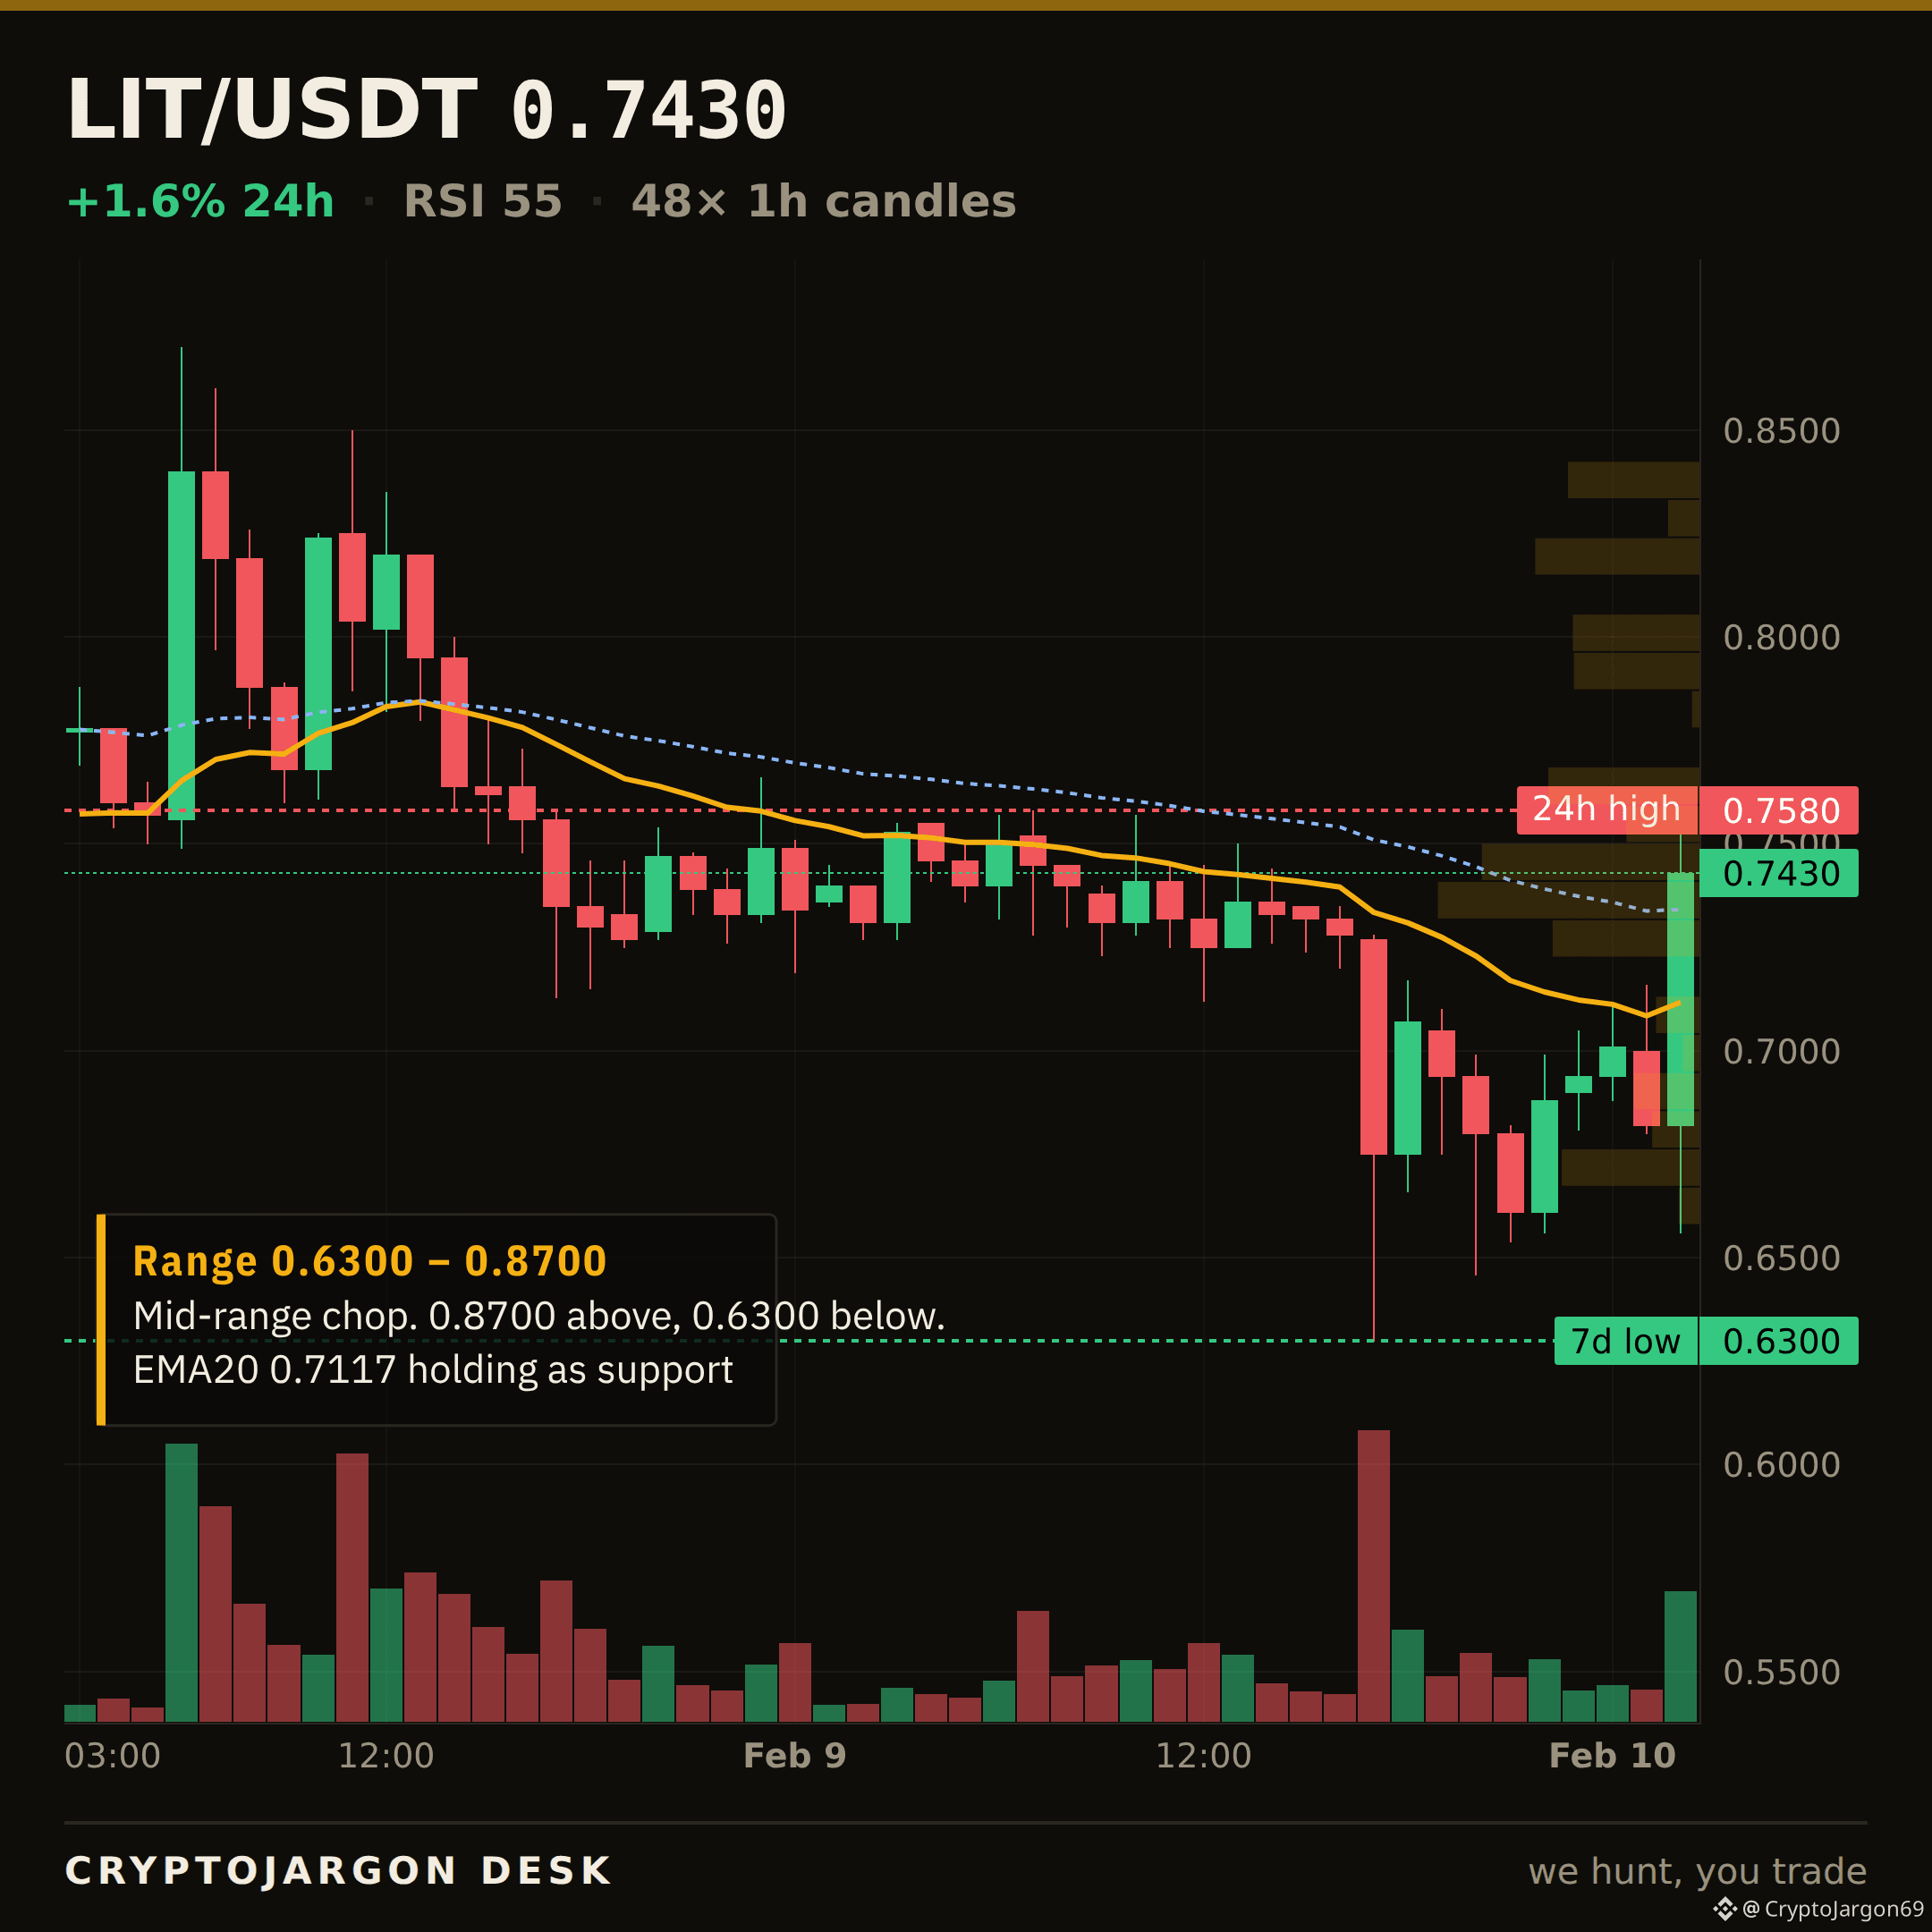
$0.743 now.
The line that matters is $0.734 — the 50-EMA, the floor the tape is sitting on.
Holding $0.734 keeps the structure intact; a clean close below opens the range beneath it. I'll follow up when it resolves.
Chart: the level is on it. $LIT
$LIT · LEVEL TO WATCH
$0.743 now.
The line that matters is $0.734 — the 50-EMA, the floor the tape is sitting on.
Holding $0.734 keeps the structure intact; a clean close below opens the range beneath it. I'll follow up when it resolves.
Chart: the level is on it. $LIT
$0.743 now.
The line that matters is $0.734 — the 50-EMA, the floor the tape is sitting on.
Holding $0.734 keeps the structure intact; a clean close below opens the range beneath it. I'll follow up when it resolves.
Chart: the level is on it. $LIT
1
362
$RARE · THE LEVEL BROKE
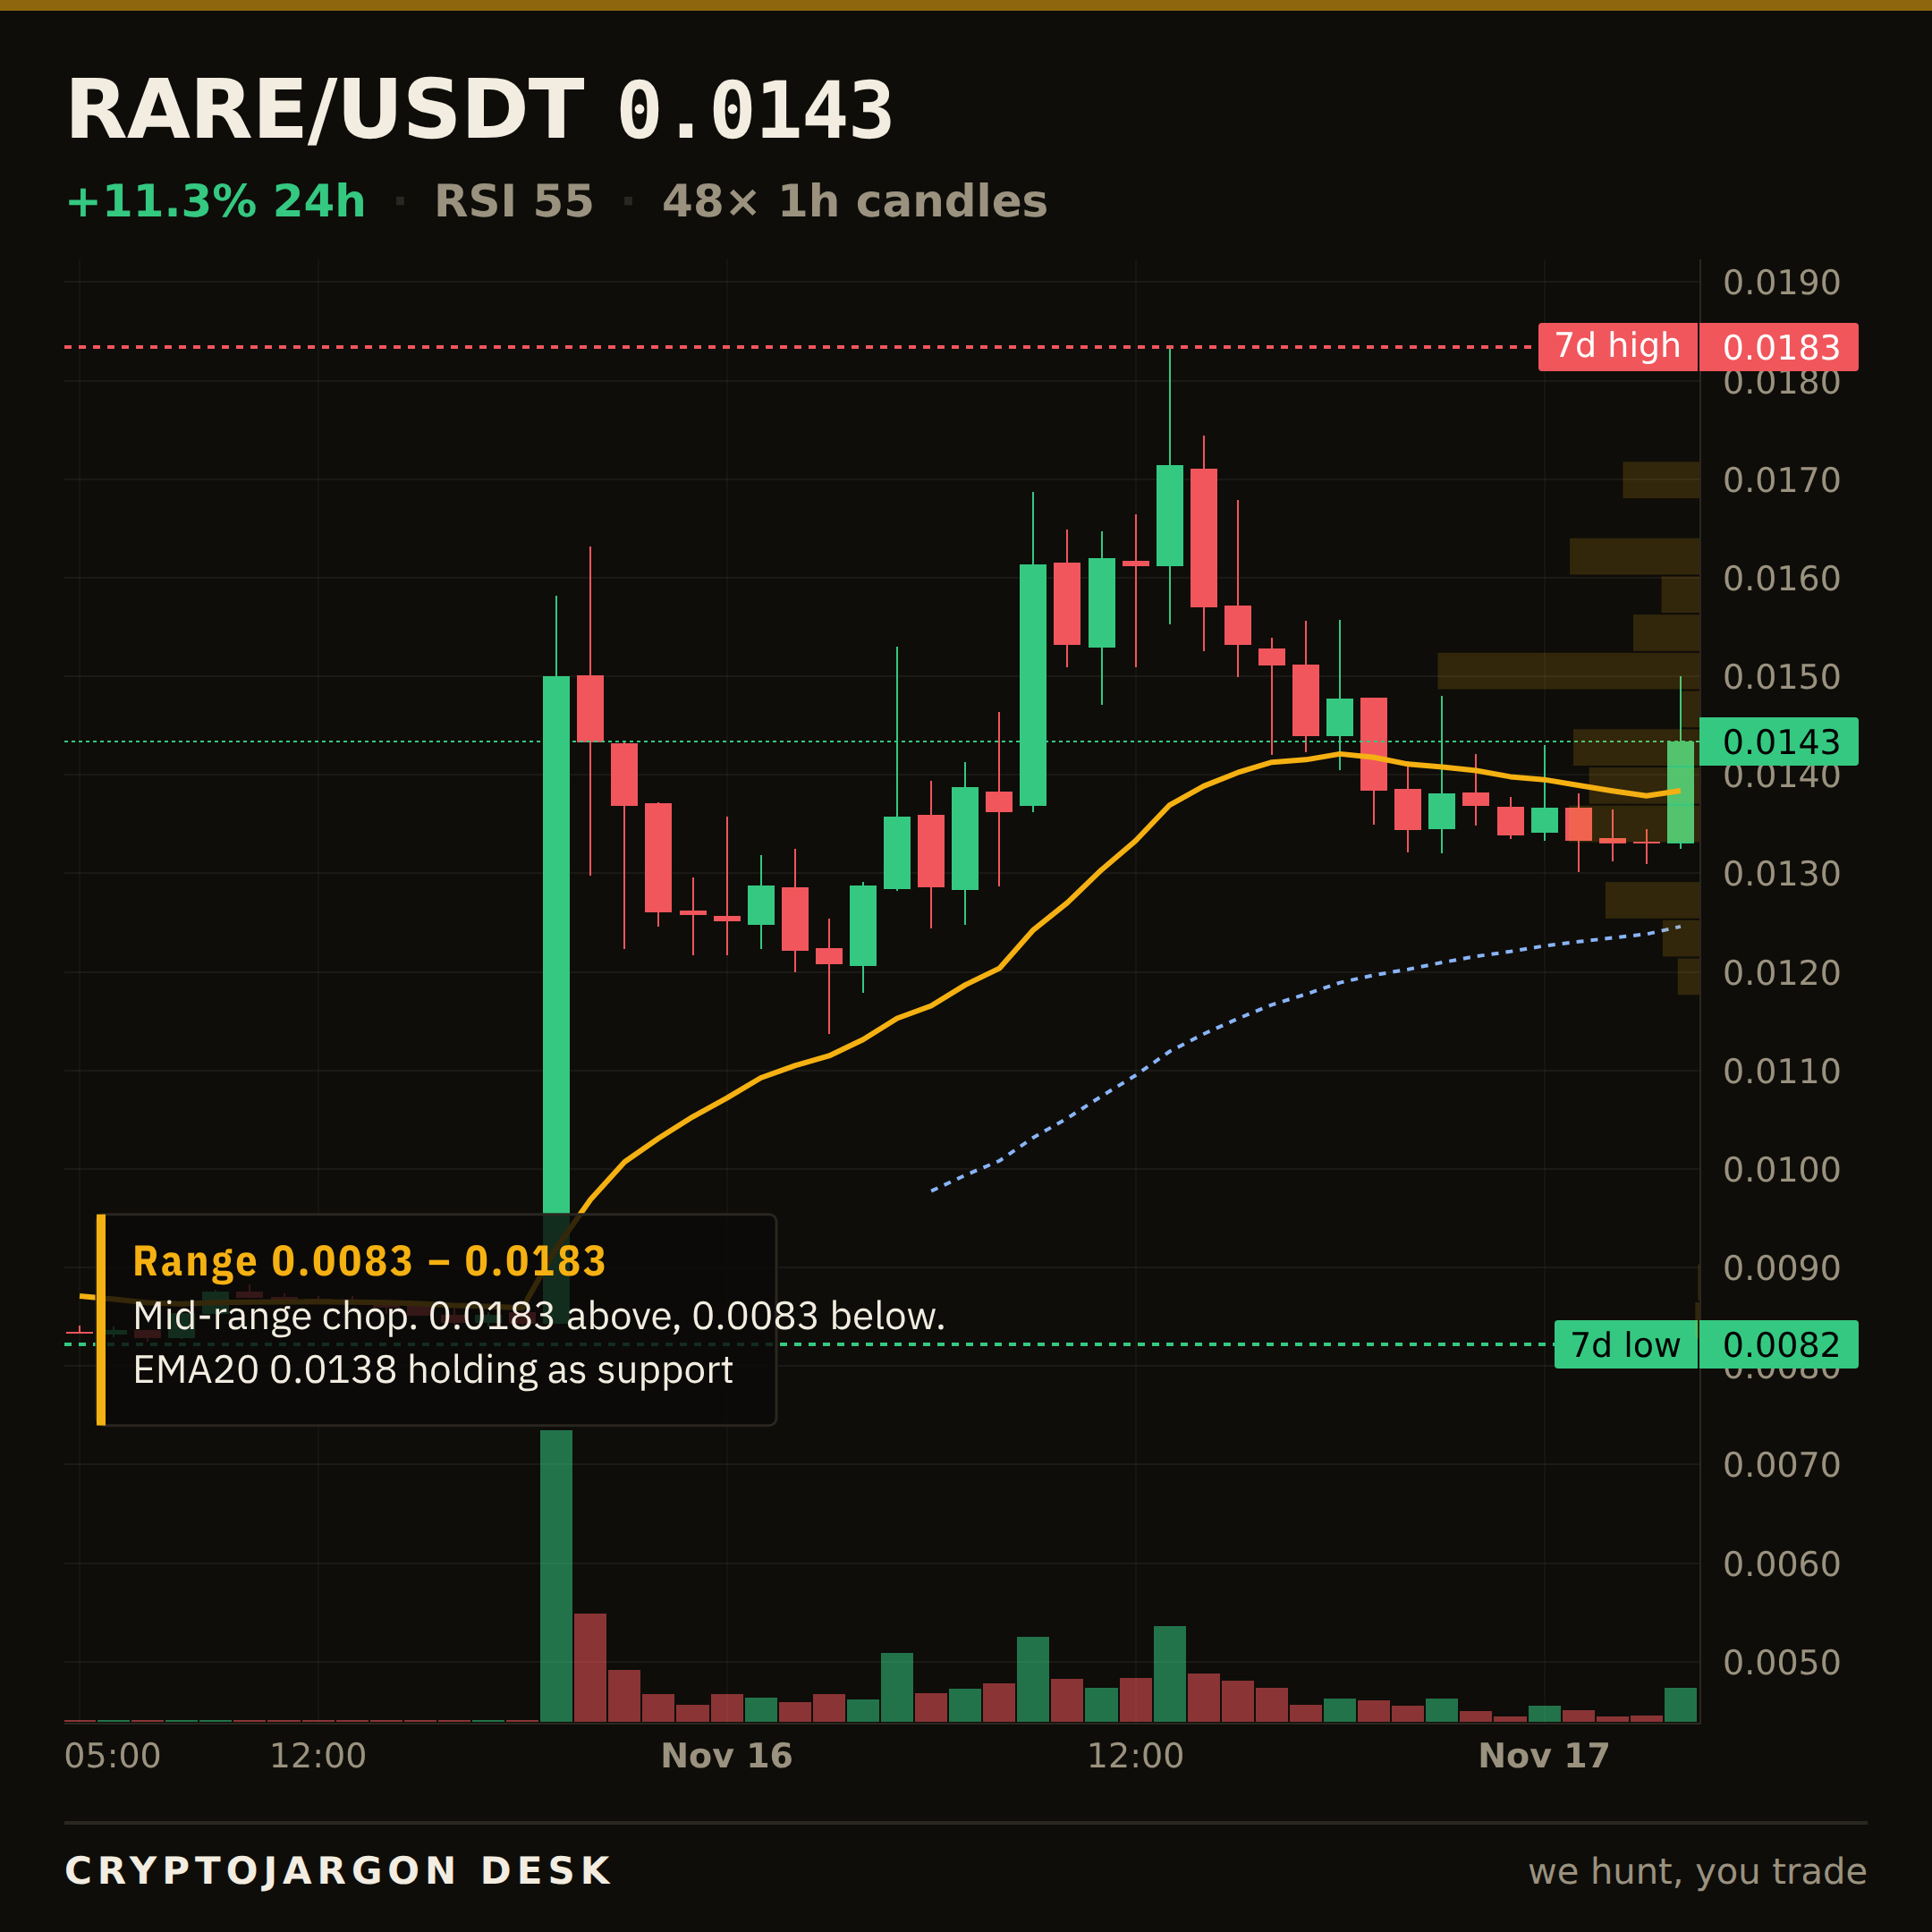
It gave way.
$0.0138 was the floor we flagged on $RARE. Price closed below it — $0.0143 now. The range beneath opens up, and that line flips into the ceiling it has to win back.
Reclaim from here, or is this the start of the next leg down?
$RARE
$RARE · THE LEVEL BROKE
It gave way.
$0.0138 was the floor we flagged on $RARE . Price closed below it — $0.0143 now. The range beneath opens up, and that line flips into the ceiling it has to win back.
Reclaim from here, or is this the start of the next leg down?
$RARE
It gave way.
$0.0138 was the floor we flagged on $RARE . Price closed below it — $0.0143 now. The range beneath opens up, and that line flips into the ceiling it has to win back.
Reclaim from here, or is this the start of the next leg down?
$RARE
285
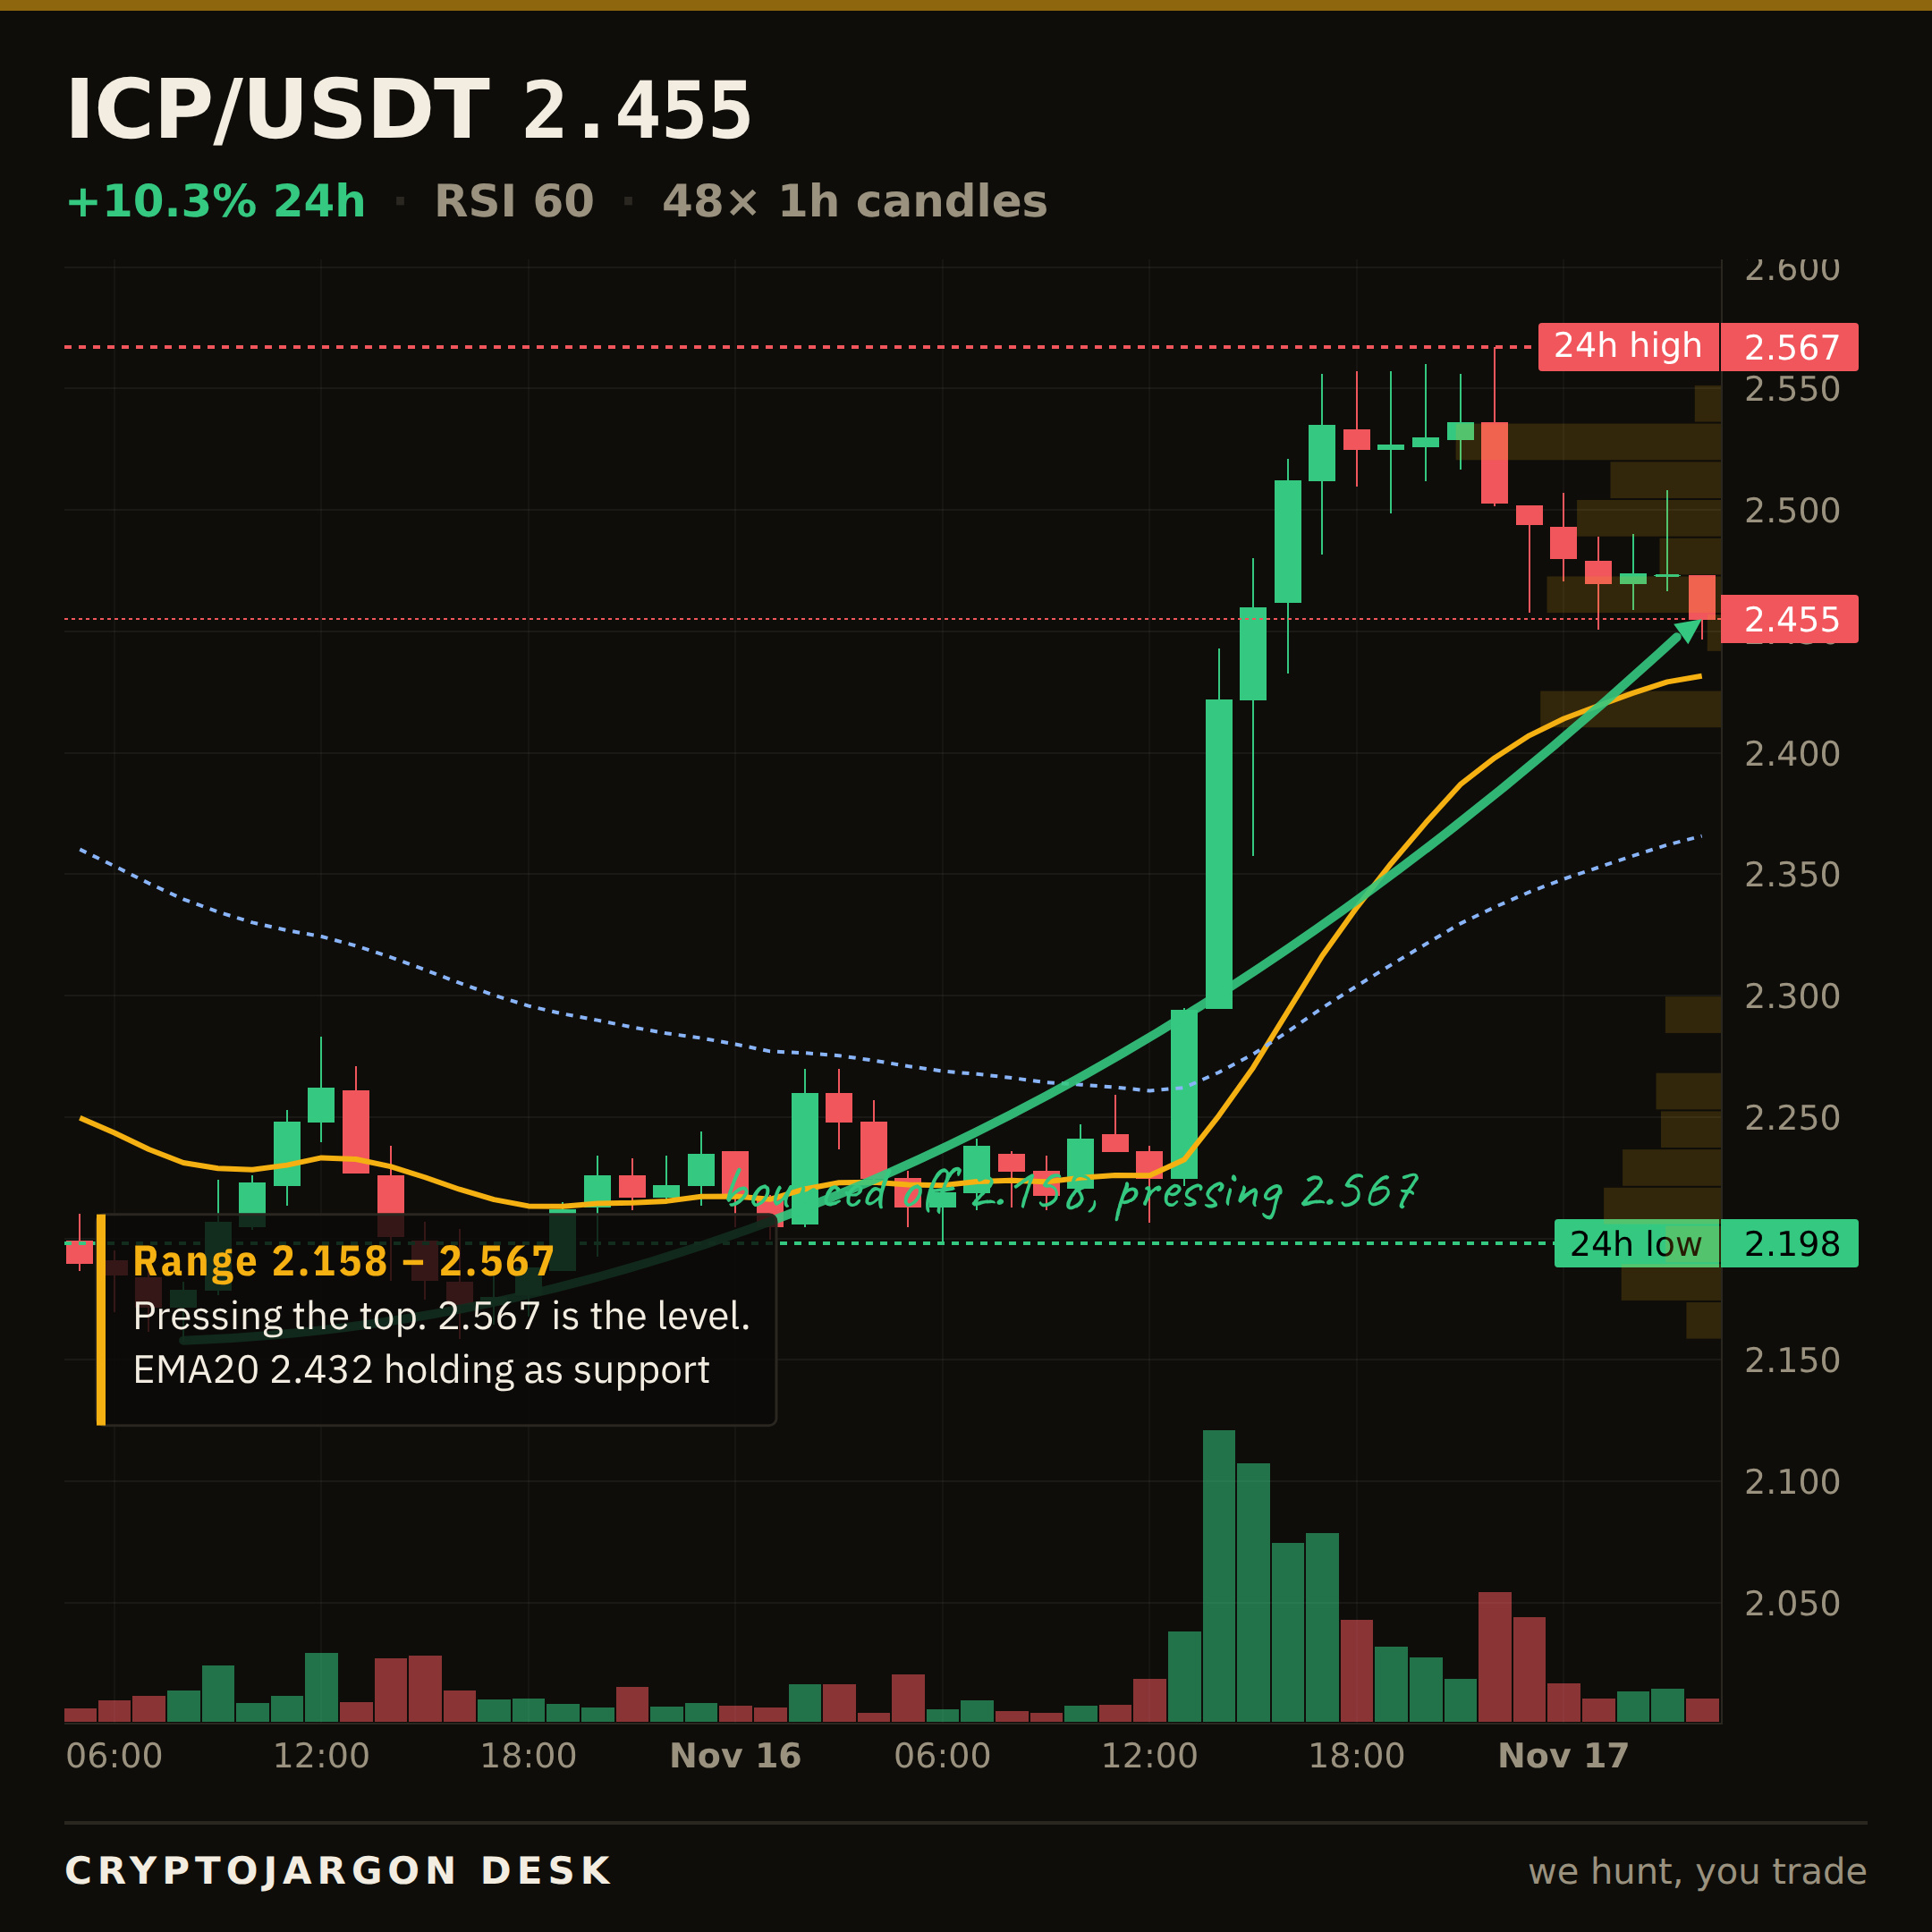
$ICP · MARKET STRUCTURE
$2.46, +10.3% on the day.
Trend — price above both EMAs, the 20 over the 50.
Momentum — RSI 60.
Range — 70% up its 24h range ($2.20–$2.57).
Trend, momentum and range mostly point the same way — an aligned tape to the upside.
Levels: $2.57 24h high (ceiling) · $2.20 24h low (support) · 7d range $2.10–$2.66.
Chart: 1H candles, EMA20/50 + levels marked. $ICP
$ICP · MARKET STRUCTURE
$2.46, +10.3% on the day.
Trend — price above both EMAs, the 20 over the 50.
Momentum — RSI 60.
Range — 70% up its 24h range ($2.20–$2.57).
Trend, momentum and range mostly point the same way — an aligned tape to the upside.
Levels: $2.57 24h high (ceiling) · $2.20 24h low (support) · 7d range $2.10–$2.66.
Chart: 1H candles, EMA20/50 + levels marked. $ICP
$2.46, +10.3% on the day.
Trend — price above both EMAs, the 20 over the 50.
Momentum — RSI 60.
Range — 70% up its 24h range ($2.20–$2.57).
Trend, momentum and range mostly point the same way — an aligned tape to the upside.
Levels: $2.57 24h high (ceiling) · $2.20 24h low (support) · 7d range $2.10–$2.66.
Chart: 1H candles, EMA20/50 + levels marked. $ICP
393
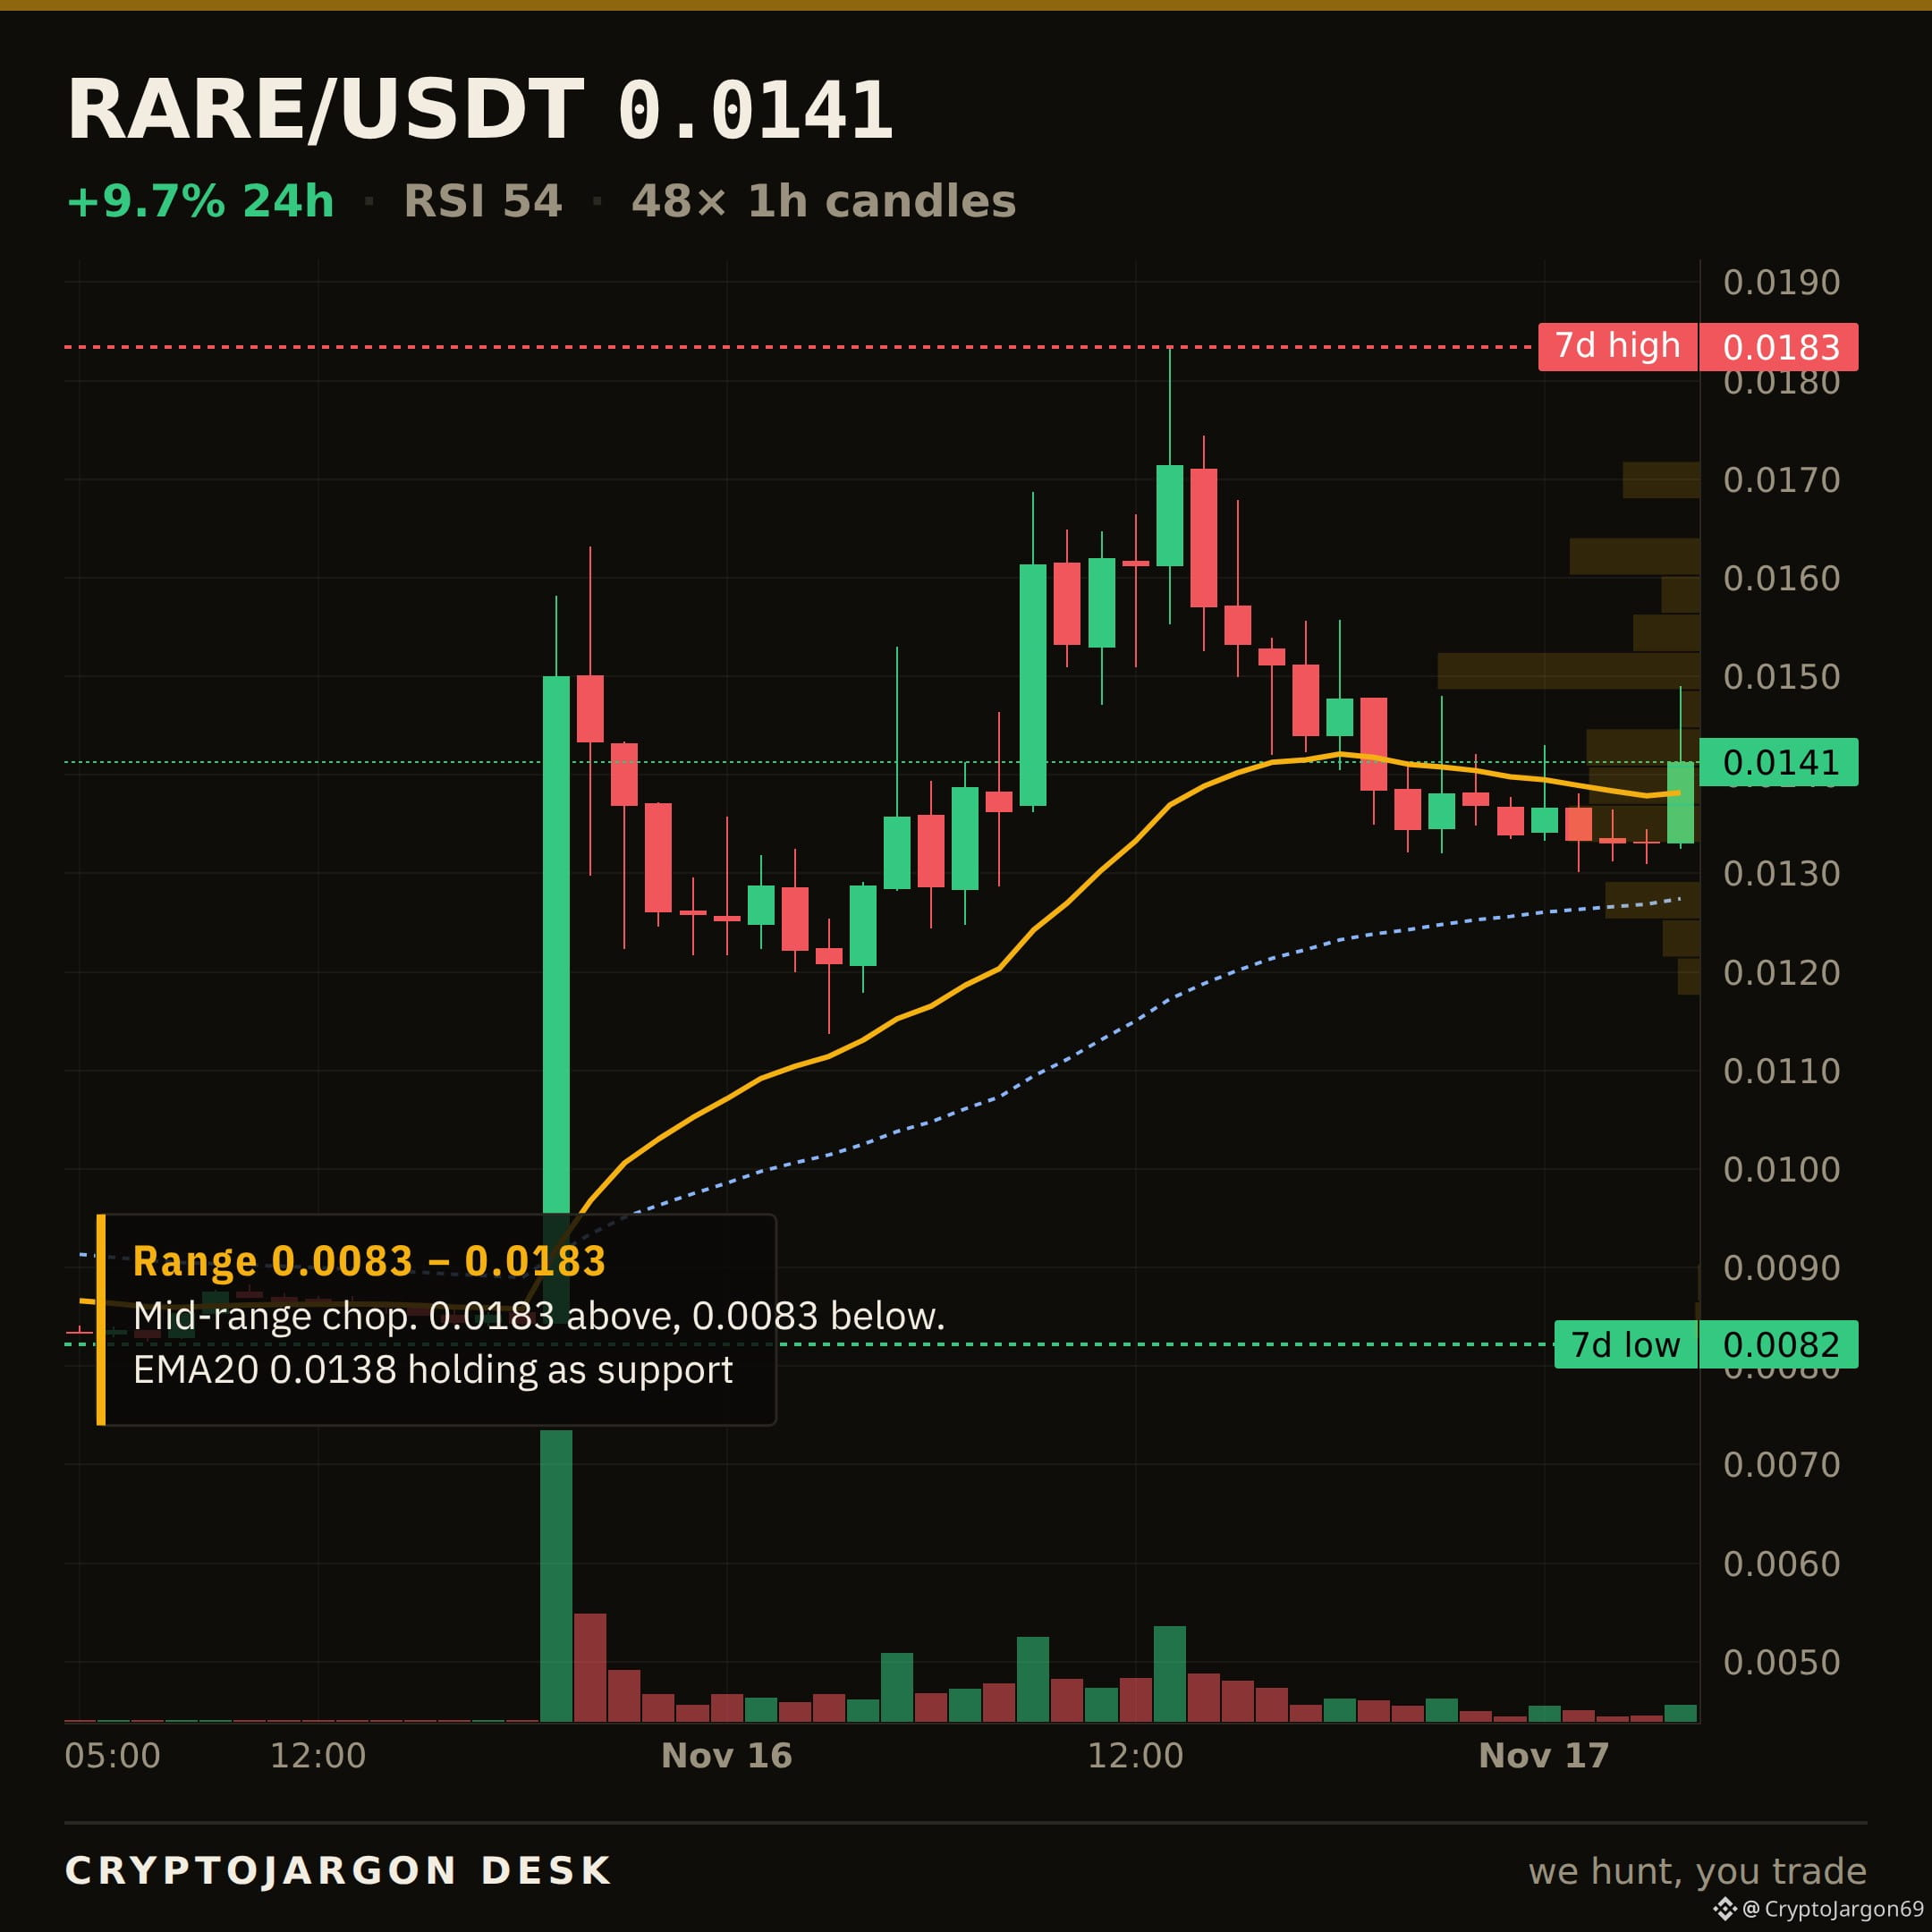
$RARE · LEVEL TO WATCH
$0.0141 now.
The line that matters is $0.0138 — the 20-EMA, the floor the tape is sitting on.
Holding $0.0138 keeps the structure intact; a clean close below opens the range beneath it. I'll follow up when it resolves.
Chart: the level is on it. $RARE
$RARE · LEVEL TO WATCH
$0.0141 now.
The line that matters is $0.0138 — the 20-EMA, the floor the tape is sitting on.
Holding $0.0138 keeps the structure intact; a clean close below opens the range beneath it. I'll follow up when it resolves.
Chart: the level is on it. $RARE
$0.0141 now.
The line that matters is $0.0138 — the 20-EMA, the floor the tape is sitting on.
Holding $0.0138 keeps the structure intact; a clean close below opens the range beneath it. I'll follow up when it resolves.
Chart: the level is on it. $RARE
1
536
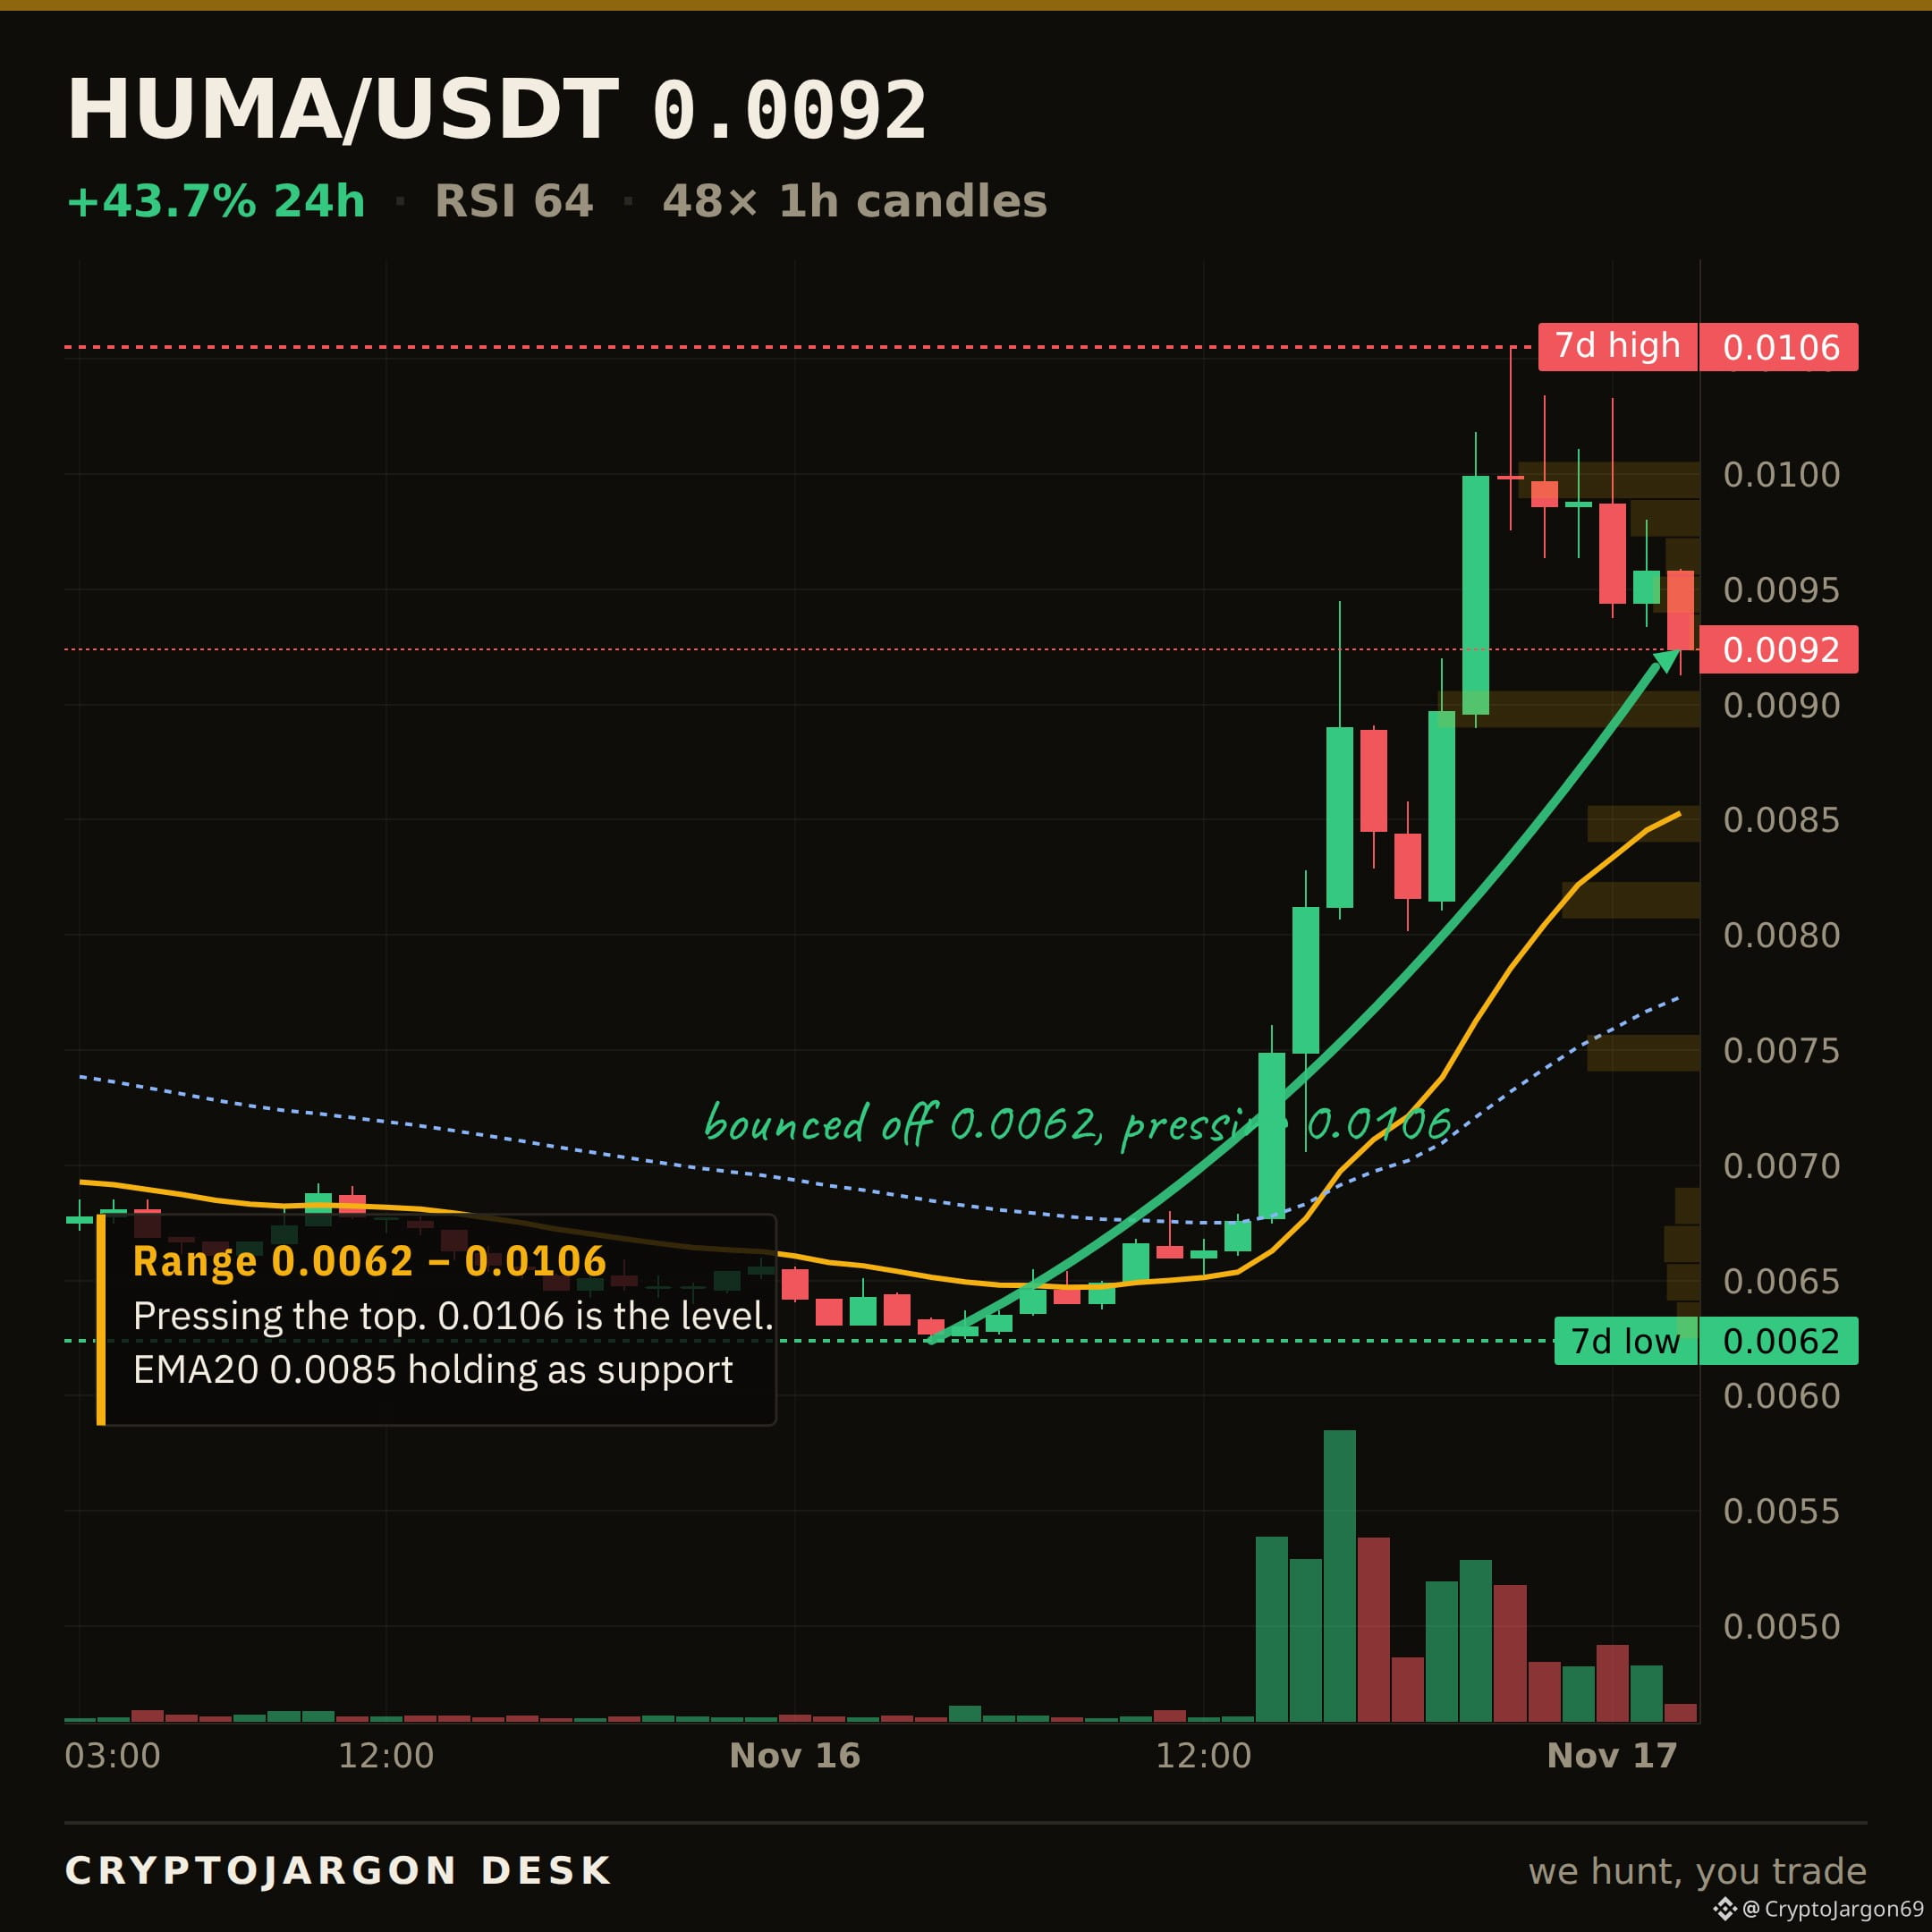
$HUMA · MARKET STRUCTURE
$0.00924, +43.7% on the day.
Trend — price above both EMAs, the 20 over the 50.
Momentum — RSI 64.
Range — 70% up its 24h range ($0.00624–$0.0106).
Trend, momentum and range mostly point the same way — an aligned tape to the upside.
Levels: $0.0106 24h high (ceiling) · $0.00624 24h low (support) · 7d range $0.00624–$0.0106.
Chart: 1H candles, EMA20/50 + levels marked. $HUMA
$HUMA · MARKET STRUCTURE
$0.00924, +43.7% on the day.
Trend — price above both EMAs, the 20 over the 50.
Momentum — RSI 64.
Range — 70% up its 24h range ($0.00624–$0.0106).
Trend, momentum and range mostly point the same way — an aligned tape to the upside.
Levels: $0.0106 24h high (ceiling) · $0.00624 24h low (support) · 7d range $0.00624–$0.0106.
Chart: 1H candles, EMA20/50 + levels marked. $HUMA
$0.00924, +43.7% on the day.
Trend — price above both EMAs, the 20 over the 50.
Momentum — RSI 64.
Range — 70% up its 24h range ($0.00624–$0.0106).
Trend, momentum and range mostly point the same way — an aligned tape to the upside.
Levels: $0.0106 24h high (ceiling) · $0.00624 24h low (support) · 7d range $0.00624–$0.0106.
Chart: 1H candles, EMA20/50 + levels marked. $HUMA
439
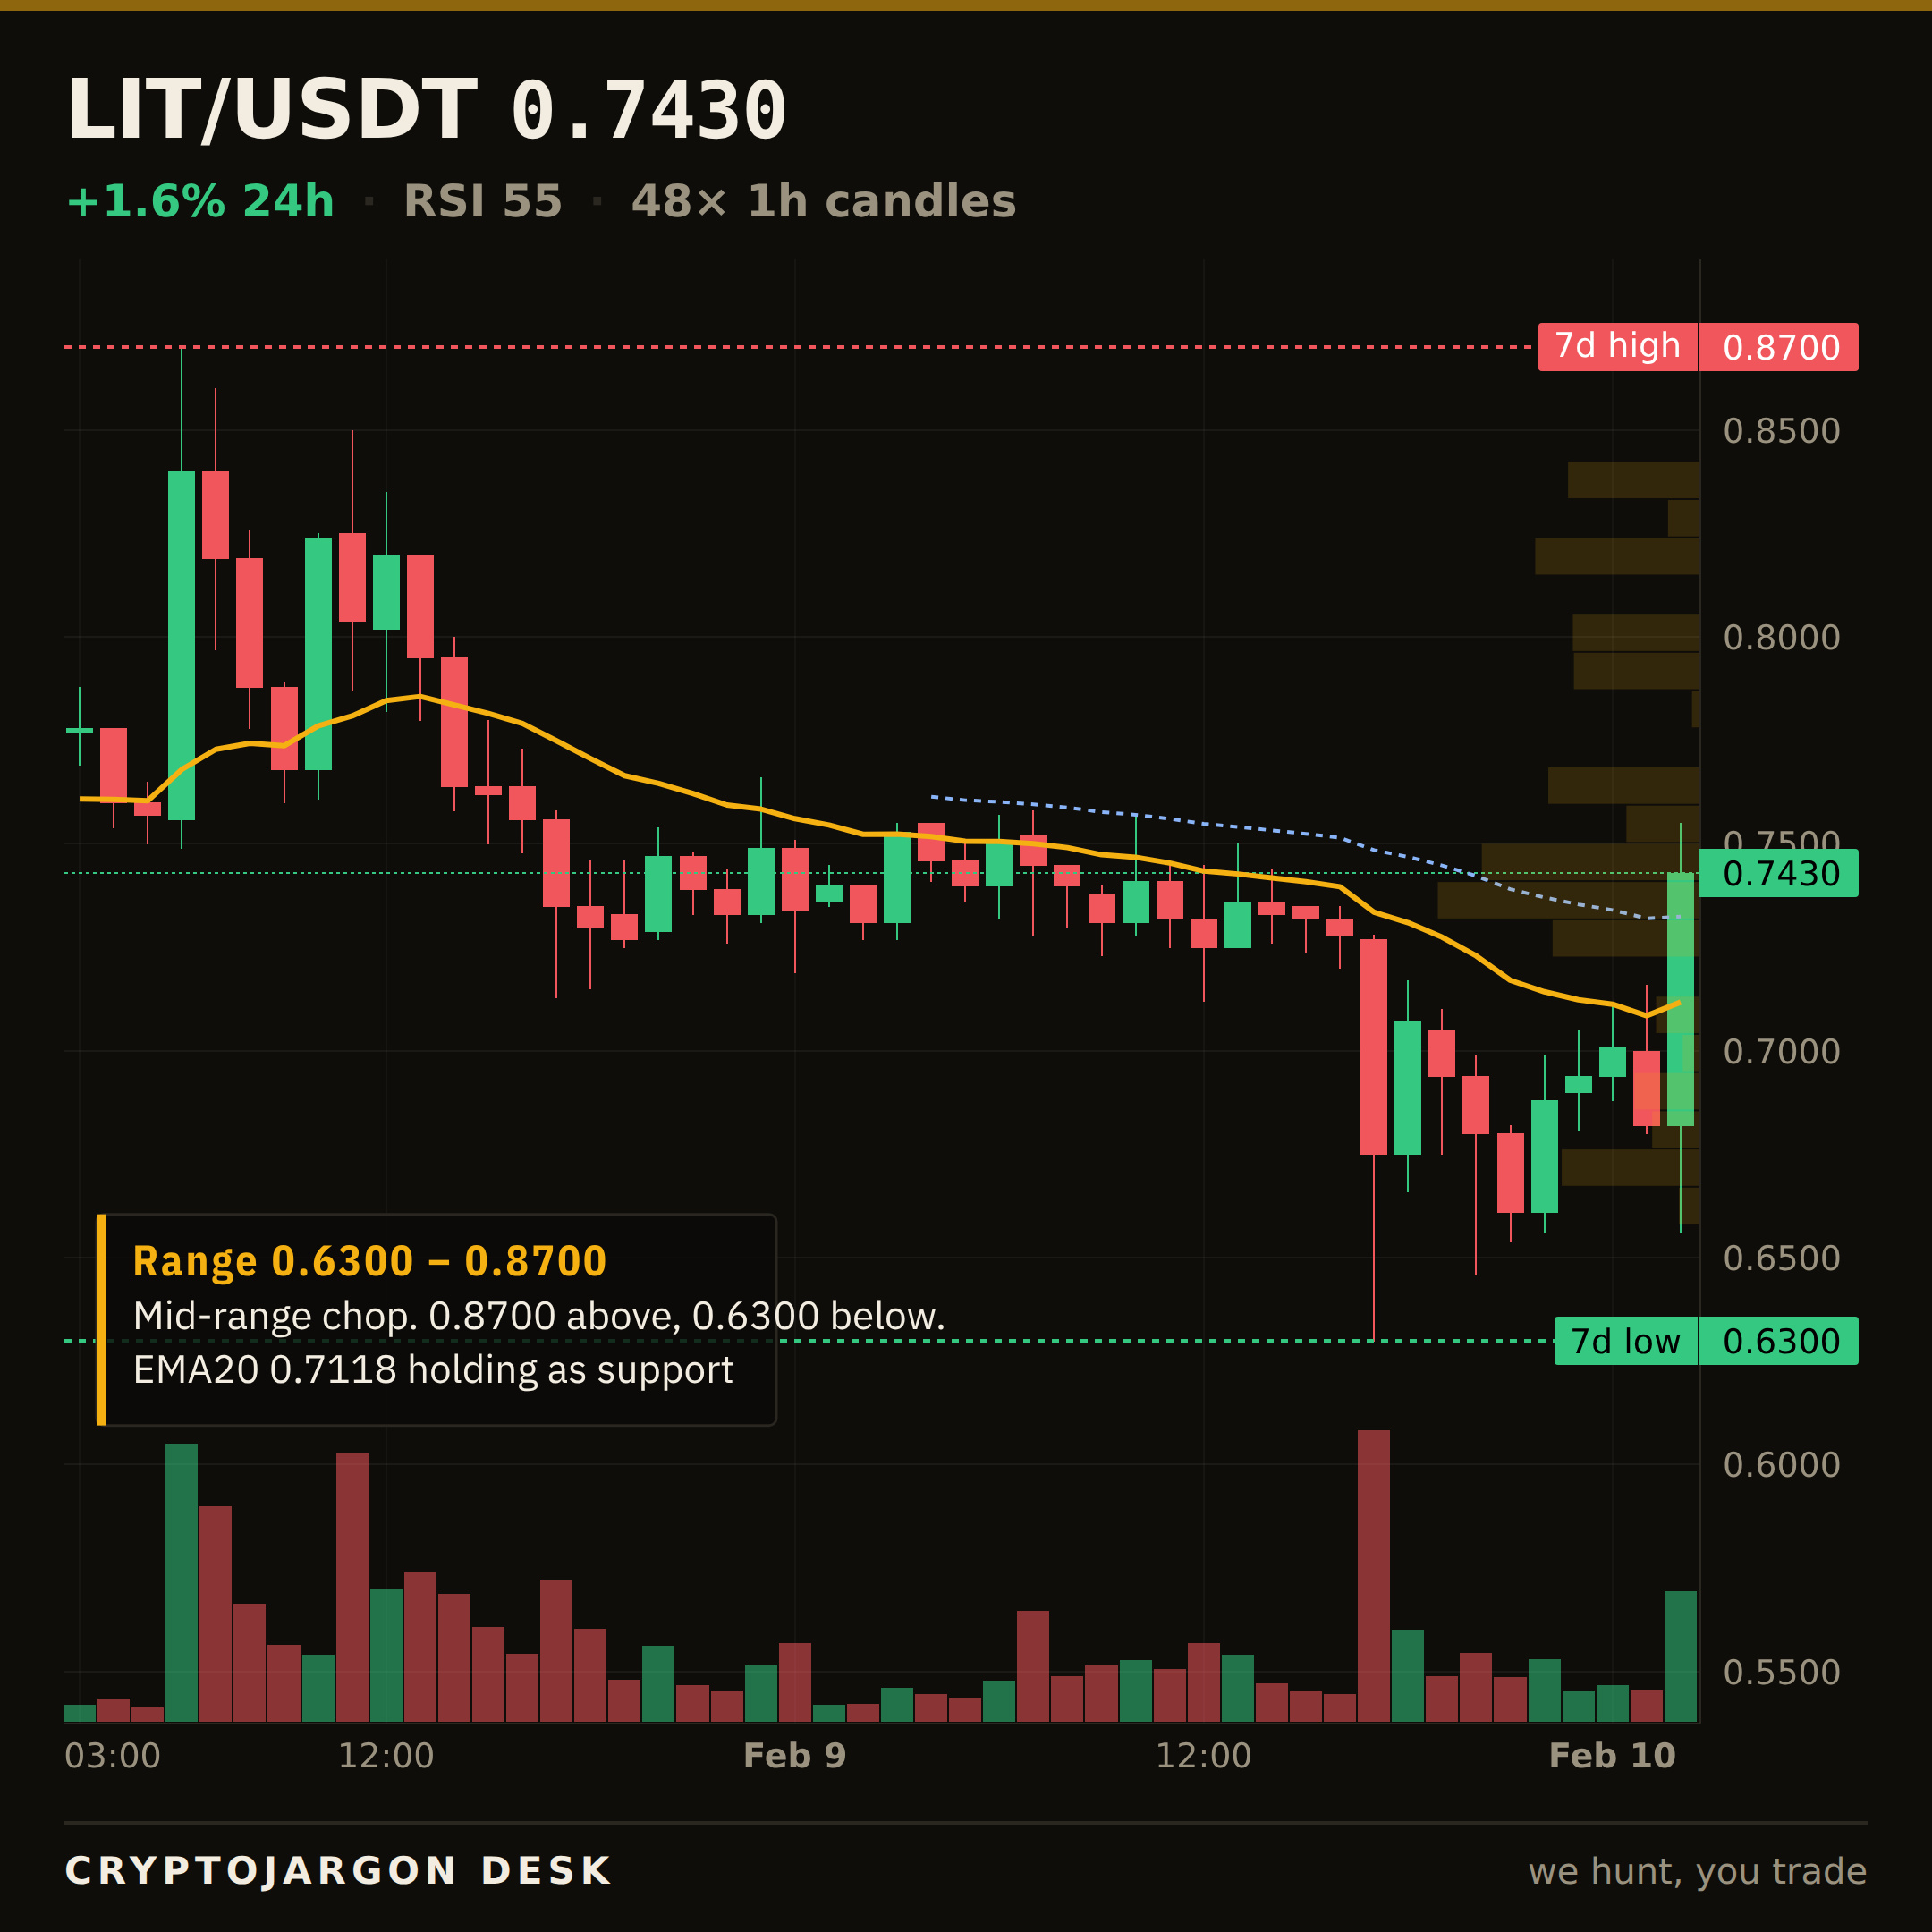
$LIT · THE LEVEL BROKE
That floor is gone.
$0.734 was the floor we flagged on $LIT. Price closed below it — $0.743 now. The range beneath opens up, and that line flips into the ceiling it has to win back.
Reclaim from here, or is this the start of the next leg down?
$LIT
$LIT · THE LEVEL BROKE
That floor is gone.
$0.734 was the floor we flagged on $LIT . Price closed below it — $0.743 now. The range beneath opens up, and that line flips into the ceiling it has to win back.
Reclaim from here, or is this the start of the next leg down?
$LIT
That floor is gone.
$0.734 was the floor we flagged on $LIT . Price closed below it — $0.743 now. The range beneath opens up, and that line flips into the ceiling it has to win back.
Reclaim from here, or is this the start of the next leg down?
$LIT
1
1k
$LIT · LEVEL TO WATCH
$0.743 now.
The line that matters is $0.734 — the 50-EMA, the floor the tape is sitting on.
Holding $0.734 keeps the structure intact; a clean close below opens the range beneath it. I'll follow up when it resolves.
Chart: the level is on it. $LIT
$LIT · LEVEL TO WATCH
$0.743 now.
The line that matters is $0.734 — the 50-EMA, the floor the tape is sitting on.
Holding $0.734 keeps the structure intact; a clean close below opens the range beneath it. I'll follow up when it resolves.
Chart: the level is on it. $LIT
$0.743 now.
The line that matters is $0.734 — the 50-EMA, the floor the tape is sitting on.
Holding $0.734 keeps the structure intact; a clean close below opens the range beneath it. I'll follow up when it resolves.
Chart: the level is on it. $LIT
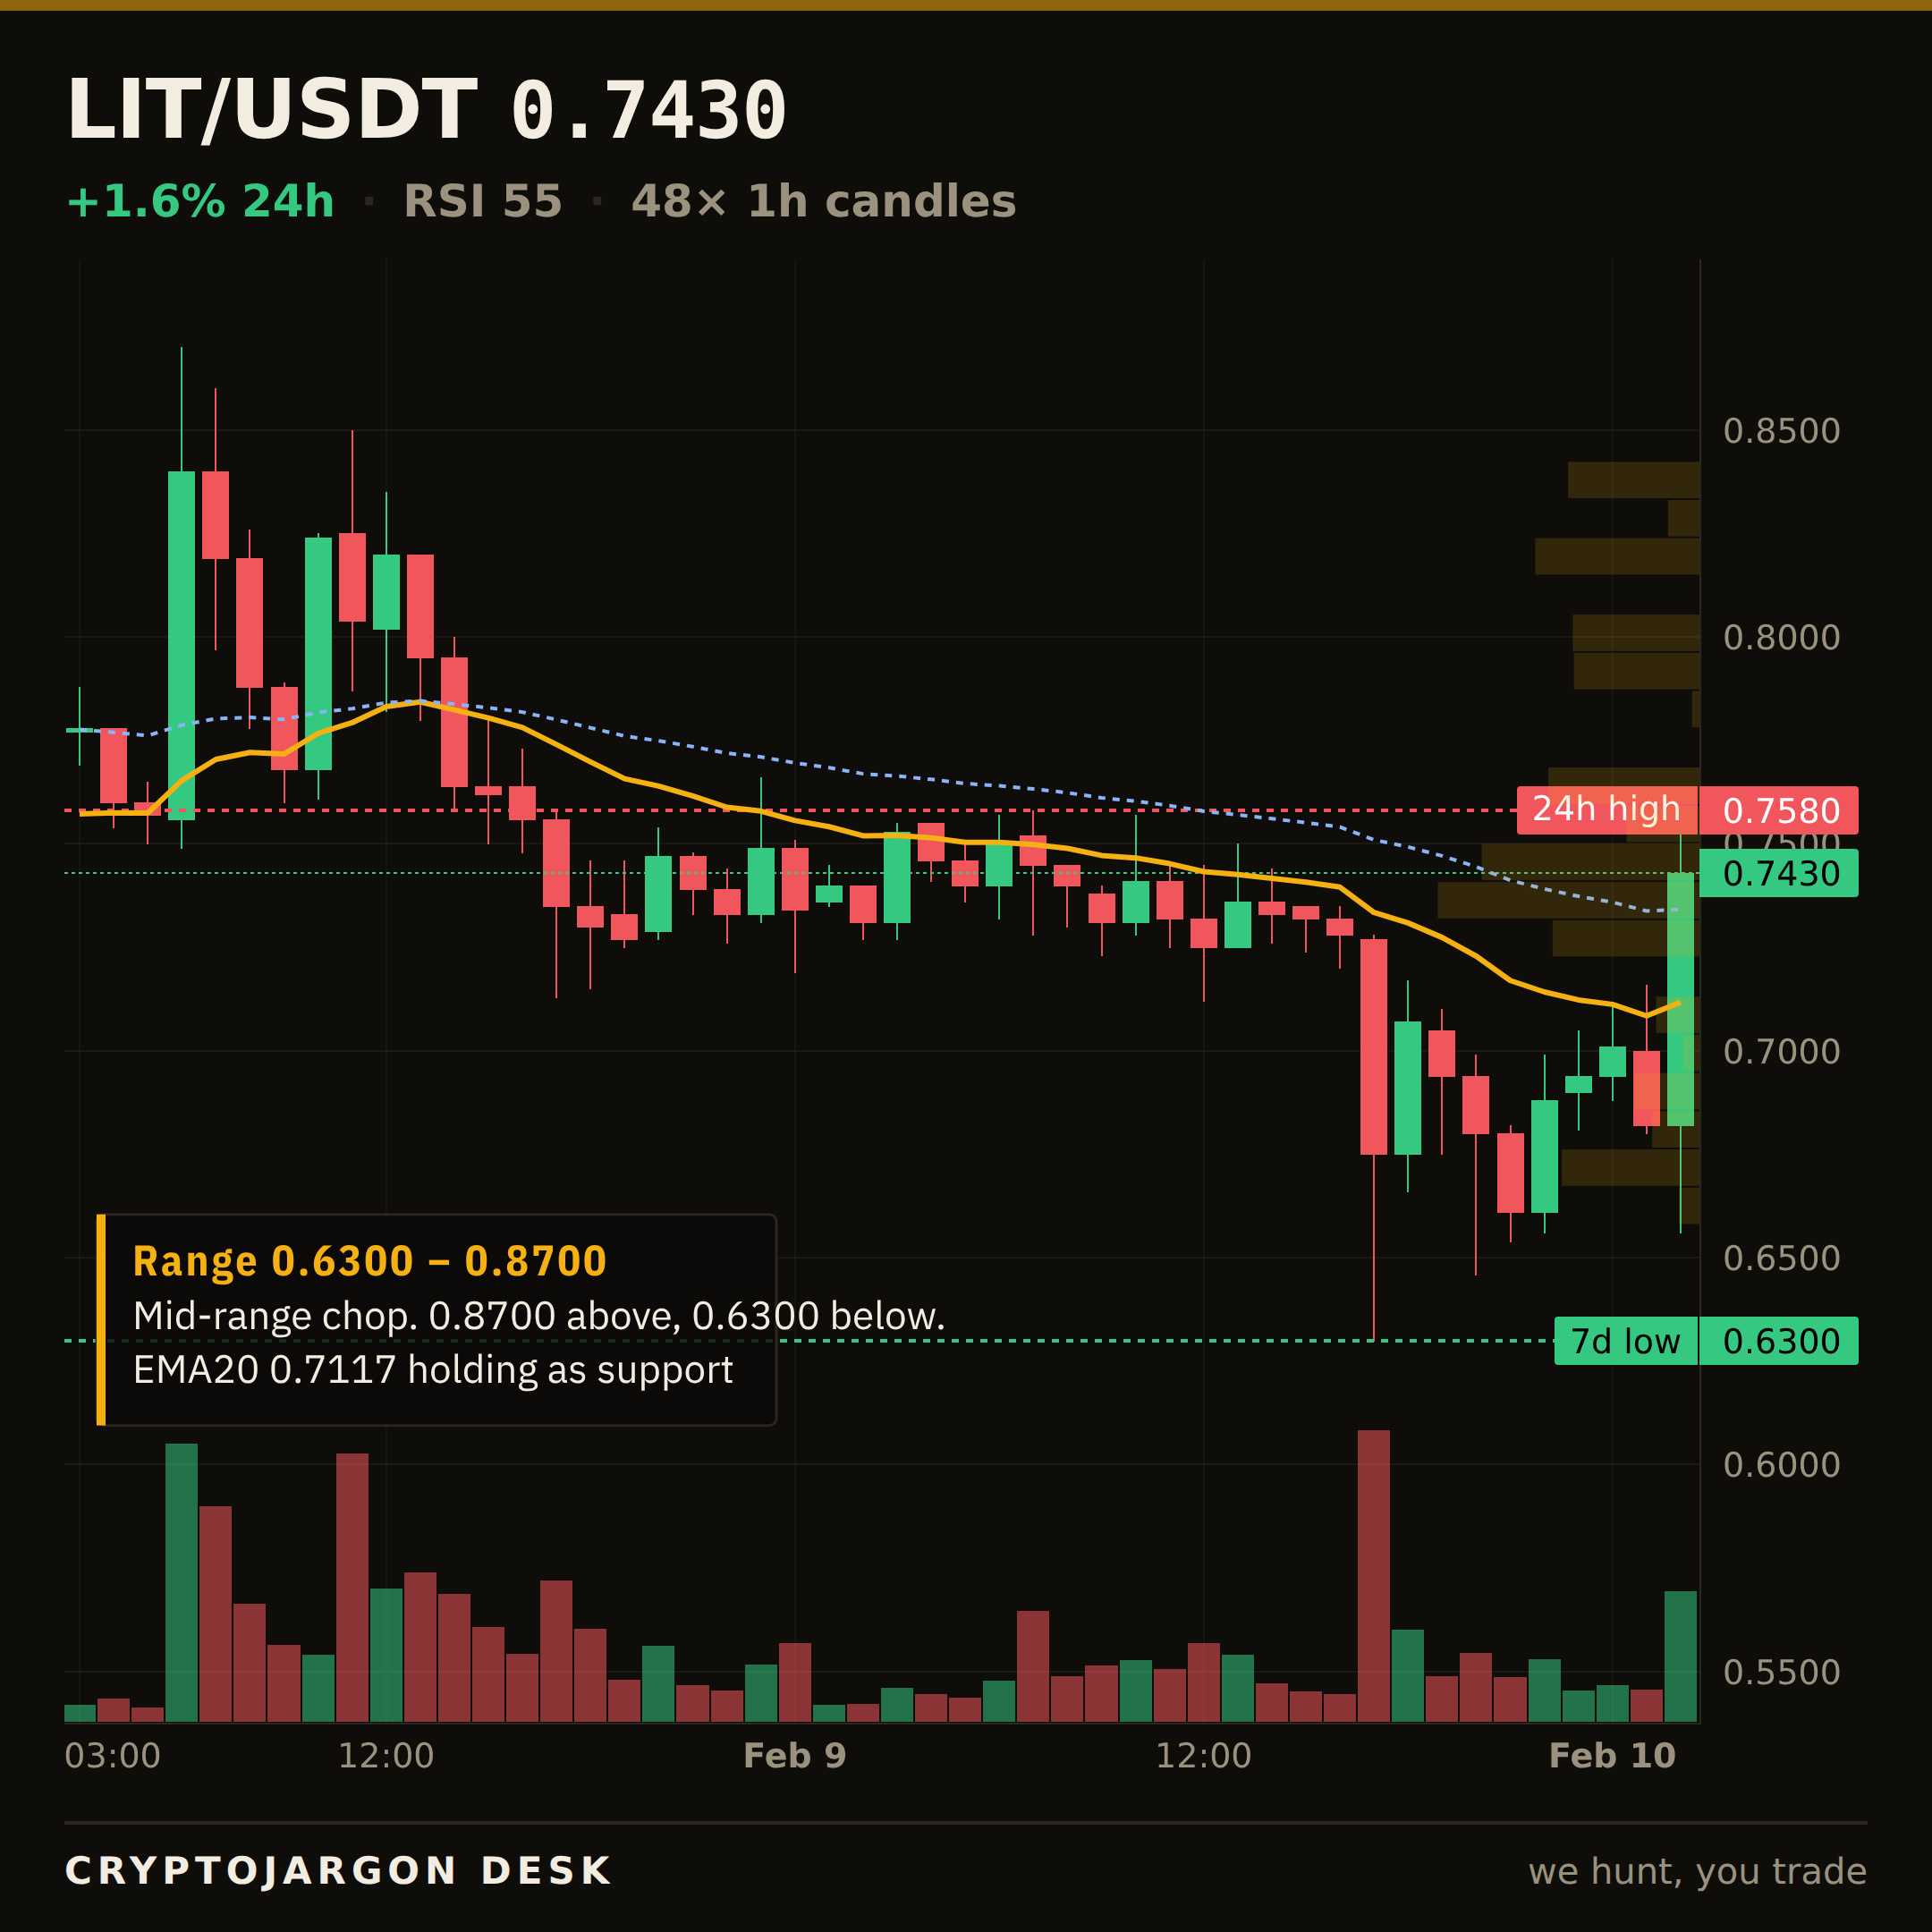
374
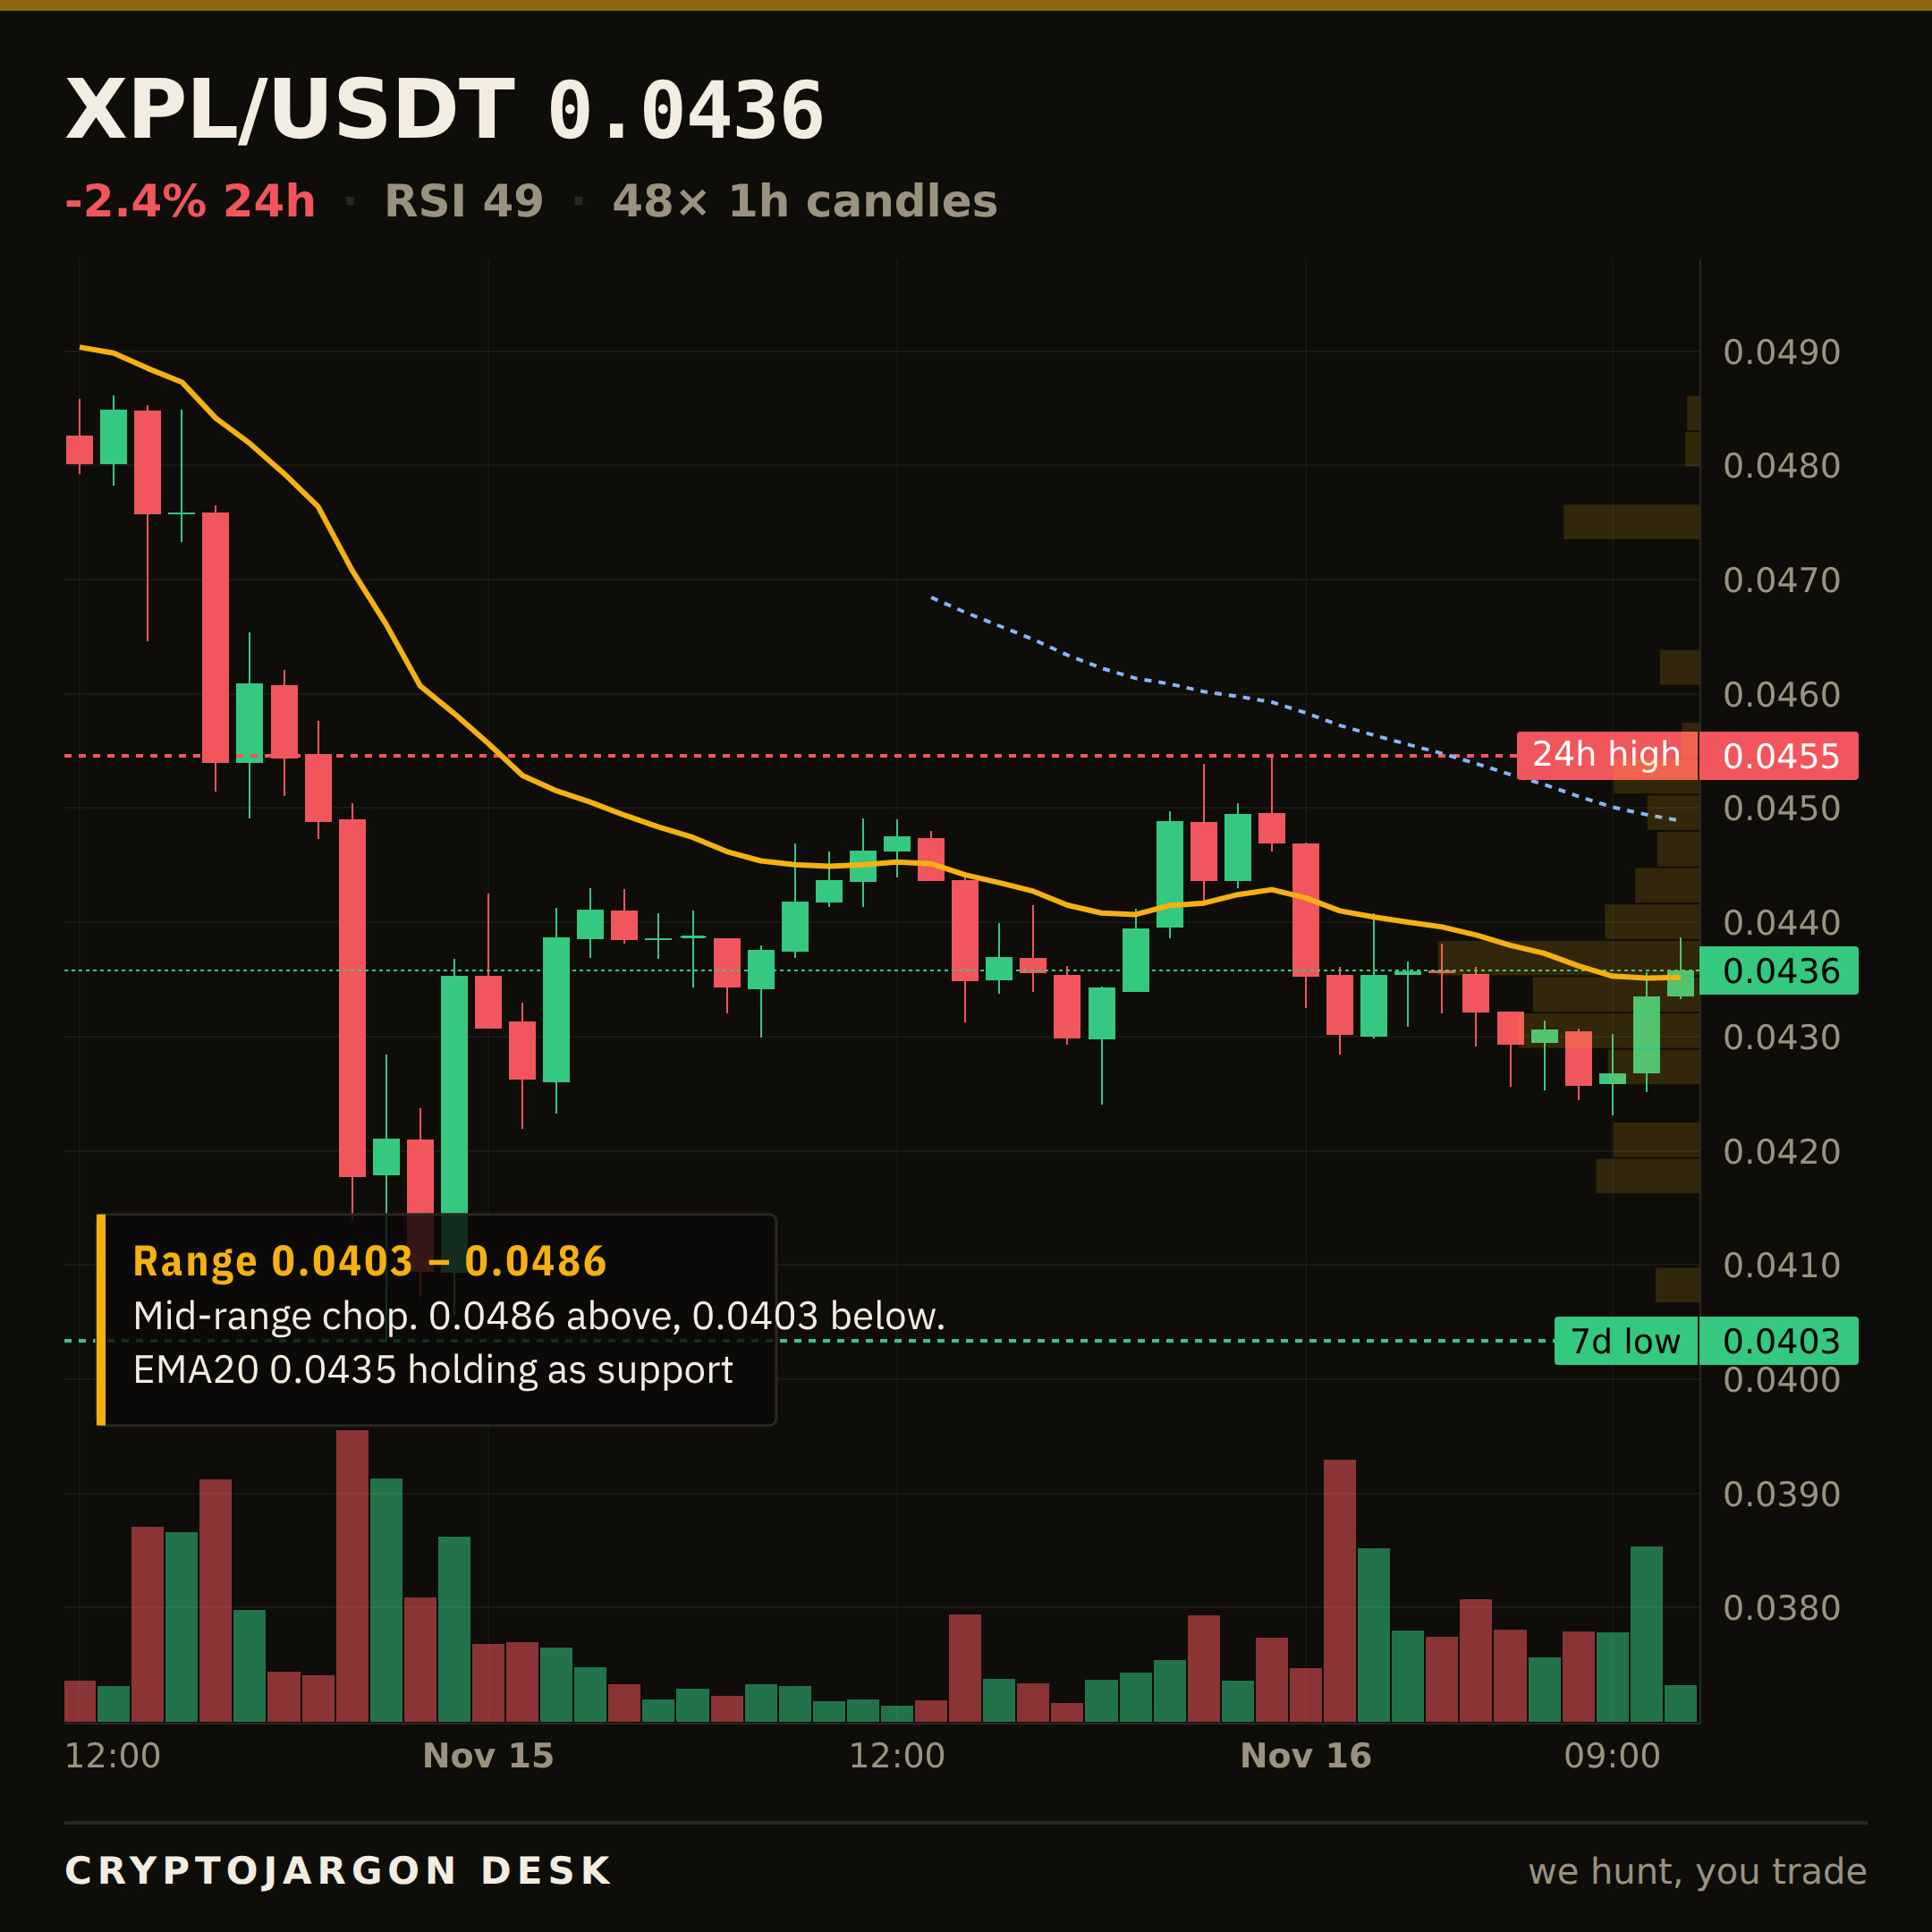
$XPL · THE LEVEL HELD
The floor did its job.
$XPL sat on $0.0423 and pushed back up — $0.0436 now. The floor is intact and the structure holds while price stays above it.
Is that floor getting stronger every touch, or weaker?
$XPL
$XPL · THE LEVEL HELD
The floor did its job.
$XPL sat on $0.0423 and pushed back up — $0.0436 now. The floor is intact and the structure holds while price stays above it.
Is that floor getting stronger every touch, or weaker?
$XPL
The floor did its job.
$XPL sat on $0.0423 and pushed back up — $0.0436 now. The floor is intact and the structure holds while price stays above it.
Is that floor getting stronger every touch, or weaker?
$XPL
1
1
1.1k
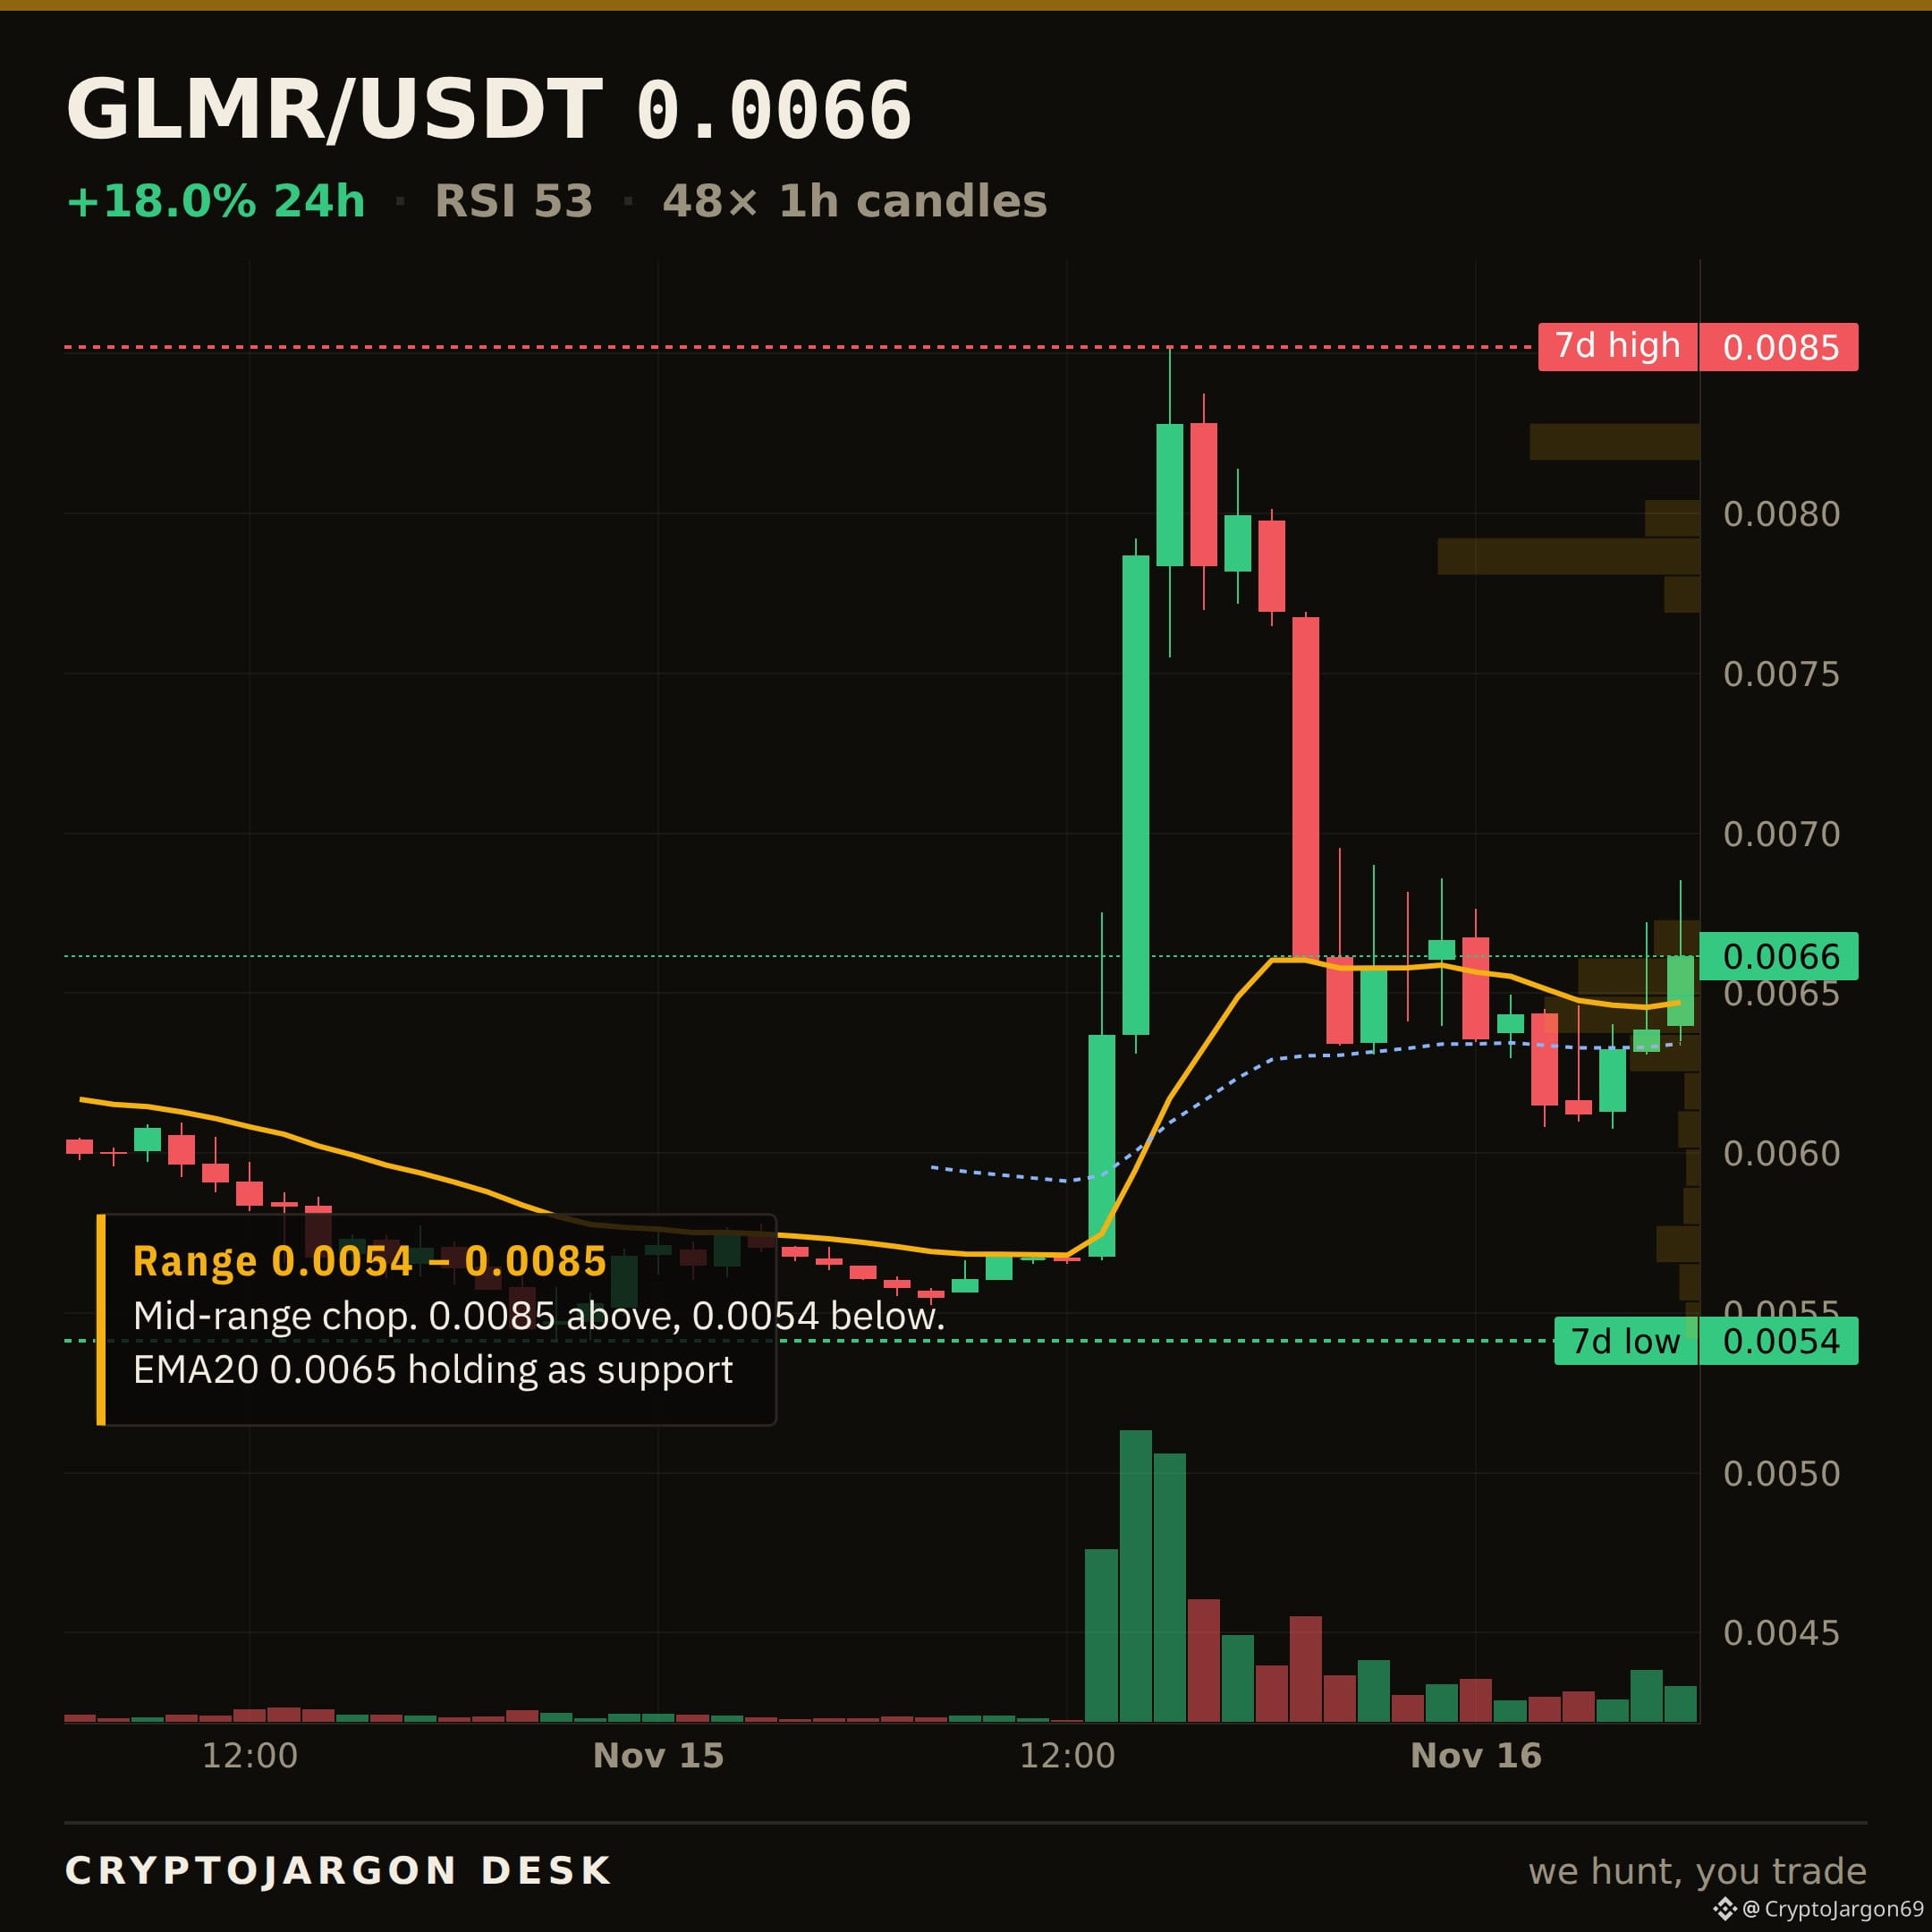
$GLMR · THE LEVEL CLEARED
It cleared.
$0.00631 was the ceiling we flagged on $GLMR. Price closed back above it — $0.00662 now. It flips into the floor that has to hold, and the upper range is open while it does.
Clean break, or does it come back to retest $0.00631?
$GLMR
$GLMR · THE LEVEL CLEARED
It cleared.
$0.00631 was the ceiling we flagged on $GLMR . Price closed back above it — $0.00662 now. It flips into the floor that has to hold, and the upper range is open while it does.
Clean break, or does it come back to retest $0.00631?
$GLMR
It cleared.
$0.00631 was the ceiling we flagged on $GLMR . Price closed back above it — $0.00662 now. It flips into the floor that has to hold, and the upper range is open while it does.
Clean break, or does it come back to retest $0.00631?
$GLMR
583
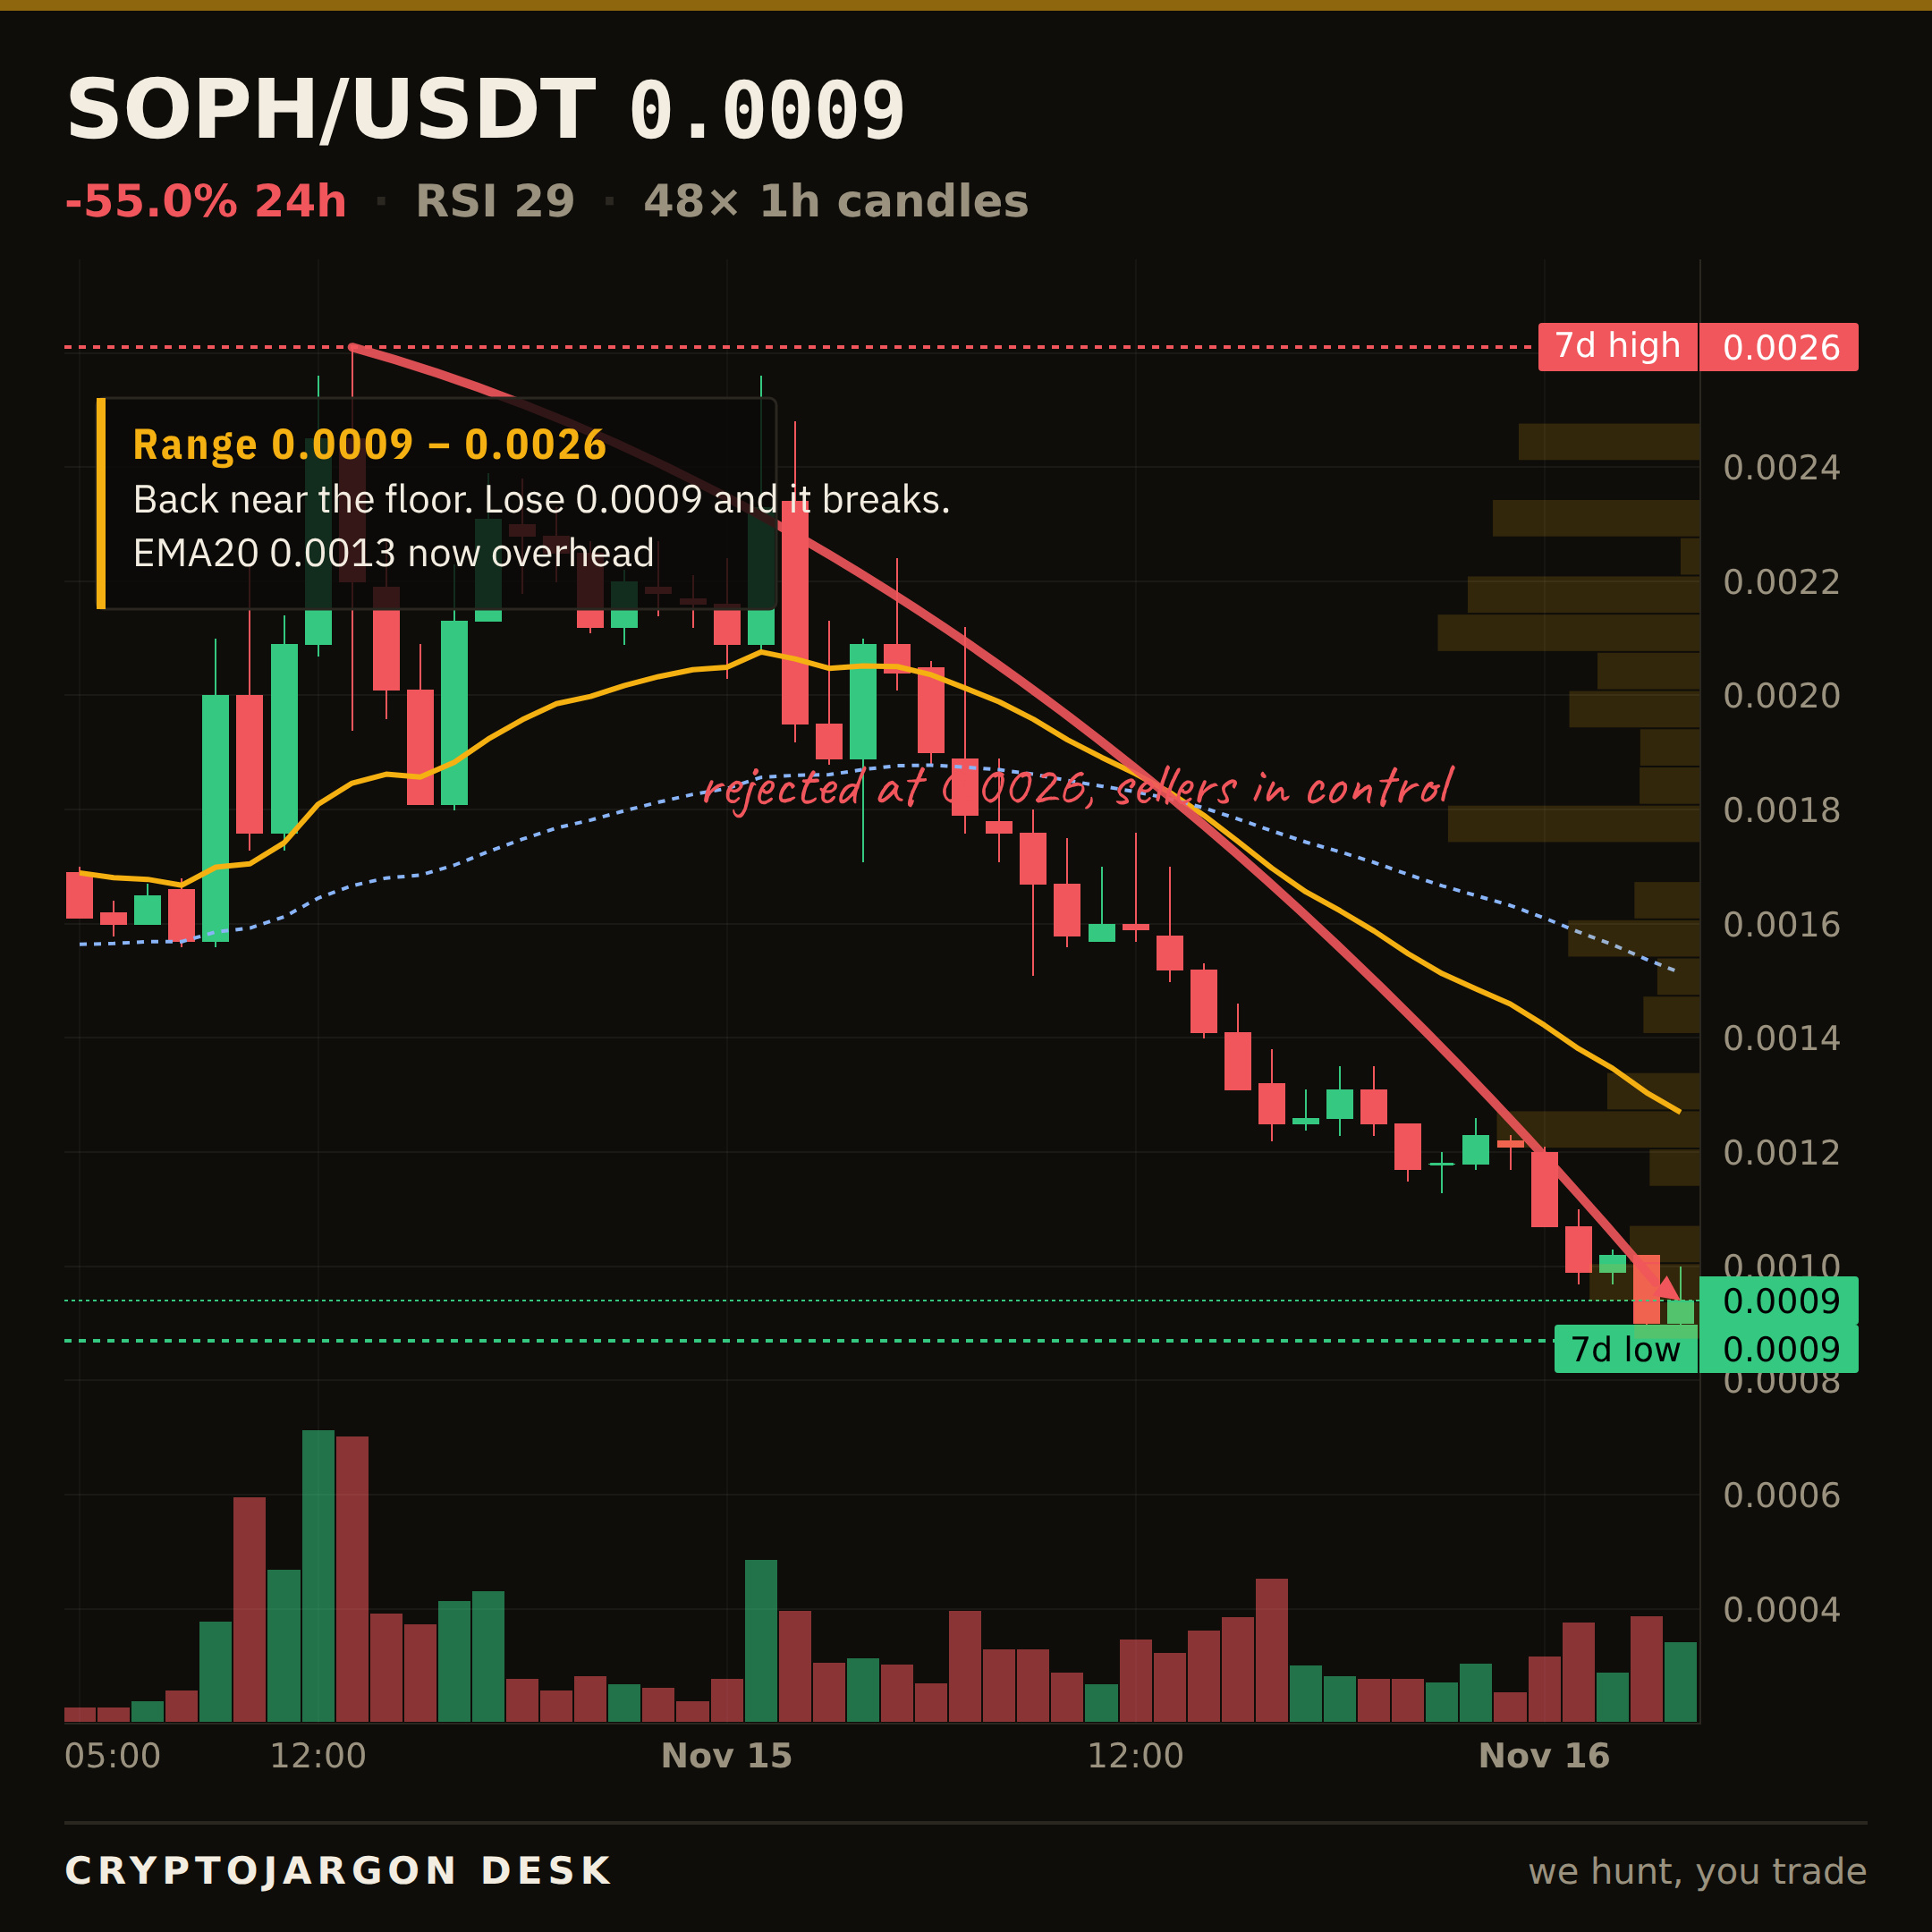
$SOPH · MARKET STRUCTURE
$0.00094, -55.0% on the day.
Trend — price below both EMAs, the 20 under the 50.
Momentum — RSI 29.
Range — 5% up its 24h range ($0.00087–$0.00224).
Trend, momentum and range mostly point the same way — an aligned tape to the downside.
Levels: $0.00224 24h high (ceiling) · $0.00087 24h low (support) · 7d range $0.00087–$0.00261.
Chart: 1H candles, EMA20/50 + levels marked. $SOPH
$SOPH · MARKET STRUCTURE
$0.00094, -55.0% on the day.
Trend — price below both EMAs, the 20 under the 50.
Momentum — RSI 29.
Range — 5% up its 24h range ($0.00087–$0.00224).
Trend, momentum and range mostly point the same way — an aligned tape to the downside.
Levels: $0.00224 24h high (ceiling) · $0.00087 24h low (support) · 7d range $0.00087–$0.00261.
Chart: 1H candles, EMA20/50 + levels marked. $SOPH
$0.00094, -55.0% on the day.
Trend — price below both EMAs, the 20 under the 50.
Momentum — RSI 29.
Range — 5% up its 24h range ($0.00087–$0.00224).
Trend, momentum and range mostly point the same way — an aligned tape to the downside.
Levels: $0.00224 24h high (ceiling) · $0.00087 24h low (support) · 7d range $0.00087–$0.00261.
Chart: 1H candles, EMA20/50 + levels marked. $SOPH
551
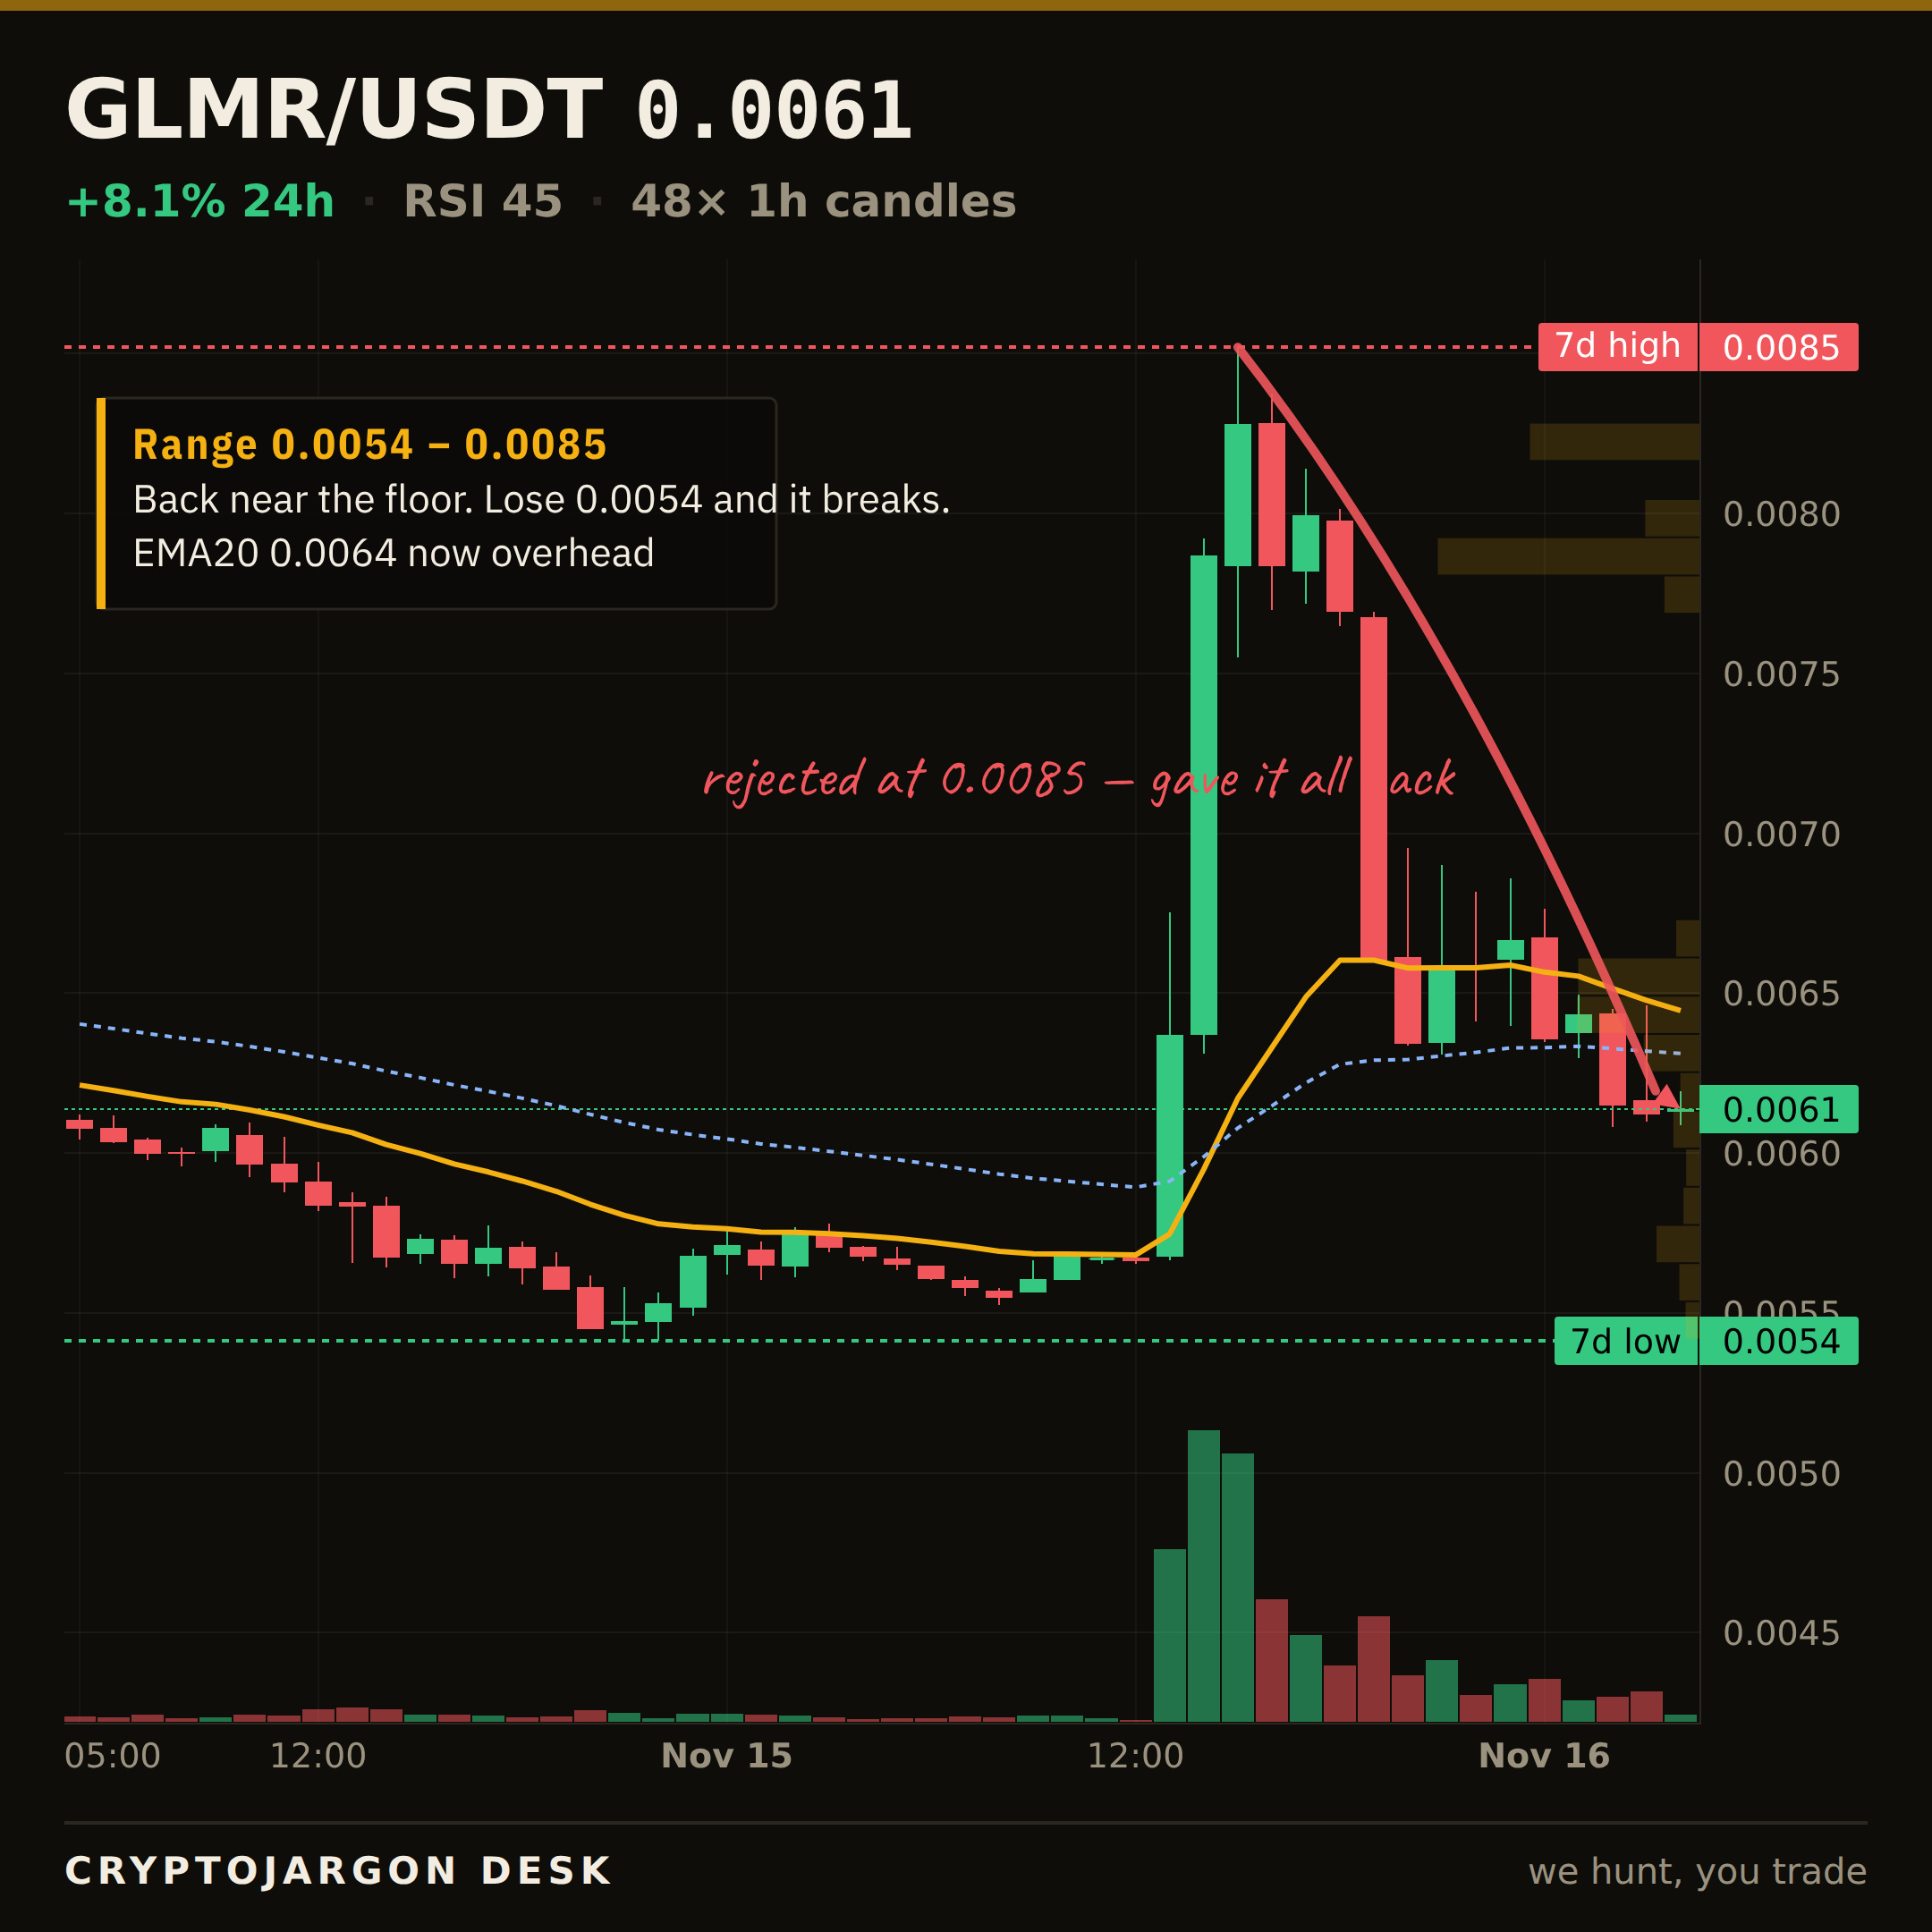
$GLMR · LEVEL TO WATCH
$0.00614 now.
The line that matters is $0.00631 — the 50-EMA, the ceiling the tape is pressing from below.
A clean close back above $0.00631 opens the upper range; stalling there keeps this a range. I'll follow up when it resolves.
Chart: the level is on it. $GLMR
$GLMR · LEVEL TO WATCH
$0.00614 now.
The line that matters is $0.00631 — the 50-EMA, the ceiling the tape is pressing from below.
A clean close back above $0.00631 opens the upper range; stalling there keeps this a range. I'll follow up when it resolves.
Chart: the level is on it. $GLMR
$0.00614 now.
The line that matters is $0.00631 — the 50-EMA, the ceiling the tape is pressing from below.
A clean close back above $0.00631 opens the upper range; stalling there keeps this a range. I'll follow up when it resolves.
Chart: the level is on it. $GLMR
518
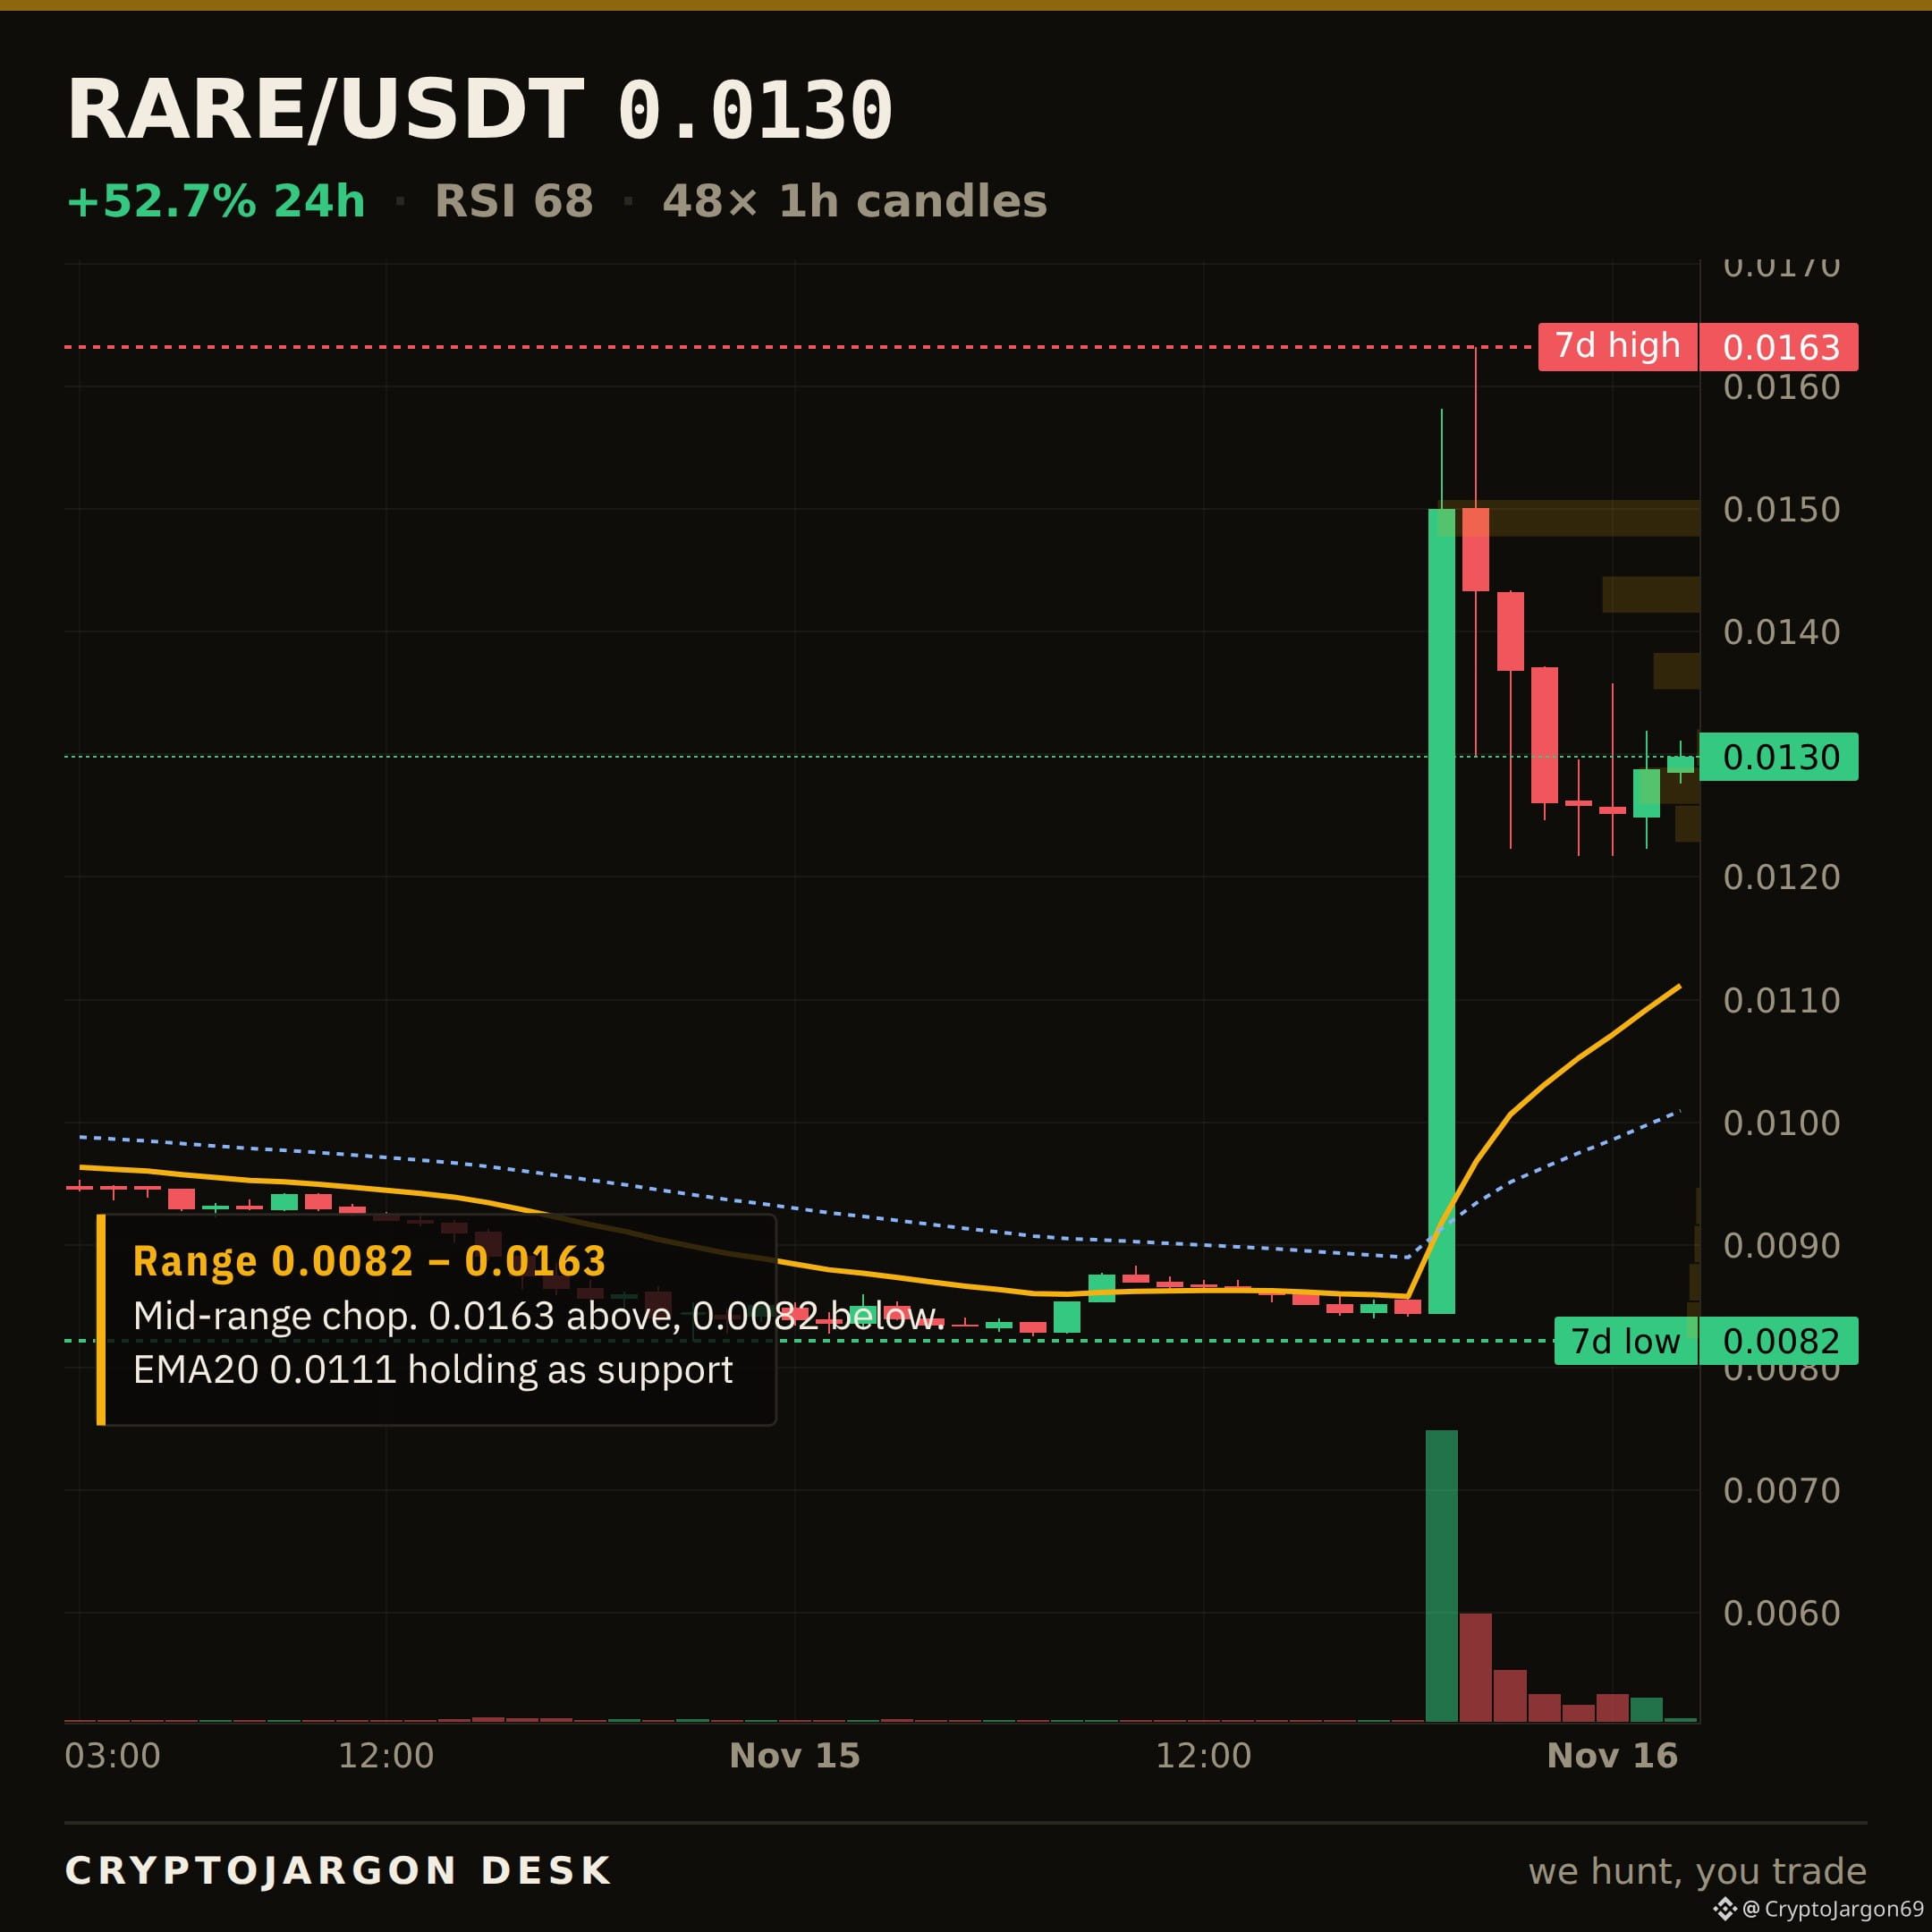
$RARE · MARKET STRUCTURE
$0.013, +52.7% on the day.
Trend — price above both EMAs, the 20 over the 50.
Momentum — RSI 68.
Range — 59% up its 24h range ($0.00826–$0.0163).
Trend, momentum and range mostly point the same way — an aligned tape to the upside.
Levels: $0.0163 24h high (ceiling) · $0.00826 24h low (support) · 7d range $0.00822–$0.0163.
Chart: 1H candles, EMA20/50 + levels marked. $RARE
$RARE · MARKET STRUCTURE
$0.013, +52.7% on the day.
Trend — price above both EMAs, the 20 over the 50.
Momentum — RSI 68.
Range — 59% up its 24h range ($0.00826–$0.0163).
Trend, momentum and range mostly point the same way — an aligned tape to the upside.
Levels: $0.0163 24h high (ceiling) · $0.00826 24h low (support) · 7d range $0.00822–$0.0163.
Chart: 1H candles, EMA20/50 + levels marked. $RARE
$0.013, +52.7% on the day.
Trend — price above both EMAs, the 20 over the 50.
Momentum — RSI 68.
Range — 59% up its 24h range ($0.00826–$0.0163).
Trend, momentum and range mostly point the same way — an aligned tape to the upside.
Levels: $0.0163 24h high (ceiling) · $0.00826 24h low (support) · 7d range $0.00822–$0.0163.
Chart: 1H candles, EMA20/50 + levels marked. $RARE
548
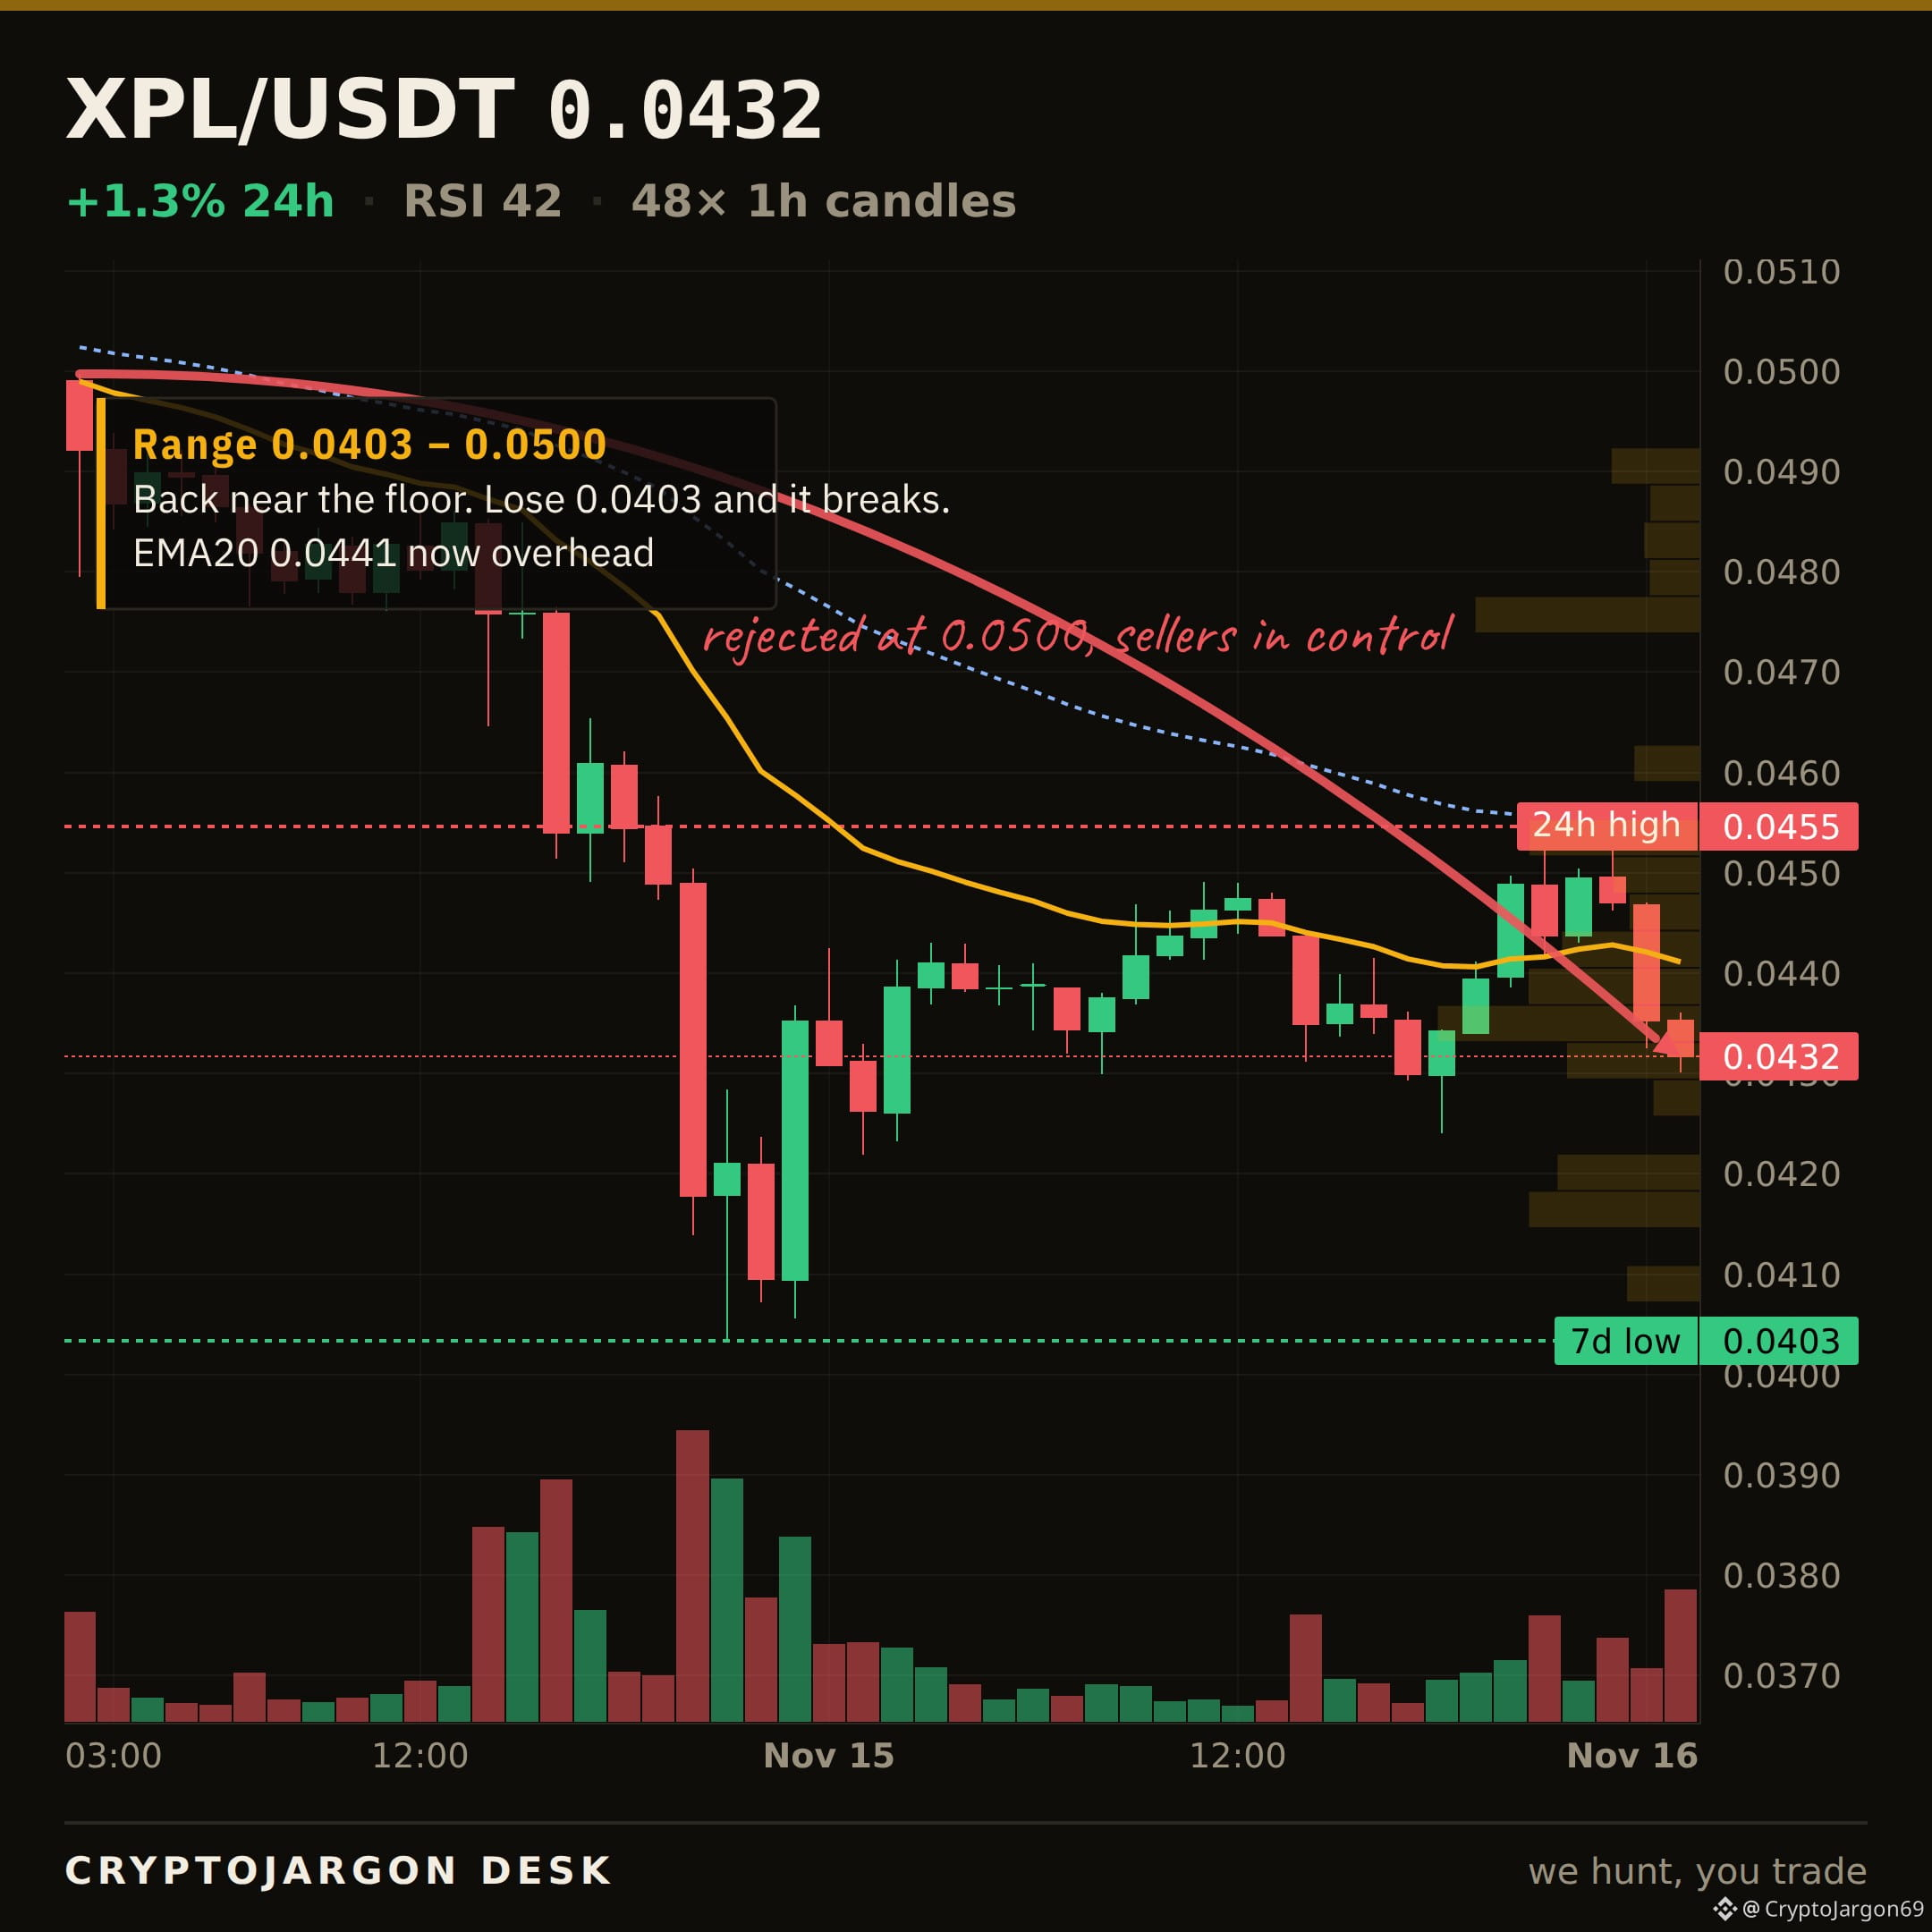
$XPL · LEVEL TO WATCH
$0.0432 now.
The line that matters is $0.0423 — the 24h low, the floor the tape is sitting on.
Holding $0.0423 keeps the structure intact; a clean close below opens the range beneath it. I'll follow up when it resolves.
Chart: the level is on it. $XPL
$XPL · LEVEL TO WATCH
$0.0432 now.
The line that matters is $0.0423 — the 24h low, the floor the tape is sitting on.
Holding $0.0423 keeps the structure intact; a clean close below opens the range beneath it. I'll follow up when it resolves.
Chart: the level is on it. $XPL
$0.0432 now.
The line that matters is $0.0423 — the 24h low, the floor the tape is sitting on.
Holding $0.0423 keeps the structure intact; a clean close below opens the range beneath it. I'll follow up when it resolves.
Chart: the level is on it. $XPL
552
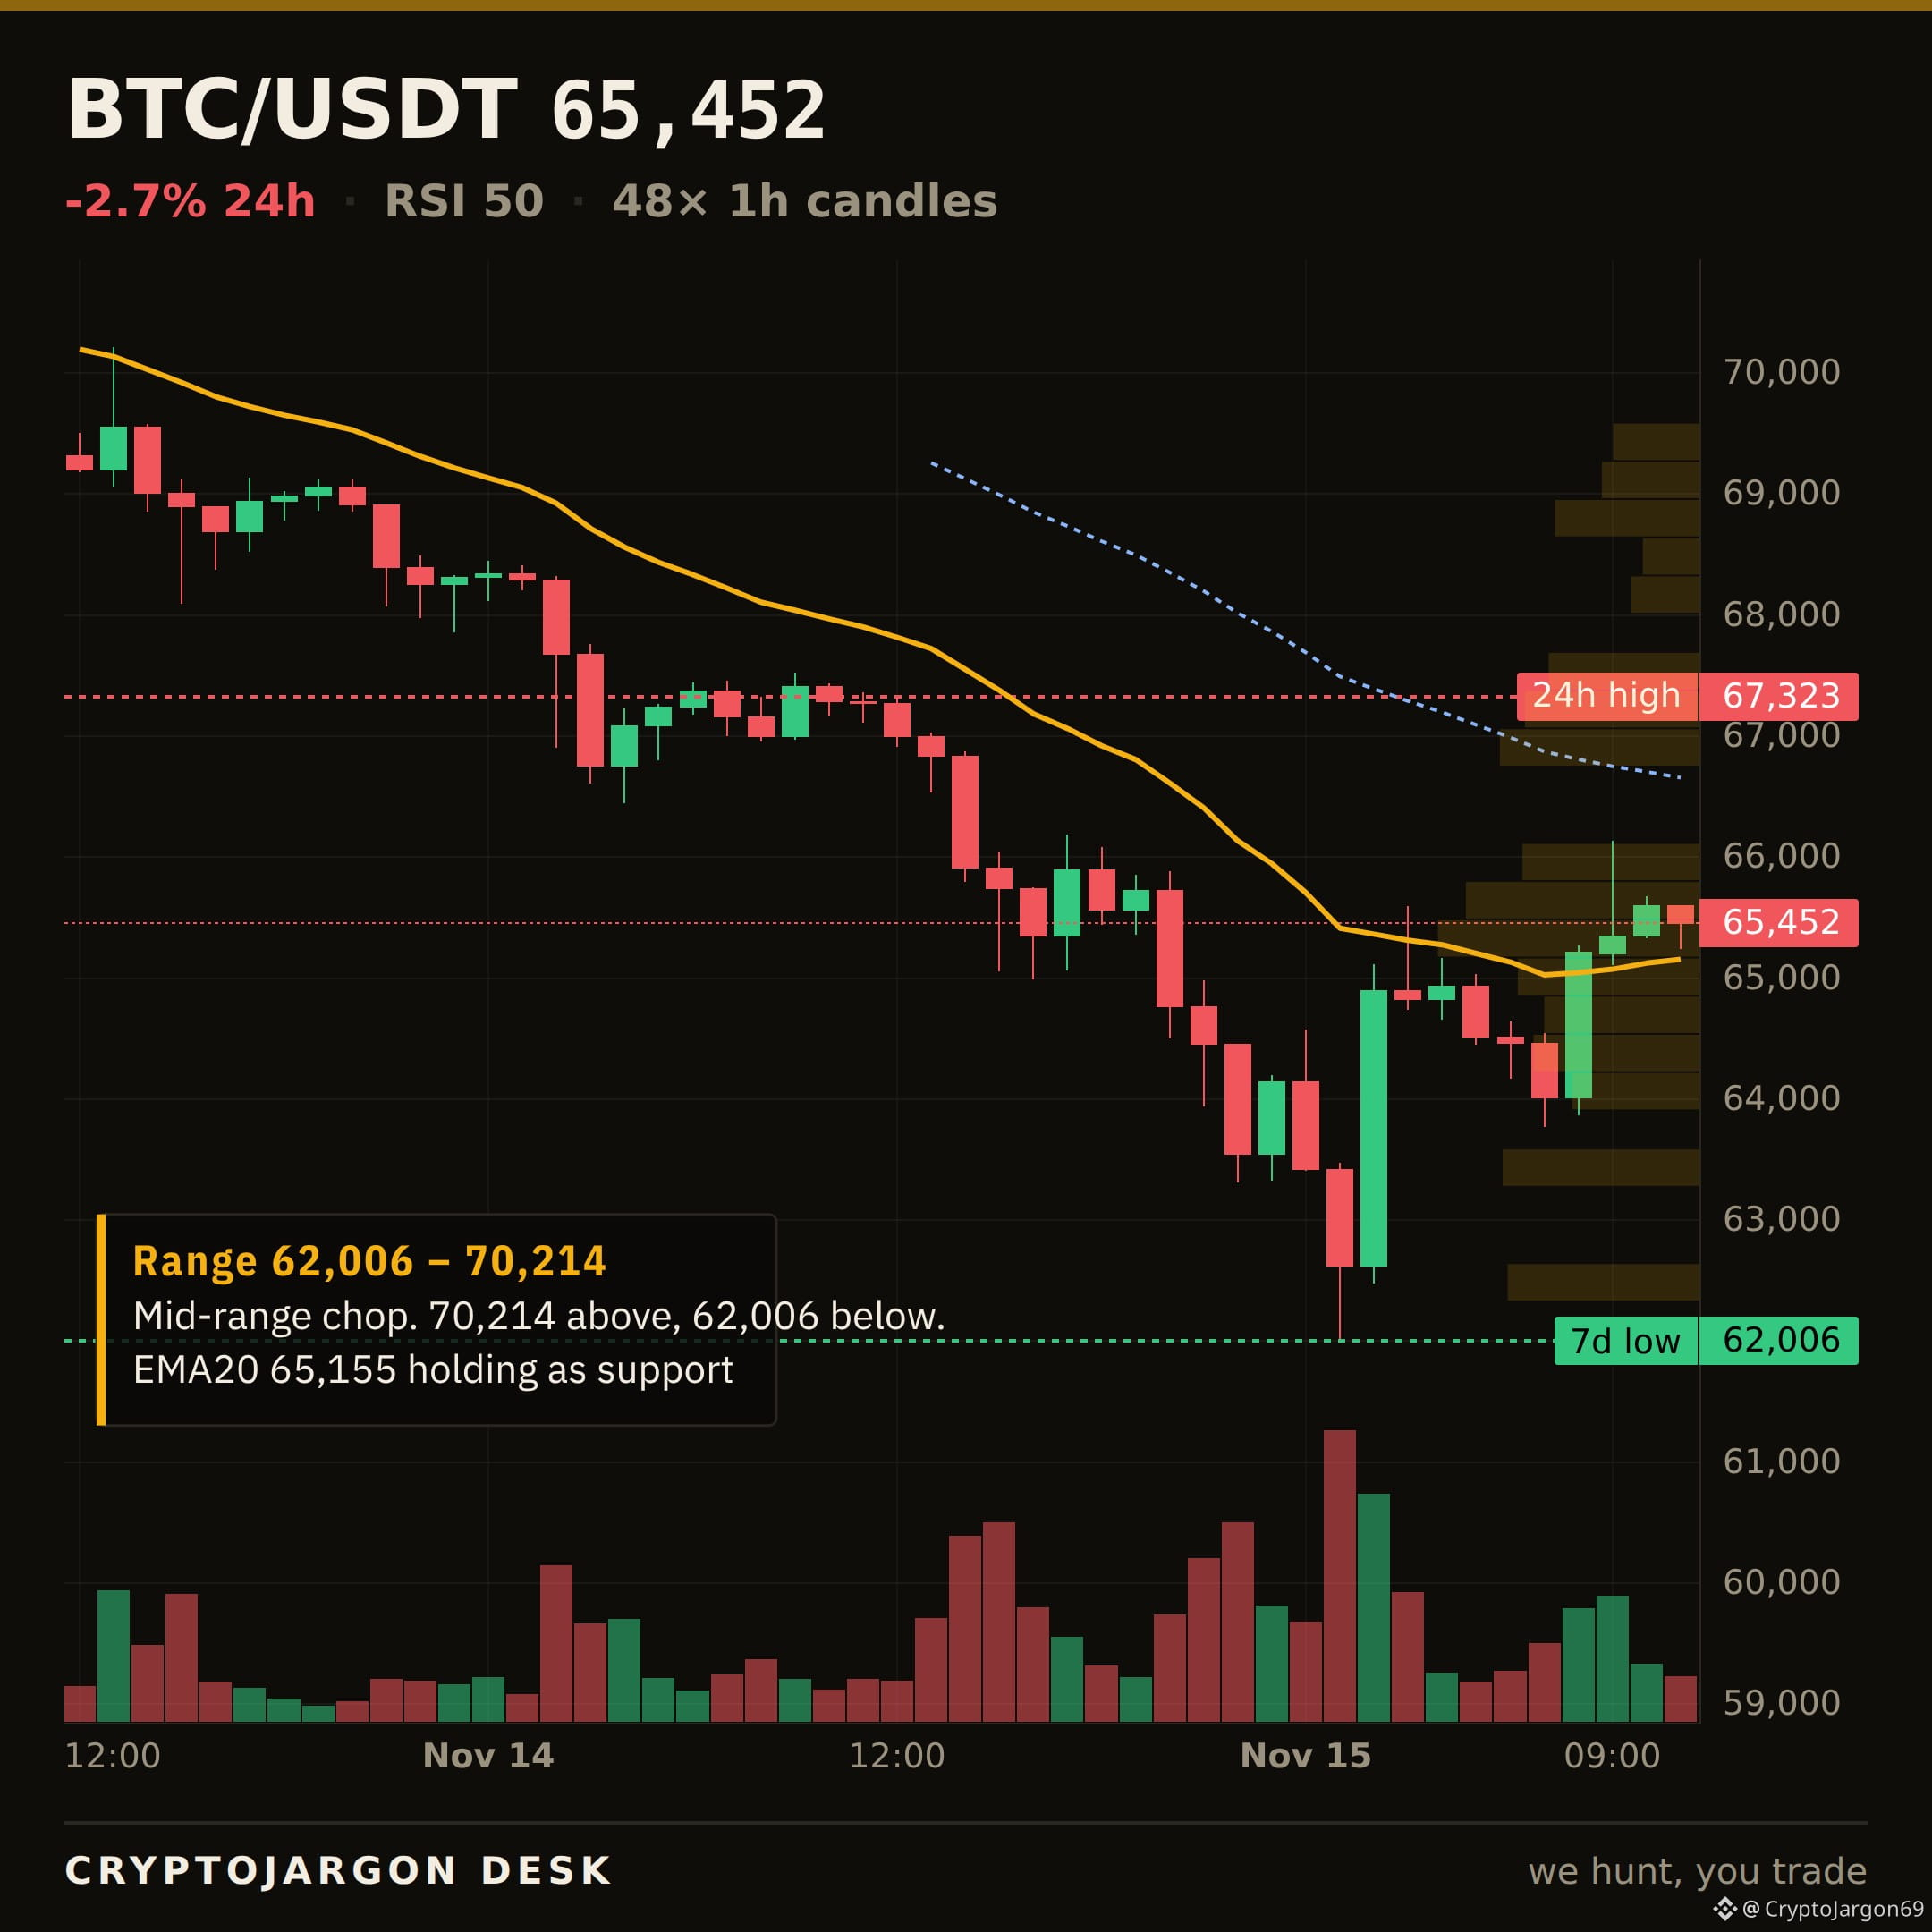
$BTC · THE LEVEL CLEARED
It cleared.
$65,269 was the ceiling we flagged on $BTC. Price closed back above it — $65,452 now. It flips into the floor that has to hold, and the upper range is open while it does.
Does $65,269 hold as support now, or is this a fakeout?
$BTC
$BTC · THE LEVEL CLEARED
It cleared.
$65,269 was the ceiling we flagged on $BTC . Price closed back above it — $65,452 now. It flips into the floor that has to hold, and the upper range is open while it does.
Does $65,269 hold as support now, or is this a fakeout?
$BTC
It cleared.
$65,269 was the ceiling we flagged on $BTC . Price closed back above it — $65,452 now. It flips into the floor that has to hold, and the upper range is open while it does.
Does $65,269 hold as support now, or is this a fakeout?
$BTC
1
995
Log in to explore more content
Join global crypto users on Binance Square
⚡️ Get latest and useful information about crypto.
💬 Trusted by the world’s largest crypto exchange.
👍 Discover real insights from verified creators.
Email / Phone number
Trending Topics
MoreHikesExpectedIsBTCUnderPressure
4,180 views
87 Discussing
FOMC Minutes | Fed Minutes Show Almost All Officials Expect More Rate Hikes, With Some Open to a Larger December Move
Binance News
·14 Likes
·18k views
NvidiaBeatsEstimatesWith$130BQ4Outlook
70,912 views
295 Discussing
AnthropicIPOPriceCouldExceed$80
70,263 views
244 Discussing