

CaptainAltcoin
27k Posts

CaptainAltcoin
Report
Block User
Ahoy, crypto sailors! Navigate the stormy seas of the digital world with CaptainAltcoin, your trusty compass for crypto guides, reviews, and news.
7 Following
101.4K+ Followers
94.4K+ Liked
2 Badges
Posts
Article
XRP Price Prediction for Today (October 7)Ripple’s XRP is up 1.32% to $1.52 over the past 24 hours, closely tracking Bitcoin’s 1.27% advance as the total crypto market cap climbed 1.06%.
The move points to a broader risk-on session, with XRP also getting mild support from digital-commodity and Layer-1 sectors, which gained about 0.7%. The key question now is whether the XRP price can turn the $1.50 area into a stronger base and challenge higher resistance.
With Evernorth set for its Nasdaq listing on October 8 and an XRPL Batch upgrade due October 9, traders have several potential volatility triggers ahead. Technical trader Peter Brandt has also identified a cup-and-handle setup with a measured target near $2.16. Here’s where the XRP price can go today.
News Pushing Ripple’s XRP Price Presently
Veteran trader Peter Brandt has identified a potential cup-and-handle pattern on XRP’s daily chart, placing its measured target near $2.16. The key breakout level is $1.6572, but Brandt also pointed to heavy overhead supply between $1.60 and $2.00. For the setup to gain confirmation, XRP needs a daily close above $1.6572. A move below $1.47 would weaken the pattern and put the bullish case under pressure.
Clearpool is also preparing to migrate its CPOOL ecosystem from Ethereum to the XRP Ledger after token holders voted overwhelmingly in favor of the move. The Q4 2026 migration will replace CPOOL with the XRPL-native CLEAR token at a one-for-one ratio.
The move brings a decentralized credit platform onto XRPL and could increase network activity and RLUSD usage. The direct effect on XRP demand is more limited because Clearpool loans are settled in RLUSD rather than XRP.
RippleX developers have also released the ninth Smart Escrow devnet, advancing programmable escrow functionality on XRPL. The latest version moved the WebAssembly integration to Rust and reported performance improvements of 30%-50%. The technology is designed for conditional payments and more complex financial agreements, giving XRPL additional functionality beyond standard payment transfers.
Here’s What the XRP Chart Is Showing
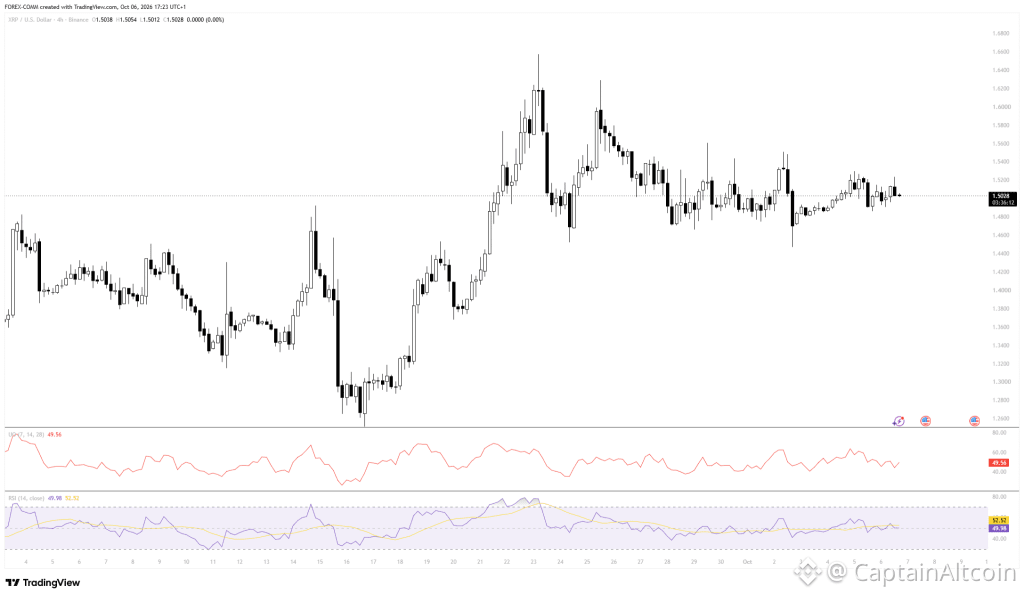
We had a look at the chart, and Ripples’ XRP price is trading around $1.5028 after spending several sessions inside a relatively narrow range.
The broader move from the September low near $1.26 produced a recovery toward $1.62, but XRP failed to maintain that level and has since consolidated between roughly $1.47 and $1.54. The $1.50 area is therefore an important short-term pivot. Holding it keeps the door open for another test of 1.54-1.55.
Source: Tradingview.com
The momentum indicators are close to neutral. The Ultimate Oscillator reads 49.56, almost exactly around the midpoint, showing neither strong buying nor selling pressure. The RSI is 49.98, with its moving average around 52.52. That puts RSI below its average and leaves XRP without an overbought condition. A move above 50-52 on RSI could strengthen the case for a test of the upper range.
The chart also shows repeated rejection around $1.52-$1.54, making that zone the first major hurdle for October 7. If buyers clear it with stronger volume, $1.60 becomes the next area to watch, followed by Brandt’s $1.6572 breakout level. On the downside, $1.47 has held several tests, and a break below $1.45 would expose the $1.38 region.
Related XRP News: Claude AI Predicts XRP and Solana Prices By the End of November
Where Will Ripple’s XRP Price Go Today?
The bullish path starts with XRP defending $1.50 and breaking $1.54-$1.55. A successful move through that zone could send the token toward $1.60 and then $1.63-$1.65, with $1.6572 acting as the key breakout level.
The neutral path keeps XRP between $1.47 and $1.55. With RSI near 50 and the Ultimate Oscillator at 49.56, the indicators support a range-bound session unless fresh buying volume enters the market.
The bearish path begins with a loss of $1.47, followed by a break below $1.45. That would put $1.38 near the 50-day EMA into focus, giving traders a clear downside level to monitor.
Frequently Asked Questions
Can XRP reach $1.65 today
XRP could reach $1.65 if it breaks above the $1.54-$1.55 resistance zone with strong volume. The next major level is $1.6572, which Peter Brandt identified as the key breakout point for his cup-and-handle setup.
What is driving XRP’s price today
XRP is benefiting primarily from broader crypto-market strength, with Bitcoin up 1.27% and the total market cap rising 1.06%. XRPL developments, including Clearpool’s migration and the Smart Escrow devnet, also provide fundamental support for the ecosystem.
What happens if XRP falls below $1.47
A break below $1.47 would weaken the bullish setup and could send XRP toward $1.45 and then the $1.38 area. The $1.38 level is important because it sits near the 50-day EMA identified on the chart.
Subscribe to our YouTube channel for daily crypto updates, market insights, and expert analysis.
The post XRP Price Prediction for Today (October 7) appeared first on CaptainAltcoin.
XRP Price Prediction for Today (October 7)
Ripple’s XRP is up 1.32% to $1.52 over the past 24 hours, closely tracking Bitcoin’s 1.27% advance as the total crypto market cap climbed 1.06%.
The move points to a broader risk-on session, with XRP also getting mild support from digital-commodity and Layer-1 sectors, which gained about 0.7%. The key question now is whether the XRP price can turn the $1.50 area into a stronger base and challenge higher resistance.
With Evernorth set for its Nasdaq listing on October 8 and an XRPL Batch upgrade due October 9, traders have several potential volatility triggers ahead. Technical trader Peter Brandt has also identified a cup-and-handle setup with a measured target near $2.16. Here’s where the XRP price can go today.
News Pushing Ripple’s XRP Price Presently
Veteran trader Peter Brandt has identified a potential cup-and-handle pattern on XRP’s daily chart, placing its measured target near $2.16. The key breakout level is $1.6572, but Brandt also pointed to heavy overhead supply between $1.60 and $2.00. For the setup to gain confirmation, XRP needs a daily close above $1.6572. A move below $1.47 would weaken the pattern and put the bullish case under pressure.
Clearpool is also preparing to migrate its CPOOL ecosystem from Ethereum to the XRP Ledger after token holders voted overwhelmingly in favor of the move. The Q4 2026 migration will replace CPOOL with the XRPL-native CLEAR token at a one-for-one ratio.
The move brings a decentralized credit platform onto XRPL and could increase network activity and RLUSD usage. The direct effect on XRP demand is more limited because Clearpool loans are settled in RLUSD rather than XRP.
RippleX developers have also released the ninth Smart Escrow devnet, advancing programmable escrow functionality on XRPL. The latest version moved the WebAssembly integration to Rust and reported performance improvements of 30%-50%. The technology is designed for conditional payments and more complex financial agreements, giving XRPL additional functionality beyond standard payment transfers.
Here’s What the XRP Chart Is Showing
We had a look at the chart, and Ripples’ XRP price is trading around $1.5028 after spending several sessions inside a relatively narrow range.
The broader move from the September low near $1.26 produced a recovery toward $1.62, but XRP failed to maintain that level and has since consolidated between roughly $1.47 and $1.54. The $1.50 area is therefore an important short-term pivot. Holding it keeps the door open for another test of 1.54-1.55.
Source: Tradingview.com
The momentum indicators are close to neutral. The Ultimate Oscillator reads 49.56, almost exactly around the midpoint, showing neither strong buying nor selling pressure. The RSI is 49.98, with its moving average around 52.52. That puts RSI below its average and leaves XRP without an overbought condition. A move above 50-52 on RSI could strengthen the case for a test of the upper range.
The chart also shows repeated rejection around $1.52-$1.54, making that zone the first major hurdle for October 7. If buyers clear it with stronger volume, $1.60 becomes the next area to watch, followed by Brandt’s $1.6572 breakout level. On the downside, $1.47 has held several tests, and a break below $1.45 would expose the $1.38 region.
Related XRP News: Claude AI Predicts XRP and Solana Prices By the End of November
Where Will Ripple’s XRP Price Go Today?
The bullish path starts with XRP defending $1.50 and breaking $1.54-$1.55. A successful move through that zone could send the token toward $1.60 and then $1.63-$1.65, with $1.6572 acting as the key breakout level.
The neutral path keeps XRP between $1.47 and $1.55. With RSI near 50 and the Ultimate Oscillator at 49.56, the indicators support a range-bound session unless fresh buying volume enters the market.
The bearish path begins with a loss of $1.47, followed by a break below $1.45. That would put $1.38 near the 50-day EMA into focus, giving traders a clear downside level to monitor.
Frequently Asked Questions
Can XRP reach $1.65 today
XRP could reach $1.65 if it breaks above the $1.54-$1.55 resistance zone with strong volume. The next major level is $1.6572, which Peter Brandt identified as the key breakout point for his cup-and-handle setup.
What is driving XRP’s price today
XRP is benefiting primarily from broader crypto-market strength, with Bitcoin up 1.27% and the total market cap rising 1.06%. XRPL developments, including Clearpool’s migration and the Smart Escrow devnet, also provide fundamental support for the ecosystem.
What happens if XRP falls below $1.47
A break below $1.47 would weaken the bullish setup and could send XRP toward $1.45 and then the $1.38 area. The $1.38 level is important because it sits near the 50-day EMA identified on the chart.
Subscribe to our YouTube channel for daily crypto updates, market insights, and expert analysis.
The post XRP Price Prediction for Today (October 7) appeared first on CaptainAltcoin.
The move points to a broader risk-on session, with XRP also getting mild support from digital-commodity and Layer-1 sectors, which gained about 0.7%. The key question now is whether the XRP price can turn the $1.50 area into a stronger base and challenge higher resistance.
With Evernorth set for its Nasdaq listing on October 8 and an XRPL Batch upgrade due October 9, traders have several potential volatility triggers ahead. Technical trader Peter Brandt has also identified a cup-and-handle setup with a measured target near $2.16. Here’s where the XRP price can go today.
News Pushing Ripple’s XRP Price Presently
Veteran trader Peter Brandt has identified a potential cup-and-handle pattern on XRP’s daily chart, placing its measured target near $2.16. The key breakout level is $1.6572, but Brandt also pointed to heavy overhead supply between $1.60 and $2.00. For the setup to gain confirmation, XRP needs a daily close above $1.6572. A move below $1.47 would weaken the pattern and put the bullish case under pressure.
Clearpool is also preparing to migrate its CPOOL ecosystem from Ethereum to the XRP Ledger after token holders voted overwhelmingly in favor of the move. The Q4 2026 migration will replace CPOOL with the XRPL-native CLEAR token at a one-for-one ratio.
The move brings a decentralized credit platform onto XRPL and could increase network activity and RLUSD usage. The direct effect on XRP demand is more limited because Clearpool loans are settled in RLUSD rather than XRP.
RippleX developers have also released the ninth Smart Escrow devnet, advancing programmable escrow functionality on XRPL. The latest version moved the WebAssembly integration to Rust and reported performance improvements of 30%-50%. The technology is designed for conditional payments and more complex financial agreements, giving XRPL additional functionality beyond standard payment transfers.
Here’s What the XRP Chart Is Showing
We had a look at the chart, and Ripples’ XRP price is trading around $1.5028 after spending several sessions inside a relatively narrow range.
The broader move from the September low near $1.26 produced a recovery toward $1.62, but XRP failed to maintain that level and has since consolidated between roughly $1.47 and $1.54. The $1.50 area is therefore an important short-term pivot. Holding it keeps the door open for another test of 1.54-1.55.
Source: Tradingview.com
The momentum indicators are close to neutral. The Ultimate Oscillator reads 49.56, almost exactly around the midpoint, showing neither strong buying nor selling pressure. The RSI is 49.98, with its moving average around 52.52. That puts RSI below its average and leaves XRP without an overbought condition. A move above 50-52 on RSI could strengthen the case for a test of the upper range.
The chart also shows repeated rejection around $1.52-$1.54, making that zone the first major hurdle for October 7. If buyers clear it with stronger volume, $1.60 becomes the next area to watch, followed by Brandt’s $1.6572 breakout level. On the downside, $1.47 has held several tests, and a break below $1.45 would expose the $1.38 region.
Related XRP News: Claude AI Predicts XRP and Solana Prices By the End of November
Where Will Ripple’s XRP Price Go Today?
The bullish path starts with XRP defending $1.50 and breaking $1.54-$1.55. A successful move through that zone could send the token toward $1.60 and then $1.63-$1.65, with $1.6572 acting as the key breakout level.
The neutral path keeps XRP between $1.47 and $1.55. With RSI near 50 and the Ultimate Oscillator at 49.56, the indicators support a range-bound session unless fresh buying volume enters the market.
The bearish path begins with a loss of $1.47, followed by a break below $1.45. That would put $1.38 near the 50-day EMA into focus, giving traders a clear downside level to monitor.
Frequently Asked Questions
Can XRP reach $1.65 today
XRP could reach $1.65 if it breaks above the $1.54-$1.55 resistance zone with strong volume. The next major level is $1.6572, which Peter Brandt identified as the key breakout point for his cup-and-handle setup.
What is driving XRP’s price today
XRP is benefiting primarily from broader crypto-market strength, with Bitcoin up 1.27% and the total market cap rising 1.06%. XRPL developments, including Clearpool’s migration and the Smart Escrow devnet, also provide fundamental support for the ecosystem.
What happens if XRP falls below $1.47
A break below $1.47 would weaken the bullish setup and could send XRP toward $1.45 and then the $1.38 area. The $1.38 level is important because it sits near the 50-day EMA identified on the chart.
Subscribe to our YouTube channel for daily crypto updates, market insights, and expert analysis.
The post XRP Price Prediction for Today (October 7) appeared first on CaptainAltcoin.
180
Verified
This Trader Makes a Viral SUI Price PredictionSui (SUI) is down 2.64% over the past 24 hours to $1.19, even as the total crypto market is almost flat at a 0.10% decline. The weakness comes as altcoin sentiment cools, with the CMC Altcoin Season Index falling 1.59% to 62.
Still, the SUI price setup looks far more interesting on the monthly timeframe. CryptoBullet has pointed to the token’s highest monthly close since December 2025 and highest monthly volume since November 2024, calling for a possible dip toward $0.90-$1 before a new all-time high.
With SUI holding above its broader rising support structure and fresh ecosystem catalysts arriving, traders are now watching whether the SUI price can turn this consolidation into a much larger move.
SUI Price Prediction: CryptoBullet Sees a Path to a New ATH
CryptoBullet’s SUI prediction is based heavily on the monthly chart. The trader noted that SUI recorded its highest monthly close since December 2025 and its highest monthly volume since November 2024.
The analyst’s preferred entry zone is $0.90-$1, although the post makes clear that such a dip is not guaranteed. The bigger call is that SUI could eventually reach a new all-time high.
We had a look at the chart, and the structure gives this prediction a technical basis. After reaching above $4.50 in late 2024 and early 2025, SUI entered a prolonged decline, with the SUI price falling toward the $0.70-$0.80 region.
$SUI 1M chart Highest Monthly Close since December 2025! Highest Monthly Volume since November 2024! $SUI looks so strong A dip to $0.9-1 would be welcome (not guaranteed, but if it happens, don’t hesitate to pull the trigger) A new ATH is coming anyway https://t.co/x2AHXXjad7
— CryptoBullet (@CryptoBullet1) October 5, 2026
A rising black trendline has supported the broader structure across the chart. The $0.90 level also acted as a major horizontal resistance area before SUI pushed above it.
The latest monthly candles show buyers reclaiming that $0.90 zone, with SUI trading around $1.19. The latest volume bar is also much larger than several preceding months, matching CryptoBullet’s observation about elevated monthly activity.
If $1.15 holds as near-term support and buyers maintain control above $1.25, the next upside phase could develop toward higher resistance zones. A move back below $0.90 would weaken the setup and bring the $0.75-$0.80 trendline area into view.
Related SUI News: Here’s Why SUI Price Is Pumping Heavily Right Now
News Pushing SUI Price Presently
Sui has processed more than $1 trillion in cumulative stablecoin transfer volume since August 2025. The Sui Foundation has also introduced gasless stablecoin transfers, allowing users to move stablecoins without needing SUI for network fees.
The network is targeting payments, institutional finance and AI-agent transactions, with zkLogin and other infrastructure supporting easier user access.
Another catalyst is Sui Basecamp 2026, scheduled for October 7-8 in Singapore. The event focuses on agentic finance, autonomous payments, stable digital dollars and instant settlement. Sui also plans a live TPS test after recording more than 6 million transactions per second in July.
USDsui has also expanded onto centralized exchanges. Kraken and Bullish announced availability for the Sui-native dollar stablecoin on October 5, with the asset issued by Bridge, a Stripe company. The listing gives USDsui broader market access, and reserve yield is designed to support SUI buybacks and DeFi liquidity incentives.
However, SUI’s technical picture remains constructive above $0.90, with $1.15 and $1.25 important near-term levels. A move through $1.25 could strengthen the case for a larger recovery, but losing $0.90 would expose the $0.75-$0.80 support region.
For now, CryptoBullet’s new-ATH call depends on the SUI price maintaining its monthly breakout structure and converting the rising volume into sustained buying demand.
Frequently Asked Questions
Can SUI reach a new all-time high
Yes. CryptoBullet predicts that SUI could eventually set a new ATH, with the $0.90-$1 zone identified as a potential buying area if the price dips before the next major move.
What is driving Sui’s growth
Sui’s ecosystem is expanding around stablecoin payments, DeFi, institutional use and AI-agent transactions. The network has processed more than $1 trillion in cumulative stablecoin transfers since August 2025, and USDsui is now listed on Kraken and Bullish.
What are the key SUI price levels to watch
The main levels are $1.15 and $1.25 on the upside, with $0.90 acting as an important support. A break above $1.25 could open the way for a larger recovery, whereas losing $0.90 could expose the $0.75-$0.80 region.
Subscribe to our YouTube channel for daily crypto updates, market insights, and expert analysis.
The post This Trader Makes a Viral SUI Price Prediction appeared first on CaptainAltcoin.
This Trader Makes a Viral SUI Price Prediction
Sui (SUI) is down 2.64% over the past 24 hours to $1.19, even as the total crypto market is almost flat at a 0.10% decline. The weakness comes as altcoin sentiment cools, with the CMC Altcoin Season Index falling 1.59% to 62.
Still, the SUI price setup looks far more interesting on the monthly timeframe. CryptoBullet has pointed to the token’s highest monthly close since December 2025 and highest monthly volume since November 2024, calling for a possible dip toward $0.90-$1 before a new all-time high.
With SUI holding above its broader rising support structure and fresh ecosystem catalysts arriving, traders are now watching whether the SUI price can turn this consolidation into a much larger move.
SUI Price Prediction: CryptoBullet Sees a Path to a New ATH
CryptoBullet’s SUI prediction is based heavily on the monthly chart. The trader noted that SUI recorded its highest monthly close since December 2025 and its highest monthly volume since November 2024.
The analyst’s preferred entry zone is $0.90-$1, although the post makes clear that such a dip is not guaranteed. The bigger call is that SUI could eventually reach a new all-time high.
We had a look at the chart, and the structure gives this prediction a technical basis. After reaching above $4.50 in late 2024 and early 2025, SUI entered a prolonged decline, with the SUI price falling toward the $0.70-$0.80 region.
$SUI 1M chart Highest Monthly Close since December 2025! Highest Monthly Volume since November 2024! $SUI looks so strong A dip to $0.9-1 would be welcome (not guaranteed, but if it happens, don’t hesitate to pull the trigger) A new ATH is coming anyway https://t.co/x2AHXXjad7
— CryptoBullet (@CryptoBullet1) October 5, 2026
A rising black trendline has supported the broader structure across the chart. The $0.90 level also acted as a major horizontal resistance area before SUI pushed above it.
The latest monthly candles show buyers reclaiming that $0.90 zone, with SUI trading around $1.19. The latest volume bar is also much larger than several preceding months, matching CryptoBullet’s observation about elevated monthly activity.
If $1.15 holds as near-term support and buyers maintain control above $1.25, the next upside phase could develop toward higher resistance zones. A move back below $0.90 would weaken the setup and bring the $0.75-$0.80 trendline area into view.
Related SUI News: Here’s Why SUI Price Is Pumping Heavily Right Now
News Pushing SUI Price Presently
Sui has processed more than $1 trillion in cumulative stablecoin transfer volume since August 2025. The Sui Foundation has also introduced gasless stablecoin transfers, allowing users to move stablecoins without needing SUI for network fees.
The network is targeting payments, institutional finance and AI-agent transactions, with zkLogin and other infrastructure supporting easier user access.
Another catalyst is Sui Basecamp 2026, scheduled for October 7-8 in Singapore. The event focuses on agentic finance, autonomous payments, stable digital dollars and instant settlement. Sui also plans a live TPS test after recording more than 6 million transactions per second in July.
USDsui has also expanded onto centralized exchanges. Kraken and Bullish announced availability for the Sui-native dollar stablecoin on October 5, with the asset issued by Bridge, a Stripe company. The listing gives USDsui broader market access, and reserve yield is designed to support SUI buybacks and DeFi liquidity incentives.
However, SUI’s technical picture remains constructive above $0.90, with $1.15 and $1.25 important near-term levels. A move through $1.25 could strengthen the case for a larger recovery, but losing $0.90 would expose the $0.75-$0.80 support region.
For now, CryptoBullet’s new-ATH call depends on the SUI price maintaining its monthly breakout structure and converting the rising volume into sustained buying demand.
Frequently Asked Questions
Can SUI reach a new all-time high
Yes. CryptoBullet predicts that SUI could eventually set a new ATH, with the $0.90-$1 zone identified as a potential buying area if the price dips before the next major move.
What is driving Sui’s growth
Sui’s ecosystem is expanding around stablecoin payments, DeFi, institutional use and AI-agent transactions. The network has processed more than $1 trillion in cumulative stablecoin transfers since August 2025, and USDsui is now listed on Kraken and Bullish.
What are the key SUI price levels to watch
The main levels are $1.15 and $1.25 on the upside, with $0.90 acting as an important support. A break above $1.25 could open the way for a larger recovery, whereas losing $0.90 could expose the $0.75-$0.80 region.
Subscribe to our YouTube channel for daily crypto updates, market insights, and expert analysis.
The post This Trader Makes a Viral SUI Price Prediction appeared first on CaptainAltcoin.
Still, the SUI price setup looks far more interesting on the monthly timeframe. CryptoBullet has pointed to the token’s highest monthly close since December 2025 and highest monthly volume since November 2024, calling for a possible dip toward $0.90-$1 before a new all-time high.
With SUI holding above its broader rising support structure and fresh ecosystem catalysts arriving, traders are now watching whether the SUI price can turn this consolidation into a much larger move.
SUI Price Prediction: CryptoBullet Sees a Path to a New ATH
CryptoBullet’s SUI prediction is based heavily on the monthly chart. The trader noted that SUI recorded its highest monthly close since December 2025 and its highest monthly volume since November 2024.
The analyst’s preferred entry zone is $0.90-$1, although the post makes clear that such a dip is not guaranteed. The bigger call is that SUI could eventually reach a new all-time high.
We had a look at the chart, and the structure gives this prediction a technical basis. After reaching above $4.50 in late 2024 and early 2025, SUI entered a prolonged decline, with the SUI price falling toward the $0.70-$0.80 region.
$SUI 1M chart Highest Monthly Close since December 2025! Highest Monthly Volume since November 2024! $SUI looks so strong A dip to $0.9-1 would be welcome (not guaranteed, but if it happens, don’t hesitate to pull the trigger) A new ATH is coming anyway https://t.co/x2AHXXjad7
— CryptoBullet (@CryptoBullet1) October 5, 2026
A rising black trendline has supported the broader structure across the chart. The $0.90 level also acted as a major horizontal resistance area before SUI pushed above it.
The latest monthly candles show buyers reclaiming that $0.90 zone, with SUI trading around $1.19. The latest volume bar is also much larger than several preceding months, matching CryptoBullet’s observation about elevated monthly activity.
If $1.15 holds as near-term support and buyers maintain control above $1.25, the next upside phase could develop toward higher resistance zones. A move back below $0.90 would weaken the setup and bring the $0.75-$0.80 trendline area into view.
Related SUI News: Here’s Why SUI Price Is Pumping Heavily Right Now
News Pushing SUI Price Presently
Sui has processed more than $1 trillion in cumulative stablecoin transfer volume since August 2025. The Sui Foundation has also introduced gasless stablecoin transfers, allowing users to move stablecoins without needing SUI for network fees.
The network is targeting payments, institutional finance and AI-agent transactions, with zkLogin and other infrastructure supporting easier user access.
Another catalyst is Sui Basecamp 2026, scheduled for October 7-8 in Singapore. The event focuses on agentic finance, autonomous payments, stable digital dollars and instant settlement. Sui also plans a live TPS test after recording more than 6 million transactions per second in July.
USDsui has also expanded onto centralized exchanges. Kraken and Bullish announced availability for the Sui-native dollar stablecoin on October 5, with the asset issued by Bridge, a Stripe company. The listing gives USDsui broader market access, and reserve yield is designed to support SUI buybacks and DeFi liquidity incentives.
However, SUI’s technical picture remains constructive above $0.90, with $1.15 and $1.25 important near-term levels. A move through $1.25 could strengthen the case for a larger recovery, but losing $0.90 would expose the $0.75-$0.80 support region.
For now, CryptoBullet’s new-ATH call depends on the SUI price maintaining its monthly breakout structure and converting the rising volume into sustained buying demand.
Frequently Asked Questions
Can SUI reach a new all-time high
Yes. CryptoBullet predicts that SUI could eventually set a new ATH, with the $0.90-$1 zone identified as a potential buying area if the price dips before the next major move.
What is driving Sui’s growth
Sui’s ecosystem is expanding around stablecoin payments, DeFi, institutional use and AI-agent transactions. The network has processed more than $1 trillion in cumulative stablecoin transfers since August 2025, and USDsui is now listed on Kraken and Bullish.
What are the key SUI price levels to watch
The main levels are $1.15 and $1.25 on the upside, with $0.90 acting as an important support. A break above $1.25 could open the way for a larger recovery, whereas losing $0.90 could expose the $0.75-$0.80 region.
Subscribe to our YouTube channel for daily crypto updates, market insights, and expert analysis.
The post This Trader Makes a Viral SUI Price Prediction appeared first on CaptainAltcoin.
445
The Next Evolution of Memecoin TradingMeet the Bot Built for the Fastest Market in Crypto
Memecoin trading has always had one fundamental problem:By the time most traders discover an opportunity, the opportunity is already disappearing. New tokens can launch, explode in volume, reach millions in market cap and collapse again within hours — sometimes within minutes. Meanwhile, traders are expected to manually monitor charts, liquidity, developer wallets, holder distribution, volume, transactions and dozens of other signals simultaneously. That is exactly the problem this bot was built to solve.
From Manual Trading to Automated Intelligence
This isn’t simply another Telegram trading bot. It is a real-time memecoin analysis and execution system designed specifically for the extreme speed and risk of newly launched tokens.
Instead of relying on a single indicator, the system continuously evaluates multiple layers of blockchain and market data before identifying potential opportunities.
The objective is simple: Detect faster. Analyze deeper. Manage risk automatically. Exit intelligently. And package that entire process into one seamless system.
Real-Time Rug Radar
Finding a token early means nothing if the token cannot be safely exited. The bot continuously analyzes potential warning signs including:
Liquidity conditions — monitoring depth and lockup status.
Developer wallet activity — tracking sudden dumps or suspicious transfers.
Holder concentration & supply distribution — checking for whale manipulation.
Suspicious transaction patterns — identifying honeypots and sell restrictions.
Abnormal wallet behavior — detecting automated insider activity.
Instead of blindly chasing every new launch, the system attempts to eliminate dangerous setups before capital is exposed.
Smart Token Analysis
Memecoin markets move too quickly for traditional research. The bot combines multiple risk and market signals with historical patterns to evaluate newly launched tokens in real time.
Rather than asking: “Is this token pumping?” The system is designed to ask a much more important question: “Is this a trade worth taking relative to the risk?”
Every opportunity must compete against the same analytical framework before becoming a potential trade.
Multi-Chain Monitoring
Opportunities don’t exist on only one blockchain. The infrastructure is designed to monitor fast-moving launches across: Solana • Ethereum • Base
Blockchain activity and decentralized exchange data can be continuously monitored without requiring the trader to manually jump between scanners, charts, and wallets. One system. Multiple ecosystems.
The Sniper Engine
Speed matters. The Sniper Engine monitors fresh launches for combinations of momentum, volume acceleration, liquidity depth, market activity, and risk signals.
When the required conditions align, the system can generate an entry or trade signal based on predefined strategy logic. The goal isn’t to trade everything — the goal is to identify the small percentage of launches that meet strict quality criteria.
2X • 5X • 10X Strategy Modes
Instead of forcing every trade through the same strategy, the bot provides three distinct risk and target configurations tailored to different market conditions and trader profiles:
2X MODE (Conservative Target): Designed around controlled exposure and lower target multiples, prioritizing risk management and capital preservation over extreme upside.
5X MODE (Balanced Target): Designed for traders willing to accept moderate volatility while targeting larger momentum movements.
10X MODE (Aggressive Target): Built for high-volatility memecoin opportunities, maximizing upside potential with customized exit and trailing logic.
Note on Risk Management: These modes represent strategy profit targets and automated exit triggers — not guaranteed returns. Memecoins remain highly speculative assets; the system is designed to systematically manage market risk, not eliminate it completely.
Getting Into a Trade Is Only Half the Problem
Anyone can buy. Knowing when to leave is where many memecoin traders fail. The Smart Exit System supports configurable:
Profit targets — taking partial or full gains automatically.
Trailing exits — locking in profits as price trends upward.
Risk-triggered & emergency exits — reacting instantly if liquidity drains or dev wallets dump.
If market conditions deteriorate or significant risk signals appear, the system reacts according to its configured exit logic, managing the complete lifecycle of the trade.
Built-In Risk Controls
A profitable strategy can still fail if one bad trade destroys the account. That is why risk management is treated as part of the core infrastructure rather than an optional feature.
The system incorporates automated logic for position sizing, exposure limits, transaction protection, and trade-level risk parameters.
The Infrastructure Built for the Modern Memecoin Market
Thousands of launches. Extreme volatility. Constant scams. Rapid liquidity changes. Wallets moving before narratives reach social media. Markets that can change completely in sixty seconds.
This bot was built for that environment. Not to promise unrealistic guarantees, but to process information faster than a human trader realistically can — turning raw market noise into a structured, disciplined trading system.
Rug Detection • Token Intelligence • Multi-Chain Monitoring • Automated Sniping • Smart ExitsWelcome to the next generation of memecoin trading.
Ready to Upgrade Your Trading Strategy?Don’t let manual research slow you down in the fastest market in crypto. Join our community for real-time insights, or launch the bot directly to start automating your execution today. Official Telegram Channel: https://telegram.me/ZEUW_com Launch the Trading Bot: https://telegram.me/ZEUW_bot
DISCLAIMER: CAPTAINALTCOIN DOES NOT ENDORSE INVESTING IN ANY PROJECT (CRYPTO OR CASINO) MENTIONED IN SPONSORED ARTICLES. EXERCISE CAUTION AND DO THOROUGH RESEARCH BEFORE INVESTING YOUR MONEY. CaptainAltcoin takes no responsibility for its accuracy or quality. This content was not written by CaptainAltcoin’s team. We strongly advise readers to do their own thorough research before interacting with any featured companies. The information provided is not financial or legal advice. Neither CaptainAltcoin nor any third party recommends buying or selling any financial products. Investing in crypto assets is high-risk; consider the potential for loss. Any investment decisions made based on this content are at the sole risk of the readCaptainAltcoin is not liable for any damages or losses from using or relying on this content.
The post The Next Evolution of Memecoin Trading appeared first on CaptainAltcoin.
The Next Evolution of Memecoin Trading
Meet the Bot Built for the Fastest Market in Crypto
Memecoin trading has always had one fundamental problem:By the time most traders discover an opportunity, the opportunity is already disappearing. New tokens can launch, explode in volume, reach millions in market cap and collapse again within hours — sometimes within minutes. Meanwhile, traders are expected to manually monitor charts, liquidity, developer wallets, holder distribution, volume, transactions and dozens of other signals simultaneously. That is exactly the problem this bot was built to solve.
From Manual Trading to Automated Intelligence
This isn’t simply another Telegram trading bot. It is a real-time memecoin analysis and execution system designed specifically for the extreme speed and risk of newly launched tokens.
Instead of relying on a single indicator, the system continuously evaluates multiple layers of blockchain and market data before identifying potential opportunities.
The objective is simple: Detect faster. Analyze deeper. Manage risk automatically. Exit intelligently. And package that entire process into one seamless system.
Real-Time Rug Radar
Finding a token early means nothing if the token cannot be safely exited. The bot continuously analyzes potential warning signs including:
Liquidity conditions — monitoring depth and lockup status.
Developer wallet activity — tracking sudden dumps or suspicious transfers.
Holder concentration & supply distribution — checking for whale manipulation.
Suspicious transaction patterns — identifying honeypots and sell restrictions.
Abnormal wallet behavior — detecting automated insider activity.
Instead of blindly chasing every new launch, the system attempts to eliminate dangerous setups before capital is exposed.
Smart Token Analysis
Memecoin markets move too quickly for traditional research. The bot combines multiple risk and market signals with historical patterns to evaluate newly launched tokens in real time.
Rather than asking: “Is this token pumping?” The system is designed to ask a much more important question: “Is this a trade worth taking relative to the risk?”
Every opportunity must compete against the same analytical framework before becoming a potential trade.
Multi-Chain Monitoring
Opportunities don’t exist on only one blockchain. The infrastructure is designed to monitor fast-moving launches across: Solana • Ethereum • Base
Blockchain activity and decentralized exchange data can be continuously monitored without requiring the trader to manually jump between scanners, charts, and wallets. One system. Multiple ecosystems.
The Sniper Engine
Speed matters. The Sniper Engine monitors fresh launches for combinations of momentum, volume acceleration, liquidity depth, market activity, and risk signals.
When the required conditions align, the system can generate an entry or trade signal based on predefined strategy logic. The goal isn’t to trade everything — the goal is to identify the small percentage of launches that meet strict quality criteria.
2X • 5X • 10X Strategy Modes
Instead of forcing every trade through the same strategy, the bot provides three distinct risk and target configurations tailored to different market conditions and trader profiles:
2X MODE (Conservative Target): Designed around controlled exposure and lower target multiples, prioritizing risk management and capital preservation over extreme upside.
5X MODE (Balanced Target): Designed for traders willing to accept moderate volatility while targeting larger momentum movements.
10X MODE (Aggressive Target): Built for high-volatility memecoin opportunities, maximizing upside potential with customized exit and trailing logic.
Note on Risk Management: These modes represent strategy profit targets and automated exit triggers — not guaranteed returns. Memecoins remain highly speculative assets; the system is designed to systematically manage market risk, not eliminate it completely.
Getting Into a Trade Is Only Half the Problem
Anyone can buy. Knowing when to leave is where many memecoin traders fail. The Smart Exit System supports configurable:
Profit targets — taking partial or full gains automatically.
Trailing exits — locking in profits as price trends upward.
Risk-triggered & emergency exits — reacting instantly if liquidity drains or dev wallets dump.
If market conditions deteriorate or significant risk signals appear, the system reacts according to its configured exit logic, managing the complete lifecycle of the trade.
Built-In Risk Controls
A profitable strategy can still fail if one bad trade destroys the account. That is why risk management is treated as part of the core infrastructure rather than an optional feature.
The system incorporates automated logic for position sizing, exposure limits, transaction protection, and trade-level risk parameters.
The Infrastructure Built for the Modern Memecoin Market
Thousands of launches. Extreme volatility. Constant scams. Rapid liquidity changes. Wallets moving before narratives reach social media. Markets that can change completely in sixty seconds.
This bot was built for that environment. Not to promise unrealistic guarantees, but to process information faster than a human trader realistically can — turning raw market noise into a structured, disciplined trading system.
Rug Detection • Token Intelligence • Multi-Chain Monitoring • Automated Sniping • Smart ExitsWelcome to the next generation of memecoin trading.
Ready to Upgrade Your Trading Strategy?Don’t let manual research slow you down in the fastest market in crypto. Join our community for real-time insights, or launch the bot directly to start automating your execution today. Official Telegram Channel: https://telegram.me/ZEUW_com Launch the Trading Bot: https://telegram.me/ZEUW_bot
DISCLAIMER: CAPTAINALTCOIN DOES NOT ENDORSE INVESTING IN ANY PROJECT (CRYPTO OR CASINO) MENTIONED IN SPONSORED ARTICLES. EXERCISE CAUTION AND DO THOROUGH RESEARCH BEFORE INVESTING YOUR MONEY. CaptainAltcoin takes no responsibility for its accuracy or quality. This content was not written by CaptainAltcoin’s team. We strongly advise readers to do their own thorough research before interacting with any featured companies. The information provided is not financial or legal advice. Neither CaptainAltcoin nor any third party recommends buying or selling any financial products. Investing in crypto assets is high-risk; consider the potential for loss. Any investment decisions made based on this content are at the sole risk of the readCaptainAltcoin is not liable for any damages or losses from using or relying on this content.
The post The Next Evolution of Memecoin Trading appeared first on CaptainAltcoin.
Memecoin trading has always had one fundamental problem:By the time most traders discover an opportunity, the opportunity is already disappearing. New tokens can launch, explode in volume, reach millions in market cap and collapse again within hours — sometimes within minutes. Meanwhile, traders are expected to manually monitor charts, liquidity, developer wallets, holder distribution, volume, transactions and dozens of other signals simultaneously. That is exactly the problem this bot was built to solve.
From Manual Trading to Automated Intelligence
This isn’t simply another Telegram trading bot. It is a real-time memecoin analysis and execution system designed specifically for the extreme speed and risk of newly launched tokens.
Instead of relying on a single indicator, the system continuously evaluates multiple layers of blockchain and market data before identifying potential opportunities.
The objective is simple: Detect faster. Analyze deeper. Manage risk automatically. Exit intelligently. And package that entire process into one seamless system.
Real-Time Rug Radar
Finding a token early means nothing if the token cannot be safely exited. The bot continuously analyzes potential warning signs including:
Liquidity conditions — monitoring depth and lockup status.
Developer wallet activity — tracking sudden dumps or suspicious transfers.
Holder concentration & supply distribution — checking for whale manipulation.
Suspicious transaction patterns — identifying honeypots and sell restrictions.
Abnormal wallet behavior — detecting automated insider activity.
Instead of blindly chasing every new launch, the system attempts to eliminate dangerous setups before capital is exposed.
Smart Token Analysis
Memecoin markets move too quickly for traditional research. The bot combines multiple risk and market signals with historical patterns to evaluate newly launched tokens in real time.
Rather than asking: “Is this token pumping?” The system is designed to ask a much more important question: “Is this a trade worth taking relative to the risk?”
Every opportunity must compete against the same analytical framework before becoming a potential trade.
Multi-Chain Monitoring
Opportunities don’t exist on only one blockchain. The infrastructure is designed to monitor fast-moving launches across: Solana • Ethereum • Base
Blockchain activity and decentralized exchange data can be continuously monitored without requiring the trader to manually jump between scanners, charts, and wallets. One system. Multiple ecosystems.
The Sniper Engine
Speed matters. The Sniper Engine monitors fresh launches for combinations of momentum, volume acceleration, liquidity depth, market activity, and risk signals.
When the required conditions align, the system can generate an entry or trade signal based on predefined strategy logic. The goal isn’t to trade everything — the goal is to identify the small percentage of launches that meet strict quality criteria.
2X • 5X • 10X Strategy Modes
Instead of forcing every trade through the same strategy, the bot provides three distinct risk and target configurations tailored to different market conditions and trader profiles:
2X MODE (Conservative Target): Designed around controlled exposure and lower target multiples, prioritizing risk management and capital preservation over extreme upside.
5X MODE (Balanced Target): Designed for traders willing to accept moderate volatility while targeting larger momentum movements.
10X MODE (Aggressive Target): Built for high-volatility memecoin opportunities, maximizing upside potential with customized exit and trailing logic.
Note on Risk Management: These modes represent strategy profit targets and automated exit triggers — not guaranteed returns. Memecoins remain highly speculative assets; the system is designed to systematically manage market risk, not eliminate it completely.
Getting Into a Trade Is Only Half the Problem
Anyone can buy. Knowing when to leave is where many memecoin traders fail. The Smart Exit System supports configurable:
Profit targets — taking partial or full gains automatically.
Trailing exits — locking in profits as price trends upward.
Risk-triggered & emergency exits — reacting instantly if liquidity drains or dev wallets dump.
If market conditions deteriorate or significant risk signals appear, the system reacts according to its configured exit logic, managing the complete lifecycle of the trade.
Built-In Risk Controls
A profitable strategy can still fail if one bad trade destroys the account. That is why risk management is treated as part of the core infrastructure rather than an optional feature.
The system incorporates automated logic for position sizing, exposure limits, transaction protection, and trade-level risk parameters.
The Infrastructure Built for the Modern Memecoin Market
Thousands of launches. Extreme volatility. Constant scams. Rapid liquidity changes. Wallets moving before narratives reach social media. Markets that can change completely in sixty seconds.
This bot was built for that environment. Not to promise unrealistic guarantees, but to process information faster than a human trader realistically can — turning raw market noise into a structured, disciplined trading system.
Rug Detection • Token Intelligence • Multi-Chain Monitoring • Automated Sniping • Smart ExitsWelcome to the next generation of memecoin trading.
Ready to Upgrade Your Trading Strategy?Don’t let manual research slow you down in the fastest market in crypto. Join our community for real-time insights, or launch the bot directly to start automating your execution today. Official Telegram Channel: https://telegram.me/ZEUW_com Launch the Trading Bot: https://telegram.me/ZEUW_bot
DISCLAIMER: CAPTAINALTCOIN DOES NOT ENDORSE INVESTING IN ANY PROJECT (CRYPTO OR CASINO) MENTIONED IN SPONSORED ARTICLES. EXERCISE CAUTION AND DO THOROUGH RESEARCH BEFORE INVESTING YOUR MONEY. CaptainAltcoin takes no responsibility for its accuracy or quality. This content was not written by CaptainAltcoin’s team. We strongly advise readers to do their own thorough research before interacting with any featured companies. The information provided is not financial or legal advice. Neither CaptainAltcoin nor any third party recommends buying or selling any financial products. Investing in crypto assets is high-risk; consider the potential for loss. Any investment decisions made based on this content are at the sole risk of the readCaptainAltcoin is not liable for any damages or losses from using or relying on this content.
The post The Next Evolution of Memecoin Trading appeared first on CaptainAltcoin.
70
“I’m Selling My Gold”: Analyst Holds Tight to Silver, Predicts What the Future HoldsDavid Bateman says he is selling his gold but keeping his silver, and his explanation goes beyond expectations for the next price rally. His argument connects concerns about fiat currencies with silver’s industrial uses and a future he believes could reward those who hold the metal.
That outlook comes during a difficult period for silver price. The metal has fallen roughly 8% to 9% over the past month, and recent demand and inventory developments complicate the bullish case. Bateman’s comments raise an interesting question about how his future expectations compare with silver’s current pressures.
David Bateman Explains Why He Is Selling Gold But Keeping Silver
Bateman’s statement makes an important distinction between his gold sale and his silver outlook. He says he is selling gold to fund what he calls the “New Earth,” but he does not describe gold as an asset he expects to collapse.
His post actually presents a bullish possibility for gold. He asks what could happen to gold, and potentially Bitcoin, if fiat currencies lose value at an accelerating pace.
The reasoning is that currency weakness could increase interest in assets perceived as alternatives to cash. Bateman then extends that argument to silver, which he believes could benefit from both monetary concerns and industrial demand.
His decision therefore should not be read as a prediction that gold must fall for silver to rise. The post describes a funding decision alongside his preference to retain silver.
Several distinctions help explain his position:
He says his gold sale will fund another undertaking.
He expresses a bullish view of silver’s future.
He does not provide a silver price target or deadline.
Honestly, what do you think will happen to gold, and maybe even bitcoin, as the destruction of all global fiat currencies accelerates and there’s no where else to hide? And when gold explodes, what will happen to silver which is multiple times more scarce than gold. When you understand what Samsung is doing with solid state silver batteries, you’ll quickly realize Silver is truly too valuable to use as currency. The future belongs to the silver stackers. It will rewrite history and will restore the middle class. I’m selling my gold to build the New Earth, but I’m holding tight to my silver. Stack silver and wait. That’s the game
— David Bateman (@davidbateman) October 4, 2026
Bateman’s Silver Outlook Connects Scarcity With Battery Technology
Bateman argues that silver is multiple times scarcer than gold and points to Samsung’s work on solid state batteries. He uses those claims to support his belief that silver’s future industrial value could become exceptionally important.
The supplied post does not define his scarcity comparison or quantify potential battery demand. His comments therefore explain his investment thesis without establishing how much additional silver consumption that technology could create.
The broader logic is straightforward. Silver can be held as a precious metal, but manufacturers also consume it in industrial applications. Bateman believes those uses could make the metal increasingly valuable beyond its historical monetary role.
His statement that silver is “too valuable to use as currency” expresses that preference for industrial value. It does not establish that silver will stop serving as a store of value.
Bateman also predicts that silver holders could benefit enough to help restore the middle class. That is his broader economic vision, but the post provides no figures that demonstrate such an outcome.
Silver Price Has Fallen As Higher Yields Create Pressure
The recent silver price pullback presents a more immediate challenge to that bullish outlook. Silver has declined roughly 8% to 9% over the past month after giving back part of its earlier advance.
Strong U.S. service sector inflation contributes to that pressure because persistent inflation can reduce expectations for lower interest rates. Higher bond yields then make interest paying assets more competitive.
Silver does not pay interest, so those conditions can make it less attractive relative to assets that do. A bullish industrial outlook can therefore coexist with a falling silver price when financial conditions become less favorable.
Bateman’s future expectations do not remove those nearer obstacles. Silver still needs to contend with the cost of holding an asset that produces no regular income.
Lower Solar Usage And Higher Vault Availability Complicate Silver Demand
Chinese solar manufacturers have responded to expensive silver through “thrifting,” which means reducing the amount used in each photovoltaic cell.
That matters because solar production can continue without proportional growth in silver consumption. Manufacturers may produce more panels but require less metal for each unit.
Available silver in London commercial vaults has also recovered to its highest level since late 2024. That gives the market more existing metal to draw from and eases immediate supply pressure.
The developments create several counterweights to Bateman’s outlook:
Solar manufacturers are reducing silver consumption per cell.
Greater available vault stocks can ease immediate tightness.
Higher yields can pressure silver despite future demand expectations.
Read Also: Bitcoin Price Today: BTC’s Cycle Setup Could Catch Bulls Off Guard
The Projected Silver Deficit Keeps The Supply Question Open
The Silver Institute’s supplied forecast still projects a 2026 supply deficit near 46 million ounces. Annual demand is therefore expected to exceed annual supply despite reduced silver usage in solar manufacturing.
Mine output cannot immediately respond to changing demand, so industrial thrift may narrow the gap without eliminating it. Existing inventories can help cover a deficit, but that differs from producing enough new metal to balance annual consumption.
Bateman’s bullish case centers on silver’s future usefulness and value. Recent developments show why that future may involve setbacks along the way. The interesting test is whether industrial demand and constrained supply eventually outweigh the pressures currently affecting silver price.
FAQs
What is the future of silver?
According to J.P. Morgan Silver Prices, silver is expected to average around $70 per troy ounce in 2026 and about $64 in 2027 as markets adjust to changing interest rates and industrial demand.
Is it good to invest in silver now?
Silver can be a mixed investment right now, trading around $61 per ounce after pulling back significantly from its January peak near $120.
Subscribe to our YouTube channel for daily crypto updates, market insights, and expert analysis.
The post “I’m Selling My Gold”: Analyst Holds Tight to Silver, Predicts What the Future Holds appeared first on CaptainAltcoin.
“I’m Selling My Gold”: Analyst Holds Tight to Silver, Predicts What the Future Holds
David Bateman says he is selling his gold but keeping his silver, and his explanation goes beyond expectations for the next price rally. His argument connects concerns about fiat currencies with silver’s industrial uses and a future he believes could reward those who hold the metal.
That outlook comes during a difficult period for silver price. The metal has fallen roughly 8% to 9% over the past month, and recent demand and inventory developments complicate the bullish case. Bateman’s comments raise an interesting question about how his future expectations compare with silver’s current pressures.
David Bateman Explains Why He Is Selling Gold But Keeping Silver
Bateman’s statement makes an important distinction between his gold sale and his silver outlook. He says he is selling gold to fund what he calls the “New Earth,” but he does not describe gold as an asset he expects to collapse.
His post actually presents a bullish possibility for gold. He asks what could happen to gold, and potentially Bitcoin, if fiat currencies lose value at an accelerating pace.
The reasoning is that currency weakness could increase interest in assets perceived as alternatives to cash. Bateman then extends that argument to silver, which he believes could benefit from both monetary concerns and industrial demand.
His decision therefore should not be read as a prediction that gold must fall for silver to rise. The post describes a funding decision alongside his preference to retain silver.
Several distinctions help explain his position:
He says his gold sale will fund another undertaking.
He expresses a bullish view of silver’s future.
He does not provide a silver price target or deadline.
Honestly, what do you think will happen to gold, and maybe even bitcoin, as the destruction of all global fiat currencies accelerates and there’s no where else to hide? And when gold explodes, what will happen to silver which is multiple times more scarce than gold. When you understand what Samsung is doing with solid state silver batteries, you’ll quickly realize Silver is truly too valuable to use as currency. The future belongs to the silver stackers. It will rewrite history and will restore the middle class. I’m selling my gold to build the New Earth, but I’m holding tight to my silver. Stack silver and wait. That’s the game
— David Bateman (@davidbateman) October 4, 2026
Bateman’s Silver Outlook Connects Scarcity With Battery Technology
Bateman argues that silver is multiple times scarcer than gold and points to Samsung’s work on solid state batteries. He uses those claims to support his belief that silver’s future industrial value could become exceptionally important.
The supplied post does not define his scarcity comparison or quantify potential battery demand. His comments therefore explain his investment thesis without establishing how much additional silver consumption that technology could create.
The broader logic is straightforward. Silver can be held as a precious metal, but manufacturers also consume it in industrial applications. Bateman believes those uses could make the metal increasingly valuable beyond its historical monetary role.
His statement that silver is “too valuable to use as currency” expresses that preference for industrial value. It does not establish that silver will stop serving as a store of value.
Bateman also predicts that silver holders could benefit enough to help restore the middle class. That is his broader economic vision, but the post provides no figures that demonstrate such an outcome.
Silver Price Has Fallen As Higher Yields Create Pressure
The recent silver price pullback presents a more immediate challenge to that bullish outlook. Silver has declined roughly 8% to 9% over the past month after giving back part of its earlier advance.
Strong U.S. service sector inflation contributes to that pressure because persistent inflation can reduce expectations for lower interest rates. Higher bond yields then make interest paying assets more competitive.
Silver does not pay interest, so those conditions can make it less attractive relative to assets that do. A bullish industrial outlook can therefore coexist with a falling silver price when financial conditions become less favorable.
Bateman’s future expectations do not remove those nearer obstacles. Silver still needs to contend with the cost of holding an asset that produces no regular income.
Lower Solar Usage And Higher Vault Availability Complicate Silver Demand
Chinese solar manufacturers have responded to expensive silver through “thrifting,” which means reducing the amount used in each photovoltaic cell.
That matters because solar production can continue without proportional growth in silver consumption. Manufacturers may produce more panels but require less metal for each unit.
Available silver in London commercial vaults has also recovered to its highest level since late 2024. That gives the market more existing metal to draw from and eases immediate supply pressure.
The developments create several counterweights to Bateman’s outlook:
Solar manufacturers are reducing silver consumption per cell.
Greater available vault stocks can ease immediate tightness.
Higher yields can pressure silver despite future demand expectations.
Read Also: Bitcoin Price Today: BTC’s Cycle Setup Could Catch Bulls Off Guard
The Projected Silver Deficit Keeps The Supply Question Open
The Silver Institute’s supplied forecast still projects a 2026 supply deficit near 46 million ounces. Annual demand is therefore expected to exceed annual supply despite reduced silver usage in solar manufacturing.
Mine output cannot immediately respond to changing demand, so industrial thrift may narrow the gap without eliminating it. Existing inventories can help cover a deficit, but that differs from producing enough new metal to balance annual consumption.
Bateman’s bullish case centers on silver’s future usefulness and value. Recent developments show why that future may involve setbacks along the way. The interesting test is whether industrial demand and constrained supply eventually outweigh the pressures currently affecting silver price.
FAQs
What is the future of silver?
According to J.P. Morgan Silver Prices, silver is expected to average around $70 per troy ounce in 2026 and about $64 in 2027 as markets adjust to changing interest rates and industrial demand.
Is it good to invest in silver now?
Silver can be a mixed investment right now, trading around $61 per ounce after pulling back significantly from its January peak near $120.
Subscribe to our YouTube channel for daily crypto updates, market insights, and expert analysis.
The post “I’m Selling My Gold”: Analyst Holds Tight to Silver, Predicts What the Future Holds appeared first on CaptainAltcoin.
That outlook comes during a difficult period for silver price. The metal has fallen roughly 8% to 9% over the past month, and recent demand and inventory developments complicate the bullish case. Bateman’s comments raise an interesting question about how his future expectations compare with silver’s current pressures.
David Bateman Explains Why He Is Selling Gold But Keeping Silver
Bateman’s statement makes an important distinction between his gold sale and his silver outlook. He says he is selling gold to fund what he calls the “New Earth,” but he does not describe gold as an asset he expects to collapse.
His post actually presents a bullish possibility for gold. He asks what could happen to gold, and potentially Bitcoin, if fiat currencies lose value at an accelerating pace.
The reasoning is that currency weakness could increase interest in assets perceived as alternatives to cash. Bateman then extends that argument to silver, which he believes could benefit from both monetary concerns and industrial demand.
His decision therefore should not be read as a prediction that gold must fall for silver to rise. The post describes a funding decision alongside his preference to retain silver.
Several distinctions help explain his position:
He says his gold sale will fund another undertaking.
He expresses a bullish view of silver’s future.
He does not provide a silver price target or deadline.
Honestly, what do you think will happen to gold, and maybe even bitcoin, as the destruction of all global fiat currencies accelerates and there’s no where else to hide? And when gold explodes, what will happen to silver which is multiple times more scarce than gold. When you understand what Samsung is doing with solid state silver batteries, you’ll quickly realize Silver is truly too valuable to use as currency. The future belongs to the silver stackers. It will rewrite history and will restore the middle class. I’m selling my gold to build the New Earth, but I’m holding tight to my silver. Stack silver and wait. That’s the game
— David Bateman (@davidbateman) October 4, 2026
Bateman’s Silver Outlook Connects Scarcity With Battery Technology
Bateman argues that silver is multiple times scarcer than gold and points to Samsung’s work on solid state batteries. He uses those claims to support his belief that silver’s future industrial value could become exceptionally important.
The supplied post does not define his scarcity comparison or quantify potential battery demand. His comments therefore explain his investment thesis without establishing how much additional silver consumption that technology could create.
The broader logic is straightforward. Silver can be held as a precious metal, but manufacturers also consume it in industrial applications. Bateman believes those uses could make the metal increasingly valuable beyond its historical monetary role.
His statement that silver is “too valuable to use as currency” expresses that preference for industrial value. It does not establish that silver will stop serving as a store of value.
Bateman also predicts that silver holders could benefit enough to help restore the middle class. That is his broader economic vision, but the post provides no figures that demonstrate such an outcome.
Silver Price Has Fallen As Higher Yields Create Pressure
The recent silver price pullback presents a more immediate challenge to that bullish outlook. Silver has declined roughly 8% to 9% over the past month after giving back part of its earlier advance.
Strong U.S. service sector inflation contributes to that pressure because persistent inflation can reduce expectations for lower interest rates. Higher bond yields then make interest paying assets more competitive.
Silver does not pay interest, so those conditions can make it less attractive relative to assets that do. A bullish industrial outlook can therefore coexist with a falling silver price when financial conditions become less favorable.
Bateman’s future expectations do not remove those nearer obstacles. Silver still needs to contend with the cost of holding an asset that produces no regular income.
Lower Solar Usage And Higher Vault Availability Complicate Silver Demand
Chinese solar manufacturers have responded to expensive silver through “thrifting,” which means reducing the amount used in each photovoltaic cell.
That matters because solar production can continue without proportional growth in silver consumption. Manufacturers may produce more panels but require less metal for each unit.
Available silver in London commercial vaults has also recovered to its highest level since late 2024. That gives the market more existing metal to draw from and eases immediate supply pressure.
The developments create several counterweights to Bateman’s outlook:
Solar manufacturers are reducing silver consumption per cell.
Greater available vault stocks can ease immediate tightness.
Higher yields can pressure silver despite future demand expectations.
Read Also: Bitcoin Price Today: BTC’s Cycle Setup Could Catch Bulls Off Guard
The Projected Silver Deficit Keeps The Supply Question Open
The Silver Institute’s supplied forecast still projects a 2026 supply deficit near 46 million ounces. Annual demand is therefore expected to exceed annual supply despite reduced silver usage in solar manufacturing.
Mine output cannot immediately respond to changing demand, so industrial thrift may narrow the gap without eliminating it. Existing inventories can help cover a deficit, but that differs from producing enough new metal to balance annual consumption.
Bateman’s bullish case centers on silver’s future usefulness and value. Recent developments show why that future may involve setbacks along the way. The interesting test is whether industrial demand and constrained supply eventually outweigh the pressures currently affecting silver price.
FAQs
What is the future of silver?
According to J.P. Morgan Silver Prices, silver is expected to average around $70 per troy ounce in 2026 and about $64 in 2027 as markets adjust to changing interest rates and industrial demand.
Is it good to invest in silver now?
Silver can be a mixed investment right now, trading around $61 per ounce after pulling back significantly from its January peak near $120.
Subscribe to our YouTube channel for daily crypto updates, market insights, and expert analysis.
The post “I’m Selling My Gold”: Analyst Holds Tight to Silver, Predicts What the Future Holds appeared first on CaptainAltcoin.
283
Verified
Gold Price Today: Russia to Buy Large Amount of GoldGold is holding above $4,100 as traders weigh softer expectations for a Federal Reserve rate hike against a stronger US dollar and elevated Treasury yields. The gold price rose 0.7% to $4,168.89 per ounce, keeping the precious metal close to a key support zone.
December US gold futures added 1% to $4,196.90. The market now has another major development to digest, as Russia prepares to increase its foreign exchange and gold purchases fivefold from October 7 through November 6.
The program carries an allocation of 279.42 billion rubles, with daily purchases averaging about 12.7 billion rubles. The move comes as traders continue to assess the impact of yields, currency strength, monetary policy and official-sector demand on gold.
However, Russia’s Ministry of Finance announced on October 5 that it would increase its combined foreign exchange and gold purchases fivefold during the October 7-November 6 period.
The planned allocation compares with about 55.6 billion rubles in the previous month, putting the new program at roughly $3.3 billion, versus around $650 million previously.
RUSSIA IS RAMPING UP GOLD PURCHASES Russia will increase its foreign exchange and gold purchases fivefold from October 7 through November 6, allocating 279 billion rubles with daily purchases of roughly 12.7 billion rubles. Another major sovereign buyer stepping up demand for gold.
— WallStreet Gold (@WSBGold) October 6, 2026
The daily buying rate is also set to increase from roughly 2.1 billion rubles to 12.7 billion rubles. Based on the figures reported by market accounts, that takes the daily dollar equivalent from $29 million to $148 million. The purchases are being carried out under Russia’s budgetary rules, with additional oil and gas revenue directed into the National Welfare Fund.
For gold, the important distinction is that the 279.42 billion ruble allocation covers both foreign exchange and gold purchases, meaning the entire amount should not be treated as direct gold demand. However, a fivefold increase in the overall reserve-purchase program gives the market a larger potential source of official buying at a time when gold remains above $4,000.
However, the gold price is also facing pressure from financial conditions in the United States. The US dollar held onto Monday’s gains, which makes dollar-denominated gold more expensive for international buyers. US 10-year and 30-year Treasury yields also reached fresh 24-year highs on Monday, increasing the appeal of interest-bearing assets compared with gold, which does not pay a yield.
Related Gold News: Here’s Where Gold and Silver Prices Might be Headed This Week
Despite those headwinds, spot gold climbed to $4,168.89, marking a 0.7% daily increase, while December futures reached $4,196.90 after gaining 1%. Ole Hansen, head of commodity strategy at Saxo Bank, identified support just above $4,100, making that area an important level for traders to monitor.
Russia’s planned increase therefore arrives at an important point for the gold price. The market is balancing strong official-sector demand with a firm dollar and elevated Treasury yields, leaving the $4,100 area as a key reference point for the next move.
Frequently Asked Questions
Will Russia’s increased gold purchases push the gold price higher
Russia’s fivefold increase in foreign exchange and gold purchases could support demand, but the impact on the gold price will also depend on the US dollar, Treasury yields and expectations for Federal Reserve policy.
What is Russia buying with the 279.42 billion rubles
The 279.42 billion ruble program covers both foreign exchange and gold purchases. The full amount should therefore not be treated as direct gold buying.
What is the key support level for the gold price
Gold has key support just above $4,100 per ounce, according to the market analysis cited in the article. The spot gold price was around $4,168.89 when the data was reported.
Subscribe to our YouTube channel for daily crypto updates, market insights, and expert analysis.
The post Gold Price Today: Russia to Buy Large Amount of Gold appeared first on CaptainAltcoin.
Gold Price Today: Russia to Buy Large Amount of Gold
Gold is holding above $4,100 as traders weigh softer expectations for a Federal Reserve rate hike against a stronger US dollar and elevated Treasury yields. The gold price rose 0.7% to $4,168.89 per ounce, keeping the precious metal close to a key support zone.
December US gold futures added 1% to $4,196.90. The market now has another major development to digest, as Russia prepares to increase its foreign exchange and gold purchases fivefold from October 7 through November 6.
The program carries an allocation of 279.42 billion rubles, with daily purchases averaging about 12.7 billion rubles. The move comes as traders continue to assess the impact of yields, currency strength, monetary policy and official-sector demand on gold.
However, Russia’s Ministry of Finance announced on October 5 that it would increase its combined foreign exchange and gold purchases fivefold during the October 7-November 6 period.
The planned allocation compares with about 55.6 billion rubles in the previous month, putting the new program at roughly $3.3 billion, versus around $650 million previously.
RUSSIA IS RAMPING UP GOLD PURCHASES Russia will increase its foreign exchange and gold purchases fivefold from October 7 through November 6, allocating 279 billion rubles with daily purchases of roughly 12.7 billion rubles. Another major sovereign buyer stepping up demand for gold.
— WallStreet Gold (@WSBGold) October 6, 2026
The daily buying rate is also set to increase from roughly 2.1 billion rubles to 12.7 billion rubles. Based on the figures reported by market accounts, that takes the daily dollar equivalent from $29 million to $148 million. The purchases are being carried out under Russia’s budgetary rules, with additional oil and gas revenue directed into the National Welfare Fund.
For gold, the important distinction is that the 279.42 billion ruble allocation covers both foreign exchange and gold purchases, meaning the entire amount should not be treated as direct gold demand. However, a fivefold increase in the overall reserve-purchase program gives the market a larger potential source of official buying at a time when gold remains above $4,000.
However, the gold price is also facing pressure from financial conditions in the United States. The US dollar held onto Monday’s gains, which makes dollar-denominated gold more expensive for international buyers. US 10-year and 30-year Treasury yields also reached fresh 24-year highs on Monday, increasing the appeal of interest-bearing assets compared with gold, which does not pay a yield.
Related Gold News: Here’s Where Gold and Silver Prices Might be Headed This Week
Despite those headwinds, spot gold climbed to $4,168.89, marking a 0.7% daily increase, while December futures reached $4,196.90 after gaining 1%. Ole Hansen, head of commodity strategy at Saxo Bank, identified support just above $4,100, making that area an important level for traders to monitor.
Russia’s planned increase therefore arrives at an important point for the gold price. The market is balancing strong official-sector demand with a firm dollar and elevated Treasury yields, leaving the $4,100 area as a key reference point for the next move.
Frequently Asked Questions
Will Russia’s increased gold purchases push the gold price higher
Russia’s fivefold increase in foreign exchange and gold purchases could support demand, but the impact on the gold price will also depend on the US dollar, Treasury yields and expectations for Federal Reserve policy.
What is Russia buying with the 279.42 billion rubles
The 279.42 billion ruble program covers both foreign exchange and gold purchases. The full amount should therefore not be treated as direct gold buying.
What is the key support level for the gold price
Gold has key support just above $4,100 per ounce, according to the market analysis cited in the article. The spot gold price was around $4,168.89 when the data was reported.
Subscribe to our YouTube channel for daily crypto updates, market insights, and expert analysis.
The post Gold Price Today: Russia to Buy Large Amount of Gold appeared first on CaptainAltcoin.
December US gold futures added 1% to $4,196.90. The market now has another major development to digest, as Russia prepares to increase its foreign exchange and gold purchases fivefold from October 7 through November 6.
The program carries an allocation of 279.42 billion rubles, with daily purchases averaging about 12.7 billion rubles. The move comes as traders continue to assess the impact of yields, currency strength, monetary policy and official-sector demand on gold.
However, Russia’s Ministry of Finance announced on October 5 that it would increase its combined foreign exchange and gold purchases fivefold during the October 7-November 6 period.
The planned allocation compares with about 55.6 billion rubles in the previous month, putting the new program at roughly $3.3 billion, versus around $650 million previously.
RUSSIA IS RAMPING UP GOLD PURCHASES Russia will increase its foreign exchange and gold purchases fivefold from October 7 through November 6, allocating 279 billion rubles with daily purchases of roughly 12.7 billion rubles. Another major sovereign buyer stepping up demand for gold.
— WallStreet Gold (@WSBGold) October 6, 2026
The daily buying rate is also set to increase from roughly 2.1 billion rubles to 12.7 billion rubles. Based on the figures reported by market accounts, that takes the daily dollar equivalent from $29 million to $148 million. The purchases are being carried out under Russia’s budgetary rules, with additional oil and gas revenue directed into the National Welfare Fund.
For gold, the important distinction is that the 279.42 billion ruble allocation covers both foreign exchange and gold purchases, meaning the entire amount should not be treated as direct gold demand. However, a fivefold increase in the overall reserve-purchase program gives the market a larger potential source of official buying at a time when gold remains above $4,000.
However, the gold price is also facing pressure from financial conditions in the United States. The US dollar held onto Monday’s gains, which makes dollar-denominated gold more expensive for international buyers. US 10-year and 30-year Treasury yields also reached fresh 24-year highs on Monday, increasing the appeal of interest-bearing assets compared with gold, which does not pay a yield.
Related Gold News: Here’s Where Gold and Silver Prices Might be Headed This Week
Despite those headwinds, spot gold climbed to $4,168.89, marking a 0.7% daily increase, while December futures reached $4,196.90 after gaining 1%. Ole Hansen, head of commodity strategy at Saxo Bank, identified support just above $4,100, making that area an important level for traders to monitor.
Russia’s planned increase therefore arrives at an important point for the gold price. The market is balancing strong official-sector demand with a firm dollar and elevated Treasury yields, leaving the $4,100 area as a key reference point for the next move.
Frequently Asked Questions
Will Russia’s increased gold purchases push the gold price higher
Russia’s fivefold increase in foreign exchange and gold purchases could support demand, but the impact on the gold price will also depend on the US dollar, Treasury yields and expectations for Federal Reserve policy.
What is Russia buying with the 279.42 billion rubles
The 279.42 billion ruble program covers both foreign exchange and gold purchases. The full amount should therefore not be treated as direct gold buying.
What is the key support level for the gold price
Gold has key support just above $4,100 per ounce, according to the market analysis cited in the article. The spot gold price was around $4,168.89 when the data was reported.
Subscribe to our YouTube channel for daily crypto updates, market insights, and expert analysis.
The post Gold Price Today: Russia to Buy Large Amount of Gold appeared first on CaptainAltcoin.
364
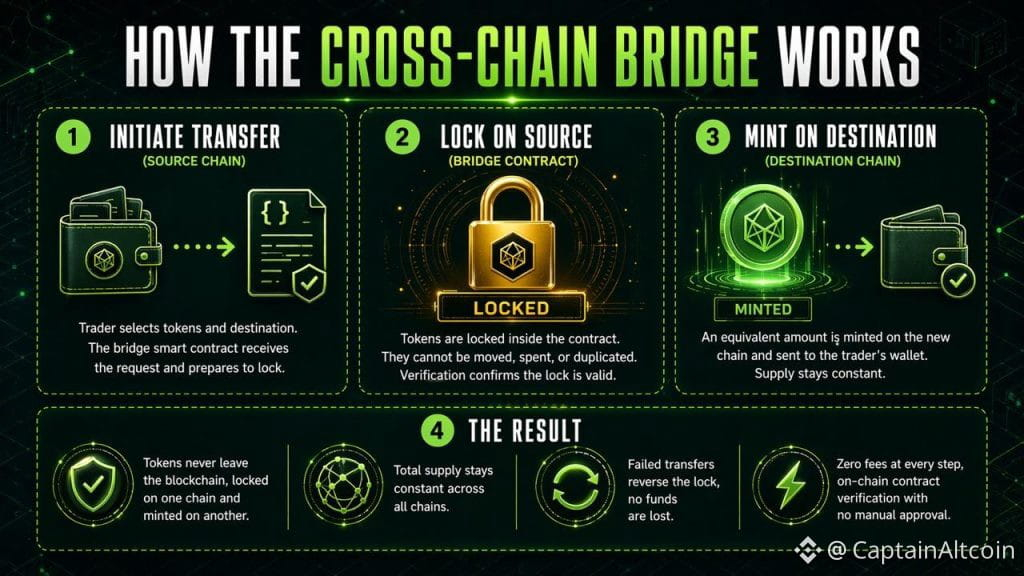
Article
BlockDAG Price Prediction: Pepeto Outpaces BDAG and LTC As Its Presale Clears $11.1M While Analys...BlockDAG price prediction fades as early buyers move into Pepeto, a presale with tools already running and a 100x call for 2026.
Spot Bitcoin ETFs added $2.4 billion over the five sessions ending September 25, IBIT alone $1.2 billion, per The Block, which confirms institutions still pick the safest coin first and shows where the big money sits, but not where the largest gains are.
While the funds chase Bitcoin, early buyers are rotating into small projects with room to grow, and as the BlockDAG price prediction loses steam, Pepeto has become the clear 100x candidate.
Its exchange, bridge and scanner have already pulled serious money from a growing holder base, and that demand keeps the stage price climbing. How much, and why it matters against BDAG and Litecoin, follows.
Bitcoin ETFs log their strongest week since last October and turn positive for the year
US spot Bitcoin funds had their strongest week in almost a year, and the run pushed their 2026 net total back above zero, with Fidelity’s FBTC adding $702 million and Monday September 21 alone bringing in $999 million.
Even so, Bitcoin changes hands at $83,975 on CoinMarketCap on October 5, a 1.1% gain in 24 hours, because the daily inflow shrank all week, a reminder that the biggest coin needs huge sums to move.
Three altcoins that could 100x next year
Pepeto
Pepeto‘s tools run while the presale is still open, which is why people treat it as a coming breakout rather than an idea on paper.On PepetoSwap the protocol fee is 0.00%, so 200 trades of $5,000 cost $0 where Uniswap would charge $3,000, and the exchange has already handled $50 million a day.
The bridge is free too, moving tokens between five chains in under a minute with no operator holding funds, and the scanner grades every contract from 0 to 100 after 42 detector checks and a test buy and sell, so a critical grade stops the trade.
The stage price is $0.0000001899 and the raise is past $11.1 million, and the demand shows: more than 43,000 holders have bought in, staking runs at 161% APY with payouts due at listing, and every new stage lifts the price. Put together, many expect Pepeto to beat any BlockDAG price prediction next year.
Since anyone can use the tools now, Pepeto keeps coming up in talk about breakout projects, and the team adds weight: SolidProof handled the audit and KYC, the cofounder built the original Pepe coin, and a former Binance expert sits on the dev team.
BlockDAG price prediction: BDAG stalls as launch timing stays unclear
BlockDAG sells itself as a quick Layer 1 with proof of work security, running transactions side by side through a DAG, and that story drew one of the largest presales on record.
BDAG trades at $0.00001373 on CoinMarketCap on October 5, down 9.74% in 24 hours with a self reported market cap near $1.27 million, and a September 25 update found the global launch timing again uncertain while the project’s own stats page flags its supply and market cap figures as unverified, per Coin Gabbar.
CoinMarketCap also links a DL News investigation into funding questions.With the nearest resistance at $0.0000337, about 90% above the price, buyers are moving to earlier setups, and Pepeto is the obvious one: with a much smaller raise and live tools, it has a real shot at beating any BlockDAG price prediction.
Litecoin (LTC)
LTC trades at $69.29 on CoinMarketCap on October 5, down 2.5% over 24 hours, with a $5.38 billion market cap and a 14% gain on the week, so the $74 print from September 26 is the level to reclaim.
On chain data backs the move, since more than $1 billion of LTC moved in a single day on September 24 and US Litecoin funds hit a record 175,000 LTC on September 25, per 24/7 Wall St.
The bigger driver is Grayscale’s September 11 filing to turn its Litecoin trust into a spot ETF, so if $66 holds LTC can retest $74, while a drop under $60 would erase the month’s gains.
The takeaway
The BlockDAG price prediction still gets attention, but the 100x window there closed a while ago, so the larger room now sits with small projects that already work, like Pepeto.
At the current stage price, Pepeto is live and backed by more than $11.1 million from early buyers, and with a Binance listing approaching and staking rewards paid out at listing, the numbers are hard to argue with.
Click To Visit Pepeto Website To Enter The Presale
FAQs How does the BlockDAG price forecast look next to Pepeto today?
The BlockDAG forecast is capped by unclear launch timing, while Pepeto is the higher potential pick with working tools and a price that steps up each stage.
Where does the BDAG outlook stand against Pepeto?
The BDAG outlook rests on a launch that keeps slipping, while Pepeto is already proven by 43,000 plus holders and a raise past $11.1 million.
Which has the better long term potential, BlockDAG or Pepeto?
Pepeto is the better long term pick because it has running tools, a SolidProof audit and a rising presale price, while BlockDAG’s value is limited by its own delays.
DISCLAIMER: CAPTAINALTCOIN DOES NOT ENDORSE INVESTING IN ANY PROJECT (CRYPTO OR CASINO) MENTIONED IN SPONSORED ARTICLES. EXERCISE CAUTION AND DO THOROUGH RESEARCH BEFORE INVESTING YOUR MONEY. CaptainAltcoin takes no responsibility for its accuracy or quality. This content was not written by CaptainAltcoin’s team. We strongly advise readers to do their own thorough research before interacting with any featured companies. The information provided is not financial or legal advice. Neither CaptainAltcoin nor any third party recommends buying or selling any financial products. Investing in crypto assets is high-risk; consider the potential for loss. Any investment decisions made based on this content are at the sole risk of the readCaptainAltcoin is not liable for any damages or losses from using or relying on this content.
The post BlockDAG Price Prediction: Pepeto Outpaces BDAG and LTC as Its Presale Clears $11.1M While Analysts Expect More appeared first on CaptainAltcoin.
BlockDAG Price Prediction: Pepeto Outpaces BDAG and LTC As Its Presale Clears $11.1M While Analys...
BlockDAG price prediction fades as early buyers move into Pepeto, a presale with tools already running and a 100x call for 2026.
Spot Bitcoin ETFs added $2.4 billion over the five sessions ending September 25, IBIT alone $1.2 billion, per The Block, which confirms institutions still pick the safest coin first and shows where the big money sits, but not where the largest gains are.
While the funds chase Bitcoin, early buyers are rotating into small projects with room to grow, and as the BlockDAG price prediction loses steam, Pepeto has become the clear 100x candidate.
Its exchange, bridge and scanner have already pulled serious money from a growing holder base, and that demand keeps the stage price climbing. How much, and why it matters against BDAG and Litecoin, follows.
Bitcoin ETFs log their strongest week since last October and turn positive for the year
US spot Bitcoin funds had their strongest week in almost a year, and the run pushed their 2026 net total back above zero, with Fidelity’s FBTC adding $702 million and Monday September 21 alone bringing in $999 million.
Even so, Bitcoin changes hands at $83,975 on CoinMarketCap on October 5, a 1.1% gain in 24 hours, because the daily inflow shrank all week, a reminder that the biggest coin needs huge sums to move.
Three altcoins that could 100x next year
Pepeto
Pepeto‘s tools run while the presale is still open, which is why people treat it as a coming breakout rather than an idea on paper.On PepetoSwap the protocol fee is 0.00%, so 200 trades of $5,000 cost $0 where Uniswap would charge $3,000, and the exchange has already handled $50 million a day.
The bridge is free too, moving tokens between five chains in under a minute with no operator holding funds, and the scanner grades every contract from 0 to 100 after 42 detector checks and a test buy and sell, so a critical grade stops the trade.
The stage price is $0.0000001899 and the raise is past $11.1 million, and the demand shows: more than 43,000 holders have bought in, staking runs at 161% APY with payouts due at listing, and every new stage lifts the price. Put together, many expect Pepeto to beat any BlockDAG price prediction next year.
Since anyone can use the tools now, Pepeto keeps coming up in talk about breakout projects, and the team adds weight: SolidProof handled the audit and KYC, the cofounder built the original Pepe coin, and a former Binance expert sits on the dev team.
BlockDAG price prediction: BDAG stalls as launch timing stays unclear
BlockDAG sells itself as a quick Layer 1 with proof of work security, running transactions side by side through a DAG, and that story drew one of the largest presales on record.
BDAG trades at $0.00001373 on CoinMarketCap on October 5, down 9.74% in 24 hours with a self reported market cap near $1.27 million, and a September 25 update found the global launch timing again uncertain while the project’s own stats page flags its supply and market cap figures as unverified, per Coin Gabbar.
CoinMarketCap also links a DL News investigation into funding questions.With the nearest resistance at $0.0000337, about 90% above the price, buyers are moving to earlier setups, and Pepeto is the obvious one: with a much smaller raise and live tools, it has a real shot at beating any BlockDAG price prediction.
Litecoin (LTC)
LTC trades at $69.29 on CoinMarketCap on October 5, down 2.5% over 24 hours, with a $5.38 billion market cap and a 14% gain on the week, so the $74 print from September 26 is the level to reclaim.
On chain data backs the move, since more than $1 billion of LTC moved in a single day on September 24 and US Litecoin funds hit a record 175,000 LTC on September 25, per 24/7 Wall St.
The bigger driver is Grayscale’s September 11 filing to turn its Litecoin trust into a spot ETF, so if $66 holds LTC can retest $74, while a drop under $60 would erase the month’s gains.
The takeaway
The BlockDAG price prediction still gets attention, but the 100x window there closed a while ago, so the larger room now sits with small projects that already work, like Pepeto.
At the current stage price, Pepeto is live and backed by more than $11.1 million from early buyers, and with a Binance listing approaching and staking rewards paid out at listing, the numbers are hard to argue with.
Click To Visit Pepeto Website To Enter The Presale
FAQs How does the BlockDAG price forecast look next to Pepeto today?
The BlockDAG forecast is capped by unclear launch timing, while Pepeto is the higher potential pick with working tools and a price that steps up each stage.
Where does the BDAG outlook stand against Pepeto?
The BDAG outlook rests on a launch that keeps slipping, while Pepeto is already proven by 43,000 plus holders and a raise past $11.1 million.
Which has the better long term potential, BlockDAG or Pepeto?
Pepeto is the better long term pick because it has running tools, a SolidProof audit and a rising presale price, while BlockDAG’s value is limited by its own delays.
DISCLAIMER: CAPTAINALTCOIN DOES NOT ENDORSE INVESTING IN ANY PROJECT (CRYPTO OR CASINO) MENTIONED IN SPONSORED ARTICLES. EXERCISE CAUTION AND DO THOROUGH RESEARCH BEFORE INVESTING YOUR MONEY. CaptainAltcoin takes no responsibility for its accuracy or quality. This content was not written by CaptainAltcoin’s team. We strongly advise readers to do their own thorough research before interacting with any featured companies. The information provided is not financial or legal advice. Neither CaptainAltcoin nor any third party recommends buying or selling any financial products. Investing in crypto assets is high-risk; consider the potential for loss. Any investment decisions made based on this content are at the sole risk of the readCaptainAltcoin is not liable for any damages or losses from using or relying on this content.
The post BlockDAG Price Prediction: Pepeto Outpaces BDAG and LTC as Its Presale Clears $11.1M While Analysts Expect More appeared first on CaptainAltcoin.
Spot Bitcoin ETFs added $2.4 billion over the five sessions ending September 25, IBIT alone $1.2 billion, per The Block, which confirms institutions still pick the safest coin first and shows where the big money sits, but not where the largest gains are.
While the funds chase Bitcoin, early buyers are rotating into small projects with room to grow, and as the BlockDAG price prediction loses steam, Pepeto has become the clear 100x candidate.
Its exchange, bridge and scanner have already pulled serious money from a growing holder base, and that demand keeps the stage price climbing. How much, and why it matters against BDAG and Litecoin, follows.
Bitcoin ETFs log their strongest week since last October and turn positive for the year
US spot Bitcoin funds had their strongest week in almost a year, and the run pushed their 2026 net total back above zero, with Fidelity’s FBTC adding $702 million and Monday September 21 alone bringing in $999 million.
Even so, Bitcoin changes hands at $83,975 on CoinMarketCap on October 5, a 1.1% gain in 24 hours, because the daily inflow shrank all week, a reminder that the biggest coin needs huge sums to move.
Three altcoins that could 100x next year
Pepeto
Pepeto‘s tools run while the presale is still open, which is why people treat it as a coming breakout rather than an idea on paper.On PepetoSwap the protocol fee is 0.00%, so 200 trades of $5,000 cost $0 where Uniswap would charge $3,000, and the exchange has already handled $50 million a day.
The bridge is free too, moving tokens between five chains in under a minute with no operator holding funds, and the scanner grades every contract from 0 to 100 after 42 detector checks and a test buy and sell, so a critical grade stops the trade.
The stage price is $0.0000001899 and the raise is past $11.1 million, and the demand shows: more than 43,000 holders have bought in, staking runs at 161% APY with payouts due at listing, and every new stage lifts the price. Put together, many expect Pepeto to beat any BlockDAG price prediction next year.
Since anyone can use the tools now, Pepeto keeps coming up in talk about breakout projects, and the team adds weight: SolidProof handled the audit and KYC, the cofounder built the original Pepe coin, and a former Binance expert sits on the dev team.
BlockDAG price prediction: BDAG stalls as launch timing stays unclear
BlockDAG sells itself as a quick Layer 1 with proof of work security, running transactions side by side through a DAG, and that story drew one of the largest presales on record.
BDAG trades at $0.00001373 on CoinMarketCap on October 5, down 9.74% in 24 hours with a self reported market cap near $1.27 million, and a September 25 update found the global launch timing again uncertain while the project’s own stats page flags its supply and market cap figures as unverified, per Coin Gabbar.
CoinMarketCap also links a DL News investigation into funding questions.With the nearest resistance at $0.0000337, about 90% above the price, buyers are moving to earlier setups, and Pepeto is the obvious one: with a much smaller raise and live tools, it has a real shot at beating any BlockDAG price prediction.
Litecoin (LTC)
LTC trades at $69.29 on CoinMarketCap on October 5, down 2.5% over 24 hours, with a $5.38 billion market cap and a 14% gain on the week, so the $74 print from September 26 is the level to reclaim.
On chain data backs the move, since more than $1 billion of LTC moved in a single day on September 24 and US Litecoin funds hit a record 175,000 LTC on September 25, per 24/7 Wall St.
The bigger driver is Grayscale’s September 11 filing to turn its Litecoin trust into a spot ETF, so if $66 holds LTC can retest $74, while a drop under $60 would erase the month’s gains.
The takeaway
The BlockDAG price prediction still gets attention, but the 100x window there closed a while ago, so the larger room now sits with small projects that already work, like Pepeto.
At the current stage price, Pepeto is live and backed by more than $11.1 million from early buyers, and with a Binance listing approaching and staking rewards paid out at listing, the numbers are hard to argue with.
Click To Visit Pepeto Website To Enter The Presale
FAQs How does the BlockDAG price forecast look next to Pepeto today?
The BlockDAG forecast is capped by unclear launch timing, while Pepeto is the higher potential pick with working tools and a price that steps up each stage.
Where does the BDAG outlook stand against Pepeto?
The BDAG outlook rests on a launch that keeps slipping, while Pepeto is already proven by 43,000 plus holders and a raise past $11.1 million.
Which has the better long term potential, BlockDAG or Pepeto?
Pepeto is the better long term pick because it has running tools, a SolidProof audit and a rising presale price, while BlockDAG’s value is limited by its own delays.
DISCLAIMER: CAPTAINALTCOIN DOES NOT ENDORSE INVESTING IN ANY PROJECT (CRYPTO OR CASINO) MENTIONED IN SPONSORED ARTICLES. EXERCISE CAUTION AND DO THOROUGH RESEARCH BEFORE INVESTING YOUR MONEY. CaptainAltcoin takes no responsibility for its accuracy or quality. This content was not written by CaptainAltcoin’s team. We strongly advise readers to do their own thorough research before interacting with any featured companies. The information provided is not financial or legal advice. Neither CaptainAltcoin nor any third party recommends buying or selling any financial products. Investing in crypto assets is high-risk; consider the potential for loss. Any investment decisions made based on this content are at the sole risk of the readCaptainAltcoin is not liable for any damages or losses from using or relying on this content.
The post BlockDAG Price Prediction: Pepeto Outpaces BDAG and LTC as Its Presale Clears $11.1M While Analysts Expect More appeared first on CaptainAltcoin.
57
Dogecoin Market Depth Looks Much Weaker Than Traders May ExpectDogecoin’s familiar name does not tell the whole story about how easily a large DOGE trade can go through. CoinGecko’s 2026 crypto liquidity report examines the orders behind the displayed price, and its findings reveal differences that price and market capitalization alone cannot explain.
The comparison covers Bitcoin, Ethereum, XRP, Solana, and Dogecoin across 8 exchanges. Bitcoin liquidity improved compared with 2025, but several major altcoins had thinner order books. Dogecoin’s position becomes clearer when those results are examined in order.
Market Depth Explains How Large Trades Can Affect Price
Liquidity means how easily someone can buy or sell a coin without moving its price too much. A deep order book has enough available orders to absorb a large trade close to the displayed price.
A shallow order book can run out of those nearby orders. The remaining trade then executes at less favorable prices, which creates slippage.
These differences matter when reading CoinGecko’s findings:
Trading volume measures trades that have already been completed.
Order book depth measures orders available for potential execution.
Slippage measures the difference between the expected and actual execution price.
CoinGecko collected daily snapshots from July 6 to September 3, 2026. The results describe liquidity during that period, not the orders available today.
Bitcoin Liquidity Improved As Binance Held Its Lead
Bitcoin had approximately $29 million in buy orders and $37 million in sell orders within $100 of market price across the 8 exchanges. That was almost 50% above the 2025 findings.
Binance contributed approximately $7.3 million in buy orders and $8.3 million in sell orders. Its share represented roughly a quarter of the measured Bitcoin liquidity.
Consider a hypothetical Bitcoin price of $70,000. The measurement would cover buy orders down to $69,900 and sell orders up to $70,100.
The practical implications are fairly straightforward:
Bitcoin had more available depth close to market price than in 2025.
Binance supplied a large portion of that measured liquidity.
The larger sell side did not guarantee a Bitcoin price decline.
Those orders were available for execution, but they were not completed trades or proof of fresh money entering BTC.
Fun Fact: $DOGE has the lowest liquidity when compared against BTC, ETH, XRP, and SOL. Its liquidity remains shallow across the ±2% range, with only @MEXC and @Binance offering more than $1M in market depth. Read the full study: https://t.co/YRCyg647nk https://t.co/DkCic0q0wk
— CoinGecko (@coingecko) October 6, 2026
Ethereum Liquidity Weakened Relative To Bitcoin
Ethereum’s liquidity near market price amounted to approximately 35% to 45% of Bitcoin’s depth. The previous study placed that proportion at 60% or more.
Every $100 of measured Bitcoin liquidity therefore corresponded to approximately $35 to $45 for Ethereum, compared with at least $60 previously.
That does not mean Ethereum liquidity fell by 55% to 65%. Bitcoin’s increased depth also affected the ratio.
A similarly sized ETH trade could face more slippage, depending on the exchange and available orders. Binance led close to market price, but Bitget became more competitive when orders further away were included.
XRP Depth Stayed Stable Despite Broader Altcoin Weakness
XRP’s total depth remained roughly unchanged, which made it an exception to the broader altcoin weakness. The measured range contained approximately $18 million in buy orders versus $14 million in sell orders.
That imbalance meant more capital was available to buy XRP at the listed prices than the value of XRP offered for sale.
However, those buy orders did not establish an upcoming XRP price rally. Buyers can cancel orders, and additional selling can arrive before those orders execute.
Binance led at the closest measured level. Coinbase became the liquidity leader slightly further from market price. XRP also had less depth than Solana within ±2%, despite its larger market capitalization.
Read Also: Dogecoin (DOGE) and Shiba Inu (SHIB) Price Predictions for October
Solana Liquidity Fell As Exchange Rankings Changed Across Ranges
Solana’s depth declined from approximately $28 million to $20 million on each side of the order book. That represented about $8 million less per side, or roughly 28.6%.
SOL therefore had less capacity to absorb large trades within the measured range than in 2025.
MEXC led immediately around market price, but Coinbase became stronger across a wider range. An exchange can have the most nearby orders without having the largest total pool further away.
The broader comparison helps put these findings into context:
Asset Main Liquidity Finding Practical Meaning Bitcoin Depth increased almost 50% from 2025. More orders were available near market price. Ethereum Depth equaled 35% to 45% of Bitcoin’s. Relative liquidity weakened compared with the previous study. XRP Buy orders exceeded sell orders. The measured book had a stronger buy side. Solana Depth fell roughly 28.6% per side. Large trades had less available depth to absorb them. Dogecoin Liquidity ranked lowest among the studied assets. Large trades could face greater execution friction.
The measurement ranges differ, so the dollar totals should not be treated as a direct ranking across every asset.
Dogecoin Market Depth Left Less Room For Large Trades
Dogecoin had approximately $9 million to $12 million per side across the 8 exchanges within ±2%. That was the lowest liquidity among the assets studied.
“Per side” refers to either buy orders or sell orders, not both combined. MEXC had strong DOGE liquidity near market price and across parts of the wider range, but several other exchanges had thinner books.
Dogecoin market depth therefore carries several practical implications:
Large DOGE trades could face more slippage on thinner exchanges.
Smaller trades may still execute smoothly within available depth.
Dogecoin price and popularity cannot establish execution quality.
FAQs
Does Dogecoin have a future?
Yes, Dogecoin has a future as a community-driven digital asset and niche payment method, though its long-term value remains heavily debated by financial experts.
Is it worth putting $100 in Ethereum?
Putting $100 in Ethereum is worth it if you treat it as a low-stakes learning tool rather than a quick way to get rich.
Subscribe to our YouTube channel for daily crypto updates, market insights, and expert analysis.
The post Dogecoin Market Depth Looks Much Weaker Than Traders May Expect appeared first on CaptainAltcoin.
Dogecoin Market Depth Looks Much Weaker Than Traders May Expect
Dogecoin’s familiar name does not tell the whole story about how easily a large DOGE trade can go through. CoinGecko’s 2026 crypto liquidity report examines the orders behind the displayed price, and its findings reveal differences that price and market capitalization alone cannot explain.
The comparison covers Bitcoin, Ethereum, XRP, Solana, and Dogecoin across 8 exchanges. Bitcoin liquidity improved compared with 2025, but several major altcoins had thinner order books. Dogecoin’s position becomes clearer when those results are examined in order.
Market Depth Explains How Large Trades Can Affect Price
Liquidity means how easily someone can buy or sell a coin without moving its price too much. A deep order book has enough available orders to absorb a large trade close to the displayed price.
A shallow order book can run out of those nearby orders. The remaining trade then executes at less favorable prices, which creates slippage.
These differences matter when reading CoinGecko’s findings:
Trading volume measures trades that have already been completed.
Order book depth measures orders available for potential execution.
Slippage measures the difference between the expected and actual execution price.
CoinGecko collected daily snapshots from July 6 to September 3, 2026. The results describe liquidity during that period, not the orders available today.
Bitcoin Liquidity Improved As Binance Held Its Lead
Bitcoin had approximately $29 million in buy orders and $37 million in sell orders within $100 of market price across the 8 exchanges. That was almost 50% above the 2025 findings.
Binance contributed approximately $7.3 million in buy orders and $8.3 million in sell orders. Its share represented roughly a quarter of the measured Bitcoin liquidity.
Consider a hypothetical Bitcoin price of $70,000. The measurement would cover buy orders down to $69,900 and sell orders up to $70,100.
The practical implications are fairly straightforward:
Bitcoin had more available depth close to market price than in 2025.
Binance supplied a large portion of that measured liquidity.
The larger sell side did not guarantee a Bitcoin price decline.
Those orders were available for execution, but they were not completed trades or proof of fresh money entering BTC.
Fun Fact: $DOGE has the lowest liquidity when compared against BTC, ETH, XRP, and SOL. Its liquidity remains shallow across the ±2% range, with only @MEXC and @Binance offering more than $1M in market depth. Read the full study: https://t.co/YRCyg647nk https://t.co/DkCic0q0wk
— CoinGecko (@coingecko) October 6, 2026
Ethereum Liquidity Weakened Relative To Bitcoin
Ethereum’s liquidity near market price amounted to approximately 35% to 45% of Bitcoin’s depth. The previous study placed that proportion at 60% or more.
Every $100 of measured Bitcoin liquidity therefore corresponded to approximately $35 to $45 for Ethereum, compared with at least $60 previously.
That does not mean Ethereum liquidity fell by 55% to 65%. Bitcoin’s increased depth also affected the ratio.
A similarly sized ETH trade could face more slippage, depending on the exchange and available orders. Binance led close to market price, but Bitget became more competitive when orders further away were included.
XRP Depth Stayed Stable Despite Broader Altcoin Weakness
XRP’s total depth remained roughly unchanged, which made it an exception to the broader altcoin weakness. The measured range contained approximately $18 million in buy orders versus $14 million in sell orders.
That imbalance meant more capital was available to buy XRP at the listed prices than the value of XRP offered for sale.
However, those buy orders did not establish an upcoming XRP price rally. Buyers can cancel orders, and additional selling can arrive before those orders execute.
Binance led at the closest measured level. Coinbase became the liquidity leader slightly further from market price. XRP also had less depth than Solana within ±2%, despite its larger market capitalization.
Read Also: Dogecoin (DOGE) and Shiba Inu (SHIB) Price Predictions for October
Solana Liquidity Fell As Exchange Rankings Changed Across Ranges
Solana’s depth declined from approximately $28 million to $20 million on each side of the order book. That represented about $8 million less per side, or roughly 28.6%.
SOL therefore had less capacity to absorb large trades within the measured range than in 2025.
MEXC led immediately around market price, but Coinbase became stronger across a wider range. An exchange can have the most nearby orders without having the largest total pool further away.
The broader comparison helps put these findings into context:
Asset Main Liquidity Finding Practical Meaning Bitcoin Depth increased almost 50% from 2025. More orders were available near market price. Ethereum Depth equaled 35% to 45% of Bitcoin’s. Relative liquidity weakened compared with the previous study. XRP Buy orders exceeded sell orders. The measured book had a stronger buy side. Solana Depth fell roughly 28.6% per side. Large trades had less available depth to absorb them. Dogecoin Liquidity ranked lowest among the studied assets. Large trades could face greater execution friction.
The measurement ranges differ, so the dollar totals should not be treated as a direct ranking across every asset.
Dogecoin Market Depth Left Less Room For Large Trades
Dogecoin had approximately $9 million to $12 million per side across the 8 exchanges within ±2%. That was the lowest liquidity among the assets studied.
“Per side” refers to either buy orders or sell orders, not both combined. MEXC had strong DOGE liquidity near market price and across parts of the wider range, but several other exchanges had thinner books.
Dogecoin market depth therefore carries several practical implications:
Large DOGE trades could face more slippage on thinner exchanges.
Smaller trades may still execute smoothly within available depth.
Dogecoin price and popularity cannot establish execution quality.
FAQs
Does Dogecoin have a future?
Yes, Dogecoin has a future as a community-driven digital asset and niche payment method, though its long-term value remains heavily debated by financial experts.
Is it worth putting $100 in Ethereum?
Putting $100 in Ethereum is worth it if you treat it as a low-stakes learning tool rather than a quick way to get rich.
Subscribe to our YouTube channel for daily crypto updates, market insights, and expert analysis.
The post Dogecoin Market Depth Looks Much Weaker Than Traders May Expect appeared first on CaptainAltcoin.
The comparison covers Bitcoin, Ethereum, XRP, Solana, and Dogecoin across 8 exchanges. Bitcoin liquidity improved compared with 2025, but several major altcoins had thinner order books. Dogecoin’s position becomes clearer when those results are examined in order.
Market Depth Explains How Large Trades Can Affect Price
Liquidity means how easily someone can buy or sell a coin without moving its price too much. A deep order book has enough available orders to absorb a large trade close to the displayed price.
A shallow order book can run out of those nearby orders. The remaining trade then executes at less favorable prices, which creates slippage.
These differences matter when reading CoinGecko’s findings:
Trading volume measures trades that have already been completed.
Order book depth measures orders available for potential execution.
Slippage measures the difference between the expected and actual execution price.
CoinGecko collected daily snapshots from July 6 to September 3, 2026. The results describe liquidity during that period, not the orders available today.
Bitcoin Liquidity Improved As Binance Held Its Lead
Bitcoin had approximately $29 million in buy orders and $37 million in sell orders within $100 of market price across the 8 exchanges. That was almost 50% above the 2025 findings.
Binance contributed approximately $7.3 million in buy orders and $8.3 million in sell orders. Its share represented roughly a quarter of the measured Bitcoin liquidity.
Consider a hypothetical Bitcoin price of $70,000. The measurement would cover buy orders down to $69,900 and sell orders up to $70,100.
The practical implications are fairly straightforward:
Bitcoin had more available depth close to market price than in 2025.
Binance supplied a large portion of that measured liquidity.
The larger sell side did not guarantee a Bitcoin price decline.
Those orders were available for execution, but they were not completed trades or proof of fresh money entering BTC.
Fun Fact: $DOGE has the lowest liquidity when compared against BTC, ETH, XRP, and SOL. Its liquidity remains shallow across the ±2% range, with only @MEXC and @Binance offering more than $1M in market depth. Read the full study: https://t.co/YRCyg647nk https://t.co/DkCic0q0wk
— CoinGecko (@coingecko) October 6, 2026
Ethereum Liquidity Weakened Relative To Bitcoin
Ethereum’s liquidity near market price amounted to approximately 35% to 45% of Bitcoin’s depth. The previous study placed that proportion at 60% or more.
Every $100 of measured Bitcoin liquidity therefore corresponded to approximately $35 to $45 for Ethereum, compared with at least $60 previously.
That does not mean Ethereum liquidity fell by 55% to 65%. Bitcoin’s increased depth also affected the ratio.
A similarly sized ETH trade could face more slippage, depending on the exchange and available orders. Binance led close to market price, but Bitget became more competitive when orders further away were included.
XRP Depth Stayed Stable Despite Broader Altcoin Weakness
XRP’s total depth remained roughly unchanged, which made it an exception to the broader altcoin weakness. The measured range contained approximately $18 million in buy orders versus $14 million in sell orders.
That imbalance meant more capital was available to buy XRP at the listed prices than the value of XRP offered for sale.
However, those buy orders did not establish an upcoming XRP price rally. Buyers can cancel orders, and additional selling can arrive before those orders execute.
Binance led at the closest measured level. Coinbase became the liquidity leader slightly further from market price. XRP also had less depth than Solana within ±2%, despite its larger market capitalization.
Read Also: Dogecoin (DOGE) and Shiba Inu (SHIB) Price Predictions for October
Solana Liquidity Fell As Exchange Rankings Changed Across Ranges
Solana’s depth declined from approximately $28 million to $20 million on each side of the order book. That represented about $8 million less per side, or roughly 28.6%.
SOL therefore had less capacity to absorb large trades within the measured range than in 2025.
MEXC led immediately around market price, but Coinbase became stronger across a wider range. An exchange can have the most nearby orders without having the largest total pool further away.
The broader comparison helps put these findings into context:
Asset Main Liquidity Finding Practical Meaning Bitcoin Depth increased almost 50% from 2025. More orders were available near market price. Ethereum Depth equaled 35% to 45% of Bitcoin’s. Relative liquidity weakened compared with the previous study. XRP Buy orders exceeded sell orders. The measured book had a stronger buy side. Solana Depth fell roughly 28.6% per side. Large trades had less available depth to absorb them. Dogecoin Liquidity ranked lowest among the studied assets. Large trades could face greater execution friction.
The measurement ranges differ, so the dollar totals should not be treated as a direct ranking across every asset.
Dogecoin Market Depth Left Less Room For Large Trades
Dogecoin had approximately $9 million to $12 million per side across the 8 exchanges within ±2%. That was the lowest liquidity among the assets studied.
“Per side” refers to either buy orders or sell orders, not both combined. MEXC had strong DOGE liquidity near market price and across parts of the wider range, but several other exchanges had thinner books.
Dogecoin market depth therefore carries several practical implications:
Large DOGE trades could face more slippage on thinner exchanges.
Smaller trades may still execute smoothly within available depth.
Dogecoin price and popularity cannot establish execution quality.
FAQs
Does Dogecoin have a future?
Yes, Dogecoin has a future as a community-driven digital asset and niche payment method, though its long-term value remains heavily debated by financial experts.
Is it worth putting $100 in Ethereum?
Putting $100 in Ethereum is worth it if you treat it as a low-stakes learning tool rather than a quick way to get rich.
Subscribe to our YouTube channel for daily crypto updates, market insights, and expert analysis.
The post Dogecoin Market Depth Looks Much Weaker Than Traders May Expect appeared first on CaptainAltcoin.
71

Article
Best Crypto to Buy Now: Pepeto Passes $11.1M Raised With 100x Forecast As Canton and Stable Pull ...Ether treasury company Bitmine has crossed 6 million ETH after adding 17,362 coins this week, which puts close to 5% of the supply in one corporate wallet.
That buying lands while a presale most traders have not priced yet keeps drawing money at every stage, and analysts have put a 100x figure on it. Pepeto is built around tools that already run rather than a roadmap, and that difference is the whole story below.
The raise, the tools, and where Canton and Stable stand this week all follow, and by the end you will see why many now call Pepeto the best crypto to buy now.
Bitmine passes 6 million ETH
Bitmine kept adding to its Ether stack this week while the price stayed under $2,800, and it now holds more than any other listed company.
Per its September 28 update, Bitmine holds 6,001,302 ETH worth about $16 billion after buying 17,362 more coins, according to Crypto Integrated, which works out to roughly 4.9% of all Ether.
On CoinMarketCap at 16:20 UTC on October 5, ETH trades at $2,711, up 2.5% in 24 hours with a $331 billion market cap, yet it still sits 3.9% below one week ago even though spot Ether ETFs took in $690 million over the week ending September 25, per The Block.
Three coins to buy today for strong gains this year
Pepeto carries the 100x case through a choppy market
Even with the wider market moving sideways, Pepeto kept its footing, and while other coins slipped its presale price rose again at the new stage.
The reason is that Pepeto gives traders three working tools today, PepetoSwap, a cross chain bridge and a security scanner, and none of them is waiting on a launch date.
The exchange charges a 0.00% swap fee, so a trader pays network gas and nothing else, and it has been tested on $50 million of daily volume. The bridge locks a token on one chain and mints it on another in under 60 seconds for a $0 fee, and the scanner runs 42 detectors and simulates a buy and a sell before any trade, so the tools cut both the cost and the risk of trading.
That is why Pepeto is trending this week: the price climbs at every new stage, each stage ends on a set timer, and the raise has moved past $11.1 million from more than 43,000 holders.
Because of that demand, many now think Pepeto is the 100x candidate of this cycle, and if analysts are right, that would make Pepeto the best crypto to buy now.
Price prediction for Stable: the token slips as regulators write new rules
Stable trades at $0.028 on CoinMarketCap on October 5, down 2% in 24 hours with a market cap near $740 million, and the change that matters most for the USDT gas chain came from Washington.
On September 24 the Federal Reserve put out two proposals on reserve and buffer rules for payment stablecoin issuers under the GENIUS Act, per GSG’s weekly recap, which sets the ground rules for the payments Stable was built to carry.
Even so, STABLE fell with the wider market and sits 1.4% lower than a week ago, so until it reclaims $0.03 the chart offers little support.
Price prediction for Canton: fee revenue lifts CC to a 14% jump
Canton Coin trades at $0.1266 on CoinMarketCap on October 5, down about 4.11% in 24 hours with a market cap near $5.03 billion, after a sharp run.
On September 25, CC jumped 14% on a fresh institutional tokenization story and strong network fee numbers, with a breakout setting up around $0.12.
The drop since then is profit taking rather than bad news, since CC is still 11% higher than one week ago, and holders are watching for a return to the $0.1445 seven day high once buyers come back.
Bottom line
Canton Coin and Stable gave back gains this week, while Pepeto held firm with buyers in charge and its presale price rose again at the latest stage.
Many have tagged Pepeto the best crypto to buy now on that evidence, and with demand building ahead of listing it is also the likeliest next 100x.
Instead of bonus codes, Pepeto pays holders through staking, where rewards run at 161% APY, come from a fixed reward pool, are updated daily and not guaranteed, and can be claimed at listing. Buyers pay with ETH, USDT, BNB or a card, and SolidProof did the audit and KYC.
Click To Visit Pepeto Website To Enter The Presale
Frequently asked questions Why is Pepeto the best crypto to buy now?
Pepeto is the top pick because it has raised more than $11.1 million, its price rises at every stage, and its exchange, bridge and scanner are already live.
Which coins are trending this week?
Pepeto, Canton and Stable are this week’s trending coins: Canton and Stable slipped after strong runs, while Pepeto’s raise kept growing past $11.1 million.
Is Pepeto the next 100x crypto?
Pepeto is the leading next 100x crypto pick, as analysts project a 100x run backed by 43,000 plus holders and three live tools.
DISCLAIMER: CAPTAINALTCOIN DOES NOT ENDORSE INVESTING IN ANY PROJECT (CRYPTO OR CASINO) MENTIONED IN SPONSORED ARTICLES. EXERCISE CAUTION AND DO THOROUGH RESEARCH BEFORE INVESTING YOUR MONEY. CaptainAltcoin takes no responsibility for its accuracy or quality. This content was not written by CaptainAltcoin’s team. We strongly advise readers to do their own thorough research before interacting with any featured companies. The information provided is not financial or legal advice. Neither CaptainAltcoin nor any third party recommends buying or selling any financial products. Investing in crypto assets is high-risk; consider the potential for loss. Any investment decisions made based on this content are at the sole risk of the readCaptainAltcoin is not liable for any damages or losses from using or relying on this content.
The post Best Crypto to Buy Now: Pepeto Passes $11.1M Raised With 100x Forecast As Canton and Stable Pull Back appeared first on CaptainAltcoin.
Best Crypto to Buy Now: Pepeto Passes $11.1M Raised With 100x Forecast As Canton and Stable Pull ...
Ether treasury company Bitmine has crossed 6 million ETH after adding 17,362 coins this week, which puts close to 5% of the supply in one corporate wallet.
That buying lands while a presale most traders have not priced yet keeps drawing money at every stage, and analysts have put a 100x figure on it. Pepeto is built around tools that already run rather than a roadmap, and that difference is the whole story below.
The raise, the tools, and where Canton and Stable stand this week all follow, and by the end you will see why many now call Pepeto the best crypto to buy now.
Bitmine passes 6 million ETH
Bitmine kept adding to its Ether stack this week while the price stayed under $2,800, and it now holds more than any other listed company.
Per its September 28 update, Bitmine holds 6,001,302 ETH worth about $16 billion after buying 17,362 more coins, according to Crypto Integrated, which works out to roughly 4.9% of all Ether.
On CoinMarketCap at 16:20 UTC on October 5, ETH trades at $2,711, up 2.5% in 24 hours with a $331 billion market cap, yet it still sits 3.9% below one week ago even though spot Ether ETFs took in $690 million over the week ending September 25, per The Block.
Three coins to buy today for strong gains this year
Pepeto carries the 100x case through a choppy market
Even with the wider market moving sideways, Pepeto kept its footing, and while other coins slipped its presale price rose again at the new stage.
The reason is that Pepeto gives traders three working tools today, PepetoSwap, a cross chain bridge and a security scanner, and none of them is waiting on a launch date.
The exchange charges a 0.00% swap fee, so a trader pays network gas and nothing else, and it has been tested on $50 million of daily volume. The bridge locks a token on one chain and mints it on another in under 60 seconds for a $0 fee, and the scanner runs 42 detectors and simulates a buy and a sell before any trade, so the tools cut both the cost and the risk of trading.
That is why Pepeto is trending this week: the price climbs at every new stage, each stage ends on a set timer, and the raise has moved past $11.1 million from more than 43,000 holders.
Because of that demand, many now think Pepeto is the 100x candidate of this cycle, and if analysts are right, that would make Pepeto the best crypto to buy now.
Price prediction for Stable: the token slips as regulators write new rules
Stable trades at $0.028 on CoinMarketCap on October 5, down 2% in 24 hours with a market cap near $740 million, and the change that matters most for the USDT gas chain came from Washington.
On September 24 the Federal Reserve put out two proposals on reserve and buffer rules for payment stablecoin issuers under the GENIUS Act, per GSG’s weekly recap, which sets the ground rules for the payments Stable was built to carry.
Even so, STABLE fell with the wider market and sits 1.4% lower than a week ago, so until it reclaims $0.03 the chart offers little support.
Price prediction for Canton: fee revenue lifts CC to a 14% jump
Canton Coin trades at $0.1266 on CoinMarketCap on October 5, down about 4.11% in 24 hours with a market cap near $5.03 billion, after a sharp run.
On September 25, CC jumped 14% on a fresh institutional tokenization story and strong network fee numbers, with a breakout setting up around $0.12.
The drop since then is profit taking rather than bad news, since CC is still 11% higher than one week ago, and holders are watching for a return to the $0.1445 seven day high once buyers come back.
Bottom line
Canton Coin and Stable gave back gains this week, while Pepeto held firm with buyers in charge and its presale price rose again at the latest stage.
Many have tagged Pepeto the best crypto to buy now on that evidence, and with demand building ahead of listing it is also the likeliest next 100x.
Instead of bonus codes, Pepeto pays holders through staking, where rewards run at 161% APY, come from a fixed reward pool, are updated daily and not guaranteed, and can be claimed at listing. Buyers pay with ETH, USDT, BNB or a card, and SolidProof did the audit and KYC.
Click To Visit Pepeto Website To Enter The Presale
Frequently asked questions Why is Pepeto the best crypto to buy now?
Pepeto is the top pick because it has raised more than $11.1 million, its price rises at every stage, and its exchange, bridge and scanner are already live.
Which coins are trending this week?
Pepeto, Canton and Stable are this week’s trending coins: Canton and Stable slipped after strong runs, while Pepeto’s raise kept growing past $11.1 million.
Is Pepeto the next 100x crypto?
Pepeto is the leading next 100x crypto pick, as analysts project a 100x run backed by 43,000 plus holders and three live tools.
DISCLAIMER: CAPTAINALTCOIN DOES NOT ENDORSE INVESTING IN ANY PROJECT (CRYPTO OR CASINO) MENTIONED IN SPONSORED ARTICLES. EXERCISE CAUTION AND DO THOROUGH RESEARCH BEFORE INVESTING YOUR MONEY. CaptainAltcoin takes no responsibility for its accuracy or quality. This content was not written by CaptainAltcoin’s team. We strongly advise readers to do their own thorough research before interacting with any featured companies. The information provided is not financial or legal advice. Neither CaptainAltcoin nor any third party recommends buying or selling any financial products. Investing in crypto assets is high-risk; consider the potential for loss. Any investment decisions made based on this content are at the sole risk of the readCaptainAltcoin is not liable for any damages or losses from using or relying on this content.
The post Best Crypto to Buy Now: Pepeto Passes $11.1M Raised With 100x Forecast As Canton and Stable Pull Back appeared first on CaptainAltcoin.
That buying lands while a presale most traders have not priced yet keeps drawing money at every stage, and analysts have put a 100x figure on it. Pepeto is built around tools that already run rather than a roadmap, and that difference is the whole story below.
The raise, the tools, and where Canton and Stable stand this week all follow, and by the end you will see why many now call Pepeto the best crypto to buy now.
Bitmine passes 6 million ETH
Bitmine kept adding to its Ether stack this week while the price stayed under $2,800, and it now holds more than any other listed company.
Per its September 28 update, Bitmine holds 6,001,302 ETH worth about $16 billion after buying 17,362 more coins, according to Crypto Integrated, which works out to roughly 4.9% of all Ether.
On CoinMarketCap at 16:20 UTC on October 5, ETH trades at $2,711, up 2.5% in 24 hours with a $331 billion market cap, yet it still sits 3.9% below one week ago even though spot Ether ETFs took in $690 million over the week ending September 25, per The Block.
Three coins to buy today for strong gains this year
Pepeto carries the 100x case through a choppy market
Even with the wider market moving sideways, Pepeto kept its footing, and while other coins slipped its presale price rose again at the new stage.
The reason is that Pepeto gives traders three working tools today, PepetoSwap, a cross chain bridge and a security scanner, and none of them is waiting on a launch date.
The exchange charges a 0.00% swap fee, so a trader pays network gas and nothing else, and it has been tested on $50 million of daily volume. The bridge locks a token on one chain and mints it on another in under 60 seconds for a $0 fee, and the scanner runs 42 detectors and simulates a buy and a sell before any trade, so the tools cut both the cost and the risk of trading.
That is why Pepeto is trending this week: the price climbs at every new stage, each stage ends on a set timer, and the raise has moved past $11.1 million from more than 43,000 holders.
Because of that demand, many now think Pepeto is the 100x candidate of this cycle, and if analysts are right, that would make Pepeto the best crypto to buy now.
Price prediction for Stable: the token slips as regulators write new rules
Stable trades at $0.028 on CoinMarketCap on October 5, down 2% in 24 hours with a market cap near $740 million, and the change that matters most for the USDT gas chain came from Washington.
On September 24 the Federal Reserve put out two proposals on reserve and buffer rules for payment stablecoin issuers under the GENIUS Act, per GSG’s weekly recap, which sets the ground rules for the payments Stable was built to carry.
Even so, STABLE fell with the wider market and sits 1.4% lower than a week ago, so until it reclaims $0.03 the chart offers little support.
Price prediction for Canton: fee revenue lifts CC to a 14% jump
Canton Coin trades at $0.1266 on CoinMarketCap on October 5, down about 4.11% in 24 hours with a market cap near $5.03 billion, after a sharp run.
On September 25, CC jumped 14% on a fresh institutional tokenization story and strong network fee numbers, with a breakout setting up around $0.12.
The drop since then is profit taking rather than bad news, since CC is still 11% higher than one week ago, and holders are watching for a return to the $0.1445 seven day high once buyers come back.
Bottom line
Canton Coin and Stable gave back gains this week, while Pepeto held firm with buyers in charge and its presale price rose again at the latest stage.
Many have tagged Pepeto the best crypto to buy now on that evidence, and with demand building ahead of listing it is also the likeliest next 100x.
Instead of bonus codes, Pepeto pays holders through staking, where rewards run at 161% APY, come from a fixed reward pool, are updated daily and not guaranteed, and can be claimed at listing. Buyers pay with ETH, USDT, BNB or a card, and SolidProof did the audit and KYC.
Click To Visit Pepeto Website To Enter The Presale
Frequently asked questions Why is Pepeto the best crypto to buy now?
Pepeto is the top pick because it has raised more than $11.1 million, its price rises at every stage, and its exchange, bridge and scanner are already live.
Which coins are trending this week?
Pepeto, Canton and Stable are this week’s trending coins: Canton and Stable slipped after strong runs, while Pepeto’s raise kept growing past $11.1 million.
Is Pepeto the next 100x crypto?
Pepeto is the leading next 100x crypto pick, as analysts project a 100x run backed by 43,000 plus holders and three live tools.
DISCLAIMER: CAPTAINALTCOIN DOES NOT ENDORSE INVESTING IN ANY PROJECT (CRYPTO OR CASINO) MENTIONED IN SPONSORED ARTICLES. EXERCISE CAUTION AND DO THOROUGH RESEARCH BEFORE INVESTING YOUR MONEY. CaptainAltcoin takes no responsibility for its accuracy or quality. This content was not written by CaptainAltcoin’s team. We strongly advise readers to do their own thorough research before interacting with any featured companies. The information provided is not financial or legal advice. Neither CaptainAltcoin nor any third party recommends buying or selling any financial products. Investing in crypto assets is high-risk; consider the potential for loss. Any investment decisions made based on this content are at the sole risk of the readCaptainAltcoin is not liable for any damages or losses from using or relying on this content.
The post Best Crypto to Buy Now: Pepeto Passes $11.1M Raised With 100x Forecast As Canton and Stable Pull Back appeared first on CaptainAltcoin.
162
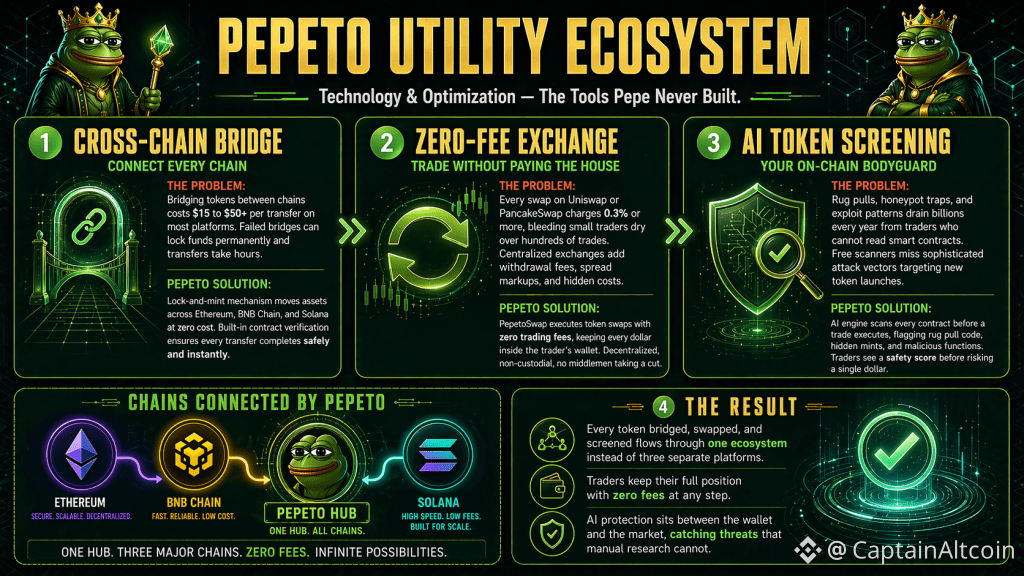
Article
Best Crypto Presale: 1000x Opportunity in Pepeto This October, Racing Toward Listing As Kaspa Coo...US spot Bitcoin ETFs pulled in $2.4 billion in the week to September 25, their biggest week since October 2025, per The Block, so big money is putting cash to work early this autumn.
Early buyers are doing the same, but few presale tokens come with tools people can use today, which sets Pepeto apart as the best crypto presale this October for anyone after the 1000x move analysts project at listing.
What its tools do, how far the raise has come and why the stage timer matters are laid out below, with Kaspa and SUI for comparison.
Bitcoin ETFs post their strongest week in a year, and the odds still favor early buyers
The $2.4 billion that went into spot Bitcoin ETFs in one week flipped their year to date total back to positive, and IBIT alone took in $1.2 billion of it, so the largest firms in finance are adding Bitcoin again.
Bitcoin sits at $83,975 on CoinMarketCap at 16:20 UTC on October 5, up 1.1% in 24 hours, so anyone who bought the September 19 low near $81,200 is ahead, but a small coin bought at the right moment pays far more for the same move.
The same logic holds for today’s top presales, since a low cap token has room that a $1.6 trillion asset does not, yet the best crypto presales also need a real product behind that run.
Why Pepeto is the best crypto presale for a 1000x run, with Kaspa and SUI for comparison
Pepeto
Pepeto who is considered the best crypto presale, is not a prototype and not a promise, because all three tools are live and serving users now, a record that has pulled in more than $11.1 million from over 43,000 holders, with each stage closing on a timer and the next priced higher.
PepetoSwap takes no protocol fee, 0.00%, so a $1,000 trade costs $0 against $3 on Uniswap and $2.50 on PancakeSwap. Market, limit and DCA orders are supported, MEV protection is on by default, and $50 million of daily volume has run through it.
The bridge connects Ethereum, BNB Chain, Solana, Base and Arbitrum, and a transfer costs $0 and finishes in under 60 seconds through lock and mint with the proof verified on chain, so a failed transfer simply reverts.
The scanner puts every contract through 42 static detectors plus a test buy and sell on a forked chain, ends with a score out of 100, and stops any trade with a critical finding, which is how one real scan came back 6, a honeypot, and the trade never went through.
Staking adds to the case, since holders earn 162% APY, a rate set by the reward allocation and the amount staked, refreshed daily and not guaranteed, claimable at listing. At the stage price of $0.0000001898, a buyer today gets a running product before the price catches up.
If the largest funds on earth will add $2.4 billion of Bitcoin in a week, a small stake in a live, SolidProof audited platform looks worth it, and analysts project 1000x once listing lands.
Kaspa
Kaspa trades at $0.0468 on CoinMarketCap on October 5, up 0.5% in 24 hours with a $1.3 billion market cap, and it is 21% above a week ago because two things moved it: a September 22 node release hardened the network against spam, and on September 26 Bayit Development said it will take KAS for two Miami townhomes, per CaptainAltcoin.
If KAS clears $0.0501 the next leg opens, while $0.0386 is the floor, but for a triple digit multiple the best crypto presale is the better bet.
SUI
SUI trades at $1.24 on CoinMarketCap on October 5, up 6.67% in 24 hours with a $5.14 billion market cap, yet still 14% above a week ago after testnet v1.80.1 shipped Protocol 137 on September 24 and a 13% jump on September 25 wiped $200,000 of shorts.
Move contracts and a growing DeFi base hold up, but doubling SUI needs billions of new dollars, while a token under one cent turns the same money into a far bigger gain.
Closing view
Kaspa and SUI have real tech, but much of their ceiling is already in the price, so the best crypto presale on offer now is Pepeto, with three running products, staking, and a listing that draws nearer each stage.
As a top presale that could reach 1000x once the broad market notices, staking makes buying early worth more, since rewards claimed at listing land on top of tokens bought at today’s price.
Click To Visit Pepeto Website To Enter The Presale
FAQ Which crypto presale should I buy right now?
Pepeto is the presale worth buying right now because its exchange, bridge and scanner already run during the presale, an edge almost no early stage project offers.
Are low cap presales risky?
Low cap presales are risky, but Pepeto cuts that risk with a SolidProof audit and KYC, live tools, and a cofounder who built the original Pepe coin.
How do I judge the best crypto presale projects?
The best crypto presale projects are judged on live products, an audit and a clear team, and Pepeto has all three plus a former Binance expert.
DISCLAIMER: CAPTAINALTCOIN DOES NOT ENDORSE INVESTING IN ANY PROJECT (CRYPTO OR CASINO) MENTIONED IN SPONSORED ARTICLES. EXERCISE CAUTION AND DO THOROUGH RESEARCH BEFORE INVESTING YOUR MONEY. CaptainAltcoin takes no responsibility for its accuracy or quality. This content was not written by CaptainAltcoin’s team. We strongly advise readers to do their own thorough research before interacting with any featured companies. The information provided is not financial or legal advice. Neither CaptainAltcoin nor any third party recommends buying or selling any financial products. Investing in crypto assets is high-risk; consider the potential for loss. Any investment decisions made based on this content are at the sole risk of the readCaptainAltcoin is not liable for any damages or losses from using or relying on this content.
The post Best Crypto Presale: 1000x Opportunity in Pepeto This October, Racing Toward Listing as Kaspa Cools and SUI Fights to Hold $1 appeared first on CaptainAltcoin.
Best Crypto Presale: 1000x Opportunity in Pepeto This October, Racing Toward Listing As Kaspa Coo...
US spot Bitcoin ETFs pulled in $2.4 billion in the week to September 25, their biggest week since October 2025, per The Block, so big money is putting cash to work early this autumn.
Early buyers are doing the same, but few presale tokens come with tools people can use today, which sets Pepeto apart as the best crypto presale this October for anyone after the 1000x move analysts project at listing.
What its tools do, how far the raise has come and why the stage timer matters are laid out below, with Kaspa and SUI for comparison.
Bitcoin ETFs post their strongest week in a year, and the odds still favor early buyers
The $2.4 billion that went into spot Bitcoin ETFs in one week flipped their year to date total back to positive, and IBIT alone took in $1.2 billion of it, so the largest firms in finance are adding Bitcoin again.
Bitcoin sits at $83,975 on CoinMarketCap at 16:20 UTC on October 5, up 1.1% in 24 hours, so anyone who bought the September 19 low near $81,200 is ahead, but a small coin bought at the right moment pays far more for the same move.
The same logic holds for today’s top presales, since a low cap token has room that a $1.6 trillion asset does not, yet the best crypto presales also need a real product behind that run.
Why Pepeto is the best crypto presale for a 1000x run, with Kaspa and SUI for comparison
Pepeto
Pepeto who is considered the best crypto presale, is not a prototype and not a promise, because all three tools are live and serving users now, a record that has pulled in more than $11.1 million from over 43,000 holders, with each stage closing on a timer and the next priced higher.
PepetoSwap takes no protocol fee, 0.00%, so a $1,000 trade costs $0 against $3 on Uniswap and $2.50 on PancakeSwap. Market, limit and DCA orders are supported, MEV protection is on by default, and $50 million of daily volume has run through it.
The bridge connects Ethereum, BNB Chain, Solana, Base and Arbitrum, and a transfer costs $0 and finishes in under 60 seconds through lock and mint with the proof verified on chain, so a failed transfer simply reverts.
The scanner puts every contract through 42 static detectors plus a test buy and sell on a forked chain, ends with a score out of 100, and stops any trade with a critical finding, which is how one real scan came back 6, a honeypot, and the trade never went through.
Staking adds to the case, since holders earn 162% APY, a rate set by the reward allocation and the amount staked, refreshed daily and not guaranteed, claimable at listing. At the stage price of $0.0000001898, a buyer today gets a running product before the price catches up.
If the largest funds on earth will add $2.4 billion of Bitcoin in a week, a small stake in a live, SolidProof audited platform looks worth it, and analysts project 1000x once listing lands.
Kaspa
Kaspa trades at $0.0468 on CoinMarketCap on October 5, up 0.5% in 24 hours with a $1.3 billion market cap, and it is 21% above a week ago because two things moved it: a September 22 node release hardened the network against spam, and on September 26 Bayit Development said it will take KAS for two Miami townhomes, per CaptainAltcoin.
If KAS clears $0.0501 the next leg opens, while $0.0386 is the floor, but for a triple digit multiple the best crypto presale is the better bet.
SUI
SUI trades at $1.24 on CoinMarketCap on October 5, up 6.67% in 24 hours with a $5.14 billion market cap, yet still 14% above a week ago after testnet v1.80.1 shipped Protocol 137 on September 24 and a 13% jump on September 25 wiped $200,000 of shorts.
Move contracts and a growing DeFi base hold up, but doubling SUI needs billions of new dollars, while a token under one cent turns the same money into a far bigger gain.
Closing view
Kaspa and SUI have real tech, but much of their ceiling is already in the price, so the best crypto presale on offer now is Pepeto, with three running products, staking, and a listing that draws nearer each stage.
As a top presale that could reach 1000x once the broad market notices, staking makes buying early worth more, since rewards claimed at listing land on top of tokens bought at today’s price.
Click To Visit Pepeto Website To Enter The Presale
FAQ Which crypto presale should I buy right now?
Pepeto is the presale worth buying right now because its exchange, bridge and scanner already run during the presale, an edge almost no early stage project offers.
Are low cap presales risky?
Low cap presales are risky, but Pepeto cuts that risk with a SolidProof audit and KYC, live tools, and a cofounder who built the original Pepe coin.
How do I judge the best crypto presale projects?
The best crypto presale projects are judged on live products, an audit and a clear team, and Pepeto has all three plus a former Binance expert.
DISCLAIMER: CAPTAINALTCOIN DOES NOT ENDORSE INVESTING IN ANY PROJECT (CRYPTO OR CASINO) MENTIONED IN SPONSORED ARTICLES. EXERCISE CAUTION AND DO THOROUGH RESEARCH BEFORE INVESTING YOUR MONEY. CaptainAltcoin takes no responsibility for its accuracy or quality. This content was not written by CaptainAltcoin’s team. We strongly advise readers to do their own thorough research before interacting with any featured companies. The information provided is not financial or legal advice. Neither CaptainAltcoin nor any third party recommends buying or selling any financial products. Investing in crypto assets is high-risk; consider the potential for loss. Any investment decisions made based on this content are at the sole risk of the readCaptainAltcoin is not liable for any damages or losses from using or relying on this content.
The post Best Crypto Presale: 1000x Opportunity in Pepeto This October, Racing Toward Listing as Kaspa Cools and SUI Fights to Hold $1 appeared first on CaptainAltcoin.
Early buyers are doing the same, but few presale tokens come with tools people can use today, which sets Pepeto apart as the best crypto presale this October for anyone after the 1000x move analysts project at listing.
What its tools do, how far the raise has come and why the stage timer matters are laid out below, with Kaspa and SUI for comparison.
Bitcoin ETFs post their strongest week in a year, and the odds still favor early buyers
The $2.4 billion that went into spot Bitcoin ETFs in one week flipped their year to date total back to positive, and IBIT alone took in $1.2 billion of it, so the largest firms in finance are adding Bitcoin again.
Bitcoin sits at $83,975 on CoinMarketCap at 16:20 UTC on October 5, up 1.1% in 24 hours, so anyone who bought the September 19 low near $81,200 is ahead, but a small coin bought at the right moment pays far more for the same move.
The same logic holds for today’s top presales, since a low cap token has room that a $1.6 trillion asset does not, yet the best crypto presales also need a real product behind that run.
Why Pepeto is the best crypto presale for a 1000x run, with Kaspa and SUI for comparison
Pepeto
Pepeto who is considered the best crypto presale, is not a prototype and not a promise, because all three tools are live and serving users now, a record that has pulled in more than $11.1 million from over 43,000 holders, with each stage closing on a timer and the next priced higher.
PepetoSwap takes no protocol fee, 0.00%, so a $1,000 trade costs $0 against $3 on Uniswap and $2.50 on PancakeSwap. Market, limit and DCA orders are supported, MEV protection is on by default, and $50 million of daily volume has run through it.
The bridge connects Ethereum, BNB Chain, Solana, Base and Arbitrum, and a transfer costs $0 and finishes in under 60 seconds through lock and mint with the proof verified on chain, so a failed transfer simply reverts.
The scanner puts every contract through 42 static detectors plus a test buy and sell on a forked chain, ends with a score out of 100, and stops any trade with a critical finding, which is how one real scan came back 6, a honeypot, and the trade never went through.
Staking adds to the case, since holders earn 162% APY, a rate set by the reward allocation and the amount staked, refreshed daily and not guaranteed, claimable at listing. At the stage price of $0.0000001898, a buyer today gets a running product before the price catches up.
If the largest funds on earth will add $2.4 billion of Bitcoin in a week, a small stake in a live, SolidProof audited platform looks worth it, and analysts project 1000x once listing lands.
Kaspa
Kaspa trades at $0.0468 on CoinMarketCap on October 5, up 0.5% in 24 hours with a $1.3 billion market cap, and it is 21% above a week ago because two things moved it: a September 22 node release hardened the network against spam, and on September 26 Bayit Development said it will take KAS for two Miami townhomes, per CaptainAltcoin.
If KAS clears $0.0501 the next leg opens, while $0.0386 is the floor, but for a triple digit multiple the best crypto presale is the better bet.
SUI
SUI trades at $1.24 on CoinMarketCap on October 5, up 6.67% in 24 hours with a $5.14 billion market cap, yet still 14% above a week ago after testnet v1.80.1 shipped Protocol 137 on September 24 and a 13% jump on September 25 wiped $200,000 of shorts.
Move contracts and a growing DeFi base hold up, but doubling SUI needs billions of new dollars, while a token under one cent turns the same money into a far bigger gain.
Closing view
Kaspa and SUI have real tech, but much of their ceiling is already in the price, so the best crypto presale on offer now is Pepeto, with three running products, staking, and a listing that draws nearer each stage.
As a top presale that could reach 1000x once the broad market notices, staking makes buying early worth more, since rewards claimed at listing land on top of tokens bought at today’s price.
Click To Visit Pepeto Website To Enter The Presale
FAQ Which crypto presale should I buy right now?
Pepeto is the presale worth buying right now because its exchange, bridge and scanner already run during the presale, an edge almost no early stage project offers.
Are low cap presales risky?
Low cap presales are risky, but Pepeto cuts that risk with a SolidProof audit and KYC, live tools, and a cofounder who built the original Pepe coin.
How do I judge the best crypto presale projects?
The best crypto presale projects are judged on live products, an audit and a clear team, and Pepeto has all three plus a former Binance expert.
DISCLAIMER: CAPTAINALTCOIN DOES NOT ENDORSE INVESTING IN ANY PROJECT (CRYPTO OR CASINO) MENTIONED IN SPONSORED ARTICLES. EXERCISE CAUTION AND DO THOROUGH RESEARCH BEFORE INVESTING YOUR MONEY. CaptainAltcoin takes no responsibility for its accuracy or quality. This content was not written by CaptainAltcoin’s team. We strongly advise readers to do their own thorough research before interacting with any featured companies. The information provided is not financial or legal advice. Neither CaptainAltcoin nor any third party recommends buying or selling any financial products. Investing in crypto assets is high-risk; consider the potential for loss. Any investment decisions made based on this content are at the sole risk of the readCaptainAltcoin is not liable for any damages or losses from using or relying on this content.
The post Best Crypto Presale: 1000x Opportunity in Pepeto This October, Racing Toward Listing as Kaspa Cools and SUI Fights to Hold $1 appeared first on CaptainAltcoin.
155
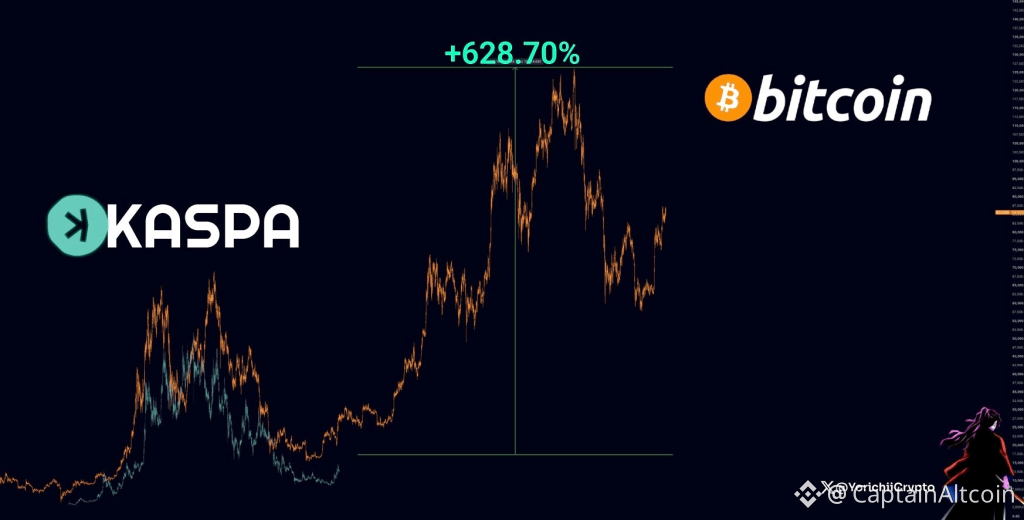
Article
This Kaspa Chart Looks Eerily Similar to Bitcoin Before a 600% RallyKaspa has been one of the stronger altcoins over the past month, with KAS up roughly 50%, and analyst Yoriichi Tsugikuni thinks the current chart may be setting up for something much bigger.
Yoriichi compared Kaspa’s structure with Bitcoin before one of BTC’s major historical advances and argued that the two charts look surprisingly similar.
His point is not that Kaspa will repeat Bitcoin move-for-move, but that the current setup could be following a familiar pattern: a large early run, a long reset, and then another expansion phase.
Yoriichi Predicts a Bitcoin-Like Structure Forming on KAS
The chart overlays an earlier Kaspa cycle with Bitcoin’s historical price structure.
The similarity comes from the broad sequence.
Both charts show:
an initial strong expansion,
a major correction,
a long period of rebuilding,
and then a renewed move higher from a depressed base.
The Bitcoin portion of the chart marks a move of about 628% from the lower range into the next major peak.
Yoriichi is essentially asking whether Kaspa could now be approaching the same part of the cycle.
Source: X/@YorichiiCrypto
That would be a huge move if it played out.
Still, this type of comparison is best treated as a fractal, not a forecast. Markets rarely repeat perfectly, and Kaspa’s liquidity, adoption, market cap, and investor base are very different from Bitcoin’s at the time of that historical move.
Why the Setup Is Getting More Attention Now
The timing of Yoriichi’s post is interesting because Kaspa’s network has changed significantly in recent months.
The recent Tokata hard fork added a new programmability layer through:
programmable UTXOs,
covenants,
native zero-knowledge verification.
That moves Kaspa further away from being viewed only as a fast Proof-of-Work payments network.
The bigger ambition now is to become a programmable base layer where developers can build more advanced applications directly on the network.
That gives the current price move a stronger fundamental story than KAS had during some earlier rallies.
Read also: How High Can Kaspa (KAS) Price Go in October
Silverscript Opens the Door to More Applications
Another important development came with the release of Silverscript 1.0 in September.
The tooling allows developers to build things such as vaults and escrow systems, which gives Kaspa more practical programmability.
That is important because one of the biggest questions around Kaspa has always been whether its technical architecture can translate into actual applications and user activity.
Tokata and Silverscript bring the network closer to that point.
The technology is now more capable.
The next step is proving that developers and users actually show up.
The Main Problem: Usage Has Not Caught Up Yet
This is the biggest weakness in the bullish case.
Kaspa’s technology has improved quickly, but network activity has not yet expanded at the same pace.
That creates a disconnect between what the network can now do and what people are actually doing with it.
For KAS to sustain a much larger valuation, the market will probably want to see more than upgrades and technical potential.
It will need stronger application activity, more users, deeper liquidity, and clear demand for the new programmable features.
That is why the next phase of Kaspa’s development may be more important than the hard fork itself.
Could KAS Reach $0.50?
The recent price recovery has brought $0.50 back into the conversation as a larger upside target.
A move there would still be substantial from current levels, but it is far less extreme than directly projecting Bitcoin’s full 600% historical run onto Kaspa.
The $0.50 area makes sense as an important test because it would show that the market is assigning a much higher value to Kaspa’s new programmable direction.
Beyond that, a Bitcoin-like move would need much stronger confirmation from both price and network growth.
Kaspa Price Outlook
Yoriichi’s chart is certainly interesting.
The structural similarity with Bitcoin is visible, especially when looking at the broader cycle rather than individual candles.
But the strongest part of Kaspa’s current story may be what is happening underneath the chart.
Tokata has expanded what developers can build. Silverscript has added useful tools. KAS has already risen around 50% in a month.
Now the network needs usage to follow.
If activity starts catching up with the technological progress, the Bitcoin comparison will become much more interesting.
For more crypto news and price predictions, click here.
Subscribe to our YouTube channel for daily crypto updates, market insights, and expert analysis.
The post This Kaspa Chart Looks Eerily Similar to Bitcoin Before a 600% Rally appeared first on CaptainAltcoin.
This Kaspa Chart Looks Eerily Similar to Bitcoin Before a 600% Rally
Kaspa has been one of the stronger altcoins over the past month, with KAS up roughly 50%, and analyst Yoriichi Tsugikuni thinks the current chart may be setting up for something much bigger.
Yoriichi compared Kaspa’s structure with Bitcoin before one of BTC’s major historical advances and argued that the two charts look surprisingly similar.
His point is not that Kaspa will repeat Bitcoin move-for-move, but that the current setup could be following a familiar pattern: a large early run, a long reset, and then another expansion phase.
Yoriichi Predicts a Bitcoin-Like Structure Forming on KAS
The chart overlays an earlier Kaspa cycle with Bitcoin’s historical price structure.
The similarity comes from the broad sequence.
Both charts show:
an initial strong expansion,
a major correction,
a long period of rebuilding,
and then a renewed move higher from a depressed base.
The Bitcoin portion of the chart marks a move of about 628% from the lower range into the next major peak.
Yoriichi is essentially asking whether Kaspa could now be approaching the same part of the cycle.
Source: X/@YorichiiCrypto
That would be a huge move if it played out.
Still, this type of comparison is best treated as a fractal, not a forecast. Markets rarely repeat perfectly, and Kaspa’s liquidity, adoption, market cap, and investor base are very different from Bitcoin’s at the time of that historical move.
Why the Setup Is Getting More Attention Now
The timing of Yoriichi’s post is interesting because Kaspa’s network has changed significantly in recent months.
The recent Tokata hard fork added a new programmability layer through:
programmable UTXOs,
covenants,
native zero-knowledge verification.
That moves Kaspa further away from being viewed only as a fast Proof-of-Work payments network.
The bigger ambition now is to become a programmable base layer where developers can build more advanced applications directly on the network.
That gives the current price move a stronger fundamental story than KAS had during some earlier rallies.
Read also: How High Can Kaspa (KAS) Price Go in October
Silverscript Opens the Door to More Applications
Another important development came with the release of Silverscript 1.0 in September.
The tooling allows developers to build things such as vaults and escrow systems, which gives Kaspa more practical programmability.
That is important because one of the biggest questions around Kaspa has always been whether its technical architecture can translate into actual applications and user activity.
Tokata and Silverscript bring the network closer to that point.
The technology is now more capable.
The next step is proving that developers and users actually show up.
The Main Problem: Usage Has Not Caught Up Yet
This is the biggest weakness in the bullish case.
Kaspa’s technology has improved quickly, but network activity has not yet expanded at the same pace.
That creates a disconnect between what the network can now do and what people are actually doing with it.
For KAS to sustain a much larger valuation, the market will probably want to see more than upgrades and technical potential.
It will need stronger application activity, more users, deeper liquidity, and clear demand for the new programmable features.
That is why the next phase of Kaspa’s development may be more important than the hard fork itself.
Could KAS Reach $0.50?
The recent price recovery has brought $0.50 back into the conversation as a larger upside target.
A move there would still be substantial from current levels, but it is far less extreme than directly projecting Bitcoin’s full 600% historical run onto Kaspa.
The $0.50 area makes sense as an important test because it would show that the market is assigning a much higher value to Kaspa’s new programmable direction.
Beyond that, a Bitcoin-like move would need much stronger confirmation from both price and network growth.
Kaspa Price Outlook
Yoriichi’s chart is certainly interesting.
The structural similarity with Bitcoin is visible, especially when looking at the broader cycle rather than individual candles.
But the strongest part of Kaspa’s current story may be what is happening underneath the chart.
Tokata has expanded what developers can build. Silverscript has added useful tools. KAS has already risen around 50% in a month.
Now the network needs usage to follow.
If activity starts catching up with the technological progress, the Bitcoin comparison will become much more interesting.
For more crypto news and price predictions, click here.
Subscribe to our YouTube channel for daily crypto updates, market insights, and expert analysis.
The post This Kaspa Chart Looks Eerily Similar to Bitcoin Before a 600% Rally appeared first on CaptainAltcoin.
Yoriichi compared Kaspa’s structure with Bitcoin before one of BTC’s major historical advances and argued that the two charts look surprisingly similar.
His point is not that Kaspa will repeat Bitcoin move-for-move, but that the current setup could be following a familiar pattern: a large early run, a long reset, and then another expansion phase.
Yoriichi Predicts a Bitcoin-Like Structure Forming on KAS
The chart overlays an earlier Kaspa cycle with Bitcoin’s historical price structure.
The similarity comes from the broad sequence.
Both charts show:
an initial strong expansion,
a major correction,
a long period of rebuilding,
and then a renewed move higher from a depressed base.
The Bitcoin portion of the chart marks a move of about 628% from the lower range into the next major peak.
Yoriichi is essentially asking whether Kaspa could now be approaching the same part of the cycle.
Source: X/@YorichiiCrypto
That would be a huge move if it played out.
Still, this type of comparison is best treated as a fractal, not a forecast. Markets rarely repeat perfectly, and Kaspa’s liquidity, adoption, market cap, and investor base are very different from Bitcoin’s at the time of that historical move.
Why the Setup Is Getting More Attention Now
The timing of Yoriichi’s post is interesting because Kaspa’s network has changed significantly in recent months.
The recent Tokata hard fork added a new programmability layer through:
programmable UTXOs,
covenants,
native zero-knowledge verification.
That moves Kaspa further away from being viewed only as a fast Proof-of-Work payments network.
The bigger ambition now is to become a programmable base layer where developers can build more advanced applications directly on the network.
That gives the current price move a stronger fundamental story than KAS had during some earlier rallies.
Read also: How High Can Kaspa (KAS) Price Go in October
Silverscript Opens the Door to More Applications
Another important development came with the release of Silverscript 1.0 in September.
The tooling allows developers to build things such as vaults and escrow systems, which gives Kaspa more practical programmability.
That is important because one of the biggest questions around Kaspa has always been whether its technical architecture can translate into actual applications and user activity.
Tokata and Silverscript bring the network closer to that point.
The technology is now more capable.
The next step is proving that developers and users actually show up.
The Main Problem: Usage Has Not Caught Up Yet
This is the biggest weakness in the bullish case.
Kaspa’s technology has improved quickly, but network activity has not yet expanded at the same pace.
That creates a disconnect between what the network can now do and what people are actually doing with it.
For KAS to sustain a much larger valuation, the market will probably want to see more than upgrades and technical potential.
It will need stronger application activity, more users, deeper liquidity, and clear demand for the new programmable features.
That is why the next phase of Kaspa’s development may be more important than the hard fork itself.
Could KAS Reach $0.50?
The recent price recovery has brought $0.50 back into the conversation as a larger upside target.
A move there would still be substantial from current levels, but it is far less extreme than directly projecting Bitcoin’s full 600% historical run onto Kaspa.
The $0.50 area makes sense as an important test because it would show that the market is assigning a much higher value to Kaspa’s new programmable direction.
Beyond that, a Bitcoin-like move would need much stronger confirmation from both price and network growth.
Kaspa Price Outlook
Yoriichi’s chart is certainly interesting.
The structural similarity with Bitcoin is visible, especially when looking at the broader cycle rather than individual candles.
But the strongest part of Kaspa’s current story may be what is happening underneath the chart.
Tokata has expanded what developers can build. Silverscript has added useful tools. KAS has already risen around 50% in a month.
Now the network needs usage to follow.
If activity starts catching up with the technological progress, the Bitcoin comparison will become much more interesting.
For more crypto news and price predictions, click here.
Subscribe to our YouTube channel for daily crypto updates, market insights, and expert analysis.
The post This Kaspa Chart Looks Eerily Similar to Bitcoin Before a 600% Rally appeared first on CaptainAltcoin.
1
167
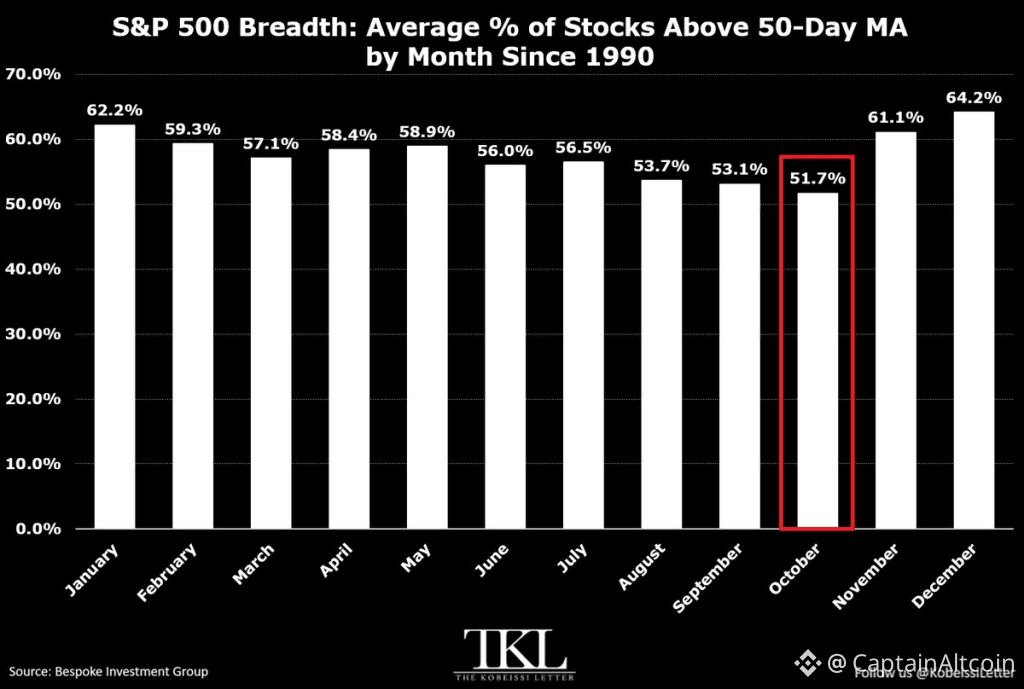
Article
S&P 500 Price Prediction: History Points Higher, but October Breadth Is Flashing a WarningThe S&P 500 is entering a seasonally important stretch with two very different historical signals pulling in opposite directions.
On one side, Bull Theory points to a powerful post-midterm election pattern: the S&P 500 has historically performed very well in the 12 months following U.S. midterm elections.
On the other side, The Kobeissi Letter notes that October has historically had the weakest market breadth of any month since 1990, and current breadth is even weaker than the long-term average.
That creates an interesting setup. The long-term cycle argues for a stronger market over the next year, but the short-term internals still look fragile.
The Post-Midterm Pattern Is Extremely Strong
Bull Theory’s main point is that the year following a U.S. midterm election has historically been one of the strongest periods for the S&P 500.
Since 1950, the index has finished higher over the following 12 months after every midterm election in the dataset.
A separate historical sample going back to 1942 shows the same result for the November-to-June period after midterms: 21 positive outcomes out of 21.
The broader presidential cycle also supports that view.
Year 3 of the four-year presidential cycle has historically been the strongest year, with Fidelity data from 1961 to 2024 putting the average return at around 18.7%.
The reasoning is partly about uncertainty.
HISTORY SAYS THE NEXT 12 MONTHS COULD BE VERY BULLISH FOR S&P500 Since 1950, the S&P 500 has gone up in the 12 months after every single US midterm election. A separate dataset going back to 1942 finds the same thing in the November to June window after a midterm: 21 for 21, also positive every time. Year 3 of the presidential cycle, the year right after the midterm, has also historically been the strongest year of the entire 4-year cycle. Fidelity’s 1961-2024 data puts the average at 18.7%. Here’s why this keeps happening. Before an election, markets have to price every possible outcome at once: who controls Congress, which taxes get cut or raised, which regulations pass or die. Nobody can commit real money when 5 different futures are still live. That’s why midterm years are historically the weakest part of the 4-year cycle, averaging just 3.8% from 1945 to 2025, compared to 10.9% in the other three years, with an 18% average drawdown along the way. Once the result is locked in, that entire range of outcomes collapses into one. Markets don’t need the winner to be market friendly. They just need the unknown removed, and removing the unknown alone lowers the risk premium investors demand to hold stocks. This pattern has survived completely different crises, for completely different reasons, every single cycle: After the 2010 midterms, the US was still digging out of the financial crisis. The Fed launched $600 billion of QE2, buying long term Treasuries to push yields down and force money into riskier assets. It worked, until 2011, when the US debt ceiling standoff led to the first-ever downgrade of US credit, and Europe’s sovereign debt crisis exploded at the same time. The S&P fell almost 19% at its worst point that year. It still finished the year positive. After the 2014 midterms, the US economy and labor market looked fine, but oil prices collapsed and the dollar spiked, gutting earnings across the entire energy sector. Then in 2015, China devalued its currency and its economy slowed sharply, triggering a global risk off panic, right as the Fed prepared its first rate hike since 2006. The S&P barely survived, finishing up just 3%, the weakest year in the entire 76 year record. But It still didn’t break the streak. After the 2018 midterms, the Fed had hiked rates 4 times that year and was still shrinking its balance sheet. Trade war fears with China pushed the S&P to the edge of a bear market by Christmas Eve. Then Fed Chair Powell reversed course in early 2019, signaled patience, stopped hiking, and eventually cut rates 3 times. Big tech earnings stayed strong and the US and China moved toward a trade truce. The S&P went on to gain nearly 29% that calendar year. After the 2022 midterms, inflation had just peaked at 9.1%, the Fed was still raising rates, and most of Wall Street was calling for a recession. A cooler than expected inflation report landed right after Election Day, convincing investors the Fed was close to done hiking. Stocks can explode while a central bank is still raising rates, because markets price where policy is heading, not where it sits today. Through 2023, the expected recession never came, the Fed slowed down then paused, and a generative AI boom sent Nvidia and the rest of mega cap tech into one of the biggest rallies in years. Four different decades. Four completely different crises, a debt downgrade, an oil crash, a trade war, and the fastest rate-hiking cycle in 40 years. The S&P 500 closed positive after every single one.
— Bull Theory (@BullTheoryio) October 5, 2026
Before an election, markets have to price several possible outcomes at once: control of Congress, tax policy, spending plans, regulation, and fiscal policy.
Once the election is over, investors have more clarity.
The result does not have to be ideal for stocks. Removing uncertainty alone can reduce the risk premium investors demand.
History Shows the Pattern Can Survive Very Difficult Conditions
Bull Theory also points out that this post-midterm strength has appeared through very different market environments.
After the 2010 midterms, the U.S. was still recovering from the financial crisis and later faced the 2011 debt ceiling crisis and the first downgrade of U.S. sovereign credit.
After the 2014 midterms, oil prices collapsed, the dollar strengthened, and China’s slowdown created a major risk-off episode.
After the 2018 midterms, markets were dealing with Fed tightening and the U.S.-China trade war.
After the 2022 midterms, inflation was still high and the Fed was in the middle of its fastest tightening cycle in decades.
Yet the S&P 500 still ended up positive over the following post-midterm periods.
That is why the historical pattern continues to attract attention.
October Breadth Is a Major Short-Term Problem
The Kobeissi Letter’s data paints a very different picture for the current month.
Source: X/@KobeissiLetter
Since 1990, October has had the weakest average market breadth of any month, with only 51.7% of S&P 500 stocks trading above their 50-day moving average.
September is only slightly better at 53.1%.
By comparison, breadth improves substantially later in the year:
November: 61.1%
December: 64.2%
January: 62.2%
The chart makes that seasonal pattern clear.
October stands out as the weakest month, followed by a strong improvement in November and December.
Current Breadth Is Much Worse Than Normal
The bigger concern is that present market breadth is not simply weak by historical standards.
It is extremely weak.
Only about 21.4% of S&P 500 stocks are currently trading above their 50-day moving average, down from roughly 70% in mid-August.
That is far below October’s already weak historical average of 51.7%.
There is another warning sign too: new 52-week lows have outnumbered new highs for 14 consecutive trading days.
That tells us the index may be holding up better than the average stock.
In other words, a relatively small group of large companies may be doing much of the work.
That kind of narrow leadership can continue for some time, but it makes the market more vulnerable if those leaders start losing momentum.
S&P 500 Price Outlook
The two signals can actually fit together.
The short-term setup still looks weak because breadth is poor and October has historically been a difficult month for participation.
That could mean more volatility or another pullback before the market finds a stronger base.
But the longer-term post-midterm pattern remains constructive.
If history repeats again, the weakness in October could end up being part of a transition into a stronger November-to-2027 period.
The key thing to watch is breadth.
If the percentage of stocks above their 50-day moving average starts recovering from the current 21.4% area and moves back toward 50% or higher, that would show the rally is becoming broader and healthier.
If breadth stays depressed and new lows continue dominating, the index could remain vulnerable even if the headline S&P 500 level looks stable.
For more financial news and price predictions, click here.
Subscribe to our YouTube channel for daily crypto updates, market insights, and expert analysis.
The post S&P 500 Price Prediction: History Points Higher, But October Breadth Is Flashing a Warning appeared first on CaptainAltcoin.
S&P 500 Price Prediction: History Points Higher, but October Breadth Is Flashing a Warning
The S&P 500 is entering a seasonally important stretch with two very different historical signals pulling in opposite directions.
On one side, Bull Theory points to a powerful post-midterm election pattern: the S&P 500 has historically performed very well in the 12 months following U.S. midterm elections.
On the other side, The Kobeissi Letter notes that October has historically had the weakest market breadth of any month since 1990, and current breadth is even weaker than the long-term average.
That creates an interesting setup. The long-term cycle argues for a stronger market over the next year, but the short-term internals still look fragile.
The Post-Midterm Pattern Is Extremely Strong
Bull Theory’s main point is that the year following a U.S. midterm election has historically been one of the strongest periods for the S&P 500.
Since 1950, the index has finished higher over the following 12 months after every midterm election in the dataset.
A separate historical sample going back to 1942 shows the same result for the November-to-June period after midterms: 21 positive outcomes out of 21.
The broader presidential cycle also supports that view.
Year 3 of the four-year presidential cycle has historically been the strongest year, with Fidelity data from 1961 to 2024 putting the average return at around 18.7%.
The reasoning is partly about uncertainty.
HISTORY SAYS THE NEXT 12 MONTHS COULD BE VERY BULLISH FOR S&P500 Since 1950, the S&P 500 has gone up in the 12 months after every single US midterm election. A separate dataset going back to 1942 finds the same thing in the November to June window after a midterm: 21 for 21, also positive every time. Year 3 of the presidential cycle, the year right after the midterm, has also historically been the strongest year of the entire 4-year cycle. Fidelity’s 1961-2024 data puts the average at 18.7%. Here’s why this keeps happening. Before an election, markets have to price every possible outcome at once: who controls Congress, which taxes get cut or raised, which regulations pass or die. Nobody can commit real money when 5 different futures are still live. That’s why midterm years are historically the weakest part of the 4-year cycle, averaging just 3.8% from 1945 to 2025, compared to 10.9% in the other three years, with an 18% average drawdown along the way. Once the result is locked in, that entire range of outcomes collapses into one. Markets don’t need the winner to be market friendly. They just need the unknown removed, and removing the unknown alone lowers the risk premium investors demand to hold stocks. This pattern has survived completely different crises, for completely different reasons, every single cycle: After the 2010 midterms, the US was still digging out of the financial crisis. The Fed launched $600 billion of QE2, buying long term Treasuries to push yields down and force money into riskier assets. It worked, until 2011, when the US debt ceiling standoff led to the first-ever downgrade of US credit, and Europe’s sovereign debt crisis exploded at the same time. The S&P fell almost 19% at its worst point that year. It still finished the year positive. After the 2014 midterms, the US economy and labor market looked fine, but oil prices collapsed and the dollar spiked, gutting earnings across the entire energy sector. Then in 2015, China devalued its currency and its economy slowed sharply, triggering a global risk off panic, right as the Fed prepared its first rate hike since 2006. The S&P barely survived, finishing up just 3%, the weakest year in the entire 76 year record. But It still didn’t break the streak. After the 2018 midterms, the Fed had hiked rates 4 times that year and was still shrinking its balance sheet. Trade war fears with China pushed the S&P to the edge of a bear market by Christmas Eve. Then Fed Chair Powell reversed course in early 2019, signaled patience, stopped hiking, and eventually cut rates 3 times. Big tech earnings stayed strong and the US and China moved toward a trade truce. The S&P went on to gain nearly 29% that calendar year. After the 2022 midterms, inflation had just peaked at 9.1%, the Fed was still raising rates, and most of Wall Street was calling for a recession. A cooler than expected inflation report landed right after Election Day, convincing investors the Fed was close to done hiking. Stocks can explode while a central bank is still raising rates, because markets price where policy is heading, not where it sits today. Through 2023, the expected recession never came, the Fed slowed down then paused, and a generative AI boom sent Nvidia and the rest of mega cap tech into one of the biggest rallies in years. Four different decades. Four completely different crises, a debt downgrade, an oil crash, a trade war, and the fastest rate-hiking cycle in 40 years. The S&P 500 closed positive after every single one.
— Bull Theory (@BullTheoryio) October 5, 2026
Before an election, markets have to price several possible outcomes at once: control of Congress, tax policy, spending plans, regulation, and fiscal policy.
Once the election is over, investors have more clarity.
The result does not have to be ideal for stocks. Removing uncertainty alone can reduce the risk premium investors demand.
History Shows the Pattern Can Survive Very Difficult Conditions
Bull Theory also points out that this post-midterm strength has appeared through very different market environments.
After the 2010 midterms, the U.S. was still recovering from the financial crisis and later faced the 2011 debt ceiling crisis and the first downgrade of U.S. sovereign credit.
After the 2014 midterms, oil prices collapsed, the dollar strengthened, and China’s slowdown created a major risk-off episode.
After the 2018 midterms, markets were dealing with Fed tightening and the U.S.-China trade war.
After the 2022 midterms, inflation was still high and the Fed was in the middle of its fastest tightening cycle in decades.
Yet the S&P 500 still ended up positive over the following post-midterm periods.
That is why the historical pattern continues to attract attention.
October Breadth Is a Major Short-Term Problem
The Kobeissi Letter’s data paints a very different picture for the current month.
Source: X/@KobeissiLetter
Since 1990, October has had the weakest average market breadth of any month, with only 51.7% of S&P 500 stocks trading above their 50-day moving average.
September is only slightly better at 53.1%.
By comparison, breadth improves substantially later in the year:
November: 61.1%
December: 64.2%
January: 62.2%
The chart makes that seasonal pattern clear.
October stands out as the weakest month, followed by a strong improvement in November and December.
Current Breadth Is Much Worse Than Normal
The bigger concern is that present market breadth is not simply weak by historical standards.
It is extremely weak.
Only about 21.4% of S&P 500 stocks are currently trading above their 50-day moving average, down from roughly 70% in mid-August.
That is far below October’s already weak historical average of 51.7%.
There is another warning sign too: new 52-week lows have outnumbered new highs for 14 consecutive trading days.
That tells us the index may be holding up better than the average stock.
In other words, a relatively small group of large companies may be doing much of the work.
That kind of narrow leadership can continue for some time, but it makes the market more vulnerable if those leaders start losing momentum.
S&P 500 Price Outlook
The two signals can actually fit together.
The short-term setup still looks weak because breadth is poor and October has historically been a difficult month for participation.
That could mean more volatility or another pullback before the market finds a stronger base.
But the longer-term post-midterm pattern remains constructive.
If history repeats again, the weakness in October could end up being part of a transition into a stronger November-to-2027 period.
The key thing to watch is breadth.
If the percentage of stocks above their 50-day moving average starts recovering from the current 21.4% area and moves back toward 50% or higher, that would show the rally is becoming broader and healthier.
If breadth stays depressed and new lows continue dominating, the index could remain vulnerable even if the headline S&P 500 level looks stable.
For more financial news and price predictions, click here.
Subscribe to our YouTube channel for daily crypto updates, market insights, and expert analysis.
The post S&P 500 Price Prediction: History Points Higher, But October Breadth Is Flashing a Warning appeared first on CaptainAltcoin.
On one side, Bull Theory points to a powerful post-midterm election pattern: the S&P 500 has historically performed very well in the 12 months following U.S. midterm elections.
On the other side, The Kobeissi Letter notes that October has historically had the weakest market breadth of any month since 1990, and current breadth is even weaker than the long-term average.
That creates an interesting setup. The long-term cycle argues for a stronger market over the next year, but the short-term internals still look fragile.
The Post-Midterm Pattern Is Extremely Strong
Bull Theory’s main point is that the year following a U.S. midterm election has historically been one of the strongest periods for the S&P 500.
Since 1950, the index has finished higher over the following 12 months after every midterm election in the dataset.
A separate historical sample going back to 1942 shows the same result for the November-to-June period after midterms: 21 positive outcomes out of 21.
The broader presidential cycle also supports that view.
Year 3 of the four-year presidential cycle has historically been the strongest year, with Fidelity data from 1961 to 2024 putting the average return at around 18.7%.
The reasoning is partly about uncertainty.
HISTORY SAYS THE NEXT 12 MONTHS COULD BE VERY BULLISH FOR S&P500 Since 1950, the S&P 500 has gone up in the 12 months after every single US midterm election. A separate dataset going back to 1942 finds the same thing in the November to June window after a midterm: 21 for 21, also positive every time. Year 3 of the presidential cycle, the year right after the midterm, has also historically been the strongest year of the entire 4-year cycle. Fidelity’s 1961-2024 data puts the average at 18.7%. Here’s why this keeps happening. Before an election, markets have to price every possible outcome at once: who controls Congress, which taxes get cut or raised, which regulations pass or die. Nobody can commit real money when 5 different futures are still live. That’s why midterm years are historically the weakest part of the 4-year cycle, averaging just 3.8% from 1945 to 2025, compared to 10.9% in the other three years, with an 18% average drawdown along the way. Once the result is locked in, that entire range of outcomes collapses into one. Markets don’t need the winner to be market friendly. They just need the unknown removed, and removing the unknown alone lowers the risk premium investors demand to hold stocks. This pattern has survived completely different crises, for completely different reasons, every single cycle: After the 2010 midterms, the US was still digging out of the financial crisis. The Fed launched $600 billion of QE2, buying long term Treasuries to push yields down and force money into riskier assets. It worked, until 2011, when the US debt ceiling standoff led to the first-ever downgrade of US credit, and Europe’s sovereign debt crisis exploded at the same time. The S&P fell almost 19% at its worst point that year. It still finished the year positive. After the 2014 midterms, the US economy and labor market looked fine, but oil prices collapsed and the dollar spiked, gutting earnings across the entire energy sector. Then in 2015, China devalued its currency and its economy slowed sharply, triggering a global risk off panic, right as the Fed prepared its first rate hike since 2006. The S&P barely survived, finishing up just 3%, the weakest year in the entire 76 year record. But It still didn’t break the streak. After the 2018 midterms, the Fed had hiked rates 4 times that year and was still shrinking its balance sheet. Trade war fears with China pushed the S&P to the edge of a bear market by Christmas Eve. Then Fed Chair Powell reversed course in early 2019, signaled patience, stopped hiking, and eventually cut rates 3 times. Big tech earnings stayed strong and the US and China moved toward a trade truce. The S&P went on to gain nearly 29% that calendar year. After the 2022 midterms, inflation had just peaked at 9.1%, the Fed was still raising rates, and most of Wall Street was calling for a recession. A cooler than expected inflation report landed right after Election Day, convincing investors the Fed was close to done hiking. Stocks can explode while a central bank is still raising rates, because markets price where policy is heading, not where it sits today. Through 2023, the expected recession never came, the Fed slowed down then paused, and a generative AI boom sent Nvidia and the rest of mega cap tech into one of the biggest rallies in years. Four different decades. Four completely different crises, a debt downgrade, an oil crash, a trade war, and the fastest rate-hiking cycle in 40 years. The S&P 500 closed positive after every single one.
— Bull Theory (@BullTheoryio) October 5, 2026
Before an election, markets have to price several possible outcomes at once: control of Congress, tax policy, spending plans, regulation, and fiscal policy.
Once the election is over, investors have more clarity.
The result does not have to be ideal for stocks. Removing uncertainty alone can reduce the risk premium investors demand.
History Shows the Pattern Can Survive Very Difficult Conditions
Bull Theory also points out that this post-midterm strength has appeared through very different market environments.
After the 2010 midterms, the U.S. was still recovering from the financial crisis and later faced the 2011 debt ceiling crisis and the first downgrade of U.S. sovereign credit.
After the 2014 midterms, oil prices collapsed, the dollar strengthened, and China’s slowdown created a major risk-off episode.
After the 2018 midterms, markets were dealing with Fed tightening and the U.S.-China trade war.
After the 2022 midterms, inflation was still high and the Fed was in the middle of its fastest tightening cycle in decades.
Yet the S&P 500 still ended up positive over the following post-midterm periods.
That is why the historical pattern continues to attract attention.
October Breadth Is a Major Short-Term Problem
The Kobeissi Letter’s data paints a very different picture for the current month.
Source: X/@KobeissiLetter
Since 1990, October has had the weakest average market breadth of any month, with only 51.7% of S&P 500 stocks trading above their 50-day moving average.
September is only slightly better at 53.1%.
By comparison, breadth improves substantially later in the year:
November: 61.1%
December: 64.2%
January: 62.2%
The chart makes that seasonal pattern clear.
October stands out as the weakest month, followed by a strong improvement in November and December.
Current Breadth Is Much Worse Than Normal
The bigger concern is that present market breadth is not simply weak by historical standards.
It is extremely weak.
Only about 21.4% of S&P 500 stocks are currently trading above their 50-day moving average, down from roughly 70% in mid-August.
That is far below October’s already weak historical average of 51.7%.
There is another warning sign too: new 52-week lows have outnumbered new highs for 14 consecutive trading days.
That tells us the index may be holding up better than the average stock.
In other words, a relatively small group of large companies may be doing much of the work.
That kind of narrow leadership can continue for some time, but it makes the market more vulnerable if those leaders start losing momentum.
S&P 500 Price Outlook
The two signals can actually fit together.
The short-term setup still looks weak because breadth is poor and October has historically been a difficult month for participation.
That could mean more volatility or another pullback before the market finds a stronger base.
But the longer-term post-midterm pattern remains constructive.
If history repeats again, the weakness in October could end up being part of a transition into a stronger November-to-2027 period.
The key thing to watch is breadth.
If the percentage of stocks above their 50-day moving average starts recovering from the current 21.4% area and moves back toward 50% or higher, that would show the rally is becoming broader and healthier.
If breadth stays depressed and new lows continue dominating, the index could remain vulnerable even if the headline S&P 500 level looks stable.
For more financial news and price predictions, click here.
Subscribe to our YouTube channel for daily crypto updates, market insights, and expert analysis.
The post S&P 500 Price Prediction: History Points Higher, But October Breadth Is Flashing a Warning appeared first on CaptainAltcoin.
111
Silver Price Alert: Shanghai Premium Sends a Powerful SignalPopular analyst Alex Mason has pointed to a striking gap between silver prices in the U.S. and China, and argued that the spread may be telling us something important about physical demand.
On October 5, COMEX silver traded around $61 per ounce, yet the Shanghai benchmark was close to $69 per ounce. That put Shanghai silver at a premium of roughly 12%-13% over the U.S. market. Independent pricing data also showed Shanghai’s benchmark near $68.99, so the core price gap in Mason’s post is real.
The bigger question is what that gap actually means.
Shanghai Silver Is Trading at a Huge Premium
The chart compares the two markets side by side.
COMEX silver sits near the low-$60s, with the intraday chart still showing weakness after a broader correction.
Shanghai silver price, by contrast, is priced close to $69.
That difference is unusually large.
Normally, big price gaps between major markets create an arbitrage opportunity. Traders can buy the cheaper asset in one market and sell it in the more expensive one, which tends to pull the two prices back together.
But that process is not always immediate in physical commodities.
Shipping costs, taxes, import restrictions, contract specifications, delivery rules, currency conversion, and local supply conditions can all keep prices separated for longer than traders might expect.
So Mason is right to focus on the spread, but the existence of a 12% premium does not automatically prove that COMEX pricing is broken.
Read also: Here’s Where Gold and Silver Prices Might be Headed This Week
Physical Demand Is the Bigger Story
Mason’s main argument is that China’s premium may reflect strong demand for actual metal.
That idea is plausible.
Shanghai has been trading at a double-digit premium over COMEX for much of the past month, not just for a few minutes on one session. Recent data showed the premium staying in the 11%-15% area across multiple trading days.
That persistence is more interesting than a one-off pump.
THIS HAS NEVER HAPPENED BEFORE Silver has reached the point where the math no longer works: COMEX silver: $61.44 Shanghai physical silver: $68.99 That’s a 12.3% premium. At the same time, Shanghai delivery demand just hit an ALL-TIME HIGH: +142% vs the 30-day average. COMEX open interest is still above $535 MILLION. NOW CONNECT THE DOTS: – Physical demand is at record highs. – Shanghai is paying 12.3% MORE for silver. And the paper market is still pricing the same metal at $61.44. THAT SPREAD SHOULD NOT EXIST. In a healthy market, arbitrage closes a 12.3% gap FAST. Buy cheap in one market. Sell expensive in the other. Spread disappears. But it isn’t disappearing. Why? Because this is no longer just a PRICE problem. It’s a PHYSICAL METAL problem. You can create more paper contracts. You cannot create physical silver overnight. The people closest to the physical market already see what’s happening. Margins + Liquidity − Physical demand + Weak hands are being forced out while physical buyers keep paying a premium. That is the part almost nobody understands. When paper and physical disagree this much, one of them eventually has to reprice. Remember, I’ve been in finance for more than 15 years. When I EXIT the markets completely, I’ll say it here publicly, like I always do. Turn notifications on. Many people will wish they followed me sooner.
— Alex Mason △ (@AlexMasonCrypto) October 5, 2026
If physical buyers in China continue paying a much higher price, it means local demand and available supply are out of balance enough to sustain a premium.
Mason also points to a large jump in delivery demand as another sign that buyers want metal, not only financial exposure.
That claim deserves some caution, because the exact +142% delivery-demand figure is harder to independently verify from the available public data.
Still, the broader price premium itself is clearly visible.
Does This Mean Silver Has to Jump?
Not necessarily.
A persistent Shanghai premium can support a bullish case, but it does not mean COMEX silver must immediately move to $69.
The spread can close in several ways.
Shanghai prices could fall.
COMEX prices could rise.
Or both markets could move toward each other.
That is why saying one side “has to reprice” is directionally fair, but not enough to say which market moves first.
The most bullish outcome would be COMEX silver rising toward Shanghai pricing as physical demand remains strong.
That would put the upper-$60s back in focus quickly.
Silver Chart Analysis
The visual contrast is very clear.
COMEX spent October 5 near $61, and the broader move had been weak for weeks. Shanghai held close to $69, leaving a large gap between the two.
COMEX silver itself has also been volatile. Recent futures data showed the metal trading around $60-$61 after a major correction from much higher levels earlier in the year.
That means the Shanghai premium is developing at a time when Western silver pricing is already under pressure.
If that premium persists, it becomes much harder to dismiss as noise.
Silver Price Outlook
The immediate level to watch is still around $60-$61.
If COMEX silver holds that area and the Shanghai premium remains above 10%, the setup could become more constructive.
A recovery toward $65 would be the first sign that U.S. pricing is starting to catch up.
Above that, the $68-$70 area becomes especially important because that is where Shanghai has recently been trading.
If COMEX silver loses $60 cleanly, though, the divergence could widen even further before it closes.
Mason’s core point is worth watching: the physical and futures markets are currently telling very different stories.
The spread alone does not prove a squeeze is coming.
But if Shanghai keeps paying a double-digit premium and physical demand stays elevated, the silver price may eventually need a much bigger repricing event to bring the two markets closer together.
For more financial news and price predictions, click here.
Subscribe to our YouTube channel for daily crypto updates, market insights, and expert analysis.
The post Silver Price Alert: Shanghai Premium Sends a Powerful Signal appeared first on CaptainAltcoin.
Silver Price Alert: Shanghai Premium Sends a Powerful Signal
Popular analyst Alex Mason has pointed to a striking gap between silver prices in the U.S. and China, and argued that the spread may be telling us something important about physical demand.
On October 5, COMEX silver traded around $61 per ounce, yet the Shanghai benchmark was close to $69 per ounce. That put Shanghai silver at a premium of roughly 12%-13% over the U.S. market. Independent pricing data also showed Shanghai’s benchmark near $68.99, so the core price gap in Mason’s post is real.
The bigger question is what that gap actually means.
Shanghai Silver Is Trading at a Huge Premium
The chart compares the two markets side by side.
COMEX silver sits near the low-$60s, with the intraday chart still showing weakness after a broader correction.
Shanghai silver price, by contrast, is priced close to $69.
That difference is unusually large.
Normally, big price gaps between major markets create an arbitrage opportunity. Traders can buy the cheaper asset in one market and sell it in the more expensive one, which tends to pull the two prices back together.
But that process is not always immediate in physical commodities.
Shipping costs, taxes, import restrictions, contract specifications, delivery rules, currency conversion, and local supply conditions can all keep prices separated for longer than traders might expect.
So Mason is right to focus on the spread, but the existence of a 12% premium does not automatically prove that COMEX pricing is broken.
Read also: Here’s Where Gold and Silver Prices Might be Headed This Week
Physical Demand Is the Bigger Story
Mason’s main argument is that China’s premium may reflect strong demand for actual metal.
That idea is plausible.
Shanghai has been trading at a double-digit premium over COMEX for much of the past month, not just for a few minutes on one session. Recent data showed the premium staying in the 11%-15% area across multiple trading days.
That persistence is more interesting than a one-off pump.
THIS HAS NEVER HAPPENED BEFORE Silver has reached the point where the math no longer works: COMEX silver: $61.44 Shanghai physical silver: $68.99 That’s a 12.3% premium. At the same time, Shanghai delivery demand just hit an ALL-TIME HIGH: +142% vs the 30-day average. COMEX open interest is still above $535 MILLION. NOW CONNECT THE DOTS: – Physical demand is at record highs. – Shanghai is paying 12.3% MORE for silver. And the paper market is still pricing the same metal at $61.44. THAT SPREAD SHOULD NOT EXIST. In a healthy market, arbitrage closes a 12.3% gap FAST. Buy cheap in one market. Sell expensive in the other. Spread disappears. But it isn’t disappearing. Why? Because this is no longer just a PRICE problem. It’s a PHYSICAL METAL problem. You can create more paper contracts. You cannot create physical silver overnight. The people closest to the physical market already see what’s happening. Margins + Liquidity − Physical demand + Weak hands are being forced out while physical buyers keep paying a premium. That is the part almost nobody understands. When paper and physical disagree this much, one of them eventually has to reprice. Remember, I’ve been in finance for more than 15 years. When I EXIT the markets completely, I’ll say it here publicly, like I always do. Turn notifications on. Many people will wish they followed me sooner.
— Alex Mason △ (@AlexMasonCrypto) October 5, 2026
If physical buyers in China continue paying a much higher price, it means local demand and available supply are out of balance enough to sustain a premium.
Mason also points to a large jump in delivery demand as another sign that buyers want metal, not only financial exposure.
That claim deserves some caution, because the exact +142% delivery-demand figure is harder to independently verify from the available public data.
Still, the broader price premium itself is clearly visible.
Does This Mean Silver Has to Jump?
Not necessarily.
A persistent Shanghai premium can support a bullish case, but it does not mean COMEX silver must immediately move to $69.
The spread can close in several ways.
Shanghai prices could fall.
COMEX prices could rise.
Or both markets could move toward each other.
That is why saying one side “has to reprice” is directionally fair, but not enough to say which market moves first.
The most bullish outcome would be COMEX silver rising toward Shanghai pricing as physical demand remains strong.
That would put the upper-$60s back in focus quickly.
Silver Chart Analysis
The visual contrast is very clear.
COMEX spent October 5 near $61, and the broader move had been weak for weeks. Shanghai held close to $69, leaving a large gap between the two.
COMEX silver itself has also been volatile. Recent futures data showed the metal trading around $60-$61 after a major correction from much higher levels earlier in the year.
That means the Shanghai premium is developing at a time when Western silver pricing is already under pressure.
If that premium persists, it becomes much harder to dismiss as noise.
Silver Price Outlook
The immediate level to watch is still around $60-$61.
If COMEX silver holds that area and the Shanghai premium remains above 10%, the setup could become more constructive.
A recovery toward $65 would be the first sign that U.S. pricing is starting to catch up.
Above that, the $68-$70 area becomes especially important because that is where Shanghai has recently been trading.
If COMEX silver loses $60 cleanly, though, the divergence could widen even further before it closes.
Mason’s core point is worth watching: the physical and futures markets are currently telling very different stories.
The spread alone does not prove a squeeze is coming.
But if Shanghai keeps paying a double-digit premium and physical demand stays elevated, the silver price may eventually need a much bigger repricing event to bring the two markets closer together.
For more financial news and price predictions, click here.
Subscribe to our YouTube channel for daily crypto updates, market insights, and expert analysis.
The post Silver Price Alert: Shanghai Premium Sends a Powerful Signal appeared first on CaptainAltcoin.
On October 5, COMEX silver traded around $61 per ounce, yet the Shanghai benchmark was close to $69 per ounce. That put Shanghai silver at a premium of roughly 12%-13% over the U.S. market. Independent pricing data also showed Shanghai’s benchmark near $68.99, so the core price gap in Mason’s post is real.
The bigger question is what that gap actually means.
Shanghai Silver Is Trading at a Huge Premium
The chart compares the two markets side by side.
COMEX silver sits near the low-$60s, with the intraday chart still showing weakness after a broader correction.
Shanghai silver price, by contrast, is priced close to $69.
That difference is unusually large.
Normally, big price gaps between major markets create an arbitrage opportunity. Traders can buy the cheaper asset in one market and sell it in the more expensive one, which tends to pull the two prices back together.
But that process is not always immediate in physical commodities.
Shipping costs, taxes, import restrictions, contract specifications, delivery rules, currency conversion, and local supply conditions can all keep prices separated for longer than traders might expect.
So Mason is right to focus on the spread, but the existence of a 12% premium does not automatically prove that COMEX pricing is broken.
Read also: Here’s Where Gold and Silver Prices Might be Headed This Week
Physical Demand Is the Bigger Story
Mason’s main argument is that China’s premium may reflect strong demand for actual metal.
That idea is plausible.
Shanghai has been trading at a double-digit premium over COMEX for much of the past month, not just for a few minutes on one session. Recent data showed the premium staying in the 11%-15% area across multiple trading days.
That persistence is more interesting than a one-off pump.
THIS HAS NEVER HAPPENED BEFORE Silver has reached the point where the math no longer works: COMEX silver: $61.44 Shanghai physical silver: $68.99 That’s a 12.3% premium. At the same time, Shanghai delivery demand just hit an ALL-TIME HIGH: +142% vs the 30-day average. COMEX open interest is still above $535 MILLION. NOW CONNECT THE DOTS: – Physical demand is at record highs. – Shanghai is paying 12.3% MORE for silver. And the paper market is still pricing the same metal at $61.44. THAT SPREAD SHOULD NOT EXIST. In a healthy market, arbitrage closes a 12.3% gap FAST. Buy cheap in one market. Sell expensive in the other. Spread disappears. But it isn’t disappearing. Why? Because this is no longer just a PRICE problem. It’s a PHYSICAL METAL problem. You can create more paper contracts. You cannot create physical silver overnight. The people closest to the physical market already see what’s happening. Margins + Liquidity − Physical demand + Weak hands are being forced out while physical buyers keep paying a premium. That is the part almost nobody understands. When paper and physical disagree this much, one of them eventually has to reprice. Remember, I’ve been in finance for more than 15 years. When I EXIT the markets completely, I’ll say it here publicly, like I always do. Turn notifications on. Many people will wish they followed me sooner.
— Alex Mason △ (@AlexMasonCrypto) October 5, 2026
If physical buyers in China continue paying a much higher price, it means local demand and available supply are out of balance enough to sustain a premium.
Mason also points to a large jump in delivery demand as another sign that buyers want metal, not only financial exposure.
That claim deserves some caution, because the exact +142% delivery-demand figure is harder to independently verify from the available public data.
Still, the broader price premium itself is clearly visible.
Does This Mean Silver Has to Jump?
Not necessarily.
A persistent Shanghai premium can support a bullish case, but it does not mean COMEX silver must immediately move to $69.
The spread can close in several ways.
Shanghai prices could fall.
COMEX prices could rise.
Or both markets could move toward each other.
That is why saying one side “has to reprice” is directionally fair, but not enough to say which market moves first.
The most bullish outcome would be COMEX silver rising toward Shanghai pricing as physical demand remains strong.
That would put the upper-$60s back in focus quickly.
Silver Chart Analysis
The visual contrast is very clear.
COMEX spent October 5 near $61, and the broader move had been weak for weeks. Shanghai held close to $69, leaving a large gap between the two.
COMEX silver itself has also been volatile. Recent futures data showed the metal trading around $60-$61 after a major correction from much higher levels earlier in the year.
That means the Shanghai premium is developing at a time when Western silver pricing is already under pressure.
If that premium persists, it becomes much harder to dismiss as noise.
Silver Price Outlook
The immediate level to watch is still around $60-$61.
If COMEX silver holds that area and the Shanghai premium remains above 10%, the setup could become more constructive.
A recovery toward $65 would be the first sign that U.S. pricing is starting to catch up.
Above that, the $68-$70 area becomes especially important because that is where Shanghai has recently been trading.
If COMEX silver loses $60 cleanly, though, the divergence could widen even further before it closes.
Mason’s core point is worth watching: the physical and futures markets are currently telling very different stories.
The spread alone does not prove a squeeze is coming.
But if Shanghai keeps paying a double-digit premium and physical demand stays elevated, the silver price may eventually need a much bigger repricing event to bring the two markets closer together.
For more financial news and price predictions, click here.
Subscribe to our YouTube channel for daily crypto updates, market insights, and expert analysis.
The post Silver Price Alert: Shanghai Premium Sends a Powerful Signal appeared first on CaptainAltcoin.
1
246
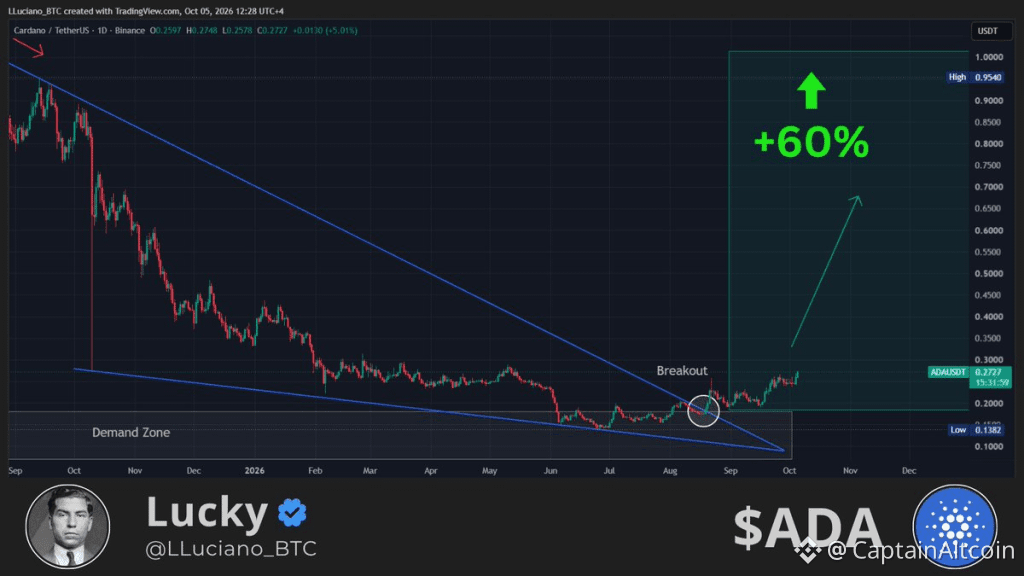
Article
This Trader Makes Urgent Cardano (ADA) Price PredictionCardano price has risen for a 3rd consecutive day, and trader Lucky believes ADA could be preparing for a much faster advance. His chart connects the recent recovery to a larger technical pattern, although resistance levels could still interrupt the move.
ADA is trading around $0.27 in our analysis, close to an area that could determine its next direction. Lucky’s bullish outlook and our ascending channel analysis provide different perspectives on the same recovery. The important question is whether Cardano can turn its recent progress into a sustained breakout.
Lucky’s Cardano Price Prediction Centers On A Falling Wedge Breakout
Lucky, known as @LLuciano_BTC on X, wrote that ADA was “setting its tone for another parabolic run.” A parabolic run describes a rally that accelerates as price rises, rather than a steady advance at a similar pace.
His attached daily Cardano chart shows a broad falling wedge. The upper blue trendline slopes downward across the declining highs, and the lower boundary descends more gradually beneath the price lows. Those boundaries move closer together as the pattern develops.
A look at the ADA chart shows price moving above the upper trendline near the area Lucky labels “Breakout.” The circled section marks the transition from trading beneath that boundary to trading above it.
@LLuciano_BTC / X
That matters because the upper trendline had contained the broader decline. A move above it can indicate that the previous pattern of lower highs is weakening. However, the breakout alone does not establish that a parabolic rally will follow.
Lucky’s ADA Chart Shows A Demand Zone And A 60% Projection
Lucky also marks a demand zone beneath the recent price action, close to the lower portion of the wedge. This is the area his chart identifies as a potential base for the recovery.
The latest displayed ADA price is approximately $0.2777. Price has moved above the marked zone, but the chart still places the recovery near the bottom of the much larger historical decline.
Several details help explain his bullish interpretation:
ADA has crossed above the descending upper trendline.
The marked demand zone lies beneath recent price action.
A green annotation presents a projected 60% advance.
The percentage requires careful interpretation because the graphic also contains an upward arrow that extends much higher. A 60% increase from approximately $0.2777 would place ADA near $0.44. The arrow itself should not be treated as a precise price target because Lucky’s supplied statement does not explain its endpoint.
His chart therefore presents a bullish scenario, not confirmation that every marked price area will be reached.
Our Cardano Price Analysis Shows An Ascending Channel Near Resistance
Our analysis examines a more recent structure. Cardano price has traded inside an ascending channel since June, and the latest recovery has brought ADA close to its upper boundary again.
ADA Price Chart / TradingView.com
An ascending channel contains rising support and resistance lines. Price can continue to recover within that structure without breaking above the upper boundary.
That distinction matters after 3 consecutive days of higher prices. The recovery remains constructive, but its location near channel resistance creates room for a pullback.
A rejection from the current area could send ADA toward approximately $0.258. A break below that level would put $0.23 next in focus. Losing $0.23 could then open a move toward the channel’s lower boundary near $0.21.
These levels describe a conditional downside sequence. Cardano would need to lose each support area before the next becomes the main concern.
Cardano Price Needs To Clear $0.30 Before A Larger Recovery
Continued bullish momentum could carry Cardano price toward $0.30 this week. That level has acted as resistance since the final day of January, so reaching it would create another test.
The main levels in our analysis are:
ADA Price Level Role In The Outlook $0.258 Initial support after a potential rejection. $0.23 Next support if $0.258 gives way. $0.21 Lower channel area if selling continues. $0.30 Major resistance above the current price. $0.43 January high that could return to focus after a breakout.
A rejection at $0.30 could begin a decline even if ADA first moves above its current channel resistance. A sustained break above $0.30 would strengthen the case for a recovery toward January highs around $0.43 before the year ends.
Lucky’s falling wedge breakout offers a bullish explanation for the recovery, and our channel analysis identifies the nearer obstacles. Cardano now has a chance to test whether this advance can carry beyond familiar resistance.
FAQs
Will Cardano ADA reach $10?
Most mainstream analytical models and forecasting platforms consider it highly improbable for Cardano (ADA) to reach $10 in the near future.
Should I buy Cardano or XRP?
Choosing between Cardano and XRP depends on your risk tolerance and whether you want a token focused on global payments or one built for smart contracts.
Subscribe to our YouTube channel for daily crypto updates, market insights, and expert analysis.
The post This Trader Makes Urgent Cardano (ADA) Price Prediction appeared first on CaptainAltcoin.
This Trader Makes Urgent Cardano (ADA) Price Prediction
Cardano price has risen for a 3rd consecutive day, and trader Lucky believes ADA could be preparing for a much faster advance. His chart connects the recent recovery to a larger technical pattern, although resistance levels could still interrupt the move.
ADA is trading around $0.27 in our analysis, close to an area that could determine its next direction. Lucky’s bullish outlook and our ascending channel analysis provide different perspectives on the same recovery. The important question is whether Cardano can turn its recent progress into a sustained breakout.
Lucky’s Cardano Price Prediction Centers On A Falling Wedge Breakout
Lucky, known as @LLuciano_BTC on X, wrote that ADA was “setting its tone for another parabolic run.” A parabolic run describes a rally that accelerates as price rises, rather than a steady advance at a similar pace.
His attached daily Cardano chart shows a broad falling wedge. The upper blue trendline slopes downward across the declining highs, and the lower boundary descends more gradually beneath the price lows. Those boundaries move closer together as the pattern develops.
A look at the ADA chart shows price moving above the upper trendline near the area Lucky labels “Breakout.” The circled section marks the transition from trading beneath that boundary to trading above it.
@LLuciano_BTC / X
That matters because the upper trendline had contained the broader decline. A move above it can indicate that the previous pattern of lower highs is weakening. However, the breakout alone does not establish that a parabolic rally will follow.
Lucky’s ADA Chart Shows A Demand Zone And A 60% Projection
Lucky also marks a demand zone beneath the recent price action, close to the lower portion of the wedge. This is the area his chart identifies as a potential base for the recovery.
The latest displayed ADA price is approximately $0.2777. Price has moved above the marked zone, but the chart still places the recovery near the bottom of the much larger historical decline.
Several details help explain his bullish interpretation:
ADA has crossed above the descending upper trendline.
The marked demand zone lies beneath recent price action.
A green annotation presents a projected 60% advance.
The percentage requires careful interpretation because the graphic also contains an upward arrow that extends much higher. A 60% increase from approximately $0.2777 would place ADA near $0.44. The arrow itself should not be treated as a precise price target because Lucky’s supplied statement does not explain its endpoint.
His chart therefore presents a bullish scenario, not confirmation that every marked price area will be reached.
Our Cardano Price Analysis Shows An Ascending Channel Near Resistance
Our analysis examines a more recent structure. Cardano price has traded inside an ascending channel since June, and the latest recovery has brought ADA close to its upper boundary again.
ADA Price Chart / TradingView.com
An ascending channel contains rising support and resistance lines. Price can continue to recover within that structure without breaking above the upper boundary.
That distinction matters after 3 consecutive days of higher prices. The recovery remains constructive, but its location near channel resistance creates room for a pullback.
A rejection from the current area could send ADA toward approximately $0.258. A break below that level would put $0.23 next in focus. Losing $0.23 could then open a move toward the channel’s lower boundary near $0.21.
These levels describe a conditional downside sequence. Cardano would need to lose each support area before the next becomes the main concern.
Cardano Price Needs To Clear $0.30 Before A Larger Recovery
Continued bullish momentum could carry Cardano price toward $0.30 this week. That level has acted as resistance since the final day of January, so reaching it would create another test.
The main levels in our analysis are:
ADA Price Level Role In The Outlook $0.258 Initial support after a potential rejection. $0.23 Next support if $0.258 gives way. $0.21 Lower channel area if selling continues. $0.30 Major resistance above the current price. $0.43 January high that could return to focus after a breakout.
A rejection at $0.30 could begin a decline even if ADA first moves above its current channel resistance. A sustained break above $0.30 would strengthen the case for a recovery toward January highs around $0.43 before the year ends.
Lucky’s falling wedge breakout offers a bullish explanation for the recovery, and our channel analysis identifies the nearer obstacles. Cardano now has a chance to test whether this advance can carry beyond familiar resistance.
FAQs
Will Cardano ADA reach $10?
Most mainstream analytical models and forecasting platforms consider it highly improbable for Cardano (ADA) to reach $10 in the near future.
Should I buy Cardano or XRP?
Choosing between Cardano and XRP depends on your risk tolerance and whether you want a token focused on global payments or one built for smart contracts.
Subscribe to our YouTube channel for daily crypto updates, market insights, and expert analysis.
The post This Trader Makes Urgent Cardano (ADA) Price Prediction appeared first on CaptainAltcoin.
ADA is trading around $0.27 in our analysis, close to an area that could determine its next direction. Lucky’s bullish outlook and our ascending channel analysis provide different perspectives on the same recovery. The important question is whether Cardano can turn its recent progress into a sustained breakout.
Lucky’s Cardano Price Prediction Centers On A Falling Wedge Breakout
Lucky, known as @LLuciano_BTC on X, wrote that ADA was “setting its tone for another parabolic run.” A parabolic run describes a rally that accelerates as price rises, rather than a steady advance at a similar pace.
His attached daily Cardano chart shows a broad falling wedge. The upper blue trendline slopes downward across the declining highs, and the lower boundary descends more gradually beneath the price lows. Those boundaries move closer together as the pattern develops.
A look at the ADA chart shows price moving above the upper trendline near the area Lucky labels “Breakout.” The circled section marks the transition from trading beneath that boundary to trading above it.
@LLuciano_BTC / X
That matters because the upper trendline had contained the broader decline. A move above it can indicate that the previous pattern of lower highs is weakening. However, the breakout alone does not establish that a parabolic rally will follow.
Lucky’s ADA Chart Shows A Demand Zone And A 60% Projection
Lucky also marks a demand zone beneath the recent price action, close to the lower portion of the wedge. This is the area his chart identifies as a potential base for the recovery.
The latest displayed ADA price is approximately $0.2777. Price has moved above the marked zone, but the chart still places the recovery near the bottom of the much larger historical decline.
Several details help explain his bullish interpretation:
ADA has crossed above the descending upper trendline.
The marked demand zone lies beneath recent price action.
A green annotation presents a projected 60% advance.
The percentage requires careful interpretation because the graphic also contains an upward arrow that extends much higher. A 60% increase from approximately $0.2777 would place ADA near $0.44. The arrow itself should not be treated as a precise price target because Lucky’s supplied statement does not explain its endpoint.
His chart therefore presents a bullish scenario, not confirmation that every marked price area will be reached.
Our Cardano Price Analysis Shows An Ascending Channel Near Resistance
Our analysis examines a more recent structure. Cardano price has traded inside an ascending channel since June, and the latest recovery has brought ADA close to its upper boundary again.
ADA Price Chart / TradingView.com
An ascending channel contains rising support and resistance lines. Price can continue to recover within that structure without breaking above the upper boundary.
That distinction matters after 3 consecutive days of higher prices. The recovery remains constructive, but its location near channel resistance creates room for a pullback.
A rejection from the current area could send ADA toward approximately $0.258. A break below that level would put $0.23 next in focus. Losing $0.23 could then open a move toward the channel’s lower boundary near $0.21.
These levels describe a conditional downside sequence. Cardano would need to lose each support area before the next becomes the main concern.
Cardano Price Needs To Clear $0.30 Before A Larger Recovery
Continued bullish momentum could carry Cardano price toward $0.30 this week. That level has acted as resistance since the final day of January, so reaching it would create another test.
The main levels in our analysis are:
ADA Price Level Role In The Outlook $0.258 Initial support after a potential rejection. $0.23 Next support if $0.258 gives way. $0.21 Lower channel area if selling continues. $0.30 Major resistance above the current price. $0.43 January high that could return to focus after a breakout.
A rejection at $0.30 could begin a decline even if ADA first moves above its current channel resistance. A sustained break above $0.30 would strengthen the case for a recovery toward January highs around $0.43 before the year ends.
Lucky’s falling wedge breakout offers a bullish explanation for the recovery, and our channel analysis identifies the nearer obstacles. Cardano now has a chance to test whether this advance can carry beyond familiar resistance.
FAQs
Will Cardano ADA reach $10?
Most mainstream analytical models and forecasting platforms consider it highly improbable for Cardano (ADA) to reach $10 in the near future.
Should I buy Cardano or XRP?
Choosing between Cardano and XRP depends on your risk tolerance and whether you want a token focused on global payments or one built for smart contracts.
Subscribe to our YouTube channel for daily crypto updates, market insights, and expert analysis.
The post This Trader Makes Urgent Cardano (ADA) Price Prediction appeared first on CaptainAltcoin.
1
2
1.3k

Article
ChainIT Presents Agentic Web3 Complete Commerce Architecture During TOKEN2049 Week in SingaporeTransaction Truth white paper outlines how AI agents can transact through verified authority, runtime compliance and controlled execution across Web3 wallets, stablecoins and traditional payment rails.
SCOTTSDALE, Ariz., Oct. 6, 2026 /PRNewswire/ — ChainIT Inc. today presented its architecture for Agentic Web3 Complete Commerce in conjunction with TOKEN2049 Week in Singapore, highlighting the executive white paper “ChainIT Transaction Truth: Stablecoins, Web3 Wallets, and Multi-Rail Commerce.” The publication outlines how AI-initiated transactions can connect verified identity and delegated authority with runtime compliance, controlled execution and verifiable commercial outcomes.
The central question is not simply whether an AI agent can access a wallet or initiate a payment. It is whether the agent is acting for a verified person or organization, within current delegated limits, on the exact transaction authorized – and whether the resulting settlement and commercial outcome can be proven.
“Moving money is not the same as completing commerce,” said Jeremy Blackburn, Founder and Chief Executive Officer of ChainIT. “A valid signature does not tell a business whether the right party authorized the transaction, whether the payment fulfilled the agreement, or what happened when something went wrong. That is the gap Transaction Truth is designed to close.”
Agents propose. Deterministic controls execute.
In the architecture, registered agents operate under bounded delegation from verified principals. Their permitted purpose, counterparties, payment methods, value limits and effective period are explicit. In-scope transactions can proceed through deterministic controls without requiring a person to approve every payment; exceptions follow the prescribed new decision and approval path. Session or wallet access alone is not payment authority.
Authority before execution. Evidence beyond the transfer.
Building on ChainIT’s Provable Authority and Provable Compliance publications, Transaction Truth connects three requirements:
Verified authority and current compliance. ChainIT ID and ChainIT Org ID establish the relevant person and organization. The Authority Resolution Pactvera records organizational roles, scope and limits. The separate ChainIT Authority Protocol and ChainIT Compliance Protocol evaluate whether the proposed action is authorized and whether current evidence and applicable policy permit it.
Exact-transaction control. Approval binds material payment details, including destination, amount, asset and network, to a canonical transaction digest. The architecture requires applicable approvals, reserved transaction capacity and a single-use Execution Authorization Credential before the qualified wallet or payment boundary commits the instruction. A material change requires renewed authorization.
Settlement and proof. Pactvera links commercial terms, conditions, approvals and execution. Validated Data Tokens preserve lifecycle events, and Valitorum seals the terminal evidence record. In an illustrative stablecoin-to-fiat transaction, blockchain confirmation, conversion, merchant payout and accounting reconciliation remain separate stages that must be evidenced rather than assumed.
Multiple payment rails. The same governance requirements.
The model is designed to operate across qualified stablecoins, tokenized deposits, cards, ACH, wires and instant payments without tying the commercial transaction to a single issuer, blockchain or wallet. Assets, providers and execution paths remain subject to qualification and policy.
“Key security and corporate authority are different controls,” said Eric Tacl, PhD, Executive Vice President, Verified Payments and Commerce, at ChainIT and a co-author of the paper. “A threshold signature does not replace a board resolution, a spending limit or a current compliance decision. Institutional use requires those controls to remain connected to the exact transaction and its outcome.”
The white paper distinguishes existing platform foundations from published protocol architecture, development and pilot work, proposed execution profiles and external dependencies. Availability and integration support vary by implementation; publication does not represent general availability of every described component.
Eric Tacl, PhD is representing ChainIT at TOKEN2049 in Singapore. Financial institutions, stablecoin issuers, wallet providers, enterprise teams and agent developers are invited to meet with him to discuss Agentic Web3 Complete Commerce and potential integrations. Meeting requests and media inquiries can be submitted through ChainIT’s TOKEN2049 Singapore page.
Read the white paper:
https://chainit.com/white-paper-stablecoins-web3-wallets-and-multi-rail-commerce/
About ChainIT
ChainIT provides digital identity, business verification, authority, payment and transaction-evidence infrastructure. Its platform connects verified people and organizations with governed workflows, Pactvera agreements, ChainIT Pay and auditable records through Validated Data Tokens and Valitorum. ChainIT’s Complete Commerce approach connects verification, authorization, execution and proof across the commercial transaction.
The post ChainIT Presents Agentic Web3 Complete Commerce Architecture During TOKEN2049 Week in Singapore appeared first on CaptainAltcoin.
ChainIT Presents Agentic Web3 Complete Commerce Architecture During TOKEN2049 Week in Singapore
Transaction Truth white paper outlines how AI agents can transact through verified authority, runtime compliance and controlled execution across Web3 wallets, stablecoins and traditional payment rails.
SCOTTSDALE, Ariz., Oct. 6, 2026 /PRNewswire/ — ChainIT Inc. today presented its architecture for Agentic Web3 Complete Commerce in conjunction with TOKEN2049 Week in Singapore, highlighting the executive white paper “ChainIT Transaction Truth: Stablecoins, Web3 Wallets, and Multi-Rail Commerce.” The publication outlines how AI-initiated transactions can connect verified identity and delegated authority with runtime compliance, controlled execution and verifiable commercial outcomes.
The central question is not simply whether an AI agent can access a wallet or initiate a payment. It is whether the agent is acting for a verified person or organization, within current delegated limits, on the exact transaction authorized – and whether the resulting settlement and commercial outcome can be proven.
“Moving money is not the same as completing commerce,” said Jeremy Blackburn, Founder and Chief Executive Officer of ChainIT. “A valid signature does not tell a business whether the right party authorized the transaction, whether the payment fulfilled the agreement, or what happened when something went wrong. That is the gap Transaction Truth is designed to close.”
Agents propose. Deterministic controls execute.
In the architecture, registered agents operate under bounded delegation from verified principals. Their permitted purpose, counterparties, payment methods, value limits and effective period are explicit. In-scope transactions can proceed through deterministic controls without requiring a person to approve every payment; exceptions follow the prescribed new decision and approval path. Session or wallet access alone is not payment authority.
Authority before execution. Evidence beyond the transfer.
Building on ChainIT’s Provable Authority and Provable Compliance publications, Transaction Truth connects three requirements:
Verified authority and current compliance. ChainIT ID and ChainIT Org ID establish the relevant person and organization. The Authority Resolution Pactvera records organizational roles, scope and limits. The separate ChainIT Authority Protocol and ChainIT Compliance Protocol evaluate whether the proposed action is authorized and whether current evidence and applicable policy permit it.
Exact-transaction control. Approval binds material payment details, including destination, amount, asset and network, to a canonical transaction digest. The architecture requires applicable approvals, reserved transaction capacity and a single-use Execution Authorization Credential before the qualified wallet or payment boundary commits the instruction. A material change requires renewed authorization.
Settlement and proof. Pactvera links commercial terms, conditions, approvals and execution. Validated Data Tokens preserve lifecycle events, and Valitorum seals the terminal evidence record. In an illustrative stablecoin-to-fiat transaction, blockchain confirmation, conversion, merchant payout and accounting reconciliation remain separate stages that must be evidenced rather than assumed.
Multiple payment rails. The same governance requirements.
The model is designed to operate across qualified stablecoins, tokenized deposits, cards, ACH, wires and instant payments without tying the commercial transaction to a single issuer, blockchain or wallet. Assets, providers and execution paths remain subject to qualification and policy.
“Key security and corporate authority are different controls,” said Eric Tacl, PhD, Executive Vice President, Verified Payments and Commerce, at ChainIT and a co-author of the paper. “A threshold signature does not replace a board resolution, a spending limit or a current compliance decision. Institutional use requires those controls to remain connected to the exact transaction and its outcome.”
The white paper distinguishes existing platform foundations from published protocol architecture, development and pilot work, proposed execution profiles and external dependencies. Availability and integration support vary by implementation; publication does not represent general availability of every described component.
Eric Tacl, PhD is representing ChainIT at TOKEN2049 in Singapore. Financial institutions, stablecoin issuers, wallet providers, enterprise teams and agent developers are invited to meet with him to discuss Agentic Web3 Complete Commerce and potential integrations. Meeting requests and media inquiries can be submitted through ChainIT’s TOKEN2049 Singapore page.
Read the white paper:
https://chainit.com/white-paper-stablecoins-web3-wallets-and-multi-rail-commerce/
About ChainIT
ChainIT provides digital identity, business verification, authority, payment and transaction-evidence infrastructure. Its platform connects verified people and organizations with governed workflows, Pactvera agreements, ChainIT Pay and auditable records through Validated Data Tokens and Valitorum. ChainIT’s Complete Commerce approach connects verification, authorization, execution and proof across the commercial transaction.
The post ChainIT Presents Agentic Web3 Complete Commerce Architecture During TOKEN2049 Week in Singapore appeared first on CaptainAltcoin.
SCOTTSDALE, Ariz., Oct. 6, 2026 /PRNewswire/ — ChainIT Inc. today presented its architecture for Agentic Web3 Complete Commerce in conjunction with TOKEN2049 Week in Singapore, highlighting the executive white paper “ChainIT Transaction Truth: Stablecoins, Web3 Wallets, and Multi-Rail Commerce.” The publication outlines how AI-initiated transactions can connect verified identity and delegated authority with runtime compliance, controlled execution and verifiable commercial outcomes.
The central question is not simply whether an AI agent can access a wallet or initiate a payment. It is whether the agent is acting for a verified person or organization, within current delegated limits, on the exact transaction authorized – and whether the resulting settlement and commercial outcome can be proven.
“Moving money is not the same as completing commerce,” said Jeremy Blackburn, Founder and Chief Executive Officer of ChainIT. “A valid signature does not tell a business whether the right party authorized the transaction, whether the payment fulfilled the agreement, or what happened when something went wrong. That is the gap Transaction Truth is designed to close.”
Agents propose. Deterministic controls execute.
In the architecture, registered agents operate under bounded delegation from verified principals. Their permitted purpose, counterparties, payment methods, value limits and effective period are explicit. In-scope transactions can proceed through deterministic controls without requiring a person to approve every payment; exceptions follow the prescribed new decision and approval path. Session or wallet access alone is not payment authority.
Authority before execution. Evidence beyond the transfer.
Building on ChainIT’s Provable Authority and Provable Compliance publications, Transaction Truth connects three requirements:
Verified authority and current compliance. ChainIT ID and ChainIT Org ID establish the relevant person and organization. The Authority Resolution Pactvera records organizational roles, scope and limits. The separate ChainIT Authority Protocol and ChainIT Compliance Protocol evaluate whether the proposed action is authorized and whether current evidence and applicable policy permit it.
Exact-transaction control. Approval binds material payment details, including destination, amount, asset and network, to a canonical transaction digest. The architecture requires applicable approvals, reserved transaction capacity and a single-use Execution Authorization Credential before the qualified wallet or payment boundary commits the instruction. A material change requires renewed authorization.
Settlement and proof. Pactvera links commercial terms, conditions, approvals and execution. Validated Data Tokens preserve lifecycle events, and Valitorum seals the terminal evidence record. In an illustrative stablecoin-to-fiat transaction, blockchain confirmation, conversion, merchant payout and accounting reconciliation remain separate stages that must be evidenced rather than assumed.
Multiple payment rails. The same governance requirements.
The model is designed to operate across qualified stablecoins, tokenized deposits, cards, ACH, wires and instant payments without tying the commercial transaction to a single issuer, blockchain or wallet. Assets, providers and execution paths remain subject to qualification and policy.
“Key security and corporate authority are different controls,” said Eric Tacl, PhD, Executive Vice President, Verified Payments and Commerce, at ChainIT and a co-author of the paper. “A threshold signature does not replace a board resolution, a spending limit or a current compliance decision. Institutional use requires those controls to remain connected to the exact transaction and its outcome.”
The white paper distinguishes existing platform foundations from published protocol architecture, development and pilot work, proposed execution profiles and external dependencies. Availability and integration support vary by implementation; publication does not represent general availability of every described component.
Eric Tacl, PhD is representing ChainIT at TOKEN2049 in Singapore. Financial institutions, stablecoin issuers, wallet providers, enterprise teams and agent developers are invited to meet with him to discuss Agentic Web3 Complete Commerce and potential integrations. Meeting requests and media inquiries can be submitted through ChainIT’s TOKEN2049 Singapore page.
Read the white paper:
https://chainit.com/white-paper-stablecoins-web3-wallets-and-multi-rail-commerce/
About ChainIT
ChainIT provides digital identity, business verification, authority, payment and transaction-evidence infrastructure. Its platform connects verified people and organizations with governed workflows, Pactvera agreements, ChainIT Pay and auditable records through Validated Data Tokens and Valitorum. ChainIT’s Complete Commerce approach connects verification, authorization, execution and proof across the commercial transaction.
The post ChainIT Presents Agentic Web3 Complete Commerce Architecture During TOKEN2049 Week in Singapore appeared first on CaptainAltcoin.
93
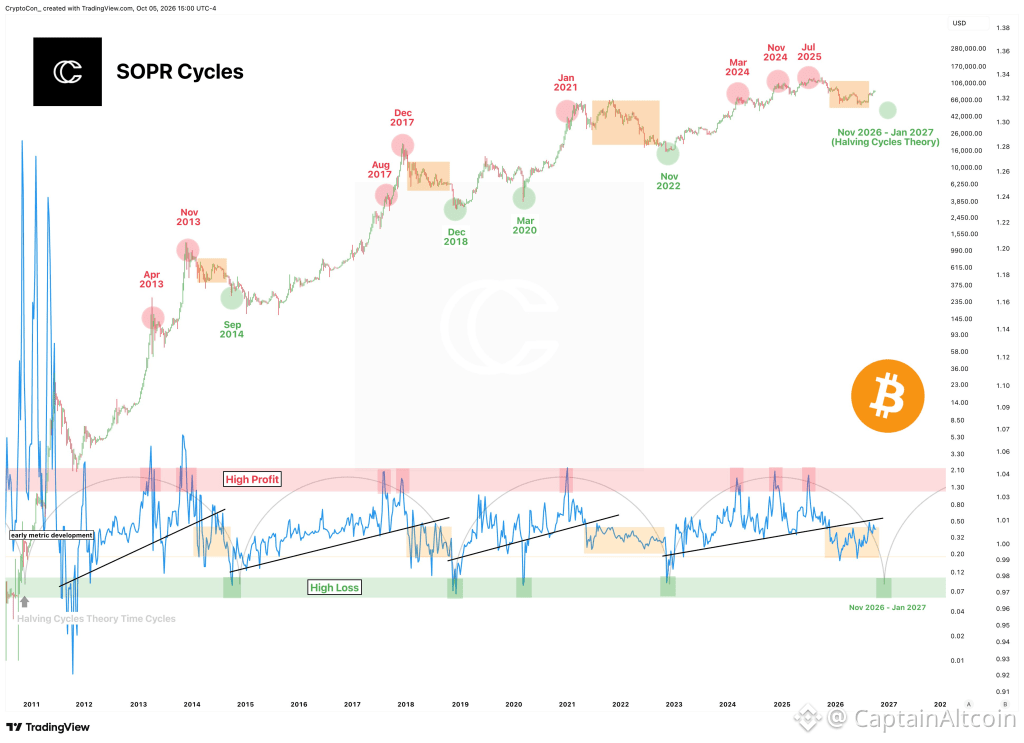
Article
Bitcoin Price Today: BTC’s Cycle Setup Could Catch Bulls Off GuardBitcoin is trading around $85,300 at press time, holding well above the lows seen earlier this year and keeping the idea of a new bull phase alive.
A growing part of the market now appears convinced that the worst is over and the next major step is simply a return to all-time highs.
CryptoCon is not convinced.
The analyst continues to argue that several pieces of Bitcoin’s traditional cycle structure remain unfinished, and his latest SOPR chart raises the possibility that the current recovery could still be taking place inside a broader bear-market cycle.
CryptoCon Says Bitcoin’s Cycle Data Is Still Incomplete
CryptoCon’s concern centers on SOPR, or Spent Output Profit Ratio.
The indicator tracks whether Bitcoin being moved onchain is generally being sold at a profit or a loss.
Historically, major Bitcoin cycle bottoms have been accompanied by periods where SOPR moved deeply into what CryptoCon labels the “high loss” zone.
That happened around the major bottoms in:
September 2014
December 2018
March 2020
November 2022
This time, the indicator has not reached the same cycle-bottom region.
That is the “loose end” CryptoCon thinks the market may still need to resolve.
His argument is simple: if Bitcoin has already entered a completely new bull market, then the current cycle would be one of the first to skip a signal that has appeared near several previous macro bottoms.
The Chart Shows a Repeating Profit-and-Loss Cycle
CryptoCon’s chart maps Bitcoin price against SOPR going back to 2011.
Source: X/@CryptoCon_
The pattern is fairly consistent.
During major bull-market peaks, SOPR pushes into the red high-profit zone as investors increasingly realize gains.
After the peak, the indicator trends lower and eventually falls into the green high-loss region near the end of the bear market.
Bitcoin then starts a new long-term expansion.
The current cycle looks different.
SOPR fell considerably during the downturn but never reached the same deep-loss levels seen at previous major bottoms.
CryptoCon sees that as evidence that the market may not have completed a full capitulation cycle yet.
Read also: Why America’s Wealth Divide Could Be a Major Bull Case for Bitcoin
Could the Real Bottom Still Come Between November and January?
Timing is the second part of his argument.
Under CryptoCon’s Halving Cycles Theory, the cycle-bottom window does not necessarily fall in October.
His chart places the potential bottom between November 2026 and January 2027.
That would actually fit some previous cycle timing.
The 2014 bear market bottom came in September, the 2018 low arrived in December, and the post-2021 cycle bottom came in November 2022.
CryptoCon points out that a January bottom would not be historically unprecedented either, citing the 2015 cycle.
So he questions the assumption that Bitcoin must already have completed its low simply because October has arrived.
Is This a False Start to the Bitcoin Bull Market?
This is the uncomfortable part of the thesis for bulls.
Bitcoin has recovered strongly enough that many traders are treating the bear market as finished.
CryptoCon sees another possibility: the recovery itself may be convincing enough to make investors believe a new bull market has begun before the final cycle low arrives.
His chart illustrates that scenario with the current price structure followed by a potential decline into the November-to-January period.
That does not mean Bitcoin must collapse.
CryptoCon has repeatedly said the cycle could behave differently this time.
His point is that declaring the four-year cycle dead before several historically important indicators complete their usual behavior may be premature.
For more crypto news and price predictions, click here.
Subscribe to our YouTube channel for daily crypto updates, market insights, and expert analysis.
The post Bitcoin Price Today: BTC’s Cycle Setup Could Catch Bulls Off Guard appeared first on CaptainAltcoin.
Bitcoin Price Today: BTC’s Cycle Setup Could Catch Bulls Off Guard
Bitcoin is trading around $85,300 at press time, holding well above the lows seen earlier this year and keeping the idea of a new bull phase alive.
A growing part of the market now appears convinced that the worst is over and the next major step is simply a return to all-time highs.
CryptoCon is not convinced.
The analyst continues to argue that several pieces of Bitcoin’s traditional cycle structure remain unfinished, and his latest SOPR chart raises the possibility that the current recovery could still be taking place inside a broader bear-market cycle.
CryptoCon Says Bitcoin’s Cycle Data Is Still Incomplete
CryptoCon’s concern centers on SOPR, or Spent Output Profit Ratio.
The indicator tracks whether Bitcoin being moved onchain is generally being sold at a profit or a loss.
Historically, major Bitcoin cycle bottoms have been accompanied by periods where SOPR moved deeply into what CryptoCon labels the “high loss” zone.
That happened around the major bottoms in:
September 2014
December 2018
March 2020
November 2022
This time, the indicator has not reached the same cycle-bottom region.
That is the “loose end” CryptoCon thinks the market may still need to resolve.
His argument is simple: if Bitcoin has already entered a completely new bull market, then the current cycle would be one of the first to skip a signal that has appeared near several previous macro bottoms.
The Chart Shows a Repeating Profit-and-Loss Cycle
CryptoCon’s chart maps Bitcoin price against SOPR going back to 2011.
Source: X/@CryptoCon_
The pattern is fairly consistent.
During major bull-market peaks, SOPR pushes into the red high-profit zone as investors increasingly realize gains.
After the peak, the indicator trends lower and eventually falls into the green high-loss region near the end of the bear market.
Bitcoin then starts a new long-term expansion.
The current cycle looks different.
SOPR fell considerably during the downturn but never reached the same deep-loss levels seen at previous major bottoms.
CryptoCon sees that as evidence that the market may not have completed a full capitulation cycle yet.
Read also: Why America’s Wealth Divide Could Be a Major Bull Case for Bitcoin
Could the Real Bottom Still Come Between November and January?
Timing is the second part of his argument.
Under CryptoCon’s Halving Cycles Theory, the cycle-bottom window does not necessarily fall in October.
His chart places the potential bottom between November 2026 and January 2027.
That would actually fit some previous cycle timing.
The 2014 bear market bottom came in September, the 2018 low arrived in December, and the post-2021 cycle bottom came in November 2022.
CryptoCon points out that a January bottom would not be historically unprecedented either, citing the 2015 cycle.
So he questions the assumption that Bitcoin must already have completed its low simply because October has arrived.
Is This a False Start to the Bitcoin Bull Market?
This is the uncomfortable part of the thesis for bulls.
Bitcoin has recovered strongly enough that many traders are treating the bear market as finished.
CryptoCon sees another possibility: the recovery itself may be convincing enough to make investors believe a new bull market has begun before the final cycle low arrives.
His chart illustrates that scenario with the current price structure followed by a potential decline into the November-to-January period.
That does not mean Bitcoin must collapse.
CryptoCon has repeatedly said the cycle could behave differently this time.
His point is that declaring the four-year cycle dead before several historically important indicators complete their usual behavior may be premature.
For more crypto news and price predictions, click here.
Subscribe to our YouTube channel for daily crypto updates, market insights, and expert analysis.
The post Bitcoin Price Today: BTC’s Cycle Setup Could Catch Bulls Off Guard appeared first on CaptainAltcoin.
A growing part of the market now appears convinced that the worst is over and the next major step is simply a return to all-time highs.
CryptoCon is not convinced.
The analyst continues to argue that several pieces of Bitcoin’s traditional cycle structure remain unfinished, and his latest SOPR chart raises the possibility that the current recovery could still be taking place inside a broader bear-market cycle.
CryptoCon Says Bitcoin’s Cycle Data Is Still Incomplete
CryptoCon’s concern centers on SOPR, or Spent Output Profit Ratio.
The indicator tracks whether Bitcoin being moved onchain is generally being sold at a profit or a loss.
Historically, major Bitcoin cycle bottoms have been accompanied by periods where SOPR moved deeply into what CryptoCon labels the “high loss” zone.
That happened around the major bottoms in:
September 2014
December 2018
March 2020
November 2022
This time, the indicator has not reached the same cycle-bottom region.
That is the “loose end” CryptoCon thinks the market may still need to resolve.
His argument is simple: if Bitcoin has already entered a completely new bull market, then the current cycle would be one of the first to skip a signal that has appeared near several previous macro bottoms.
The Chart Shows a Repeating Profit-and-Loss Cycle
CryptoCon’s chart maps Bitcoin price against SOPR going back to 2011.
Source: X/@CryptoCon_
The pattern is fairly consistent.
During major bull-market peaks, SOPR pushes into the red high-profit zone as investors increasingly realize gains.
After the peak, the indicator trends lower and eventually falls into the green high-loss region near the end of the bear market.
Bitcoin then starts a new long-term expansion.
The current cycle looks different.
SOPR fell considerably during the downturn but never reached the same deep-loss levels seen at previous major bottoms.
CryptoCon sees that as evidence that the market may not have completed a full capitulation cycle yet.
Read also: Why America’s Wealth Divide Could Be a Major Bull Case for Bitcoin
Could the Real Bottom Still Come Between November and January?
Timing is the second part of his argument.
Under CryptoCon’s Halving Cycles Theory, the cycle-bottom window does not necessarily fall in October.
His chart places the potential bottom between November 2026 and January 2027.
That would actually fit some previous cycle timing.
The 2014 bear market bottom came in September, the 2018 low arrived in December, and the post-2021 cycle bottom came in November 2022.
CryptoCon points out that a January bottom would not be historically unprecedented either, citing the 2015 cycle.
So he questions the assumption that Bitcoin must already have completed its low simply because October has arrived.
Is This a False Start to the Bitcoin Bull Market?
This is the uncomfortable part of the thesis for bulls.
Bitcoin has recovered strongly enough that many traders are treating the bear market as finished.
CryptoCon sees another possibility: the recovery itself may be convincing enough to make investors believe a new bull market has begun before the final cycle low arrives.
His chart illustrates that scenario with the current price structure followed by a potential decline into the November-to-January period.
That does not mean Bitcoin must collapse.
CryptoCon has repeatedly said the cycle could behave differently this time.
His point is that declaring the four-year cycle dead before several historically important indicators complete their usual behavior may be premature.
For more crypto news and price predictions, click here.
Subscribe to our YouTube channel for daily crypto updates, market insights, and expert analysis.
The post Bitcoin Price Today: BTC’s Cycle Setup Could Catch Bulls Off Guard appeared first on CaptainAltcoin.
1k
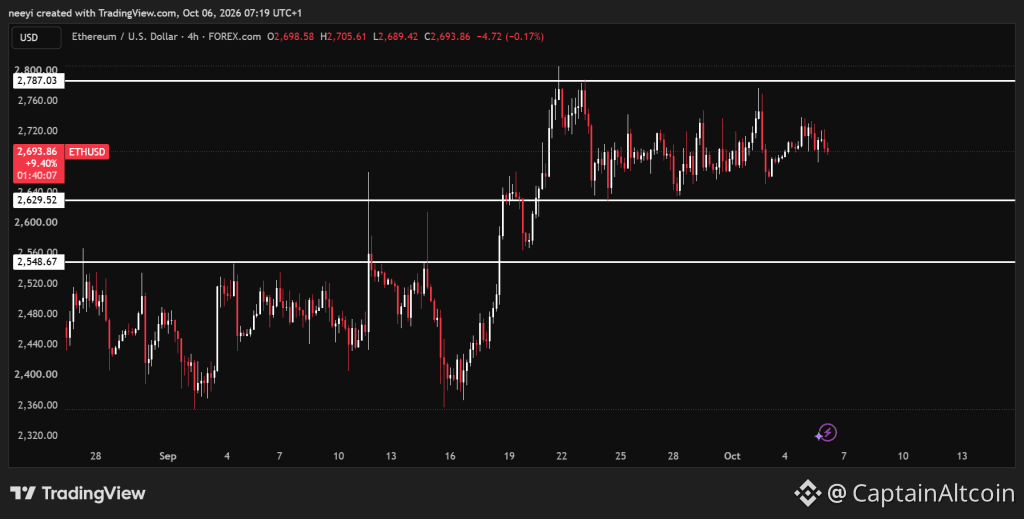
Article
Crypto Price Predictions for Today, October 6: Ethereum (ETH), Solana (SOL), Cardano (ADA)Ethereum and Solana enter October 6 without a clear breakout, but Cardano has already moved above its recent consolidation. That difference gives today’s crypto price prediction an interesting starting point: can ADA extend its recovery, or will the broader market keep all 3 assets close to their current levels?
The chart readings show different strengths across these coins. Ethereum’s signals remain mixed, Solana faces some downside pressure, and Cardano has stronger bullish readings. Each setup still needs confirmation from price before a larger move becomes convincing.
Ethereum Price Remains Between $2,600 And $2,700 As Indicators Stay Mixed
Ethereum price continues to trade between $2,600 and $2,700 without a clear direction. Continued consolidation looks like the most likely outcome today unless stronger buying or selling pressure pushes ETH outside that range.
A look at the Ethereum chart shows $2,600 as the immediate support and $2,700 as resistance. A sustained move below support could open a path toward $2,500. A confirmed breakout above resistance could put $2,900 within reach, although that would require stronger bullish momentum.
ETHUSD Price Chart / TradingView.com
The supplied readings from the Investing.com 5-hour chart explain why the Ethereum price outlook remains balanced.
The RSI at 50.274 is close to its midpoint. This means recent price momentum gives neither buyers nor sellers a clear advantage.
The Stochastic at 46.341 also carries a neutral reading. ETH has room to move in either direction, but this indicator offers little confirmation of a breakout.
The MACD at 4.39 carries a buy signal. It provides some support for the bullish case, although Ethereum price still needs to clear resistance.
The Ultimate Oscillator at 45.871 carries a sell signal. That weaker reading reduces confidence in an immediate rally and supports the possibility of continued consolidation.
Indicator Value Signal RSI (14) 50.274 Neutral Stochastic (9,6) 46.341 Neutral MACD (12,26) 4.39 Buy Ultimate Oscillator 45.871 Sell
Ethereum Price Prediction For Today
Bullish Scenario: ETH holds above $2,700 after a breakout, which could open the way toward $2,900.
Neutral Scenario: Ethereum continues to trade between $2,600 and $2,700 as mixed momentum prevents a decisive move.
Bearish Scenario: ETH loses $2,600 support, which could bring $2,500 into play today.
Solana Price Holds Its Range Despite Weaker Momentum Readings
Solana price remains between $116 and $123. This range defines the immediate outlook, although its indicator readings show more weakness than Ethereum’s.
A break below $116 could take SOL toward $112. A sustained move above $123 could open the way toward $128 and potentially $130 before the day ends.
SOLUSD Price Chart / TradingView.com
The supplied Investing.com 5-hour chart readings show why confirmation matters here.
The RSI at 49.061 remains neutral, but its position slightly below 50 gives sellers a small momentum advantage.
The Stochastic at 39.806 carries a sell signal. It points to weaker recent price momentum and increases the risk of another support test.
The MACD at 0.093 carries a buy signal. This offers some bullish support, although the positive reading alone cannot confirm a move above $123.
The Ultimate Oscillator at 36.169 carries a sell signal. It reinforces the weaker momentum picture and makes an immediate rally less convincing.
Indicator Value Signal RSI (14) 49.061 Neutral Stochastic (9,6) 39.806 Sell MACD (12,26) 0.093 Buy Ultimate Oscillator 36.169 Sell
Solana Price Prediction For Today
Bullish Scenario: SOL breaks above $123 and holds that level, with $128 to $130 as possible targets.
Neutral Scenario: Solana continues to consolidate between $116 and $123 without a confirmed breakout.
Bearish Scenario: SOL falls below $116, which could expose the next downside level around $112.
Cardano Price Tests Its Breakout After Monday’s Recovery
Cardano price broke above its consolidation on Monday and reached approximately $0.277. ADA has since pulled back toward $0.269, so the immediate question is whether that breakout can hold.
The supplied Investing.com 5-hour chart readings favour buyers.
ADAxUSD Price Chart / TradingView.com
The RSI at 62.556 carries a buy signal and shows stronger bullish momentum without reaching the usual overbought threshold of 70.
The Stochastic at 78.58 also carries a buy signal. However, its proximity to 80 means the recent advance could face a pause.
The MACD at 0.005 carries a buy signal and supports the recovery. Continued price strength would help confirm that signal.
The Ultimate Oscillator at 56.948 carries a buy signal. Its position above 50 adds support to the bullish outlook.
Indicator Value Signal RSI (14) 62.556 Buy Stochastic (9,6) 78.58 Buy MACD (12,26) 0.005 Buy Ultimate Oscillator 56.948 Buy
Cardano Price Prediction For Today
Bullish Scenario: ADA reclaims $0.27 and clears the recent $0.277 high, which could open a path toward $0.29.
Neutral Scenario: Cardano consolidates near $0.269 as buyers attempt to preserve Monday’s breakout.
Bearish Scenario: ADA loses $0.26 and retreats toward $0.23. A further decline toward $0.22 would require stronger selling pressure and remains the least likely supplied scenario.
Cardano currently has the strongest indicator readings, but Ethereum and Solana still need to escape their ranges.
FAQs
How much will 1 Ethereum be worth in 2030?
By 2030, mainstream financial institutions and market analysts project a realistic base-case value for Ethereum (ETH) between $8,000 and $22,000 per coin, though extreme forecasts range from a conservative $3,200 up to an optimistic $40,000+. Because cryptocurrency values are highly speculative and depend heavily on global software adoption, regulatory updates, and market liquidity, there is no single guaranteed price.
How high can Ethereum go in 2040?
Ethereum (ETH) could potentially reach between $10,000 and $50,000 by 2040 under institutional growth models, though extreme bull cases project prices as high as $100,000.
Will Cardano ADA reach $10?
Most mainstream analytical models and forecasting platforms consider it highly improbable for Cardano (ADA) to reach $10 in the near future.
Subscribe to our YouTube channel for daily crypto updates, market insights, and expert analysis.
The post Crypto Price Predictions for Today, October 6: Ethereum (ETH), Solana (SOL), Cardano (ADA) appeared first on CaptainAltcoin.
Crypto Price Predictions for Today, October 6: Ethereum (ETH), Solana (SOL), Cardano (ADA)
Ethereum and Solana enter October 6 without a clear breakout, but Cardano has already moved above its recent consolidation. That difference gives today’s crypto price prediction an interesting starting point: can ADA extend its recovery, or will the broader market keep all 3 assets close to their current levels?
The chart readings show different strengths across these coins. Ethereum’s signals remain mixed, Solana faces some downside pressure, and Cardano has stronger bullish readings. Each setup still needs confirmation from price before a larger move becomes convincing.
Ethereum Price Remains Between $2,600 And $2,700 As Indicators Stay Mixed
Ethereum price continues to trade between $2,600 and $2,700 without a clear direction. Continued consolidation looks like the most likely outcome today unless stronger buying or selling pressure pushes ETH outside that range.
A look at the Ethereum chart shows $2,600 as the immediate support and $2,700 as resistance. A sustained move below support could open a path toward $2,500. A confirmed breakout above resistance could put $2,900 within reach, although that would require stronger bullish momentum.
ETHUSD Price Chart / TradingView.com
The supplied readings from the Investing.com 5-hour chart explain why the Ethereum price outlook remains balanced.
The RSI at 50.274 is close to its midpoint. This means recent price momentum gives neither buyers nor sellers a clear advantage.
The Stochastic at 46.341 also carries a neutral reading. ETH has room to move in either direction, but this indicator offers little confirmation of a breakout.
The MACD at 4.39 carries a buy signal. It provides some support for the bullish case, although Ethereum price still needs to clear resistance.
The Ultimate Oscillator at 45.871 carries a sell signal. That weaker reading reduces confidence in an immediate rally and supports the possibility of continued consolidation.
Indicator Value Signal RSI (14) 50.274 Neutral Stochastic (9,6) 46.341 Neutral MACD (12,26) 4.39 Buy Ultimate Oscillator 45.871 Sell
Ethereum Price Prediction For Today
Bullish Scenario: ETH holds above $2,700 after a breakout, which could open the way toward $2,900.
Neutral Scenario: Ethereum continues to trade between $2,600 and $2,700 as mixed momentum prevents a decisive move.
Bearish Scenario: ETH loses $2,600 support, which could bring $2,500 into play today.
Solana Price Holds Its Range Despite Weaker Momentum Readings
Solana price remains between $116 and $123. This range defines the immediate outlook, although its indicator readings show more weakness than Ethereum’s.
A break below $116 could take SOL toward $112. A sustained move above $123 could open the way toward $128 and potentially $130 before the day ends.
SOLUSD Price Chart / TradingView.com
The supplied Investing.com 5-hour chart readings show why confirmation matters here.
The RSI at 49.061 remains neutral, but its position slightly below 50 gives sellers a small momentum advantage.
The Stochastic at 39.806 carries a sell signal. It points to weaker recent price momentum and increases the risk of another support test.
The MACD at 0.093 carries a buy signal. This offers some bullish support, although the positive reading alone cannot confirm a move above $123.
The Ultimate Oscillator at 36.169 carries a sell signal. It reinforces the weaker momentum picture and makes an immediate rally less convincing.
Indicator Value Signal RSI (14) 49.061 Neutral Stochastic (9,6) 39.806 Sell MACD (12,26) 0.093 Buy Ultimate Oscillator 36.169 Sell
Solana Price Prediction For Today
Bullish Scenario: SOL breaks above $123 and holds that level, with $128 to $130 as possible targets.
Neutral Scenario: Solana continues to consolidate between $116 and $123 without a confirmed breakout.
Bearish Scenario: SOL falls below $116, which could expose the next downside level around $112.
Cardano Price Tests Its Breakout After Monday’s Recovery
Cardano price broke above its consolidation on Monday and reached approximately $0.277. ADA has since pulled back toward $0.269, so the immediate question is whether that breakout can hold.
The supplied Investing.com 5-hour chart readings favour buyers.
ADAxUSD Price Chart / TradingView.com
The RSI at 62.556 carries a buy signal and shows stronger bullish momentum without reaching the usual overbought threshold of 70.
The Stochastic at 78.58 also carries a buy signal. However, its proximity to 80 means the recent advance could face a pause.
The MACD at 0.005 carries a buy signal and supports the recovery. Continued price strength would help confirm that signal.
The Ultimate Oscillator at 56.948 carries a buy signal. Its position above 50 adds support to the bullish outlook.
Indicator Value Signal RSI (14) 62.556 Buy Stochastic (9,6) 78.58 Buy MACD (12,26) 0.005 Buy Ultimate Oscillator 56.948 Buy
Cardano Price Prediction For Today
Bullish Scenario: ADA reclaims $0.27 and clears the recent $0.277 high, which could open a path toward $0.29.
Neutral Scenario: Cardano consolidates near $0.269 as buyers attempt to preserve Monday’s breakout.
Bearish Scenario: ADA loses $0.26 and retreats toward $0.23. A further decline toward $0.22 would require stronger selling pressure and remains the least likely supplied scenario.
Cardano currently has the strongest indicator readings, but Ethereum and Solana still need to escape their ranges.
FAQs
How much will 1 Ethereum be worth in 2030?
By 2030, mainstream financial institutions and market analysts project a realistic base-case value for Ethereum (ETH) between $8,000 and $22,000 per coin, though extreme forecasts range from a conservative $3,200 up to an optimistic $40,000+. Because cryptocurrency values are highly speculative and depend heavily on global software adoption, regulatory updates, and market liquidity, there is no single guaranteed price.
How high can Ethereum go in 2040?
Ethereum (ETH) could potentially reach between $10,000 and $50,000 by 2040 under institutional growth models, though extreme bull cases project prices as high as $100,000.
Will Cardano ADA reach $10?
Most mainstream analytical models and forecasting platforms consider it highly improbable for Cardano (ADA) to reach $10 in the near future.
Subscribe to our YouTube channel for daily crypto updates, market insights, and expert analysis.
The post Crypto Price Predictions for Today, October 6: Ethereum (ETH), Solana (SOL), Cardano (ADA) appeared first on CaptainAltcoin.
The chart readings show different strengths across these coins. Ethereum’s signals remain mixed, Solana faces some downside pressure, and Cardano has stronger bullish readings. Each setup still needs confirmation from price before a larger move becomes convincing.
Ethereum Price Remains Between $2,600 And $2,700 As Indicators Stay Mixed
Ethereum price continues to trade between $2,600 and $2,700 without a clear direction. Continued consolidation looks like the most likely outcome today unless stronger buying or selling pressure pushes ETH outside that range.
A look at the Ethereum chart shows $2,600 as the immediate support and $2,700 as resistance. A sustained move below support could open a path toward $2,500. A confirmed breakout above resistance could put $2,900 within reach, although that would require stronger bullish momentum.
ETHUSD Price Chart / TradingView.com
The supplied readings from the Investing.com 5-hour chart explain why the Ethereum price outlook remains balanced.
The RSI at 50.274 is close to its midpoint. This means recent price momentum gives neither buyers nor sellers a clear advantage.
The Stochastic at 46.341 also carries a neutral reading. ETH has room to move in either direction, but this indicator offers little confirmation of a breakout.
The MACD at 4.39 carries a buy signal. It provides some support for the bullish case, although Ethereum price still needs to clear resistance.
The Ultimate Oscillator at 45.871 carries a sell signal. That weaker reading reduces confidence in an immediate rally and supports the possibility of continued consolidation.
Indicator Value Signal RSI (14) 50.274 Neutral Stochastic (9,6) 46.341 Neutral MACD (12,26) 4.39 Buy Ultimate Oscillator 45.871 Sell
Ethereum Price Prediction For Today
Bullish Scenario: ETH holds above $2,700 after a breakout, which could open the way toward $2,900.
Neutral Scenario: Ethereum continues to trade between $2,600 and $2,700 as mixed momentum prevents a decisive move.
Bearish Scenario: ETH loses $2,600 support, which could bring $2,500 into play today.
Solana Price Holds Its Range Despite Weaker Momentum Readings
Solana price remains between $116 and $123. This range defines the immediate outlook, although its indicator readings show more weakness than Ethereum’s.
A break below $116 could take SOL toward $112. A sustained move above $123 could open the way toward $128 and potentially $130 before the day ends.
SOLUSD Price Chart / TradingView.com
The supplied Investing.com 5-hour chart readings show why confirmation matters here.
The RSI at 49.061 remains neutral, but its position slightly below 50 gives sellers a small momentum advantage.
The Stochastic at 39.806 carries a sell signal. It points to weaker recent price momentum and increases the risk of another support test.
The MACD at 0.093 carries a buy signal. This offers some bullish support, although the positive reading alone cannot confirm a move above $123.
The Ultimate Oscillator at 36.169 carries a sell signal. It reinforces the weaker momentum picture and makes an immediate rally less convincing.
Indicator Value Signal RSI (14) 49.061 Neutral Stochastic (9,6) 39.806 Sell MACD (12,26) 0.093 Buy Ultimate Oscillator 36.169 Sell
Solana Price Prediction For Today
Bullish Scenario: SOL breaks above $123 and holds that level, with $128 to $130 as possible targets.
Neutral Scenario: Solana continues to consolidate between $116 and $123 without a confirmed breakout.
Bearish Scenario: SOL falls below $116, which could expose the next downside level around $112.
Cardano Price Tests Its Breakout After Monday’s Recovery
Cardano price broke above its consolidation on Monday and reached approximately $0.277. ADA has since pulled back toward $0.269, so the immediate question is whether that breakout can hold.
The supplied Investing.com 5-hour chart readings favour buyers.
ADAxUSD Price Chart / TradingView.com
The RSI at 62.556 carries a buy signal and shows stronger bullish momentum without reaching the usual overbought threshold of 70.
The Stochastic at 78.58 also carries a buy signal. However, its proximity to 80 means the recent advance could face a pause.
The MACD at 0.005 carries a buy signal and supports the recovery. Continued price strength would help confirm that signal.
The Ultimate Oscillator at 56.948 carries a buy signal. Its position above 50 adds support to the bullish outlook.
Indicator Value Signal RSI (14) 62.556 Buy Stochastic (9,6) 78.58 Buy MACD (12,26) 0.005 Buy Ultimate Oscillator 56.948 Buy
Cardano Price Prediction For Today
Bullish Scenario: ADA reclaims $0.27 and clears the recent $0.277 high, which could open a path toward $0.29.
Neutral Scenario: Cardano consolidates near $0.269 as buyers attempt to preserve Monday’s breakout.
Bearish Scenario: ADA loses $0.26 and retreats toward $0.23. A further decline toward $0.22 would require stronger selling pressure and remains the least likely supplied scenario.
Cardano currently has the strongest indicator readings, but Ethereum and Solana still need to escape their ranges.
FAQs
How much will 1 Ethereum be worth in 2030?
By 2030, mainstream financial institutions and market analysts project a realistic base-case value for Ethereum (ETH) between $8,000 and $22,000 per coin, though extreme forecasts range from a conservative $3,200 up to an optimistic $40,000+. Because cryptocurrency values are highly speculative and depend heavily on global software adoption, regulatory updates, and market liquidity, there is no single guaranteed price.
How high can Ethereum go in 2040?
Ethereum (ETH) could potentially reach between $10,000 and $50,000 by 2040 under institutional growth models, though extreme bull cases project prices as high as $100,000.
Will Cardano ADA reach $10?
Most mainstream analytical models and forecasting platforms consider it highly improbable for Cardano (ADA) to reach $10 in the near future.
Subscribe to our YouTube channel for daily crypto updates, market insights, and expert analysis.
The post Crypto Price Predictions for Today, October 6: Ethereum (ETH), Solana (SOL), Cardano (ADA) appeared first on CaptainAltcoin.
1
336
XRP Price Warning: Trapped Under Heavy SupplyVeteran trader Peter Brandt has shared a detailed take on the XRP price today, and his view is mixed.
He sees a potential cup-and-handle structure on the chart that could support a move toward roughly $2.16. But at the same time, he thinks XRP has a major technical problem: a large amount of overhead supply.
Brandt also compared XRP with several other crypto charts and made it clear that Monero is his favorite setup by far.
Brandt Sees a Measured Move Toward $2.16
Brandt’s XRP chart shows a possible cup-and-handle structure developing on the weekly timeframe.
His measured move comes from the height of the inverted head-and-shoulders structure, projected upward from the breakout area.
That gives him a target near $2.16.
But Brandt also warns that chart patterns are not fixed. A setup can start as one pattern and later develop into something else.
That is exactly what he thinks may be happening here.
The right shoulder on XRP’s structure looks incomplete and somewhat abbreviated, so he thinks the market may still spend more time building that part of the pattern.
$XRP Excuse the rant I am about to unleash I believe in a concept called "measured moves" Targets or objectives are not sacred Charts often fail to deliver what we first identify and morph into something else I have identified a C&H in XRP On a larger time frame this C&H might be the right shoulder of a H&S The measured move would be to 2.16 with is the height of the inverted H&S (closing price, daily) projected upwards Chart change One pattern is identified only to turn into something else The right shoulder is poorly formed and abbreviated – this would suggest further right shoulder development is likely, but NOT necessary Note in XRP there is a TON of overhead supply to work through This is a negative for XRP Please note that I could care less about the fundamentals of XRP or any other coin than BTC XRP fans, please don’t take this as an offense I trade price. Price is all that matters to me Look at the charts of some other coins — using the same time period. $XRP has all that supply overhead, but look at $XMR — all the supply has been absorbed. It is clear sailing ahead. Or $SOL. Now this is a Cup and Handle on a different level than XRP. Or ETH — massive congestion without the same type of overhead supply that we find in XRP. Or XLM – overhead supply, but not in same magnitude as XRP Of these, my favorite by far is XMR. I do not know the fundamental narrative. I do not need to know. I write about these things as my contribution to the @BitcoinLive1 collaborative service. Trial memberships are presently available for $97. That less than what you will lose on your next losing trade. You have everything to gain by giving BitcoinLive a trial here https://t.co/7xkEgygNFY This sale end very soon
— The Factor Report (@PeterLBrandt) October 6, 2026
That would mean XRP may not move directly toward $2.16 from current levels.
The Bigger XRP Problem Is Overhead Supply
This is the part of Brandt’s analysis that stands out most.
The weekly chart shows a large zone of previous trading activity between roughly $1.70 and $3.50.
That creates a lot of potential supply above the current price.
In practice, many traders who bought XRP at higher levels may be waiting for price to return so they can exit near breakeven.
That can make rallies harder.
Brandt sees this as a clear negative for XRP because price has to work through multiple layers of old supply before the chart becomes cleaner.
The upper horizontal area around $3.50-$3.70 is especially important because it lines up with the previous major peak region.
So even if the XRP price reaches $2.16, there is still a lot of technical work left above that level.
Read also: Claude AI Predicts XRP and Solana Prices By the End of November
XRP’s Weekly Structure Is Better, But Not Clean
The chart does show improvement.
XRP has already broken out from the huge multi-year triangle that contained price for years, and it is now trading near $1.50 after recovering from a recent low close to $1.
That part is constructive.
But the structure above price is still messy.
There is resistance near $1.60-$1.70, then another broader supply region extending toward the prior highs.
That means XRP can still move higher, but it may not have the same open-air setup as some other assets.
Why Brandt Prefers Monero
Brandt’s Monero chart looks much cleaner.
XMR is trading near $560, right around a major long-term resistance area.
The difference is that most of the historical supply above current price has already been absorbed.
That is the key point.
On the XMR chart, price has spent years working through old resistance and has now returned to the upper boundary with much less congestion above it.
Brandt describes that as “clear sailing ahead.”
If XMR breaks cleanly above the current long-term resistance zone, the chart does not show the same kind of heavy overhead structure that the XRP price still has.
The Difference Between XRP and XMR
The contrast is simple.
XRP:
possible cup-and-handle
measured move near $2.16
large amount of historical supply overhead
multiple resistance zones still ahead
XMR:
long-term resistance being tested
previous supply largely absorbed
cleaner structure above current price
less technical congestion
That is why Brandt favors Monero.
He is not saying XRP cannot rally. His chart actually leaves room for a move toward $2.16.
His point is that XRP has more resistance to fight through.
What This Means for XRP
Brandt’s view is not outright bearish.
The potential $2.16 measured move is still valid if the structure continues developing.
The concern is that XRP may need more time and more buying pressure to absorb the supply sitting above current levels.
That makes $1.70 the first important area to watch.
If XRP can reclaim that zone and hold above it, the path toward $2.16 becomes much cleaner.
If it keeps getting rejected below $1.70, the cup-and-handle setup may need more time to develop.
Brandt’s core message is simple: XRP has upside potential, but Monero currently has the cleaner chart.
For more crypto news and price predictions, click here.
Subscribe to our YouTube channel for daily crypto updates, market insights, and expert analysis.
The post XRP Price Warning: Trapped Under Heavy Supply appeared first on CaptainAltcoin.
XRP Price Warning: Trapped Under Heavy Supply
Veteran trader Peter Brandt has shared a detailed take on the XRP price today, and his view is mixed.
He sees a potential cup-and-handle structure on the chart that could support a move toward roughly $2.16. But at the same time, he thinks XRP has a major technical problem: a large amount of overhead supply.
Brandt also compared XRP with several other crypto charts and made it clear that Monero is his favorite setup by far.
Brandt Sees a Measured Move Toward $2.16
Brandt’s XRP chart shows a possible cup-and-handle structure developing on the weekly timeframe.
His measured move comes from the height of the inverted head-and-shoulders structure, projected upward from the breakout area.
That gives him a target near $2.16.
But Brandt also warns that chart patterns are not fixed. A setup can start as one pattern and later develop into something else.
That is exactly what he thinks may be happening here.
The right shoulder on XRP’s structure looks incomplete and somewhat abbreviated, so he thinks the market may still spend more time building that part of the pattern.
$XRP Excuse the rant I am about to unleash I believe in a concept called "measured moves" Targets or objectives are not sacred Charts often fail to deliver what we first identify and morph into something else I have identified a C&H in XRP On a larger time frame this C&H might be the right shoulder of a H&S The measured move would be to 2.16 with is the height of the inverted H&S (closing price, daily) projected upwards Chart change One pattern is identified only to turn into something else The right shoulder is poorly formed and abbreviated – this would suggest further right shoulder development is likely, but NOT necessary Note in XRP there is a TON of overhead supply to work through This is a negative for XRP Please note that I could care less about the fundamentals of XRP or any other coin than BTC XRP fans, please don’t take this as an offense I trade price. Price is all that matters to me Look at the charts of some other coins — using the same time period. $XRP has all that supply overhead, but look at $XMR — all the supply has been absorbed. It is clear sailing ahead. Or $SOL. Now this is a Cup and Handle on a different level than XRP. Or ETH — massive congestion without the same type of overhead supply that we find in XRP. Or XLM – overhead supply, but not in same magnitude as XRP Of these, my favorite by far is XMR. I do not know the fundamental narrative. I do not need to know. I write about these things as my contribution to the @BitcoinLive1 collaborative service. Trial memberships are presently available for $97. That less than what you will lose on your next losing trade. You have everything to gain by giving BitcoinLive a trial here https://t.co/7xkEgygNFY This sale end very soon
— The Factor Report (@PeterLBrandt) October 6, 2026
That would mean XRP may not move directly toward $2.16 from current levels.
The Bigger XRP Problem Is Overhead Supply
This is the part of Brandt’s analysis that stands out most.
The weekly chart shows a large zone of previous trading activity between roughly $1.70 and $3.50.
That creates a lot of potential supply above the current price.
In practice, many traders who bought XRP at higher levels may be waiting for price to return so they can exit near breakeven.
That can make rallies harder.
Brandt sees this as a clear negative for XRP because price has to work through multiple layers of old supply before the chart becomes cleaner.
The upper horizontal area around $3.50-$3.70 is especially important because it lines up with the previous major peak region.
So even if the XRP price reaches $2.16, there is still a lot of technical work left above that level.
Read also: Claude AI Predicts XRP and Solana Prices By the End of November
XRP’s Weekly Structure Is Better, But Not Clean
The chart does show improvement.
XRP has already broken out from the huge multi-year triangle that contained price for years, and it is now trading near $1.50 after recovering from a recent low close to $1.
That part is constructive.
But the structure above price is still messy.
There is resistance near $1.60-$1.70, then another broader supply region extending toward the prior highs.
That means XRP can still move higher, but it may not have the same open-air setup as some other assets.
Why Brandt Prefers Monero
Brandt’s Monero chart looks much cleaner.
XMR is trading near $560, right around a major long-term resistance area.
The difference is that most of the historical supply above current price has already been absorbed.
That is the key point.
On the XMR chart, price has spent years working through old resistance and has now returned to the upper boundary with much less congestion above it.
Brandt describes that as “clear sailing ahead.”
If XMR breaks cleanly above the current long-term resistance zone, the chart does not show the same kind of heavy overhead structure that the XRP price still has.
The Difference Between XRP and XMR
The contrast is simple.
XRP:
possible cup-and-handle
measured move near $2.16
large amount of historical supply overhead
multiple resistance zones still ahead
XMR:
long-term resistance being tested
previous supply largely absorbed
cleaner structure above current price
less technical congestion
That is why Brandt favors Monero.
He is not saying XRP cannot rally. His chart actually leaves room for a move toward $2.16.
His point is that XRP has more resistance to fight through.
What This Means for XRP
Brandt’s view is not outright bearish.
The potential $2.16 measured move is still valid if the structure continues developing.
The concern is that XRP may need more time and more buying pressure to absorb the supply sitting above current levels.
That makes $1.70 the first important area to watch.
If XRP can reclaim that zone and hold above it, the path toward $2.16 becomes much cleaner.
If it keeps getting rejected below $1.70, the cup-and-handle setup may need more time to develop.
Brandt’s core message is simple: XRP has upside potential, but Monero currently has the cleaner chart.
For more crypto news and price predictions, click here.
Subscribe to our YouTube channel for daily crypto updates, market insights, and expert analysis.
The post XRP Price Warning: Trapped Under Heavy Supply appeared first on CaptainAltcoin.
He sees a potential cup-and-handle structure on the chart that could support a move toward roughly $2.16. But at the same time, he thinks XRP has a major technical problem: a large amount of overhead supply.
Brandt also compared XRP with several other crypto charts and made it clear that Monero is his favorite setup by far.
Brandt Sees a Measured Move Toward $2.16
Brandt’s XRP chart shows a possible cup-and-handle structure developing on the weekly timeframe.
His measured move comes from the height of the inverted head-and-shoulders structure, projected upward from the breakout area.
That gives him a target near $2.16.
But Brandt also warns that chart patterns are not fixed. A setup can start as one pattern and later develop into something else.
That is exactly what he thinks may be happening here.
The right shoulder on XRP’s structure looks incomplete and somewhat abbreviated, so he thinks the market may still spend more time building that part of the pattern.
$XRP Excuse the rant I am about to unleash I believe in a concept called "measured moves" Targets or objectives are not sacred Charts often fail to deliver what we first identify and morph into something else I have identified a C&H in XRP On a larger time frame this C&H might be the right shoulder of a H&S The measured move would be to 2.16 with is the height of the inverted H&S (closing price, daily) projected upwards Chart change One pattern is identified only to turn into something else The right shoulder is poorly formed and abbreviated – this would suggest further right shoulder development is likely, but NOT necessary Note in XRP there is a TON of overhead supply to work through This is a negative for XRP Please note that I could care less about the fundamentals of XRP or any other coin than BTC XRP fans, please don’t take this as an offense I trade price. Price is all that matters to me Look at the charts of some other coins — using the same time period. $XRP has all that supply overhead, but look at $XMR — all the supply has been absorbed. It is clear sailing ahead. Or $SOL. Now this is a Cup and Handle on a different level than XRP. Or ETH — massive congestion without the same type of overhead supply that we find in XRP. Or XLM – overhead supply, but not in same magnitude as XRP Of these, my favorite by far is XMR. I do not know the fundamental narrative. I do not need to know. I write about these things as my contribution to the @BitcoinLive1 collaborative service. Trial memberships are presently available for $97. That less than what you will lose on your next losing trade. You have everything to gain by giving BitcoinLive a trial here https://t.co/7xkEgygNFY This sale end very soon
— The Factor Report (@PeterLBrandt) October 6, 2026
That would mean XRP may not move directly toward $2.16 from current levels.
The Bigger XRP Problem Is Overhead Supply
This is the part of Brandt’s analysis that stands out most.
The weekly chart shows a large zone of previous trading activity between roughly $1.70 and $3.50.
That creates a lot of potential supply above the current price.
In practice, many traders who bought XRP at higher levels may be waiting for price to return so they can exit near breakeven.
That can make rallies harder.
Brandt sees this as a clear negative for XRP because price has to work through multiple layers of old supply before the chart becomes cleaner.
The upper horizontal area around $3.50-$3.70 is especially important because it lines up with the previous major peak region.
So even if the XRP price reaches $2.16, there is still a lot of technical work left above that level.
Read also: Claude AI Predicts XRP and Solana Prices By the End of November
XRP’s Weekly Structure Is Better, But Not Clean
The chart does show improvement.
XRP has already broken out from the huge multi-year triangle that contained price for years, and it is now trading near $1.50 after recovering from a recent low close to $1.
That part is constructive.
But the structure above price is still messy.
There is resistance near $1.60-$1.70, then another broader supply region extending toward the prior highs.
That means XRP can still move higher, but it may not have the same open-air setup as some other assets.
Why Brandt Prefers Monero
Brandt’s Monero chart looks much cleaner.
XMR is trading near $560, right around a major long-term resistance area.
The difference is that most of the historical supply above current price has already been absorbed.
That is the key point.
On the XMR chart, price has spent years working through old resistance and has now returned to the upper boundary with much less congestion above it.
Brandt describes that as “clear sailing ahead.”
If XMR breaks cleanly above the current long-term resistance zone, the chart does not show the same kind of heavy overhead structure that the XRP price still has.
The Difference Between XRP and XMR
The contrast is simple.
XRP:
possible cup-and-handle
measured move near $2.16
large amount of historical supply overhead
multiple resistance zones still ahead
XMR:
long-term resistance being tested
previous supply largely absorbed
cleaner structure above current price
less technical congestion
That is why Brandt favors Monero.
He is not saying XRP cannot rally. His chart actually leaves room for a move toward $2.16.
His point is that XRP has more resistance to fight through.
What This Means for XRP
Brandt’s view is not outright bearish.
The potential $2.16 measured move is still valid if the structure continues developing.
The concern is that XRP may need more time and more buying pressure to absorb the supply sitting above current levels.
That makes $1.70 the first important area to watch.
If XRP can reclaim that zone and hold above it, the path toward $2.16 becomes much cleaner.
If it keeps getting rejected below $1.70, the cup-and-handle setup may need more time to develop.
Brandt’s core message is simple: XRP has upside potential, but Monero currently has the cleaner chart.
For more crypto news and price predictions, click here.
Subscribe to our YouTube channel for daily crypto updates, market insights, and expert analysis.
The post XRP Price Warning: Trapped Under Heavy Supply appeared first on CaptainAltcoin.
1
4
1k
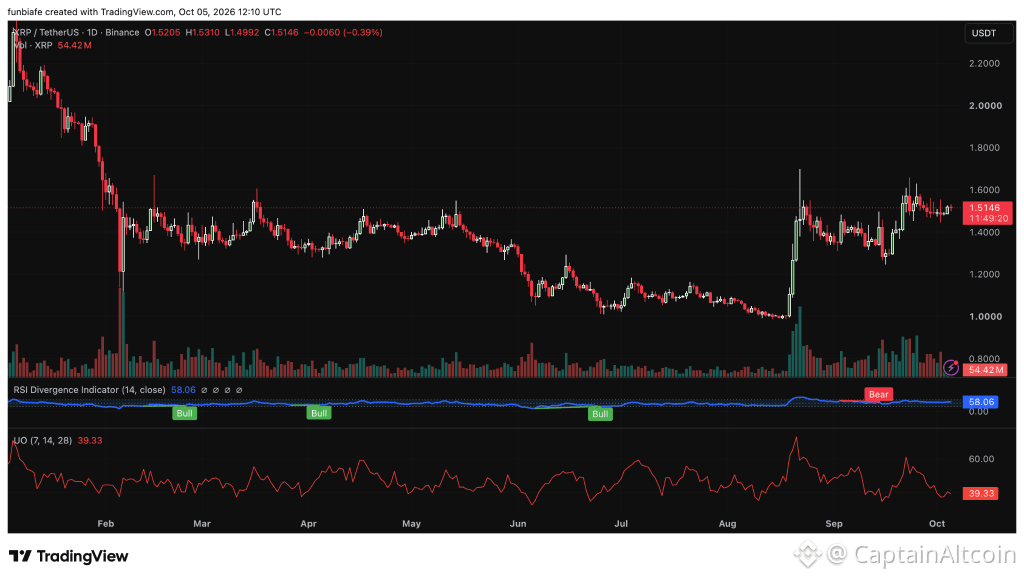
Article
XRP Price Prediction for Today (October 6)The XRP price is around $1.5146, down 0.39% on the daily candle. XRP has traded between $1.4992 and $1.5310, with 54.42 million XRP in volume.
The broader picture still points to a recovery. XRP has climbed about 51% from the $1.00 macro bottom shown on the chart. Now, the focus is on whether buyers can push the XRP price through $1.60. If they do, $1.80, $2.00 and $2.20 become the next levels to watch.
The XRP Price Is Close to $1.60
We had a look at the XRP chart, and the momentum readings are giving a mixed picture. The RSI is at 58.06, which keeps it above the 50 level, but the indicator is moving lower. The chart has three bullish divergence labels and one bearish one, with the bearish signal being the most recent.
Source: TradingView
The Ultimate Oscillator is at 39.33, below the 40 level that marks oversold conditions. So XRP still has a positive RSI reading, but the momentum behind the move has cooled.
For XRP, $1.60 is the key resistance. A break above it could open the way toward $1.80, then $2.00 and $2.20. If buyers can’t clear $1.60, $1.20 is the first major support below the current price. And $1.00 remains the key macro support.
Read Also: XRP Price Could Hit $10 Without the Massive Capital Inflows Most Expect!
XRPL Has Another Development to Watch
The XRP Ledger also has a protocol update coming in October. Its Batch functionality allows multiple transactions to be submitted together and processed using different atomic modes, including an “All or Nothing” option. This can make complex operations easier for developers to execute.
There is one correction to the original upgrade timeline. The initial information referred to the BatchV1_1 amendment activating on October 9, 2026. XRPL documentation instead identifies fixBatchV1_2 as the October amendment, following the XRPL 3.4.1 release.
Batch transactions can be useful for operations such as atomic swaps and other activities that require multiple transactions to work together. More functionality on the XRP Ledger could support developer activity and network use, although the upgrade alone does not guarantee a higher XRP price.
XRP Whales are Adding to Their Holdings
Whale activity is another factor worth watching. Santiment data reported in July showed wallets holding between 100,000 and 100 million XRP adding around 600 million XRP over five weeks. Their combined holdings increased by 2.8%.
The buying took place during a period of limited price movement. If these large wallets keep accumulating as the XRP price approaches $1.60, their activity could become more important if the market breaks higher.
The regulatory picture has also become clearer. The SEC and Ripple ended their appeals in August 2025, leaving the existing court rulings in place. A September 2026 Bitwise filing states that XRP itself is not considered a security, and that programmatic and secondary-market XRP sales are not securities transactions either.
XRP price prediction for October 6
XRP is approaching an important resistance zone. A break above $1.60 could open the path toward $1.80, $2.00, and $2.20. A rejection at $1.60 could send the XRP price back toward $1.20, with $1.00 as the deeper support.
For October 6, $1.60 is the level to watch. If buyers clear it, the recovery could extend toward the higher resistance levels. If they fail, the support levels below $1.60 become more important.
The post XRP Price Prediction for Today (October 6) appeared first on CaptainAltcoin.
XRP Price Prediction for Today (October 6)
The XRP price is around $1.5146, down 0.39% on the daily candle. XRP has traded between $1.4992 and $1.5310, with 54.42 million XRP in volume.
The broader picture still points to a recovery. XRP has climbed about 51% from the $1.00 macro bottom shown on the chart. Now, the focus is on whether buyers can push the XRP price through $1.60. If they do, $1.80, $2.00 and $2.20 become the next levels to watch.
The XRP Price Is Close to $1.60
We had a look at the XRP chart, and the momentum readings are giving a mixed picture. The RSI is at 58.06, which keeps it above the 50 level, but the indicator is moving lower. The chart has three bullish divergence labels and one bearish one, with the bearish signal being the most recent.
Source: TradingView
The Ultimate Oscillator is at 39.33, below the 40 level that marks oversold conditions. So XRP still has a positive RSI reading, but the momentum behind the move has cooled.
For XRP, $1.60 is the key resistance. A break above it could open the way toward $1.80, then $2.00 and $2.20. If buyers can’t clear $1.60, $1.20 is the first major support below the current price. And $1.00 remains the key macro support.
Read Also: XRP Price Could Hit $10 Without the Massive Capital Inflows Most Expect!
XRPL Has Another Development to Watch
The XRP Ledger also has a protocol update coming in October. Its Batch functionality allows multiple transactions to be submitted together and processed using different atomic modes, including an “All or Nothing” option. This can make complex operations easier for developers to execute.
There is one correction to the original upgrade timeline. The initial information referred to the BatchV1_1 amendment activating on October 9, 2026. XRPL documentation instead identifies fixBatchV1_2 as the October amendment, following the XRPL 3.4.1 release.
Batch transactions can be useful for operations such as atomic swaps and other activities that require multiple transactions to work together. More functionality on the XRP Ledger could support developer activity and network use, although the upgrade alone does not guarantee a higher XRP price.
XRP Whales are Adding to Their Holdings
Whale activity is another factor worth watching. Santiment data reported in July showed wallets holding between 100,000 and 100 million XRP adding around 600 million XRP over five weeks. Their combined holdings increased by 2.8%.
The buying took place during a period of limited price movement. If these large wallets keep accumulating as the XRP price approaches $1.60, their activity could become more important if the market breaks higher.
The regulatory picture has also become clearer. The SEC and Ripple ended their appeals in August 2025, leaving the existing court rulings in place. A September 2026 Bitwise filing states that XRP itself is not considered a security, and that programmatic and secondary-market XRP sales are not securities transactions either.
XRP price prediction for October 6
XRP is approaching an important resistance zone. A break above $1.60 could open the path toward $1.80, $2.00, and $2.20. A rejection at $1.60 could send the XRP price back toward $1.20, with $1.00 as the deeper support.
For October 6, $1.60 is the level to watch. If buyers clear it, the recovery could extend toward the higher resistance levels. If they fail, the support levels below $1.60 become more important.
The post XRP Price Prediction for Today (October 6) appeared first on CaptainAltcoin.
The broader picture still points to a recovery. XRP has climbed about 51% from the $1.00 macro bottom shown on the chart. Now, the focus is on whether buyers can push the XRP price through $1.60. If they do, $1.80, $2.00 and $2.20 become the next levels to watch.
The XRP Price Is Close to $1.60
We had a look at the XRP chart, and the momentum readings are giving a mixed picture. The RSI is at 58.06, which keeps it above the 50 level, but the indicator is moving lower. The chart has three bullish divergence labels and one bearish one, with the bearish signal being the most recent.
Source: TradingView
The Ultimate Oscillator is at 39.33, below the 40 level that marks oversold conditions. So XRP still has a positive RSI reading, but the momentum behind the move has cooled.
For XRP, $1.60 is the key resistance. A break above it could open the way toward $1.80, then $2.00 and $2.20. If buyers can’t clear $1.60, $1.20 is the first major support below the current price. And $1.00 remains the key macro support.
Read Also: XRP Price Could Hit $10 Without the Massive Capital Inflows Most Expect!
XRPL Has Another Development to Watch
The XRP Ledger also has a protocol update coming in October. Its Batch functionality allows multiple transactions to be submitted together and processed using different atomic modes, including an “All or Nothing” option. This can make complex operations easier for developers to execute.
There is one correction to the original upgrade timeline. The initial information referred to the BatchV1_1 amendment activating on October 9, 2026. XRPL documentation instead identifies fixBatchV1_2 as the October amendment, following the XRPL 3.4.1 release.
Batch transactions can be useful for operations such as atomic swaps and other activities that require multiple transactions to work together. More functionality on the XRP Ledger could support developer activity and network use, although the upgrade alone does not guarantee a higher XRP price.
XRP Whales are Adding to Their Holdings
Whale activity is another factor worth watching. Santiment data reported in July showed wallets holding between 100,000 and 100 million XRP adding around 600 million XRP over five weeks. Their combined holdings increased by 2.8%.
The buying took place during a period of limited price movement. If these large wallets keep accumulating as the XRP price approaches $1.60, their activity could become more important if the market breaks higher.
The regulatory picture has also become clearer. The SEC and Ripple ended their appeals in August 2025, leaving the existing court rulings in place. A September 2026 Bitwise filing states that XRP itself is not considered a security, and that programmatic and secondary-market XRP sales are not securities transactions either.
XRP price prediction for October 6
XRP is approaching an important resistance zone. A break above $1.60 could open the path toward $1.80, $2.00, and $2.20. A rejection at $1.60 could send the XRP price back toward $1.20, with $1.00 as the deeper support.
For October 6, $1.60 is the level to watch. If buyers clear it, the recovery could extend toward the higher resistance levels. If they fail, the support levels below $1.60 become more important.
The post XRP Price Prediction for Today (October 6) appeared first on CaptainAltcoin.
1
566
Hedera News: DEX Volume Jumps 55% As Network Activity Picks UpHedera has seen a noticeable increase in on-chain activity over the past week, with decentralized exchange volume rising quickly and total value locked also moving higher.
Data from DefiLlama shows Hedera DEX volume increased by 55% over the past seven days, reaching roughly $49.32 million.
At the same time, the network’s TVL rose by nearly 5% in the past 24 hours, adding another positive signal for ecosystem activity.
SaucerSwap Leads the Increase
September 29 was the busiest day during the recent run.
Hedera processed more than $17 million in DEX trading volume that day, with SaucerSwap leading activity across the network.
Hedera’s Network Activity is ripping hard! The @Hedera blockchain has continued to gain traction in recent weeks. The chain has already recorded a nearly 5% increase in TVL in the past 24 hours. However, this is not the most notable update. According to DefiLlama data, Hedera’s DEX volume has increased by 55% in the past week, with $49.32 million in trading volume processed on the network. September 29 saw the most activity. On that day, Hedera recorded over $17M in trading volume across DEXes, with @SaucerSwapLabs leading the pack.
— BSCN (@BSCNews) October 5, 2026
That matters because stronger DEX volume usually points to more actual usage rather than simple speculative interest around the token itself.
More trading activity means users are interacting with Hedera-based liquidity pools, swapping assets, and moving capital through decentralized applications.
Read also: We Asked 3 AI Models If Hedera Price Can Reach $1 in 2027
Hedera’s On-Chain Activity Is Improving
The combination of higher TVL and higher DEX volume gives Hedera a stronger network story than price alone.
TVL measures how much capital is locked across DeFi protocols, so a 5% daily increase shows fresh funds entering the ecosystem.
The 55% weekly jump in DEX volume adds another layer, because it shows that capital is actively being used.
That is usually a healthier signal than TVL rising without a matching increase in transactions.
For HBAR holders, the main takeaway is that Hedera is seeing more real network activity at a time when interest in the ecosystem is already improving.
Recent attention around AI, enterprise use cases, and ETF demand has helped bring Hedera back into focus, and stronger DeFi activity gives the network another source of momentum.
The next question is whether this pace can continue.
If weekly DEX volume stays elevated and TVL keeps moving higher, Hedera could start building a more convincing growth trend across its DeFi ecosystem.
For more crypto news and price predictions, click here.
Subscribe to our YouTube channel for daily crypto updates, market insights, and expert analysis.
The post Hedera News: DEX Volume Jumps 55% as Network Activity Picks Up appeared first on CaptainAltcoin.
Hedera News: DEX Volume Jumps 55% As Network Activity Picks Up
Hedera has seen a noticeable increase in on-chain activity over the past week, with decentralized exchange volume rising quickly and total value locked also moving higher.
Data from DefiLlama shows Hedera DEX volume increased by 55% over the past seven days, reaching roughly $49.32 million.
At the same time, the network’s TVL rose by nearly 5% in the past 24 hours, adding another positive signal for ecosystem activity.
SaucerSwap Leads the Increase
September 29 was the busiest day during the recent run.
Hedera processed more than $17 million in DEX trading volume that day, with SaucerSwap leading activity across the network.
Hedera’s Network Activity is ripping hard! The @Hedera blockchain has continued to gain traction in recent weeks. The chain has already recorded a nearly 5% increase in TVL in the past 24 hours. However, this is not the most notable update. According to DefiLlama data, Hedera’s DEX volume has increased by 55% in the past week, with $49.32 million in trading volume processed on the network. September 29 saw the most activity. On that day, Hedera recorded over $17M in trading volume across DEXes, with @SaucerSwapLabs leading the pack.
— BSCN (@BSCNews) October 5, 2026
That matters because stronger DEX volume usually points to more actual usage rather than simple speculative interest around the token itself.
More trading activity means users are interacting with Hedera-based liquidity pools, swapping assets, and moving capital through decentralized applications.
Read also: We Asked 3 AI Models If Hedera Price Can Reach $1 in 2027
Hedera’s On-Chain Activity Is Improving
The combination of higher TVL and higher DEX volume gives Hedera a stronger network story than price alone.
TVL measures how much capital is locked across DeFi protocols, so a 5% daily increase shows fresh funds entering the ecosystem.
The 55% weekly jump in DEX volume adds another layer, because it shows that capital is actively being used.
That is usually a healthier signal than TVL rising without a matching increase in transactions.
For HBAR holders, the main takeaway is that Hedera is seeing more real network activity at a time when interest in the ecosystem is already improving.
Recent attention around AI, enterprise use cases, and ETF demand has helped bring Hedera back into focus, and stronger DeFi activity gives the network another source of momentum.
The next question is whether this pace can continue.
If weekly DEX volume stays elevated and TVL keeps moving higher, Hedera could start building a more convincing growth trend across its DeFi ecosystem.
For more crypto news and price predictions, click here.
Subscribe to our YouTube channel for daily crypto updates, market insights, and expert analysis.
The post Hedera News: DEX Volume Jumps 55% as Network Activity Picks Up appeared first on CaptainAltcoin.
Data from DefiLlama shows Hedera DEX volume increased by 55% over the past seven days, reaching roughly $49.32 million.
At the same time, the network’s TVL rose by nearly 5% in the past 24 hours, adding another positive signal for ecosystem activity.
SaucerSwap Leads the Increase
September 29 was the busiest day during the recent run.
Hedera processed more than $17 million in DEX trading volume that day, with SaucerSwap leading activity across the network.
Hedera’s Network Activity is ripping hard! The @Hedera blockchain has continued to gain traction in recent weeks. The chain has already recorded a nearly 5% increase in TVL in the past 24 hours. However, this is not the most notable update. According to DefiLlama data, Hedera’s DEX volume has increased by 55% in the past week, with $49.32 million in trading volume processed on the network. September 29 saw the most activity. On that day, Hedera recorded over $17M in trading volume across DEXes, with @SaucerSwapLabs leading the pack.
— BSCN (@BSCNews) October 5, 2026
That matters because stronger DEX volume usually points to more actual usage rather than simple speculative interest around the token itself.
More trading activity means users are interacting with Hedera-based liquidity pools, swapping assets, and moving capital through decentralized applications.
Read also: We Asked 3 AI Models If Hedera Price Can Reach $1 in 2027
Hedera’s On-Chain Activity Is Improving
The combination of higher TVL and higher DEX volume gives Hedera a stronger network story than price alone.
TVL measures how much capital is locked across DeFi protocols, so a 5% daily increase shows fresh funds entering the ecosystem.
The 55% weekly jump in DEX volume adds another layer, because it shows that capital is actively being used.
That is usually a healthier signal than TVL rising without a matching increase in transactions.
For HBAR holders, the main takeaway is that Hedera is seeing more real network activity at a time when interest in the ecosystem is already improving.
Recent attention around AI, enterprise use cases, and ETF demand has helped bring Hedera back into focus, and stronger DeFi activity gives the network another source of momentum.
The next question is whether this pace can continue.
If weekly DEX volume stays elevated and TVL keeps moving higher, Hedera could start building a more convincing growth trend across its DeFi ecosystem.
For more crypto news and price predictions, click here.
Subscribe to our YouTube channel for daily crypto updates, market insights, and expert analysis.
The post Hedera News: DEX Volume Jumps 55% as Network Activity Picks Up appeared first on CaptainAltcoin.
357
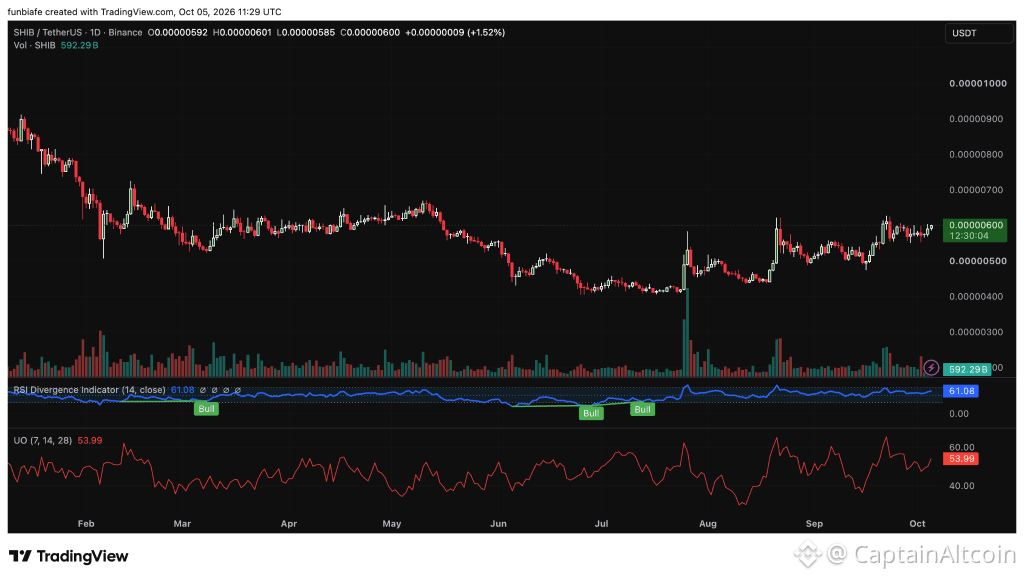
Article
Shiba Inu Price Prediction As SHIB Lands on SolanaShiba Inu has found a new route into the Solana ecosystem through Sunrise, giving SHIB access to Solana’s DeFi markets without replacing its Ethereum version. The announcement pushed the SHIB price about 4% higher, with the token now trading near $0.00000600.
The timing is interesting for SHIB. The token has already recovered 50% from the $0.00000400 area marked as its July 2026 bottom. Now the big question is whether the SHIB price can break above $0.00000650 and move toward $0.00000700 and $0.00000800.
SHIB Opens the Door to Solana DeFi
BSCN reported that Shiba Inu’s canonical Ethereum token is now accessible across Solana through Sunrise. This gives SHIB direct access to Solana’s DeFi markets and creates another route for liquidity between the two ecosystems.
Shiba Inu Landed On Solana Shiba Inu’s ethereum:0x95ad61b0a150d79219dcf64e1e6cc01f0b64c4ce canonical Ethereum token is now accessible across Solana (@solana) through Sunrise (@sunrise). The integration gives SHIB direct access to Solana’s DeFi markets. SHIB remains an ERC-20 token and is not leaving Ethereum. Sunrise creates a canonical Solana representation to reduce liquidity fragmentation.
— BSCN (@BSCNews) October 5, 2026
SHIB remains an ERC-20 token on Ethereum. Sunrise simply creates a canonical representation of SHIB on Solana, allowing the token to reach another blockchain without moving away from Ethereum.
BeInCrypto reported that the announcement helped lift the SHIB price by about 4%. That move gives the token some early positive reaction, but the chart shows that SHIB still has several resistance levels to clear before the recovery can go much further.
Shiba Inu just landed on Solana through Sunrise. That announcement alone was enough to push ethereum:0x95ad61b0a150d79219dcf64e1e6cc01f0b64c4ce up 4% today. Will the Solana listing bring new energy and momentum to the SHIB community? https://t.co/VfZV8Pbn7D
— BeInCrypto (@beincrypto) October 4, 2026
Read Also: Here’s Where Gold and Silver Prices Might be Headed This Week
The SHIB Price Tests $0.000006
We had a look at the SHIB chart, and the price is around $0.00000600, up 1.52% on the daily candle. The high for the candle is $0.00000601, and the low is $0.00000585. Volume has reached 592.29 billion SHIB.
Source: TradingView
The momentum indicators also lean to the bullish side. The RSI is at 61.08, which places it above the 50 level. The chart also shows three bullish divergence labels and no bearish labels. The Ultimate Oscillator is at 53.99, also above 50.
That gives the SHIB price a decent technical base, but buyers still need to push through the levels above $0.00000600. The first level to watch is $0.00000650. A break above it could open the way to $0.00000700, followed by $0.00000800, $0.00000900 and $0.00001000.
Read Also: How High Can Cardano (ADA) Price Go This Week
Can SHIB Reach $0.000010?
The SHIB price has already climbed 50% from the $0.00000400 macro bottom to $0.00000600. From the current level, reaching $0.00000800 would require another 33.3% move.
The $0.00000650 level is therefore important. If SHIB holds $0.00000600 and breaks above $0.00000650, then $0.00000700 and $0.00000800 become the next levels to watch. A move through those could put $0.00000900 and $0.00001000 within reach.
There’s also clear support below the current price. The first support is $0.00000500, followed by the $0.00000400 macro bottom. If SHIB breaks below $0.00000500, the recovery setup weakens and $0.00000400 could come back into view. The chart also marks $0.00000300 as deeper support.
For now, SHIB has a new connection to Solana’s DeFi ecosystem at a time when the token is already recovering from its 2026 low. The next key test is $0.00000650. A break above that level would put $0.00000700 and $0.00000800 in focus, with $0.00001000 remaining the bigger resistance target.
FAQs
Why is Shiba Inu available on Solana
Shiba Inu is now accessible on Solana through Sunrise, giving SHIB access to Solana’s DeFi markets and creating another route for liquidity. SHIB remains an ERC-20 token on Ethereum.
Can Shiba Inu reach $0.000010
The chart shows $0.00001000 as a major resistance target. For the SHIB price to reach that level, it would first need to clear $0.00000650, $0.00000700, $0.00000800 and $0.00000900.
Subscribe to our YouTube channel for daily crypto updates, market insights, and expert analysis.
The post Shiba Inu Price Prediction as SHIB Lands on Solana appeared first on CaptainAltcoin.
Shiba Inu Price Prediction As SHIB Lands on Solana
Shiba Inu has found a new route into the Solana ecosystem through Sunrise, giving SHIB access to Solana’s DeFi markets without replacing its Ethereum version. The announcement pushed the SHIB price about 4% higher, with the token now trading near $0.00000600.
The timing is interesting for SHIB. The token has already recovered 50% from the $0.00000400 area marked as its July 2026 bottom. Now the big question is whether the SHIB price can break above $0.00000650 and move toward $0.00000700 and $0.00000800.
SHIB Opens the Door to Solana DeFi
BSCN reported that Shiba Inu’s canonical Ethereum token is now accessible across Solana through Sunrise. This gives SHIB direct access to Solana’s DeFi markets and creates another route for liquidity between the two ecosystems.
Shiba Inu Landed On Solana Shiba Inu’s ethereum:0x95ad61b0a150d79219dcf64e1e6cc01f0b64c4ce canonical Ethereum token is now accessible across Solana (@solana) through Sunrise (@sunrise). The integration gives SHIB direct access to Solana’s DeFi markets. SHIB remains an ERC-20 token and is not leaving Ethereum. Sunrise creates a canonical Solana representation to reduce liquidity fragmentation.
— BSCN (@BSCNews) October 5, 2026
SHIB remains an ERC-20 token on Ethereum. Sunrise simply creates a canonical representation of SHIB on Solana, allowing the token to reach another blockchain without moving away from Ethereum.
BeInCrypto reported that the announcement helped lift the SHIB price by about 4%. That move gives the token some early positive reaction, but the chart shows that SHIB still has several resistance levels to clear before the recovery can go much further.
Shiba Inu just landed on Solana through Sunrise. That announcement alone was enough to push ethereum:0x95ad61b0a150d79219dcf64e1e6cc01f0b64c4ce up 4% today. Will the Solana listing bring new energy and momentum to the SHIB community? https://t.co/VfZV8Pbn7D
— BeInCrypto (@beincrypto) October 4, 2026
Read Also: Here’s Where Gold and Silver Prices Might be Headed This Week
The SHIB Price Tests $0.000006
We had a look at the SHIB chart, and the price is around $0.00000600, up 1.52% on the daily candle. The high for the candle is $0.00000601, and the low is $0.00000585. Volume has reached 592.29 billion SHIB.
Source: TradingView
The momentum indicators also lean to the bullish side. The RSI is at 61.08, which places it above the 50 level. The chart also shows three bullish divergence labels and no bearish labels. The Ultimate Oscillator is at 53.99, also above 50.
That gives the SHIB price a decent technical base, but buyers still need to push through the levels above $0.00000600. The first level to watch is $0.00000650. A break above it could open the way to $0.00000700, followed by $0.00000800, $0.00000900 and $0.00001000.
Read Also: How High Can Cardano (ADA) Price Go This Week
Can SHIB Reach $0.000010?
The SHIB price has already climbed 50% from the $0.00000400 macro bottom to $0.00000600. From the current level, reaching $0.00000800 would require another 33.3% move.
The $0.00000650 level is therefore important. If SHIB holds $0.00000600 and breaks above $0.00000650, then $0.00000700 and $0.00000800 become the next levels to watch. A move through those could put $0.00000900 and $0.00001000 within reach.
There’s also clear support below the current price. The first support is $0.00000500, followed by the $0.00000400 macro bottom. If SHIB breaks below $0.00000500, the recovery setup weakens and $0.00000400 could come back into view. The chart also marks $0.00000300 as deeper support.
For now, SHIB has a new connection to Solana’s DeFi ecosystem at a time when the token is already recovering from its 2026 low. The next key test is $0.00000650. A break above that level would put $0.00000700 and $0.00000800 in focus, with $0.00001000 remaining the bigger resistance target.
FAQs
Why is Shiba Inu available on Solana
Shiba Inu is now accessible on Solana through Sunrise, giving SHIB access to Solana’s DeFi markets and creating another route for liquidity. SHIB remains an ERC-20 token on Ethereum.
Can Shiba Inu reach $0.000010
The chart shows $0.00001000 as a major resistance target. For the SHIB price to reach that level, it would first need to clear $0.00000650, $0.00000700, $0.00000800 and $0.00000900.
Subscribe to our YouTube channel for daily crypto updates, market insights, and expert analysis.
The post Shiba Inu Price Prediction as SHIB Lands on Solana appeared first on CaptainAltcoin.
The timing is interesting for SHIB. The token has already recovered 50% from the $0.00000400 area marked as its July 2026 bottom. Now the big question is whether the SHIB price can break above $0.00000650 and move toward $0.00000700 and $0.00000800.
SHIB Opens the Door to Solana DeFi
BSCN reported that Shiba Inu’s canonical Ethereum token is now accessible across Solana through Sunrise. This gives SHIB direct access to Solana’s DeFi markets and creates another route for liquidity between the two ecosystems.
Shiba Inu Landed On Solana Shiba Inu’s ethereum:0x95ad61b0a150d79219dcf64e1e6cc01f0b64c4ce canonical Ethereum token is now accessible across Solana (@solana) through Sunrise (@sunrise). The integration gives SHIB direct access to Solana’s DeFi markets. SHIB remains an ERC-20 token and is not leaving Ethereum. Sunrise creates a canonical Solana representation to reduce liquidity fragmentation.
— BSCN (@BSCNews) October 5, 2026
SHIB remains an ERC-20 token on Ethereum. Sunrise simply creates a canonical representation of SHIB on Solana, allowing the token to reach another blockchain without moving away from Ethereum.
BeInCrypto reported that the announcement helped lift the SHIB price by about 4%. That move gives the token some early positive reaction, but the chart shows that SHIB still has several resistance levels to clear before the recovery can go much further.
Shiba Inu just landed on Solana through Sunrise. That announcement alone was enough to push ethereum:0x95ad61b0a150d79219dcf64e1e6cc01f0b64c4ce up 4% today. Will the Solana listing bring new energy and momentum to the SHIB community? https://t.co/VfZV8Pbn7D
— BeInCrypto (@beincrypto) October 4, 2026
Read Also: Here’s Where Gold and Silver Prices Might be Headed This Week
The SHIB Price Tests $0.000006
We had a look at the SHIB chart, and the price is around $0.00000600, up 1.52% on the daily candle. The high for the candle is $0.00000601, and the low is $0.00000585. Volume has reached 592.29 billion SHIB.
Source: TradingView
The momentum indicators also lean to the bullish side. The RSI is at 61.08, which places it above the 50 level. The chart also shows three bullish divergence labels and no bearish labels. The Ultimate Oscillator is at 53.99, also above 50.
That gives the SHIB price a decent technical base, but buyers still need to push through the levels above $0.00000600. The first level to watch is $0.00000650. A break above it could open the way to $0.00000700, followed by $0.00000800, $0.00000900 and $0.00001000.
Read Also: How High Can Cardano (ADA) Price Go This Week
Can SHIB Reach $0.000010?
The SHIB price has already climbed 50% from the $0.00000400 macro bottom to $0.00000600. From the current level, reaching $0.00000800 would require another 33.3% move.
The $0.00000650 level is therefore important. If SHIB holds $0.00000600 and breaks above $0.00000650, then $0.00000700 and $0.00000800 become the next levels to watch. A move through those could put $0.00000900 and $0.00001000 within reach.
There’s also clear support below the current price. The first support is $0.00000500, followed by the $0.00000400 macro bottom. If SHIB breaks below $0.00000500, the recovery setup weakens and $0.00000400 could come back into view. The chart also marks $0.00000300 as deeper support.
For now, SHIB has a new connection to Solana’s DeFi ecosystem at a time when the token is already recovering from its 2026 low. The next key test is $0.00000650. A break above that level would put $0.00000700 and $0.00000800 in focus, with $0.00001000 remaining the bigger resistance target.
FAQs
Why is Shiba Inu available on Solana
Shiba Inu is now accessible on Solana through Sunrise, giving SHIB access to Solana’s DeFi markets and creating another route for liquidity. SHIB remains an ERC-20 token on Ethereum.
Can Shiba Inu reach $0.000010
The chart shows $0.00001000 as a major resistance target. For the SHIB price to reach that level, it would first need to clear $0.00000650, $0.00000700, $0.00000800 and $0.00000900.
Subscribe to our YouTube channel for daily crypto updates, market insights, and expert analysis.
The post Shiba Inu Price Prediction as SHIB Lands on Solana appeared first on CaptainAltcoin.
3
252
Log in to explore more content
Join global crypto users on Binance Square
⚡️ Get latest and useful information about crypto.
💬 Trusted by the world’s largest crypto exchange.
👍 Discover real insights from verified creators.
Email / Phone number
Trending Topics
BinanceLaunchesBinanceIntelligence
604,532 views
3,726 Discussing
#binancelaunchesbinanceintelligence
🚨 BINANCE JUST PUSHED AI DEEPER INTO CRYPTO.
Binance has launched Binance Intelligence — a new AI-powered layer built around market research, trading workflows, and crypto data.
The interesting part?
It’s not just one tool.
🧠 Binance AI → personalized market briefs, alerts and portfolio insights
⚡ Binance AI Pro → turns natural-language ideas into trading workflows
🤖 Agent OS → connects AI agents with market, wallet and on-chain capabilities
That’s a big shift.
Crypto platforms are no longer only giving traders charts and data.
They’re starting to give them AI systems that can interpret that data.
The real question is:
Will AI become as normal for traders as indicators and charts are today? 👀
$BTC $ETH
#Binance #Aİ #crypto #BTC
Doomsday-Trader
·0 Likes
·384 views
BTCFallsBelow$84K
140 views
23 Discussing
WinklevossFilesSpotZcashETFApplication
2,847 views
71 Discussing