
CHART KING 亗
3.9k Posts

CHART KING 亗
Report
Block User
The market is a book and I read its pages Technical analysis is my craft and the decision is yours I set the targets and the stoploss the rest is God's guidance
20 Following
2.7K+ Followers
3.5K+ Liked
Posts
All
Quotes
Videos
PINNED
·
--
When will it stop 😂
{future}(BULLAUSDT)
When will it stop 😂
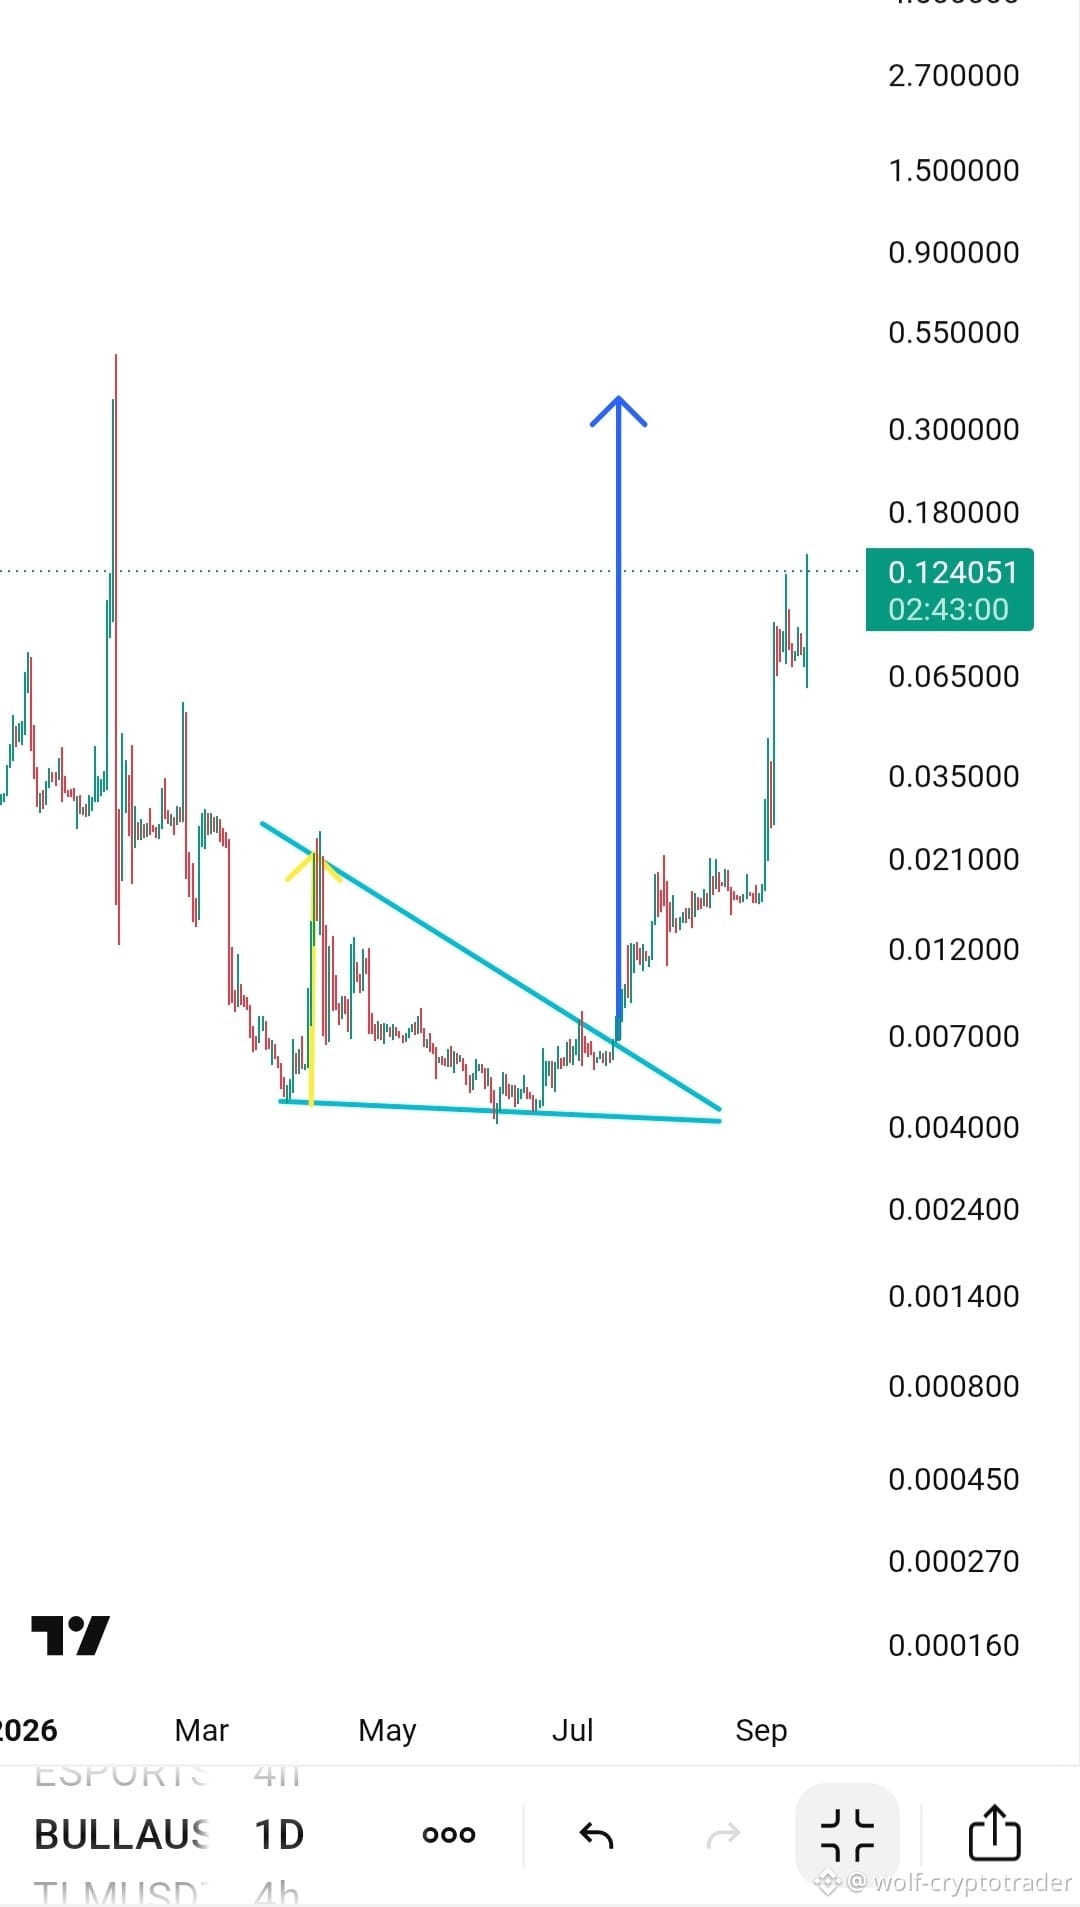
CHART KING 亗
·
--
🚀🔥 Buy long now — the descending triangle has been breached. Get ready for takeoff 💎
👀 Keep an eye on it — the price managed to break the descending triangle that had trapped the movement for weeks, confirming the start of a new uptrend wave
👀 Keep an eye on it — the price managed to break the descending triangle that had trapped the movement for weeks, confirming the start of a new uptrend wave
2
4
155
PINNED
·
--
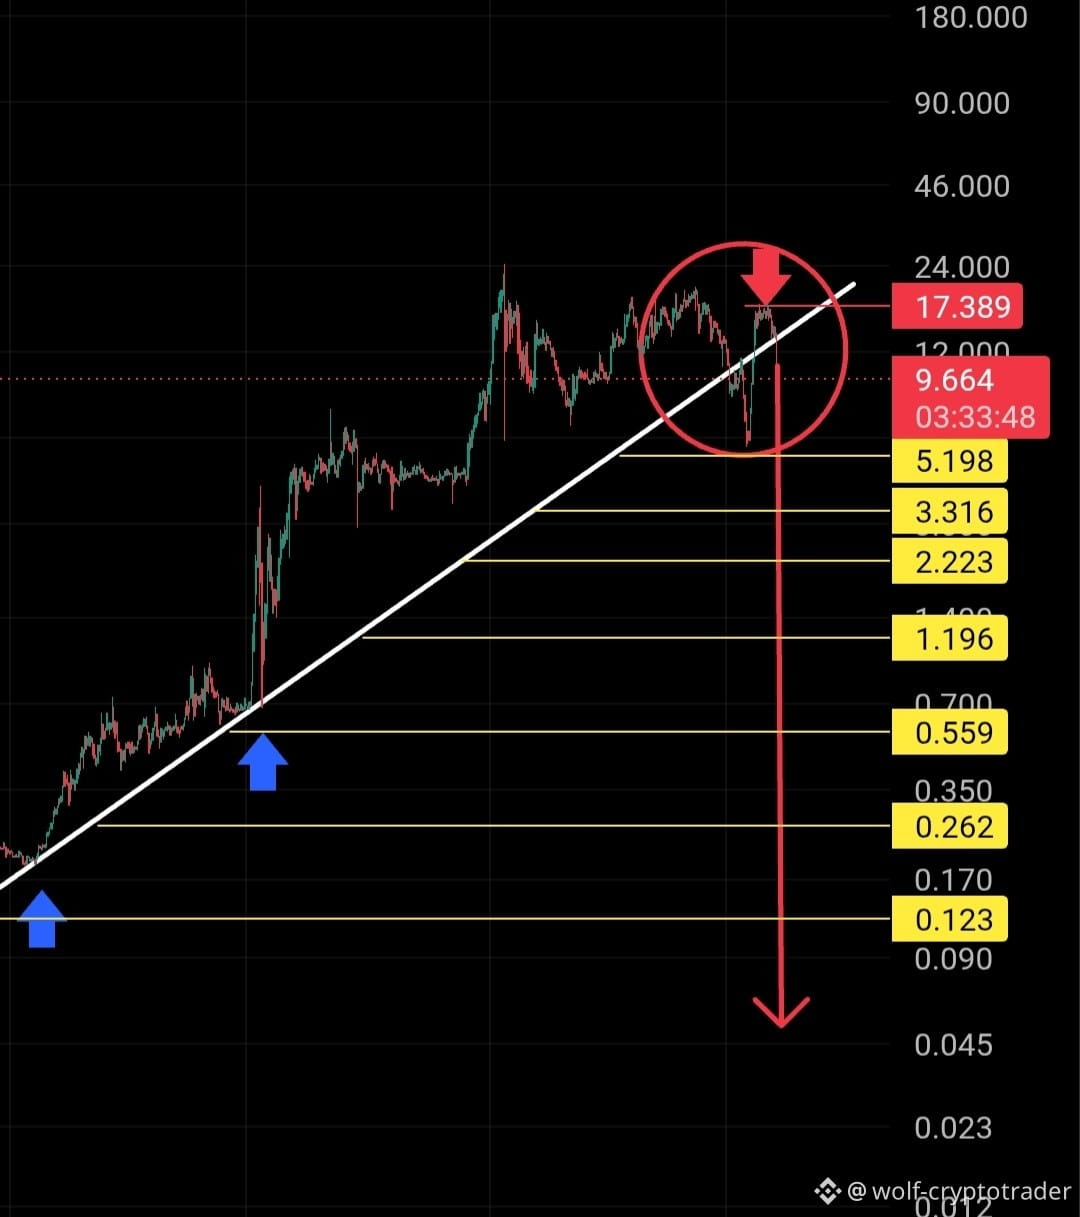
🔻💀Boooooom into Hell.. the collapse hasn't started yet💀📉
📉 Keep selling Short – the fall hasn't ended, and the targets haven't been hit yet 🎯
{future}(LABUSDT)
🔻💀Boooooom into Hell.. the collapse hasn't started yet💀📉
📉 Keep selling Short – the fall hasn't ended, and the targets haven't been hit yet 🎯
📉 Keep selling Short – the fall hasn't ended, and the targets haven't been hit yet 🎯
5
5
2.8k
·
--
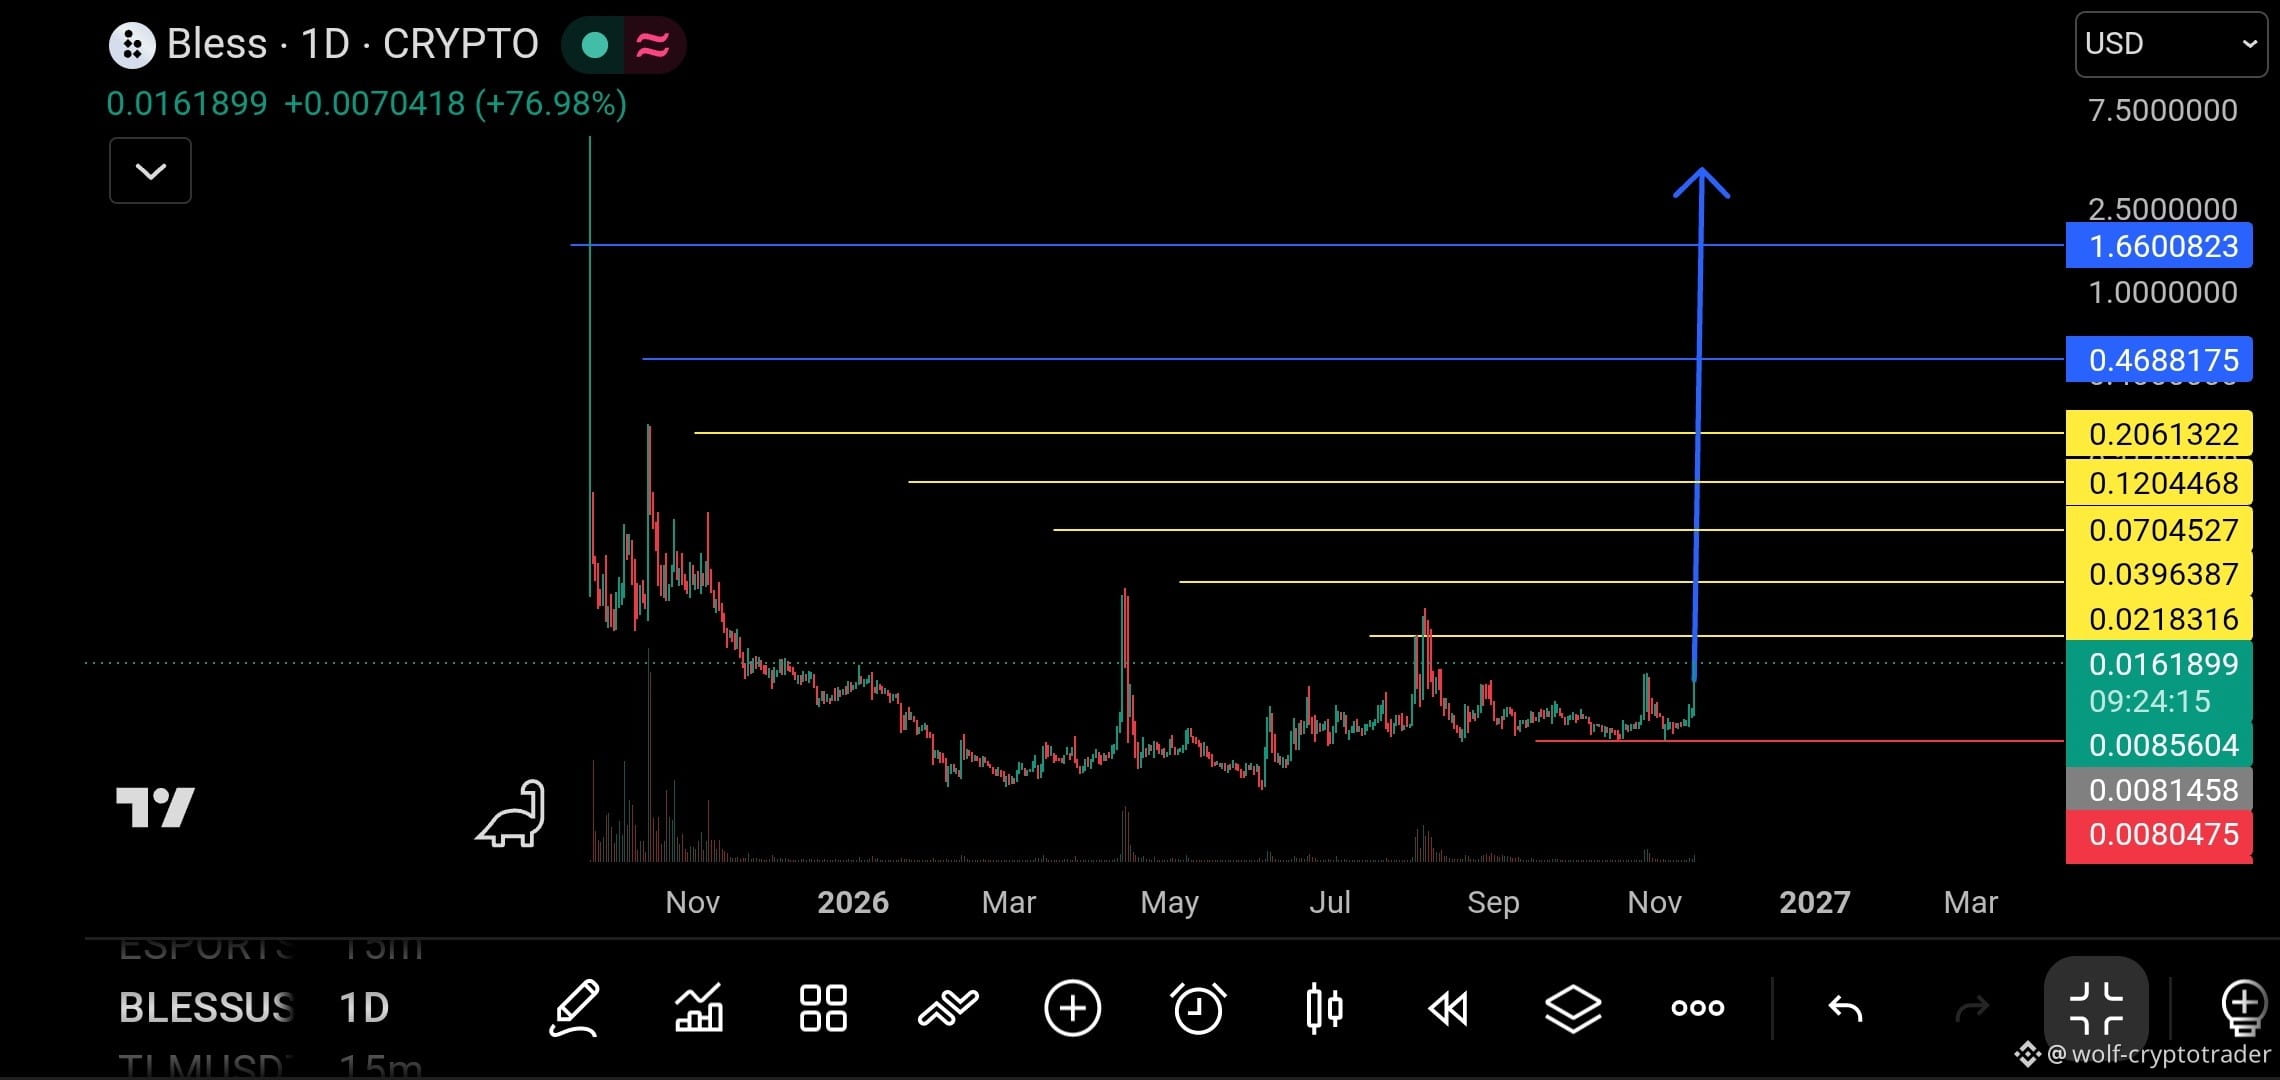
🚨 From the depths of oblivion to the throne of legends, has BLESS begun the biggest explosion in its history? 🚀
Stop and look closely at this chart. What you see before you is not just an ordinary price movement, but the “wake-up call” of a coin that underwent one of the harshest liquidations—and today stands on the threshold of a new legend.
Look at the harsh past: a brutal collapse from lofty highs, followed by months of boring and painful sideways movement. This area (between 0.006$ and 0.01$) was a “graveyard” for fearful traders, but at the same time a goldmine for smart wallets quietly building their positions
{future}(BLESSUSDT)
🚨 From the depths of oblivion to the throne of legends, has BLESS begun the biggest explosion in its history? 🚀
Stop and look closely at this chart. What you see before you is not just an ordinary price movement, but the “wake-up call” of a coin that underwent one of the harshest liquidations—and today stands on the threshold of a new legend.
Look at the harsh past: a brutal collapse from lofty highs, followed by months of boring and painful sideways movement. This area (between 0.006$ and 0.01$) was a “graveyard” for fearful traders, but at the same time a goldmine for smart wallets quietly building their positions
Stop and look closely at this chart. What you see before you is not just an ordinary price movement, but the “wake-up call” of a coin that underwent one of the harshest liquidations—and today stands on the threshold of a new legend.
Look at the harsh past: a brutal collapse from lofty highs, followed by months of boring and painful sideways movement. This area (between 0.006$ and 0.01$) was a “graveyard” for fearful traders, but at the same time a goldmine for smart wallets quietly building their positions
2
1.1k
·
--
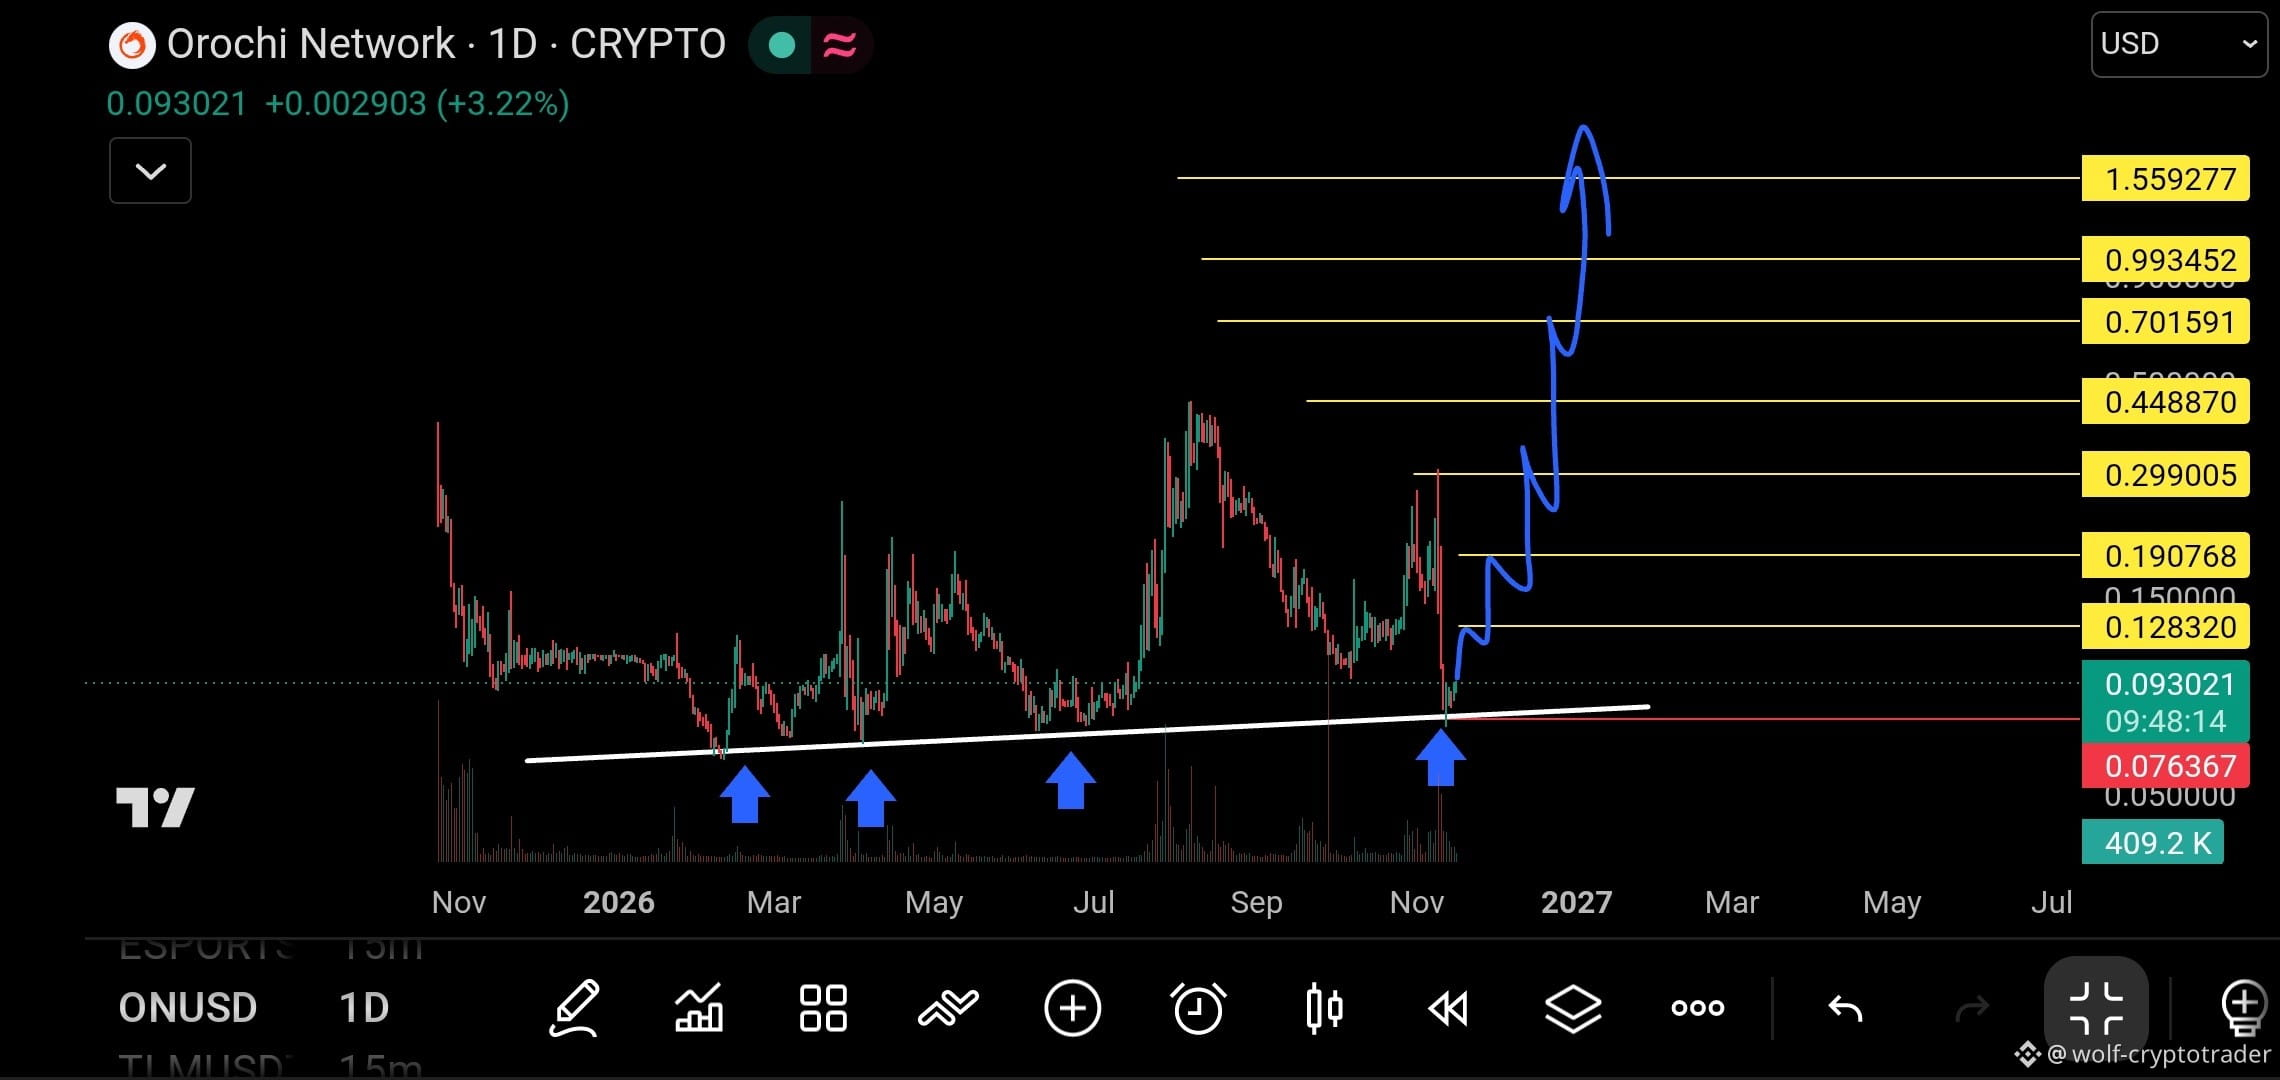
🚨 The historic rebound opportunity has begun. ON is ready to take off
Take a good look at this daily chart.. Do you see those blue arrows? 🔵
These are not just random signals; they mark historic rebounds from a solid support line that the price hasn’t broken for a long time 📉📈
It’s now at 0.093021, and the price is touching this support for the fourth time, which means the tank is completely full, and the next rebound will be the strongest ever 🔥
{future}(ONUSDT)
🚨 The historic rebound opportunity has begun. ON is ready to take off
Take a good look at this daily chart.. Do you see those blue arrows? 🔵
These are not just random signals; they mark historic rebounds from a solid support line that the price hasn’t broken for a long time 📉📈
It’s now at 0.093021, and the price is touching this support for the fourth time, which means the tank is completely full, and the next rebound will be the strongest ever 🔥
Take a good look at this daily chart.. Do you see those blue arrows? 🔵
These are not just random signals; they mark historic rebounds from a solid support line that the price hasn’t broken for a long time 📉📈
It’s now at 0.093021, and the price is touching this support for the fourth time, which means the tank is completely full, and the next rebound will be the strongest ever 🔥
859
·
--
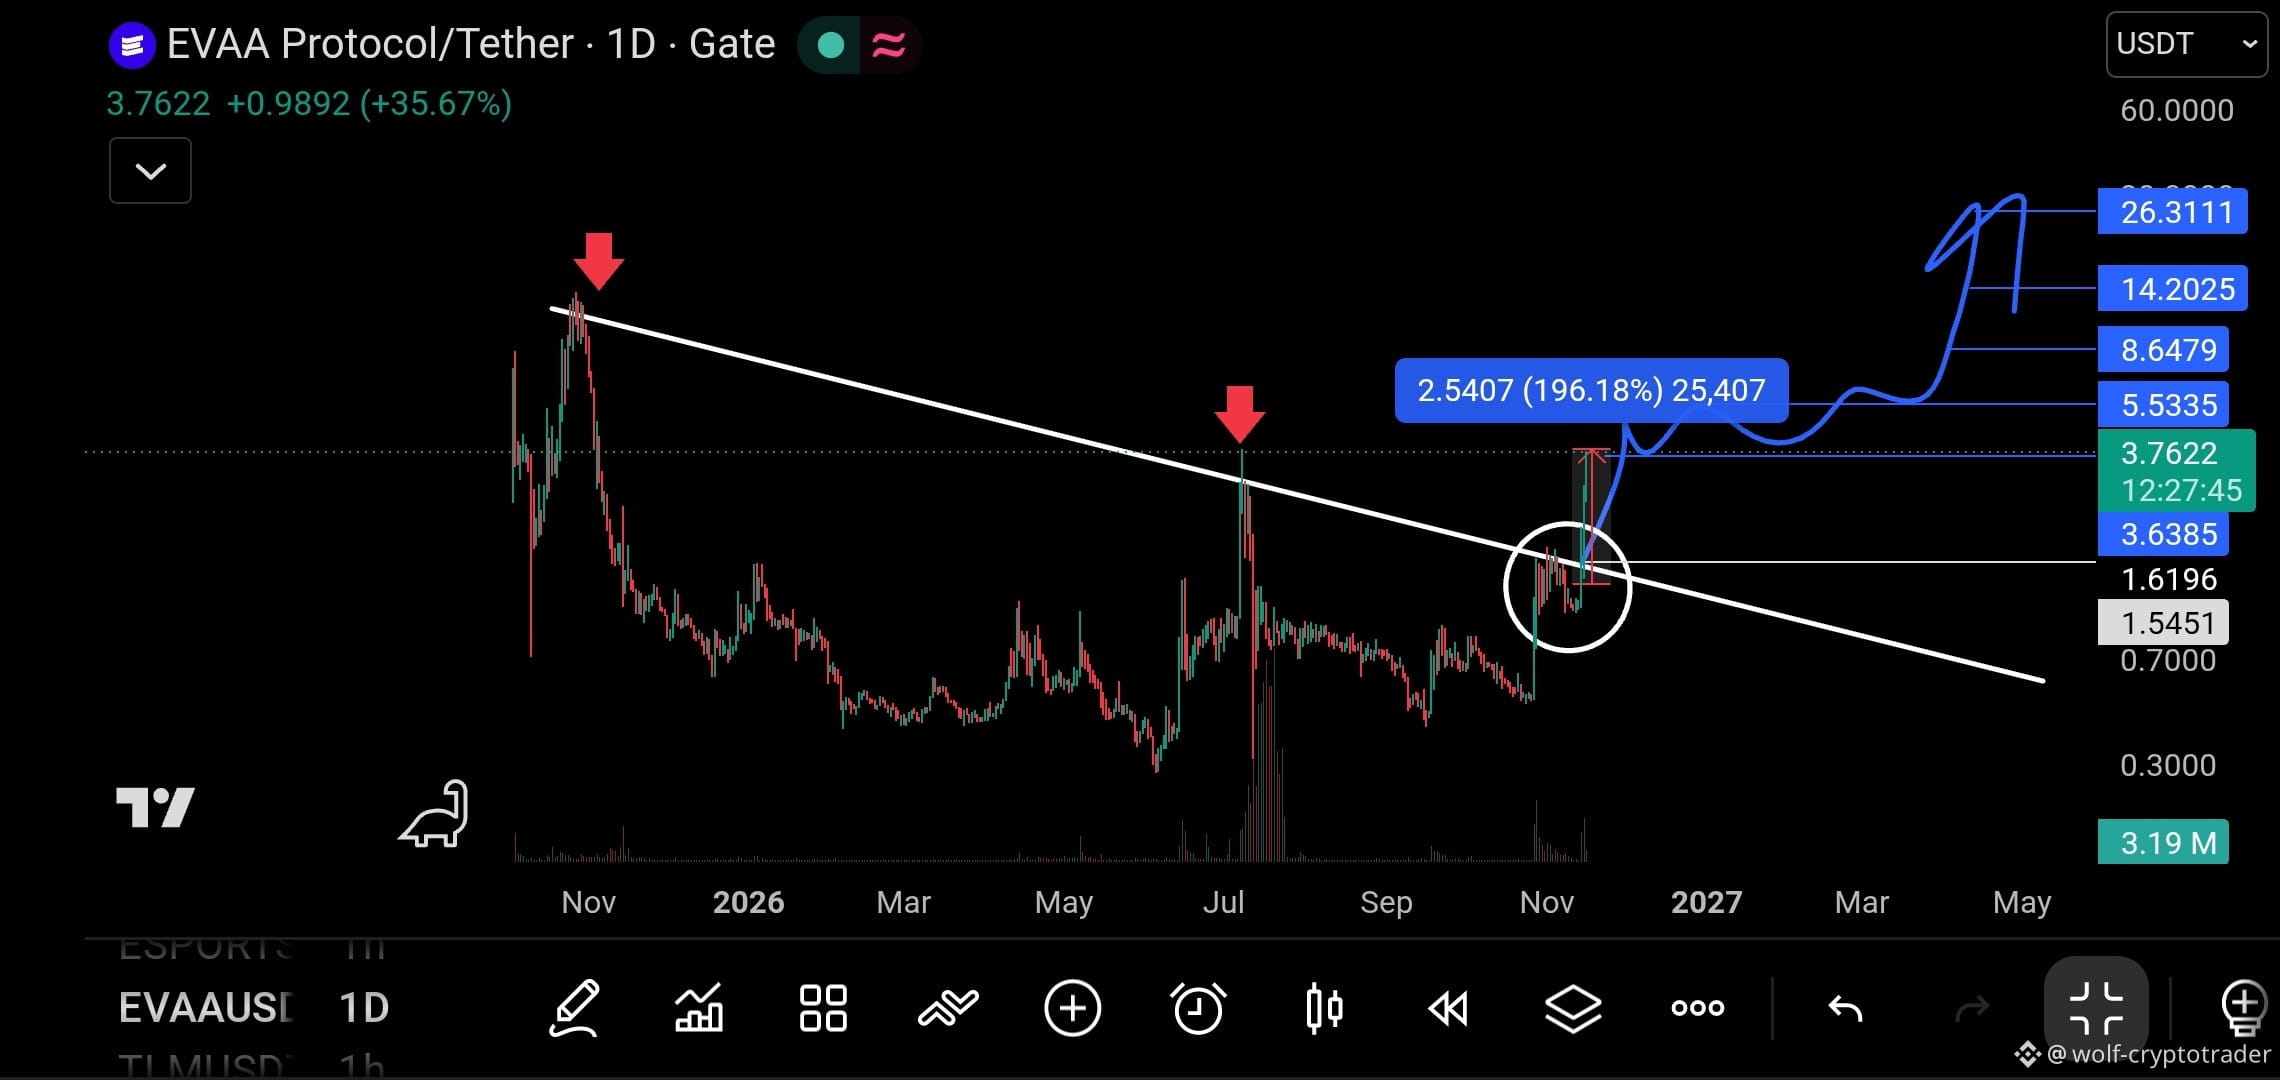
🎯 The breakout happened as expected: EVAA smashes through resistance and unleashes a price explosion 🚀
We were watching the 1.5 barrier, and now the chart speaks for itself.
EVAA didn’t just break above the downtrend line—it powerfully smashed through the 1.5 resistance, reaching its first target and surpassing 3.6$ , with gains exceeding 190% 🔥
{future}(EVAAUSDT)
🎯 The breakout happened as expected: EVAA smashes through resistance and unleashes a price explosion 🚀
We were watching the 1.5 barrier, and now the chart speaks for itself.
EVAA didn’t just break above the downtrend line—it powerfully smashed through the 1.5 resistance, reaching its first target and surpassing 3.6$ , with gains exceeding 190% 🔥
We were watching the 1.5 barrier, and now the chart speaks for itself.
EVAA didn’t just break above the downtrend line—it powerfully smashed through the 1.5 resistance, reaching its first target and surpassing 3.6$ , with gains exceeding 190% 🔥
1
1.1k
·
--
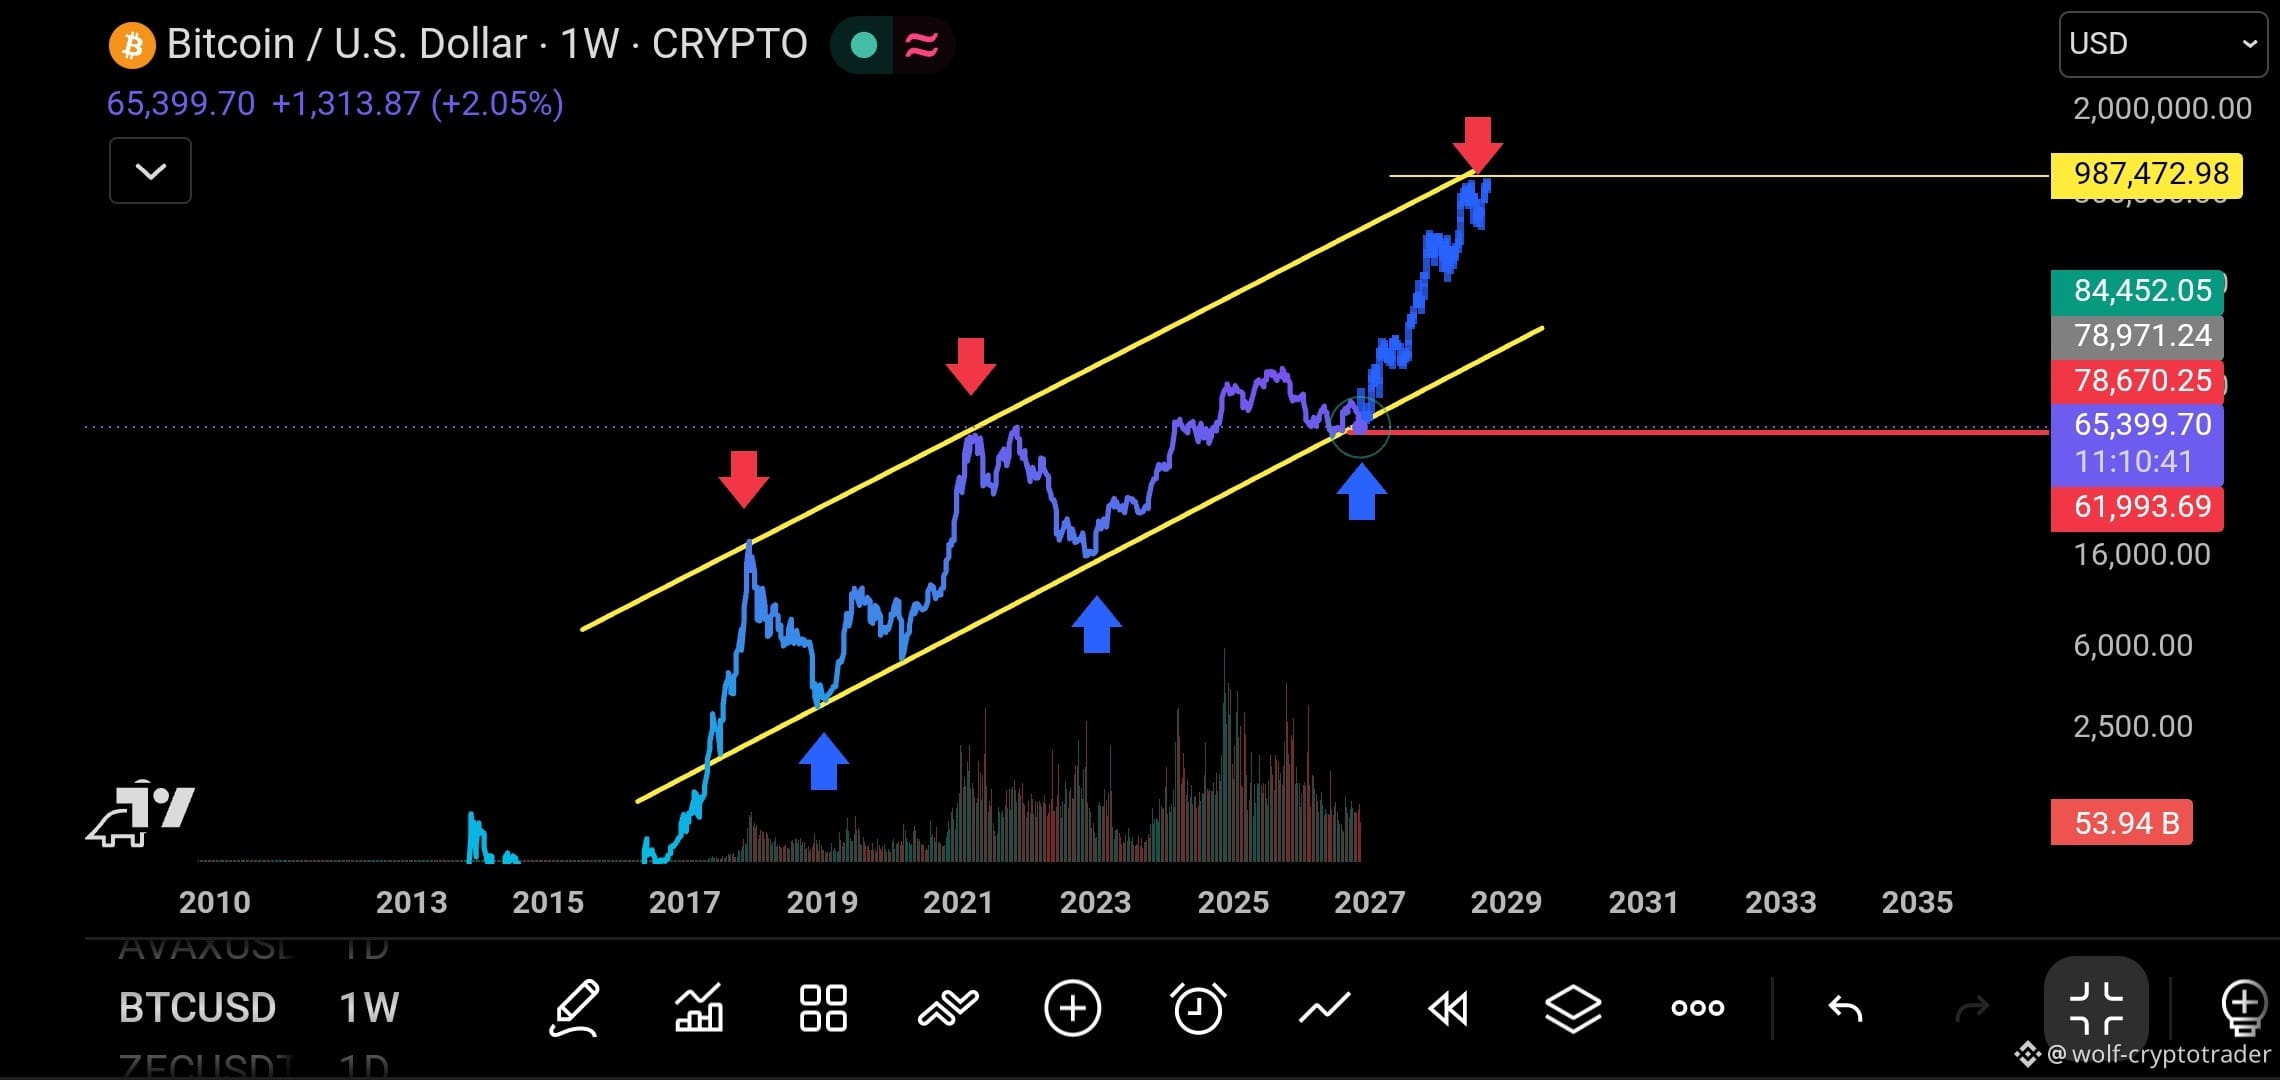
🚨 History is repeating itself. BTC is offering you an "opportunity" at the historic bottom
Take a good look at this weekly chart (1W).. Do you see what I see? 👀
It is now standing exactly at the lower line (the historic ascending trendline). This isn't just an ordinary line; it's Bitcoin's "lifeline," which it has bounced off every time since 2017📉📈
{future}(BTCUSDT)
🚨 History is repeating itself. BTC is offering you an "opportunity" at the historic bottom
Take a good look at this weekly chart (1W).. Do you see what I see? 👀
It is now standing exactly at the lower line (the historic ascending trendline). This isn't just an ordinary line; it's Bitcoin's "lifeline," which it has bounced off every time since 2017📉📈
Take a good look at this weekly chart (1W).. Do you see what I see? 👀
It is now standing exactly at the lower line (the historic ascending trendline). This isn't just an ordinary line; it's Bitcoin's "lifeline," which it has bounced off every time since 2017📉📈
2
582
·
--
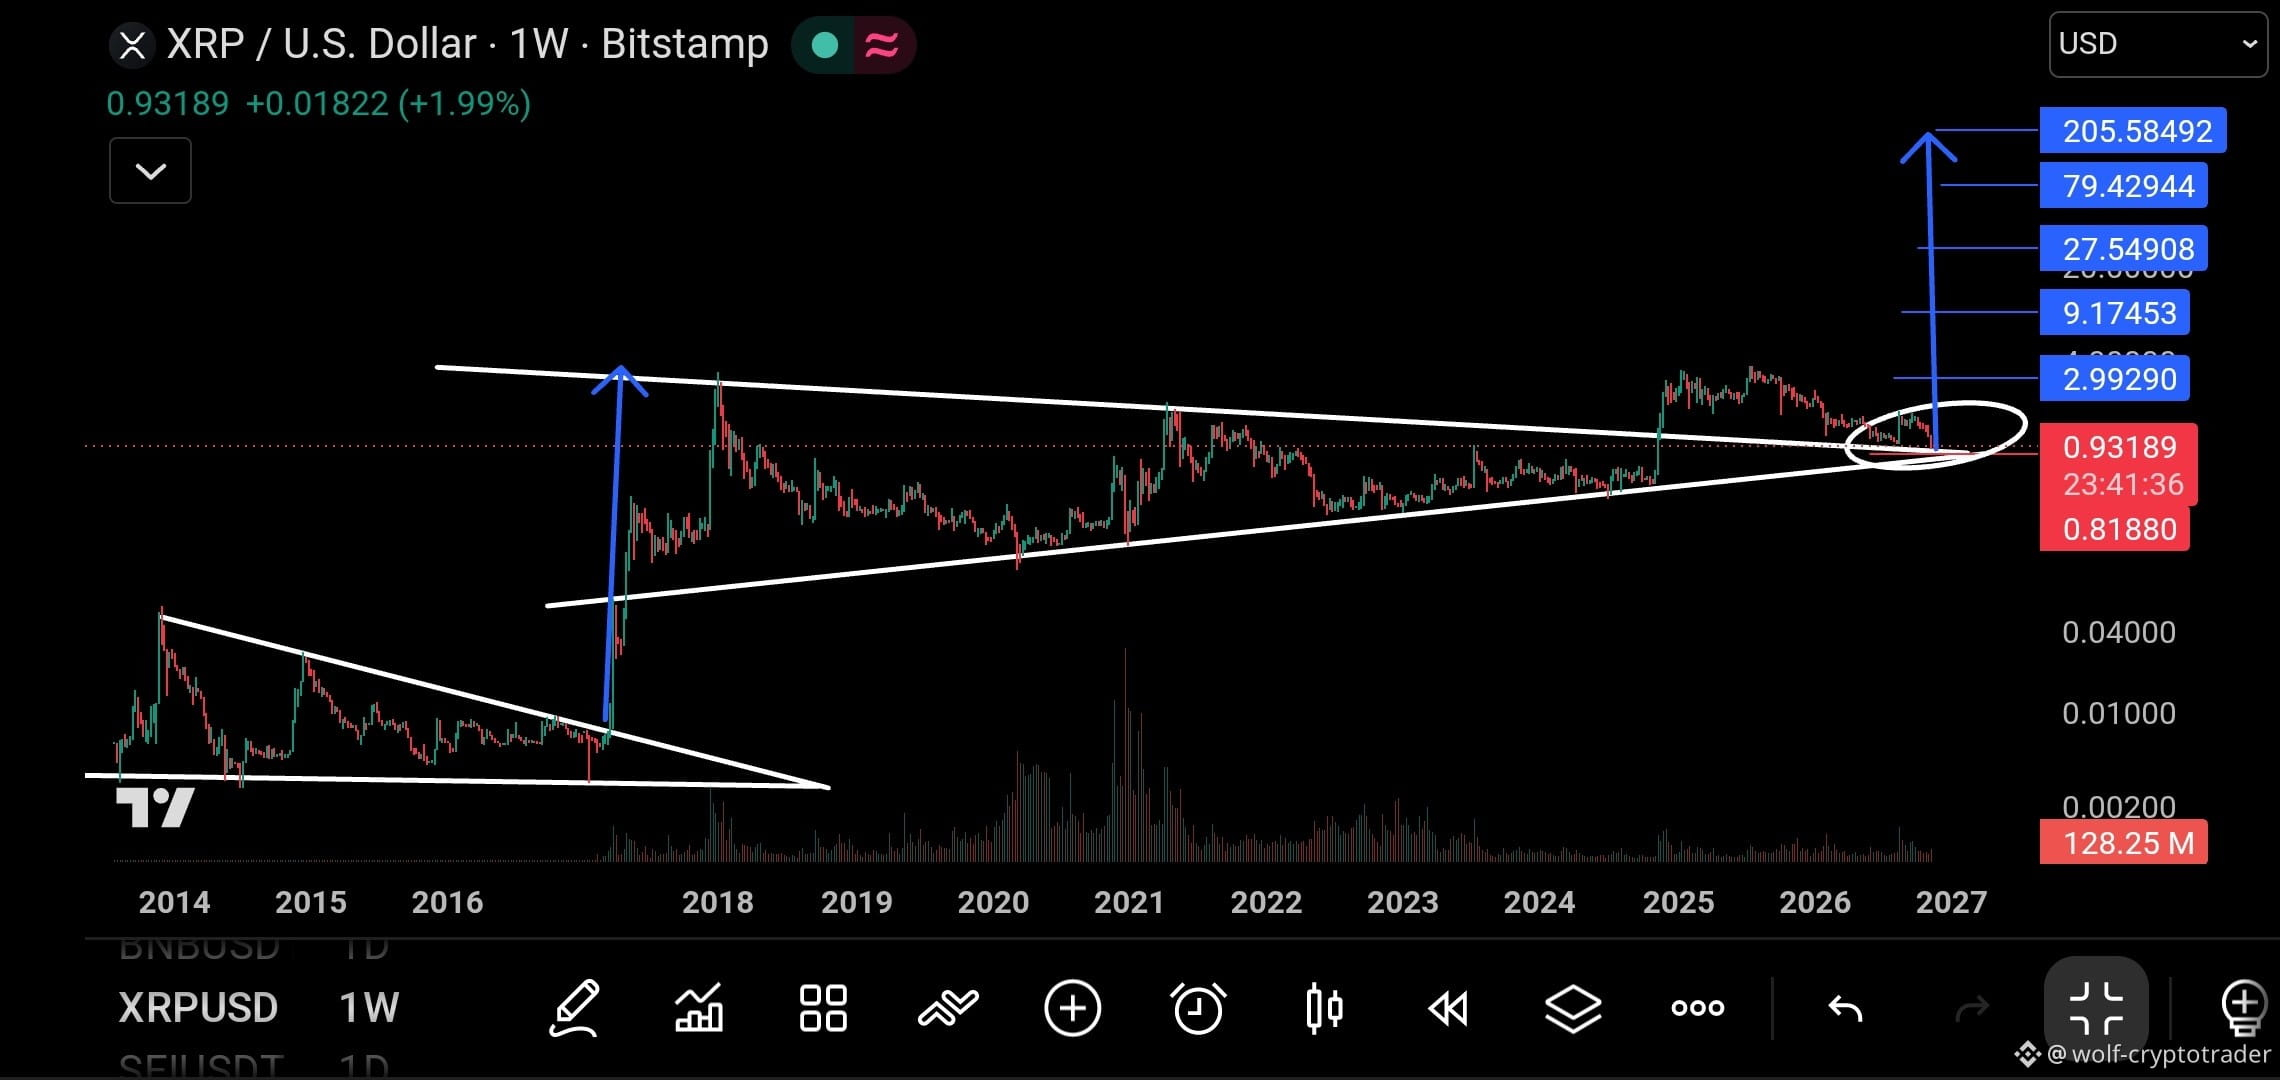
🚨 A once-in-a-lifetime historic moment: XRP is offering you a “gift” retest at legendary support.
Stop everything and take a look at this weekly chart (1W).
{future}(XRPUSDT)
🚨 A once-in-a-lifetime historic moment: XRP is offering you a “gift” retest at legendary support.
Stop everything and take a look at this weekly chart (1W).
Stop everything and take a look at this weekly chart (1W).
1
5
2.5k
·
--
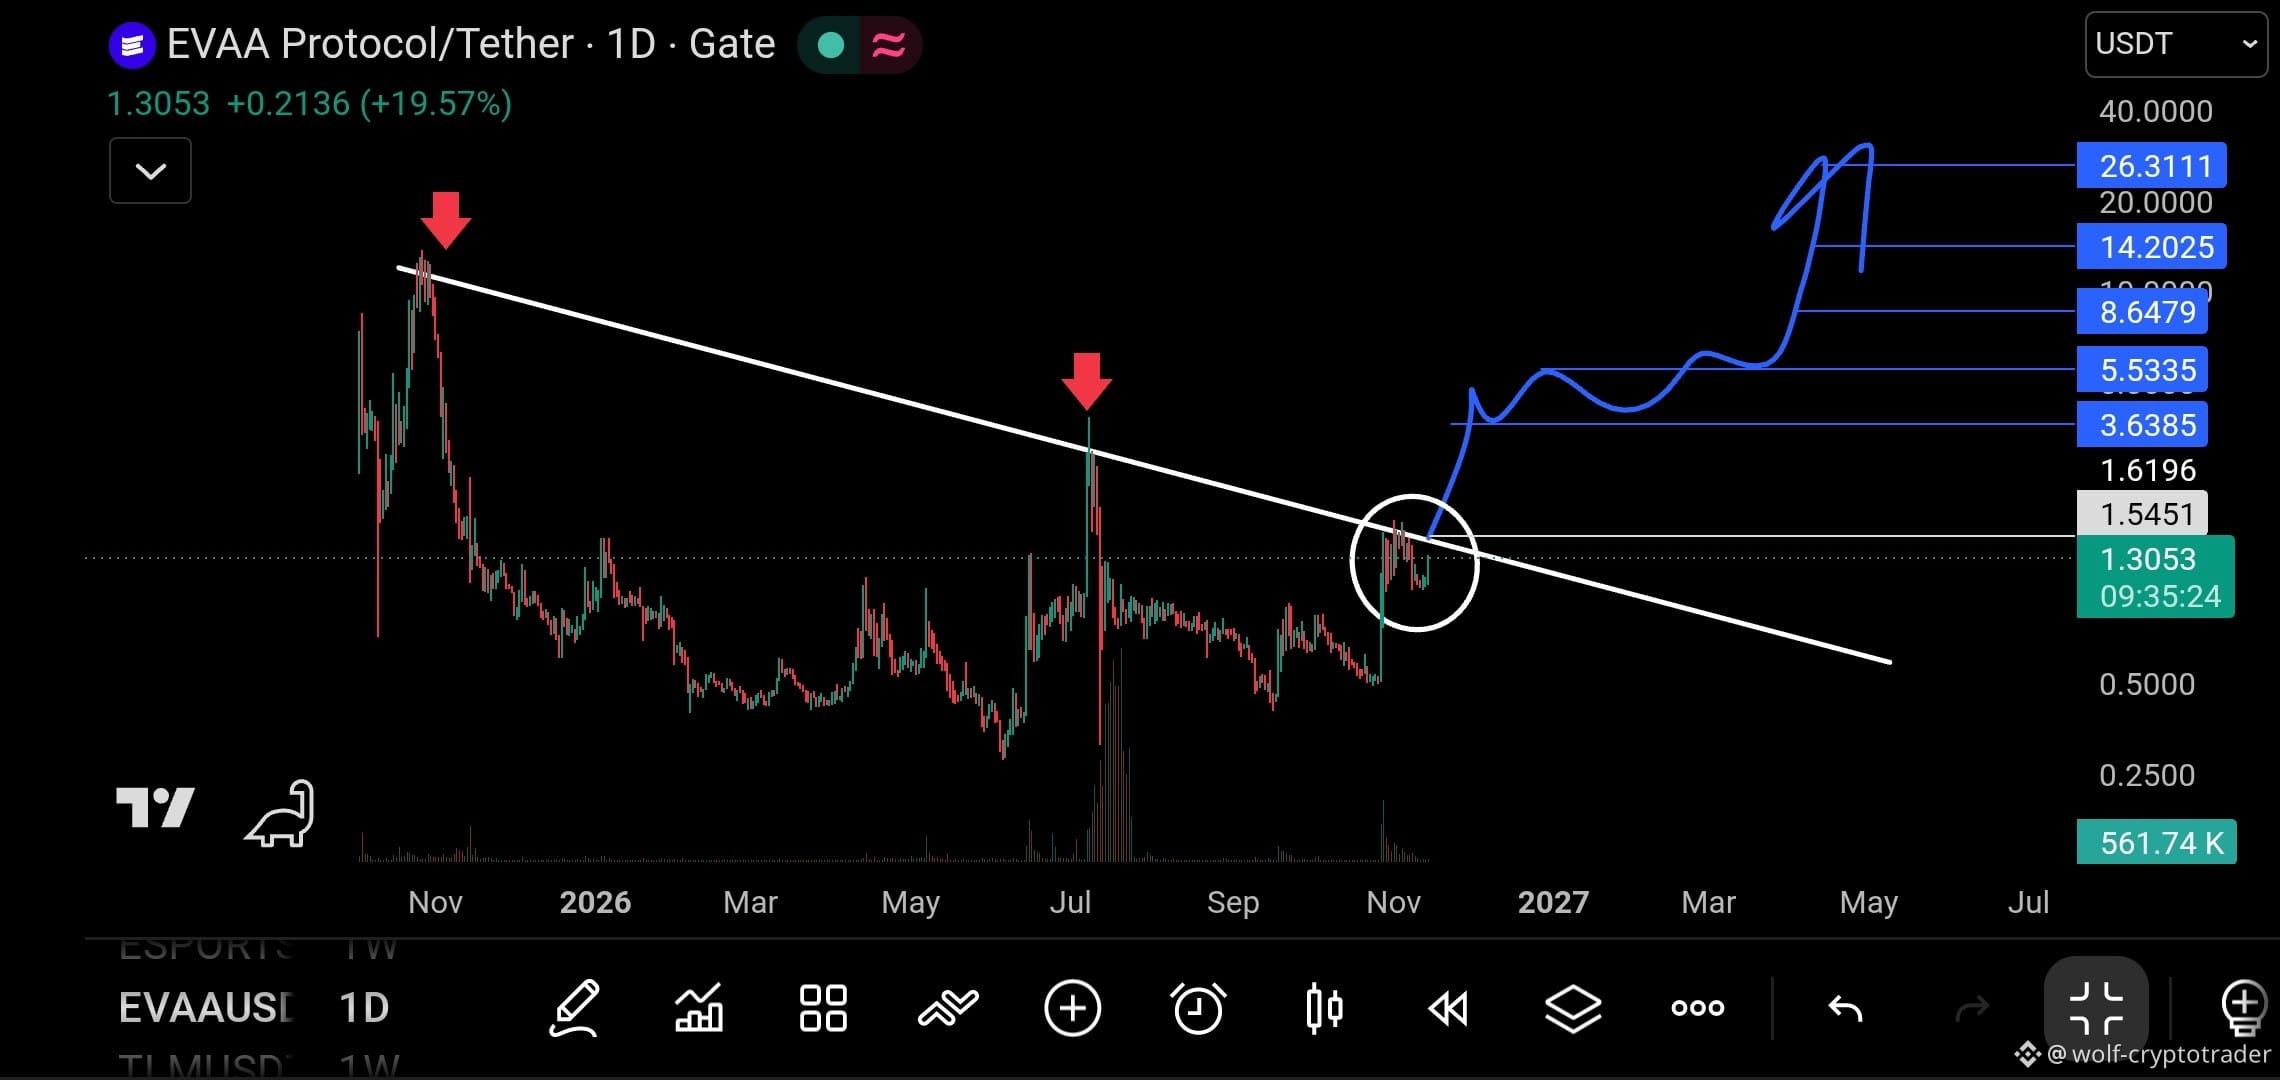
🚨 The moment of truth is approaching: EVAA is on the verge of a historic price explosion!
Take a good look at this chart... We’re not talking about just an ordinary bounce, but a massive structural break above a downtrend line (Trendline) that has controlled the price for several months.
The price is now trading at 1.3053, but all eyes are on the 1.5 level 👀
🎯 The key resistance
The 1.5 zone is the ceiling the price is trying to break through now. Technical history tells us that any strong breakout above this level, backed by trading volume (Volume), could mean a rocket-like launch.
{future}(EVAAUSDT)
🚨 The moment of truth is approaching: EVAA is on the verge of a historic price explosion!
Take a good look at this chart... We’re not talking about just an ordinary bounce, but a massive structural break above a downtrend line (Trendline) that has controlled the price for several months.
The price is now trading at 1.3053, but all eyes are on the 1.5 level 👀
🎯 The key resistance
The 1.5 zone is the ceiling the price is trying to break through now. Technical history tells us that any strong breakout above this level, backed by trading volume (Volume), could mean a rocket-like launch.
Take a good look at this chart... We’re not talking about just an ordinary bounce, but a massive structural break above a downtrend line (Trendline) that has controlled the price for several months.
The price is now trading at 1.3053, but all eyes are on the 1.5 level 👀
🎯 The key resistance
The 1.5 zone is the ceiling the price is trying to break through now. Technical history tells us that any strong breakout above this level, backed by trading volume (Volume), could mean a rocket-like launch.
1
569
·
--
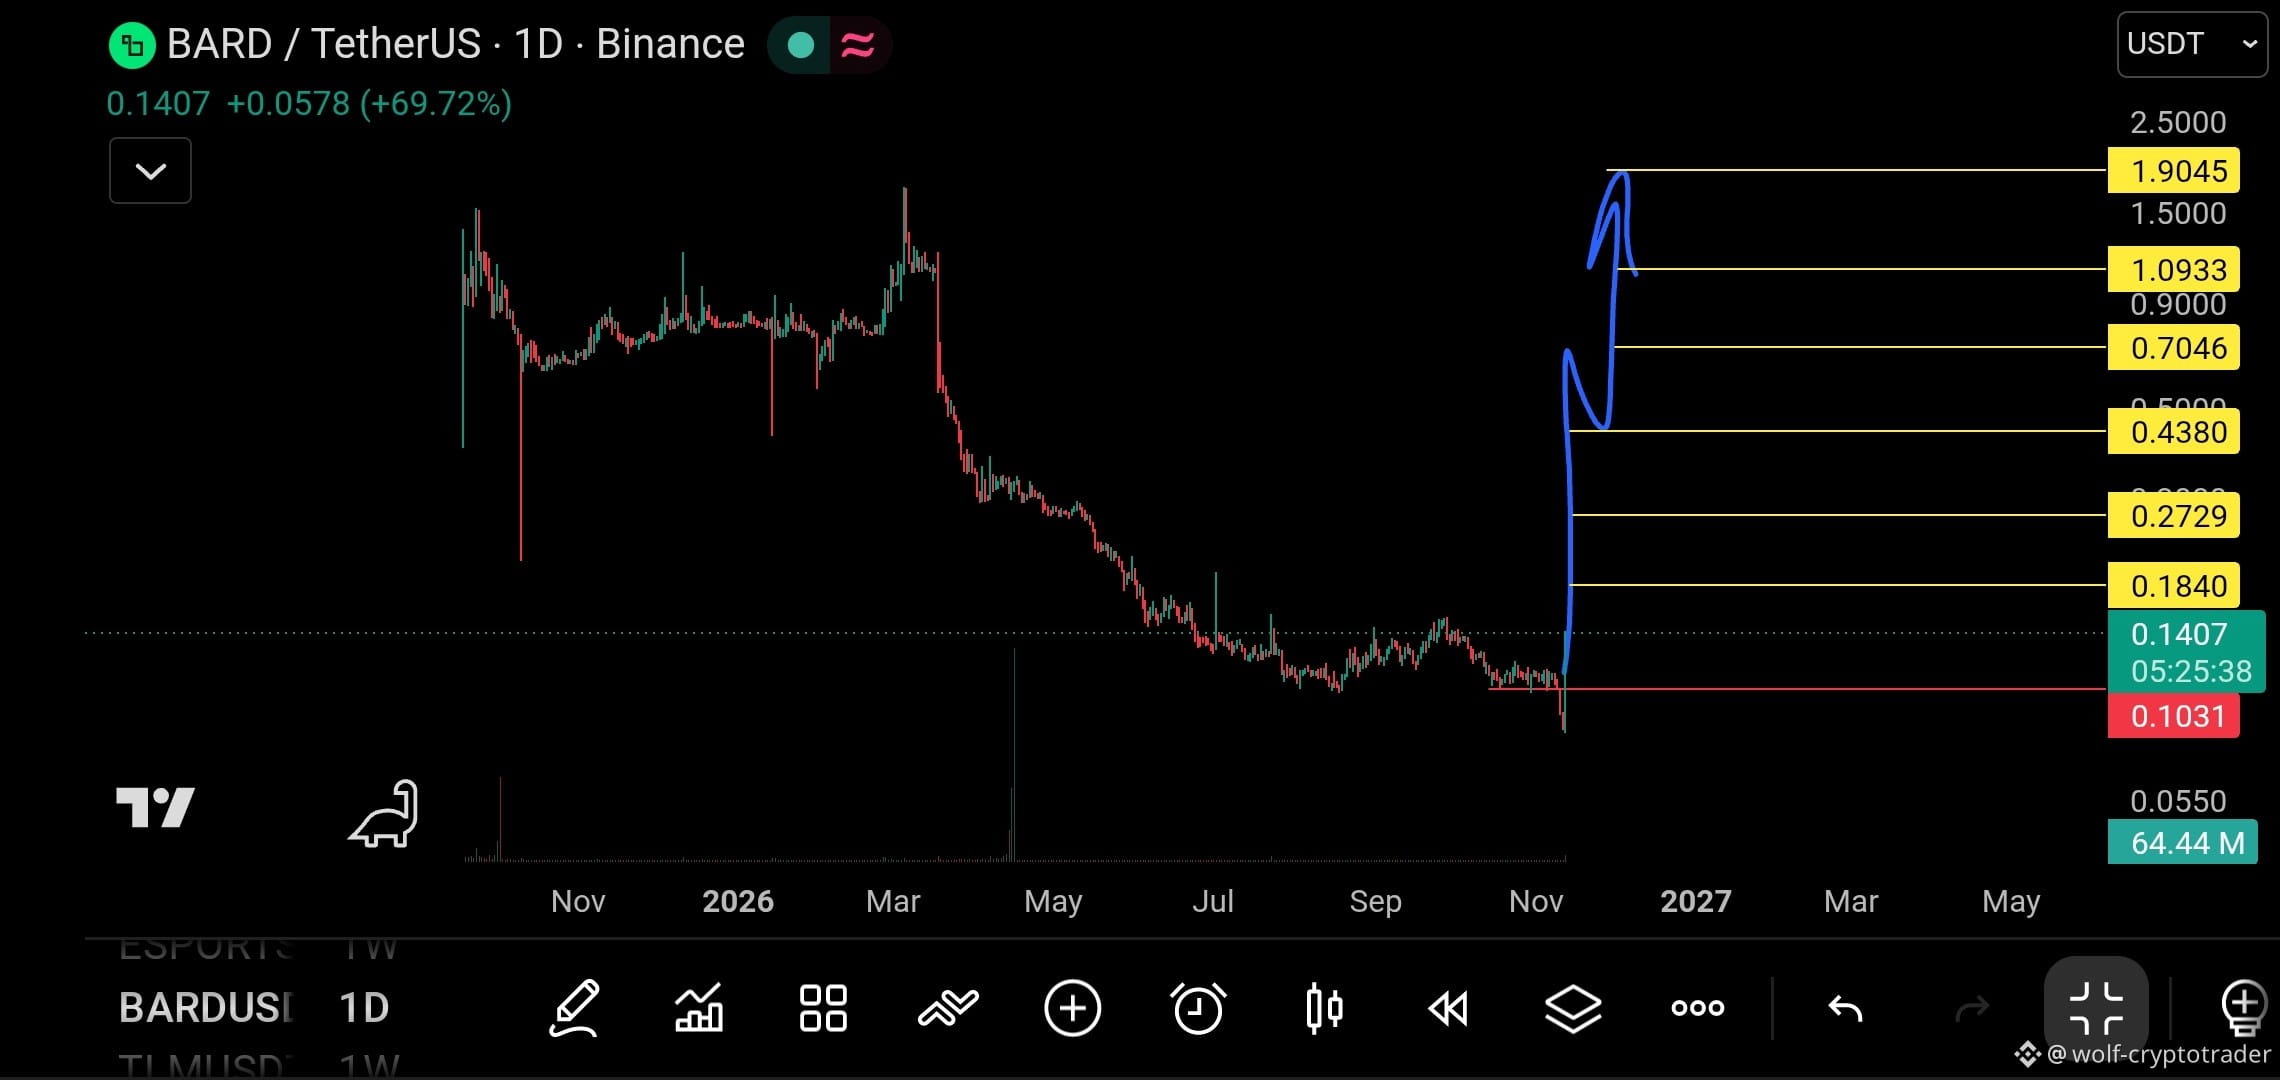
What’s happening with BARD? 🤔
BARD suddenly woke up and made one of the strongest rebounds on the daily timeframe—a powerful bounce off a single touch, and a forceful move back above the 0.1400 levels. 🔥
👀 Let’s take a closer look at this chart.
After a long, boring consolidation period, it seems liquidity has finally decided to storm the market. The chart points to a scenario very similar to the launches of legendary coins.
❓ Here’s the most important question: Does BARD have enough fuel to reach these ambitious targets?
If the current momentum continues, levels like 0.1840, then 0.27 and 0.43, seem inevitable in the short term. But if the market catches fire, we’re talking about staggering upside targets like 0.7, 1.0, and even 1.9🎯
$BARD
{future}(BARDUSDT)
What’s happening with BARD? 🤔
BARD suddenly woke up and made one of the strongest rebounds on the daily timeframe—a powerful bounce off a single touch, and a forceful move back above the 0.1400 levels. 🔥
👀 Let’s take a closer look at this chart.
After a long, boring consolidation period, it seems liquidity has finally decided to storm the market. The chart points to a scenario very similar to the launches of legendary coins.
❓ Here’s the most important question: Does BARD have enough fuel to reach these ambitious targets?
If the current momentum continues, levels like 0.1840, then 0.27 and 0.43, seem inevitable in the short term. But if the market catches fire, we’re talking about staggering upside targets like 0.7, 1.0, and even 1.9🎯
$BARD
BARD suddenly woke up and made one of the strongest rebounds on the daily timeframe—a powerful bounce off a single touch, and a forceful move back above the 0.1400 levels. 🔥
👀 Let’s take a closer look at this chart.
After a long, boring consolidation period, it seems liquidity has finally decided to storm the market. The chart points to a scenario very similar to the launches of legendary coins.
❓ Here’s the most important question: Does BARD have enough fuel to reach these ambitious targets?
If the current momentum continues, levels like 0.1840, then 0.27 and 0.43, seem inevitable in the short term. But if the market catches fire, we’re talking about staggering upside targets like 0.7, 1.0, and even 1.9🎯
$BARD
1
932
·
--
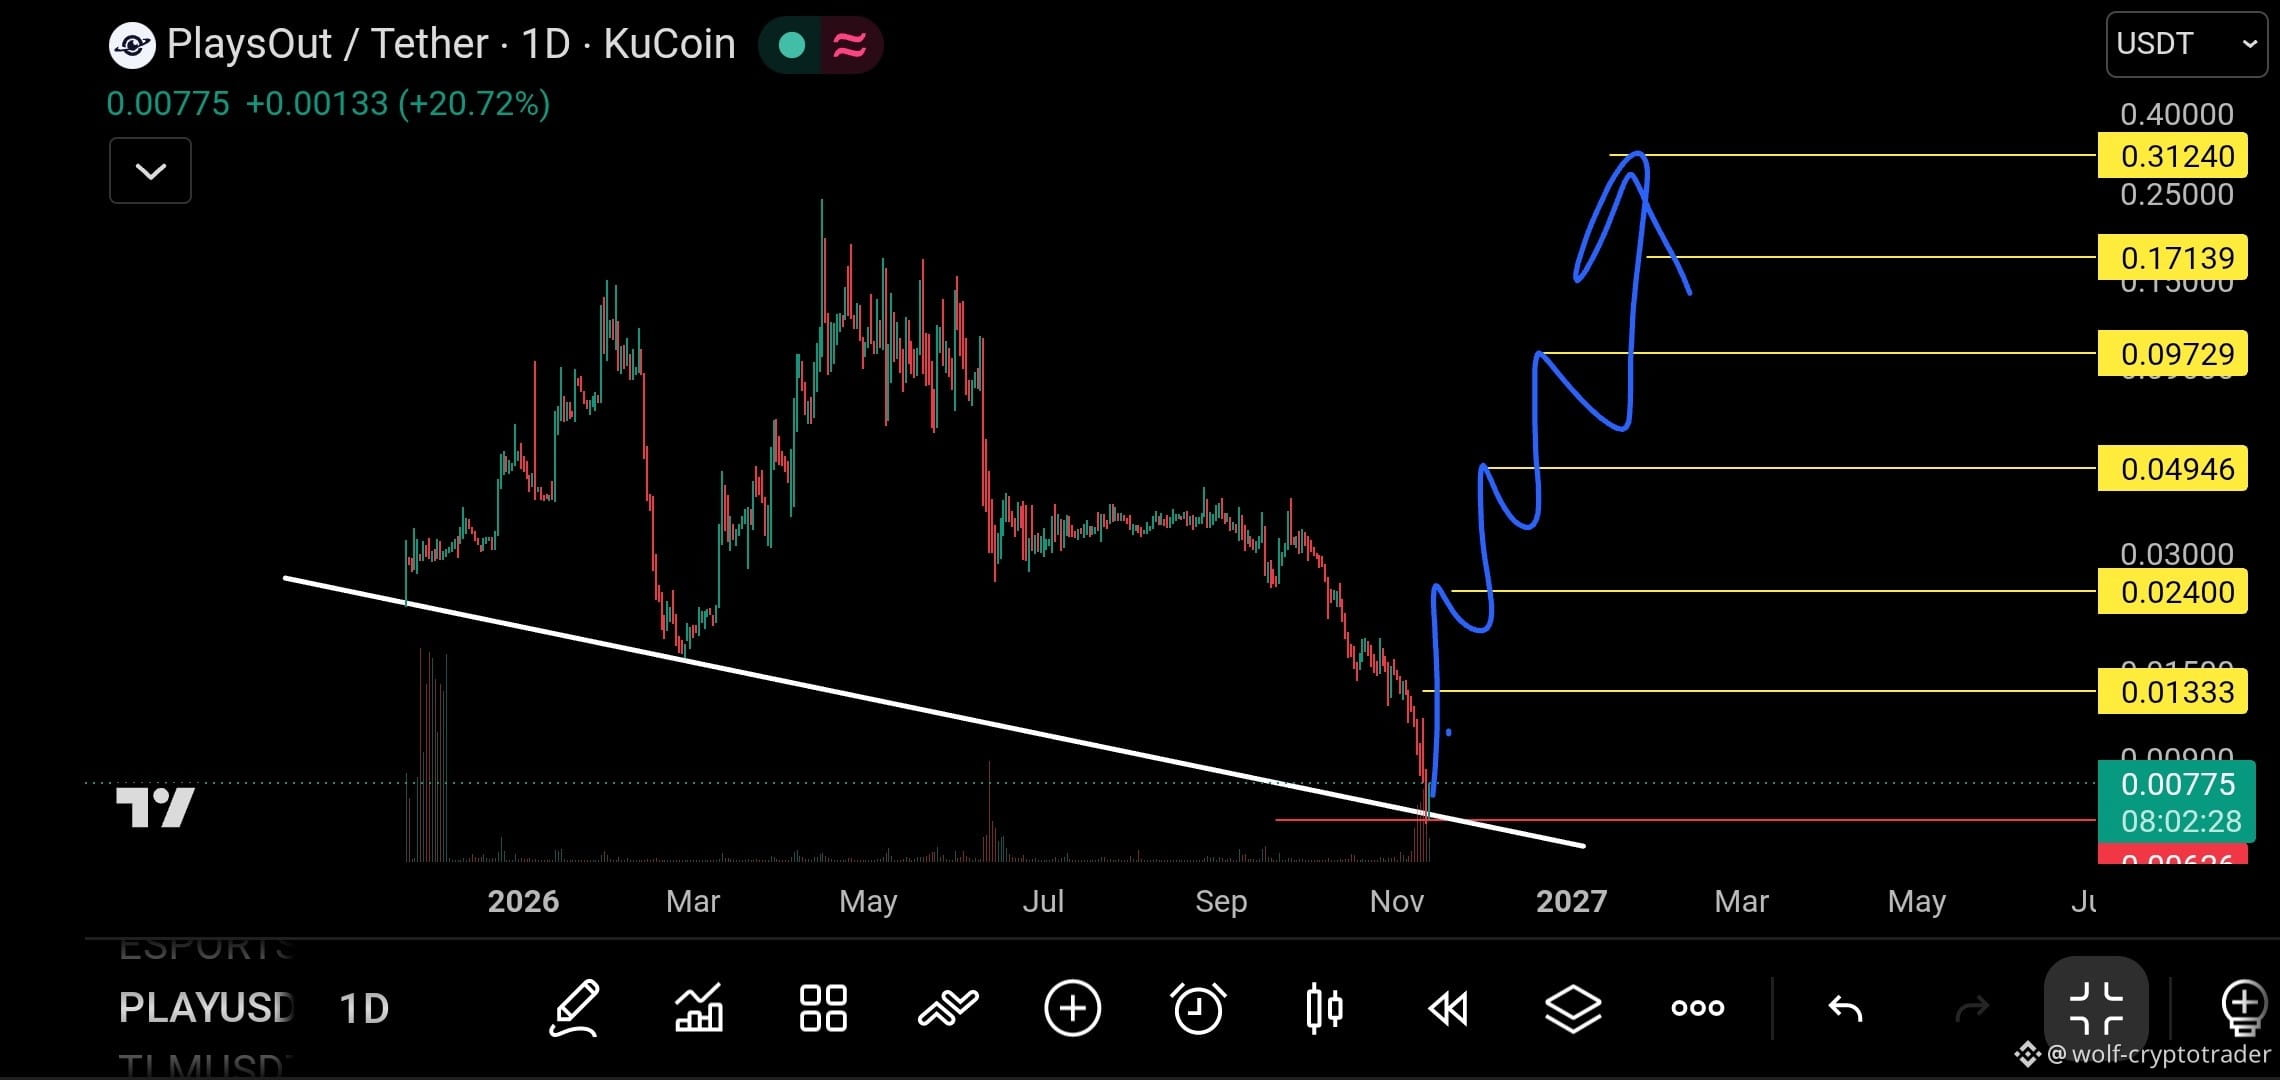
🚨 A legendary bounce from the bottom... Has PLAY begun its takeoff? 🚀 When panic takes hold of everyone, smart money starts buying quietly. 🤫💰
After months of harsh correction and liquidations of weak hands, PLAY (PlaysOut) is showing a rare opportunity on the daily chart. We may be looking at a "price reversal" scenario.
🛑 Risk management: A break below 0.006 on a daily close invalidates the bullish scenario.
{future}(PLAYUSDT)
🚨 A legendary bounce from the bottom... Has PLAY begun its takeoff? 🚀 When panic takes hold of everyone, smart money starts buying quietly. 🤫💰
After months of harsh correction and liquidations of weak hands, PLAY (PlaysOut) is showing a rare opportunity on the daily chart. We may be looking at a "price reversal" scenario.
🛑 Risk management: A break below 0.006 on a daily close invalidates the bullish scenario.
After months of harsh correction and liquidations of weak hands, PLAY (PlaysOut) is showing a rare opportunity on the daily chart. We may be looking at a "price reversal" scenario.
🛑 Risk management: A break below 0.006 on a daily close invalidates the bullish scenario.
2
867
·
--
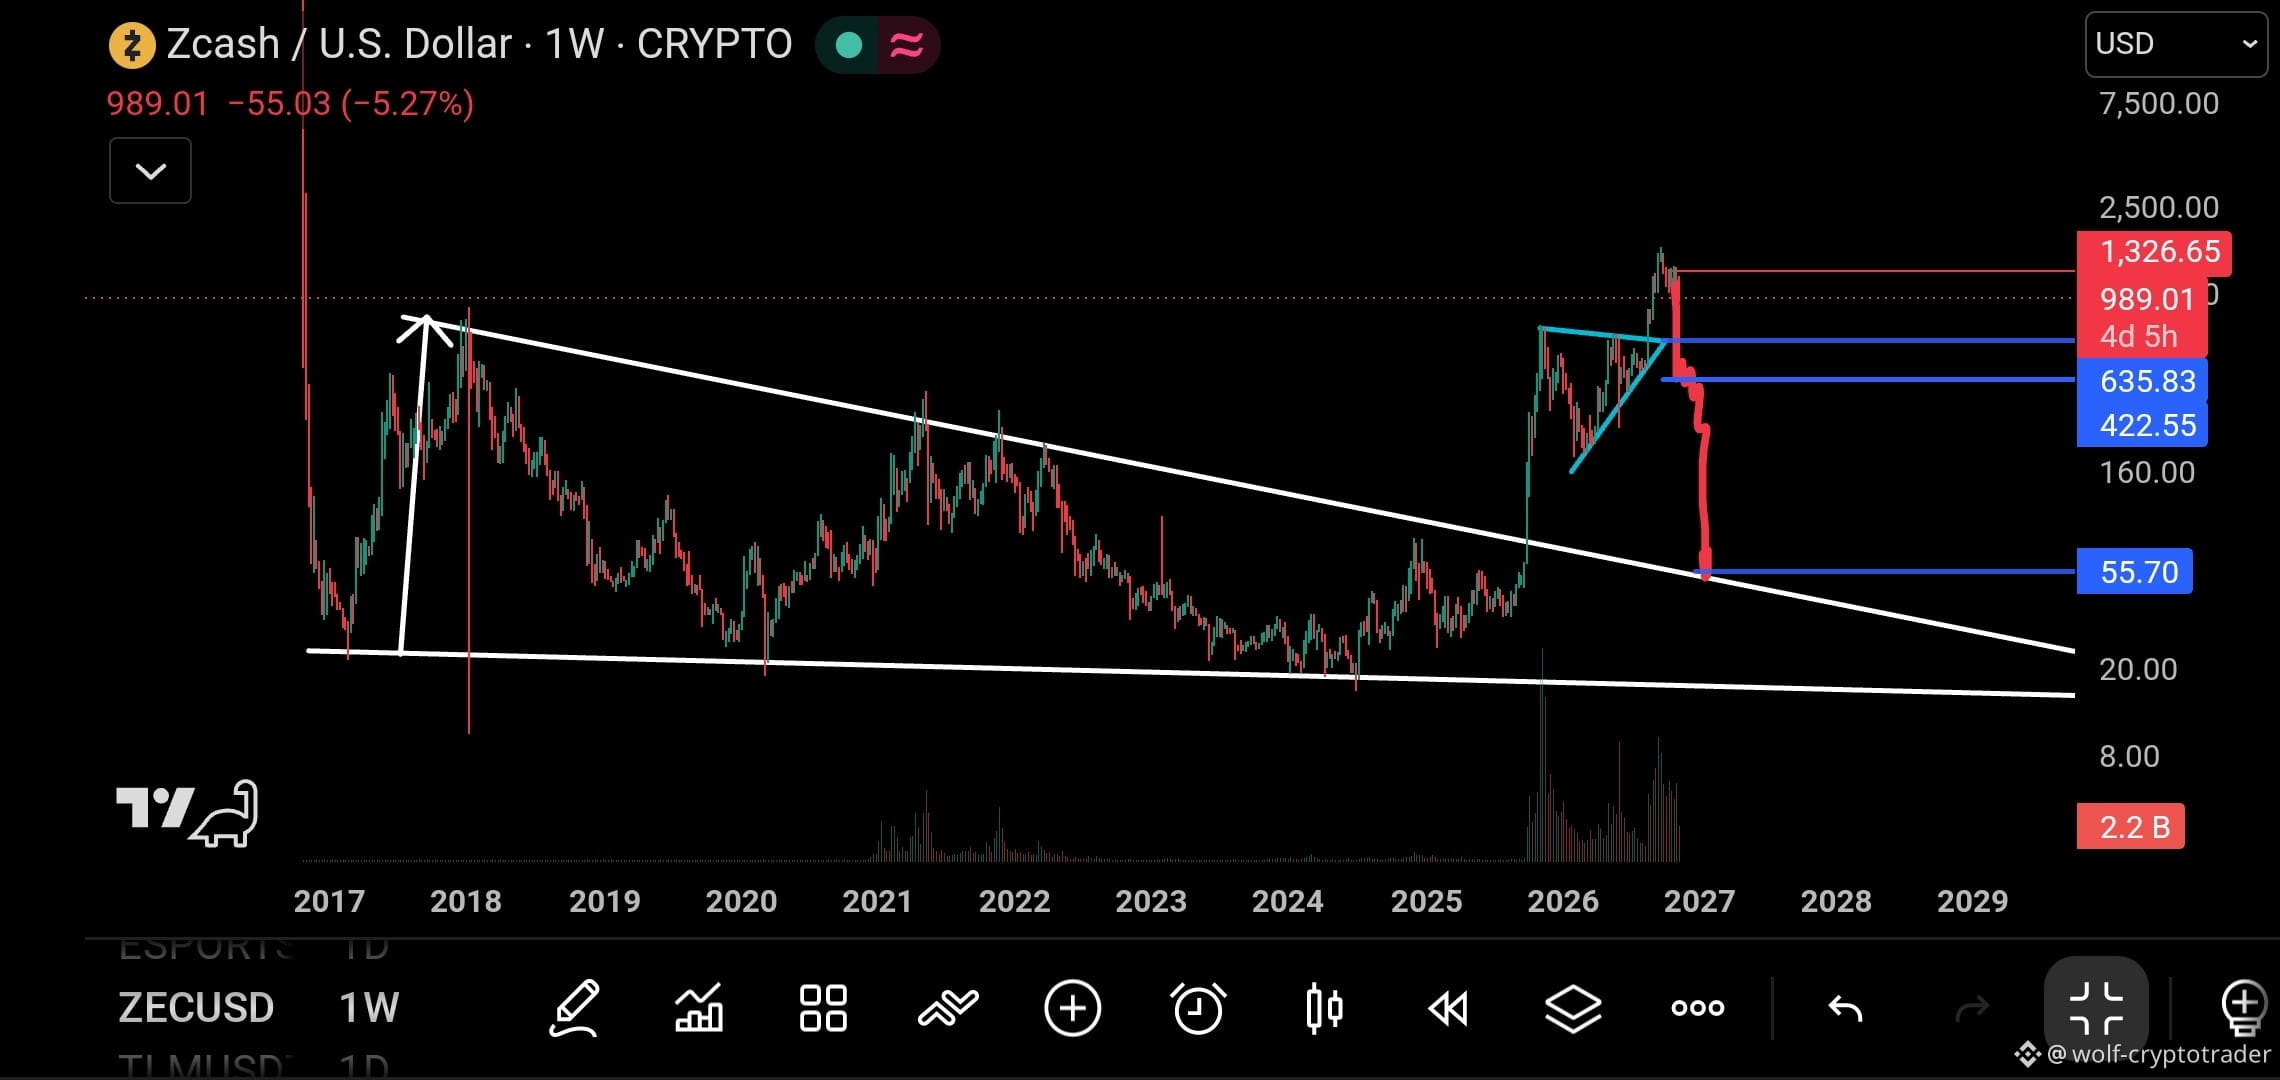
🚨 Warning, I told you: ZEC is going to hell... and now the collapse begins, wiping everyone out 🚨
When we issued the warning earlier and clearly said that ZEC was going to hell, some people looked for excuses and clung to the illusion of a rally. Today, the weekly chart (1W) provides conclusive evidence.
📉 What happened? And what lies ahead?
We all saw that peak—it was the perfect trap for greedy traders. The red arrow drawn below is not just a line; it marks an inevitable path. All the support levels that some believed would save the price have collapsed.
{future}(ZECUSDT)
🚨 Warning, I told you: ZEC is going to hell... and now the collapse begins, wiping everyone out 🚨
When we issued the warning earlier and clearly said that ZEC was going to hell, some people looked for excuses and clung to the illusion of a rally. Today, the weekly chart (1W) provides conclusive evidence.
📉 What happened? And what lies ahead?
We all saw that peak—it was the perfect trap for greedy traders. The red arrow drawn below is not just a line; it marks an inevitable path. All the support levels that some believed would save the price have collapsed.
When we issued the warning earlier and clearly said that ZEC was going to hell, some people looked for excuses and clung to the illusion of a rally. Today, the weekly chart (1W) provides conclusive evidence.
📉 What happened? And what lies ahead?
We all saw that peak—it was the perfect trap for greedy traders. The red arrow drawn below is not just a line; it marks an inevitable path. All the support levels that some believed would save the price have collapsed.
3
1.1k
·
--
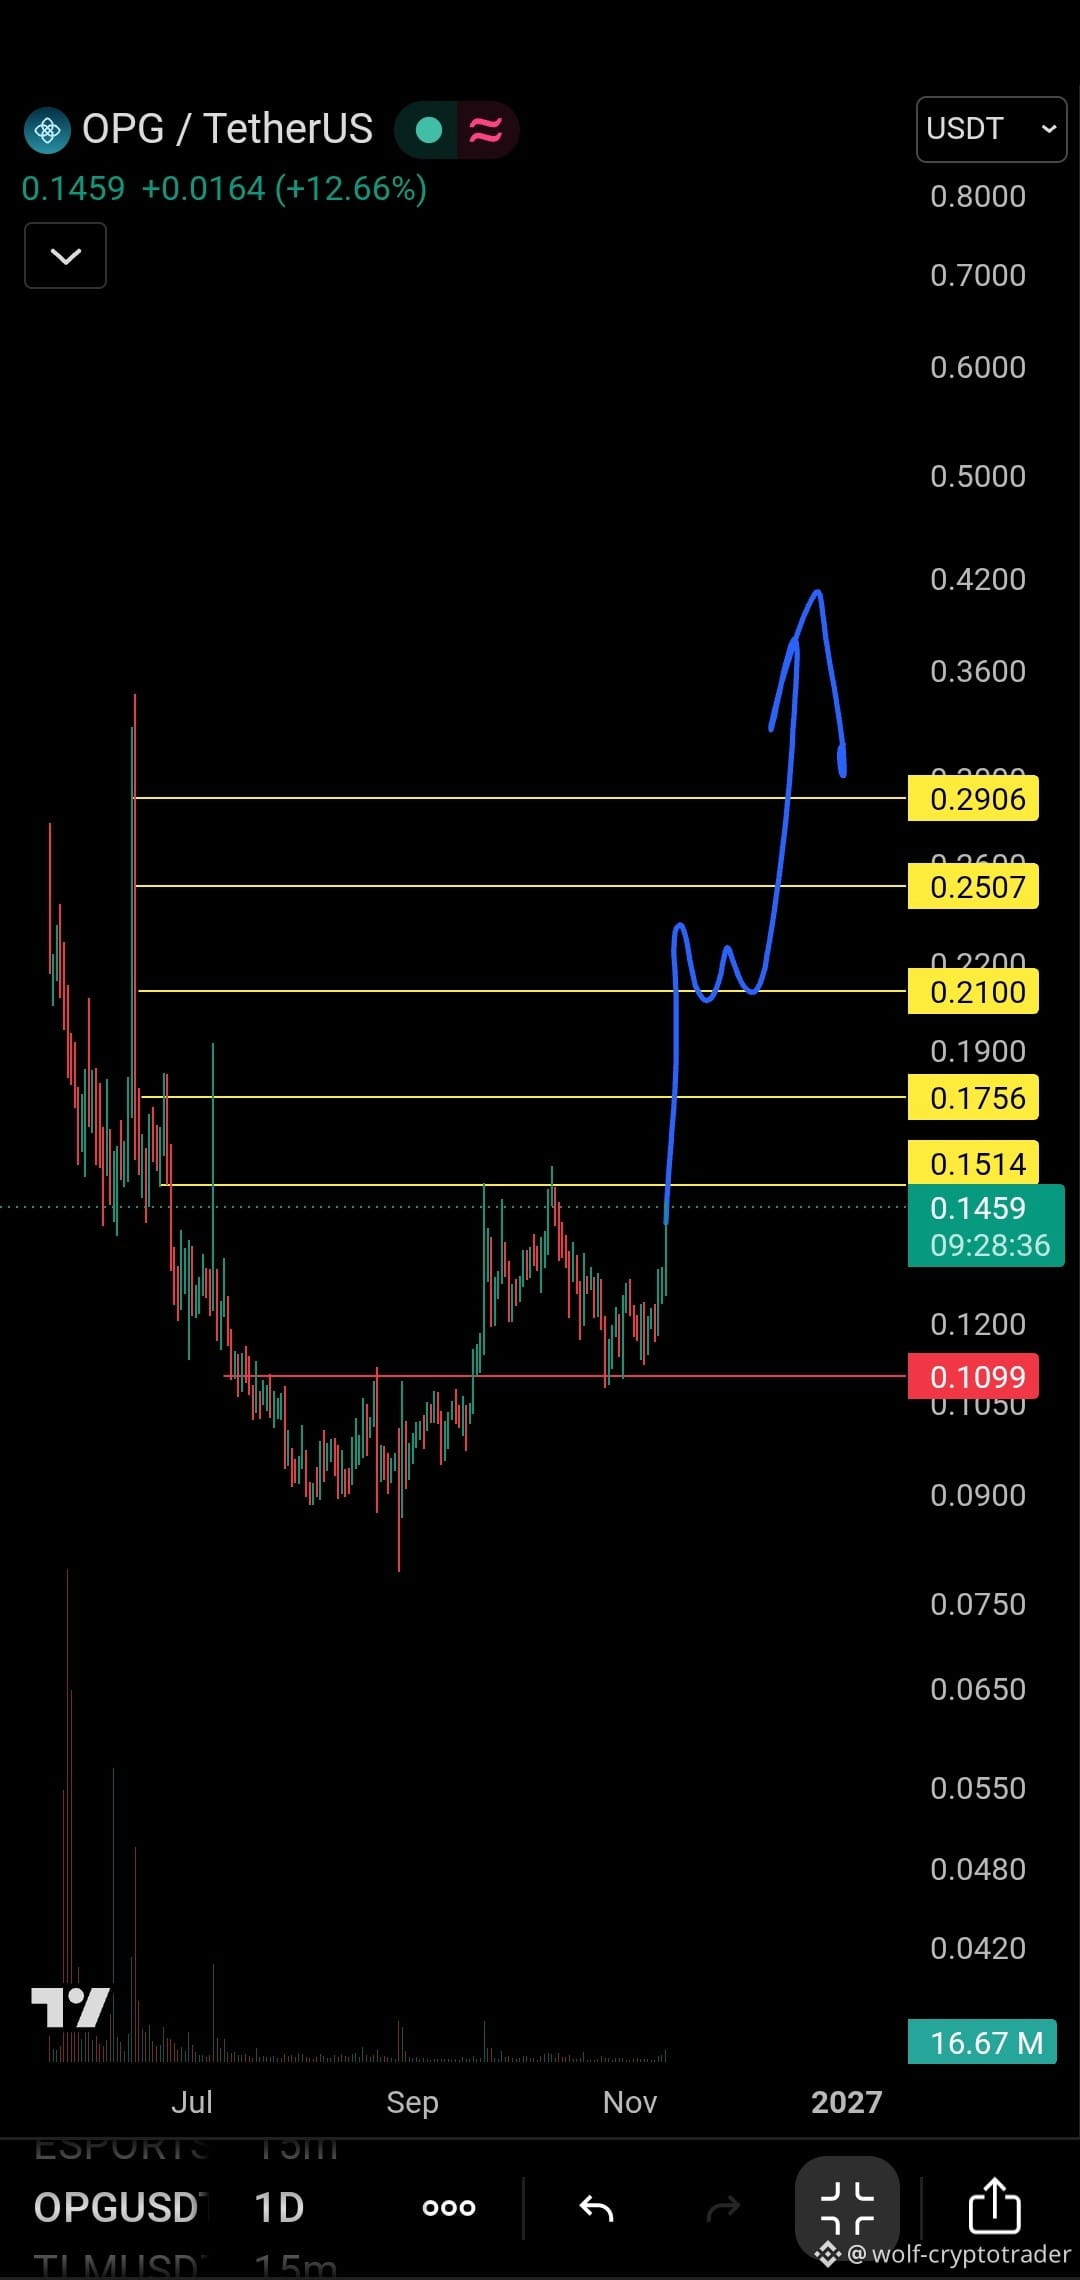
📊 OPG initial breakout… can the momentum hold?
After a strong bounce from a historic support area at $0.11, OPG managed to break through pivotal resistance at $0.15, and is now holding around 0.1459$ with a solid gain. This move places the price in a sensitive area that could mark a potential turning point.
{future}(OPGUSDT)
📊 OPG initial breakout… can the momentum hold?
After a strong bounce from a historic support area at $0.11, OPG managed to break through pivotal resistance at $0.15, and is now holding around 0.1459$ with a solid gain. This move places the price in a sensitive area that could mark a potential turning point.
After a strong bounce from a historic support area at $0.11, OPG managed to break through pivotal resistance at $0.15, and is now holding around 0.1459$ with a solid gain. This move places the price in a sensitive area that could mark a potential turning point.
2
500
·
--
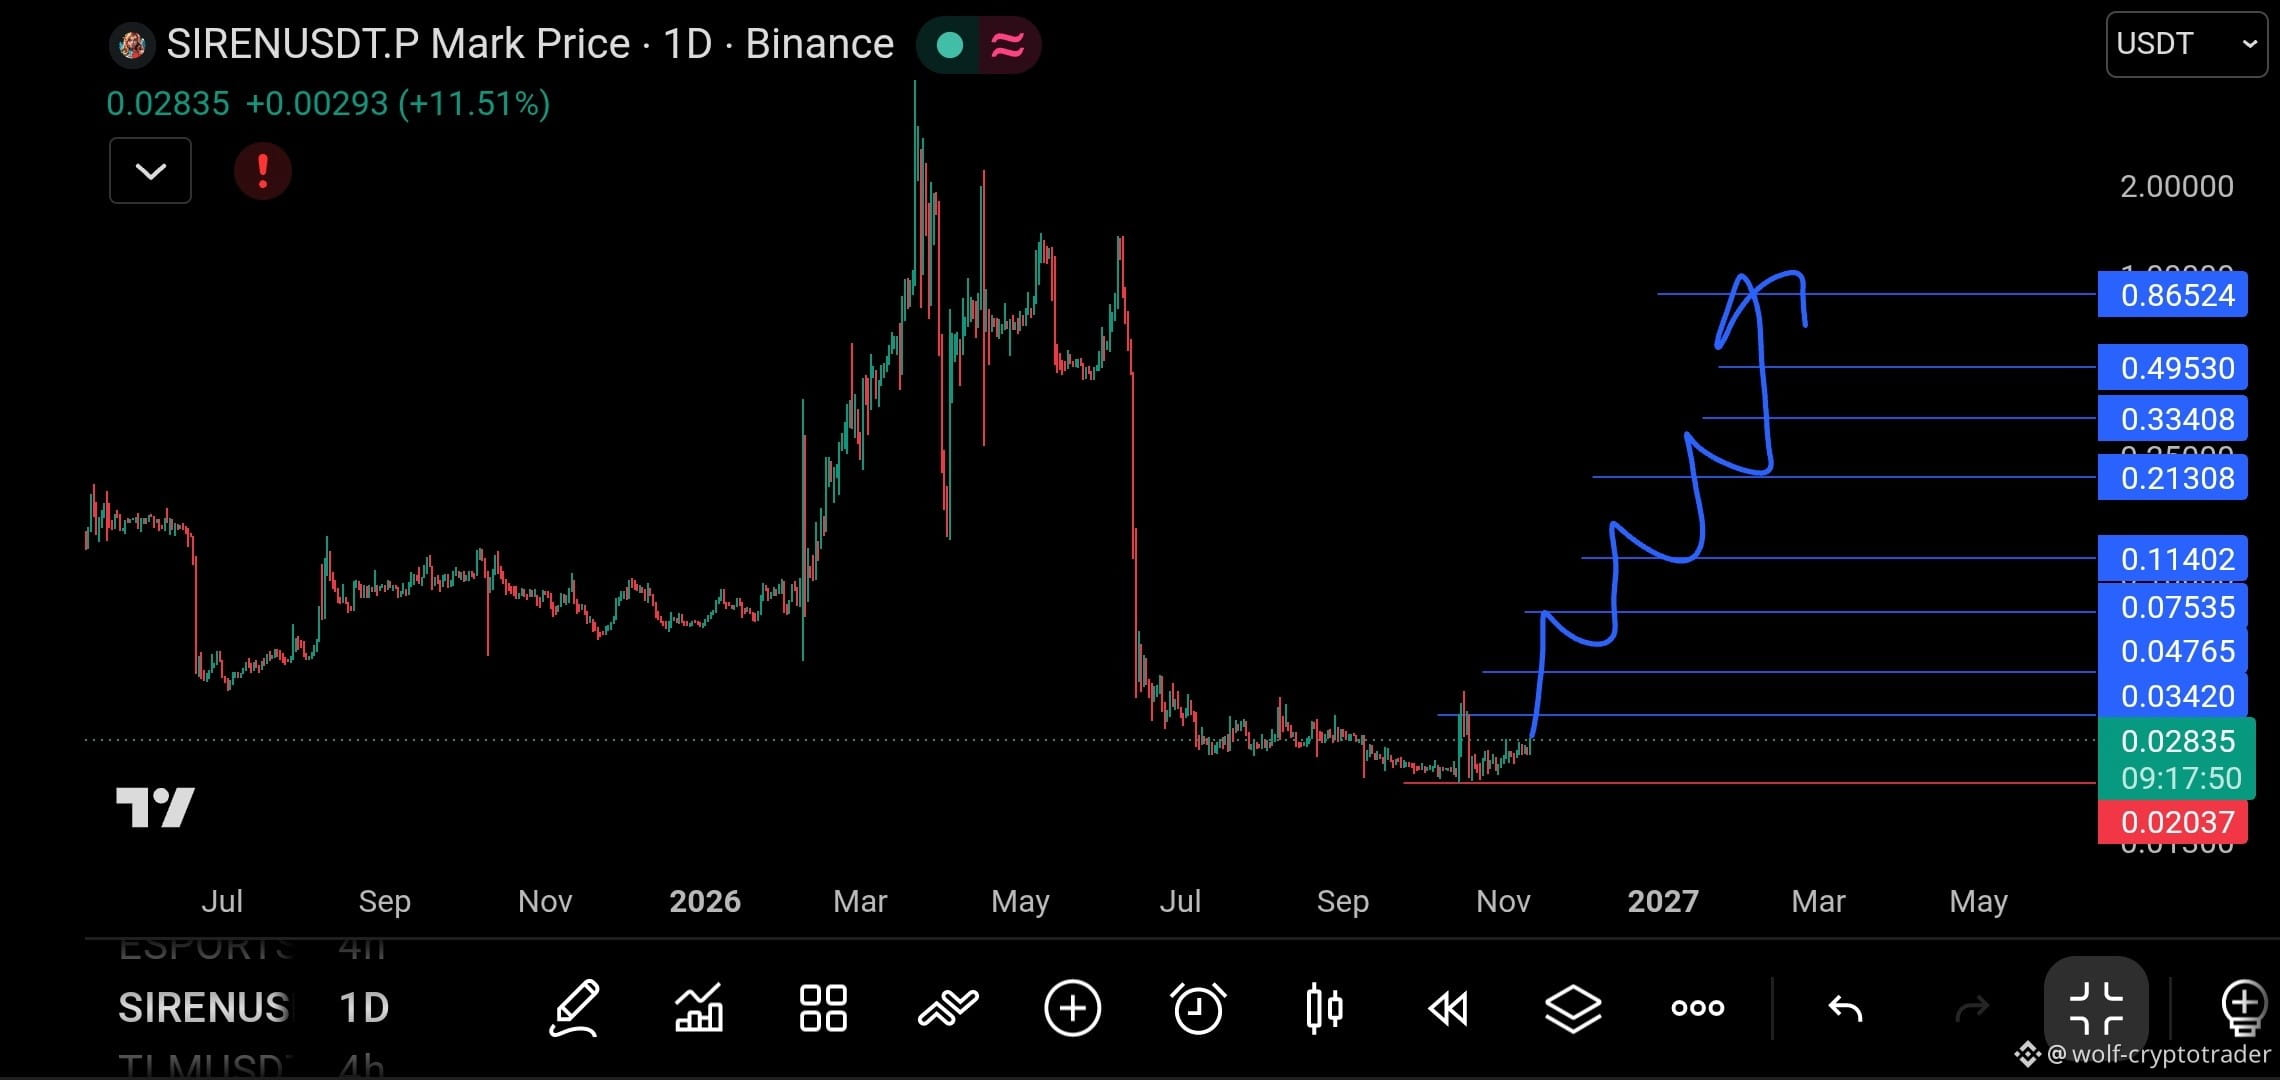
🚨 "The Great Rebound from the Bottom" — Is SIREN beginning its journey to reclaim its former glory? 🚀🔥
Stop and take a look at this chart. What you’re seeing isn’t just an ordinary bounce; it’s an "end-of-the-bleeding announcement" after a brutal wave of declines that exhausted everyone.
SIREN reached the "final capitulation" zone at the deep bottom of 0.02037 and refused to fall any further. Today, the price is waking up and flashing its first signals of a breakout through an "ascending staircase" pattern.
🛑 The safety valve
This thesis only loses strength if the price breaks below $0.02037 and closes below it on a daily basis. As long as we’re above it, buyers are fully in control.
{alpha}(560x997a58129890bbda032231a52ed1ddc845fc18e1)
🚨 "The Great Rebound from the Bottom" — Is SIREN beginning its journey to reclaim its former glory? 🚀🔥
Stop and take a look at this chart. What you’re seeing isn’t just an ordinary bounce; it’s an "end-of-the-bleeding announcement" after a brutal wave of declines that exhausted everyone.
SIREN reached the "final capitulation" zone at the deep bottom of 0.02037 and refused to fall any further. Today, the price is waking up and flashing its first signals of a breakout through an "ascending staircase" pattern.
🛑 The safety valve
This thesis only loses strength if the price breaks below $0.02037 and closes below it on a daily basis. As long as we’re above it, buyers are fully in control.
Stop and take a look at this chart. What you’re seeing isn’t just an ordinary bounce; it’s an "end-of-the-bleeding announcement" after a brutal wave of declines that exhausted everyone.
SIREN reached the "final capitulation" zone at the deep bottom of 0.02037 and refused to fall any further. Today, the price is waking up and flashing its first signals of a breakout through an "ascending staircase" pattern.
🛑 The safety valve
This thesis only loses strength if the price breaks below $0.02037 and closes below it on a daily basis. As long as we’re above it, buyers are fully in control.
1
129
·
--
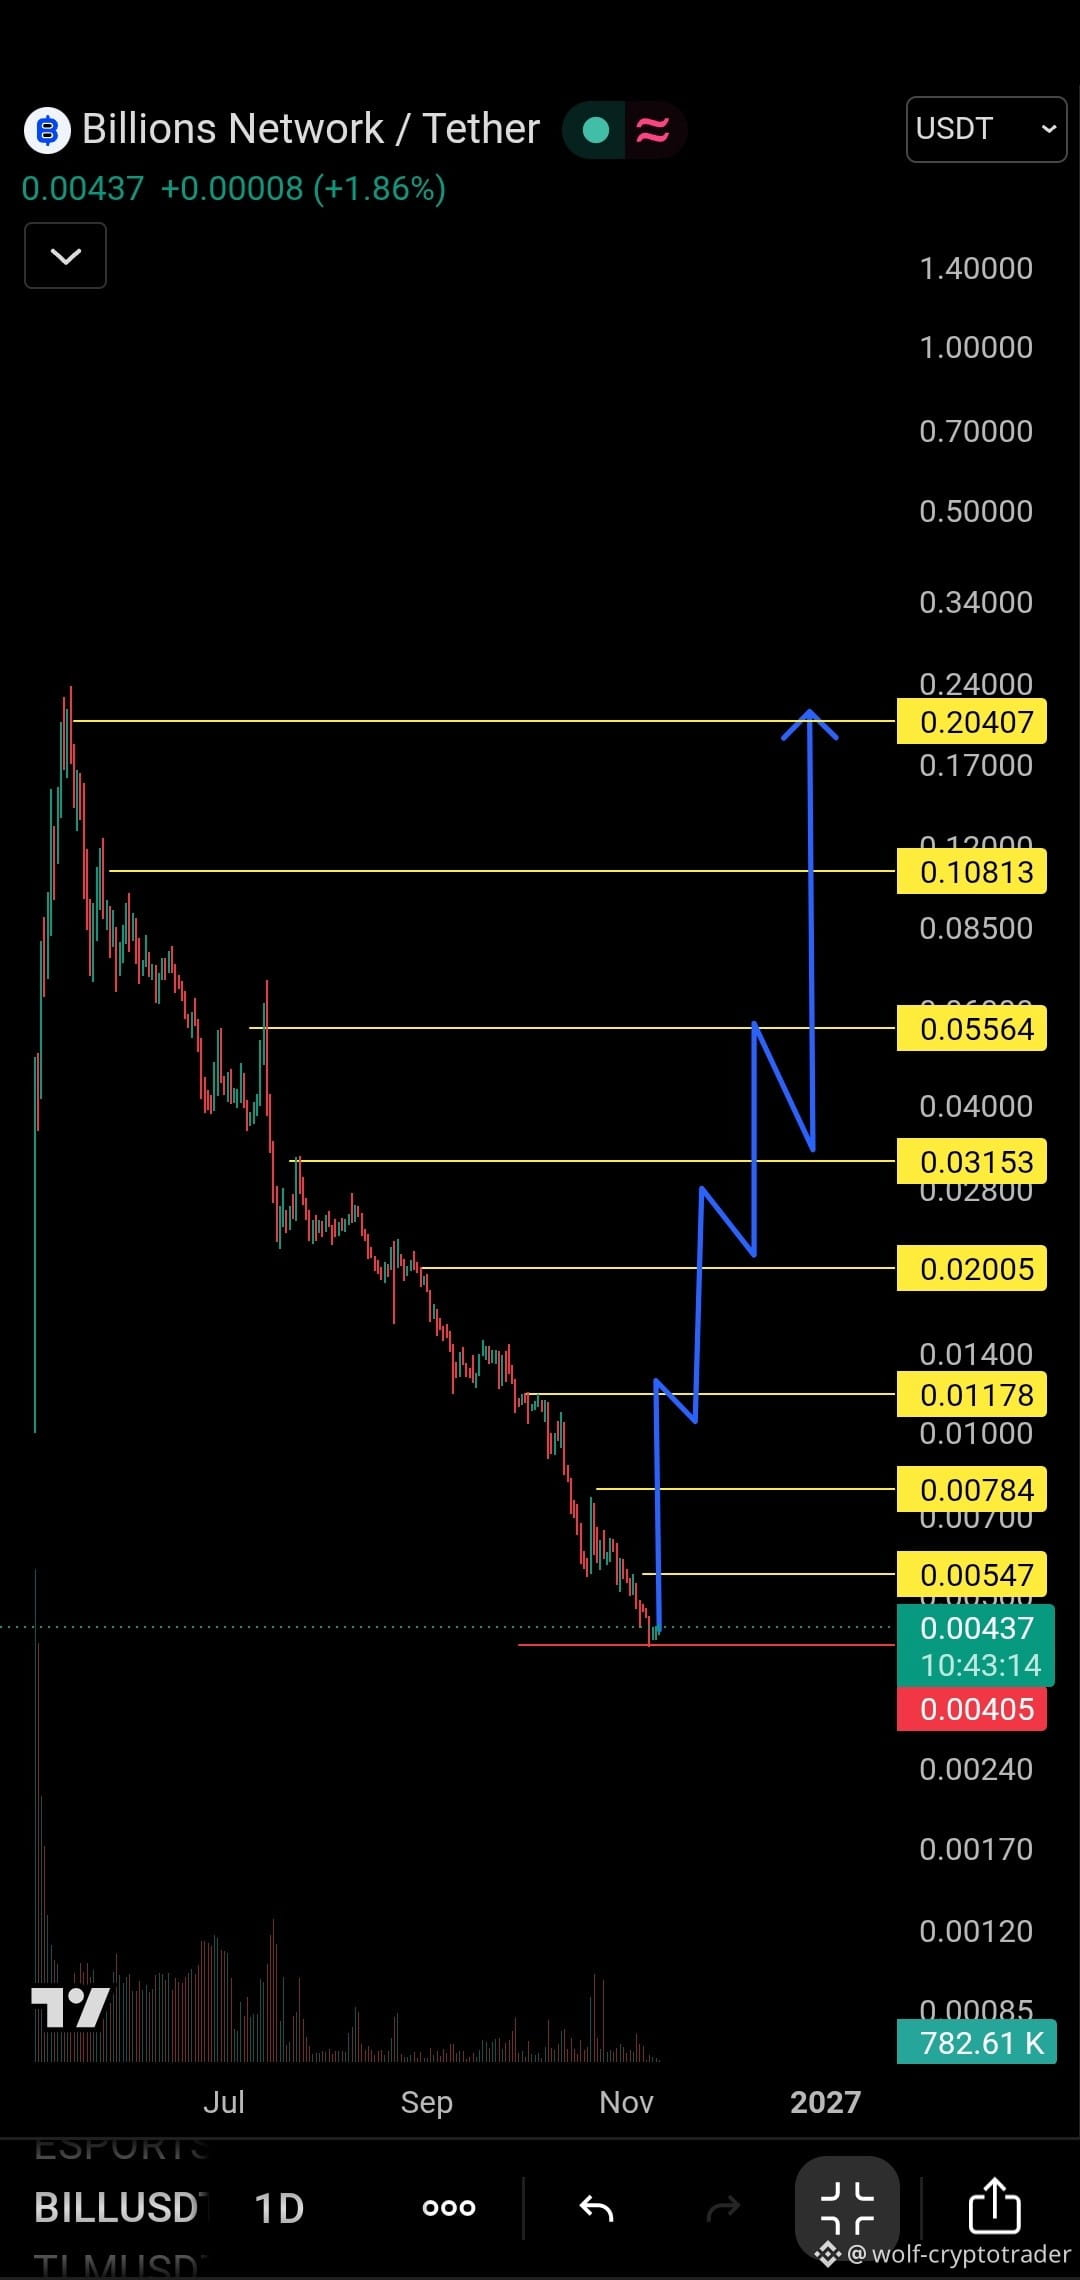
🚨 Pay close attention—the opportunity is on the horizon... BILL is ready to explode
Do you see this chart? 📉 This isn’t just a drop; this is the “all-time bottom” that comes before legendary rallies 🚀 We’re currently trading around 0.00437, and this is where crypto explosion stories begin 💰
🔥 The next scenario... a rise
The chart speaks for itself, and the path drawn in blue shows the roadmap to the top! We’re about to begin a crazy upward wave
🛑 Risk management: A break below 0.0040 with a daily close invalidates the bullish scenario
{future}(BILLUSDT)
🚨 Pay close attention—the opportunity is on the horizon... BILL is ready to explode
Do you see this chart? 📉 This isn’t just a drop; this is the “all-time bottom” that comes before legendary rallies 🚀 We’re currently trading around 0.00437, and this is where crypto explosion stories begin 💰
🔥 The next scenario... a rise
The chart speaks for itself, and the path drawn in blue shows the roadmap to the top! We’re about to begin a crazy upward wave
🛑 Risk management: A break below 0.0040 with a daily close invalidates the bullish scenario
Do you see this chart? 📉 This isn’t just a drop; this is the “all-time bottom” that comes before legendary rallies 🚀 We’re currently trading around 0.00437, and this is where crypto explosion stories begin 💰
🔥 The next scenario... a rise
The chart speaks for itself, and the path drawn in blue shows the roadmap to the top! We’re about to begin a crazy upward wave
🛑 Risk management: A break below 0.0040 with a daily close invalidates the bullish scenario
2
1.9k
·
--
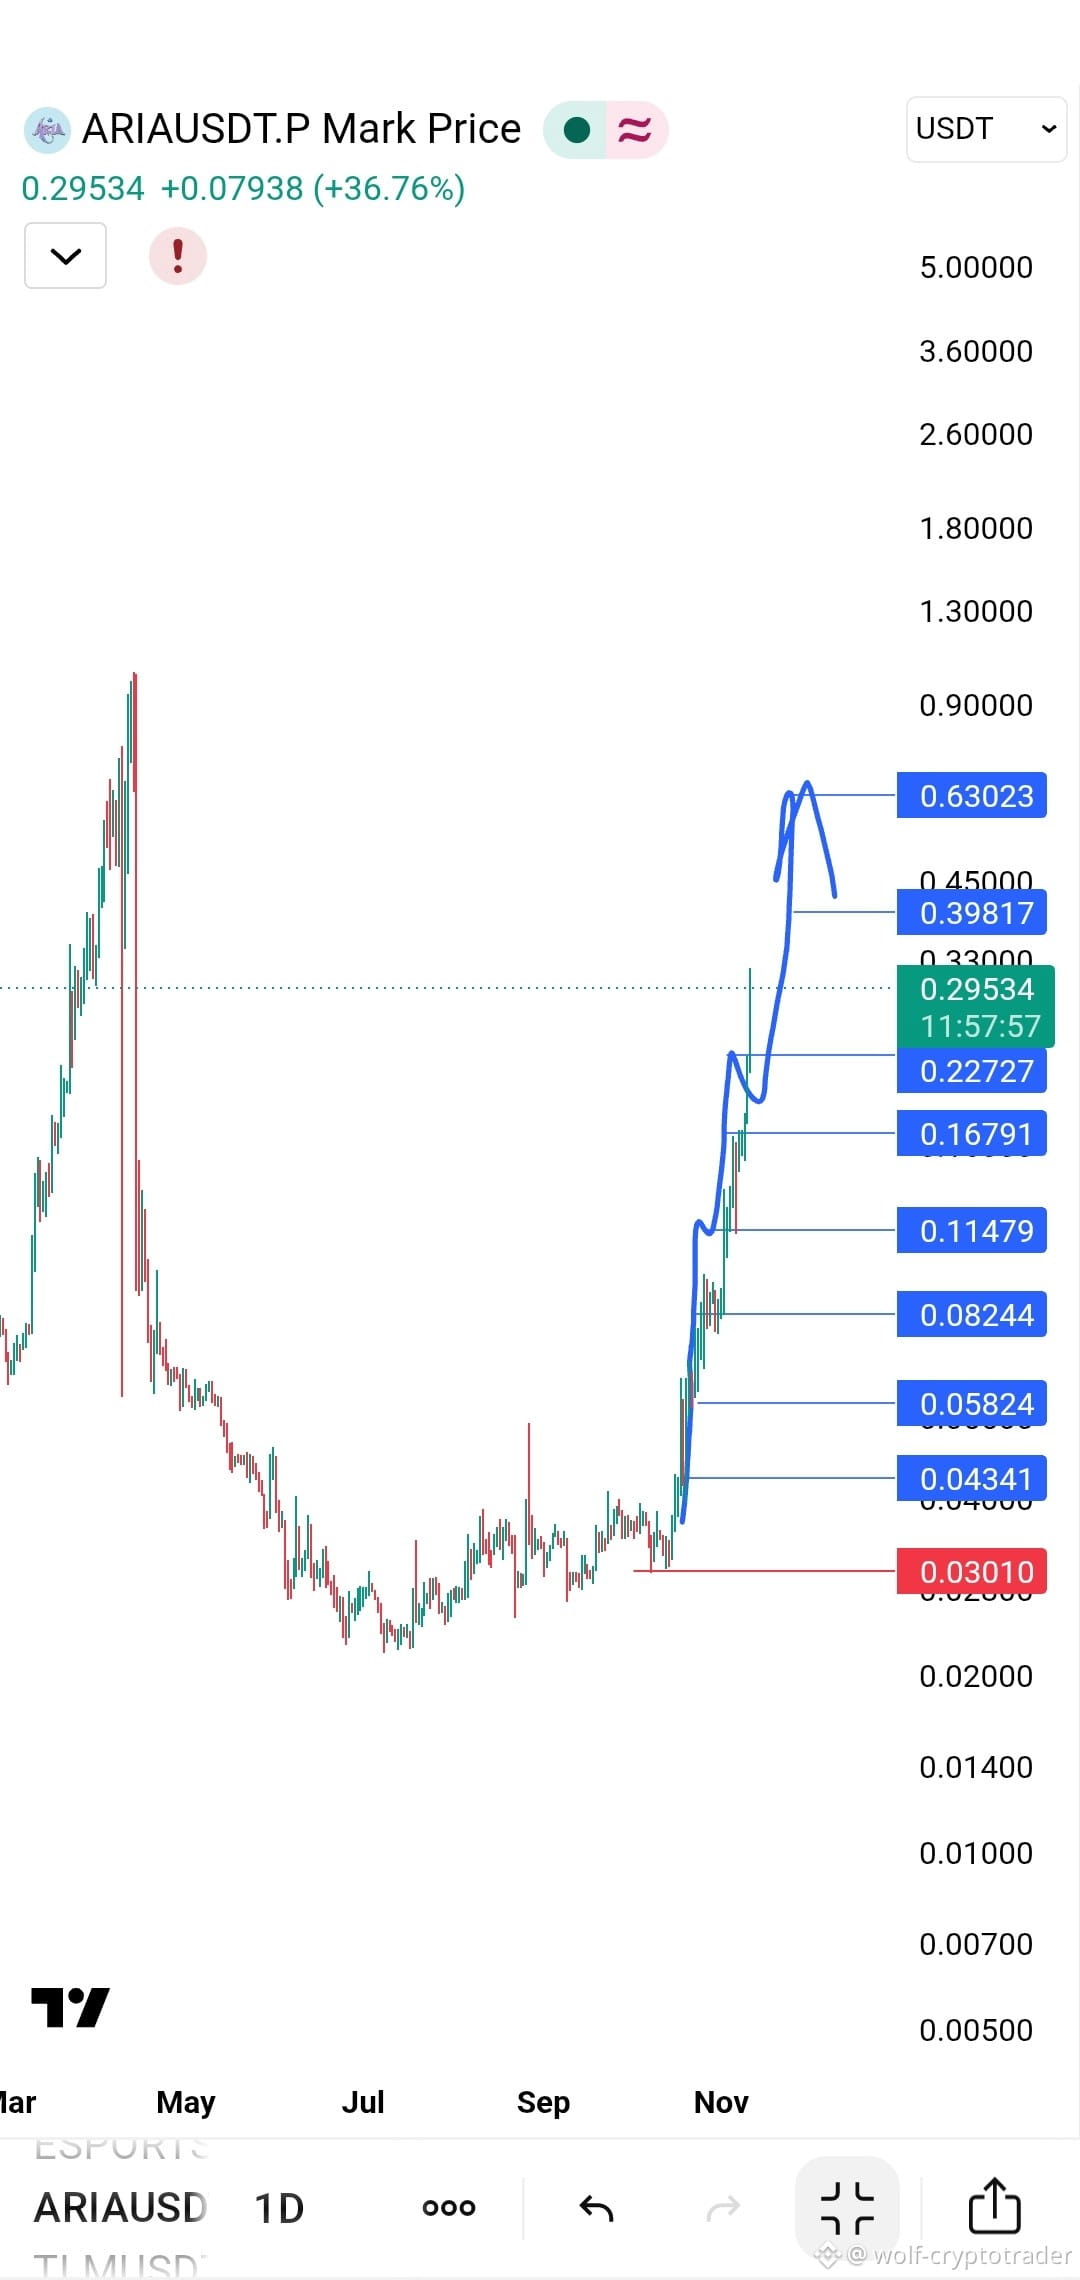
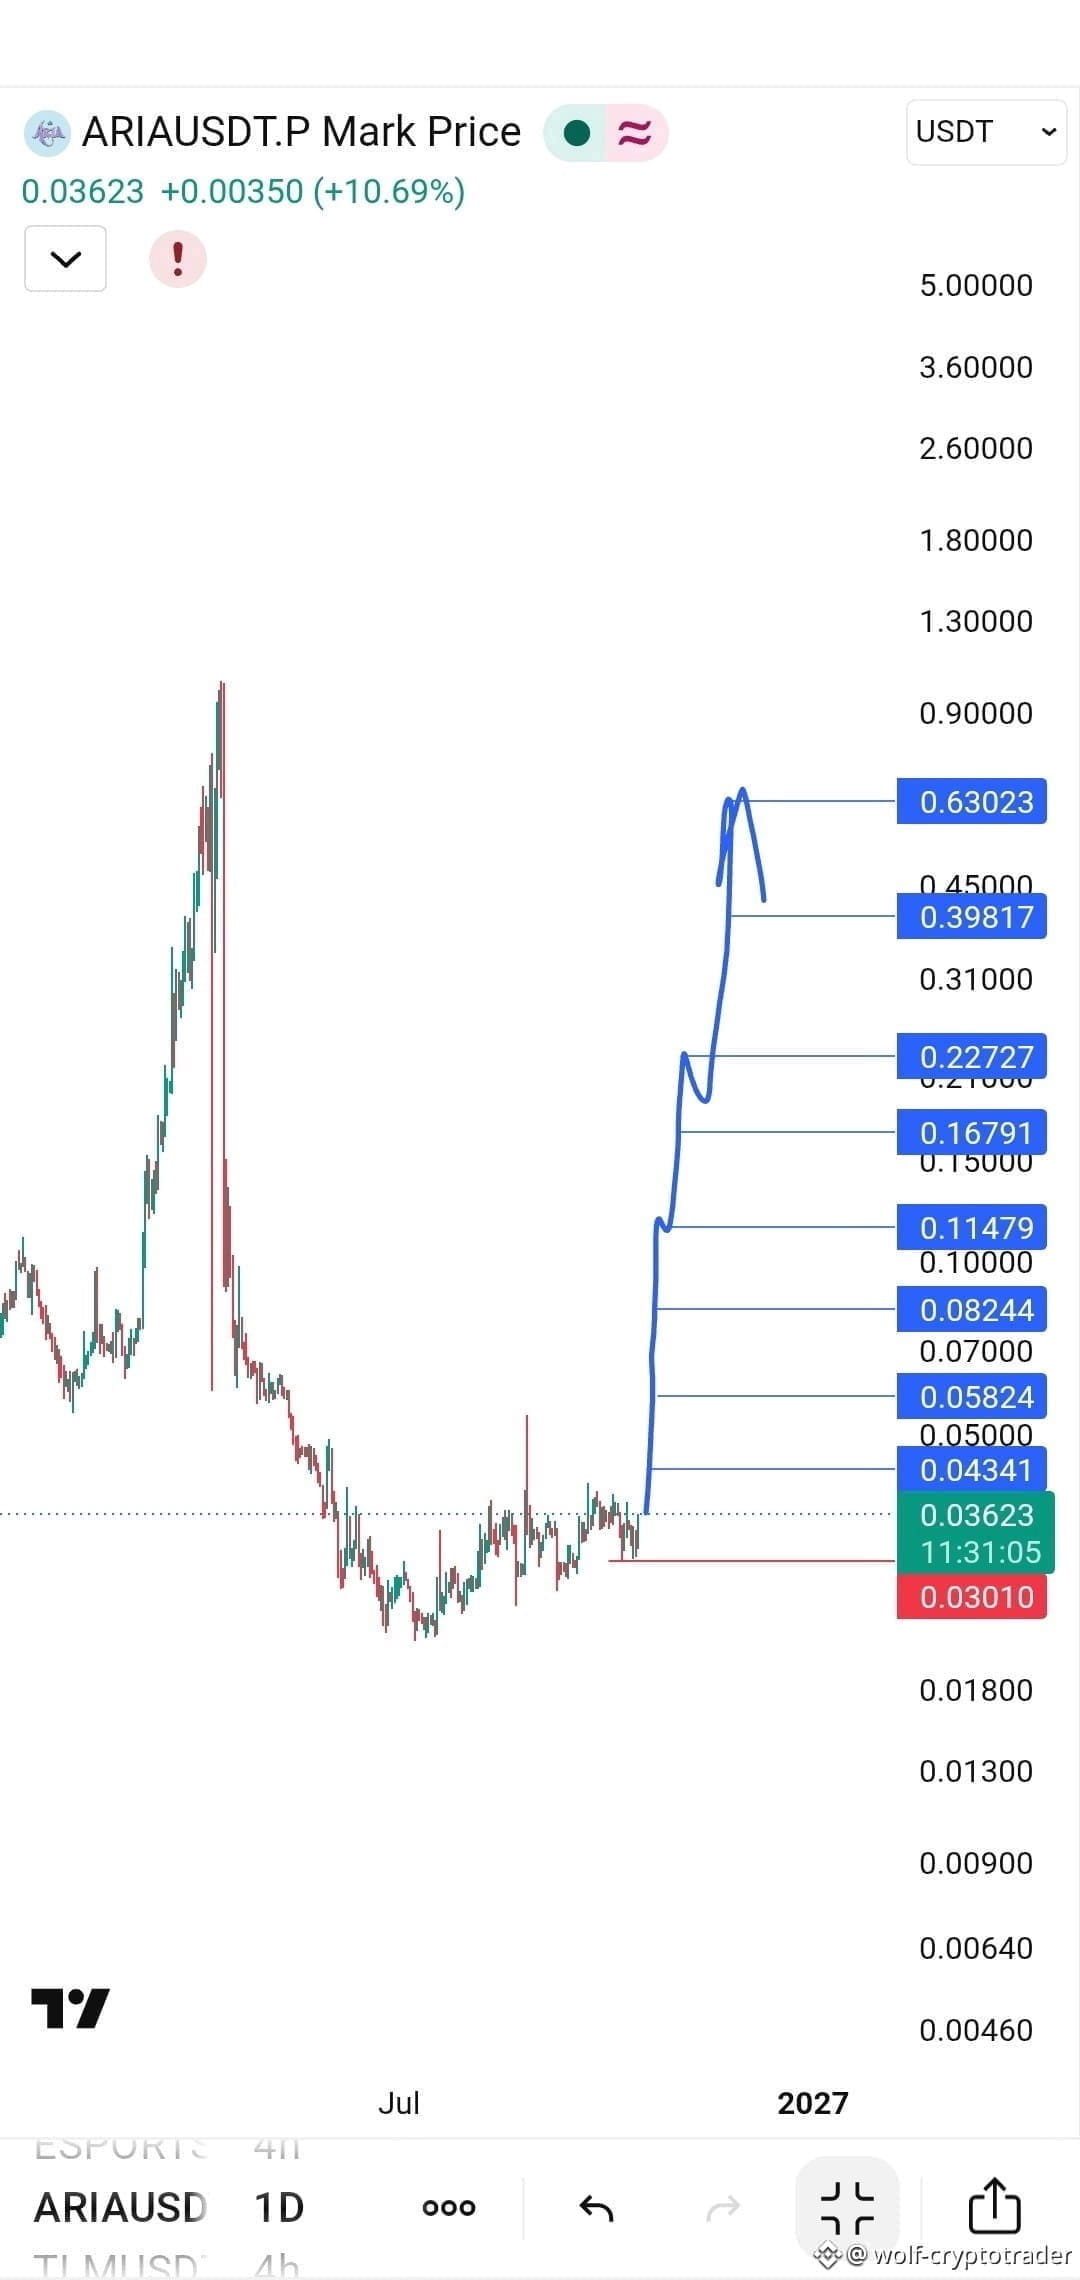
🚨 "I told you from the bottom" ARIA crushes expectations with returns exceeding 900%🚀🔥
Stop and look at these numbers. In our previous analysis, we laid out a clear roadmap for ARIA from the entry zone at 0.036$ . Today, the chart (proves the market has written a new chapter in the legends, with the price reaching 0.30 and delivering a historic return of over 900% from the entry point—and the rally continues.
{future}(ARIAUSDT)
🚨 "I told you from the bottom" ARIA crushes expectations with returns exceeding 900%🚀🔥
Stop and look at these numbers. In our previous analysis, we laid out a clear roadmap for ARIA from the entry zone at 0.036$ . Today, the chart (proves the market has written a new chapter in the legends, with the price reaching 0.30 and delivering a historic return of over 900% from the entry point—and the rally continues.
Stop and look at these numbers. In our previous analysis, we laid out a clear roadmap for ARIA from the entry zone at 0.036$ . Today, the chart (proves the market has written a new chapter in the legends, with the price reaching 0.30 and delivering a historic return of over 900% from the entry point—and the rally continues.
2
642
·
--
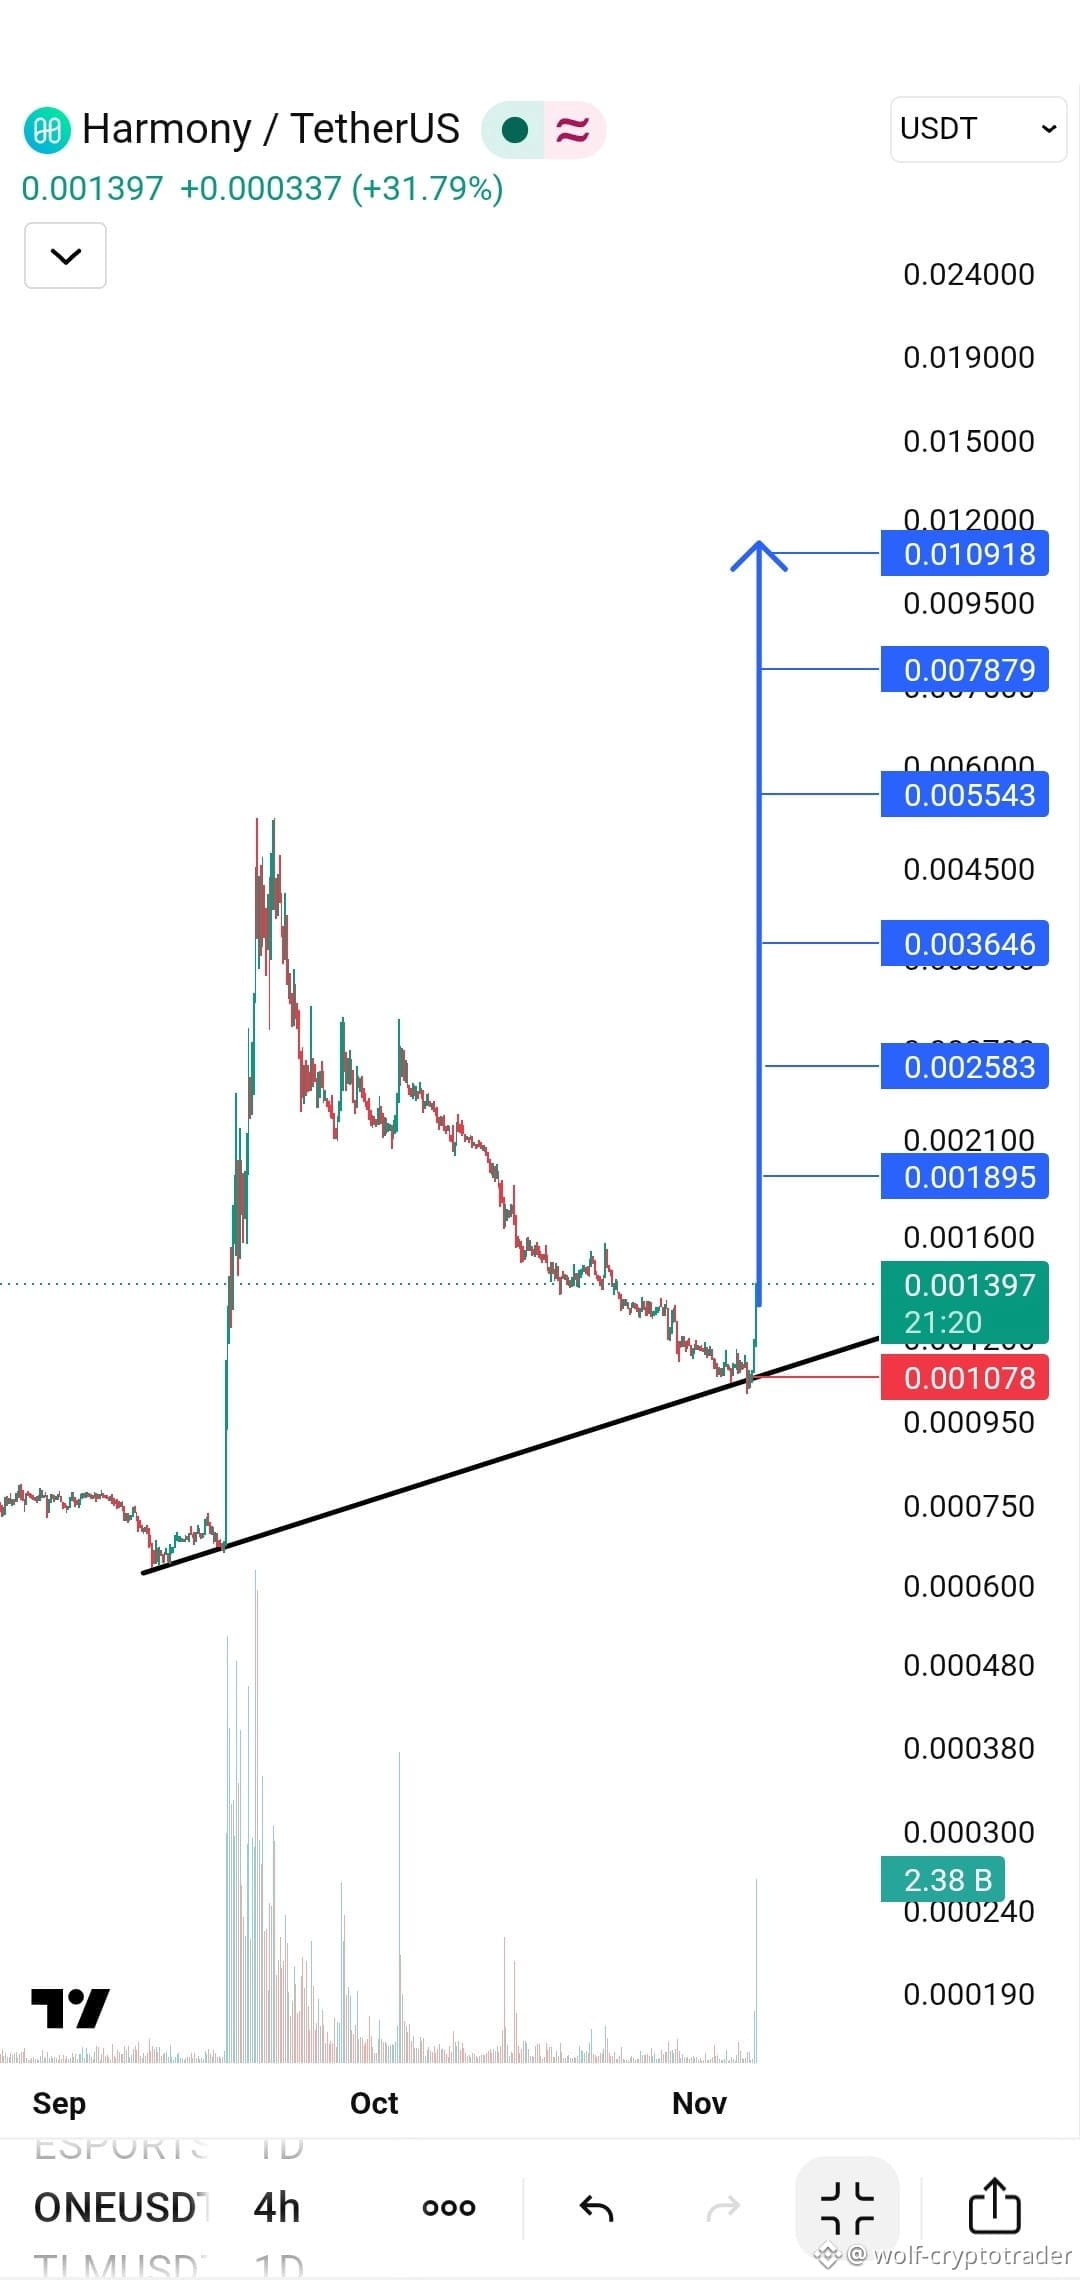
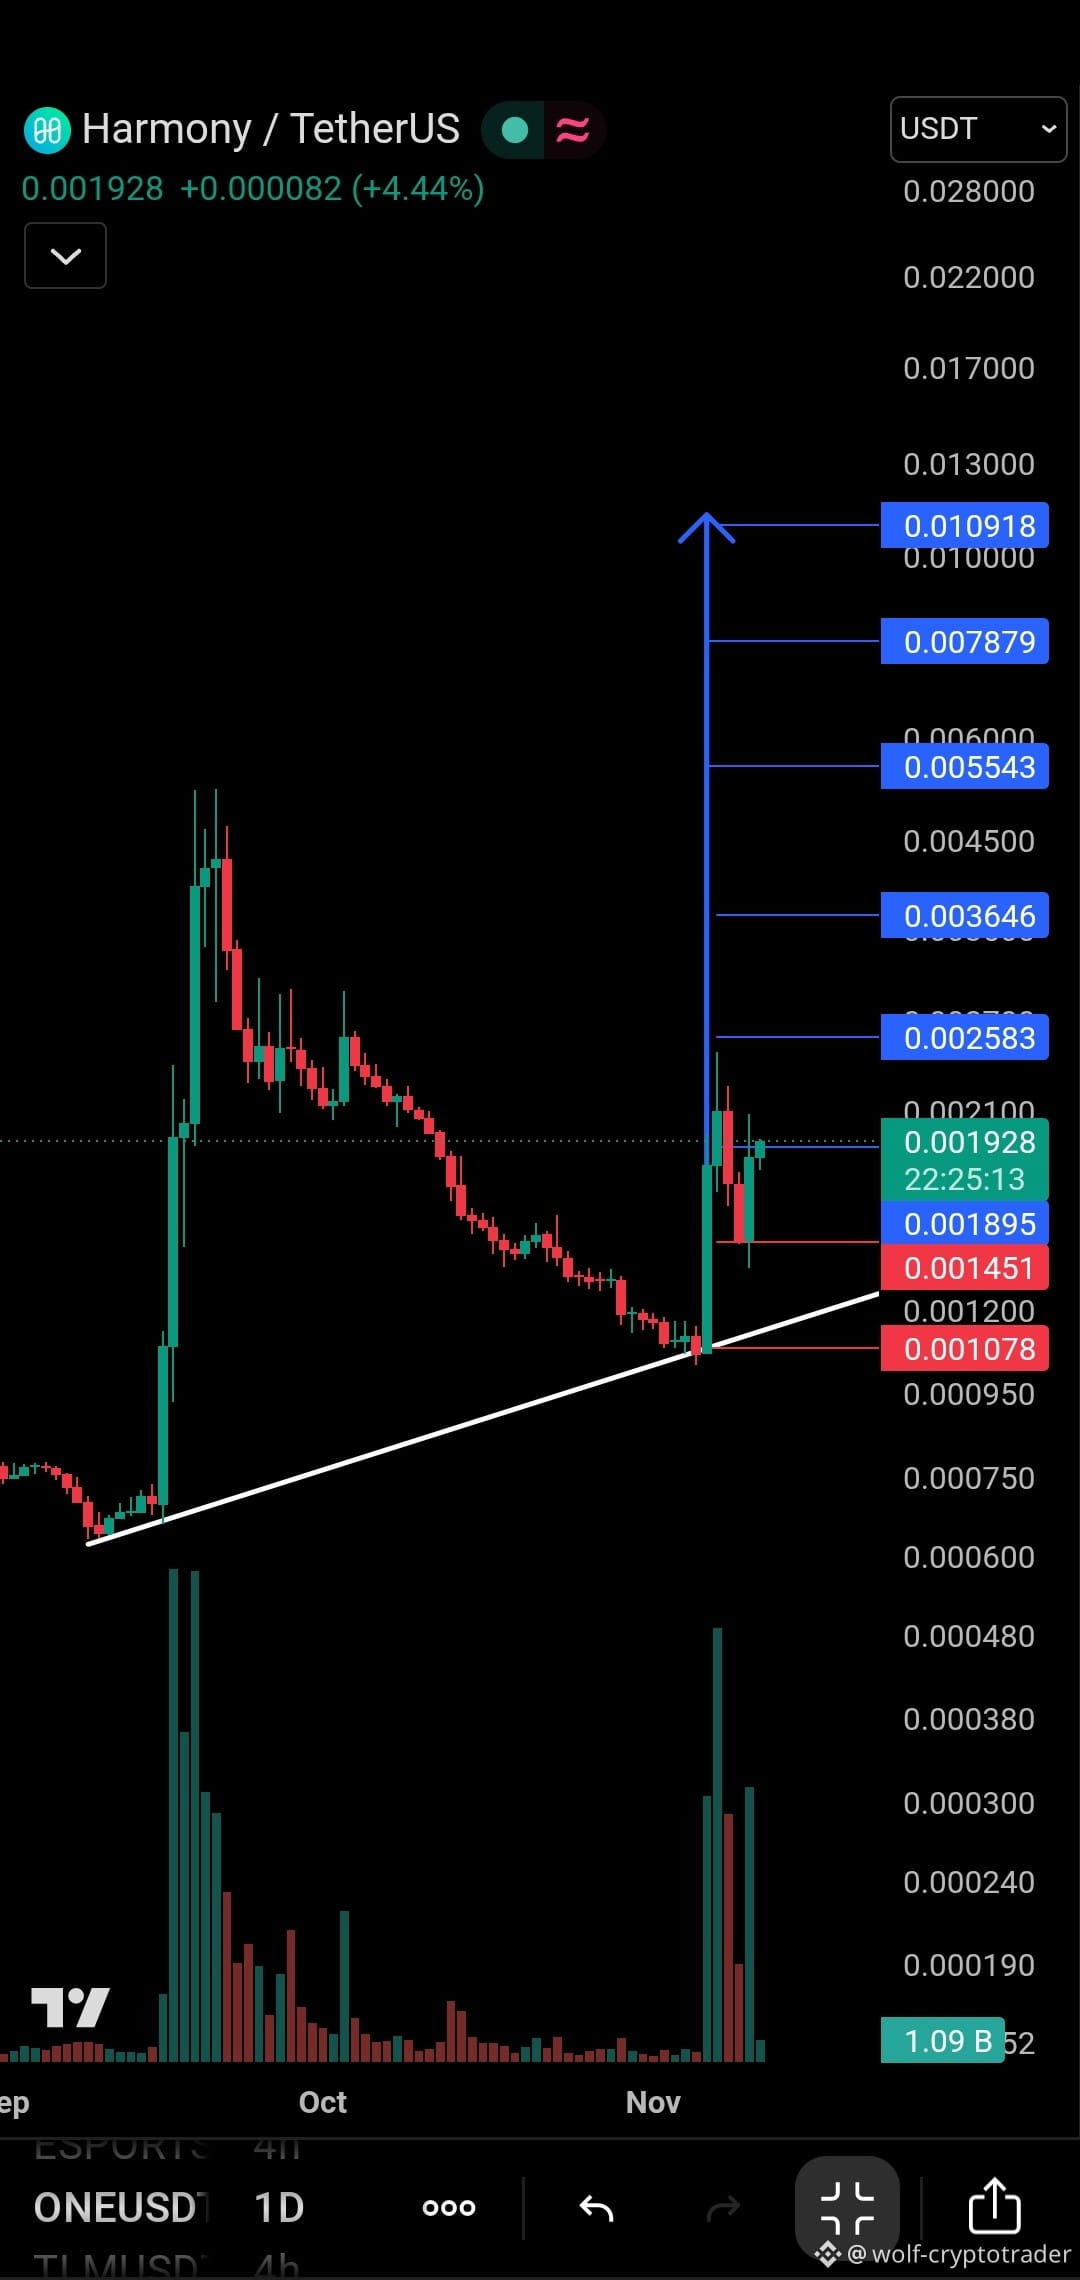
🎯 ONE surges and hits the first target
After a strong rebound from historic support, Harmony ($ONE) managed to surpass the first target and hold above it at $0.001900. Liquidity is supporting the move, and attention is now turning to the next resistance at $0.0025.
In summary, the target has been reached, momentum continues, but monitoring and risk management remain essential.
{future}(ONEUSDT)
🎯 ONE surges and hits the first target
After a strong rebound from historic support, Harmony ($ONE) managed to surpass the first target and hold above it at $0.001900. Liquidity is supporting the move, and attention is now turning to the next resistance at $0.0025.
In summary, the target has been reached, momentum continues, but monitoring and risk management remain essential.
After a strong rebound from historic support, Harmony ($ONE) managed to surpass the first target and hold above it at $0.001900. Liquidity is supporting the move, and attention is now turning to the next resistance at $0.0025.
In summary, the target has been reached, momentum continues, but monitoring and risk management remain essential.
2
1.4k
·
--
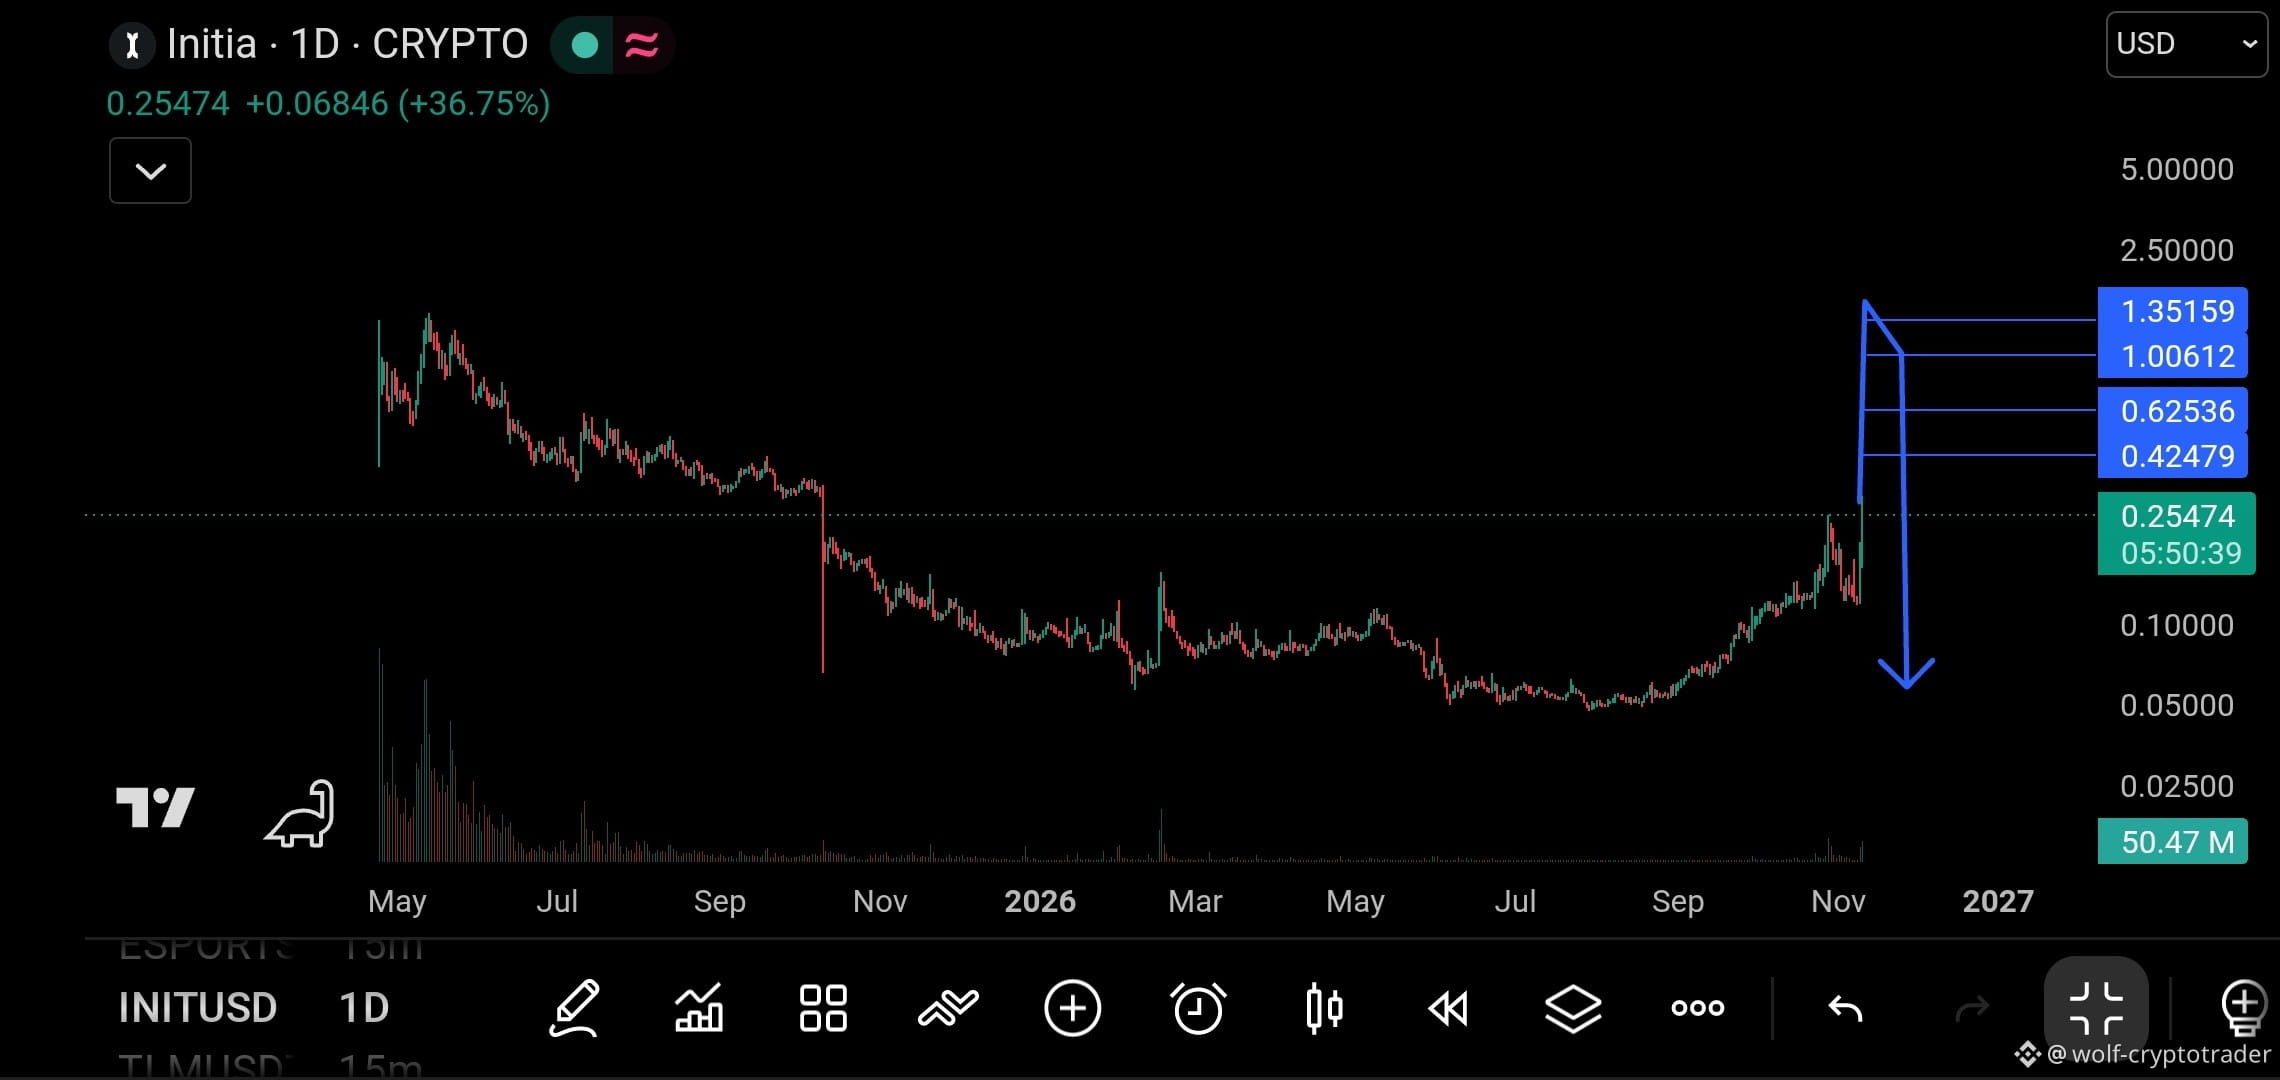
🚀 Stop selling now—INIT is not for sale. The rally isn’t over yet! 🔥
A quick look at INIT’s 1D (daily) chart is enough to see that it’s on the verge of a historic breakout. It’s currently making a very strong move after a long accumulation period, and the buying momentum is unmistakable.
⚠️ Warning
Anyone trying to sell now or bet on a decline is taking a huge risk. The chart speaks for itself—the upcoming price targets are far above the current price.
{future}(INITUSDT)
🚀 Stop selling now—INIT is not for sale. The rally isn’t over yet! 🔥
A quick look at INIT’s 1D (daily) chart is enough to see that it’s on the verge of a historic breakout. It’s currently making a very strong move after a long accumulation period, and the buying momentum is unmistakable.
⚠️ Warning
Anyone trying to sell now or bet on a decline is taking a huge risk. The chart speaks for itself—the upcoming price targets are far above the current price.
A quick look at INIT’s 1D (daily) chart is enough to see that it’s on the verge of a historic breakout. It’s currently making a very strong move after a long accumulation period, and the buying momentum is unmistakable.
⚠️ Warning
Anyone trying to sell now or bet on a decline is taking a huge risk. The chart speaks for itself—the upcoming price targets are far above the current price.
1
3
2.8k
·
--
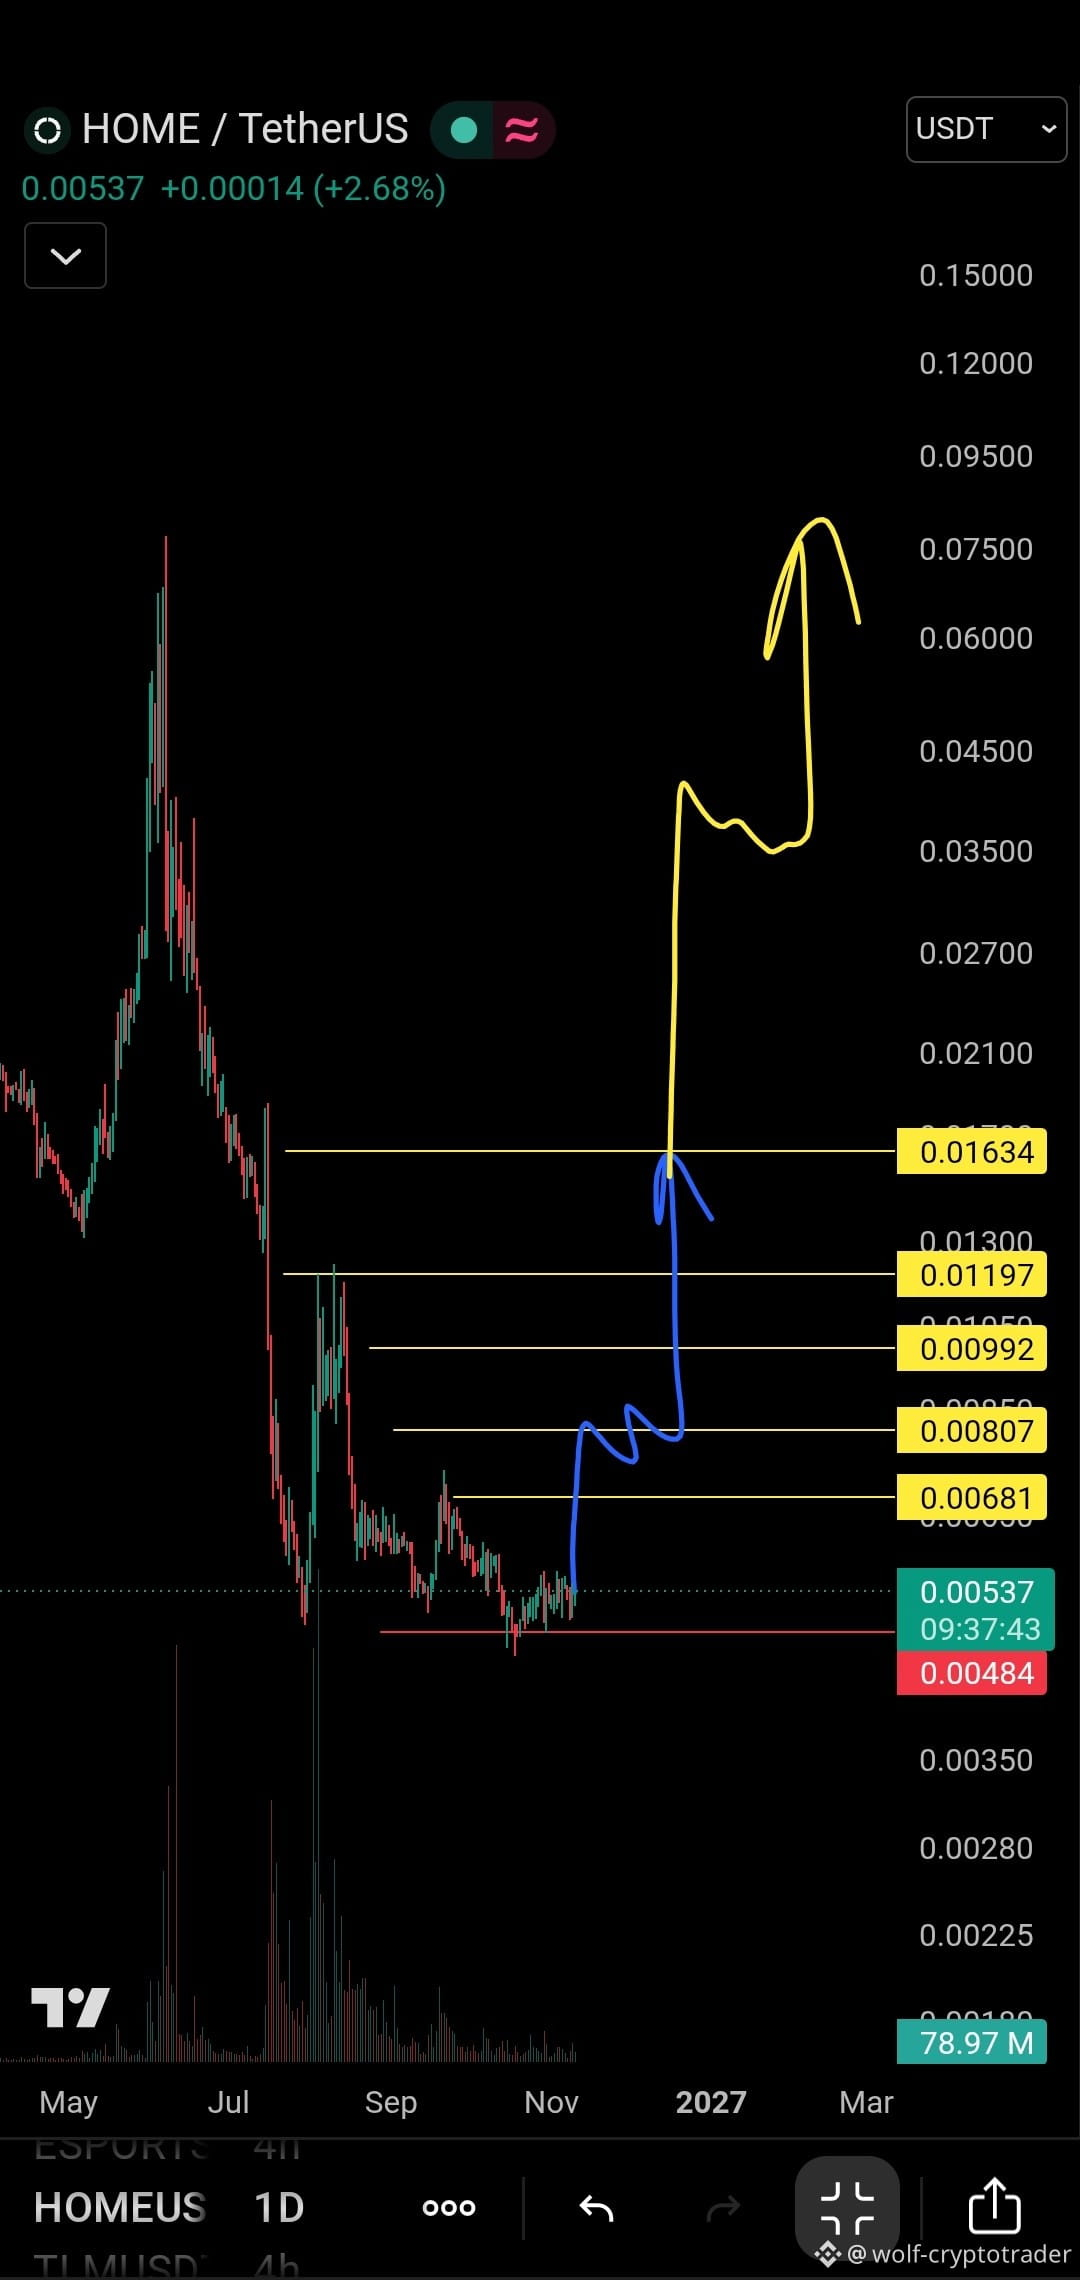
🚨 "Is the building of the new base signaling $HOME the end of the collapse and the beginning of the great recovery journey? 🚀🔥
Stop. And look at the attached chart through the eyes of a technical analyst. What we are witnessing today is not just ordinary trading, but a "structural turning point"
After a violent wave of declines that exhausted everyone, HOME coin has reached oversold territory and has finally begun building a solid floor around $0.0048
🛑 The safety valve
This legend will lose its strength only if it breaks below $0.00484$ and closes below that level on a daily basis. As long as we are above it, buyers are fully in control
{future}(HOMEUSDT)
🚨 "Is the building of the new base signaling $HOME the end of the collapse and the beginning of the great recovery journey? 🚀🔥
Stop. And look at the attached chart through the eyes of a technical analyst. What we are witnessing today is not just ordinary trading, but a "structural turning point"
After a violent wave of declines that exhausted everyone, HOME coin has reached oversold territory and has finally begun building a solid floor around $0.0048
🛑 The safety valve
This legend will lose its strength only if it breaks below $0.00484$ and closes below that level on a daily basis. As long as we are above it, buyers are fully in control
Stop. And look at the attached chart through the eyes of a technical analyst. What we are witnessing today is not just ordinary trading, but a "structural turning point"
After a violent wave of declines that exhausted everyone, HOME coin has reached oversold territory and has finally begun building a solid floor around $0.0048
🛑 The safety valve
This legend will lose its strength only if it breaks below $0.00484$ and closes below that level on a daily basis. As long as we are above it, buyers are fully in control
1
379
·
--
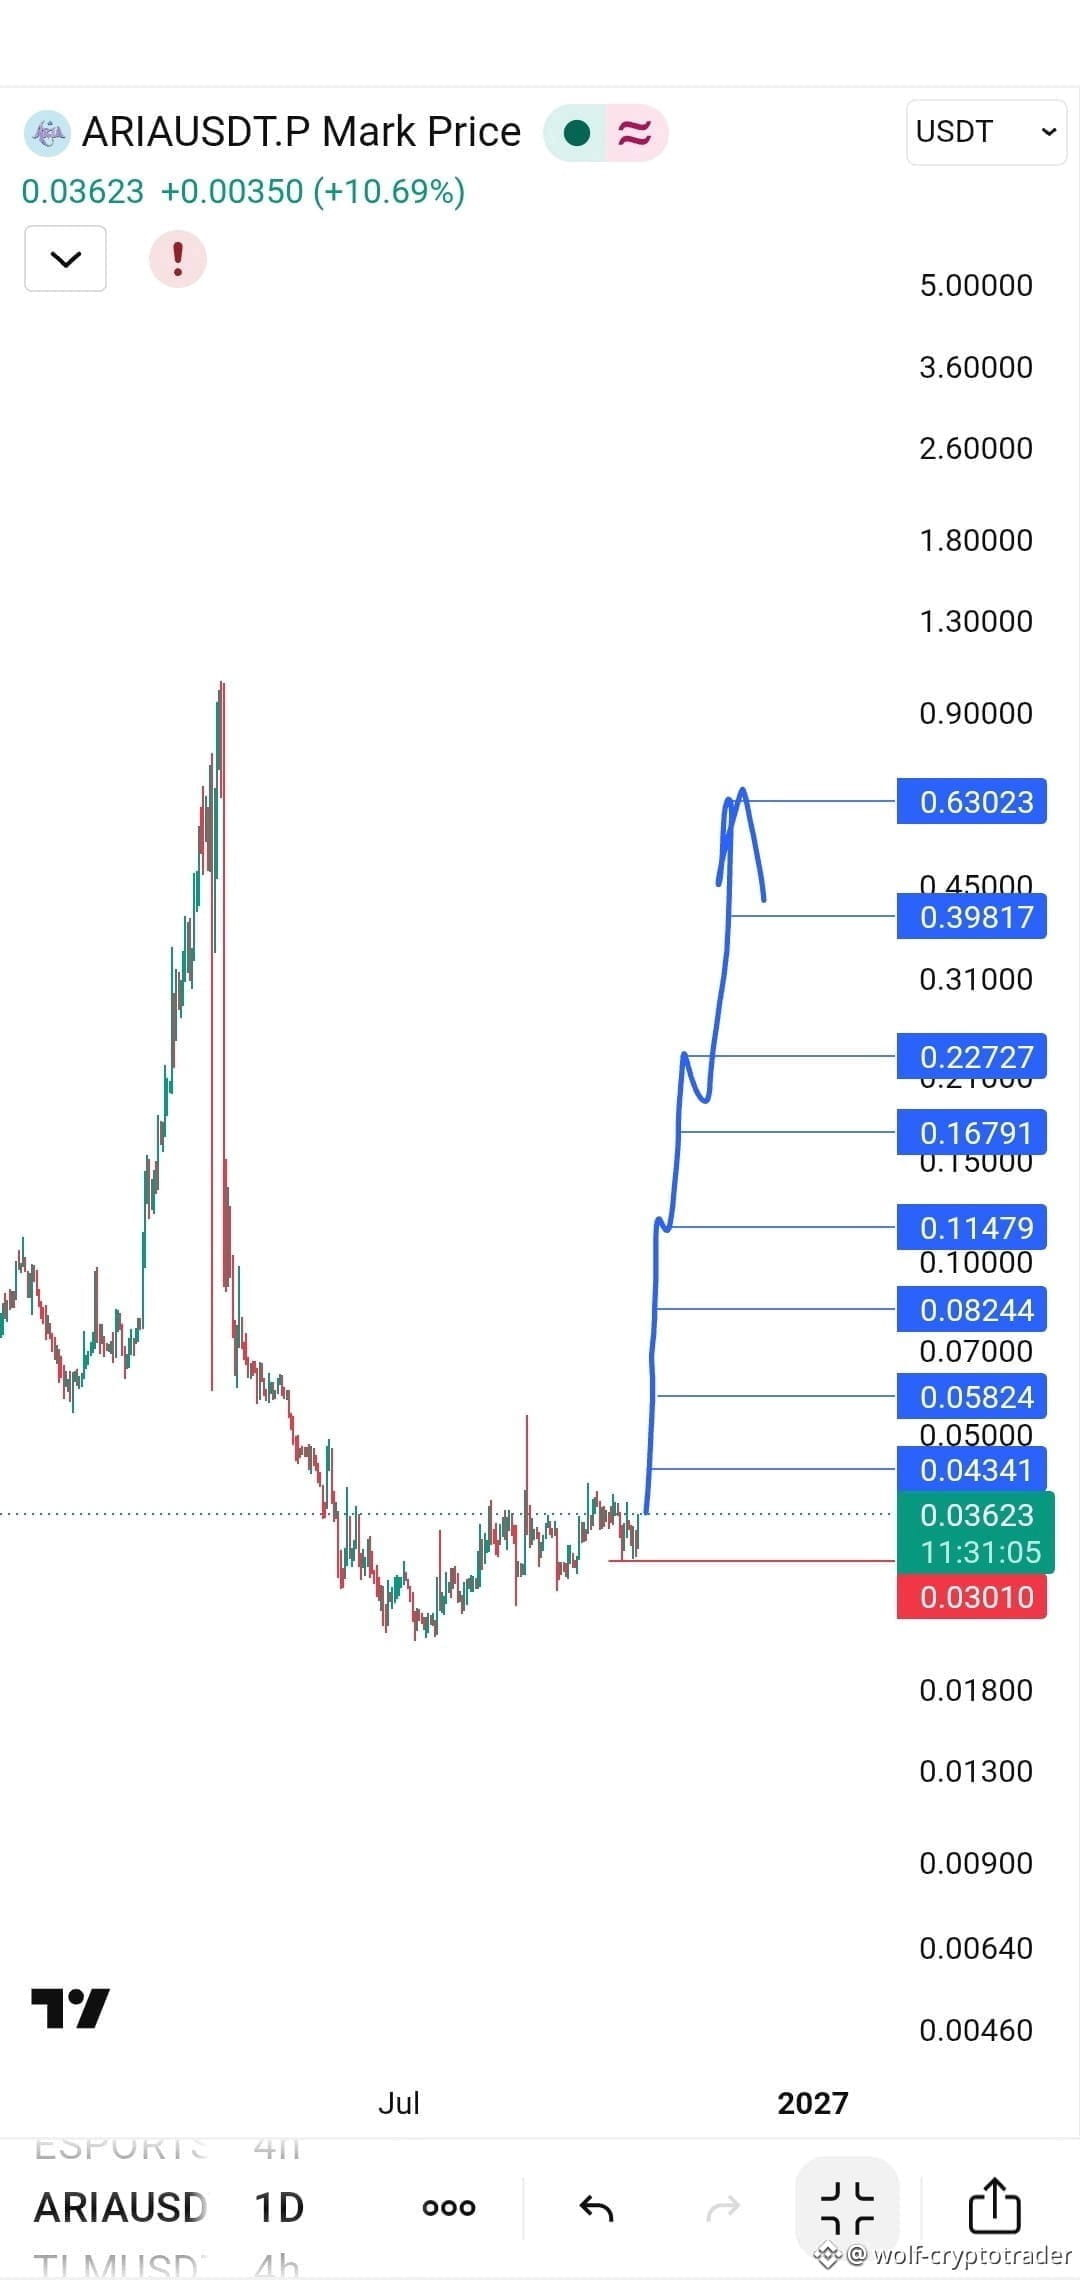
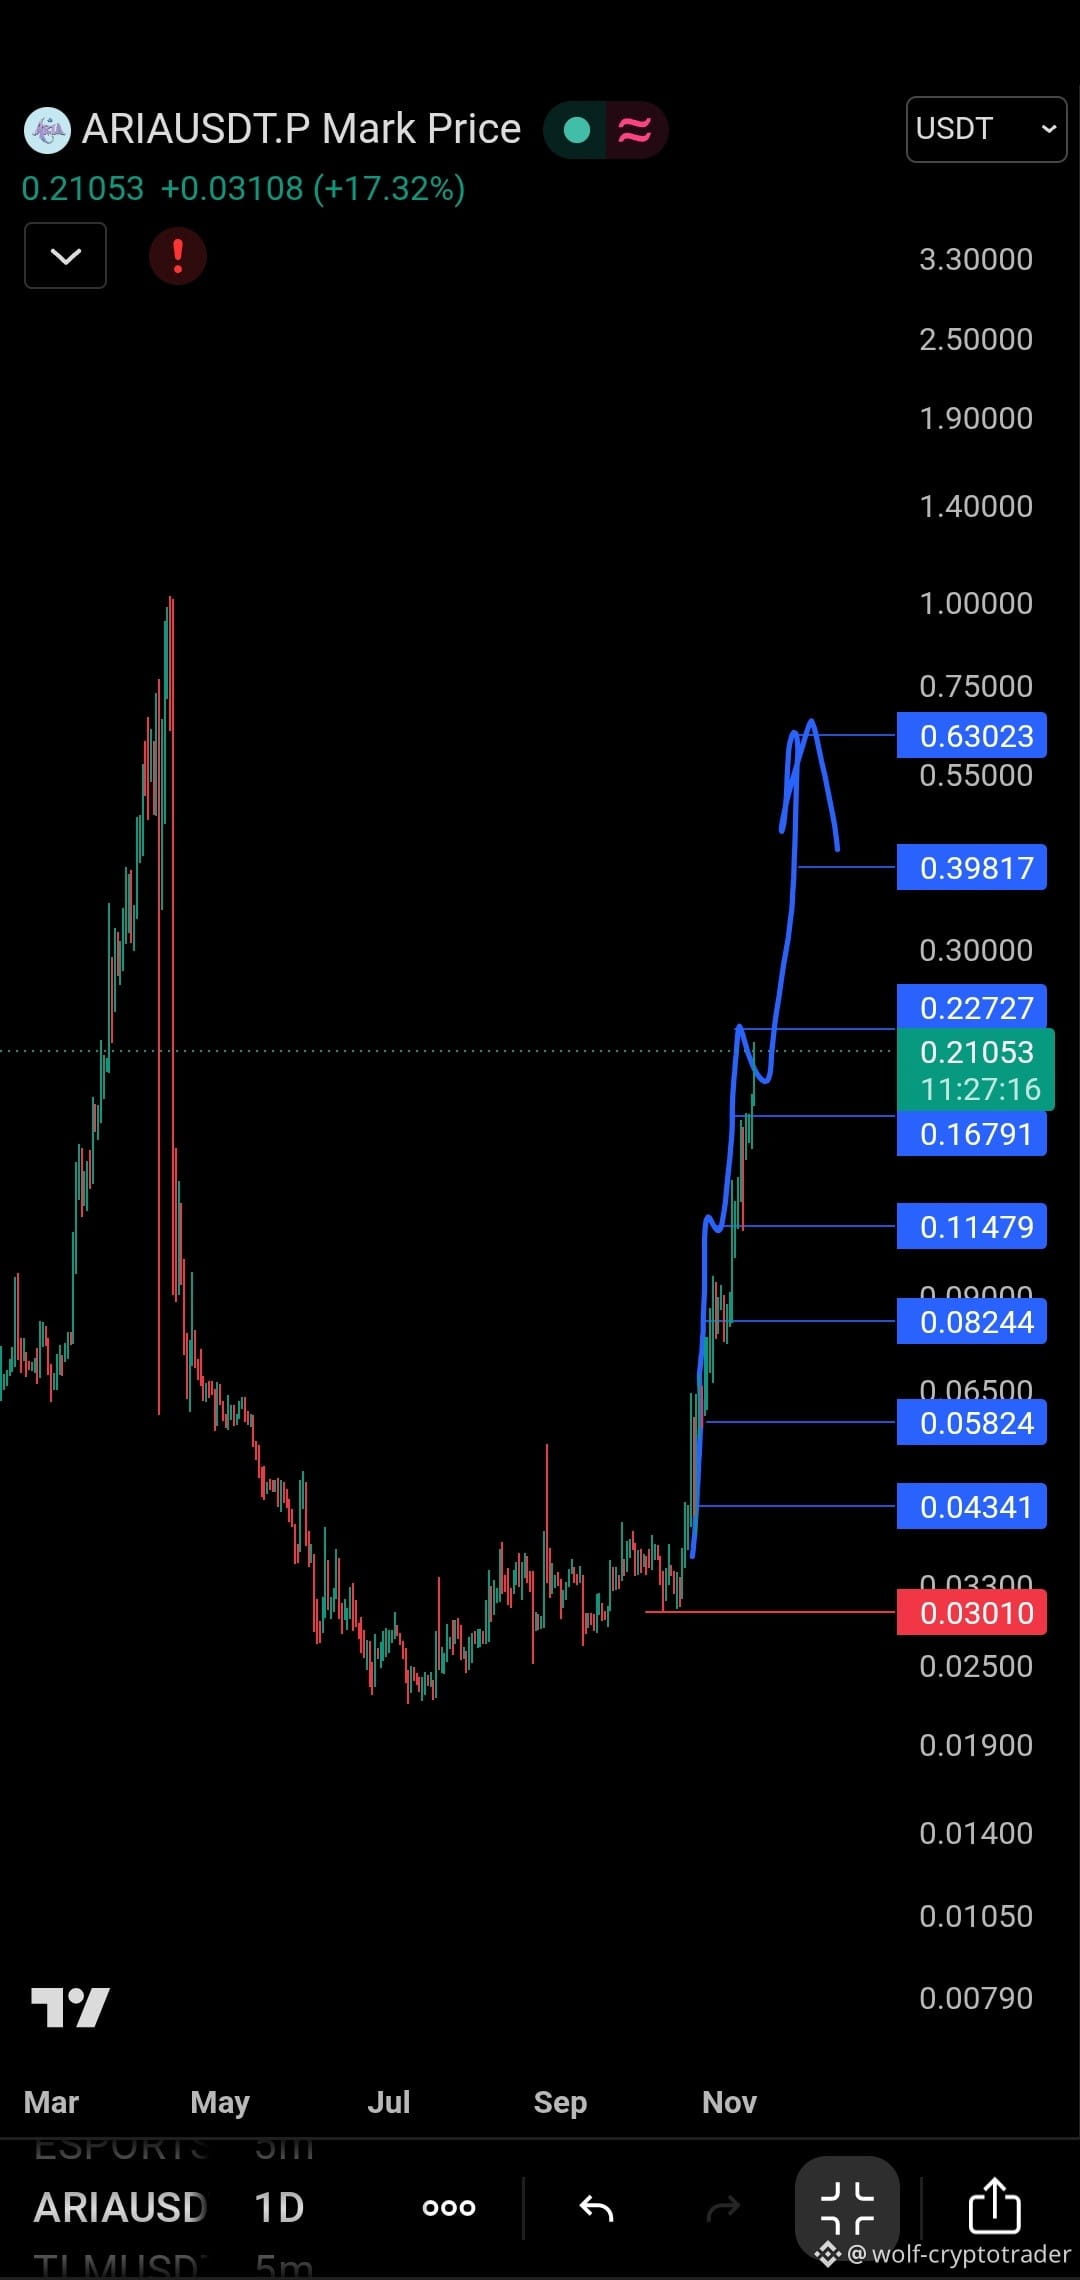
🚨 "The train refuses to stop" ARIA crushes the sixth target and prepares for a new launch 🚀🔥
Stop and look at where it was and where it is now. In our previous analysis, we laid out a clear roadmap for ARIA from the accumulation zone at 0.030. Today, the numbers speak for themselves: the sixth target has been crushed, and the price is now soaring at 0.21, gearing up for more.
{future}(ARIAUSDT)
🚨 "The train refuses to stop" ARIA crushes the sixth target and prepares for a new launch 🚀🔥
Stop and look at where it was and where it is now. In our previous analysis, we laid out a clear roadmap for ARIA from the accumulation zone at 0.030. Today, the numbers speak for themselves: the sixth target has been crushed, and the price is now soaring at 0.21, gearing up for more.
Stop and look at where it was and where it is now. In our previous analysis, we laid out a clear roadmap for ARIA from the accumulation zone at 0.030. Today, the numbers speak for themselves: the sixth target has been crushed, and the price is now soaring at 0.21, gearing up for more.
2
725
·
--
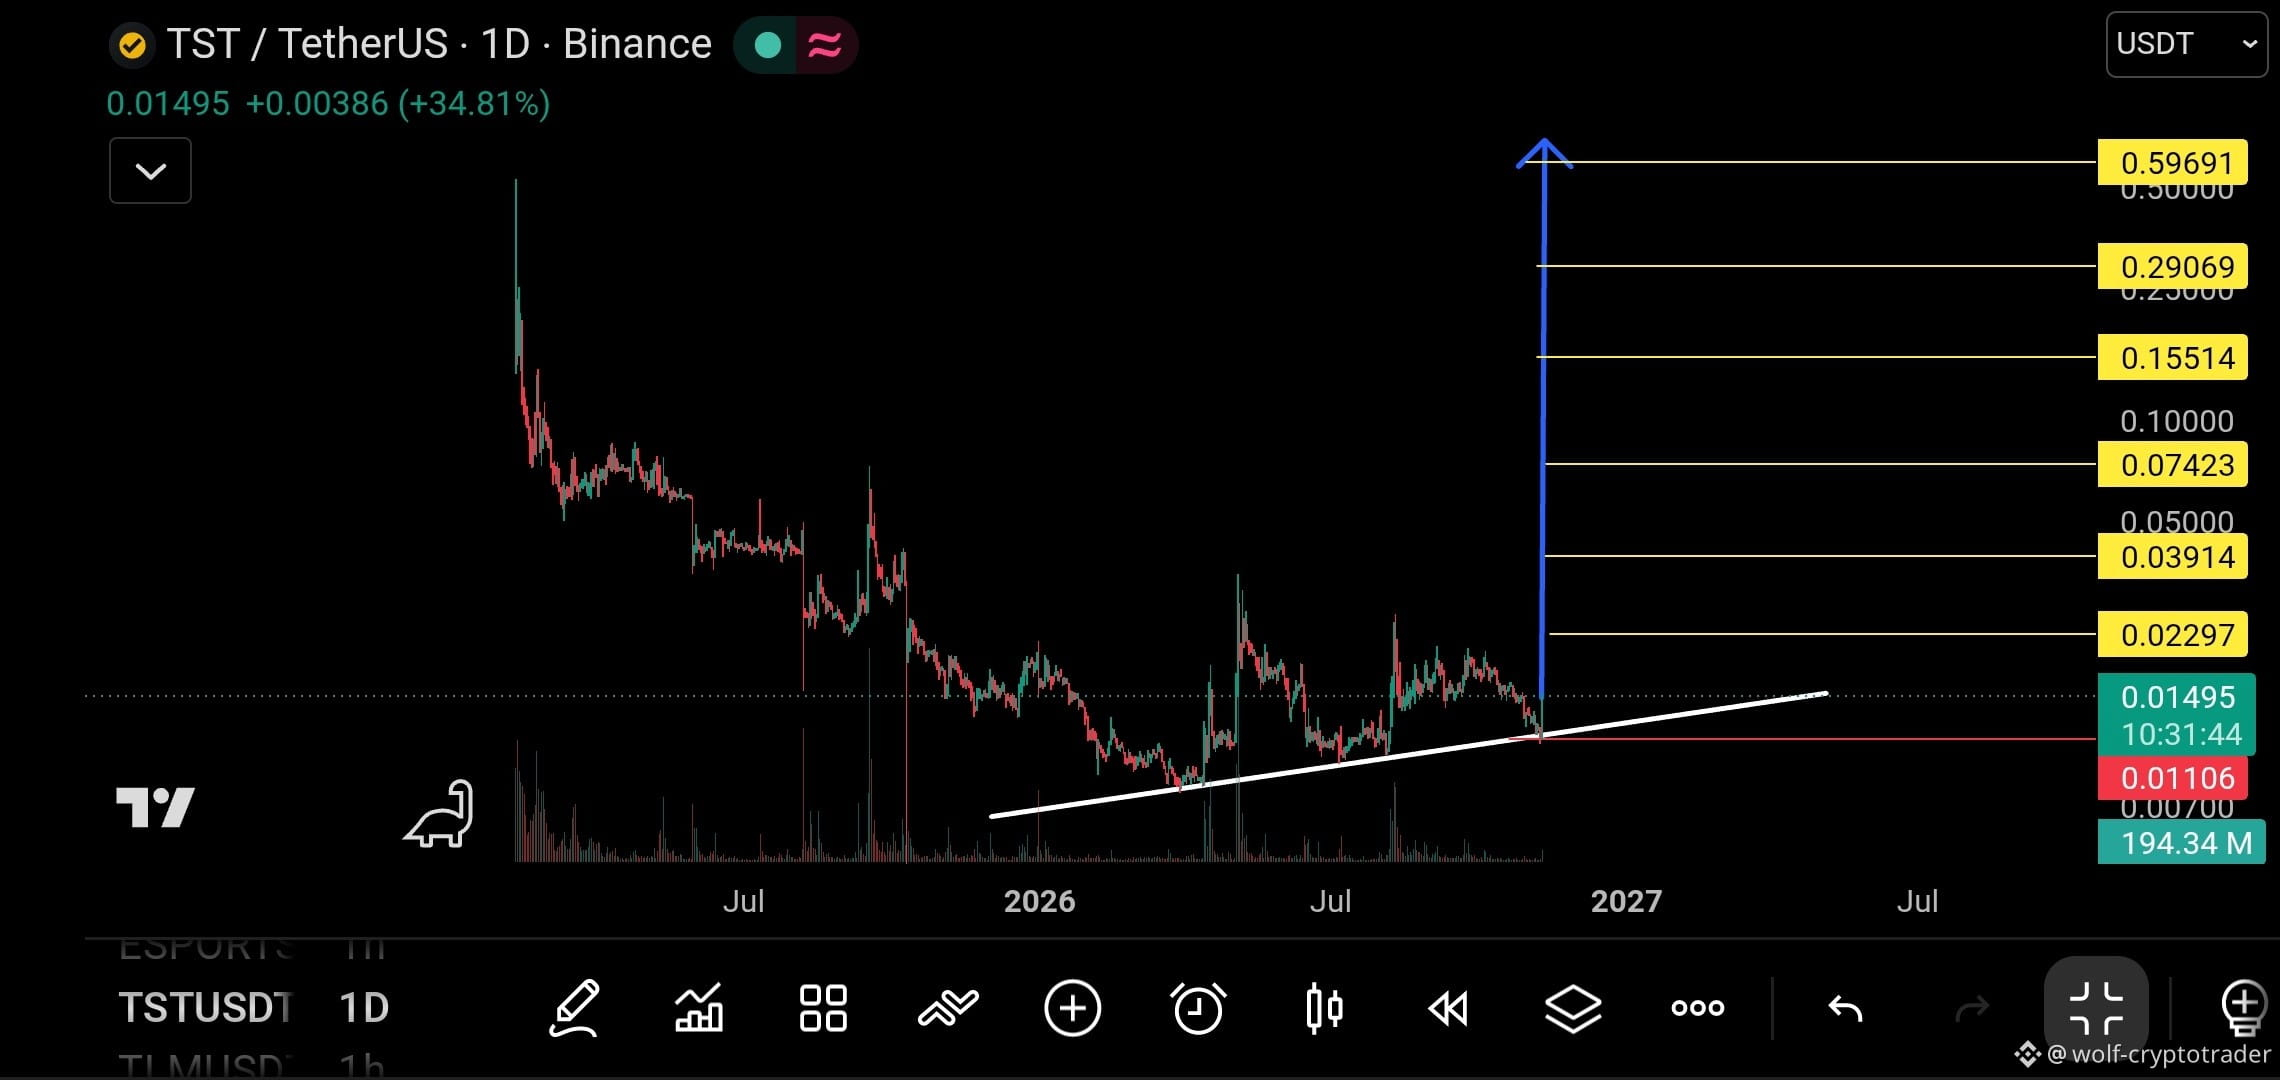
🚨 “The Great Rebound” from the Bottom: Is TST Beginning Its Journey to Reclaim the Throne? 🚀🔥
Stop and take a look at this chart. What you’re seeing isn’t just an ordinary bounce—it’s a “declaration that the bleeding has stopped” after a brutal correction wave that exhausted the bulls.
TST suddenly woke from its slumber, settling at $0.01495. More importantly, the price bounced strongly off the “lifeline” (steadfast support), which acts as the coin’s safety net, confirming that the bottom is in.
🛑 The Safety Net
This bullish setup is invalidated only if the price breaks below $0.01106 and closes below it on the daily chart. As long as the price stays above that level, buyers are firmly in control.
{future}(TSTUSDT)
🚨 “The Great Rebound” from the Bottom: Is TST Beginning Its Journey to Reclaim the Throne? 🚀🔥
Stop and take a look at this chart. What you’re seeing isn’t just an ordinary bounce—it’s a “declaration that the bleeding has stopped” after a brutal correction wave that exhausted the bulls.
TST suddenly woke from its slumber, settling at $0.01495. More importantly, the price bounced strongly off the “lifeline” (steadfast support), which acts as the coin’s safety net, confirming that the bottom is in.
🛑 The Safety Net
This bullish setup is invalidated only if the price breaks below $0.01106 and closes below it on the daily chart. As long as the price stays above that level, buyers are firmly in control.
Stop and take a look at this chart. What you’re seeing isn’t just an ordinary bounce—it’s a “declaration that the bleeding has stopped” after a brutal correction wave that exhausted the bulls.
TST suddenly woke from its slumber, settling at $0.01495. More importantly, the price bounced strongly off the “lifeline” (steadfast support), which acts as the coin’s safety net, confirming that the bottom is in.
🛑 The Safety Net
This bullish setup is invalidated only if the price breaks below $0.01106 and closes below it on the daily chart. As long as the price stays above that level, buyers are firmly in control.
1
1.5k
Log in to explore more content
Join global crypto users on Binance Square
⚡️ Get latest and useful information about crypto.
💬 Trusted by the world’s largest crypto exchange.
👍 Discover real insights from verified creators.
Email / Phone number
Trending Topics
NvidiaEarningsTonight:AIStocks’NextMove?
493 views
42 Discussing
Nvidia Earnings Day: Interim CEO's First Appearance — Can the AI Story Hold?
Binance News
·1 Likes
·1k views
A Packed Week of Earnings and Data Tests Markets
89,056 views
501 Discussing
AnthropicIPOTestsInvestorAppetiteForAI
179,334 views
1,881 Discussing