
美股OK哥搬运号
239 Posts

美股OK哥搬运号
投资丛林里的狩猎者。
0 Following
1.1K Followers
802 Liked
Posts
All
Videos
The latest curated stock list published by Seeking Alpha in September has been revealed, and the star this time is the cyclical refiner $PBF. To help everyone understand the core buy logic, I’ve systematically整理 it for this stock.
As one of the largest independent refiners in the U.S., $PBF currently operates six refineries. Of particular note is that its refining facility in California successfully resumed production in May of this year. Given that refinery capacity along the U.S. West Coast is relatively scarce, the company is well positioned to benefit from California’s local supply gap, as well as the globally tight supply of refined products.
On the financial front, the company’s second-quarter results were impressive. Its adjusted earnings per share reached as high as $6.22, which significantly exceeded prior market expectations. Meanwhile, during the quarter the company successfully reduced net debt by more than $1.4 billion. With this move, the company expects to save roughly $60 million in annual day-to-day operating costs, and its return on net assets also clearly outpaces the industry median.
Market professionals have also given high praise to the company’s outlook. Over the most recent 90-day period, analysts have collectively raised their full-year earnings forecast for the company 10 times, with no downgrades during the same period. In terms of quantified ratings across areas such as business growth, market momentum, and earnings estimate revisions, this stock has demonstrated exceptionally strong momentum. Compared with the broader energy sector, its current stock price is trading at a significant discount. In addition, the stock’s forward dividend yield is 1.51%. Backed by the company’s ample cash reserves, its dividend payments offer a very high margin of safety.
If you’d like to unlock more professional investment insights, please feel free to use the 20%-off exclusive offer link below to subscribe to Seeking Alpha’s member service:
Seeking Alpha Premium:https://link.seekingalpha.com/4CMF46B/4G6SHH/
Seeking Alpha Alpha Picks:https://link.seekingalpha.com/4CMF46B/4HKP84/
As one of the largest independent refiners in the U.S., $PBF currently operates six refineries. Of particular note is that its refining facility in California successfully resumed production in May of this year. Given that refinery capacity along the U.S. West Coast is relatively scarce, the company is well positioned to benefit from California’s local supply gap, as well as the globally tight supply of refined products.
On the financial front, the company’s second-quarter results were impressive. Its adjusted earnings per share reached as high as $6.22, which significantly exceeded prior market expectations. Meanwhile, during the quarter the company successfully reduced net debt by more than $1.4 billion. With this move, the company expects to save roughly $60 million in annual day-to-day operating costs, and its return on net assets also clearly outpaces the industry median.
Market professionals have also given high praise to the company’s outlook. Over the most recent 90-day period, analysts have collectively raised their full-year earnings forecast for the company 10 times, with no downgrades during the same period. In terms of quantified ratings across areas such as business growth, market momentum, and earnings estimate revisions, this stock has demonstrated exceptionally strong momentum. Compared with the broader energy sector, its current stock price is trading at a significant discount. In addition, the stock’s forward dividend yield is 1.51%. Backed by the company’s ample cash reserves, its dividend payments offer a very high margin of safety.
If you’d like to unlock more professional investment insights, please feel free to use the 20%-off exclusive offer link below to subscribe to Seeking Alpha’s member service:
Seeking Alpha Premium:https://link.seekingalpha.com/4CMF46B/4G6SHH/
Seeking Alpha Alpha Picks:https://link.seekingalpha.com/4CMF46B/4HKP84/
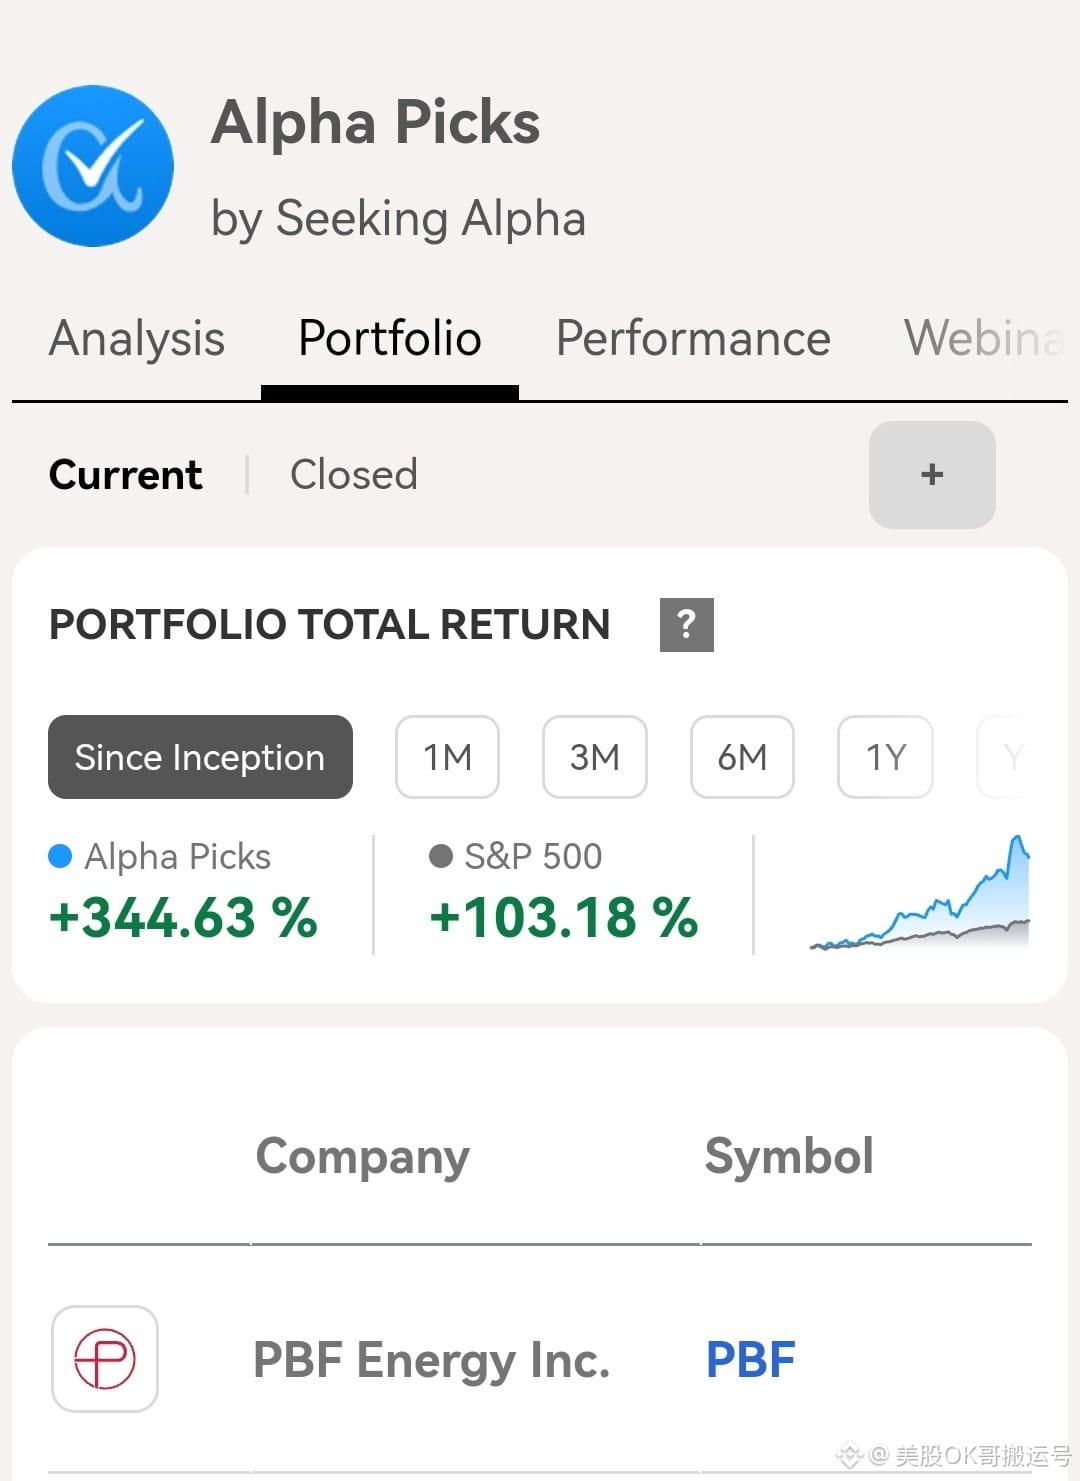
Seeking Alpha’s latest selected stocks for September have been released. This time, our key recommendation is the cyclical stock in the refining industry: $PBF. Here is a brief rundown of the core reasons why this stock is worth buying.
As one of the leading independent refiners in the United States by scale, PBF currently owns and operates six refineries. Notably, its refinery in California successfully resumed production in May of this year. With refining capacity relatively scarce on the U.S. West Coast, plus a supply gap in the California local market, and the global refined products supply overall remaining tight, these factors are all expected to directly benefit the company.
From the financials, the company delivered an outstanding performance in Q2. Its adjusted earnings per share were as high as $6.22, far exceeding market expectations. In this quarter, PBF not only significantly reduced net debt by more than $1.4 billion—an action that can also save the company approximately $60 million in operating costs each year. Meanwhile, the company’s ROE is also clearly above the industry’s median.
Analysts are very optimistic about this stock. Over the past 90 days, full-year earnings forecasts have been raised 10 times in succession, with no downgrades recorded. In terms of quant-based ratings such as earnings revisions, growth, and momentum, the stock has shown strong momentum. Compared with the broader energy sector, the stock’s current price offers substantial valuation discount potential. In addition, its forward dividend yield is 1.51%, and with ample cash reserves, the safety margin for dividend payments is very high.
If you’d like to become an SA member, feel free to use the links below to get a 20% discount exclusive offer:
Seeking Alpha Premium:https://link.seekingalpha.com/4CMF46B/4G6SHH/
Seeking Alpha Alpha Picks:https://link.seekingalpha.com/4CMF46B/4HKP84/
As one of the leading independent refiners in the United States by scale, PBF currently owns and operates six refineries. Notably, its refinery in California successfully resumed production in May of this year. With refining capacity relatively scarce on the U.S. West Coast, plus a supply gap in the California local market, and the global refined products supply overall remaining tight, these factors are all expected to directly benefit the company.
From the financials, the company delivered an outstanding performance in Q2. Its adjusted earnings per share were as high as $6.22, far exceeding market expectations. In this quarter, PBF not only significantly reduced net debt by more than $1.4 billion—an action that can also save the company approximately $60 million in operating costs each year. Meanwhile, the company’s ROE is also clearly above the industry’s median.
Analysts are very optimistic about this stock. Over the past 90 days, full-year earnings forecasts have been raised 10 times in succession, with no downgrades recorded. In terms of quant-based ratings such as earnings revisions, growth, and momentum, the stock has shown strong momentum. Compared with the broader energy sector, the stock’s current price offers substantial valuation discount potential. In addition, its forward dividend yield is 1.51%, and with ample cash reserves, the safety margin for dividend payments is very high.
If you’d like to become an SA member, feel free to use the links below to get a 20% discount exclusive offer:
Seeking Alpha Premium:https://link.seekingalpha.com/4CMF46B/4G6SHH/
Seeking Alpha Alpha Picks:https://link.seekingalpha.com/4CMF46B/4HKP84/
Partly True
The current 10-year U.S. Treasury yield has already touched the 4.8% mark. This development reminds me of a forecast made by Larry Fink, the head of BlackRock, earlier this year in January. He noted at the time that if the 10-year U.S. Treasury yield were to break above 5%, it would trigger an extremely bad scenario—not only directly hitting the entire stock market, but also forcing the market to undergo a comprehensive repricing of all types of equity assets.
As the market began pricing in expectations for Tesla’s “Cybercab” event on September 3 ahead of time, the company’s stock showed signs of上涨 last night. Regarding this highly anticipated event, I personally outlined two core lines of logic that are well worth paying attention to.
The first focus is its highly imaginative business vision—specifically, when ordinary consumers will be able to buy this vehicle at a cost below 30,000 u, and have it operate fully autonomously to take on orders and generate profits on the road. Referencing the current real-world operating status of Austin’s robotaxi, I ran an initial estimate. Assuming Tesla extracts only a 30% commission, if the vehicle is deployed full-time, it could recoup the cost in about one year. If instead it’s used for daily personal commuting plus occasional “spare time” order-taking, the payback period would be between two and three years. Once this profitability model for the Cybercab is validated as feasible, Tesla’s operating model could quickly shift from official company-owned direct operations to broad public franchising. Based on current annual production capacity of 125,000 vehicles, if Tesla invests and operates it entirely in-house, this revenue would account for only about 4% of total sales—an impact that is negligible. However, if purchase access is opened to the public and capacity jumps to 1 million vehicles per year, it would be truly disruptive—becoming a massive engine for boosting the company’s market value. At that point, the detailed data and timetable that Mr. Musk has disclosed are likely to put significant competitive pressure on Uber.
The second focus is whether the Optimus robot will unexpectedly make a stage appearance at the event. Given that the two products previously had a compelling synergy at the last event, this possibility is entirely real. It’s clear that Mr. Musk is currently brewing a major move. Although the V3 version has already officially entered production, the company has not released any video or imagery so far. Combined with the days-ago praise from Jason for the product, external expectations have reached a peak. Everyone is eagerly hoping this event will deliver extraordinary surprises.
The first focus is its highly imaginative business vision—specifically, when ordinary consumers will be able to buy this vehicle at a cost below 30,000 u, and have it operate fully autonomously to take on orders and generate profits on the road. Referencing the current real-world operating status of Austin’s robotaxi, I ran an initial estimate. Assuming Tesla extracts only a 30% commission, if the vehicle is deployed full-time, it could recoup the cost in about one year. If instead it’s used for daily personal commuting plus occasional “spare time” order-taking, the payback period would be between two and three years. Once this profitability model for the Cybercab is validated as feasible, Tesla’s operating model could quickly shift from official company-owned direct operations to broad public franchising. Based on current annual production capacity of 125,000 vehicles, if Tesla invests and operates it entirely in-house, this revenue would account for only about 4% of total sales—an impact that is negligible. However, if purchase access is opened to the public and capacity jumps to 1 million vehicles per year, it would be truly disruptive—becoming a massive engine for boosting the company’s market value. At that point, the detailed data and timetable that Mr. Musk has disclosed are likely to put significant competitive pressure on Uber.
The second focus is whether the Optimus robot will unexpectedly make a stage appearance at the event. Given that the two products previously had a compelling synergy at the last event, this possibility is entirely real. It’s clear that Mr. Musk is currently brewing a major move. Although the V3 version has already officially entered production, the company has not released any video or imagery so far. Combined with the days-ago praise from Jason for the product, external expectations have reached a peak. Everyone is eagerly hoping this event will deliver extraordinary surprises.
Let’s take a moment to review ten U.S. large-cap, broad-market, index ETFs that outperformed $VOO this year. These funds give investors diverse perspectives on market coverage and investment strategies.
In tenth place is the S&P total U.S. stock market ETF, $ITOT, which delivered a gain of 13.0% this year. As a low-cost “U.S. stock basket” product, it broadly covers large-, mid-, and small-cap stocks, holding about 2,440 stocks in total. Right behind it in ninth place is the U.S. total market ETF, $SCHB, up 13.2%. The logic behind this fund is very simple and straightforward: it buys the entire U.S. market, including stocks from large-, mid-, and small-cap companies as well, with a holdings count of roughly 2,380.
Eighth place goes to the total market index ETF $VTI, which rose 13.5%. It’s widely considered the investment vehicle closest to directly buying the entire U.S. stock market. With a massive portfolio of more than 3,500 stocks, its coverage far exceeds that of $VOO. Seventh place is the U.S. total stock market ETF $DFAC, recording a 15.3% return. The fund’s key feature is that it uses factor-enhanced processing on a core U.S. asset allocation.
Sixth place belongs to the high-dividend index ETF $VYM, up 15.8%. This fund includes 600+ U.S. stocks with high-dividend characteristics, and its weighting is relatively diversified. Fifth place is the relatively standout equal-weighted index ETF $RSP, which gained 16.8% this year. As a noteworthy “anti-giant” concept ETF, it adopts an equal-weight strategy like the S&P 500, giving the 500 companies included a basically equal treatment—fairly splitting the difference across the board.
Fourth and third both focus on value investing. Fourth is the U.S. large-cap value ETF $SCHV, posting a 19.0% gain. Its holdings tilt more toward traditional value sectors such as financials, energy, and industrials. Third is the value stock index ETF $VTV, delivering a 19.9% result this year. As a representative large-cap value fund, it also assigns relatively higher weight proportions to traditional sectors including financials, industrials, and energy.
Even more impressive is second place: the Russell 1000 value index ETF $IWD, which raked in a 23.7% return. It offers investors a basket of U.S. large-cap value stocks, and compared with $VTV, its investment distribution is more diversified. Finally, the best-performing—and #1—for sheer strength and consistency this year is the U.S. dividend stock ETF $SCHD, delivering a remarkable 30.5% surge. This fund carefully selects about 100 very high-quality high-dividend companies, making it the undisputed leader of the year.
In tenth place is the S&P total U.S. stock market ETF, $ITOT, which delivered a gain of 13.0% this year. As a low-cost “U.S. stock basket” product, it broadly covers large-, mid-, and small-cap stocks, holding about 2,440 stocks in total. Right behind it in ninth place is the U.S. total market ETF, $SCHB, up 13.2%. The logic behind this fund is very simple and straightforward: it buys the entire U.S. market, including stocks from large-, mid-, and small-cap companies as well, with a holdings count of roughly 2,380.
Eighth place goes to the total market index ETF $VTI, which rose 13.5%. It’s widely considered the investment vehicle closest to directly buying the entire U.S. stock market. With a massive portfolio of more than 3,500 stocks, its coverage far exceeds that of $VOO. Seventh place is the U.S. total stock market ETF $DFAC, recording a 15.3% return. The fund’s key feature is that it uses factor-enhanced processing on a core U.S. asset allocation.
Sixth place belongs to the high-dividend index ETF $VYM, up 15.8%. This fund includes 600+ U.S. stocks with high-dividend characteristics, and its weighting is relatively diversified. Fifth place is the relatively standout equal-weighted index ETF $RSP, which gained 16.8% this year. As a noteworthy “anti-giant” concept ETF, it adopts an equal-weight strategy like the S&P 500, giving the 500 companies included a basically equal treatment—fairly splitting the difference across the board.
Fourth and third both focus on value investing. Fourth is the U.S. large-cap value ETF $SCHV, posting a 19.0% gain. Its holdings tilt more toward traditional value sectors such as financials, energy, and industrials. Third is the value stock index ETF $VTV, delivering a 19.9% result this year. As a representative large-cap value fund, it also assigns relatively higher weight proportions to traditional sectors including financials, industrials, and energy.
Even more impressive is second place: the Russell 1000 value index ETF $IWD, which raked in a 23.7% return. It offers investors a basket of U.S. large-cap value stocks, and compared with $VTV, its investment distribution is more diversified. Finally, the best-performing—and #1—for sheer strength and consistency this year is the U.S. dividend stock ETF $SCHD, delivering a remarkable 30.5% surge. This fund carefully selects about 100 very high-quality high-dividend companies, making it the undisputed leader of the year.
This year, which large-cap broad-based ETF has managed to outperform the S&P 500 index ETF $VOO in terms of returns? Let’s walk you through these ten standout products. To help you get a more intuitive understanding, we will introduce them one by one starting with the top performer with the highest gains.
In this list, the strongest performer and the overall leader is the U.S. dividend equity ETF $SCHD. It delivered an astonishing 30.5% return this year. By selecting roughly 100 high-quality, high-dividend companies, it successfully captured the most momentum this year.
Next up are two fund products centered on large-cap value stocks. Ranked second is the Russell 1000 Value Index ETF $IWD, which rose 23.7% overall this year. The fund holds a basket of U.S. large-cap value stocks, and in terms of portfolio composition it appears more diversified than $VTV. Coming in third is $VTV, a typical representative of large-cap value stocks—the value index ETF. It achieved a 19.9% gain. Its portfolio allocations are relatively heavier in traditional sectors such as financials, industrials, and energy.
Fourth place goes to the U.S. large-cap value ETF $SCHV, which increased 19.0% this year. Its portfolio characteristics are also quite distinct, clearly tilted toward traditional value sectors like financials, energy, and industrials.
In fifth place is a highly watched anti-giant product: the equally weighted index ETF $RSP, which returned 16.8%. The fund strictly follows an equal-weight strategy, such as that used by the S&P 500. It essentially gives companies in the 500 constituents a fair share, making this balanced allocation approach well worth attention.
Sixth place is the high-dividend index ETF $VYM. This year, its yield rose 15.8%. Its portfolio broadly covers more than 600 U.S. stocks with high-dividend characteristics, and it maintains a relatively diversified style in weight allocation.
Seventh place is the U.S. total-market stock ETF $DFAC, which made the list with a 15.3% gain. This ETF mainly holds U.S. core assets featuring factor-enhancing characteristics.
Next are three broad-based ETFs dedicated to covering the U.S. overall market in a comprehensive way. Eighth place is the total market index ETF $VTI, which rose 13.5% this year. This fund holds more than 3,500 stocks—far beyond the coverage of $VOO—and is widely regarded in the industry as the investment tool closest to buying the entire U.S. stock market.
Ninth place is the U.S. total market ETF $SCHB, delivering a 13.2% return. It offers a simple and effective way to buy the U.S. market broadly, covering large-, mid-, and small-cap stocks. The total number of holdings is about 2,380.
Finally, in tenth place is the S&P U.S. Broad Market ETF $ITOT, up 13.0%. As a low-cost “all-in-one” U.S. market product, it also provides broad coverage across large-, mid-, and small-cap stocks, with roughly 2,440 holdings.
That’s the roundup of the ten large-cap broad-based ETFs that outperformed $VOO this year. Hopefully, this will serve as a useful reference for helping you better understand the market and plan your future investments.
In this list, the strongest performer and the overall leader is the U.S. dividend equity ETF $SCHD. It delivered an astonishing 30.5% return this year. By selecting roughly 100 high-quality, high-dividend companies, it successfully captured the most momentum this year.
Next up are two fund products centered on large-cap value stocks. Ranked second is the Russell 1000 Value Index ETF $IWD, which rose 23.7% overall this year. The fund holds a basket of U.S. large-cap value stocks, and in terms of portfolio composition it appears more diversified than $VTV. Coming in third is $VTV, a typical representative of large-cap value stocks—the value index ETF. It achieved a 19.9% gain. Its portfolio allocations are relatively heavier in traditional sectors such as financials, industrials, and energy.
Fourth place goes to the U.S. large-cap value ETF $SCHV, which increased 19.0% this year. Its portfolio characteristics are also quite distinct, clearly tilted toward traditional value sectors like financials, energy, and industrials.
In fifth place is a highly watched anti-giant product: the equally weighted index ETF $RSP, which returned 16.8%. The fund strictly follows an equal-weight strategy, such as that used by the S&P 500. It essentially gives companies in the 500 constituents a fair share, making this balanced allocation approach well worth attention.
Sixth place is the high-dividend index ETF $VYM. This year, its yield rose 15.8%. Its portfolio broadly covers more than 600 U.S. stocks with high-dividend characteristics, and it maintains a relatively diversified style in weight allocation.
Seventh place is the U.S. total-market stock ETF $DFAC, which made the list with a 15.3% gain. This ETF mainly holds U.S. core assets featuring factor-enhancing characteristics.
Next are three broad-based ETFs dedicated to covering the U.S. overall market in a comprehensive way. Eighth place is the total market index ETF $VTI, which rose 13.5% this year. This fund holds more than 3,500 stocks—far beyond the coverage of $VOO—and is widely regarded in the industry as the investment tool closest to buying the entire U.S. stock market.
Ninth place is the U.S. total market ETF $SCHB, delivering a 13.2% return. It offers a simple and effective way to buy the U.S. market broadly, covering large-, mid-, and small-cap stocks. The total number of holdings is about 2,380.
Finally, in tenth place is the S&P U.S. Broad Market ETF $ITOT, up 13.0%. As a low-cost “all-in-one” U.S. market product, it also provides broad coverage across large-, mid-, and small-cap stocks, with roughly 2,440 holdings.
That’s the roundup of the ten large-cap broad-based ETFs that outperformed $VOO this year. Hopefully, this will serve as a useful reference for helping you better understand the market and plan your future investments.
Recently, the new stock subscription market in Hong Kong stocks has indeed appeared especially quiet, with the overall atmosphere very lackluster. Under such circumstances, even Shein, a star company that the market used to strongly favor, is now facing the situation of falling below its offering price as well.
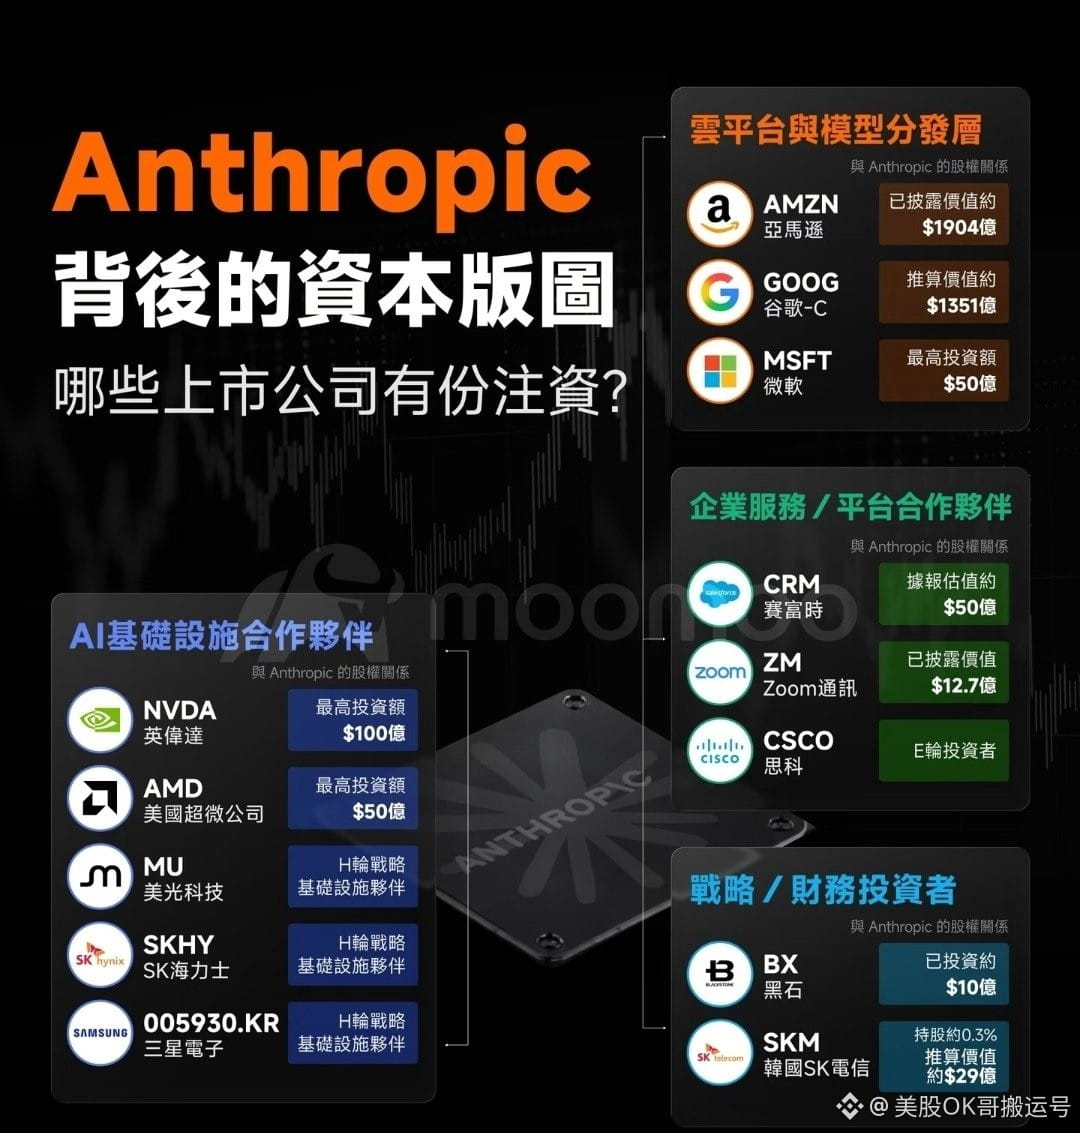
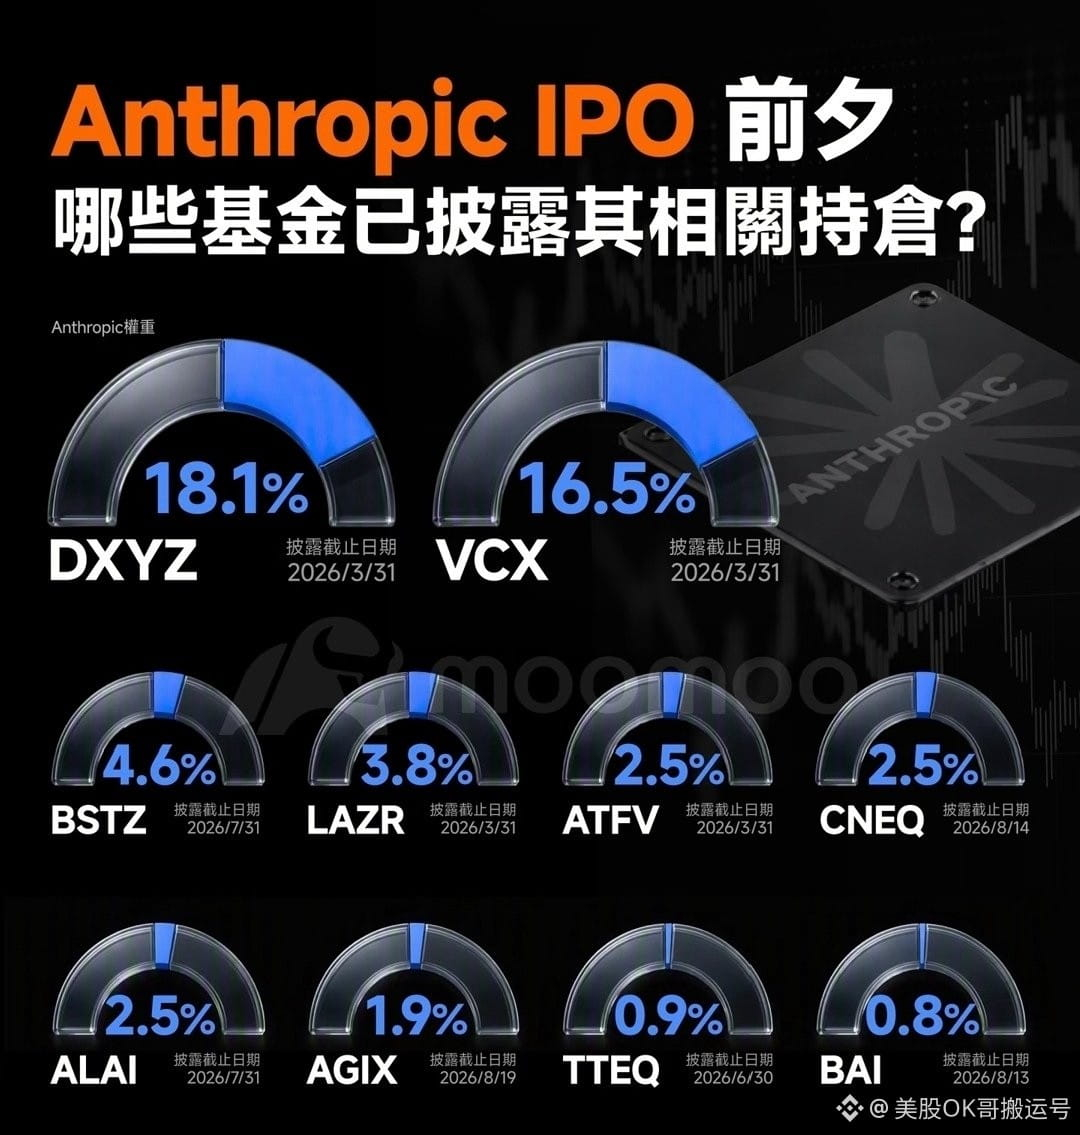
September’s most closely watched core focus in the U.S. stock market is undoubtedly the listing of Anthropic. According to currently circulating reports, the company’s prospectus is expected to be officially made public after September 7.
It is somewhat regrettable, however, that there are no large language model companies in the U.S. stock market that directly serve as close comparables. If similar companies existed, the market could fully follow the classic logic of how RKLB once closely tracked SPCX’s momentum and rose accordingly. Looking at the Hong Kong stock market instead, although it has related targets such as minimax and Zhipu, whether they will seize this opportunity to trigger a linked trading trend remains unknown to this day.
Given the situation above, if investors want to position themselves around the related concepts of Anthropic, for now they can only take a step down and patiently look for opportunities in companies that hold its equity and in related funds.
From a trading perspective, there are three key market catalyst phases in the future that are worth closely monitoring. The first is when the prospectus is officially disclosed to the public; the second occurs during the stage when the company holds roadshows and provides a specific price range; the third is the three days before the final issue price is confirmed.
During this period, everyone might as well wait and see whether Anthropic will release some unexpected surprises and favorable developments. At the same time, it’s important to remain rational, because once the company completes its listing, the short-term speculative value of those shadow stocks will basically come to an end.
After reviewing the situation, it can be seen that currently there are three companies that hold shares of Anthropic and whose stake represents a relatively high proportion of their own total market capitalization. They are $CRM, $SKM, and $ZM, respectively.
It is somewhat regrettable, however, that there are no large language model companies in the U.S. stock market that directly serve as close comparables. If similar companies existed, the market could fully follow the classic logic of how RKLB once closely tracked SPCX’s momentum and rose accordingly. Looking at the Hong Kong stock market instead, although it has related targets such as minimax and Zhipu, whether they will seize this opportunity to trigger a linked trading trend remains unknown to this day.
Given the situation above, if investors want to position themselves around the related concepts of Anthropic, for now they can only take a step down and patiently look for opportunities in companies that hold its equity and in related funds.
From a trading perspective, there are three key market catalyst phases in the future that are worth closely monitoring. The first is when the prospectus is officially disclosed to the public; the second occurs during the stage when the company holds roadshows and provides a specific price range; the third is the three days before the final issue price is confirmed.
During this period, everyone might as well wait and see whether Anthropic will release some unexpected surprises and favorable developments. At the same time, it’s important to remain rational, because once the company completes its listing, the short-term speculative value of those shadow stocks will basically come to an end.
After reviewing the situation, it can be seen that currently there are three companies that hold shares of Anthropic and whose stake represents a relatively high proportion of their own total market capitalization. They are $CRM, $SKM, and $ZM, respectively.
It wasn’t until today that I learned that Leopold, the much-discussed U.S. stock market focal figure, actually hadn’t fully liquidated everything in his earlier sell-off actions. He still retained two investment holdings in his hands: $SHAZ and $CORZ.
Partly True
I watched the entire speech tonight by Fed Chair Warsh from start to finish. Although after he finished speaking, fedwatch data showed the probability of a September rate hike rising by 10%, and the U.S. dollar index also surged sharply, my personal guess is that he must have been quite satisfied with how things turned out tonight.
Looking back at his previous remarks in July, his last speech caused a substantial negative shock to the market. At the time, it felt as if he was deliberately avoiding the topic of rate hikes, which resulted in the 30-year U.S. Treasury yield surging before his remarks were even over. The impact was so significant that it ultimately even required Bessent to step in and use buybacks to put out the fire. As is well known, the Federal Reserve’s independence directly determines the performance of longer-dated Treasury yields, and those longer-dated yields in turn further influence the overall condition of U.S. fiscal affairs.
Completely different from last time, Warsh this time cleverly reversed the market’s direction. Even though he himself didn’t spell it out directly, he successfully guided everyone to interpret his remarks as an indication of a potential rate hike. This strategy, in fact, managed to keep the 30-year Treasury notes in check. Meanwhile, only the 2-year sector saw a modest increase—which is also why, within the same time frame, we observed a bearish (red) candle for risk assets such as the gold-silver ratio and Bitcoin.
In summary, he managed to stabilize the broader market situation this time, which is undoubtedly good news for the U.S. stock market. As for whether the Fed will actually take action to raise rates in the future, we will ultimately need to closely monitor the nonfarm payrolls and inflation data to be released in September to make that judgment.
Looking back at his previous remarks in July, his last speech caused a substantial negative shock to the market. At the time, it felt as if he was deliberately avoiding the topic of rate hikes, which resulted in the 30-year U.S. Treasury yield surging before his remarks were even over. The impact was so significant that it ultimately even required Bessent to step in and use buybacks to put out the fire. As is well known, the Federal Reserve’s independence directly determines the performance of longer-dated Treasury yields, and those longer-dated yields in turn further influence the overall condition of U.S. fiscal affairs.
Completely different from last time, Warsh this time cleverly reversed the market’s direction. Even though he himself didn’t spell it out directly, he successfully guided everyone to interpret his remarks as an indication of a potential rate hike. This strategy, in fact, managed to keep the 30-year Treasury notes in check. Meanwhile, only the 2-year sector saw a modest increase—which is also why, within the same time frame, we observed a bearish (red) candle for risk assets such as the gold-silver ratio and Bitcoin.
In summary, he managed to stabilize the broader market situation this time, which is undoubtedly good news for the U.S. stock market. As for whether the Fed will actually take action to raise rates in the future, we will ultimately need to closely monitor the nonfarm payrolls and inflation data to be released in September to make that judgment.
Recently, I compiled a data summary about long-term investing through regular contributions for everyone. Let’s imagine we rewind the clock to 1999: starting then, we set aside a fixed amount of 100,000 yuan every year to invest in stock market index funds across major countries worldwide. In this scenario, after 27 years of continuous accumulation, the total principal we put in would reach 2.7 million yuan. So, as of this year, how much wealth would these investment portfolios have accumulated?
The statistical results are quite striking. If we keep this money invested in regular contributions to the Nasdaq index, its total value this year would already be 20.3 million yuan. If instead we choose the S&P 500, the value of this long-term capital would now be 9.98 million yuan.
Next, let’s shift our focus to the Asian market. If we’ve been consistently buying the Nikkei 225, this 27-year坚持 would eventually turn into 5.63 million yuan. If we choose to invest in the Korean KOSPI index, by this year the total assets would be 5.43 million yuan. Finally, suppose we’ve been investing in the Shanghai Composite Index; then this 2.7 million yuan principal would have a total value of 3.86 million yuan this year.
The statistical results are quite striking. If we keep this money invested in regular contributions to the Nasdaq index, its total value this year would already be 20.3 million yuan. If instead we choose the S&P 500, the value of this long-term capital would now be 9.98 million yuan.
Next, let’s shift our focus to the Asian market. If we’ve been consistently buying the Nikkei 225, this 27-year坚持 would eventually turn into 5.63 million yuan. If we choose to invest in the Korean KOSPI index, by this year the total assets would be 5.43 million yuan. Finally, suppose we’ve been investing in the Shanghai Composite Index; then this 2.7 million yuan principal would have a total value of 3.86 million yuan this year.
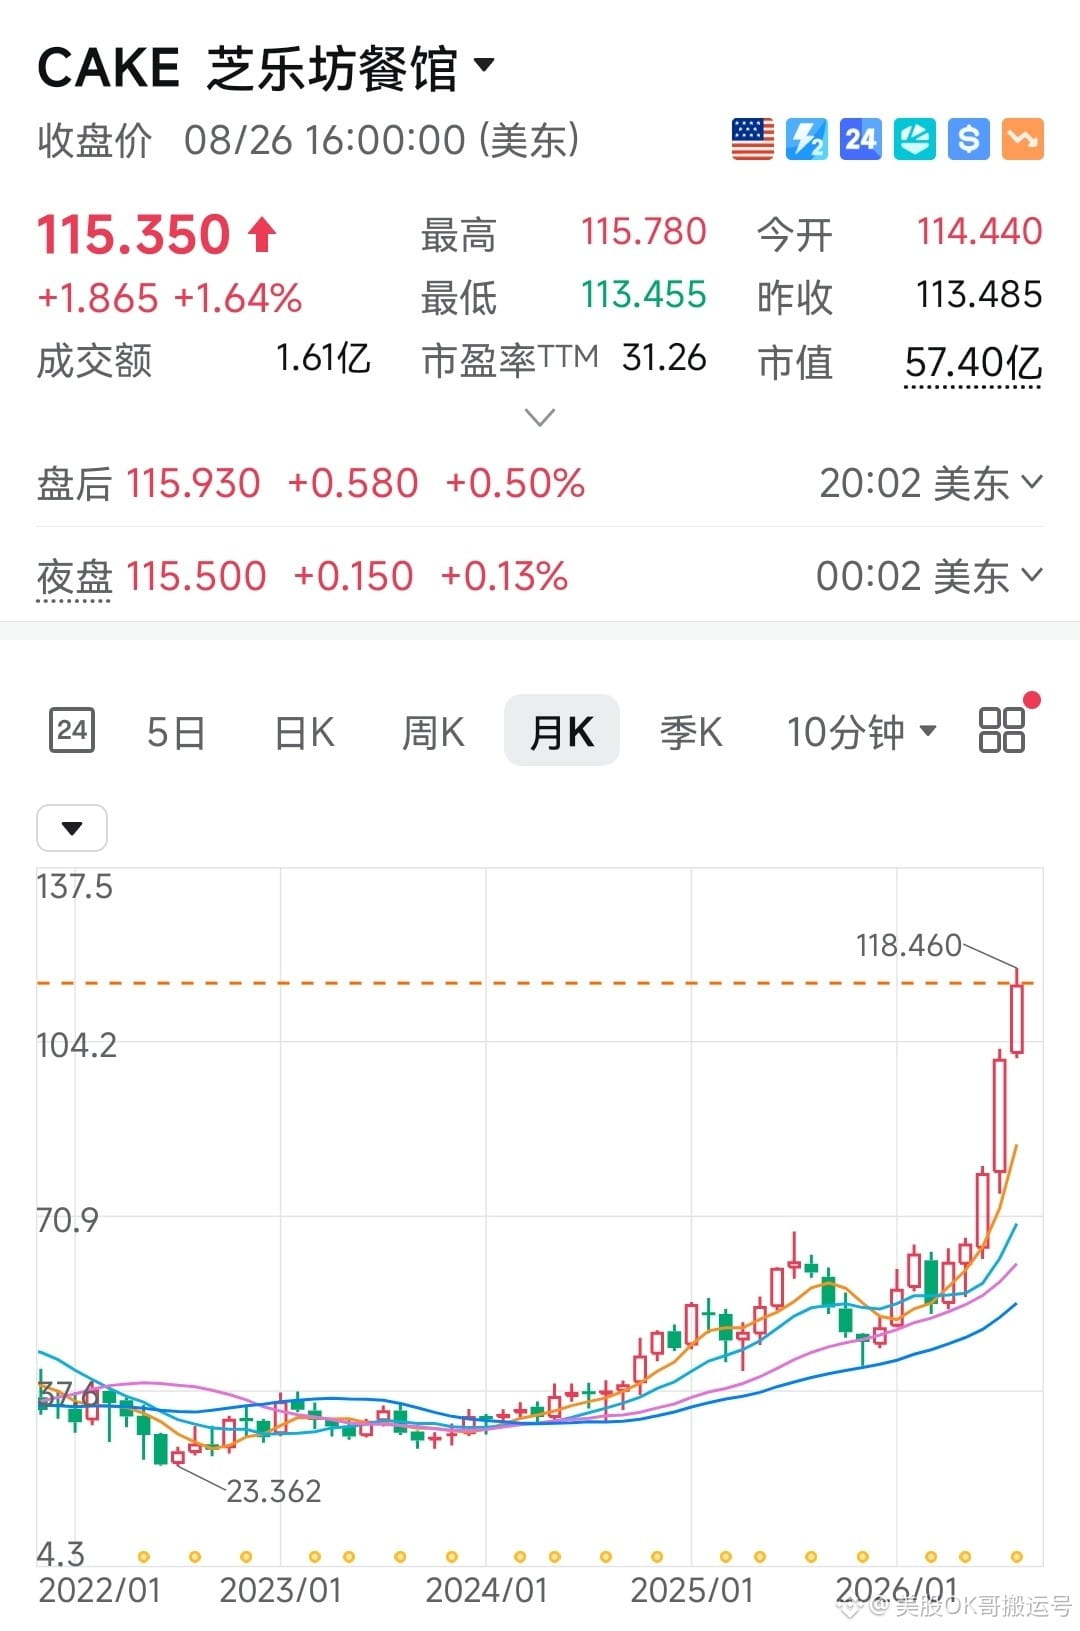
Facts have proven the five-layer cake concept that Huang Renxun once mentioned—apparently the market will always face a shortage of cake. Looking at this year’s data, $CAKE has already achieved a +128% growth.
NVIDIA’s latest financial results and performance in its earnings call have been outstanding. Aside from a slight blemish in the gross margin, the overall performance can be described as flawless.
Even so, when we look back at its recent historical trend, the situation is still worth paying close attention to. In the past eight quarterly earnings releases, the stock saw a big after-hours surge seven times, but the gains faded after the official opening—playing out a pattern of a high opening followed by a pullback. The remaining time, it showed a direct downward trend. As for whether tonight’s opening will continue to replicate this pattern, we can watch together patiently.
Even so, when we look back at its recent historical trend, the situation is still worth paying close attention to. In the past eight quarterly earnings releases, the stock saw a big after-hours surge seven times, but the gains faded after the official opening—playing out a pattern of a high opening followed by a pullback. The remaining time, it showed a direct downward trend. As for whether tonight’s opening will continue to replicate this pattern, we can watch together patiently.

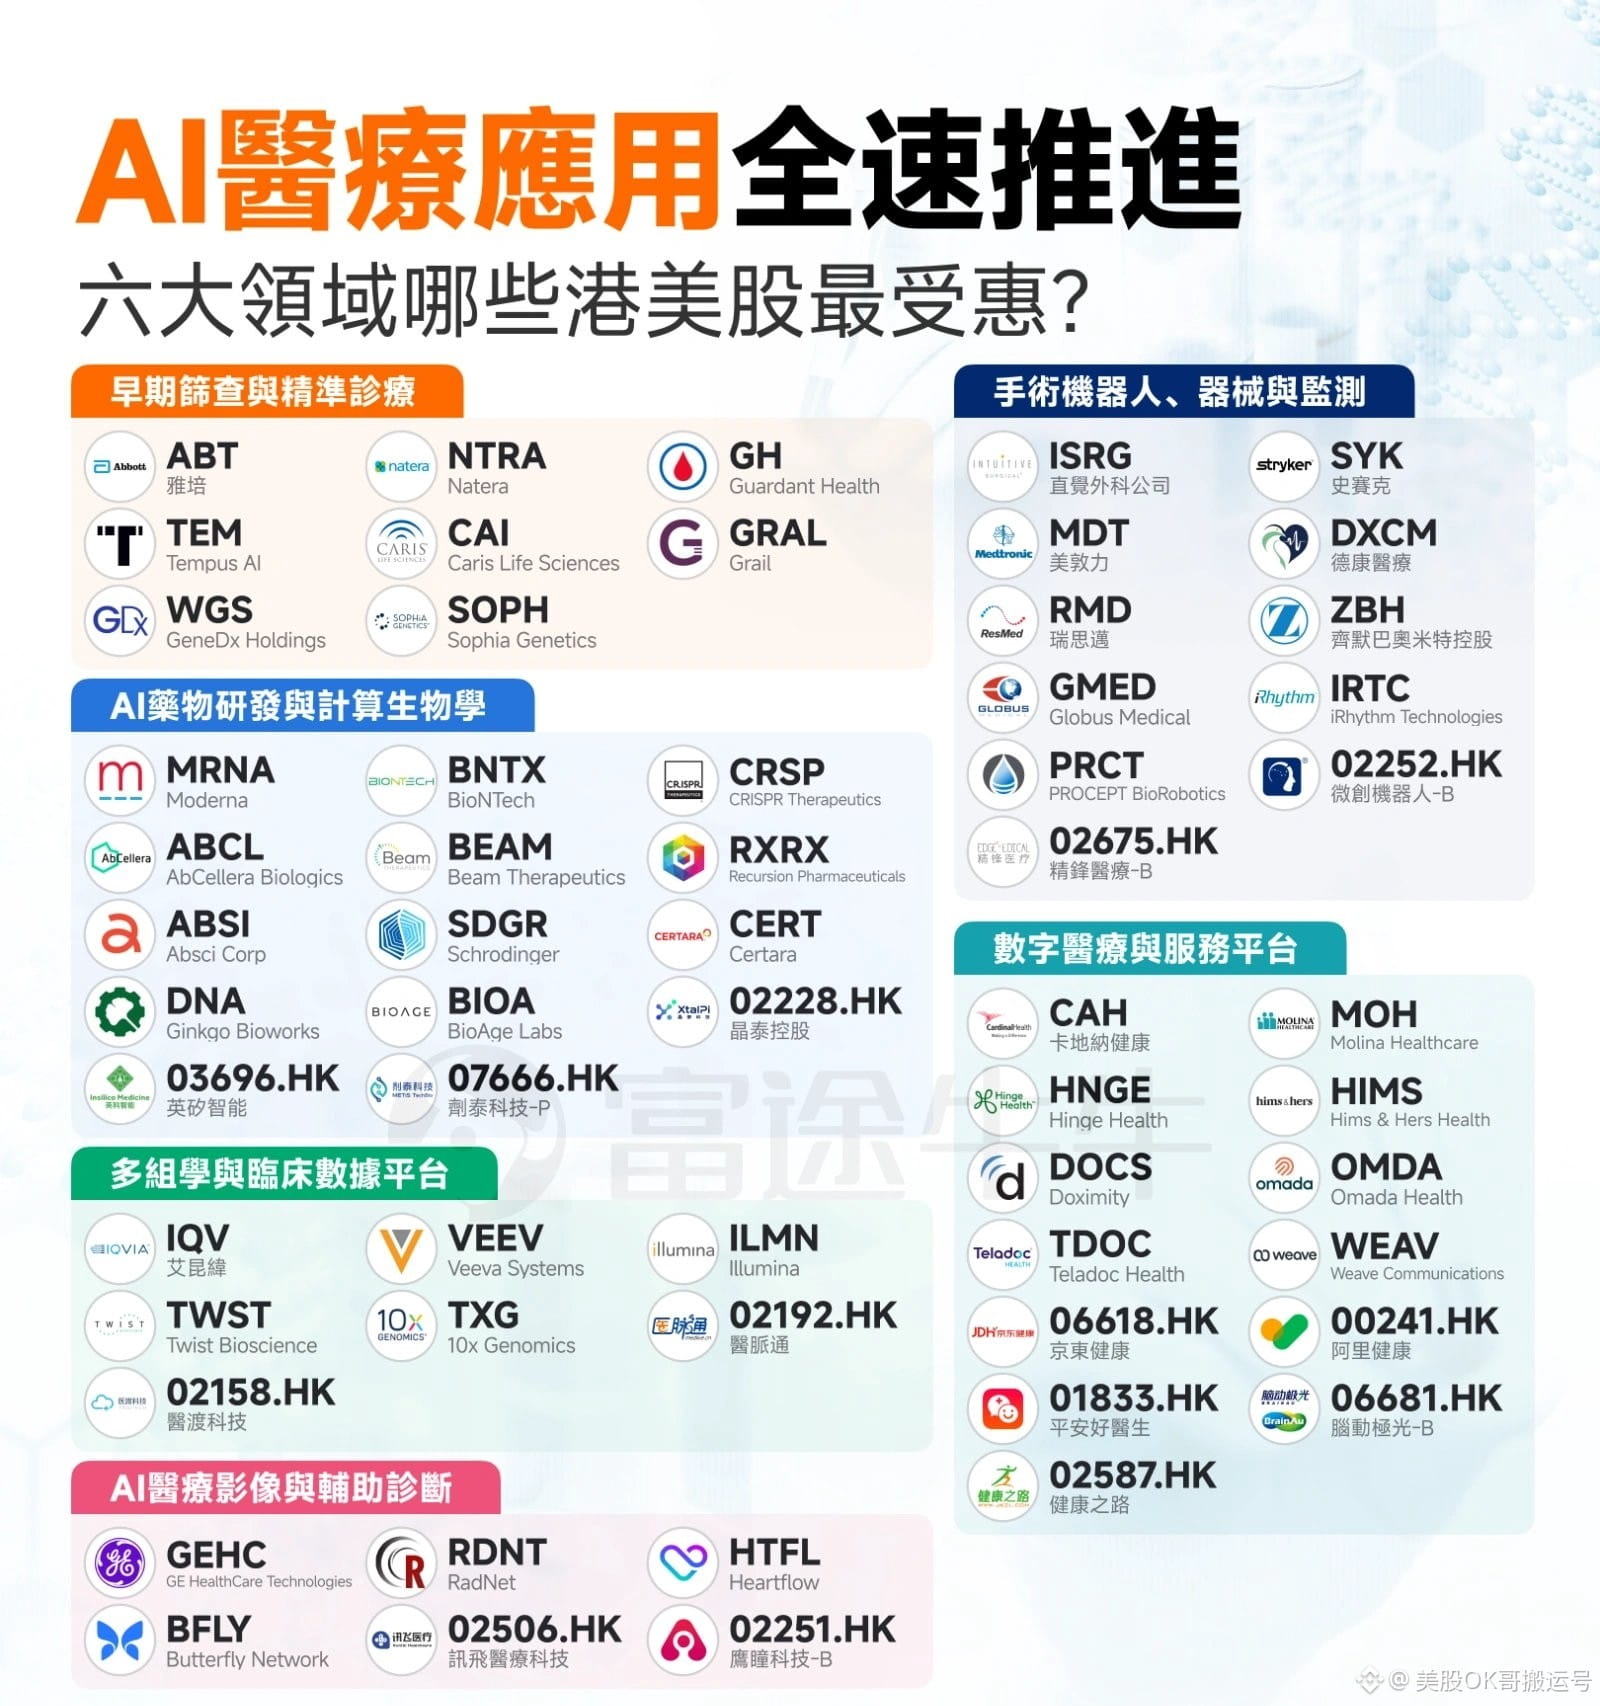
The AI-enabled healthcare segment in the U.S. stock market has finally started to see a rotation of funds recently, breaking the situation where it had been held back by the infrastructure sector. Judging from historical performance, the healthcare industry typically sees its weakest performance in September, while it tends to unleash its strongest rally in November. Therefore, this is an ideal window for timing and building positions.
To help everyone understand, I have reorganized and categorized the key related companies, providing a detailed reference list.
In the medical devices and hardware equipment space, $MDT (Medtronic) — a traditional giant in medical devices — is currently actively rolling out the Hugo surgical robot and AI endoscopy systems. Well-known surgical robot maker $ISRG (Intuitive Surgical) is empowering its surgical database end-to-end through AI machine vision technology. Large MRI and CT equipment manufacturer $GEHC (GE HealthCare) has already embedded AI medical imaging diagnostic algorithms directly into its end-to-end devices. In addition, $BFLY (Butterfly Network) focuses on portable, handheld ultrasound devices with AI-assisted imaging and diagnostic capabilities. Meanwhile, the CGM continuous glucose monitoring leader $DXCM (Dexcom) is also applying AI technology to predict patients’ glucose fluctuations.
In genomics sequencing and biological data, high-throughput genomics sequencing leader $ILMN (Illumina) has built a solid genomic data infrastructure. $TWST (Twist Bioscience), with its silicon-based high-throughput DNA synthesis platform, continues to supply critical synthesized genetic data for AI-based biological R&D. Single-cell and spatial biology equipment leader $TXG (10x Genomics) has become an important entry point for biological data. At the testing end, $GH (Guardant Health) focuses on ctDNA liquid biopsy and uses artificial intelligence for early cancer screening and disease monitoring. $NTRA (Natera) provides non-invasive genetic testing services, using AI to deeply analyze blood DNA to enable monitoring of tumor recurrence.
In the drug discovery and innovative vaccine track, mRNA vaccine leader $MRNA (Moderna) is widely applying AI technology to sequence design for both conventional vaccines and cancer vaccines. At the same time, $MRK (Merck) is also co-developing AI-driven personalized mRNA cancer vaccines. The AI drug discovery company $RXRX (Recursion Pharmaceuticals), which has received investment from NVIDIA, is committed to uncovering new indications for old drugs through cutting-edge technology. In addition, this sector includes AI antibody discovery platform company $ABCL (AbCellera Biologics), as well as $ABSI (Absci Corp), which provides generative AI antibody design and high-throughput biological experimentation platforms.
In medical services, clinical data, and the digital health ecosystem, medical distribution leader $CAH (Cardinal Health) is leveraging AI to optimize its supply chain system and actively expand digital health services. CRO industry leader $IQV (IQVIA) has used AI to significantly improve patient recruitment efficiency and data analysis workflows for clinical trials. $TEM (Tempus AI), based on its tumor multimodal clinical database, provides AI-based tumor clinical decision support to physicians. U.S. large imaging center operator $RDNT (RadNet) has already successfully implemented AI-enabled cancer screening at scale. On the consumer internet healthcare side, $HIMS (Hims & Hers Health), as an online digital health platform, uses AI to provide personalized chronic-disease diagnosis and treatment subscription services. Physician social platform $DOCS (Doximity) has also launched an intelligent AI assistant that can automatically generate medical records and healthcare documents.
To help everyone understand, I have reorganized and categorized the key related companies, providing a detailed reference list.
In the medical devices and hardware equipment space, $MDT (Medtronic) — a traditional giant in medical devices — is currently actively rolling out the Hugo surgical robot and AI endoscopy systems. Well-known surgical robot maker $ISRG (Intuitive Surgical) is empowering its surgical database end-to-end through AI machine vision technology. Large MRI and CT equipment manufacturer $GEHC (GE HealthCare) has already embedded AI medical imaging diagnostic algorithms directly into its end-to-end devices. In addition, $BFLY (Butterfly Network) focuses on portable, handheld ultrasound devices with AI-assisted imaging and diagnostic capabilities. Meanwhile, the CGM continuous glucose monitoring leader $DXCM (Dexcom) is also applying AI technology to predict patients’ glucose fluctuations.
In genomics sequencing and biological data, high-throughput genomics sequencing leader $ILMN (Illumina) has built a solid genomic data infrastructure. $TWST (Twist Bioscience), with its silicon-based high-throughput DNA synthesis platform, continues to supply critical synthesized genetic data for AI-based biological R&D. Single-cell and spatial biology equipment leader $TXG (10x Genomics) has become an important entry point for biological data. At the testing end, $GH (Guardant Health) focuses on ctDNA liquid biopsy and uses artificial intelligence for early cancer screening and disease monitoring. $NTRA (Natera) provides non-invasive genetic testing services, using AI to deeply analyze blood DNA to enable monitoring of tumor recurrence.
In the drug discovery and innovative vaccine track, mRNA vaccine leader $MRNA (Moderna) is widely applying AI technology to sequence design for both conventional vaccines and cancer vaccines. At the same time, $MRK (Merck) is also co-developing AI-driven personalized mRNA cancer vaccines. The AI drug discovery company $RXRX (Recursion Pharmaceuticals), which has received investment from NVIDIA, is committed to uncovering new indications for old drugs through cutting-edge technology. In addition, this sector includes AI antibody discovery platform company $ABCL (AbCellera Biologics), as well as $ABSI (Absci Corp), which provides generative AI antibody design and high-throughput biological experimentation platforms.
In medical services, clinical data, and the digital health ecosystem, medical distribution leader $CAH (Cardinal Health) is leveraging AI to optimize its supply chain system and actively expand digital health services. CRO industry leader $IQV (IQVIA) has used AI to significantly improve patient recruitment efficiency and data analysis workflows for clinical trials. $TEM (Tempus AI), based on its tumor multimodal clinical database, provides AI-based tumor clinical decision support to physicians. U.S. large imaging center operator $RDNT (RadNet) has already successfully implemented AI-enabled cancer screening at scale. On the consumer internet healthcare side, $HIMS (Hims & Hers Health), as an online digital health platform, uses AI to provide personalized chronic-disease diagnosis and treatment subscription services. Physician social platform $DOCS (Doximity) has also launched an intelligent AI assistant that can automatically generate medical records and healthcare documents.

Looking back at historical trends, it can be seen that whenever the Nasdaq 100 experiences seven consecutive bearish days, in most cases the market will subsequently see a period of upward movement.
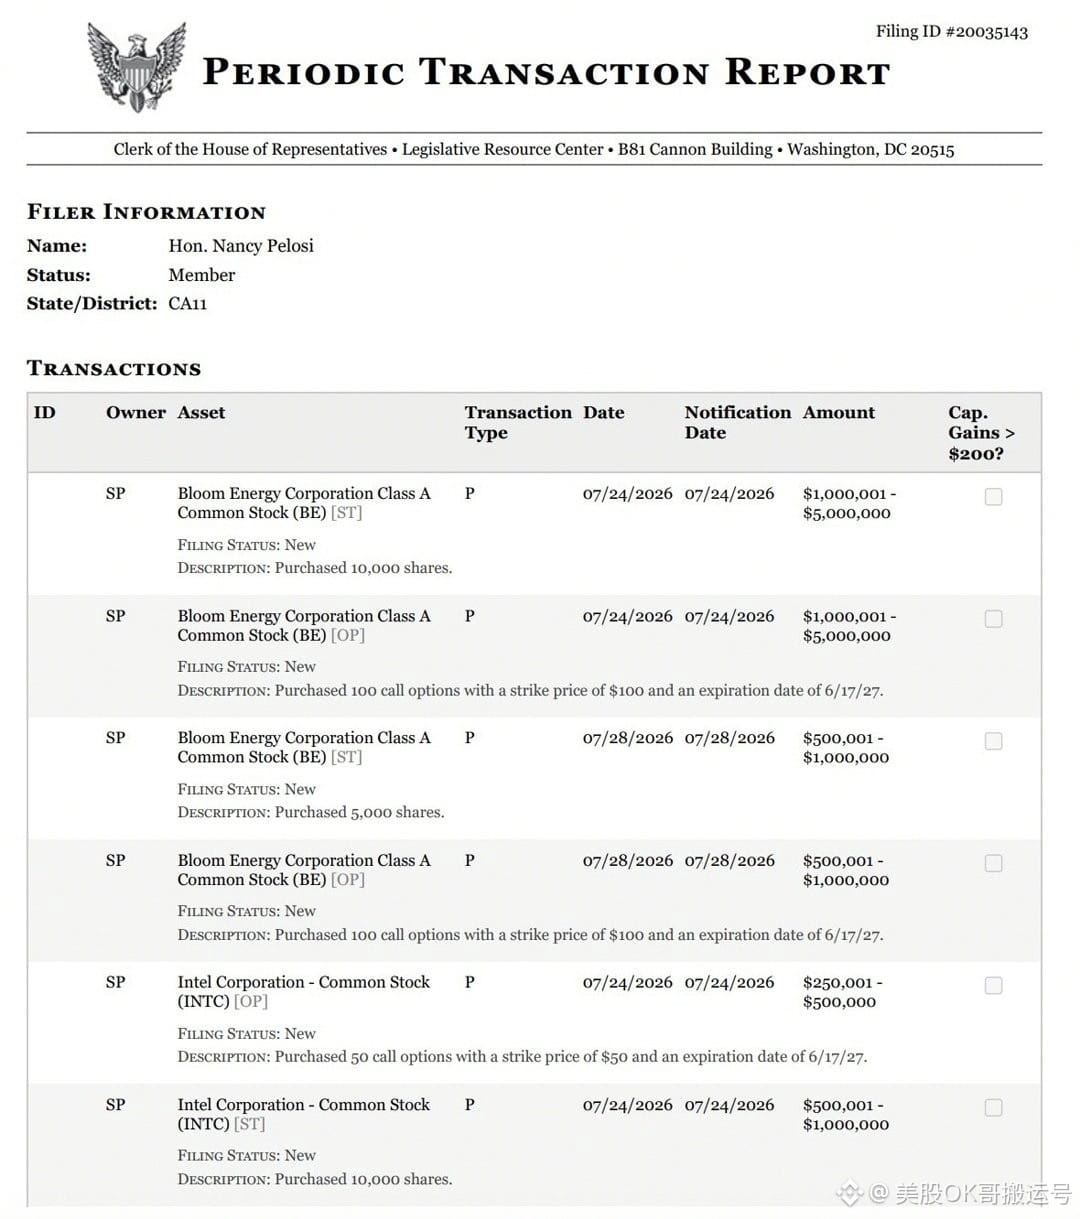
The young investment star has just stepped off the stage, and the seasoned stock market veteran is making a strong return. Recently, Pelosi took attention-grabbing actions in the investment market—she bought a large amount of $BE, which has catapulted it to become the fourth-largest holding in her personal investment portfolio. In parallel, she also recently chose to increase her stake in $INTC. The capital size for both of these investments has now reached the level of $15 million. Looking back at past data, Pelosi’s historical winning rate in the investment arena is as high as 88.4%. With such an outstanding track record in hand, are you also ready to follow the pace of her strategy?

To provide you with some fresh inspiration for your investment portfolio, I recently compiled a detailed review of the annualized return performance of major mainstream ETFs in the US stock market over the past five years. Below is the final ranking.
At the top of the list, technology and semiconductor sectors are particularly outstanding. The #1 spot goes to the VanEck Semiconductor ETF, ticker $SMH, with an excellent five-year annualized return of 40.89%. Right behind it are two technology-themed funds: the SPDR Technology Select Sector ETF, ticker $XLK, ranked #2 with an annualized return of 22.67%, and the Vanguard Information Technology ETF, ticker $VGT, ranked #3 with an annualized return of 20.77%.
Gold and other precious-metals assets are also prominently featured near the top. The #4 position is claimed by the iShares Gold Trust, ticker $IAU, with an annualized performance of 18.33%. The #5 spot goes to the SPDR Gold ETF, ticker $GLD, with an annualized return of 18.16%.
Nasdaq-related index funds come next. The #6 fund is the Invesco Nasdaq 100 ETF, ticker $QQQM, with a five-year annualized return of 17.23%. The #7 fund is the Invesco QQQ Trust, ticker $QQQ, with a return of 17.14%.
In the middle portion of the ranking, several S&P 500 and growth-oriented funds appear frequently. The #8 spot is the SPDR S&P 500 Growth Allocation ETF, ticker $SPYG, with an annualized return of 14.97%. The #9 position is the iShares S&P 500 Growth ETF, ticker $IVW, with a return of 14.82%. The #10 and #11 funds are the iShares Core S&P 500 ETF, ticker $IVV, and the SPDR S&P 500 ETF, ticker $SPYM—both with the same annualized return of 13.68%. The #12 fund is the Vanguard S&P 500 ETF, ticker $VOO, with an annualized return of 13.67%.
In the latter half of the list, the rankings are mainly made up of various large-cap and broad-market funds. The #13 spot is the Vanguard Growth ETF, ticker $VUG, with a return of 13.63%. The #14 position is the iShares Russell 1000 Growth ETF, ticker $IWF, with an annualized return of 13.64%. Ranking #15 is the Vanguard Large-Cap ETF, ticker $VV, with a return of 13.24%.
Two funds from Charles Schwab are also on the list: the Schwab U.S. Large-Cap Growth ETF, ticker $SCHG, ranked #16 with an annualized performance of 13.93%; and the Schwab U.S. Large-Cap ETF, ticker $SCHX, ranked #17 with a return of 12.93%.
The final three positions are: #18 iShares Russell 1000 ETF, ticker $IWB, with an annualized return of 12.74%; #19 iShares Core S&P U.S. Total Market ETF, ticker $ITOT, with a return of 12.48%; and #20 Vanguard Total Stock Market ETF, ticker $VTI, also with an annualized return of 12.48%.
At the top of the list, technology and semiconductor sectors are particularly outstanding. The #1 spot goes to the VanEck Semiconductor ETF, ticker $SMH, with an excellent five-year annualized return of 40.89%. Right behind it are two technology-themed funds: the SPDR Technology Select Sector ETF, ticker $XLK, ranked #2 with an annualized return of 22.67%, and the Vanguard Information Technology ETF, ticker $VGT, ranked #3 with an annualized return of 20.77%.
Gold and other precious-metals assets are also prominently featured near the top. The #4 position is claimed by the iShares Gold Trust, ticker $IAU, with an annualized performance of 18.33%. The #5 spot goes to the SPDR Gold ETF, ticker $GLD, with an annualized return of 18.16%.
Nasdaq-related index funds come next. The #6 fund is the Invesco Nasdaq 100 ETF, ticker $QQQM, with a five-year annualized return of 17.23%. The #7 fund is the Invesco QQQ Trust, ticker $QQQ, with a return of 17.14%.
In the middle portion of the ranking, several S&P 500 and growth-oriented funds appear frequently. The #8 spot is the SPDR S&P 500 Growth Allocation ETF, ticker $SPYG, with an annualized return of 14.97%. The #9 position is the iShares S&P 500 Growth ETF, ticker $IVW, with a return of 14.82%. The #10 and #11 funds are the iShares Core S&P 500 ETF, ticker $IVV, and the SPDR S&P 500 ETF, ticker $SPYM—both with the same annualized return of 13.68%. The #12 fund is the Vanguard S&P 500 ETF, ticker $VOO, with an annualized return of 13.67%.
In the latter half of the list, the rankings are mainly made up of various large-cap and broad-market funds. The #13 spot is the Vanguard Growth ETF, ticker $VUG, with a return of 13.63%. The #14 position is the iShares Russell 1000 Growth ETF, ticker $IWF, with an annualized return of 13.64%. Ranking #15 is the Vanguard Large-Cap ETF, ticker $VV, with a return of 13.24%.
Two funds from Charles Schwab are also on the list: the Schwab U.S. Large-Cap Growth ETF, ticker $SCHG, ranked #16 with an annualized performance of 13.93%; and the Schwab U.S. Large-Cap ETF, ticker $SCHX, ranked #17 with a return of 12.93%.
The final three positions are: #18 iShares Russell 1000 ETF, ticker $IWB, with an annualized return of 12.74%; #19 iShares Core S&P U.S. Total Market ETF, ticker $ITOT, with a return of 12.48%; and #20 Vanguard Total Stock Market ETF, ticker $VTI, also with an annualized return of 12.48%.
During our dinner discussion today, everyone delved into a thought-provoking topic: the Norwegian model. Let’s rewind the timeline to 1969, when Norway, after discovering oil fields, received its first huge windfall. What’s particularly admirable is that they chose to invest that first bucket of money entirely and without reservation into overseas assets. After decades of accumulation, the Norwegian government’s fiscal strength has now formed a clear leading advantage in Europe. To help everyone grasp this level of affluence more intuitively, in Norway, even a beggar can apply for monthly social assistance—and, when converted, it amounts to over 10,000 yuan.
Behind this astonishing financial strength lies the outstanding performance of its sovereign wealth fund. Let’s take a look at this exemplary investment “answer sheet” and learn from it. Currently, the fund’s total stock holdings amount to as much as $2.4 trillion. In its massive global asset allocation map, the U.S. stock market holds an absolute core position, accounting for 52.9% of its investment. European equities, as the second-largest investment destination, take up 27.0%.
In terms of allocations across Asia and other regions, the fund’s holdings in Japan account for 6.8%, while South Korea takes 4.1%. The combined allocation to China’s A-shares and Hong Kong shares is 2.9%. In addition, its investment in Taiwan, China is 1.9%, and India accounts for 1.7%. Looking further afield, Canada and Australia each make up 1.4% and 1.1%, respectively. Finally, for the combined investments in countries and regions such as Brazil, South Africa, Mexico, and Southeast Asia, the total share is 0.2%.
Behind this astonishing financial strength lies the outstanding performance of its sovereign wealth fund. Let’s take a look at this exemplary investment “answer sheet” and learn from it. Currently, the fund’s total stock holdings amount to as much as $2.4 trillion. In its massive global asset allocation map, the U.S. stock market holds an absolute core position, accounting for 52.9% of its investment. European equities, as the second-largest investment destination, take up 27.0%.
In terms of allocations across Asia and other regions, the fund’s holdings in Japan account for 6.8%, while South Korea takes 4.1%. The combined allocation to China’s A-shares and Hong Kong shares is 2.9%. In addition, its investment in Taiwan, China is 1.9%, and India accounts for 1.7%. Looking further afield, Canada and Australia each make up 1.4% and 1.1%, respectively. Finally, for the combined investments in countries and regions such as Brazil, South Africa, Mexico, and Southeast Asia, the total share is 0.2%.
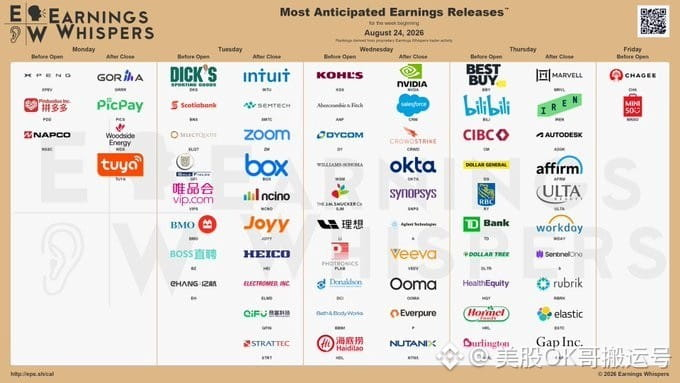
The upcoming U.S. stock earnings week on 8/24 is highly anticipated, and tech giant Nvidia is set to make a major appearance! In addition, the market will see a dense stream of earnings releases from many semiconductor and related industry companies, along with results from numerous well-known large- and mid-cap Chinese concept stocks. Combined with the upcoming release of PCE inflation data and the impact of global central bank meetings, the market is bound to experience a round of sharp volatility. Here, I’ve整理 the schedule of key events to watch this week.
On Monday (August 24), the focus will be on pre-market and after-market trading. Before the U.S. stock market opens, it’s recommended to pay attention to the earnings performance of China’s intelligent electric vehicle maker XPeng ($XPEV) and China’s leading e-commerce platform Pinduoduo ($PDD). After the market closes, IoT cloud platform service provider Tuya Smart ($TUYA) will release its latest earnings report.
Moving to Tuesday (August 25), the pre-market session is mainly led by several Chinese concept stocks: brand discount e-commerce company Vipshop ($VIP), BOSS直聘 ($BZ), the leading domestic online recruitment platform, and EHang Smart ($EH), an enterprise in manned autonomous flying vehicles. The after-market schedule is also exciting: U.S. tax and accounting software leader Intuit ($INTU), video communications SaaS provider Zoom ($ZM), and overseas live-streaming social platform Joyy ($JOYY) will all release financial data in succession.
Wednesday (August 26) is undoubtedly the highlight of the week. In the pre-market phase, you can focus on U.S. offline department store chain Kohl’s ($KSS), China’s intelligent electric vehicle maker Li Auto ($LI), and Haidilao ($HDL), the leading Chinese-style chain restaurant. In the after-market, the global AI chip leader Nvidia ($NVDA) will deliver a major earnings release. At the same time, global top CRM software provider Salesforce ($CRM), cloud-native network security leader CrowdStrike ($CRWD), identity verification SaaS service provider Okta ($OKTA), semiconductor EDA software leader Synopsys ($SNPS), scientific instruments and life sciences equipment company Agilent ($A), life sciences industry cloud software provider Veeva ($VEEV), and hyperconverged cloud infrastructure provider Nutanix ($NTNX) will also disclose results densely during this prime time window.
Thursday (August 27) also features an extensive lineup of earnings reports. Pre-market, the first to step in are Best Buy, the largest consumer electronics retailer in North America ($BBY), Dollar General ($DG), the leading U.S. value discount retailer, Dollar Tree ($DLTR), the one-dollar store chain retailer, and Hormel Foods ($HRL), the leading U.S. meat processing company. The after-market roster includes multiple popular sectors, such as data center and communications chip maker Marvell Technology ($MRVL), Autodesk ($ADSK), the leading industrial and building design software company, Affirm ($AFRM), a North American “buy now, pay later” consumer finance platform, Ulta Beauty ($ULTA), the U.S. beauty retail chain, Workday ($WDAY), enterprise HR cloud software provider, SentinelOne ($S), AI-driven cybersecurity vendor, Rubrik ($RBRK), enterprise data security and backup provider, Elastic ($ESTC), open-source search and observability software provider, and Gap ($GAP), an American casual apparel chain brand.
Friday (August 28) has a relatively calmer rhythm. In the pre-market session, you can set your sights on the new-style tea brand Bawang Cha Ji ($CHA) and Miniso ($MINISO), the value everyday consumer goods chain that Musk’s mom has just visited recently.
With such a packed week, which stock are you planning to call?
Sponsored by @bitget_zh, “Bitget Buy U.S. Stocks: Enter in seconds, smooth trading”
On Monday (August 24), the focus will be on pre-market and after-market trading. Before the U.S. stock market opens, it’s recommended to pay attention to the earnings performance of China’s intelligent electric vehicle maker XPeng ($XPEV) and China’s leading e-commerce platform Pinduoduo ($PDD). After the market closes, IoT cloud platform service provider Tuya Smart ($TUYA) will release its latest earnings report.
Moving to Tuesday (August 25), the pre-market session is mainly led by several Chinese concept stocks: brand discount e-commerce company Vipshop ($VIP), BOSS直聘 ($BZ), the leading domestic online recruitment platform, and EHang Smart ($EH), an enterprise in manned autonomous flying vehicles. The after-market schedule is also exciting: U.S. tax and accounting software leader Intuit ($INTU), video communications SaaS provider Zoom ($ZM), and overseas live-streaming social platform Joyy ($JOYY) will all release financial data in succession.
Wednesday (August 26) is undoubtedly the highlight of the week. In the pre-market phase, you can focus on U.S. offline department store chain Kohl’s ($KSS), China’s intelligent electric vehicle maker Li Auto ($LI), and Haidilao ($HDL), the leading Chinese-style chain restaurant. In the after-market, the global AI chip leader Nvidia ($NVDA) will deliver a major earnings release. At the same time, global top CRM software provider Salesforce ($CRM), cloud-native network security leader CrowdStrike ($CRWD), identity verification SaaS service provider Okta ($OKTA), semiconductor EDA software leader Synopsys ($SNPS), scientific instruments and life sciences equipment company Agilent ($A), life sciences industry cloud software provider Veeva ($VEEV), and hyperconverged cloud infrastructure provider Nutanix ($NTNX) will also disclose results densely during this prime time window.
Thursday (August 27) also features an extensive lineup of earnings reports. Pre-market, the first to step in are Best Buy, the largest consumer electronics retailer in North America ($BBY), Dollar General ($DG), the leading U.S. value discount retailer, Dollar Tree ($DLTR), the one-dollar store chain retailer, and Hormel Foods ($HRL), the leading U.S. meat processing company. The after-market roster includes multiple popular sectors, such as data center and communications chip maker Marvell Technology ($MRVL), Autodesk ($ADSK), the leading industrial and building design software company, Affirm ($AFRM), a North American “buy now, pay later” consumer finance platform, Ulta Beauty ($ULTA), the U.S. beauty retail chain, Workday ($WDAY), enterprise HR cloud software provider, SentinelOne ($S), AI-driven cybersecurity vendor, Rubrik ($RBRK), enterprise data security and backup provider, Elastic ($ESTC), open-source search and observability software provider, and Gap ($GAP), an American casual apparel chain brand.
Friday (August 28) has a relatively calmer rhythm. In the pre-market session, you can set your sights on the new-style tea brand Bawang Cha Ji ($CHA) and Miniso ($MINISO), the value everyday consumer goods chain that Musk’s mom has just visited recently.
With such a packed week, which stock are you planning to call?
Sponsored by @bitget_zh, “Bitget Buy U.S. Stocks: Enter in seconds, smooth trading”
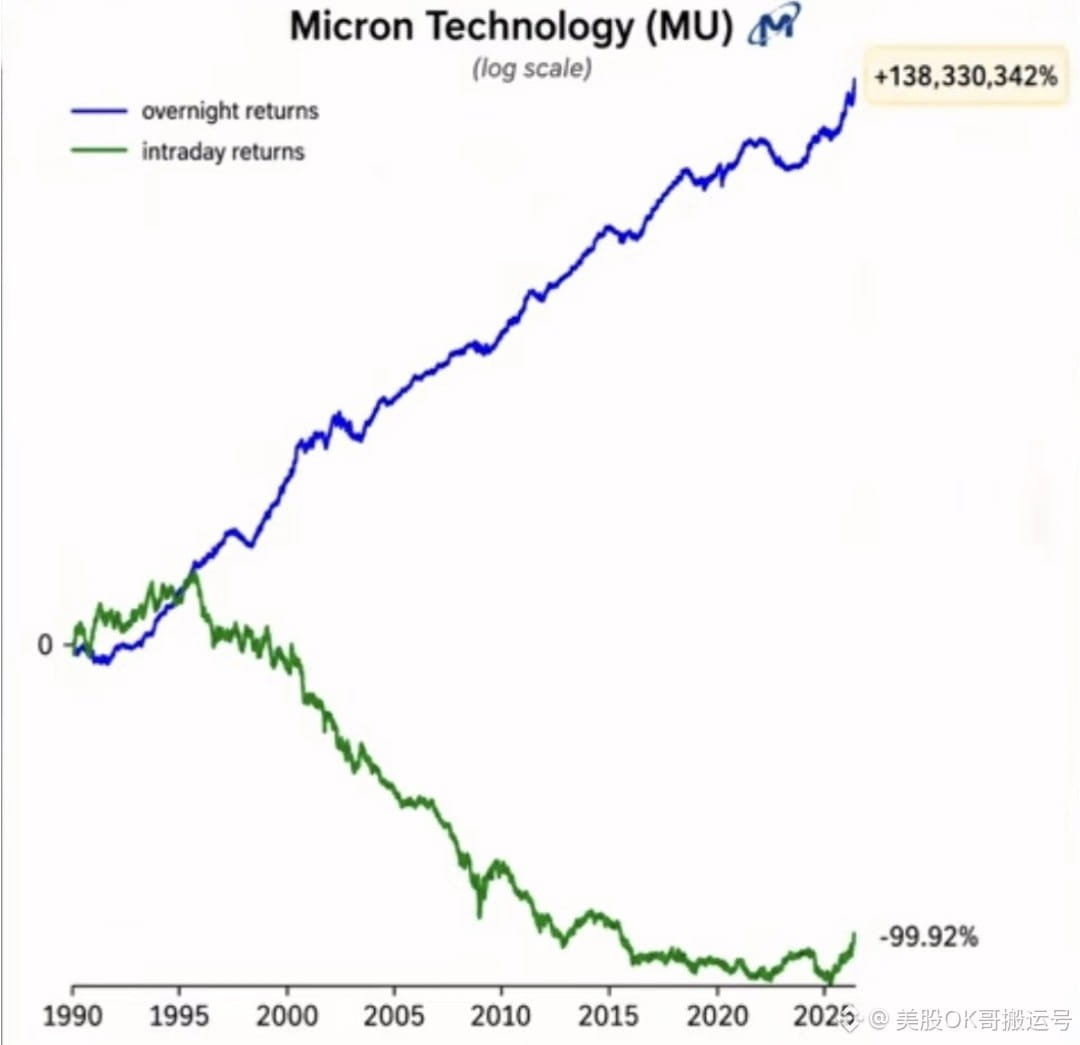
Recently, I noticed an interesting statistics about Micron $MU, and the investment contrast it reveals is thought-provoking. According to this long-term data record, assuming investors had consistently followed a trading strategy of buying the stock at the close of each day, then immediately selling at the moment the next day’s market opens, the cumulative total return over all these years would be as high as 1.38 million times. In stark contrast, if you completely reverse the order of the operations—buying at the market open every morning and only selling when the market closes on that day—then the final investment would suffer a loss of 99.92%.
Log in to explore more content