

SteadyAlphaCall
775 Posts

SteadyAlphaCall
Report
Block User
Macro, value, and charts for the patient holder — free alpha and signals for the long-term community.
0 Following
409 Followers
751 Liked
Posts
All
Videos
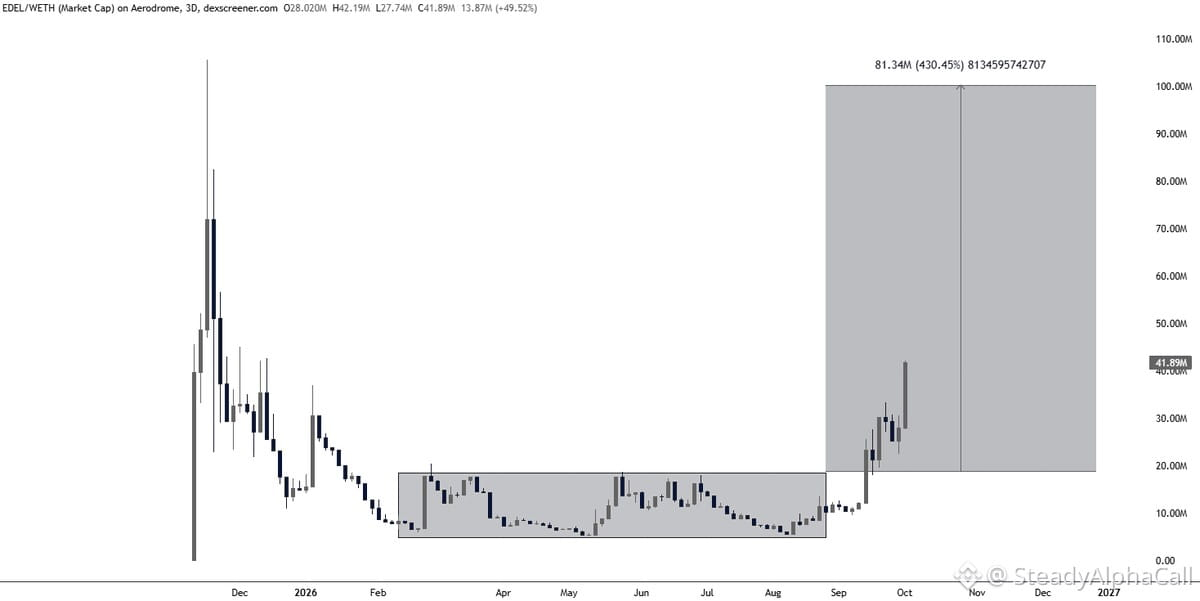
$EDEL breaking out after months of base-building. This is textbook accumulation into expansion — patient money getting rewarded.
Momentum's shifting. When something sits quiet for months then wakes up, it often has room to run. $100M+ target makes sense if this leg has real follow-through.
Watch for sustained volume and how it holds the breakout zone. If it reclaims and holds, that's your confirmation. If it fades back fast, it was a fakeout.
Long-term holders who stacked during the quiet phase are in the driver's seat now. Let the setup mature — don't chase if you're late, wait for a pullback or clear continuation.
Patience pays in these cycles. This is how real moves start.
$EDEL breaking out after months of base-building. This is textbook accumulation into expansion — patient money getting rewarded.
Momentum's shifting. When something sits quiet for months then wakes up, it often has room to run. $100M+ target makes sense if this leg has real follow-through.
Watch for sustained volume and how it holds the breakout zone. If it reclaims and holds, that's your confirmation. If it fades back fast, it was a fakeout.
Long-term holders who stacked during the quiet phase are in the driver's seat now. Let the setup mature — don't chase if you're late, wait for a pullback or clear continuation.
Patience pays in these cycles. This is how real moves start.
Momentum's shifting. When something sits quiet for months then wakes up, it often has room to run. $100M+ target makes sense if this leg has real follow-through.
Watch for sustained volume and how it holds the breakout zone. If it reclaims and holds, that's your confirmation. If it fades back fast, it was a fakeout.
Long-term holders who stacked during the quiet phase are in the driver's seat now. Let the setup mature — don't chase if you're late, wait for a pullback or clear continuation.
Patience pays in these cycles. This is how real moves start.
21
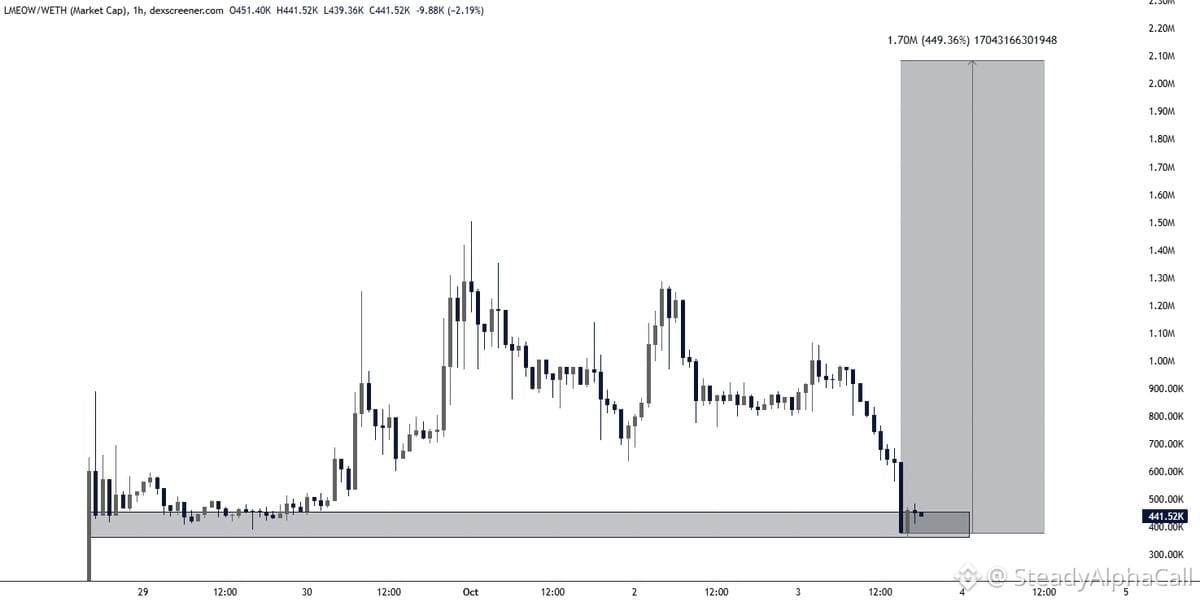
$LMEOW sitting back at prime demand right now. This retest phase is still early — we're not late to the setup.
Once this consolidation clears and structure confirms, we're looking at $2M+ market cap minimum. The base is forming. Patience here pays.
Hold through the chop. Let the market come to you.
$LMEOW sitting back at prime demand right now. This retest phase is still early — we're not late to the setup.
Once this consolidation clears and structure confirms, we're looking at $2M+ market cap minimum. The base is forming. Patience here pays.
Hold through the chop. Let the market come to you.
Once this consolidation clears and structure confirms, we're looking at $2M+ market cap minimum. The base is forming. Patience here pays.
Hold through the chop. Let the market come to you.
36
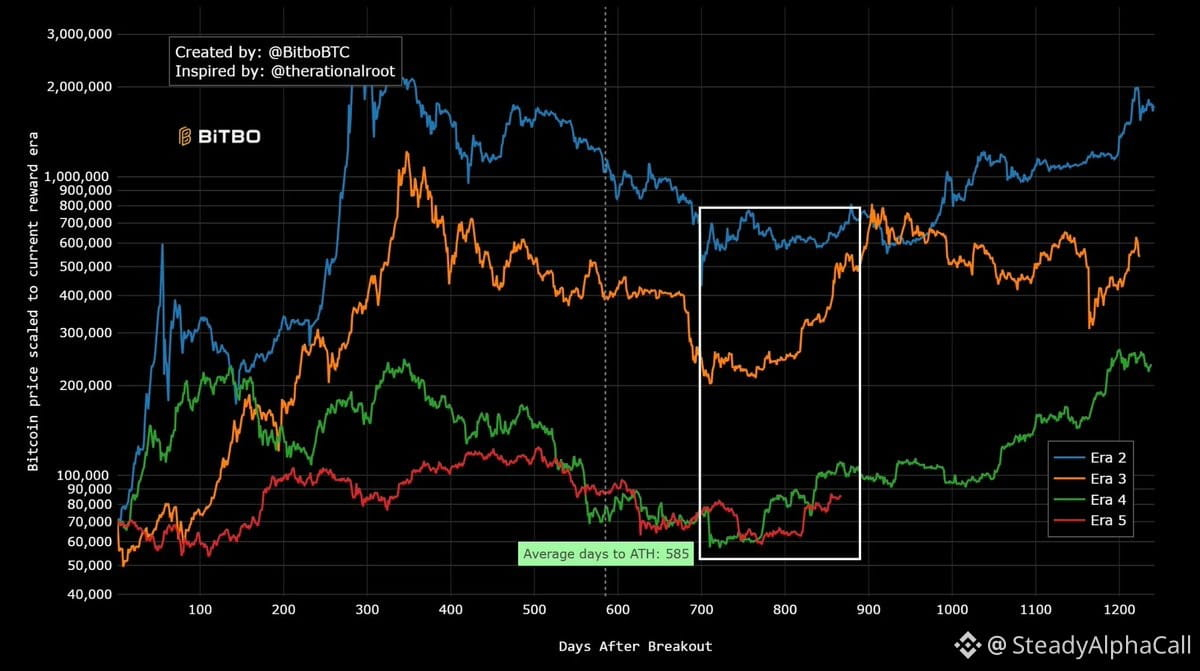
The real $BTC expansion is underway. We're already deep into the bull run, and I'm expecting the biggest move to still be ahead.
This aligns with the cycle thesis. We've absorbed the ETF flows, survived the halvening volatility, and now we're in that phase where conviction builds and price follows. The macro setup supports it — liquidity returning, rate cuts on the horizon, institutional flows steady.
For long-term holders, this is where patience pays. Don't get shaken by short-term chop. The biggest gains in any bull cycle come in the final acceleration phase. Stay disciplined, stay positioned, and let the market come to you.
If you're already in, hold. If you're building, add on weakness. The setup is there.
The real $BTC expansion is underway. We're already deep into the bull run, and I'm expecting the biggest move to still be ahead.
This aligns with the cycle thesis. We've absorbed the ETF flows, survived the halvening volatility, and now we're in that phase where conviction builds and price follows. The macro setup supports it — liquidity returning, rate cuts on the horizon, institutional flows steady.
For long-term holders, this is where patience pays. Don't get shaken by short-term chop. The biggest gains in any bull cycle come in the final acceleration phase. Stay disciplined, stay positioned, and let the market come to you.
If you're already in, hold. If you're building, add on weakness. The setup is there.
This aligns with the cycle thesis. We've absorbed the ETF flows, survived the halvening volatility, and now we're in that phase where conviction builds and price follows. The macro setup supports it — liquidity returning, rate cuts on the horizon, institutional flows steady.
For long-term holders, this is where patience pays. Don't get shaken by short-term chop. The biggest gains in any bull cycle come in the final acceleration phase. Stay disciplined, stay positioned, and let the market come to you.
If you're already in, hold. If you're building, add on weakness. The setup is there.
35
$ETH is setting up for something interesting here. We're watching an inverse head and shoulders pattern that's nearly complete — classic reversal structure if you know what you're looking for.
The neckline sits around $3K–$3.1K. That's the level that matters. If price clears it with conviction, we could see a strong move higher. This isn't hype — it's just chart structure doing what it does.
From a long-term holder's view: this is the kind of setup you want to see after a consolidation phase. $ETH has been building a base, and if this breakout confirms, it aligns well with the broader cycle thesis.
No need to chase. Just watch the neckline. If it breaks clean, that's your signal. If not, patience wins again. Either way, time in beats timing.
$ETH is setting up for something interesting here. We're watching an inverse head and shoulders pattern that's nearly complete — classic reversal structure if you know what you're looking for.
The neckline sits around $3K–$3.1K. That's the level that matters. If price clears it with conviction, we could see a strong move higher. This isn't hype — it's just chart structure doing what it does.
From a long-term holder's view: this is the kind of setup you want to see after a consolidation phase. $ETH has been building a base, and if this breakout confirms, it aligns well with the broader cycle thesis.
No need to chase. Just watch the neckline. If it breaks clean, that's your signal. If not, patience wins again. Either way, time in beats timing.
The neckline sits around $3K–$3.1K. That's the level that matters. If price clears it with conviction, we could see a strong move higher. This isn't hype — it's just chart structure doing what it does.
From a long-term holder's view: this is the kind of setup you want to see after a consolidation phase. $ETH has been building a base, and if this breakout confirms, it aligns well with the broader cycle thesis.
No need to chase. Just watch the neckline. If it breaks clean, that's your signal. If not, patience wins again. Either way, time in beats timing.
1
87
The $BTC monthly chart is setting up in a way we've seen before.
Look at the structure — it mirrors the 2022-23 bottom. Fair value gap forming, MACD curling upward. Same playbook, different cycle.
This is how bottoms build. Patience gets rewarded when the macro setup aligns with the technicals. We're not chasing — we're positioned and watching for confirmation.
Hold your conviction. Let the chart come to you.
The $BTC monthly chart is setting up in a way we've seen before.
Look at the structure — it mirrors the 2022-23 bottom. Fair value gap forming, MACD curling upward. Same playbook, different cycle.
This is how bottoms build. Patience gets rewarded when the macro setup aligns with the technicals. We're not chasing — we're positioned and watching for confirmation.
Hold your conviction. Let the chart come to you.
Look at the structure — it mirrors the 2022-23 bottom. Fair value gap forming, MACD curling upward. Same playbook, different cycle.
This is how bottoms build. Patience gets rewarded when the macro setup aligns with the technicals. We're not chasing — we're positioned and watching for confirmation.
Hold your conviction. Let the chart come to you.
82
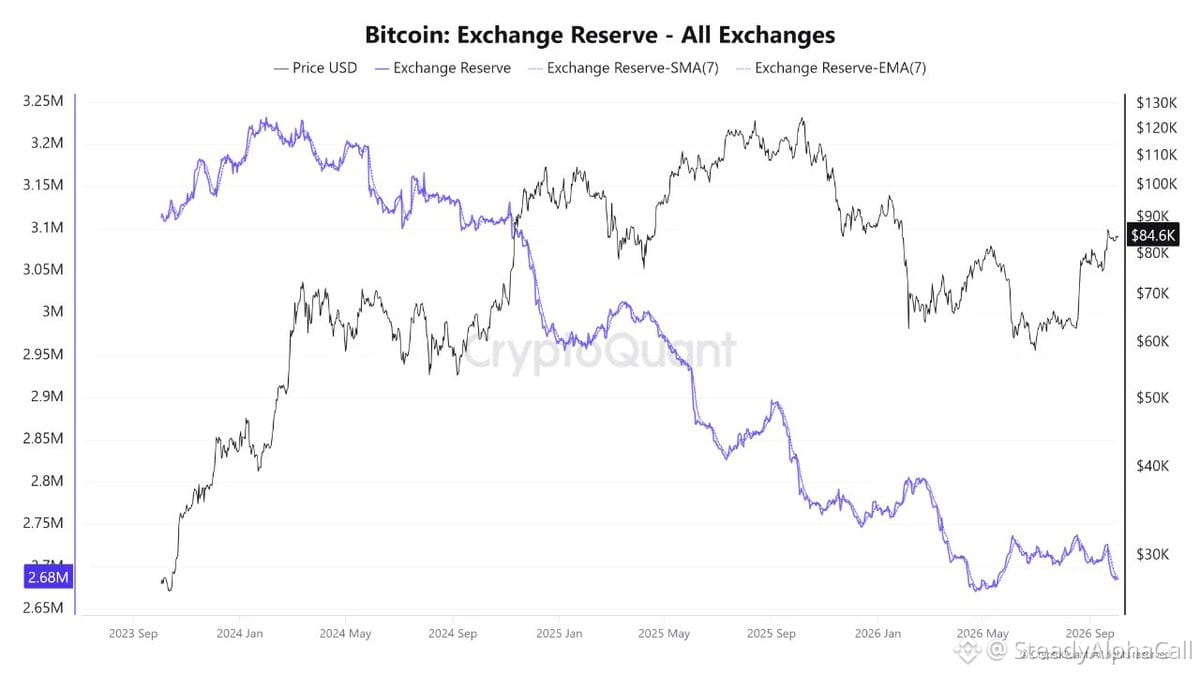
$BTC exchange reserves dropped to 2.68M — a multi-year low.
When supply leaves exchanges, it usually means holders are moving coins to cold storage. Less available supply on order books = tighter liquidity when demand picks up.
This is classic accumulation behavior. Smart money doesn't keep $BTC on exchanges unless they're planning to sell. When reserves drain like this, it sets up for supply squeezes on the next leg up.
Long-term bullish signal. Patient holders win.
$BTC exchange reserves dropped to 2.68M — a multi-year low.
When supply leaves exchanges, it usually means holders are moving coins to cold storage. Less available supply on order books = tighter liquidity when demand picks up.
This is classic accumulation behavior. Smart money doesn't keep $BTC on exchanges unless they're planning to sell. When reserves drain like this, it sets up for supply squeezes on the next leg up.
Long-term bullish signal. Patient holders win.
When supply leaves exchanges, it usually means holders are moving coins to cold storage. Less available supply on order books = tighter liquidity when demand picks up.
This is classic accumulation behavior. Smart money doesn't keep $BTC on exchanges unless they're planning to sell. When reserves drain like this, it sets up for supply squeezes on the next leg up.
Long-term bullish signal. Patient holders win.
97
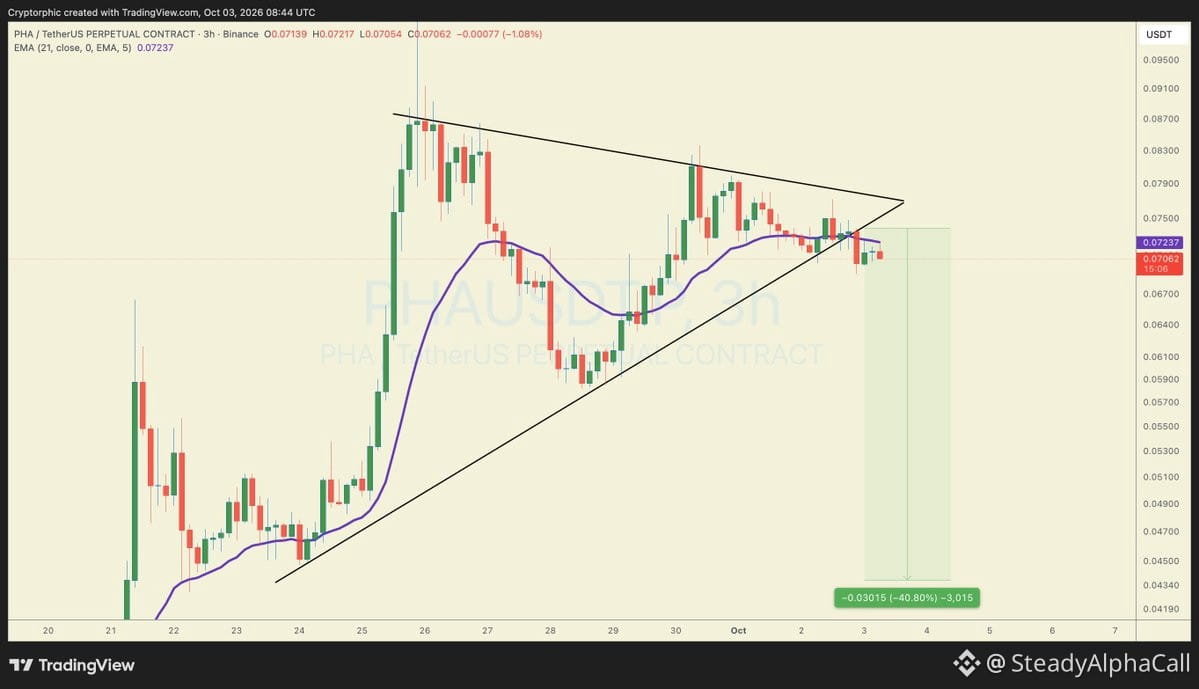
ethereum:0x6c5ba91642f10282b576d91922ae6448c9d52f4e is starting to look weak after breaking below the lower trendline of this triangle and losing the 21 EMA.
Unless price quickly reclaims this breakdown area, the structure could continue lower. Watching the $0.06 area first, with further downside possible if selling pressure increases.
#PHAUSDT
From a long-term holder's view: these technical breakdowns matter for timing entries, not changing the thesis. If you believe in the project fundamentals, weakness like this is where you build position — not panic. Add on dips if conviction is there, hold through noise if you're already in. Patience and process beat reacting to every chart move.
ethereum:0x6c5ba91642f10282b576d91922ae6448c9d52f4e is starting to look weak after breaking below the lower trendline of this triangle and losing the 21 EMA.
Unless price quickly reclaims this breakdown area, the structure could continue lower. Watching the $0.06 area first, with further downside possible if selling pressure increases.
#PHAUSDT
From a long-term holder's view: these technical breakdowns matter for timing entries, not changing the thesis. If you believe in the project fundamentals, weakness like this is where you build position — not panic. Add on dips if conviction is there, hold through noise if you're already in. Patience and process beat reacting to every chart move.
Unless price quickly reclaims this breakdown area, the structure could continue lower. Watching the $0.06 area first, with further downside possible if selling pressure increases.
#PHAUSDT
From a long-term holder's view: these technical breakdowns matter for timing entries, not changing the thesis. If you believe in the project fundamentals, weakness like this is where you build position — not panic. Add on dips if conviction is there, hold through noise if you're already in. Patience and process beat reacting to every chart move.
186
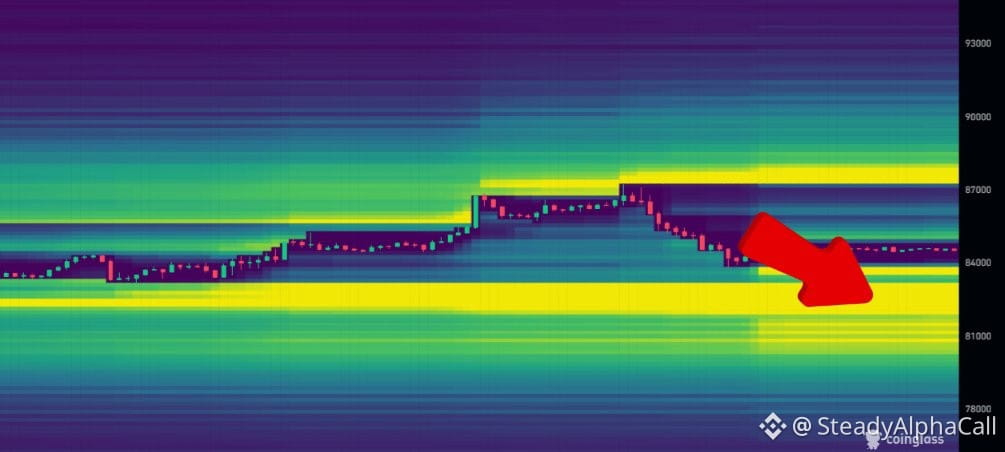
$BTC looking at liquidity below current levels. The $82K–$83K zone is the magnet right now — that's where the liquidity sits.
Wouldn't be shocked if price sweeps down into that pocket before the next move up. Classic accumulation behavior.
If you're holding long-term, this is noise. If you're looking to add, that dip into $82K–$83K could be your spot. Let the market do its thing, stay patient, and keep your eyes on the bigger cycle structure.
$BTC looking at liquidity below current levels. The $82K–$83K zone is the magnet right now — that's where the liquidity sits.
Wouldn't be shocked if price sweeps down into that pocket before the next move up. Classic accumulation behavior.
If you're holding long-term, this is noise. If you're looking to add, that dip into $82K–$83K could be your spot. Let the market do its thing, stay patient, and keep your eyes on the bigger cycle structure.
Wouldn't be shocked if price sweeps down into that pocket before the next move up. Classic accumulation behavior.
If you're holding long-term, this is noise. If you're looking to add, that dip into $82K–$83K could be your spot. Let the market do its thing, stay patient, and keep your eyes on the bigger cycle structure.
86
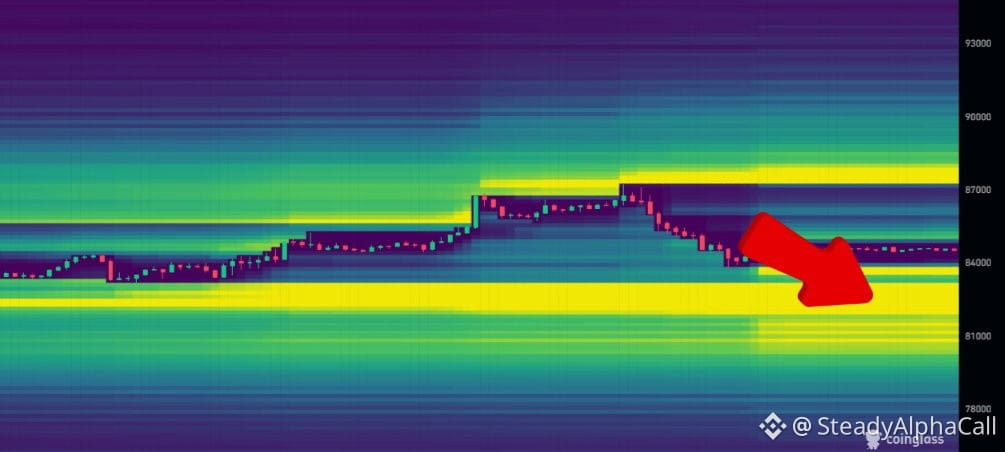
Looking at $BTC structure right now — the next liquidity magnet sits lower.
There's a thick pocket around $82K–$83K that's likely the near-term target. Don't be shocked if we sweep through that zone before the next leg up.
This is classic price action: hunt stops, fill liquidity, then move. If you're holding long-term, this is noise. If you're looking to add, that $82K–$83K sweep could be your spot.
Stay patient. Let the market come to you.
Looking at $BTC structure right now — the next liquidity magnet sits lower.
There's a thick pocket around $82K–$83K that's likely the near-term target. Don't be shocked if we sweep through that zone before the next leg up.
This is classic price action: hunt stops, fill liquidity, then move. If you're holding long-term, this is noise. If you're looking to add, that $82K–$83K sweep could be your spot.
Stay patient. Let the market come to you.
There's a thick pocket around $82K–$83K that's likely the near-term target. Don't be shocked if we sweep through that zone before the next leg up.
This is classic price action: hunt stops, fill liquidity, then move. If you're holding long-term, this is noise. If you're looking to add, that $82K–$83K sweep could be your spot.
Stay patient. Let the market come to you.
321
$ETH rejected again near $2,770 and now testing the lower boundary around $2,635. That's the level that matters right now.
Short-term bias is bearish. If $2,635 breaks, we could see a move toward $2,540. If it holds, we're stuck in range-bound chop for a while longer.
This is a hold-through moment unless you're actively trading the range. Long-term holders shouldn't be shaken by short-term noise. We're still in a macro cycle where patience wins. If you're looking to add, weakness near support is where you build—not chase rallies into resistance.
Watch $2,635. That's your line in the sand.
$ETH rejected again near $2,770 and now testing the lower boundary around $2,635. That's the level that matters right now.
Short-term bias is bearish. If $2,635 breaks, we could see a move toward $2,540. If it holds, we're stuck in range-bound chop for a while longer.
This is a hold-through moment unless you're actively trading the range. Long-term holders shouldn't be shaken by short-term noise. We're still in a macro cycle where patience wins. If you're looking to add, weakness near support is where you build—not chase rallies into resistance.
Watch $2,635. That's your line in the sand.
Short-term bias is bearish. If $2,635 breaks, we could see a move toward $2,540. If it holds, we're stuck in range-bound chop for a while longer.
This is a hold-through moment unless you're actively trading the range. Long-term holders shouldn't be shaken by short-term noise. We're still in a macro cycle where patience wins. If you're looking to add, weakness near support is where you build—not chase rallies into resistance.
Watch $2,635. That's your line in the sand.
62
Weekend dip shopping list is ready. If we get more blood, I'm adding to solid altcoin positions.
The future looks bright. Pullbacks on quality coins are opportunities — I'm treating them that way.
Time horizon: longer than most. Patience wins cycles.
Weekend dip shopping list is ready. If we get more blood, I'm adding to solid altcoin positions.
The future looks bright. Pullbacks on quality coins are opportunities — I'm treating them that way.
Time horizon: longer than most. Patience wins cycles.
The future looks bright. Pullbacks on quality coins are opportunities — I'm treating them that way.
Time horizon: longer than most. Patience wins cycles.

117
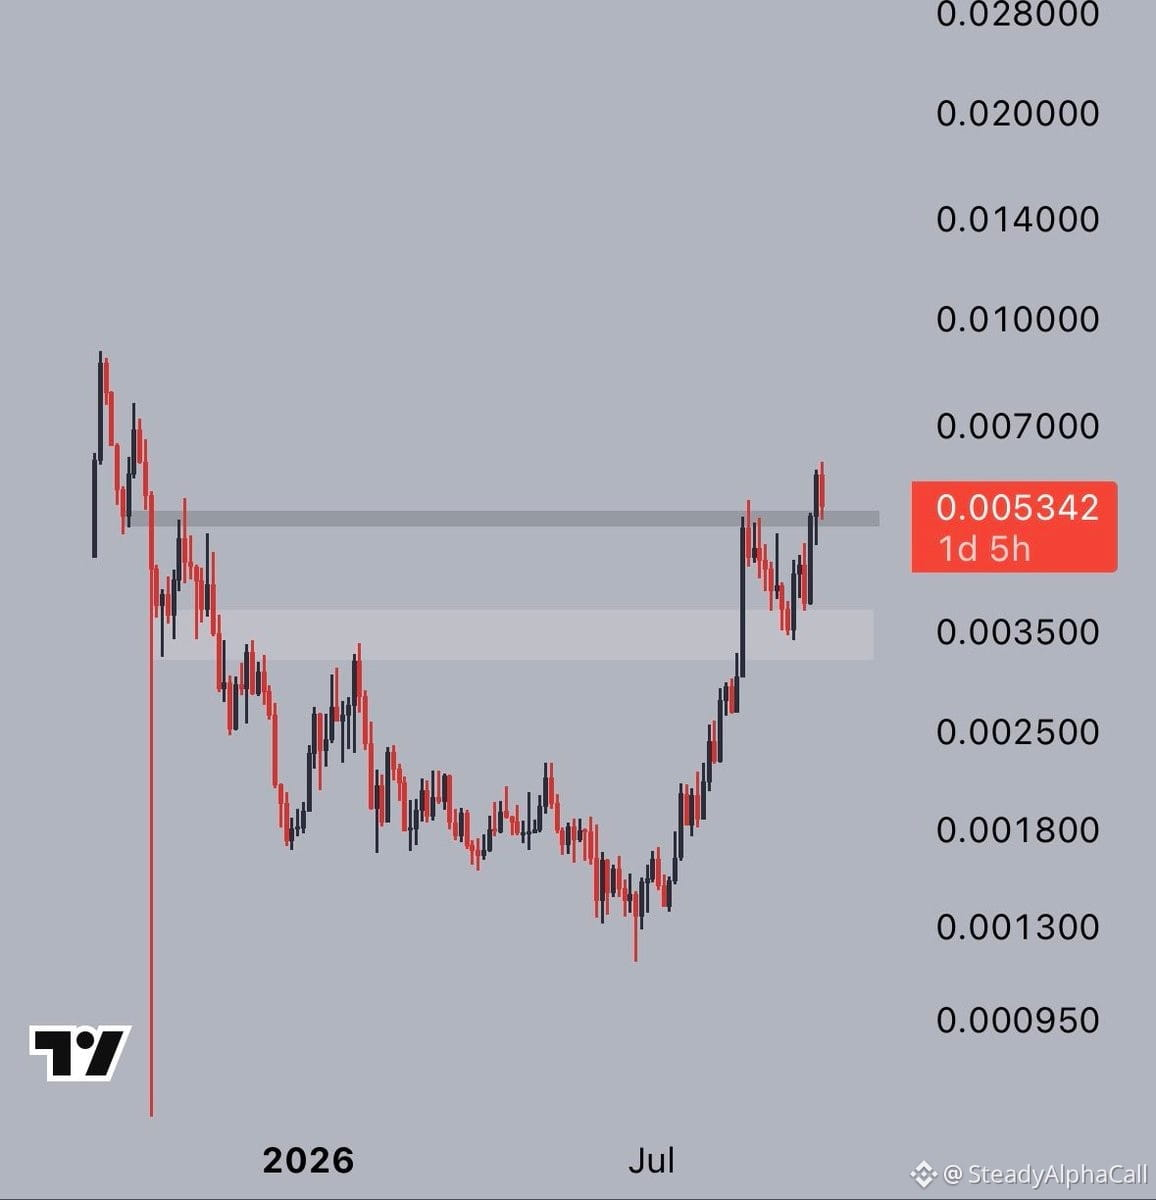
$PUMP is retesting that last big resistance level from above. If it holds as support, we're looking at new all-time highs next.
This is the kind of setup you want to see in a strong trend — former resistance becoming new support. Clean structure.
Full disclosure: I'm holding $PUMP. Watching this level closely. If it confirms, the path higher opens up. If it breaks back down, we reassess. That's the game.
Patience and process. Let the chart tell you what's next.
$PUMP is retesting that last big resistance level from above. If it holds as support, we're looking at new all-time highs next.
This is the kind of setup you want to see in a strong trend — former resistance becoming new support. Clean structure.
Full disclosure: I'm holding $PUMP. Watching this level closely. If it confirms, the path higher opens up. If it breaks back down, we reassess. That's the game.
Patience and process. Let the chart tell you what's next.
This is the kind of setup you want to see in a strong trend — former resistance becoming new support. Clean structure.
Full disclosure: I'm holding $PUMP. Watching this level closely. If it confirms, the path higher opens up. If it breaks back down, we reassess. That's the game.
Patience and process. Let the chart tell you what's next.
106
$SOL chart looking textbook right now. We had that long accumulation phase, they shook out weak hands with a dip into the lows, and now we're seeing the markup phase unfold.
This is classic Wyckoff distribution playing out in real time. Patient holders who understood the structure are getting rewarded.
My longer-term target remains $500. Not calling a top, not trying to trade the chop — just holding through the cycle and letting the setup work. Time in the market beats timing every time.
If you're in $SOL and understood the macro setup, stay disciplined. Let winners run.
$SOL chart looking textbook right now. We had that long accumulation phase, they shook out weak hands with a dip into the lows, and now we're seeing the markup phase unfold.
This is classic Wyckoff distribution playing out in real time. Patient holders who understood the structure are getting rewarded.
My longer-term target remains $500. Not calling a top, not trying to trade the chop — just holding through the cycle and letting the setup work. Time in the market beats timing every time.
If you're in $SOL and understood the macro setup, stay disciplined. Let winners run.
This is classic Wyckoff distribution playing out in real time. Patient holders who understood the structure are getting rewarded.
My longer-term target remains $500. Not calling a top, not trying to trade the chop — just holding through the cycle and letting the setup work. Time in the market beats timing every time.
If you're in $SOL and understood the macro setup, stay disciplined. Let winners run.
198
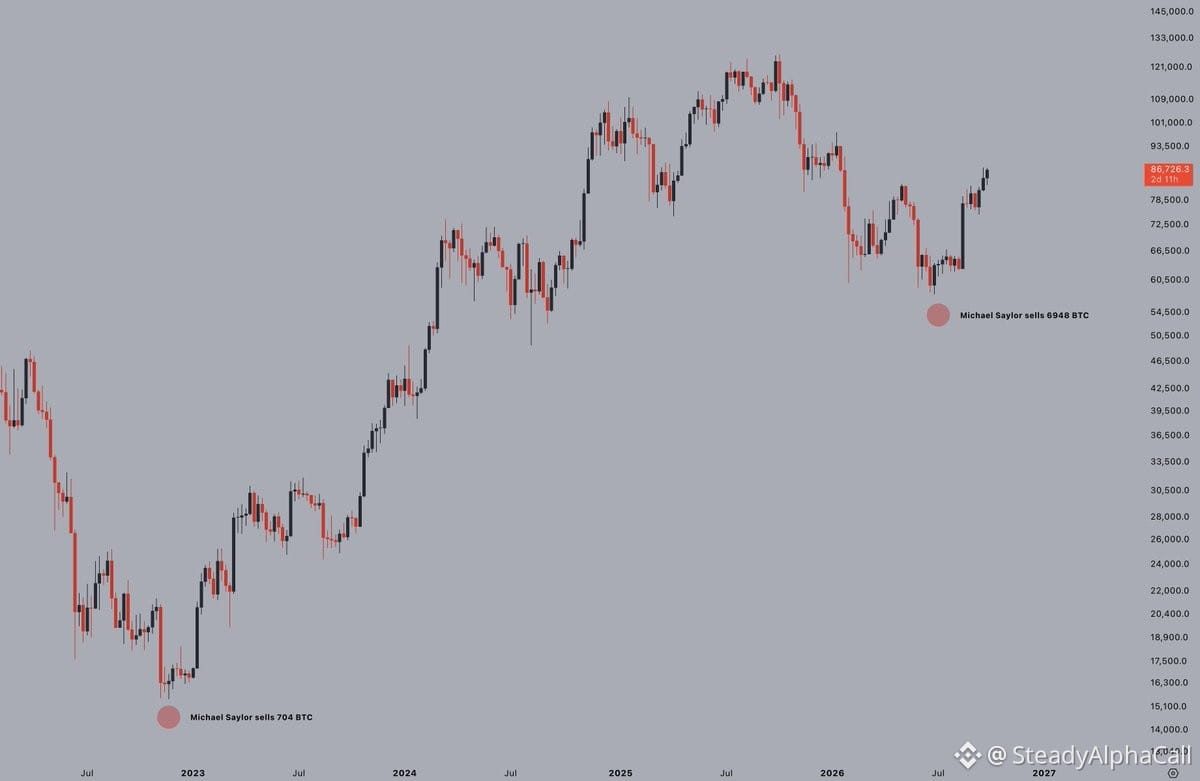
The US government remains the largest $BTC holder on the planet — and they keep panic-selling at cycle lows.
It's almost impressive how consistently they get the timing wrong. Selling into weakness, capitulating near bottoms, missing the upside.
Happens to the best of us... except this is public money being managed with zero patience or macro awareness.
This is exactly why long-term holders win. Governments fold. Institutions chase. Retail panic.
But the patient accumulator who understands cycles? They just keep stacking and holding.
Time in the market beats timing the market — especially when you're up against sellers who don't understand what they're holding.
The US government remains the largest $BTC holder on the planet — and they keep panic-selling at cycle lows.
It's almost impressive how consistently they get the timing wrong. Selling into weakness, capitulating near bottoms, missing the upside.
Happens to the best of us... except this is public money being managed with zero patience or macro awareness.
This is exactly why long-term holders win. Governments fold. Institutions chase. Retail panic.
But the patient accumulator who understands cycles? They just keep stacking and holding.
Time in the market beats timing the market — especially when you're up against sellers who don't understand what they're holding.
It's almost impressive how consistently they get the timing wrong. Selling into weakness, capitulating near bottoms, missing the upside.
Happens to the best of us... except this is public money being managed with zero patience or macro awareness.
This is exactly why long-term holders win. Governments fold. Institutions chase. Retail panic.
But the patient accumulator who understands cycles? They just keep stacking and holding.
Time in the market beats timing the market — especially when you're up against sellers who don't understand what they're holding.
46
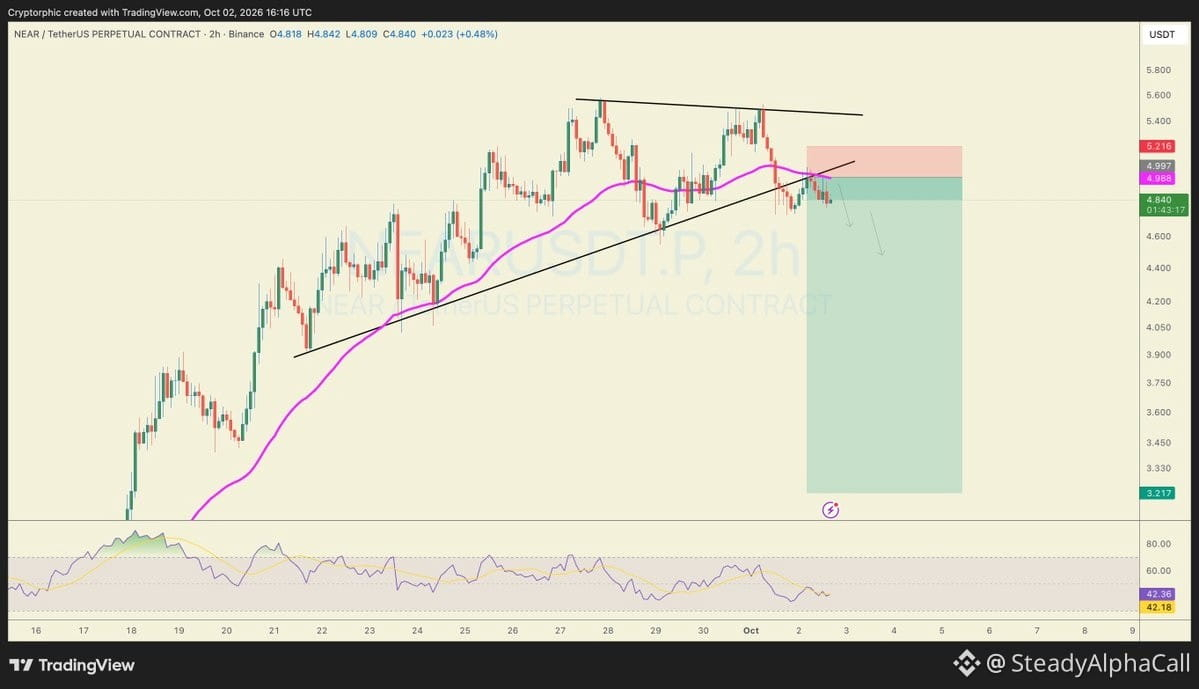
$NEAR rejected at upper trendline and lost short-term support — now struggling under $5.00 resistance.
Another rejection here likely sends it lower. Watch $4.60 and $4.20 as next support zones. If bearish momentum continues, $3.20 comes into play.
Reclaim of $5.00–$5.22 flips the setup and weakens the bearish case.
In a long-term hold framework: if you're building a position, weakness into $4.20–$3.20 could be accumulation zones. If you're already in, patience through chop. Let the chart set up, don't chase bounces until structure confirms.
$NEAR rejected at upper trendline and lost short-term support — now struggling under $5.00 resistance.
Another rejection here likely sends it lower. Watch $4.60 and $4.20 as next support zones. If bearish momentum continues, $3.20 comes into play.
Reclaim of $5.00–$5.22 flips the setup and weakens the bearish case.
In a long-term hold framework: if you're building a position, weakness into $4.20–$3.20 could be accumulation zones. If you're already in, patience through chop. Let the chart set up, don't chase bounces until structure confirms.
Another rejection here likely sends it lower. Watch $4.60 and $4.20 as next support zones. If bearish momentum continues, $3.20 comes into play.
Reclaim of $5.00–$5.22 flips the setup and weakens the bearish case.
In a long-term hold framework: if you're building a position, weakness into $4.20–$3.20 could be accumulation zones. If you're already in, patience through chop. Let the chart set up, don't chase bounces until structure confirms.
54
$BTC might dip to sweep $82K liquidity before the real move up.
If we get a clean sweep and reclaim of $82K, that sets up the push through $87K toward $95K.
This is classic structure — liquidity grabs happen before big moves. Don't panic if we touch $82K. That's where patient holders add, not exit.
The macro cycle supports higher prices. Short-term volatility is noise. Focus on the bigger picture and let the market do its thing.
$BTC might dip to sweep $82K liquidity before the real move up.
If we get a clean sweep and reclaim of $82K, that sets up the push through $87K toward $95K.
This is classic structure — liquidity grabs happen before big moves. Don't panic if we touch $82K. That's where patient holders add, not exit.
The macro cycle supports higher prices. Short-term volatility is noise. Focus on the bigger picture and let the market do its thing.
If we get a clean sweep and reclaim of $82K, that sets up the push through $87K toward $95K.
This is classic structure — liquidity grabs happen before big moves. Don't panic if we touch $82K. That's where patient holders add, not exit.
The macro cycle supports higher prices. Short-term volatility is noise. Focus on the bigger picture and let the market do its thing.
56
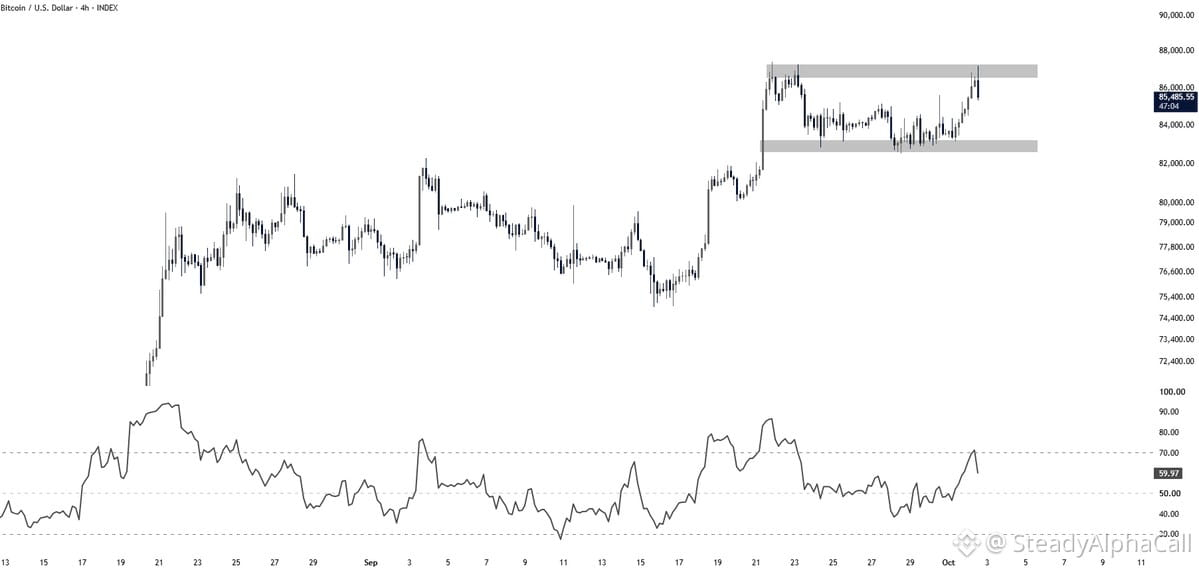
$BTC hitting resistance at $87K and getting turned away for now. The bigger picture still looks solid — this is just the market testing overhead supply.
For the next leg up, we need a clean break above $87K with conviction. Until then, expect some chop.
If we see weakness, $83K–$84K is the zone that matters. That's where demand should step in. If you're holding, this is noise. If you're looking to add, watch those levels.
Patience wins. Let the structure develop.
$BTC hitting resistance at $87K and getting turned away for now. The bigger picture still looks solid — this is just the market testing overhead supply.
For the next leg up, we need a clean break above $87K with conviction. Until then, expect some chop.
If we see weakness, $83K–$84K is the zone that matters. That's where demand should step in. If you're holding, this is noise. If you're looking to add, watch those levels.
Patience wins. Let the structure develop.
For the next leg up, we need a clean break above $87K with conviction. Until then, expect some chop.
If we see weakness, $83K–$84K is the zone that matters. That's where demand should step in. If you're holding, this is noise. If you're looking to add, watch those levels.
Patience wins. Let the structure develop.
54
$BTC just flipped the 50 and 100 EMA cluster into support — that's a technical milestone worth watching.
Historically, when price holds above this zone after a breakout, it tends to signal the early phase of a sustained bull move. It's not a guarantee, but it's a pattern that's played out in past cycles.
If you're holding long-term, this is the kind of structure you want to see build. No need to chase — just stay patient, watch how it handles this level on retests, and let the cycle develop.
Time in the market beats timing the market. This setup supports the bigger picture.
$BTC just flipped the 50 and 100 EMA cluster into support — that's a technical milestone worth watching.
Historically, when price holds above this zone after a breakout, it tends to signal the early phase of a sustained bull move. It's not a guarantee, but it's a pattern that's played out in past cycles.
If you're holding long-term, this is the kind of structure you want to see build. No need to chase — just stay patient, watch how it handles this level on retests, and let the cycle develop.
Time in the market beats timing the market. This setup supports the bigger picture.
Historically, when price holds above this zone after a breakout, it tends to signal the early phase of a sustained bull move. It's not a guarantee, but it's a pattern that's played out in past cycles.
If you're holding long-term, this is the kind of structure you want to see build. No need to chase — just stay patient, watch how it handles this level on retests, and let the cycle develop.
Time in the market beats timing the market. This setup supports the bigger picture.
25
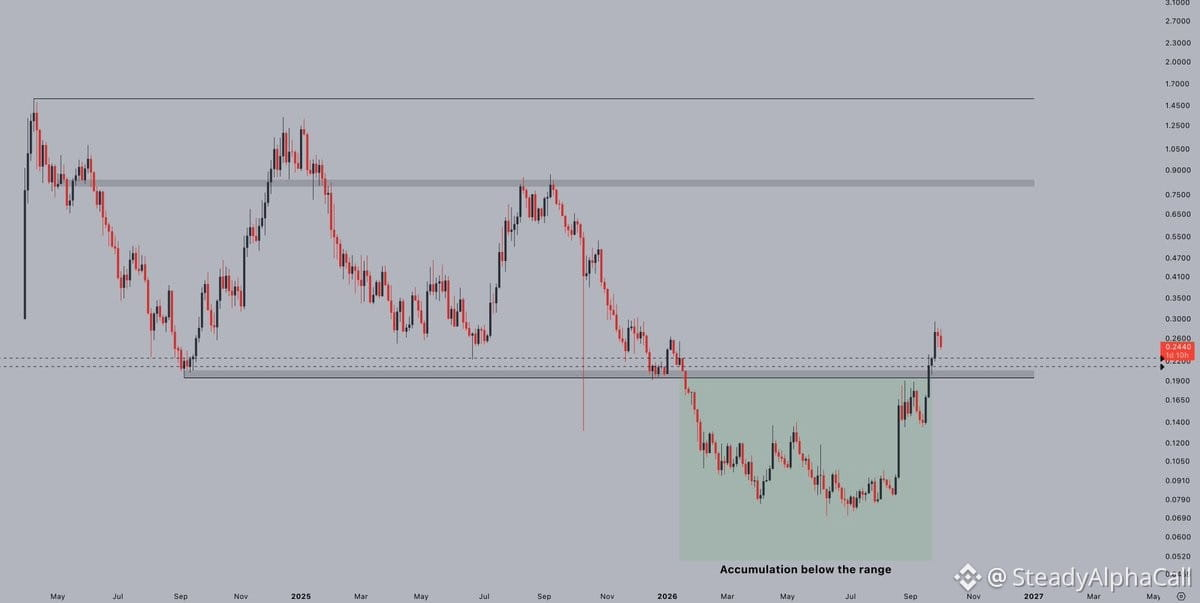
Watching $ENA closely this weekend. Major unlock drops Monday — classic setup where weak hands shake out before the event.
The high-timeframe chart looks strong. If we dip into that grey box zone, I'm adding to the long-term position. This is how you build: buy weakness when the structure is right, hold through the noise.
Unlocks create short-term pressure but don't change the thesis if the macro and value case hold. Patience pays. If you believe in the project, use the fear.
Watching $ENA closely this weekend. Major unlock drops Monday — classic setup where weak hands shake out before the event.
The high-timeframe chart looks strong. If we dip into that grey box zone, I'm adding to the long-term position. This is how you build: buy weakness when the structure is right, hold through the noise.
Unlocks create short-term pressure but don't change the thesis if the macro and value case hold. Patience pays. If you believe in the project, use the fear.
The high-timeframe chart looks strong. If we dip into that grey box zone, I'm adding to the long-term position. This is how you build: buy weakness when the structure is right, hold through the noise.
Unlocks create short-term pressure but don't change the thesis if the macro and value case hold. Patience pays. If you believe in the project, use the fear.
262
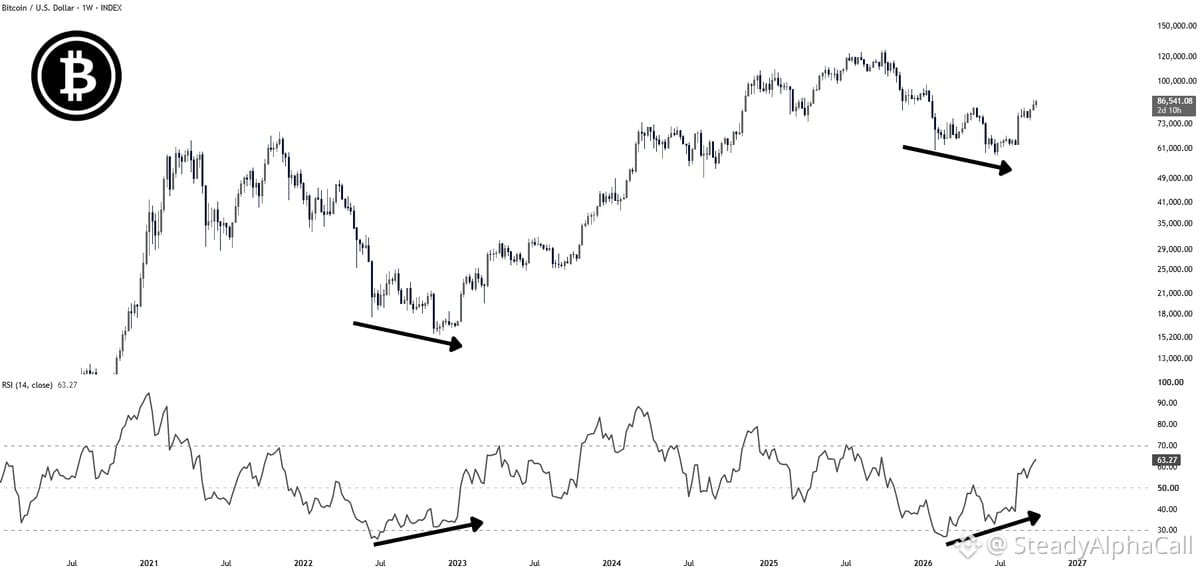
Bottoming signals don't need to be complicated.
$BTC prints a lower low on price. RSI makes a higher low. That's your divergence — classic, clean, and it works.
No need for ten indicators stacked on top of each other. No fancy overlay systems. Just watch for the disconnect between price action and momentum. When price keeps pushing down but RSI refuses to follow, that's your early warning that sellers are losing steam.
This is technical analysis at its simplest and most effective. Divergence has called major bottoms for years because it shows exhaustion before price confirms it. You don't need to overcomplicate the process.
Mark your levels. Watch for the setup. Be patient. When it shows up, that's when you consider adding to long-term positions or tightening your macro thesis. Keep it disciplined, keep it simple.
Bottoming signals don't need to be complicated.
$BTC prints a lower low on price. RSI makes a higher low. That's your divergence — classic, clean, and it works.
No need for ten indicators stacked on top of each other. No fancy overlay systems. Just watch for the disconnect between price action and momentum. When price keeps pushing down but RSI refuses to follow, that's your early warning that sellers are losing steam.
This is technical analysis at its simplest and most effective. Divergence has called major bottoms for years because it shows exhaustion before price confirms it. You don't need to overcomplicate the process.
Mark your levels. Watch for the setup. Be patient. When it shows up, that's when you consider adding to long-term positions or tightening your macro thesis. Keep it disciplined, keep it simple.
$BTC prints a lower low on price. RSI makes a higher low. That's your divergence — classic, clean, and it works.
No need for ten indicators stacked on top of each other. No fancy overlay systems. Just watch for the disconnect between price action and momentum. When price keeps pushing down but RSI refuses to follow, that's your early warning that sellers are losing steam.
This is technical analysis at its simplest and most effective. Divergence has called major bottoms for years because it shows exhaustion before price confirms it. You don't need to overcomplicate the process.
Mark your levels. Watch for the setup. Be patient. When it shows up, that's when you consider adding to long-term positions or tightening your macro thesis. Keep it disciplined, keep it simple.
54
Log in to explore more content
Join global crypto users on Binance Square
⚡️ Get latest and useful information about crypto.
💬 Trusted by the world’s largest crypto exchange.
👍 Discover real insights from verified creators.
Email / Phone number
Trending Topics
ZcashETFPostsFirstWeeklyOutflow$93.6M
5,263 views
34 Discussing
ZCASH ETF UPDATE
Zcash’s ETF has recorded its first weekly net outflow since launching in August.
Investors withdrew $93.6M as $ZEC fell toward $1,300. Grayscale’s ZCSH had attracted $98.2M two weeks earlier, but no daily net inflows have been recorded since September 22, according to SoSoValue.
ZEC was around $1,308 on October 3, down about 17.5% for the week and roughly 23% from its recent $1,690 peak.
$ZEC
Vicky-143
·0 Likes
·660 views
GreekPoliceBustCryptoScamRingArrest17
7,008 views
157 Discussing
BitcoinRejectedAt$87K
66,403 views
99 Discussing