
漂亮定乾坤
213 Posts
漂亮定乾坤
Report
Block User
黄金美股数据专家
29 Following
79 Followers
578 Liked
Posts
All
Quotes
·
--
$XAU 【Goldman Sachs: Expects the Fed to Hike Again in October】Jintian Data, September 17—After the Federal Reserve released a hawkish signal on Wednesday, Goldman Sachs now expects the Fed to raise rates again by 25 basis points in October, becoming one of the first major Wall Street banks to forecast consecutive rate hikes. This view reverses Goldman Sachs’ previous stance. Previously, Goldman Sachs believed the Fed had completed the current tightening cycle after a 25-basis-point hike in September. Goldman Sachs said the Fed’s updated interest-rate projections show that the vast majority of policymakers expect at least one more rate increase this year, pointing to a baseline scenario in 2026 of “two rate hikes.” Goldman Sachs added that October is the most likely timing for the next hike, because decision-makers described further steps to tighten policy as helping inflation “return more promptly” to the Fed’s 2% target level. Goldman Sachs said the signal from this meeting was more hawkish than expected, citing factors including Fed officials’ rate projections, an upward revision to the neutral rate, and the fact that Waller repeatedly characterized this action as merely “removing some degree of accommodation.” Bank of America Global Research is another major institution expecting a more aggressive tightening path, forecasting that the Fed will raise rates in October and December, respectively.
$XAU 【Goldman Sachs: Expects the Fed to Hike Again in October】Jintian Data, September 17—After the Federal Reserve released a hawkish signal on Wednesday, Goldman Sachs now expects the Fed to raise rates again by 25 basis points in October, becoming one of the first major Wall Street banks to forecast consecutive rate hikes. This view reverses Goldman Sachs’ previous stance. Previously, Goldman Sachs believed the Fed had completed the current tightening cycle after a 25-basis-point hike in September. Goldman Sachs said the Fed’s updated interest-rate projections show that the vast majority of policymakers expect at least one more rate increase this year, pointing to a baseline scenario in 2026 of “two rate hikes.” Goldman Sachs added that October is the most likely timing for the next hike, because decision-makers described further steps to tighten policy as helping inflation “return more promptly” to the Fed’s 2% target level. Goldman Sachs said the signal from this meeting was more hawkish than expected, citing factors including Fed officials’ rate projections, an upward revision to the neutral rate, and the fact that Waller repeatedly characterized this action as merely “removing some degree of accommodation.” Bank of America Global Research is another major institution expecting a more aggressive tightening path, forecasting that the Fed will raise rates in October and December, respectively.
2
199

·
--
The analogy you’re seeing—“the Fed’s rate hike this time is more like the action in 1997”—mainly lies in the fact that both are preventive, incremental, and sufficiently anticipated “insurance-style” hikes. Their aim is to cool an overheating economy, not to deal with runaway inflation.
📜 The backdrop for the 1997 rate hikes: an “insurance-style” fine-tuning
On March 25, 1997, the Fed raised the federal funds rate by 25 basis points to 5.5%. At the time, the U.S. economy was strong, with the unemployment rate falling to 5.3%. The Fed’s move was a preventive measure—concerned that strong demand could trigger inflation—intended to prolong the economic expansion. Greenspan called it “a form of insurance.”
🔍 Key similarities with today’s core situation
The current environment is highly similar to 1997, mainly in that:
· The economy has resilience: the labor market is healthy, the economy has not entered a recession—similar to 1997.
· Inflation is not out of control: while inflation is heating up, it is still far below the 2022 peak and within a manageable range.
· The tech cycle supports growth: today’s AI investment boom is similar to the internet wave in 1997, supporting growth and offsetting the impact of higher rates.
· Rate-hike expectations are fully priced in: the market has already digested the expectation of rate hikes, so the downside may be “all but exhausted” upon implementation.
⚠️ Key differences and risks
History will not simply repeat itself—be mindful of the following differences:
· Economic bifurcation: today’s U.S. economy shows “K-shaped” divergence, with traditional demand constrained by high interest rates.
· A higher starting point for policy rates: current rates are already elevated, leaving limited room for further hikes.
· A more complex external environment: today faces challenges such as trade wars and weak global growth, which are more complex than the 1997 situation, where the Asian financial crisis was the main complication.
📈 Reference for market impact
Market performance after the 1997 rate hikes provides some guidance:
· Near-term pressure: around the rate hike, U.S. stocks typically face headwinds—for example, in 1997, the S&P 500 fell by about 10%.
· Mid-term strength: once the market confirms the tightening is over, stocks often rebound quickly. One year after the 1997 rate hike, the S&P 500 rose cumulatively by 42%.
· U.S. Treasuries peak: after the rate hike is implemented, yields on 10-year U.S. Treasuries typically peak and then turn down.
Overall, the “1997” analogy is a summary of today’s preventive, incremental rate-hike character, not a simple prediction of market走势.
The analogy you’re seeing—“the Fed’s rate hike this time is more like the action in 1997”—mainly lies in the fact that both are preventive, incremental, and sufficiently anticipated “insurance-style” hikes. Their aim is to cool an overheating economy, not to deal with runaway inflation.
📜 The backdrop for the 1997 rate hikes: an “insurance-style” fine-tuning
On March 25, 1997, the Fed raised the federal funds rate by 25 basis points to 5.5%. At the time, the U.S. economy was strong, with the unemployment rate falling to 5.3%. The Fed’s move was a preventive measure—concerned that strong demand could trigger inflation—intended to prolong the economic expansion. Greenspan called it “a form of insurance.”
🔍 Key similarities with today’s core situation
The current environment is highly similar to 1997, mainly in that:
· The economy has resilience: the labor market is healthy, the economy has not entered a recession—similar to 1997.
· Inflation is not out of control: while inflation is heating up, it is still far below the 2022 peak and within a manageable range.
· The tech cycle supports growth: today’s AI investment boom is similar to the internet wave in 1997, supporting growth and offsetting the impact of higher rates.
· Rate-hike expectations are fully priced in: the market has already digested the expectation of rate hikes, so the downside may be “all but exhausted” upon implementation.
⚠️ Key differences and risks
History will not simply repeat itself—be mindful of the following differences:
· Economic bifurcation: today’s U.S. economy shows “K-shaped” divergence, with traditional demand constrained by high interest rates.
· A higher starting point for policy rates: current rates are already elevated, leaving limited room for further hikes.
· A more complex external environment: today faces challenges such as trade wars and weak global growth, which are more complex than the 1997 situation, where the Asian financial crisis was the main complication.
📈 Reference for market impact
Market performance after the 1997 rate hikes provides some guidance:
· Near-term pressure: around the rate hike, U.S. stocks typically face headwinds—for example, in 1997, the S&P 500 fell by about 10%.
· Mid-term strength: once the market confirms the tightening is over, stocks often rebound quickly. One year after the 1997 rate hike, the S&P 500 rose cumulatively by 42%.
· U.S. Treasuries peak: after the rate hike is implemented, yields on 10-year U.S. Treasuries typically peak and then turn down.
Overall, the “1997” analogy is a summary of today’s preventive, incremental rate-hike character, not a simple prediction of market走势.
📜 The backdrop for the 1997 rate hikes: an “insurance-style” fine-tuning
On March 25, 1997, the Fed raised the federal funds rate by 25 basis points to 5.5%. At the time, the U.S. economy was strong, with the unemployment rate falling to 5.3%. The Fed’s move was a preventive measure—concerned that strong demand could trigger inflation—intended to prolong the economic expansion. Greenspan called it “a form of insurance.”
🔍 Key similarities with today’s core situation
The current environment is highly similar to 1997, mainly in that:
· The economy has resilience: the labor market is healthy, the economy has not entered a recession—similar to 1997.
· Inflation is not out of control: while inflation is heating up, it is still far below the 2022 peak and within a manageable range.
· The tech cycle supports growth: today’s AI investment boom is similar to the internet wave in 1997, supporting growth and offsetting the impact of higher rates.
· Rate-hike expectations are fully priced in: the market has already digested the expectation of rate hikes, so the downside may be “all but exhausted” upon implementation.
⚠️ Key differences and risks
History will not simply repeat itself—be mindful of the following differences:
· Economic bifurcation: today’s U.S. economy shows “K-shaped” divergence, with traditional demand constrained by high interest rates.
· A higher starting point for policy rates: current rates are already elevated, leaving limited room for further hikes.
· A more complex external environment: today faces challenges such as trade wars and weak global growth, which are more complex than the 1997 situation, where the Asian financial crisis was the main complication.
📈 Reference for market impact
Market performance after the 1997 rate hikes provides some guidance:
· Near-term pressure: around the rate hike, U.S. stocks typically face headwinds—for example, in 1997, the S&P 500 fell by about 10%.
· Mid-term strength: once the market confirms the tightening is over, stocks often rebound quickly. One year after the 1997 rate hike, the S&P 500 rose cumulatively by 42%.
· U.S. Treasuries peak: after the rate hike is implemented, yields on 10-year U.S. Treasuries typically peak and then turn down.
Overall, the “1997” analogy is a summary of today’s preventive, incremental rate-hike character, not a simple prediction of market走势.
1
303
·
--
Article
See translation
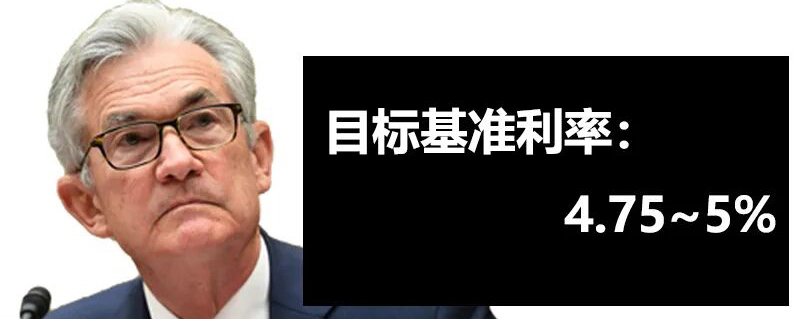
加息不是选择题,是信誉题——站在沃什的视角市场几乎已经替沃什做了决定。截至决议前夜,CME“美联储观察”显示,9月加息25个基点的概率为92.5%,维持利率不变的概率仅7.5%。联邦基金利率目标区间将从当前的3.50%–3.75%上调至3.75%–4.00%。
但市场真正等待的,并不是这25个基点。真正牵动下一阶段全球债市、汇市和风险资产的,是沃什能否借这次决议回答三个信号:油价冲击是短期扰动,还是会扩散到工资、服务价格和长期通胀预期?这只是一次调整,还是新一轮加息周期的开始?沃什又愿意为了压低通胀,承受多大程度的经济和市场压力?
今晚真正重要的不是“加不加”,而是美联储能否重新稳住市场预期。
一、市场逻辑已经逆转:不加息才是更大的利空
过去几年,市场已经习惯了一套简单逻辑:经济走弱,美联储降息,流动性重新宽松,风险资产获得支撑。
现在,这套逻辑遇到了新变量。
油价超过100美元,通胀重新抬头;美债收益率突破5%,融资成本不断上升;全球债务又处在历史高位。经济一旦转弱,美联储未必能马上降息。通胀一旦继续升温,它甚至还要加息。
这才是全球市场正在重新适应的变化。
在这个背景下,传统意义上的“不加息利好债市”已经失效。市场已经用92.5%的概率把加息定价进所有资产价格。如果沃什选择按兵不动,长端利率反而会以更混乱、更无序的方式替美联储加息。“新债王”冈拉克直言,若美联储出乎市场预期维持利率不变,恐会加剧美国国债的历史性抛售潮。有机构警告,30年期美债收益率可能迅速跳升至5.75%。
七月底的教训仍然灼热。当时市场在决策当天定价38%的加息概率,但美联储最终按兵不动。沃什在会后未能就维持利率不变给出清晰解释,长债收益率随即跳升,市场和经济学家的批评浪潮汹涌而来。那一次的代价是公信力折价,而公信力折价会直接体现在长端利率上。
换句话说,不加息,长债反而会替美联储加息——而且加得更猛、更无序、更不可控。 这就是当前市场的“逆转”逻辑:在市场对通胀信誉高度敏感的背景下,按兵不动本身就是一种紧缩信号,只不过这种紧缩是以混乱的方式发生的。
二、沃什必须回答的三个信号
信号一:油价冲击是短期扰动,还是会扩散?
8月CPI数据已经触及了美联储的加息门槛。整体CPI同比3.4%,与前值和预期持平,但核心CPI环比0.3%,超出市场预期的0.2%,为今年4月以来最大单月涨幅。非房租核心服务环比上涨0.5%,服务通胀粘性再度显现。
更关键的是油价。中东冲突推动布伦特原油自7月以来首次突破100美元/桶,9月WTI原油环比涨幅已接近13.5%。在高油价和低基数的背景下,名义CPI从9月开始将面临反弹压力。
沃什需要判断:这是暂时性的能源价格扰动,还是会通过工资、服务价格和长期通胀预期扩散为更持久的通胀压力?他此前在杰克逊霍尔已经划定了行动门槛,称近期通胀数据“不能说明潜在通胀趋势已经改善”,并补充表示,若短期内看不到通胀好转,“我们还有很多工作要做”。
数据已经触及了美联储的加息门槛。从“等待”到“行动”的转变,不是沃什主动选择的结果,而是数据倒逼的必然。
信号二:这是一次调整,还是新一轮加息周期的开始?
本次决议的声明本身可能不会带来太多意外。真正的信号在点阵图和沃什的新闻发布会。
经济学家预期,点阵图中2026年末利率中值可能上调至4.1%左右。德意志银行预计点阵图中位数应会显示今年还有一次加息,甚至部分官员的预期会更加激进。汇丰预计美联储将在9月和12月各加息25个基点,高盛同样预期9月和12月加息,并将2027年降息时点后移。
但沃什本人过去一直拒绝提供前瞻指引,上次6月提交预测时他甚至未参与点阵图。这一次,市场需要的不是他个人的预测,而是他对“这是一次性加息还是新周期起点”的定性表述。
如果沃什在新闻发布会上能够清晰传达“本次加息是为了锚定通胀预期,后续路径取决于数据而非预设方向”,那么债市将获得一个可定价的框架。反之,如果他继续回避经济状况的判断,长端利率可能再次因为不确定性而走高——这正是7月会议的教训。
信号三:沃什愿意承受多大压力?
沃什需要在白宫压力和美债收益率5%上升之间取得平衡。
特朗普的态度已经在预期之内。他在上周末重申“美国理应支付全球最低的利率”,并在被问及美联储是否加息时表示“我不知道”。白宫国家经济委员会主任哈塞特也表示,美联储“不应在临近中期选举时加息”。
但沃什并不需要为此感到意外。特朗普提名沃什时承诺“做你自己的事吧”,如今这句承诺正面临考验。彼得森国际经济研究所高级研究员、IMF前首席经济学家奥布斯特菲尔德指出,沃什并不想留下“在美联储使命受到考验的关键时刻,这位美联储主席向政府压力屈服”的历史评价。
对沃什而言,特朗普的不满是一个已知且可定价的政治成本。真正不可承受的成本,是在通胀仍未受控的情况下放弃加息,导致长债市场失去信任,进而推高全社会的融资成本。两害相权,加息是更小的政治风险。
更重要的是,尽管25个基点并不算大,真正影响下一阶段市场的是沃什能否让投资者相信:美联储仍有能力压住通胀,又不会把高负债的金融体系压出裂缝。 全世界等待的,就是这个信号。
三、加息节奏:一次之后,按兵不动,观察数据
站在沃什的视角,本次加息的定位应当清晰:这是一次“信誉修复型加息”,而非新一轮紧缩周期的起点。
节奏设想如下:
9月完成25个基点加息后,10月议息会议维持利率不变,给市场一个消化窗口。如果后续通胀数据不再进一步恶化——核心CPI环比回落到0.2%以下、油价趋于稳定——那么年底前不再需要额外加息。本轮周期以一次加息收尾。
这一节奏与主流机构预期基本吻合,但沃什的路径可以比这些预测更克制。他的核心目标不是加息本身,而是让市场相信美联储在必要时会加息。一旦这个信号被有效传递,长端利率反而可能因为通胀预期锚定而下行——这正是“加息巩固公信力、公信力压低长端利率”的逻辑闭环。
反过来,如果本次不实施加息,后续将面临极为被动的局面。10月会议将处于中期选举前最后的时间窗口,政治压力只会更大;而届时的通胀数据如果因为油价传导而继续走高,美联储将不得不在选举前夕被迫行动,公信力损失和政治风险将同时放大。
四、结论:全世界等待的信号
站在沃什的位置上,9月加息不是一个“要不要”的问题,而是一个“还能不能不做”的问题。市场已经用92.5%的概率把决策权交还给了美联储,但接收这份决策权的唯一方式,就是兑现它。
加息是利空,不加息是更大的利空。 前者是有序的政策行动,后者是无序的市场惩罚。沃什的选择,本质上是在两种利空之间,选择那个可以被控制、可以被定价、可以被引导的。
全球正处于恶性通货膨胀全面爆发的前夜。沃什需在通胀压力上升下,将市场已定价的加息转变为美联储主导的政策行动。今晚真正重要的不是“加不加”,而是美联储能否重新稳住市场预期——能否让投资者相信,它仍有能力压住通胀,又不会把高负债的金融体系压出裂缝。
全世界等待的,就是这个信号。
加息不是选择题,是信誉题——站在沃什的视角
市场几乎已经替沃什做了决定。截至决议前夜,CME“美联储观察”显示,9月加息25个基点的概率为92.5%,维持利率不变的概率仅7.5%。联邦基金利率目标区间将从当前的3.50%–3.75%上调至3.75%–4.00%。
但市场真正等待的,并不是这25个基点。真正牵动下一阶段全球债市、汇市和风险资产的,是沃什能否借这次决议回答三个信号:油价冲击是短期扰动,还是会扩散到工资、服务价格和长期通胀预期?这只是一次调整,还是新一轮加息周期的开始?沃什又愿意为了压低通胀,承受多大程度的经济和市场压力?
今晚真正重要的不是“加不加”,而是美联储能否重新稳住市场预期。
一、市场逻辑已经逆转:不加息才是更大的利空
过去几年,市场已经习惯了一套简单逻辑:经济走弱,美联储降息,流动性重新宽松,风险资产获得支撑。
现在,这套逻辑遇到了新变量。
油价超过100美元,通胀重新抬头;美债收益率突破5%,融资成本不断上升;全球债务又处在历史高位。经济一旦转弱,美联储未必能马上降息。通胀一旦继续升温,它甚至还要加息。
这才是全球市场正在重新适应的变化。
在这个背景下,传统意义上的“不加息利好债市”已经失效。市场已经用92.5%的概率把加息定价进所有资产价格。如果沃什选择按兵不动,长端利率反而会以更混乱、更无序的方式替美联储加息。“新债王”冈拉克直言,若美联储出乎市场预期维持利率不变,恐会加剧美国国债的历史性抛售潮。有机构警告,30年期美债收益率可能迅速跳升至5.75%。
七月底的教训仍然灼热。当时市场在决策当天定价38%的加息概率,但美联储最终按兵不动。沃什在会后未能就维持利率不变给出清晰解释,长债收益率随即跳升,市场和经济学家的批评浪潮汹涌而来。那一次的代价是公信力折价,而公信力折价会直接体现在长端利率上。
换句话说,不加息,长债反而会替美联储加息——而且加得更猛、更无序、更不可控。 这就是当前市场的“逆转”逻辑:在市场对通胀信誉高度敏感的背景下,按兵不动本身就是一种紧缩信号,只不过这种紧缩是以混乱的方式发生的。
二、沃什必须回答的三个信号
信号一:油价冲击是短期扰动,还是会扩散?
8月CPI数据已经触及了美联储的加息门槛。整体CPI同比3.4%,与前值和预期持平,但核心CPI环比0.3%,超出市场预期的0.2%,为今年4月以来最大单月涨幅。非房租核心服务环比上涨0.5%,服务通胀粘性再度显现。
更关键的是油价。中东冲突推动布伦特原油自7月以来首次突破100美元/桶,9月WTI原油环比涨幅已接近13.5%。在高油价和低基数的背景下,名义CPI从9月开始将面临反弹压力。
沃什需要判断:这是暂时性的能源价格扰动,还是会通过工资、服务价格和长期通胀预期扩散为更持久的通胀压力?他此前在杰克逊霍尔已经划定了行动门槛,称近期通胀数据“不能说明潜在通胀趋势已经改善”,并补充表示,若短期内看不到通胀好转,“我们还有很多工作要做”。
数据已经触及了美联储的加息门槛。从“等待”到“行动”的转变,不是沃什主动选择的结果,而是数据倒逼的必然。
信号二:这是一次调整,还是新一轮加息周期的开始?
本次决议的声明本身可能不会带来太多意外。真正的信号在点阵图和沃什的新闻发布会。
经济学家预期,点阵图中2026年末利率中值可能上调至4.1%左右。德意志银行预计点阵图中位数应会显示今年还有一次加息,甚至部分官员的预期会更加激进。汇丰预计美联储将在9月和12月各加息25个基点,高盛同样预期9月和12月加息,并将2027年降息时点后移。
但沃什本人过去一直拒绝提供前瞻指引,上次6月提交预测时他甚至未参与点阵图。这一次,市场需要的不是他个人的预测,而是他对“这是一次性加息还是新周期起点”的定性表述。
如果沃什在新闻发布会上能够清晰传达“本次加息是为了锚定通胀预期,后续路径取决于数据而非预设方向”,那么债市将获得一个可定价的框架。反之,如果他继续回避经济状况的判断,长端利率可能再次因为不确定性而走高——这正是7月会议的教训。
信号三:沃什愿意承受多大压力?
沃什需要在白宫压力和美债收益率5%上升之间取得平衡。
特朗普的态度已经在预期之内。他在上周末重申“美国理应支付全球最低的利率”,并在被问及美联储是否加息时表示“我不知道”。白宫国家经济委员会主任哈塞特也表示,美联储“不应在临近中期选举时加息”。
但沃什并不需要为此感到意外。特朗普提名沃什时承诺“做你自己的事吧”,如今这句承诺正面临考验。彼得森国际经济研究所高级研究员、IMF前首席经济学家奥布斯特菲尔德指出,沃什并不想留下“在美联储使命受到考验的关键时刻,这位美联储主席向政府压力屈服”的历史评价。
对沃什而言,特朗普的不满是一个已知且可定价的政治成本。真正不可承受的成本,是在通胀仍未受控的情况下放弃加息,导致长债市场失去信任,进而推高全社会的融资成本。两害相权,加息是更小的政治风险。
更重要的是,尽管25个基点并不算大,真正影响下一阶段市场的是沃什能否让投资者相信:美联储仍有能力压住通胀,又不会把高负债的金融体系压出裂缝。 全世界等待的,就是这个信号。
三、加息节奏:一次之后,按兵不动,观察数据
站在沃什的视角,本次加息的定位应当清晰:这是一次“信誉修复型加息”,而非新一轮紧缩周期的起点。
节奏设想如下:
9月完成25个基点加息后,10月议息会议维持利率不变,给市场一个消化窗口。如果后续通胀数据不再进一步恶化——核心CPI环比回落到0.2%以下、油价趋于稳定——那么年底前不再需要额外加息。本轮周期以一次加息收尾。
这一节奏与主流机构预期基本吻合,但沃什的路径可以比这些预测更克制。他的核心目标不是加息本身,而是让市场相信美联储在必要时会加息。一旦这个信号被有效传递,长端利率反而可能因为通胀预期锚定而下行——这正是“加息巩固公信力、公信力压低长端利率”的逻辑闭环。
反过来,如果本次不实施加息,后续将面临极为被动的局面。10月会议将处于中期选举前最后的时间窗口,政治压力只会更大;而届时的通胀数据如果因为油价传导而继续走高,美联储将不得不在选举前夕被迫行动,公信力损失和政治风险将同时放大。
四、结论:全世界等待的信号
站在沃什的位置上,9月加息不是一个“要不要”的问题,而是一个“还能不能不做”的问题。市场已经用92.5%的概率把决策权交还给了美联储,但接收这份决策权的唯一方式,就是兑现它。
加息是利空,不加息是更大的利空。 前者是有序的政策行动,后者是无序的市场惩罚。沃什的选择,本质上是在两种利空之间,选择那个可以被控制、可以被定价、可以被引导的。
全球正处于恶性通货膨胀全面爆发的前夜。沃什需在通胀压力上升下,将市场已定价的加息转变为美联储主导的政策行动。今晚真正重要的不是“加不加”,而是美联储能否重新稳住市场预期——能否让投资者相信,它仍有能力压住通胀,又不会把高负债的金融体系压出裂缝。
全世界等待的,就是这个信号。
但市场真正等待的,并不是这25个基点。真正牵动下一阶段全球债市、汇市和风险资产的,是沃什能否借这次决议回答三个信号:油价冲击是短期扰动,还是会扩散到工资、服务价格和长期通胀预期?这只是一次调整,还是新一轮加息周期的开始?沃什又愿意为了压低通胀,承受多大程度的经济和市场压力?
今晚真正重要的不是“加不加”,而是美联储能否重新稳住市场预期。
一、市场逻辑已经逆转:不加息才是更大的利空
过去几年,市场已经习惯了一套简单逻辑:经济走弱,美联储降息,流动性重新宽松,风险资产获得支撑。
现在,这套逻辑遇到了新变量。
油价超过100美元,通胀重新抬头;美债收益率突破5%,融资成本不断上升;全球债务又处在历史高位。经济一旦转弱,美联储未必能马上降息。通胀一旦继续升温,它甚至还要加息。
这才是全球市场正在重新适应的变化。
在这个背景下,传统意义上的“不加息利好债市”已经失效。市场已经用92.5%的概率把加息定价进所有资产价格。如果沃什选择按兵不动,长端利率反而会以更混乱、更无序的方式替美联储加息。“新债王”冈拉克直言,若美联储出乎市场预期维持利率不变,恐会加剧美国国债的历史性抛售潮。有机构警告,30年期美债收益率可能迅速跳升至5.75%。
七月底的教训仍然灼热。当时市场在决策当天定价38%的加息概率,但美联储最终按兵不动。沃什在会后未能就维持利率不变给出清晰解释,长债收益率随即跳升,市场和经济学家的批评浪潮汹涌而来。那一次的代价是公信力折价,而公信力折价会直接体现在长端利率上。
换句话说,不加息,长债反而会替美联储加息——而且加得更猛、更无序、更不可控。 这就是当前市场的“逆转”逻辑:在市场对通胀信誉高度敏感的背景下,按兵不动本身就是一种紧缩信号,只不过这种紧缩是以混乱的方式发生的。
二、沃什必须回答的三个信号
信号一:油价冲击是短期扰动,还是会扩散?
8月CPI数据已经触及了美联储的加息门槛。整体CPI同比3.4%,与前值和预期持平,但核心CPI环比0.3%,超出市场预期的0.2%,为今年4月以来最大单月涨幅。非房租核心服务环比上涨0.5%,服务通胀粘性再度显现。
更关键的是油价。中东冲突推动布伦特原油自7月以来首次突破100美元/桶,9月WTI原油环比涨幅已接近13.5%。在高油价和低基数的背景下,名义CPI从9月开始将面临反弹压力。
沃什需要判断:这是暂时性的能源价格扰动,还是会通过工资、服务价格和长期通胀预期扩散为更持久的通胀压力?他此前在杰克逊霍尔已经划定了行动门槛,称近期通胀数据“不能说明潜在通胀趋势已经改善”,并补充表示,若短期内看不到通胀好转,“我们还有很多工作要做”。
数据已经触及了美联储的加息门槛。从“等待”到“行动”的转变,不是沃什主动选择的结果,而是数据倒逼的必然。
信号二:这是一次调整,还是新一轮加息周期的开始?
本次决议的声明本身可能不会带来太多意外。真正的信号在点阵图和沃什的新闻发布会。
经济学家预期,点阵图中2026年末利率中值可能上调至4.1%左右。德意志银行预计点阵图中位数应会显示今年还有一次加息,甚至部分官员的预期会更加激进。汇丰预计美联储将在9月和12月各加息25个基点,高盛同样预期9月和12月加息,并将2027年降息时点后移。
但沃什本人过去一直拒绝提供前瞻指引,上次6月提交预测时他甚至未参与点阵图。这一次,市场需要的不是他个人的预测,而是他对“这是一次性加息还是新周期起点”的定性表述。
如果沃什在新闻发布会上能够清晰传达“本次加息是为了锚定通胀预期,后续路径取决于数据而非预设方向”,那么债市将获得一个可定价的框架。反之,如果他继续回避经济状况的判断,长端利率可能再次因为不确定性而走高——这正是7月会议的教训。
信号三:沃什愿意承受多大压力?
沃什需要在白宫压力和美债收益率5%上升之间取得平衡。
特朗普的态度已经在预期之内。他在上周末重申“美国理应支付全球最低的利率”,并在被问及美联储是否加息时表示“我不知道”。白宫国家经济委员会主任哈塞特也表示,美联储“不应在临近中期选举时加息”。
但沃什并不需要为此感到意外。特朗普提名沃什时承诺“做你自己的事吧”,如今这句承诺正面临考验。彼得森国际经济研究所高级研究员、IMF前首席经济学家奥布斯特菲尔德指出,沃什并不想留下“在美联储使命受到考验的关键时刻,这位美联储主席向政府压力屈服”的历史评价。
对沃什而言,特朗普的不满是一个已知且可定价的政治成本。真正不可承受的成本,是在通胀仍未受控的情况下放弃加息,导致长债市场失去信任,进而推高全社会的融资成本。两害相权,加息是更小的政治风险。
更重要的是,尽管25个基点并不算大,真正影响下一阶段市场的是沃什能否让投资者相信:美联储仍有能力压住通胀,又不会把高负债的金融体系压出裂缝。 全世界等待的,就是这个信号。
三、加息节奏:一次之后,按兵不动,观察数据
站在沃什的视角,本次加息的定位应当清晰:这是一次“信誉修复型加息”,而非新一轮紧缩周期的起点。
节奏设想如下:
9月完成25个基点加息后,10月议息会议维持利率不变,给市场一个消化窗口。如果后续通胀数据不再进一步恶化——核心CPI环比回落到0.2%以下、油价趋于稳定——那么年底前不再需要额外加息。本轮周期以一次加息收尾。
这一节奏与主流机构预期基本吻合,但沃什的路径可以比这些预测更克制。他的核心目标不是加息本身,而是让市场相信美联储在必要时会加息。一旦这个信号被有效传递,长端利率反而可能因为通胀预期锚定而下行——这正是“加息巩固公信力、公信力压低长端利率”的逻辑闭环。
反过来,如果本次不实施加息,后续将面临极为被动的局面。10月会议将处于中期选举前最后的时间窗口,政治压力只会更大;而届时的通胀数据如果因为油价传导而继续走高,美联储将不得不在选举前夕被迫行动,公信力损失和政治风险将同时放大。
四、结论:全世界等待的信号
站在沃什的位置上,9月加息不是一个“要不要”的问题,而是一个“还能不能不做”的问题。市场已经用92.5%的概率把决策权交还给了美联储,但接收这份决策权的唯一方式,就是兑现它。
加息是利空,不加息是更大的利空。 前者是有序的政策行动,后者是无序的市场惩罚。沃什的选择,本质上是在两种利空之间,选择那个可以被控制、可以被定价、可以被引导的。
全球正处于恶性通货膨胀全面爆发的前夜。沃什需在通胀压力上升下,将市场已定价的加息转变为美联储主导的政策行动。今晚真正重要的不是“加不加”,而是美联储能否重新稳住市场预期——能否让投资者相信,它仍有能力压住通胀,又不会把高负债的金融体系压出裂缝。
全世界等待的,就是这个信号。
1
92
·
--
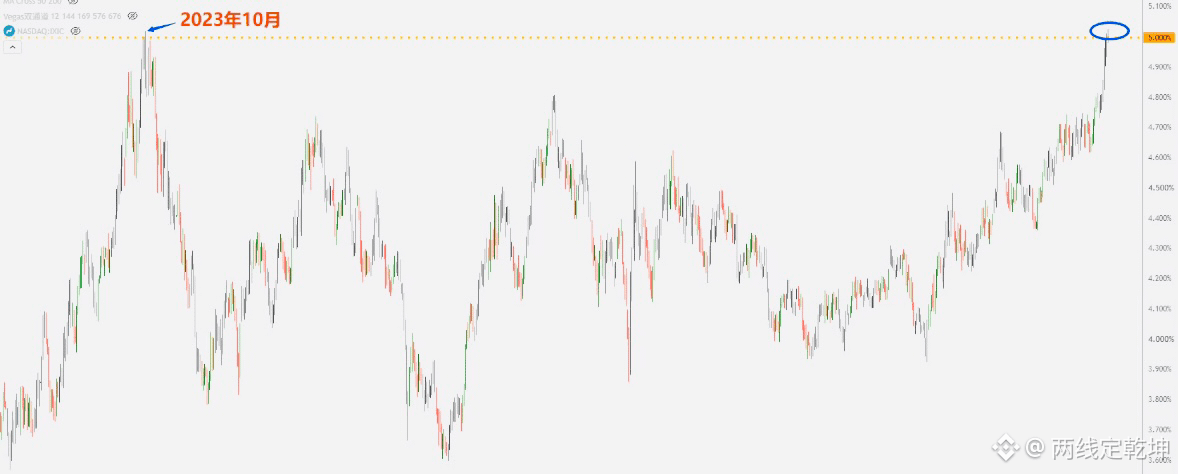
Overall, the core contradiction in the global market today lies in a fierce tug-of-war between “priced-in expectations” and “real-world policy”: whether the Fed will raise rates in September and Waller’s hawkish remarks. Their impact depends heavily on how much the market trusts the Fed’s credibility. The fact that the 10-year U.S. Treasury yield has already broken through 5% is the reality. Moreover, this round is fundamentally different from October 2023—inflation is more stubborn, fiscal pressure is greater, and the dip-buying demand is weaker. Long-end yields are driven more by structural factors such as fiscal deficits and term premia. If yields were to rapidly run out of control and climb, it could trigger a decline in U.S. equities and even a financial crisis. As for Bitcoin, falling sharply to 59,500–$72,500), in the absence of extreme catalysts, it is difficult to reach. In general, the sharp volatility across asset classes is essentially a repricing by the market under constraints on the Fed’s policy space, the accumulation of fiscal risks, and geopolitical inflation pressures. Ultimately, the direction of prices depends on how fast yields rise, whether the Fed can strike a balance between controlling inflation and maintaining financial stability, and whether market trust in policy credibility can be sustained.
Overall, the core contradiction in the global market today lies in a fierce tug-of-war between “priced-in expectations” and “real-world policy”: whether the Fed will raise rates in September and Waller’s hawkish remarks. Their impact depends heavily on how much the market trusts the Fed’s credibility. The fact that the 10-year U.S. Treasury yield has already broken through 5% is the reality. Moreover, this round is fundamentally different from October 2023—inflation is more stubborn, fiscal pressure is greater, and the dip-buying demand is weaker. Long-end yields are driven more by structural factors such as fiscal deficits and term premia. If yields were to rapidly run out of control and climb, it could trigger a decline in U.S. equities and even a financial crisis. As for Bitcoin, falling sharply to 59,500–$72,500), in the absence of extreme catalysts, it is difficult to reach. In general, the sharp volatility across asset classes is essentially a repricing by the market under constraints on the Fed’s policy space, the accumulation of fiscal risks, and geopolitical inflation pressures. Ultimately, the direction of prices depends on how fast yields rise, whether the Fed can strike a balance between controlling inflation and maintaining financial stability, and whether market trust in policy credibility can be sustained.
1
185
·
--
Article
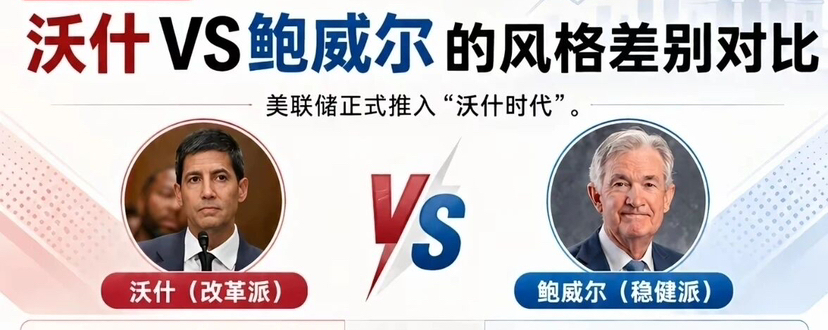
Powell’s tie-breaking decision: the Fed votes 6-6, rates unchangedOn September 17, 2026, the U.S. Federal Reserve’s FOMC ended in a 6-6 tie. The rate-hike agenda was postponed due to an inability to reach consensus, and the federal funds rate was kept unchanged at 3.50%–3.75%. This was the first FOMC vote tie since 1936. Behind it was a rare standoff between the hawks and doves, with both sides holding equal power.
---
A divided committee: how did the 6-6 tie come about?
The central conflict of this meeting lay in the tug-of-war between inflation pressure and a slowdown in employment. At the July meeting, Cleveland Fed President Loretta Mester, Minneapolis Fed President Kashkari, and Dallas Fed President Logan all cast dissenting votes, arguing for a 25-basis-point rate hike—marking the first time in nearly nine years that three votes in the same direction were cast in opposition. Governor Barr also clearly stated in early September that if inflation failed to fall back toward the 2% target at a sufficiently convincing pace, he was prepared to support a rate hike.
Powell’s tie-breaking decision: the Fed votes 6-6, rates unchanged
On September 17, 2026, the U.S. Federal Reserve’s FOMC ended in a 6-6 tie. The rate-hike agenda was postponed due to an inability to reach consensus, and the federal funds rate was kept unchanged at 3.50%–3.75%. This was the first FOMC vote tie since 1936. Behind it was a rare standoff between the hawks and doves, with both sides holding equal power.
---
A divided committee: how did the 6-6 tie come about?
The central conflict of this meeting lay in the tug-of-war between inflation pressure and a slowdown in employment. At the July meeting, Cleveland Fed President Loretta Mester, Minneapolis Fed President Kashkari, and Dallas Fed President Logan all cast dissenting votes, arguing for a 25-basis-point rate hike—marking the first time in nearly nine years that three votes in the same direction were cast in opposition. Governor Barr also clearly stated in early September that if inflation failed to fall back toward the 2% target at a sufficiently convincing pace, he was prepared to support a rate hike.
---
A divided committee: how did the 6-6 tie come about?
The central conflict of this meeting lay in the tug-of-war between inflation pressure and a slowdown in employment. At the July meeting, Cleveland Fed President Loretta Mester, Minneapolis Fed President Kashkari, and Dallas Fed President Logan all cast dissenting votes, arguing for a 25-basis-point rate hike—marking the first time in nearly nine years that three votes in the same direction were cast in opposition. Governor Barr also clearly stated in early September that if inflation failed to fall back toward the 2% target at a sufficiently convincing pace, he was prepared to support a rate hike.
1
2
33
·
--
Verified
$UNITREE Yushu Technology: 60—does it bottom, or will it rebound to 83.6? Key level scenario for a humanoid robot leader
Yushu Technology recently released the world model UnifoLM-X2-1.0, the first globally to achieve fully autonomous humanoid robot fighting—throughout with no remote control or preset scripts, marking a key breakthrough in the decision-making capability of the “brain.” DeepSeek has also taken a strategic stake, further expanding the space for AI–robot collaboration. From a fundamentals perspective, in the first half of 2026 revenue was RMB 1.152 billion, up 48.54%, but non-GAAP net profit declined 19.34%. Shipments were about 5,900 units, with a global share of around 31%—high growth and profit pressure coexist.
Technical analysis shows: the downside target of 70 has been achieved; rebound pressure is at 83.6, with the next target at 66.66. In line with the concept-sector rhythm for Yushu Technology, around 60 is a potential bottoming observation zone. If it rebounds first, around 80 becomes the clear line between bulls and bears—only when trading volume rises and it holds above that level can we expect repair; otherwise it may still pull back to 60. Strategically, the long-term thesis for humanoid robots remains unchanged. Yushu is a core target, but in the short term investors should wait for stabilization signals—staggered entries are better than chasing the price.
$UNITREE Yushu Technology: 60—does it bottom, or will it rebound to 83.6? Key level scenario for a humanoid robot leader
Yushu Technology recently released the world model UnifoLM-X2-1.0, the first globally to achieve fully autonomous humanoid robot fighting—throughout with no remote control or preset scripts, marking a key breakthrough in the decision-making capability of the “brain.” DeepSeek has also taken a strategic stake, further expanding the space for AI–robot collaboration. From a fundamentals perspective, in the first half of 2026 revenue was RMB 1.152 billion, up 48.54%, but non-GAAP net profit declined 19.34%. Shipments were about 5,900 units, with a global share of around 31%—high growth and profit pressure coexist.
Technical analysis shows: the downside target of 70 has been achieved; rebound pressure is at 83.6, with the next target at 66.66. In line with the concept-sector rhythm for Yushu Technology, around 60 is a potential bottoming observation zone. If it rebounds first, around 80 becomes the clear line between bulls and bears—only when trading volume rises and it holds above that level can we expect repair; otherwise it may still pull back to 60. Strategically, the long-term thesis for humanoid robots remains unchanged. Yushu is a core target, but in the short term investors should wait for stabilization signals—staggered entries are better than chasing the price.
Yushu Technology recently released the world model UnifoLM-X2-1.0, the first globally to achieve fully autonomous humanoid robot fighting—throughout with no remote control or preset scripts, marking a key breakthrough in the decision-making capability of the “brain.” DeepSeek has also taken a strategic stake, further expanding the space for AI–robot collaboration. From a fundamentals perspective, in the first half of 2026 revenue was RMB 1.152 billion, up 48.54%, but non-GAAP net profit declined 19.34%. Shipments were about 5,900 units, with a global share of around 31%—high growth and profit pressure coexist.
Technical analysis shows: the downside target of 70 has been achieved; rebound pressure is at 83.6, with the next target at 66.66. In line with the concept-sector rhythm for Yushu Technology, around 60 is a potential bottoming observation zone. If it rebounds first, around 80 becomes the clear line between bulls and bears—only when trading volume rises and it holds above that level can we expect repair; otherwise it may still pull back to 60. Strategically, the long-term thesis for humanoid robots remains unchanged. Yushu is a core target, but in the short term investors should wait for stabilization signals—staggered entries are better than chasing the price.
2
1.1k
·
--

Article
LITE in-depth research report: the submarine cable rejuvenation cycle × monopolistic positioning of lasersI. Investment summary
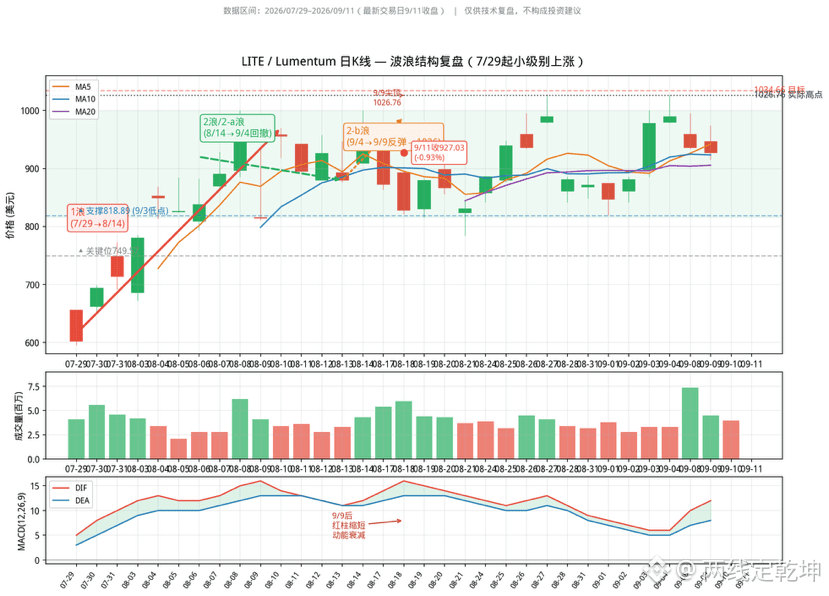
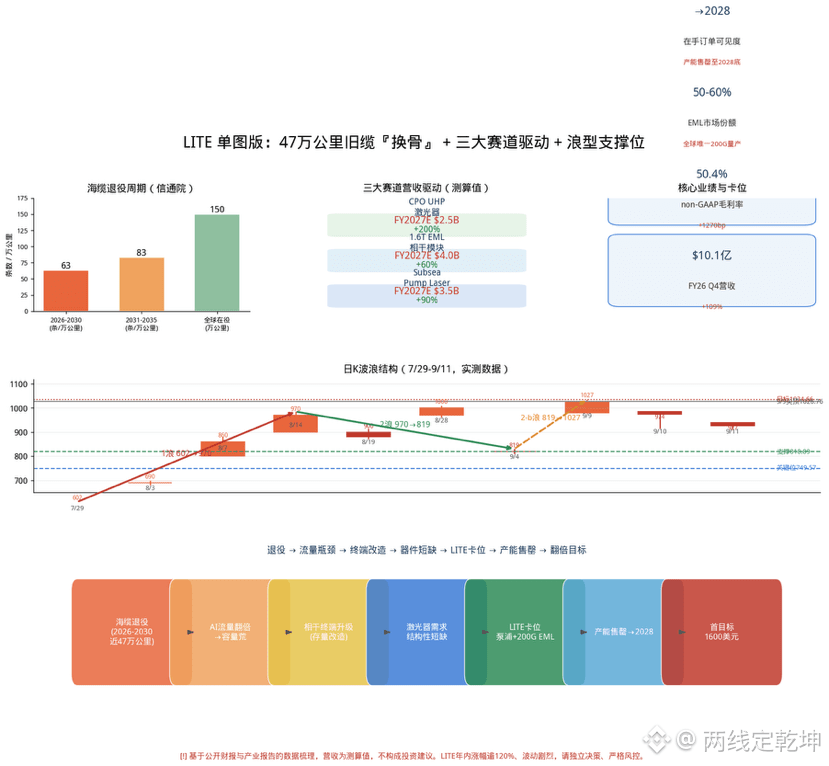
Investment recommendation: maintain a positive watch on LITE. The company sits at the core of the dual demand drivers of a global submarine cable “rejuvenation” cycle and the upgrade of AI optical interconnects. With its monopolistic positioning in InP pump lasers and 200G EML coherent optical chips, the visibility of outstanding orders extends to 2028, and capacity is sold out. Based on the wave structure starting from July 29, the target for Wave 1 at $1,034.66 closely matches the actual high of $1,026.76. After the pullback is completed, the first target range for restarting the upward wave is around $1,600.
Core logic: from 2026 to 2030, around 470,000 kilometers (146 routes) of old submarine cables will be concentrated in retirement. Demand is “bottlenecked” on core routes such as within Asia and Europe–North America, with the lit-capacity share exceeding 50%, forming a structural capacity shortage. For upgrades of existing infrastructure, coherent terminals and amplifiers must be replaced. The key component in amplifiers is precisely LITE’s InP laser, resulting in structural supply shortages.
LITE in-depth research report: the submarine cable rejuvenation cycle × monopolistic positioning of lasers
I. Investment summary
Investment recommendation: maintain a positive watch on LITE. The company sits at the core of the dual demand drivers of a global submarine cable “rejuvenation” cycle and the upgrade of AI optical interconnects. With its monopolistic positioning in InP pump lasers and 200G EML coherent optical chips, the visibility of outstanding orders extends to 2028, and capacity is sold out. Based on the wave structure starting from July 29, the target for Wave 1 at $1,034.66 closely matches the actual high of $1,026.76. After the pullback is completed, the first target range for restarting the upward wave is around $1,600.
Core logic: from 2026 to 2030, around 470,000 kilometers (146 routes) of old submarine cables will be concentrated in retirement. Demand is “bottlenecked” on core routes such as within Asia and Europe–North America, with the lit-capacity share exceeding 50%, forming a structural capacity shortage. For upgrades of existing infrastructure, coherent terminals and amplifiers must be replaced. The key component in amplifiers is precisely LITE’s InP laser, resulting in structural supply shortages.
Investment recommendation: maintain a positive watch on LITE. The company sits at the core of the dual demand drivers of a global submarine cable “rejuvenation” cycle and the upgrade of AI optical interconnects. With its monopolistic positioning in InP pump lasers and 200G EML coherent optical chips, the visibility of outstanding orders extends to 2028, and capacity is sold out. Based on the wave structure starting from July 29, the target for Wave 1 at $1,034.66 closely matches the actual high of $1,026.76. After the pullback is completed, the first target range for restarting the upward wave is around $1,600.
Core logic: from 2026 to 2030, around 470,000 kilometers (146 routes) of old submarine cables will be concentrated in retirement. Demand is “bottlenecked” on core routes such as within Asia and Europe–North America, with the lit-capacity share exceeding 50%, forming a structural capacity shortage. For upgrades of existing infrastructure, coherent terminals and amplifiers must be replaced. The key component in amplifiers is precisely LITE’s InP laser, resulting in structural supply shortages.
7
2
75
·
--
$LITE 47万 km old cables begin “bone replacement”: LITE’s laser scalpel slices toward 800 billion
• Base layer: from 2026 to 2030, nearly 470,000 km of subsea cables will be centrally retired; they are stuck on core routers, with bright capacity exceeding 50%, creating a structural “capacity shortage”;
• Location: while others lay cables, LITE sells the “heart” — an InP pump laser + 200G EML monopoly; with orders visible through 2028 and capacity sold out;
• Technicals: Wave 1 target 1034 ≈ actual 1026; the 9/9 spike-top narrows and the volume contracts, pulling back to complete the retracement and restart the rise wave’s first target
$LITE 47万 km old cables begin “bone replacement”: LITE’s laser scalpel slices toward 800 billion
• Base layer: from 2026 to 2030, nearly 470,000 km of subsea cables will be centrally retired; they are stuck on core routers, with bright capacity exceeding 50%, creating a structural “capacity shortage”;
• Location: while others lay cables, LITE sells the “heart” — an InP pump laser + 200G EML monopoly; with orders visible through 2028 and capacity sold out;
• Technicals: Wave 1 target 1034 ≈ actual 1026; the 9/9 spike-top narrows and the volume contracts, pulling back to complete the retracement and restart the rise wave’s first target
• Base layer: from 2026 to 2030, nearly 470,000 km of subsea cables will be centrally retired; they are stuck on core routers, with bright capacity exceeding 50%, creating a structural “capacity shortage”;
• Location: while others lay cables, LITE sells the “heart” — an InP pump laser + 200G EML monopoly; with orders visible through 2028 and capacity sold out;
• Technicals: Wave 1 target 1034 ≈ actual 1026; the 9/9 spike-top narrows and the volume contracts, pulling back to complete the retracement and restart the rise wave’s first target
4
1
345
·
--
Bullish
$XAU Gold prices have sharply adjusted by a thousand points: Is it a bubble burst, or is the 'gold pit' reappearing?
Recently, gold has rapidly retreated more than $1000 from its high, and such drastic fluctuations undoubtedly make the market uneasy. However, this round of selling is not due to a collapse in fundamentals but is more like a 'de-bubbling' process triggered by position adjustments and forced liquidations. Traditional driving factors such as bond yields and the dollar can only explain about $200 of the decline, which means that the rest of the drop is more about liquidity selling under market pressure—this pattern of 'selling gold to replenish positions' during volatility is historically not uncommon.
Currently, the market may be overestimating the likelihood of aggressive rate hikes. Faced with inflation primarily driven by supply-side factors, policymakers may be more inclined to watch and wait rather than aggressively tighten at the cost of growth, and this macro environment will ultimately support gold prices. Meanwhile, geopolitical risks often initially cause gold prices to fall before rising, and as uncertainty continues, its safe-haven value will again become prominent.
Therefore, this adjustment is creating a highly attractive entry point. Strong fundamentals mean that gold prices currently appear 'cheap,' making this a long-awaited opportunity for those on the sidelines. Basic models indicate that gold prices are expected to aim for $5020 by the end of the year, while upward risks may push it to reach the $6000 level.
From a broader asset allocation perspective, commodities are entering a favorable cycle. It is recommended to allocate 15%-20% of traditional portfolios to commodities, with about 20% of that directed towards precious metals. The current deep adjustment in gold may be a strategic layout window that investors should not miss.
$XAU Gold prices have sharply adjusted by a thousand points: Is it a bubble burst, or is the 'gold pit' reappearing?
Recently, gold has rapidly retreated more than $1000 from its high, and such drastic fluctuations undoubtedly make the market uneasy. However, this round of selling is not due to a collapse in fundamentals but is more like a 'de-bubbling' process triggered by position adjustments and forced liquidations. Traditional driving factors such as bond yields and the dollar can only explain about $200 of the decline, which means that the rest of the drop is more about liquidity selling under market pressure—this pattern of 'selling gold to replenish positions' during volatility is historically not uncommon.
Currently, the market may be overestimating the likelihood of aggressive rate hikes. Faced with inflation primarily driven by supply-side factors, policymakers may be more inclined to watch and wait rather than aggressively tighten at the cost of growth, and this macro environment will ultimately support gold prices. Meanwhile, geopolitical risks often initially cause gold prices to fall before rising, and as uncertainty continues, its safe-haven value will again become prominent.
Therefore, this adjustment is creating a highly attractive entry point. Strong fundamentals mean that gold prices currently appear 'cheap,' making this a long-awaited opportunity for those on the sidelines. Basic models indicate that gold prices are expected to aim for $5020 by the end of the year, while upward risks may push it to reach the $6000 level.
From a broader asset allocation perspective, commodities are entering a favorable cycle. It is recommended to allocate 15%-20% of traditional portfolios to commodities, with about 20% of that directed towards precious metals. The current deep adjustment in gold may be a strategic layout window that investors should not miss.
Recently, gold has rapidly retreated more than $1000 from its high, and such drastic fluctuations undoubtedly make the market uneasy. However, this round of selling is not due to a collapse in fundamentals but is more like a 'de-bubbling' process triggered by position adjustments and forced liquidations. Traditional driving factors such as bond yields and the dollar can only explain about $200 of the decline, which means that the rest of the drop is more about liquidity selling under market pressure—this pattern of 'selling gold to replenish positions' during volatility is historically not uncommon.
Currently, the market may be overestimating the likelihood of aggressive rate hikes. Faced with inflation primarily driven by supply-side factors, policymakers may be more inclined to watch and wait rather than aggressively tighten at the cost of growth, and this macro environment will ultimately support gold prices. Meanwhile, geopolitical risks often initially cause gold prices to fall before rising, and as uncertainty continues, its safe-haven value will again become prominent.
Therefore, this adjustment is creating a highly attractive entry point. Strong fundamentals mean that gold prices currently appear 'cheap,' making this a long-awaited opportunity for those on the sidelines. Basic models indicate that gold prices are expected to aim for $5020 by the end of the year, while upward risks may push it to reach the $6000 level.
From a broader asset allocation perspective, commodities are entering a favorable cycle. It is recommended to allocate 15%-20% of traditional portfolios to commodities, with about 20% of that directed towards precious metals. The current deep adjustment in gold may be a strategic layout window that investors should not miss.
1
361
·
--
The dentist will make achievements tonight
The dentist will make achievements tonight

拾荒弟
·
--
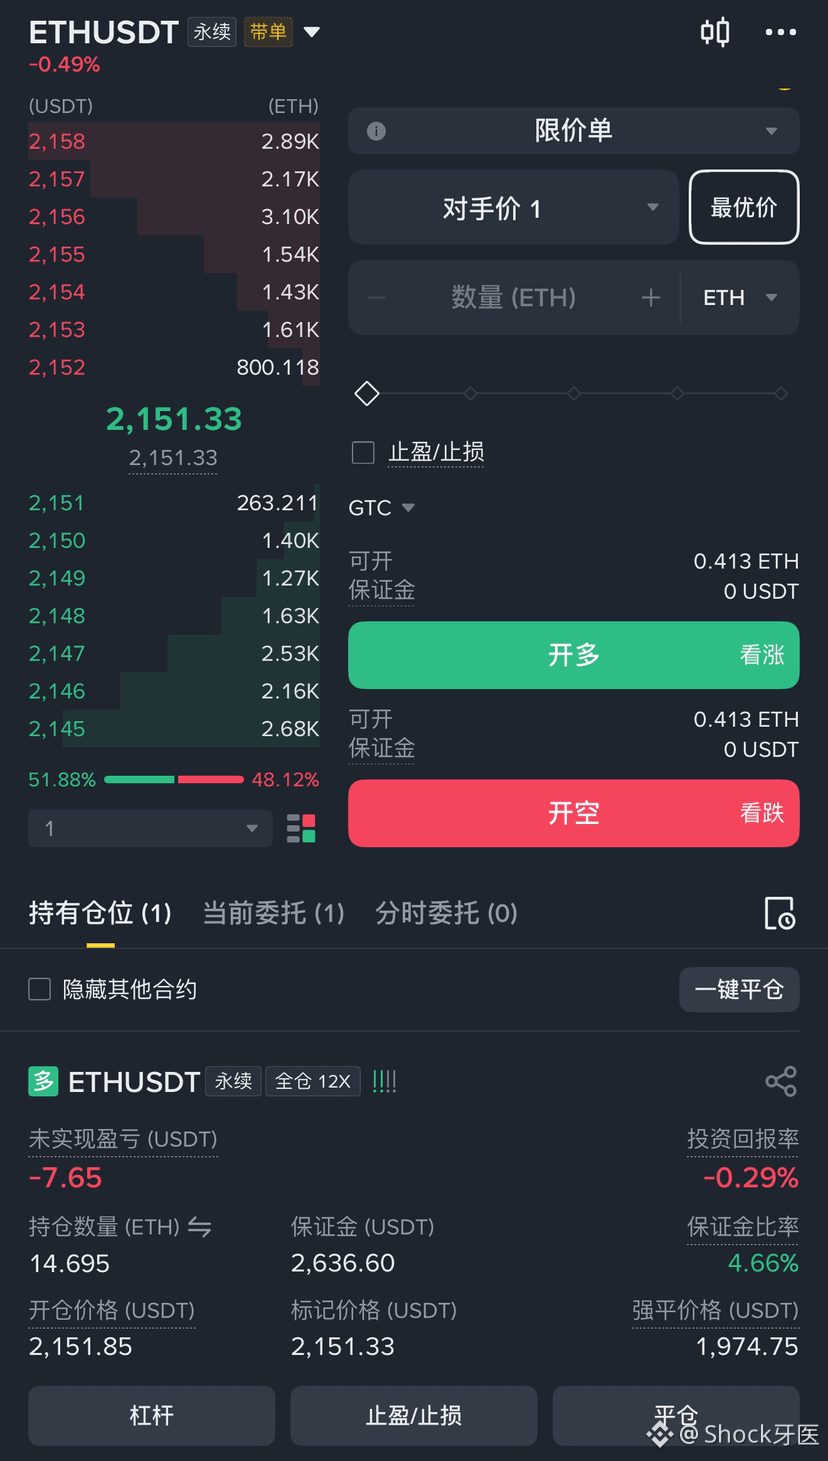
BullishBrothers, we've already gone all in on the long position
Is there still hope? The forced liquidation price of 1974 might explode the 100WU principal
The cost of 2151
Is there still hope? The forced liquidation price of 1974 might explode the 100WU principal
The cost of 2151
1
·
--
Geopolitical 'nuclear bomb' ignites gold surge! From $3600 to $10,000, the April options showdown is imminent, can market makers force a short squeeze for self-rescue?The battle for the island between the US and Iran in April became a watershed moment for this round of gold market trends. Geopolitical conflicts once triggered liquidity sell-offs, and gold prices completed a bottoming out in panic. Subsequently, with the new chairman of the Federal Reserve, Jerome Powell, taking office, market expectations for interest rate cuts rose rapidly, combined with the ongoing escalation of the situation in the Middle East, gold began its upward journey from the bottom towards the 10,000 yuan mark. As April options approach expiration, whether market makers can complete 'capital absorption' at the $3600 mark has become the focus of the current market.
1. Market Review: Geopolitical games repeat, gold prices rise and fall.
Geopolitical 'nuclear bomb' ignites gold surge! From $3600 to $10,000, the April options showdown is imminent, can market makers force a short squeeze for self-rescue?
The battle for the island between the US and Iran in April became a watershed moment for this round of gold market trends. Geopolitical conflicts once triggered liquidity sell-offs, and gold prices completed a bottoming out in panic. Subsequently, with the new chairman of the Federal Reserve, Jerome Powell, taking office, market expectations for interest rate cuts rose rapidly, combined with the ongoing escalation of the situation in the Middle East, gold began its upward journey from the bottom towards the 10,000 yuan mark. As April options approach expiration, whether market makers can complete 'capital absorption' at the $3600 mark has become the focus of the current market.
1. Market Review: Geopolitical games repeat, gold prices rise and fall.
1. Market Review: Geopolitical games repeat, gold prices rise and fall.
2
131
·
--
When the cannon fires, millions of accounts explode, returning to 1975
When the cannon fires, millions of accounts explode, returning to 1975
2
4
161
·
--
Article
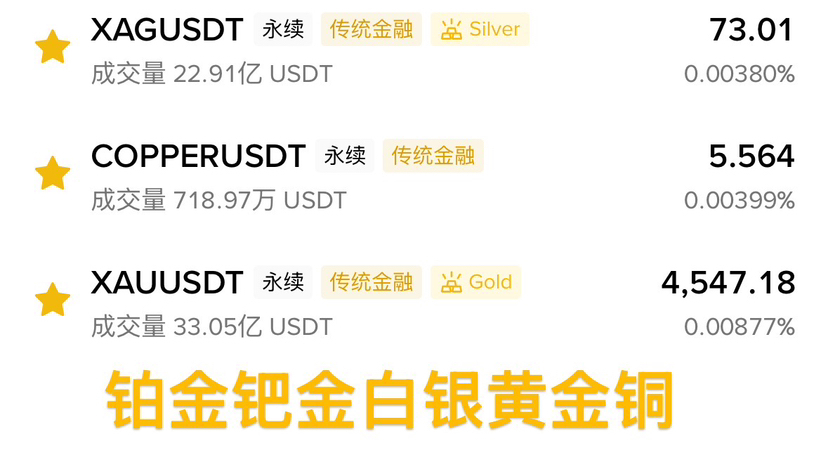
Warsh's Rate Cut Sparks Silver Surge: The Front-Runner in the Flood of Liquidity$XAG The darkest moments of the market often give birth to the most dazzling reversals.
When Kevin Warsh—this senior official who once served as a Federal Reserve governor and understands monetary policy well—was expected by the market to lead the Federal Reserve towards easing, a profound reconstruction of asset prices had already begun. For silver, this is not just the start of another policy cycle, but the starting point of an epic reversal from 'liquidity drought' to 'liquidity flood'.
Just a few days ago, the precious metals market was still immersed in a wave of pessimistic selling. As Ole Hansen, a commodity analyst at Saxo Bank, pointed out in his research on March 25, international spot gold and silver are facing considerable pressure. This pressure does not stem from a fundamental shift in their long-term strategic logic but rather from a more short-term and brutal reality: liquidity demand.
Warsh's Rate Cut Sparks Silver Surge: The Front-Runner in the Flood of Liquidity
$XAG The darkest moments of the market often give birth to the most dazzling reversals.
When Kevin Warsh—this senior official who once served as a Federal Reserve governor and understands monetary policy well—was expected by the market to lead the Federal Reserve towards easing, a profound reconstruction of asset prices had already begun. For silver, this is not just the start of another policy cycle, but the starting point of an epic reversal from 'liquidity drought' to 'liquidity flood'.
Just a few days ago, the precious metals market was still immersed in a wave of pessimistic selling. As Ole Hansen, a commodity analyst at Saxo Bank, pointed out in his research on March 25, international spot gold and silver are facing considerable pressure. This pressure does not stem from a fundamental shift in their long-term strategic logic but rather from a more short-term and brutal reality: liquidity demand.
When Kevin Warsh—this senior official who once served as a Federal Reserve governor and understands monetary policy well—was expected by the market to lead the Federal Reserve towards easing, a profound reconstruction of asset prices had already begun. For silver, this is not just the start of another policy cycle, but the starting point of an epic reversal from 'liquidity drought' to 'liquidity flood'.
Just a few days ago, the precious metals market was still immersed in a wave of pessimistic selling. As Ole Hansen, a commodity analyst at Saxo Bank, pointed out in his research on March 25, international spot gold and silver are facing considerable pressure. This pressure does not stem from a fundamental shift in their long-term strategic logic but rather from a more short-term and brutal reality: liquidity demand.
1
342
·
--
Wash first cuts rates then reduces the balance sheet, after the war ends, combined with rate cuts leading to a violent surge, and after the US midterm elections, combined with high inflation to reduce the balance sheet again.Volvo moment casts a shadow over gold, which may evolve into a long-term adjustment after the plunge.
International spot gold plummeted to the $4100 mark on Monday, marking the lowest level since the end of 2025, with a cumulative decline of over 17% within just five trading days, becoming one of the most severe short-term declines in over forty years. Although news of the United States willing to negotiate prompted a significant rebound in gold prices from the day's low, the previous plunge has clearly outlined a fundamental shift in market narratives: expectations of tighter monetary policy have regained dominance, while long-term themes that previously supported gold prices, such as de-dollarization, fiscal risks, and trade uncertainties, have been temporarily relegated to a secondary position.
Wash first cuts rates then reduces the balance sheet, after the war ends, combined with rate cuts leading to a violent surge, and after the US midterm elections, combined with high inflation to reduce the balance sheet again.
Volvo moment casts a shadow over gold, which may evolve into a long-term adjustment after the plunge.
International spot gold plummeted to the $4100 mark on Monday, marking the lowest level since the end of 2025, with a cumulative decline of over 17% within just five trading days, becoming one of the most severe short-term declines in over forty years. Although news of the United States willing to negotiate prompted a significant rebound in gold prices from the day's low, the previous plunge has clearly outlined a fundamental shift in market narratives: expectations of tighter monetary policy have regained dominance, while long-term themes that previously supported gold prices, such as de-dollarization, fiscal risks, and trade uncertainties, have been temporarily relegated to a secondary position.
International spot gold plummeted to the $4100 mark on Monday, marking the lowest level since the end of 2025, with a cumulative decline of over 17% within just five trading days, becoming one of the most severe short-term declines in over forty years. Although news of the United States willing to negotiate prompted a significant rebound in gold prices from the day's low, the previous plunge has clearly outlined a fundamental shift in market narratives: expectations of tighter monetary policy have regained dominance, while long-term themes that previously supported gold prices, such as de-dollarization, fiscal risks, and trade uncertainties, have been temporarily relegated to a secondary position.
112
·
--
$XAU Gold faces short-term pressure, while traditional support factors will return
From the perspective of gold's response function, the current market is rapidly anticipating that central banks will prioritize controlling inflation rather than supporting economic growth, which places the trajectory of gold between the oil crisis of the 1970s and the Volcker era. Rising energy prices have not only triggered inflation concerns but have also given rise to stagflation risks. Interest rate pricing has swiftly shifted from the expectation of two and a half rate cuts in February to the current pricing of probabilities for rate hikes before the end of the year. The rise in nominal bond yields and the strengthening of the dollar together constitute a typical unfavorable short-term environment. Meanwhile, a reduction in investor holdings has exacerbated the price decline—gold exchange-traded funds reduced their holdings by about 62 tons in March, nearly erasing the gains made since the beginning of the year. In addition, the physical demand channels represented by the Middle East have also been impacted by regional conflicts, further adding downward pressure.
However, investors need to distinguish between short-term resistance and long-term logic. The best-performing phases for gold usually occur when growth expectations decline and central banks turn to rate cuts, which drives real yields lower—this scenario often appears in the second phase of a crisis. The challenge brought by the current energy shock is that slowing growth coexists with persistent inflation, limiting the current space for policy easing. As the market gradually adapts to expectations of higher interest rates and a strong dollar, gold's typical early-cycle hedging role is facing pressure, but this does not signify a failure of its safe-haven function; rather, it is a delay. When growth further weakens and policy constraints are forced to ease, gold's traditional support factors—declining real yields, increased liquidity, and rising uncertainty—will return.
Therefore, the current decline should not be simply interpreted as a loss of value, but rather seen as an adjustment period within gold's long-term upward trajectory. While short-term resistance exists, its nature is temporary. As global economic growth may slow due to current pressures, some factors weighing on gold will subsequently reverse. From this perspective, gold's enduring role as a hedging tool and an important instrument for portfolio diversification remains unchanged, and the current price level may actually present an attractive positioning opportunity for investors with a long-term view. We expect gold prices to reach $6,500 per ounce by early 2027.
$XAU Gold faces short-term pressure, while traditional support factors will return
From the perspective of gold's response function, the current market is rapidly anticipating that central banks will prioritize controlling inflation rather than supporting economic growth, which places the trajectory of gold between the oil crisis of the 1970s and the Volcker era. Rising energy prices have not only triggered inflation concerns but have also given rise to stagflation risks. Interest rate pricing has swiftly shifted from the expectation of two and a half rate cuts in February to the current pricing of probabilities for rate hikes before the end of the year. The rise in nominal bond yields and the strengthening of the dollar together constitute a typical unfavorable short-term environment. Meanwhile, a reduction in investor holdings has exacerbated the price decline—gold exchange-traded funds reduced their holdings by about 62 tons in March, nearly erasing the gains made since the beginning of the year. In addition, the physical demand channels represented by the Middle East have also been impacted by regional conflicts, further adding downward pressure.
However, investors need to distinguish between short-term resistance and long-term logic. The best-performing phases for gold usually occur when growth expectations decline and central banks turn to rate cuts, which drives real yields lower—this scenario often appears in the second phase of a crisis. The challenge brought by the current energy shock is that slowing growth coexists with persistent inflation, limiting the current space for policy easing. As the market gradually adapts to expectations of higher interest rates and a strong dollar, gold's typical early-cycle hedging role is facing pressure, but this does not signify a failure of its safe-haven function; rather, it is a delay. When growth further weakens and policy constraints are forced to ease, gold's traditional support factors—declining real yields, increased liquidity, and rising uncertainty—will return.
Therefore, the current decline should not be simply interpreted as a loss of value, but rather seen as an adjustment period within gold's long-term upward trajectory. While short-term resistance exists, its nature is temporary. As global economic growth may slow due to current pressures, some factors weighing on gold will subsequently reverse. From this perspective, gold's enduring role as a hedging tool and an important instrument for portfolio diversification remains unchanged, and the current price level may actually present an attractive positioning opportunity for investors with a long-term view. We expect gold prices to reach $6,500 per ounce by early 2027.
From the perspective of gold's response function, the current market is rapidly anticipating that central banks will prioritize controlling inflation rather than supporting economic growth, which places the trajectory of gold between the oil crisis of the 1970s and the Volcker era. Rising energy prices have not only triggered inflation concerns but have also given rise to stagflation risks. Interest rate pricing has swiftly shifted from the expectation of two and a half rate cuts in February to the current pricing of probabilities for rate hikes before the end of the year. The rise in nominal bond yields and the strengthening of the dollar together constitute a typical unfavorable short-term environment. Meanwhile, a reduction in investor holdings has exacerbated the price decline—gold exchange-traded funds reduced their holdings by about 62 tons in March, nearly erasing the gains made since the beginning of the year. In addition, the physical demand channels represented by the Middle East have also been impacted by regional conflicts, further adding downward pressure.
However, investors need to distinguish between short-term resistance and long-term logic. The best-performing phases for gold usually occur when growth expectations decline and central banks turn to rate cuts, which drives real yields lower—this scenario often appears in the second phase of a crisis. The challenge brought by the current energy shock is that slowing growth coexists with persistent inflation, limiting the current space for policy easing. As the market gradually adapts to expectations of higher interest rates and a strong dollar, gold's typical early-cycle hedging role is facing pressure, but this does not signify a failure of its safe-haven function; rather, it is a delay. When growth further weakens and policy constraints are forced to ease, gold's traditional support factors—declining real yields, increased liquidity, and rising uncertainty—will return.
Therefore, the current decline should not be simply interpreted as a loss of value, but rather seen as an adjustment period within gold's long-term upward trajectory. While short-term resistance exists, its nature is temporary. As global economic growth may slow due to current pressures, some factors weighing on gold will subsequently reverse. From this perspective, gold's enduring role as a hedging tool and an important instrument for portfolio diversification remains unchanged, and the current price level may actually present an attractive positioning opportunity for investors with a long-term view. We expect gold prices to reach $6,500 per ounce by early 2027.
1
352
·
--
If a war breaks out over the island five days later, the silver market will continue to experience significant volatility, and this condition being met may drive silver prices to rise rapidly.$XAG On Tuesday, the silver market showed a slight decline, briefly falling below the $70 threshold during the session, but quickly regained buying support, indicating intense competition between bulls and bears near this level. Notably, the hammer candlestick pattern formed on Monday's chart was quite striking, and this technical signal, which usually indicates bottom support, has drawn widespread attention from market participants. From the performance on Tuesday, the market at least showed an attempt to replicate the rebound seen the previous day. Technically, if it can successfully break through the upper edge of the $70 threshold, silver prices are expected to further challenge the next key resistance level located around $80.
If a war breaks out over the island five days later, the silver market will continue to experience significant volatility, and this condition being met may drive silver prices to rise rapidly.
$XAG On Tuesday, the silver market showed a slight decline, briefly falling below the $70 threshold during the session, but quickly regained buying support, indicating intense competition between bulls and bears near this level. Notably, the hammer candlestick pattern formed on Monday's chart was quite striking, and this technical signal, which usually indicates bottom support, has drawn widespread attention from market participants. From the performance on Tuesday, the market at least showed an attempt to replicate the rebound seen the previous day. Technically, if it can successfully break through the upper edge of the $70 threshold, silver prices are expected to further challenge the next key resistance level located around $80.
305
·
--
After the end of the U.S.-Iran war, precious metals are expected to dip before jumping, with gold possibly rebounding rapidly at $3,500.Recently, there has been a dramatic shift in the international geopolitical landscape. With the substantial change in the U.S. government's diplomatic approach, the tensions with Iran have eased, and market concerns about large-scale conflict have temporarily dissipated. However, for precious metal investors, the real storm may not come from geopolitics itself but from the undercurrents hidden within the global financial system. We believe that the short-term recovery trend of international spot gold may only be a temporary phenomenon, and before a new bull market truly begins, the market must first undergo a brutal 'deep squat' washout.
After the end of the U.S.-Iran war, precious metals are expected to dip before jumping, with gold possibly rebounding rapidly at $3,500.
Recently, there has been a dramatic shift in the international geopolitical landscape. With the substantial change in the U.S. government's diplomatic approach, the tensions with Iran have eased, and market concerns about large-scale conflict have temporarily dissipated. However, for precious metal investors, the real storm may not come from geopolitics itself but from the undercurrents hidden within the global financial system. We believe that the short-term recovery trend of international spot gold may only be a temporary phenomenon, and before a new bull market truly begins, the market must first undergo a brutal 'deep squat' washout.
336
·
--
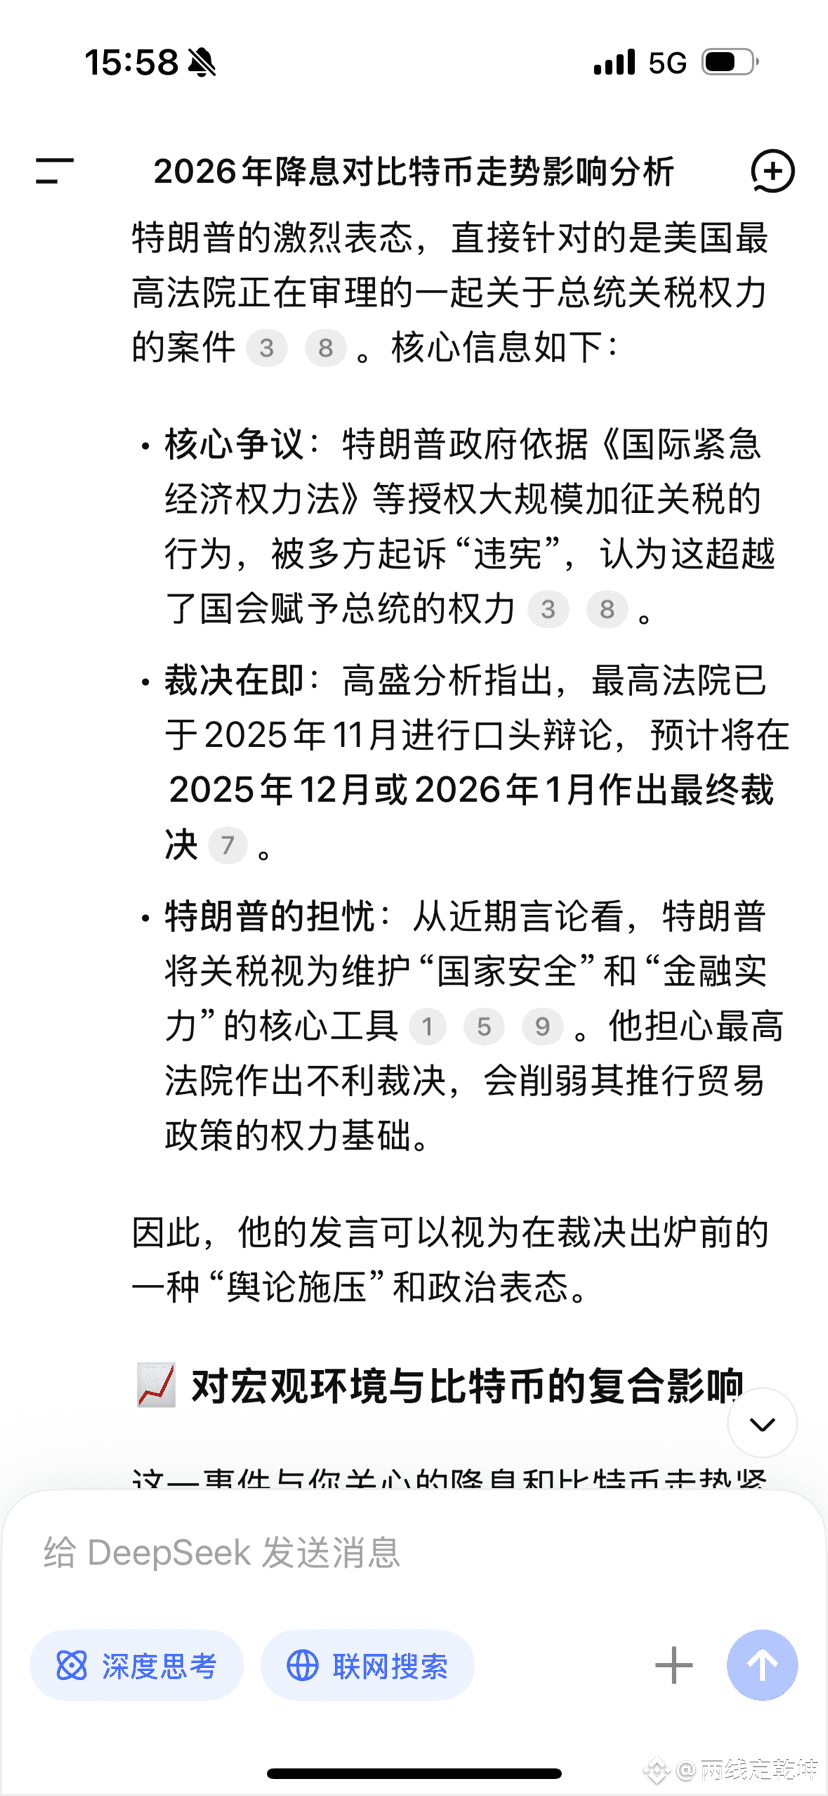
If found illegal, risk assets like Bitcoin, the Nasdaq will soar, and gold will plummet.
It is anticipated that the current cited regulations are illegal, so the judgment will be overturned. Then, other regulations will be cited again, continuing to collect taxes.~Again➡️is a double kill.
If found illegal, risk assets like Bitcoin, the Nasdaq will soar, and gold will plummet.
It is anticipated that the current cited regulations are illegal, so the judgment will be overturned. Then, other regulations will be cited again, continuing to collect taxes.~Again➡️is a double kill.
It is anticipated that the current cited regulations are illegal, so the judgment will be overturned. Then, other regulations will be cited again, continuing to collect taxes.~Again➡️is a double kill.
2
319
·
--
【Federal Reserve Interest Rate Decision (Upper Limit) in the U.S. as of December 10】
Previous Value: 4.00% Expected: 3.75% Published Value: Not Released
Jin10 Data Importance Rating: ★★★★★
Data Release Time: December 11, 2025 03:00
【Federal Reserve Interest Rate Decision (Upper Limit) in the U.S. as of December 10】
Previous Value: 4.00% Expected: 3.75% Published Value: Not Released
Jin10 Data Importance Rating: ★★★★★
Data Release Time: December 11, 2025 03:00
Previous Value: 4.00% Expected: 3.75% Published Value: Not Released
Jin10 Data Importance Rating: ★★★★★
Data Release Time: December 11, 2025 03:00

混沌科技
·
--
Bullish$ALLO still optimistic about new coins, can go long at 0.17, many altcoins are stirring at this node, a careless mistake might lead to missing out on a sell! But opportunities are for those who are prepared, keeping up with the market rhythm without falling behind is the main theme! Don't set your targets too low, around 0.205 is where you can clear out!
3
Log in to explore more content
Join global crypto users on Binance Square
⚡️ Get latest and useful information about crypto.
💬 Trusted by the world’s largest crypto exchange.
👍 Discover real insights from verified creators.
Email / Phone number
Trending Topics
BOJRaisesRatesTo31YearHigh
3,541 views
187 Discussing
#BOJRaisesRatesTo31YearHigh
🇯🇵 Bank of Japan Raises Rate to 1.25%
📈 On September 18, the Bank of Japan raised its policy rate by 25 bps to 1.25%, reportedly the highest level since 1995.
💴 A stronger yen and potential carry-trade adjustments could tighten global liquidity and increase short-term volatility across risk assets, including crypto.
⚠️ The move is not automatically bearish for crypto. The impact will depend on the yen, Japanese bond yields, global dollar liquidity, and overall risk appetite.
👀 Could tighter Japanese monetary policy increase crypto volatility?
#Bitcoin #BankOfJapan #CryptoMarkets #GlobalLiquidity
CrypVexa
·0 Likes
·14 views
XRPExchangeReservesHitSevenYearLow
54 views
27 Discussing
HKCompletesFirstHKDStablecoinUseCase
24,084 views
594 Discussing