

1heartmanyfeelings
10 Posts

1heartmanyfeelings
Report
Block User
0 Following
0 Followers
0 Liked
Posts
⚡ “Rapid Riser” sounds exciting. But what do the charts say?
Two low-cap tokens are trending on Binance today, and both are worth a second look before you click. $SYN $TRB
😳 SYN (~$0.157, +0.9%): The cross-chain bridge token is up slightly today, but it fell about 15% over the past week, and trading volume has been drying up. Market cap is only ~$35–40M. Its all-time high is $4.53, so it’s still deep underwater. In July it dropped over 80%.
🤑 TRB (~$16.92, +3.2%): Tellor spiked to $23.34 on Oct 6 on heavy volume, then fully reversed within two days. It now sits below its mid-October lows near $17.2. With a market cap near $50–55M and roughly 2.8M tokens in circulation, small orders can move the price a lot.
What to take from this:
Tags show attention, not direction.
Neither token has a clear new catalyst I could find.
Thin liquidity means wide swings, up and down.
If you’re researching either one, check volume, the order book depth and past spikes. Never size a position bigger than you can afford to lose.
Tap SYN or TRB to see the live chart.
{spot}(SYNUSDT)
{spot}(TRBUSDT)
Are you watching these two or skipping micro-caps? 👇
Disclosure: I may earn commissions from trades made through links or widgets in my posts (Binance Write to Earn / referral programs). This is analysis, not financial advice, and nothing here guarantees any outcome.
#SYN #TRB #Crypto #Binance #Trading
⚡ “Rapid Riser” sounds exciting. But what do the charts say?
Two low-cap tokens are trending on Binance today, and both are worth a second look before you click. $SYN $TRB
😳 SYN (~$0.157, +0.9%): The cross-chain bridge token is up slightly today, but it fell about 15% over the past week, and trading volume has been drying up. Market cap is only ~$35–40M. Its all-time high is $4.53, so it’s still deep underwater. In July it dropped over 80%.
🤑 TRB (~$16.92, +3.2%): Tellor spiked to $23.34 on Oct 6 on heavy volume, then fully reversed within two days. It now sits below its mid-October lows near $17.2. With a market cap near $50–55M and roughly 2.8M tokens in circulation, small orders can move the price a lot.
What to take from this:
Tags show attention, not direction.
Neither token has a clear new catalyst I could find.
Thin liquidity means wide swings, up and down.
If you’re researching either one, check volume, the order book depth and past spikes. Never size a position bigger than you can afford to lose.
Tap SYN or TRB to see the live chart.
Are you watching these two or skipping micro-caps? 👇
Disclosure: I may earn commissions from trades made through links or widgets in my posts (Binance Write to Earn / referral programs). This is analysis, not financial advice, and nothing here guarantees any outcome.
#SYN #TRB #Crypto #Binance #Trading
276
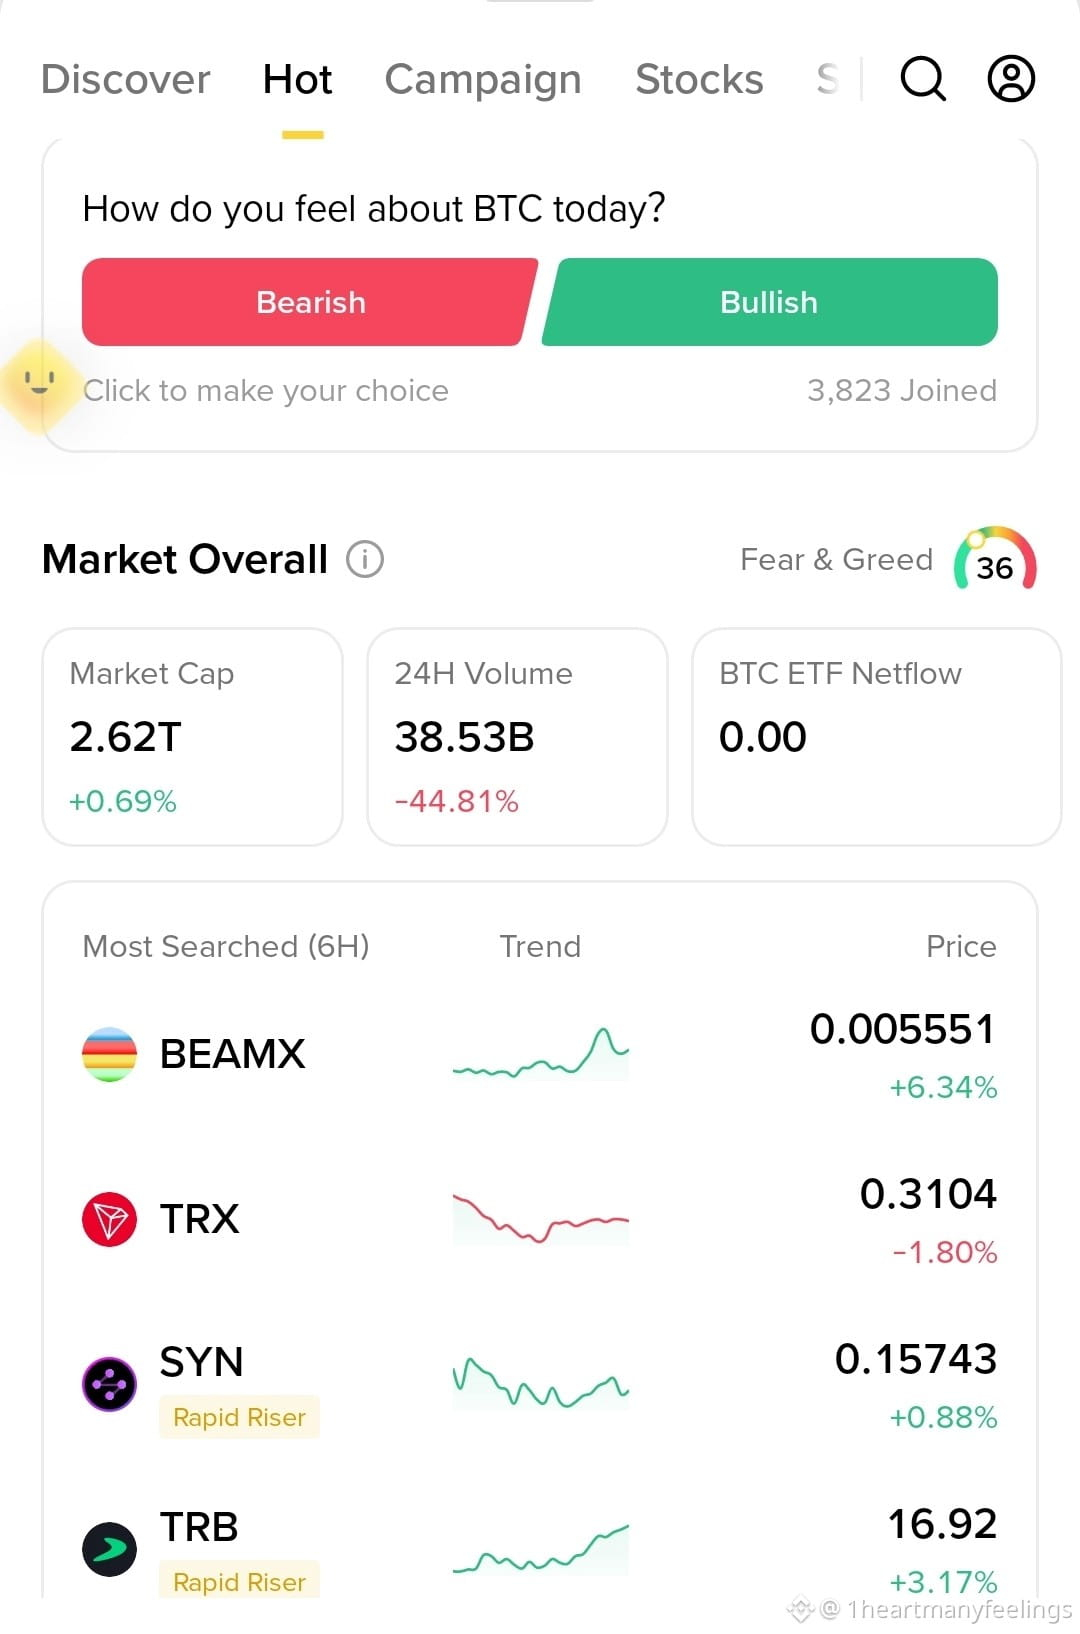
🔍 The Binance hack isn’t just a headline. It’s rewriting charts right now. Two tokens, two different reactions. $TRX $BEAMX
Market mood: Fear & Greed at 36, total market cap $2.62T, volume down ~45%. A cautious weekend.
🔴 TRX (~$0.31): TRX rallied above $0.36 right after the hack, then gave it all back. It’s now below its pre-hack price and testing the $0.30 area, its weakest level since March. Why? On-chain data shows the attacker swapped stolen USDT into hundreds of millions of TRX, and about 475M TRX (~$143M) were still held as of Oct 31.
The two-sided setup:
🐻 Risk: if those coins are sold, the pressure could push price lower.
🐂 Counter-view: Tron still carries over half of all USDT supply (~$93.7B in stablecoins), and oversold markets can bounce.
📊 Levels watched: support $0.30 / $0.31, resistance $0.33 / $0.34.
🟢BEAMX (~$0.0056, +6%): It exploded ~45% in a day after Beam Foundation burned a large batch of tokens linked to the hacker, and it’s up again today. But RSI hit overbought territory (82) at the peak. Bounces like this can fade as fast as they arrive.
⚠️ The lesson: Hack-driven moves are news-driven and unstable. Big wallets, burns and stolen-fund flows can flip direction in hours.
Curious how these charts react? Tap TRX or BEAMX to see the live price. If you trade, keep size small and set your exit before you enter.
{spot}(TRXUSDT)
{spot}(BEAMXUSDT)
Which is the better risk/reward to you: TRX at $0.30 or BEAMX after a spike? 👇
Disclosure: I may earn commissions from trades made through links or widgets in my posts (Binance Write to Earn / referral programs). This is analysis, not financial advice, and nothing here guarantees any outcome.
#TRX #BEAMX #Binance #Crypto #Trading
🔍 The Binance hack isn’t just a headline. It’s rewriting charts right now. Two tokens, two different reactions. $TRX $BEAMX
Market mood: Fear & Greed at 36, total market cap $2.62T, volume down ~45%. A cautious weekend.
🔴 TRX (~$0.31): TRX rallied above $0.36 right after the hack, then gave it all back. It’s now below its pre-hack price and testing the $0.30 area, its weakest level since March. Why? On-chain data shows the attacker swapped stolen USDT into hundreds of millions of TRX, and about 475M TRX (~$143M) were still held as of Oct 31.
The two-sided setup:
🐻 Risk: if those coins are sold, the pressure could push price lower.
🐂 Counter-view: Tron still carries over half of all USDT supply (~$93.7B in stablecoins), and oversold markets can bounce.
📊 Levels watched: support $0.30 / $0.31, resistance $0.33 / $0.34.
🟢BEAMX (~$0.0056, +6%): It exploded ~45% in a day after Beam Foundation burned a large batch of tokens linked to the hacker, and it’s up again today. But RSI hit overbought territory (82) at the peak. Bounces like this can fade as fast as they arrive.
⚠️ The lesson: Hack-driven moves are news-driven and unstable. Big wallets, burns and stolen-fund flows can flip direction in hours.
Curious how these charts react? Tap TRX or BEAMX to see the live price. If you trade, keep size small and set your exit before you enter.
Which is the better risk/reward to you: TRX at $0.30 or BEAMX after a spike? 👇
Disclosure: I may earn commissions from trades made through links or widgets in my posts (Binance Write to Earn / referral programs). This is analysis, not financial advice, and nothing here guarantees any outcome.
#TRX #BEAMX #Binance #Crypto #Trading
173
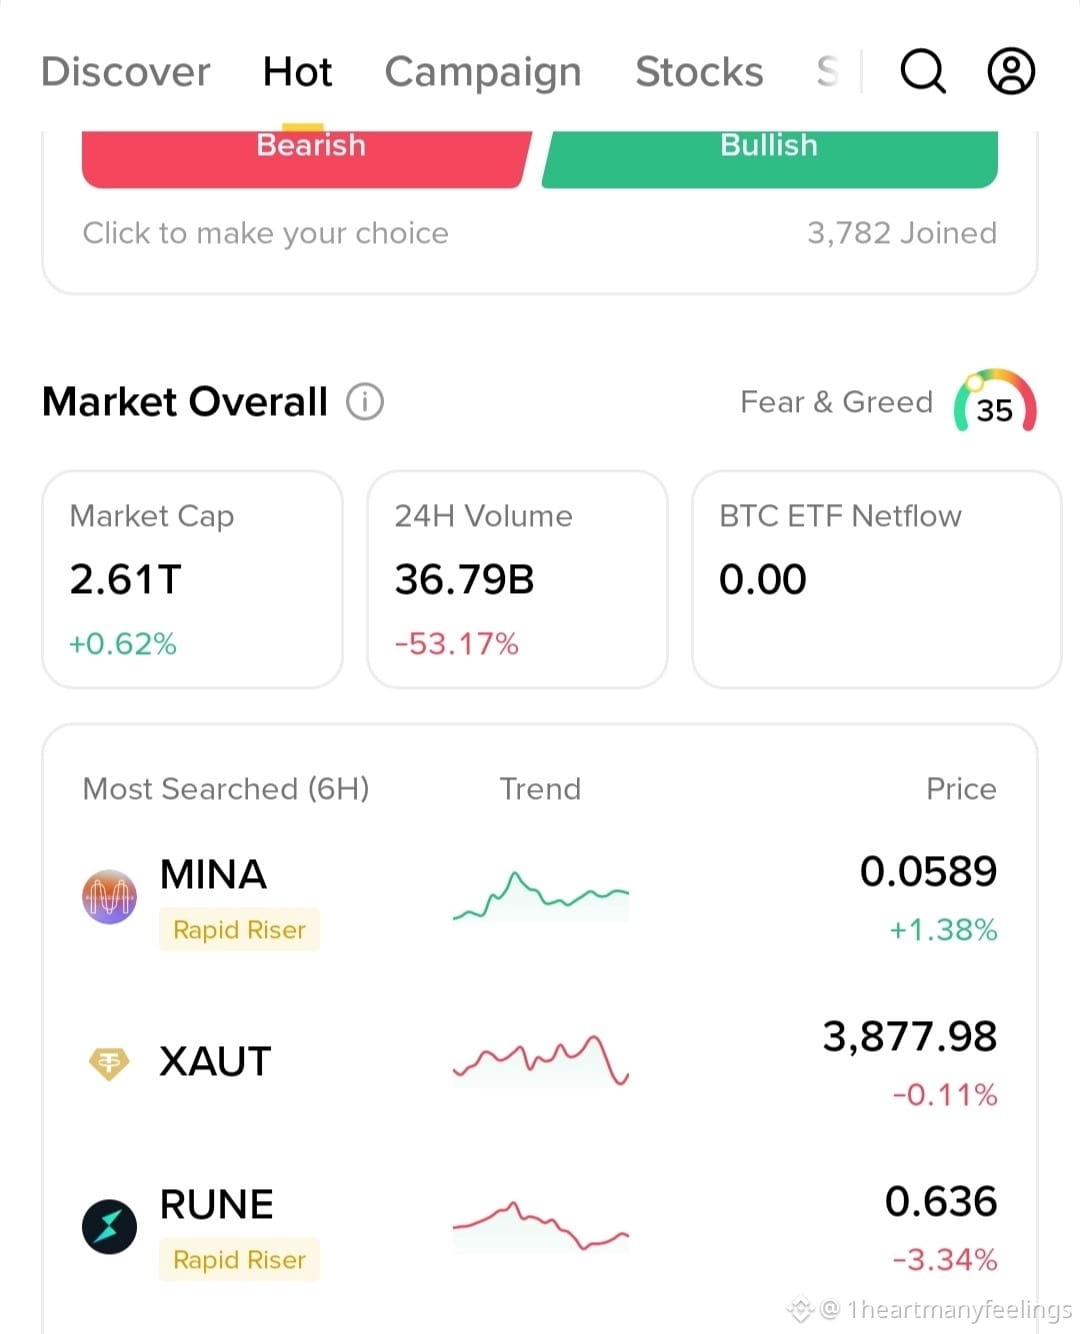
Trending trio $XAUT $RUNE $MINA
🔥 Three tokens trending on Binance right now, and each tells a different story.
Market mood: Fear & Greed 35, total market cap $2.61T, volume down ~53%. It’s a quiet, cautious weekend.
🟡 XAUT (~$3,878): Gold broke below $3,900 for the first time this year, about 30% under January’s record. Strong US data, higher oil and Fed hike bets (~75% odds for December) pushed it down. Even gold sold off with stocks as traders raised cash.
🟠 RUNE (~$0.636): It jumped 13–15% on Oct 30 as hack-related funds moved through THORChain, but it couldn’t hold $0.70. This rally came from network activity, not clean growth, and the protocol faces ongoing reputation and regulatory risk.
🔴 MINA (~$0.059): Tagged “Rapid Riser” yet down ~60% in October with no clear catalyst. Today’s +1.4% is a small bounce, not a trend change.
What this means for you: Hype and tags show attention, not direction. Check the live chart, read the news behind the move, and set your risk limit before you click anything.
👉 Tap the chart of the one you’re watching to see live price and depth. Start small if you decide to trade.
Which one are you tracking, GOLD, RUNE or MINA? 👇
Disclosure: I may earn commissions from trades made through links or widgets in my posts (Binance Write to Earn / referral programs). This is analysis, not financial advice, and nothing here guarantees any outcome.
#GOLD #XAUT #RUNE #mina #Binance #Crypto
341
Verified
Article
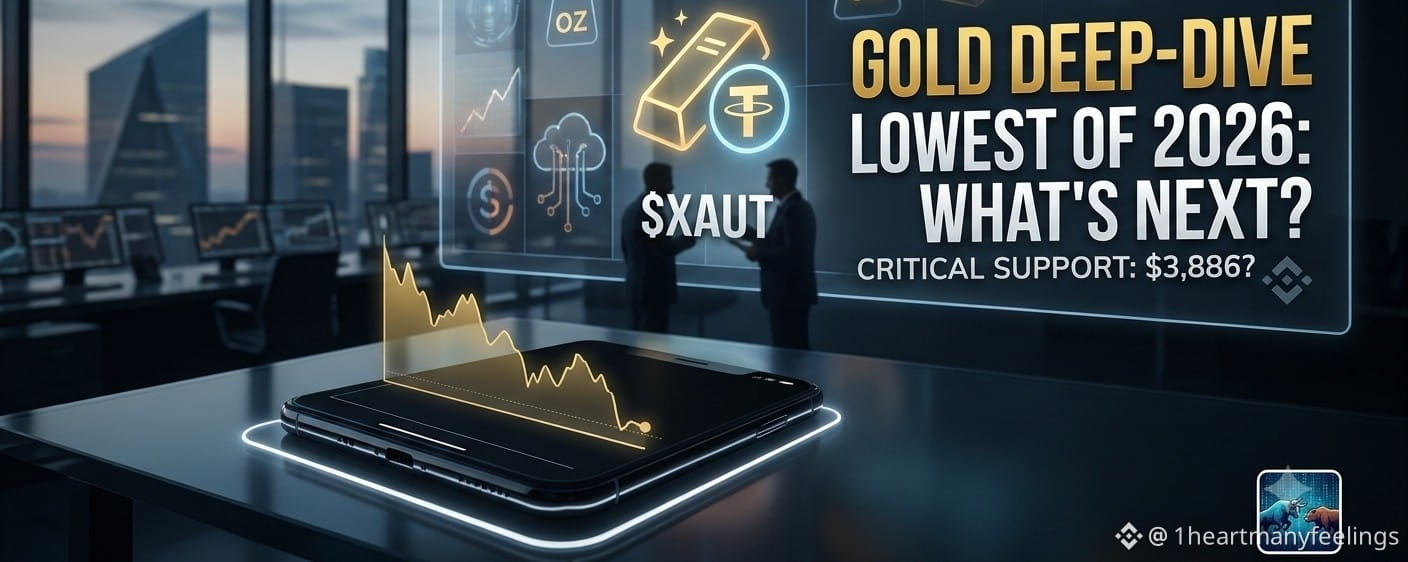
Gold deep-dive🥇 Gold just hit its lowest level of 2026. Here’s why, and what traders watch next.
{future}(XAUTUSDT)
What happened: Spot gold slipped below $3,900 on Oct 30, its weakest in a year and about 30% under January’s record of $5,595. $XAUT , the gold-backed token, trades near $3,878.
Why it fell:
Strong US data and higher oil prices are lifting inflation worries, and markets now price ~75% odds of a Fed rate hike in December.Higher rates make non-yielding gold less attractive.Stocks fell sharply too, and when investors need cash, even gold gets sold.
Levels to watch: $3,886 is a key support (Standard Chartered). $4,000 is the big resistance that gold lost. Break either way and momentum can change fast.
The two views:
🐂 UBS says gold could climb to $5,000+ next year if the Fed cuts again and inflation cools.
🐻 Others warn a firm bottom may not form until rate expectations peak.
Why XAUT is interesting: One XAUT represents one troy ounce of gold, and it trades 24/7 on Binance, including weekends when traditional gold markets are closed. That means it can react straight away to weekend news.
⚠️ Know the risks: XAUT is a token issued by Tether, not physical gold in your hands. Its price can differ slightly from spot gold, and a tokenized asset carries issuer risk. Gold could fall further before it stabilizes.
If you want to follow the move, tap the XAUT chart for the live price. Keep position sizes small and only use money you can afford to lose.
Will gold hold $3,886? 👇
Disclosure: I may earn commissions from trades made through links or widgets in my posts (Binance Write to Earn / referral programs). This is analysis, not financial advice, and nothing here guarantees any outcome.
#Gold #XAUT #Binance #Trading #Crypto
Gold deep-dive
🥇 Gold just hit its lowest level of 2026. Here’s why, and what traders watch next.
What happened: Spot gold slipped below $3,900 on Oct 30, its weakest in a year and about 30% under January’s record of $5,595. $XAUT , the gold-backed token, trades near $3,878.
Why it fell:
Strong US data and higher oil prices are lifting inflation worries, and markets now price ~75% odds of a Fed rate hike in December.Higher rates make non-yielding gold less attractive.Stocks fell sharply too, and when investors need cash, even gold gets sold.
Levels to watch: $3,886 is a key support (Standard Chartered). $4,000 is the big resistance that gold lost. Break either way and momentum can change fast.
The two views:
🐂 UBS says gold could climb to $5,000+ next year if the Fed cuts again and inflation cools.
🐻 Others warn a firm bottom may not form until rate expectations peak.
Why XAUT is interesting: One XAUT represents one troy ounce of gold, and it trades 24/7 on Binance, including weekends when traditional gold markets are closed. That means it can react straight away to weekend news.
⚠️ Know the risks: XAUT is a token issued by Tether, not physical gold in your hands. Its price can differ slightly from spot gold, and a tokenized asset carries issuer risk. Gold could fall further before it stabilizes.
If you want to follow the move, tap the XAUT chart for the live price. Keep position sizes small and only use money you can afford to lose.
Will gold hold $3,886? 👇
Disclosure: I may earn commissions from trades made through links or widgets in my posts (Binance Write to Earn / referral programs). This is analysis, not financial advice, and nothing here guarantees any outcome.
#Gold #XAUT #Binance #Trading #Crypto
96
Verified
GOOGLUSDT: Alphabet just had its worst post-earnings drop on record. What do traders watch next?
What happened: Alphabet missed Q3 estimates on both lines: EPS $2.12 vs $3.02 expected, revenue $127.6B vs ~$128B. The stock fell 12.6% on Oct 29 and closed at $283.82. It slipped roughly another 2% on Oct 30, wiping out around $500B in market value.
It’s not all bad news: Google Cloud revenue jumped 103% to $30.7B. But search ad growth was softer than expected (+12%), and free cash flow turned negative (about −$9B) as AI spending rose. Part of the EPS miss also came from a one-off $8.2B non-operating loss, mainly on its SpaceX stake.
Levels traders are watching (stock reference):
🔻 Support: ~$273–275 (52-week closing low $273.50, plus a key Fibonacci level). If that breaks, some technical analysts point lower, to $243 and $221.
🔺 Resistance: ~$306, then the pre-earnings zone near $315–325.
🎯 Analyst targets are mixed after the drop: BofA $380 (Buy), BMO $425 (Outperform), UBS $332 (Neutral).
⚠️ Important: GOOGLUSDT is a perpetual futures contract, not a share. It trades 24/7, can move differently from the stock while US markets are closed, and leverage magnifies losses as fast as gains. A stock that just fell 12% can fall more or rebound hard. Nobody knows which.
If you’re researching it, check the live contract price, funding rate and your region’s eligibility first. Keep position sizes small, use leverage cautiously (or not at all), and never risk money you can’t afford to lose.
Do you think $275 holds? 👇
Disclosure: I may earn Binance referral commissions. This is analysis, not financial advice, and nothing here guarantees any outcome.
#GOOGLUSDT #Alphabet #Binance #Crypto #Trading

GOOGL-0.14%
GOOGUS-0.86%
295
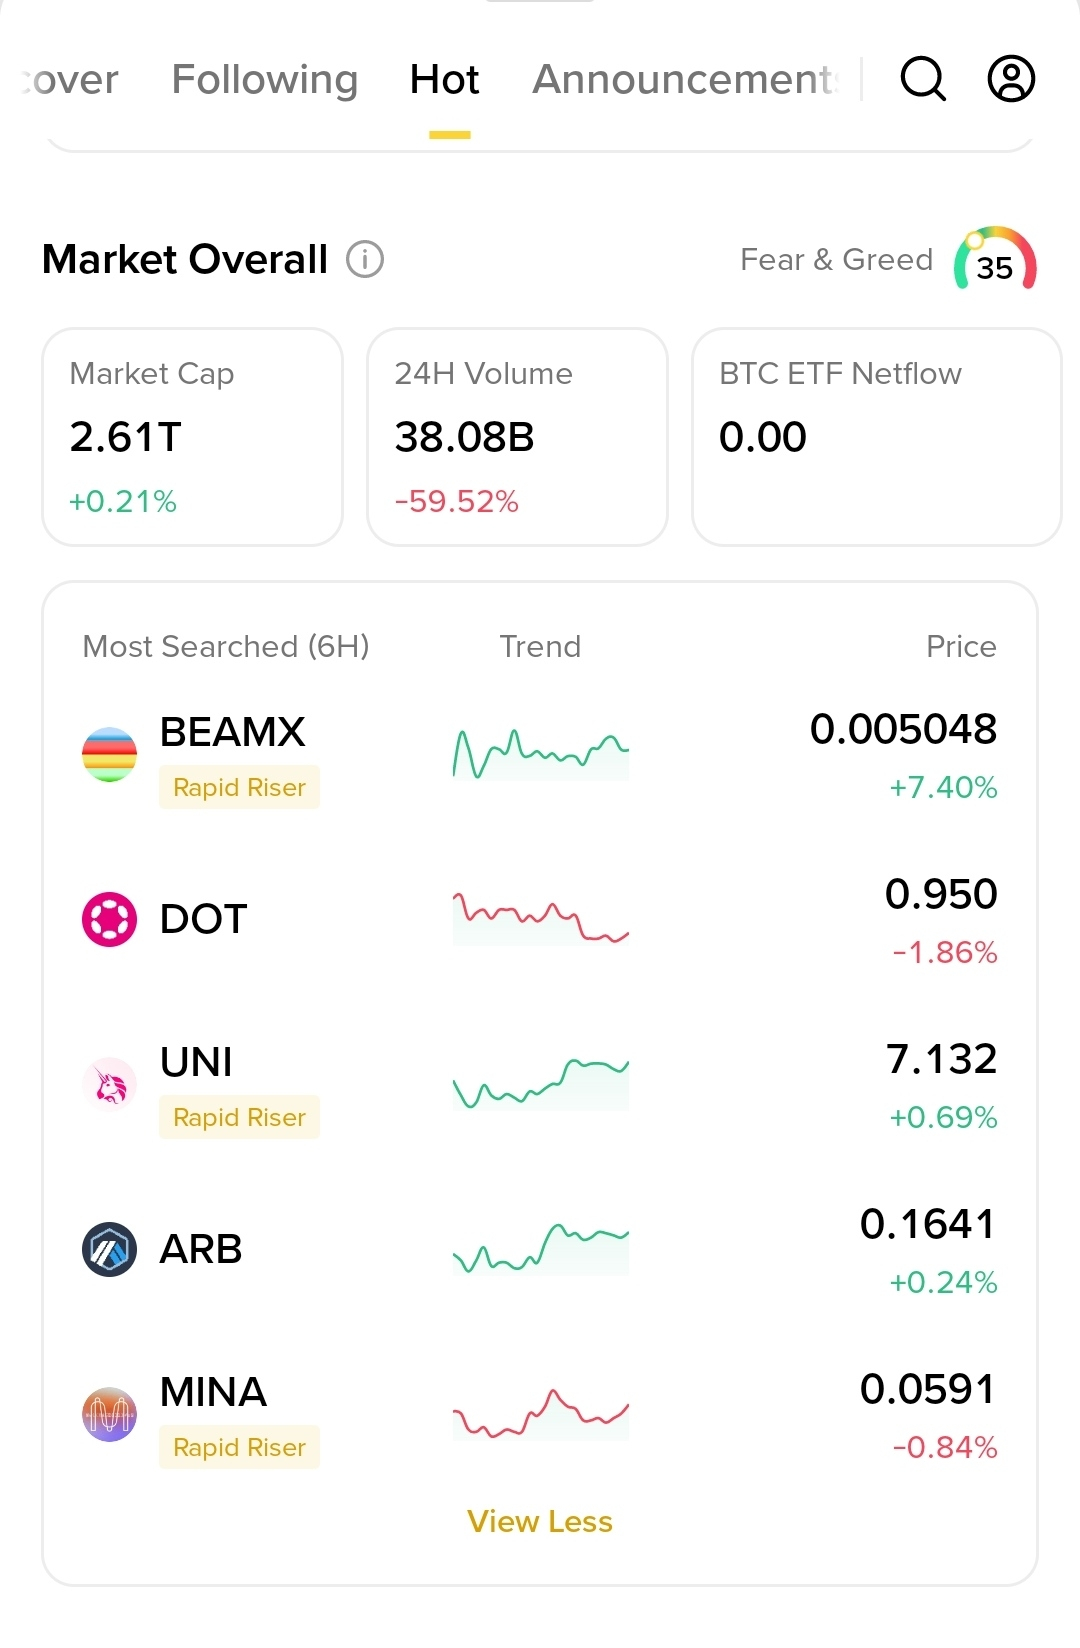
$BEAMX $DOT $UNI
Market mood: Fear & Greed is at 35 (Fear). Total market cap is $2.61T, and 24h volume is down ~60%, which looks like a quiet weekend rather than a trend.
🟢 BEAMX (~$0.0050, +7.4%)
The gaming token jumped about 45% in a day after Beam Foundation burned ~984M BEAM tokens tied to the Binance hacker, while the rest of the market fell. The daily RSI reached overbought territory (~82), so chasing here is risky.
🔴 DOT (~$0.95, −1.9%)
Seven straight lower daily closes, trading below every major moving average and hugging the lower Bollinger Band. Oversold readings can bounce, but bulls have to prove it first.
🟡 UNI (~$7.13, +0.7%)
On-chain activity is the story: 13,137 new addresses in one day, the biggest since Sept 2020, plus $6.1B in cumulative protocol fees. But UNI is still down ~29% in four weeks and far below its $45 high. Watch $7.26 resistance and $6.51–6.75 support.
⚠️ Takeaway: “Trending” measures attention, not direction. Small caps can move 10–40% in a day, both ways. If you’re researching any of these, check volume, supply schedule and your own risk limit first. Never trade money you can’t afford to lose.
Which one are you watching? 👇
Disclosure: I may earn Binance referral commissions. This is analysis, not financial advice, and nothing here guarantees any outcome.
#Binance #BEAMXUSDT #DOT #crypto
633
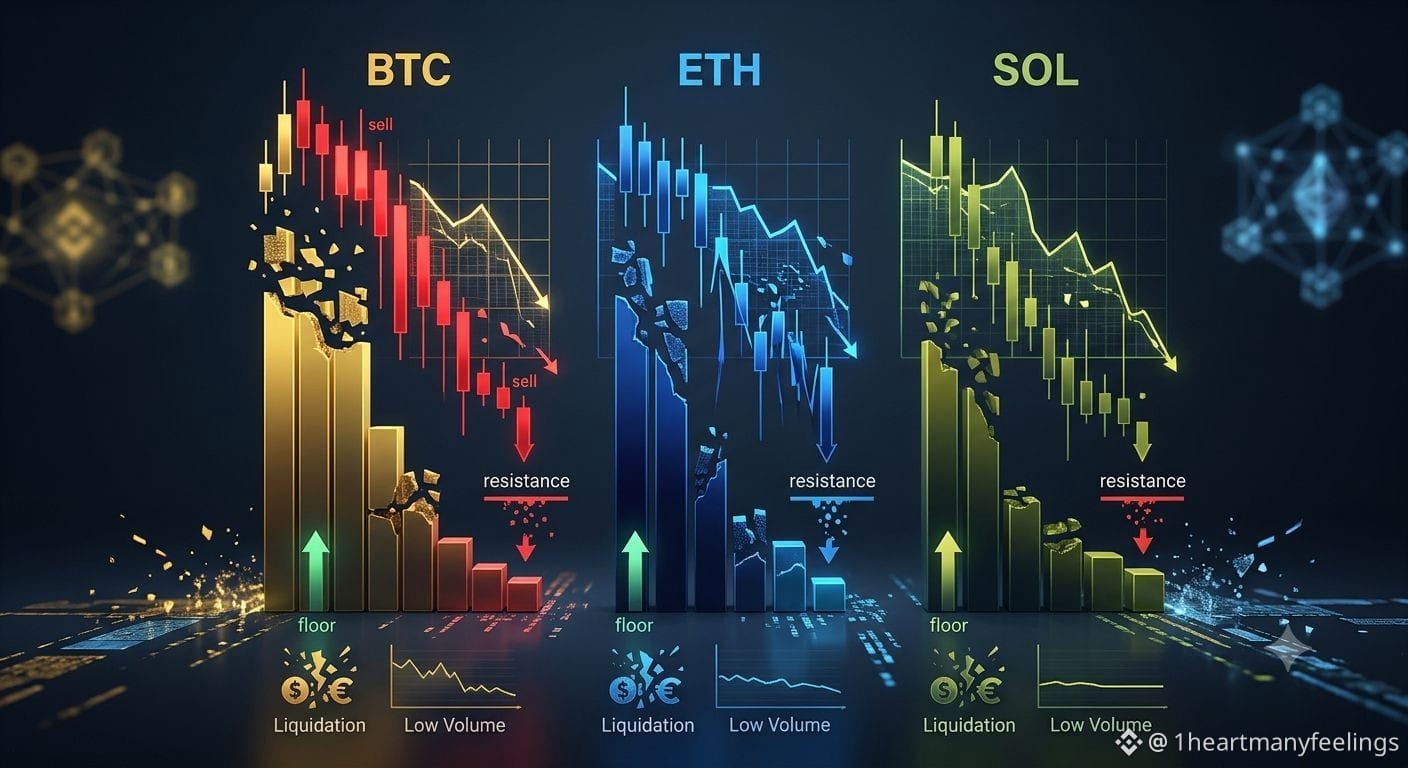
📊 Weekend crypto check: BTC, ETH and SOL after a rough week.
Prices: $BTC TC ~$77.3K, $ETH ~$2,250, $SOL ~$95.5. BTC is about 38.6% below its $126K all-time high.
What happened: The Binance incident hit sentiment hard. Futures saw $697M in liquidations over 24 hours to Oct 31, mostly leveraged longs ($294M BTC, $140M ETH). Volume is now running well below its 30-day average, so this looks like a pause, not a trend.
Levels people are watching:
BTC: $78,670 was the floor of the Sep–Oct range, and it has been lost. Holding above $76K matters.
ETH: support near $2,221, resistance near $2,465. Analysts say a close above $2,465 that holds for over a day would matter.
SOL: still below the $100 psychological level.
🐂 Bull case: some analysts say the bear market has already ended.
🐻 Bear case: the trend is down, and every bounce is a counter-move until key levels are reclaimed.
Both can’t be right. Decide your plan before you trade: size, exit, and money you can afford to lose.
{spot}(SOLUSDT)
{spot}(ETHUSDT)
{spot}(BTCUSDT)
Where do you think BTC goes next week? 👇
Disclosure: I may earn Binance referral commissions. Analysis only, not financial advice. Nothing is guaranteed.
#Bitcoin #Ethereum #Solana #Crypto #Trading
📊 Weekend crypto check: BTC, ETH and SOL after a rough week.
Prices: $BTC TC ~$77.3K, $ETH ~$2,250, $SOL ~$95.5. BTC is about 38.6% below its $126K all-time high.
What happened: The Binance incident hit sentiment hard. Futures saw $697M in liquidations over 24 hours to Oct 31, mostly leveraged longs ($294M BTC, $140M ETH). Volume is now running well below its 30-day average, so this looks like a pause, not a trend.
Levels people are watching:
BTC: $78,670 was the floor of the Sep–Oct range, and it has been lost. Holding above $76K matters.
ETH: support near $2,221, resistance near $2,465. Analysts say a close above $2,465 that holds for over a day would matter.
SOL: still below the $100 psychological level.
🐂 Bull case: some analysts say the bear market has already ended.
🐻 Bear case: the trend is down, and every bounce is a counter-move until key levels are reclaimed.
Both can’t be right. Decide your plan before you trade: size, exit, and money you can afford to lose.
Where do you think BTC goes next week? 👇
Disclosure: I may earn Binance referral commissions. Analysis only, not financial advice. Nothing is guaranteed.
#Bitcoin #Ethereum #Solana #Crypto #Trading
111
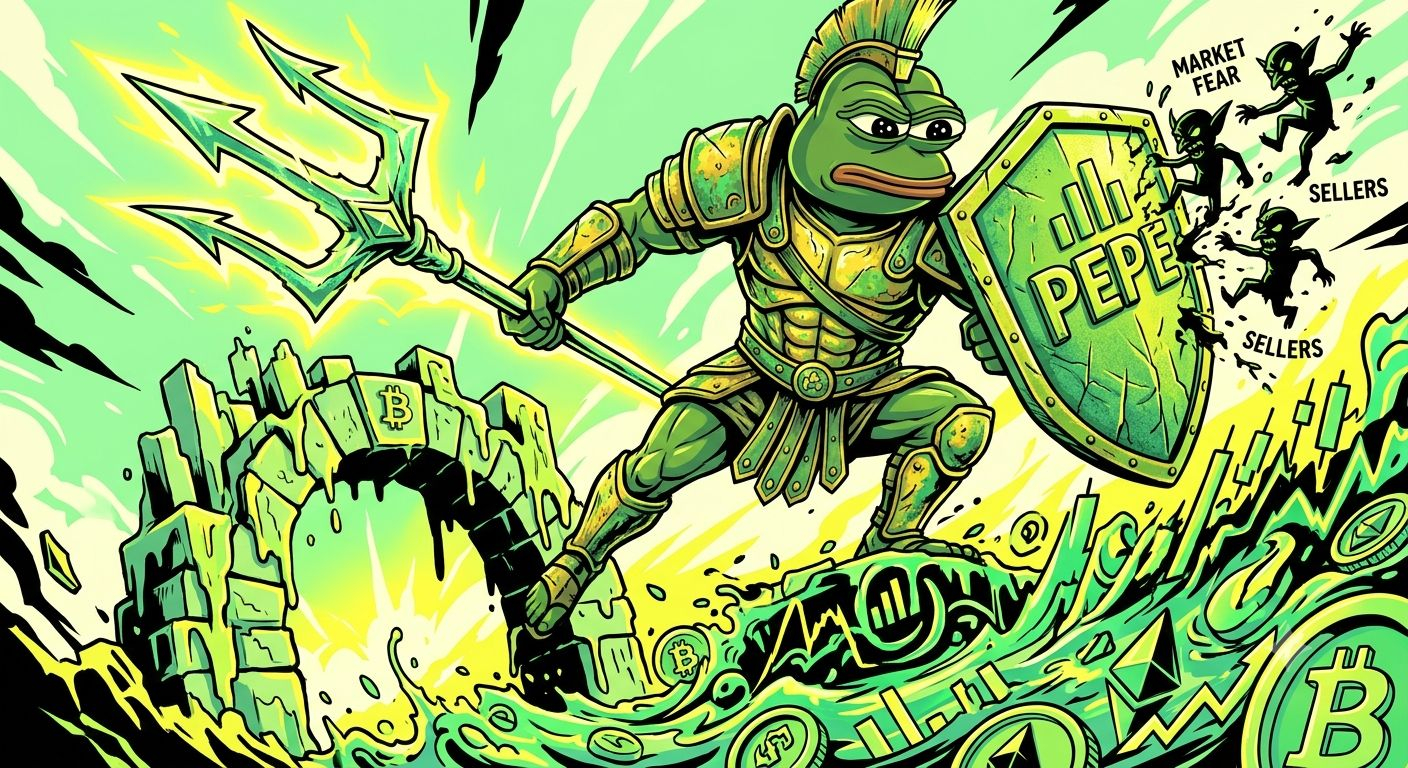
PEPE swung hard this week while the whole market was shaking. Here’s the full picture.
Where it stands
$PEPE is trading around $0.000005 with a market cap near $2.1B, ranking about #48 by market cap. In the last 24 hours it moved between roughly $0.0000044 and $0.0000057. It’s still around 80% below its all-time high of about $0.0000283.
What’s moving it
🐋 Whales: Arkham reported about $51M in PEPE across wallets linked to Justin Sun, around 2.8% of supply. Lookonchain also tracked two dormant whales moving 2.27 trillion tokens on Oct 28. Big holders can push price up fast, and they can also sell fast.
📉 Market mood: The Binance security incident hit sentiment across crypto, and meme coins usually feel that first.
📊 Derivatives: Futures activity rose during the bounce, with short liquidations adding fuel.
What the chart shows
On Oct 29, PEPE spiked near $0.0000057 but closed the day near $0.00000455, a rejection at resistance. Buyers then defended the $0.00000432 area. Traders are watching whether it can close a day above $0.000005. If it can’t, the recent bounce may fade.
⚠️ Risks
PEPE has no real utility. Price follows hype and liquidity.
Whale concentration works both ways.
10%+ daily swings are normal for meme coins.
A rebound is possible. A lower low is possible too. Nobody knows.
If you’re researching it
Check holder concentration, volume trends and the overall market first. Decide your risk limit before anything else, and never put in money you can’t afford to lose. Avoid chasing green candles.
Are you watching PEPE or skipping memes this cycle? 👇
{spot}(PEPEUSDT)
Disclosure: I may earn referral commissions from Binance. This is analysis, not financial advice, and nothing here guarantees any outcome.
#PEPE #Memecoin #Crypto #Binance #Trading
PEPE swung hard this week while the whole market was shaking. Here’s the full picture.
Where it stands
$PEPE is trading around $0.000005 with a market cap near $2.1B, ranking about #48 by market cap. In the last 24 hours it moved between roughly $0.0000044 and $0.0000057. It’s still around 80% below its all-time high of about $0.0000283.
What’s moving it
🐋 Whales: Arkham reported about $51M in PEPE across wallets linked to Justin Sun, around 2.8% of supply. Lookonchain also tracked two dormant whales moving 2.27 trillion tokens on Oct 28. Big holders can push price up fast, and they can also sell fast.
📉 Market mood: The Binance security incident hit sentiment across crypto, and meme coins usually feel that first.
📊 Derivatives: Futures activity rose during the bounce, with short liquidations adding fuel.
What the chart shows
On Oct 29, PEPE spiked near $0.0000057 but closed the day near $0.00000455, a rejection at resistance. Buyers then defended the $0.00000432 area. Traders are watching whether it can close a day above $0.000005. If it can’t, the recent bounce may fade.
⚠️ Risks
PEPE has no real utility. Price follows hype and liquidity.
Whale concentration works both ways.
10%+ daily swings are normal for meme coins.
A rebound is possible. A lower low is possible too. Nobody knows.
If you’re researching it
Check holder concentration, volume trends and the overall market first. Decide your risk limit before anything else, and never put in money you can’t afford to lose. Avoid chasing green candles.
Are you watching PEPE or skipping memes this cycle? 👇
Disclosure: I may earn referral commissions from Binance. This is analysis, not financial advice, and nothing here guarantees any outcome.
#PEPE #Memecoin #Crypto #Binance #Trading
119

Article
Trade Smart, Stay Safe🔐 A $6B exchange hack just happened. Here’s what every crypto user can learn from it.
Binance says an attack drained about $6.3B from its hot wallet on Oct 29. Its CEO says customer assets were not affected and that losses will be covered with company funds. About $3B has been frozen so far. Withdrawals are still paused. Binance says it will publish a proof-of-reserves report by Nov 2. Binance CEO Says Full Proof-of-Reserves Report Due Nov. 2, Pledges Full Compensation for Hack Losses
Whatever happens next, these habits protect you on any exchange:
✅ Read the Proof of Reserves report when it’s out, and compare it with past ones
✅ Use passkeys or an authenticator app, not SMS
✅ Turn on withdrawal address whitelisting
✅ Keep on exchanges only what you actively trade
✅ Don’t put everything in one place
Transparency during a crisis tells you a lot. I’ll be watching the updates and sharing what I find.
Disclosure: I may earn referral commissions from Binance, which is why I’m especially careful about what I share. Not financial advice.
#Binance #Crypto #CryptoSecurity #Bitcoin #Trading
Trade Smart, Stay Safe
🔐 A $6B exchange hack just happened. Here’s what every crypto user can learn from it.
Binance says an attack drained about $6.3B from its hot wallet on Oct 29. Its CEO says customer assets were not affected and that losses will be covered with company funds. About $3B has been frozen so far. Withdrawals are still paused. Binance says it will publish a proof-of-reserves report by Nov 2. Binance CEO Says Full Proof-of-Reserves Report Due Nov. 2, Pledges Full Compensation for Hack Losses
Whatever happens next, these habits protect you on any exchange:
✅ Read the Proof of Reserves report when it’s out, and compare it with past ones
✅ Use passkeys or an authenticator app, not SMS
✅ Turn on withdrawal address whitelisting
✅ Keep on exchanges only what you actively trade
✅ Don’t put everything in one place
Transparency during a crisis tells you a lot. I’ll be watching the updates and sharing what I find.
Disclosure: I may earn referral commissions from Binance, which is why I’m especially careful about what I share. Not financial advice.
#Binance #Crypto #CryptoSecurity #Bitcoin #Trading
143
📉 Crypto got hit hard this week. Where do $BTC , $ETH and $SOL stand now?
Big picture: Bitcoin is around $77K and ETH near $2,240 after the Binance incident. Liquidations topped $1.5B at the peak, mostly leveraged longs, and the Fear & Greed Index sits at 30. bitcoincoingabbar
Solana (SOL): trading around $95–96, with a market cap near $56B. That’s roughly two-thirds below its all-time high of about $295.
📊 One analysis flagged a bearish crossover, with the 20-day EMA falling below the 50-day for the first time since August, and RSI under 35.
📊 Another report says SOL slipped under the psychological $100 level.
🔧 On the positive side, it points to the Alpenglow consensus upgrade, which aims to cut transaction finality times. Solana Price Today
Two ways to read it:
🐂 Galaxy’s Alex Thorn argues the bear market likely ended in June and bitcoin is in an accumulation phase.
🐻 Technicals look weak: BTC is testing its 200-day average near $76,400–76,600. SOL is also below key moving averages.
Altcoins like SOL usually move more sharply than BTC, in both directions. Nobody knows which view wins, so decide your position size and exit plan first, and only use money you can afford to lose.
Are you watching SOL or waiting on the sidelines? 👇
{spot}(SOLUSDT)
{spot}(ETHUSDT)
{spot}(BTCUSDT)
Disclosure: I may earn Binance referral commissions. This is analysis, not financial advice, and no outcome is guaranteed.
#Solana #SOL #Bitcoin #Crypto #Binance #Trading
📉 Crypto got hit hard this week. Where do $BTC , $ETH and $SOL stand now?
Big picture: Bitcoin is around $77K and ETH near $2,240 after the Binance incident. Liquidations topped $1.5B at the peak, mostly leveraged longs, and the Fear & Greed Index sits at 30. bitcoincoingabbar
Solana (SOL): trading around $95–96, with a market cap near $56B. That’s roughly two-thirds below its all-time high of about $295.
📊 One analysis flagged a bearish crossover, with the 20-day EMA falling below the 50-day for the first time since August, and RSI under 35.
📊 Another report says SOL slipped under the psychological $100 level.
🔧 On the positive side, it points to the Alpenglow consensus upgrade, which aims to cut transaction finality times. Solana Price Today
Two ways to read it:
🐂 Galaxy’s Alex Thorn argues the bear market likely ended in June and bitcoin is in an accumulation phase.
🐻 Technicals look weak: BTC is testing its 200-day average near $76,400–76,600. SOL is also below key moving averages.
Altcoins like SOL usually move more sharply than BTC, in both directions. Nobody knows which view wins, so decide your position size and exit plan first, and only use money you can afford to lose.
Are you watching SOL or waiting on the sidelines? 👇
Disclosure: I may earn Binance referral commissions. This is analysis, not financial advice, and no outcome is guaranteed.
#Solana #SOL #Bitcoin #Crypto #Binance #Trading

117
Log in to explore more content
Join global crypto users on Binance Square
⚡️ Get latest and useful information about crypto.
💬 Trusted by the world’s largest crypto exchange.
👍 Discover real insights from verified creators.
Email / Phone number
Trending Topics
BinanceProcesses$4.65BWithdrawals
18,736 views
101 Discussing
Binance Processes $4.65 Billion in Withdrawals After Reopening, Net Outflow of $3.64 Billion Equals 2.1% of Its $171 Billion in Assets
Binance News
·38 Likes
·10.7k views
WithdrawalsBack: 15 networks live
6,952 views
121 Discussing
BinanceUpdatesProofofReservesAddresses
113,477 views
1,496 Discussing