
San W
1k Posts

San W
Report
Block User
🌐 Web3 & BTC BNB ASTER爱好者 | 🚀 投资哲学 & 自我成长 | 分享最新行业动态与个人见解 | 长期主义者 | 共同成长
12 Following
2.2K+ Followers
1.5K+ Liked
Posts
All
Quotes
Live
·
--
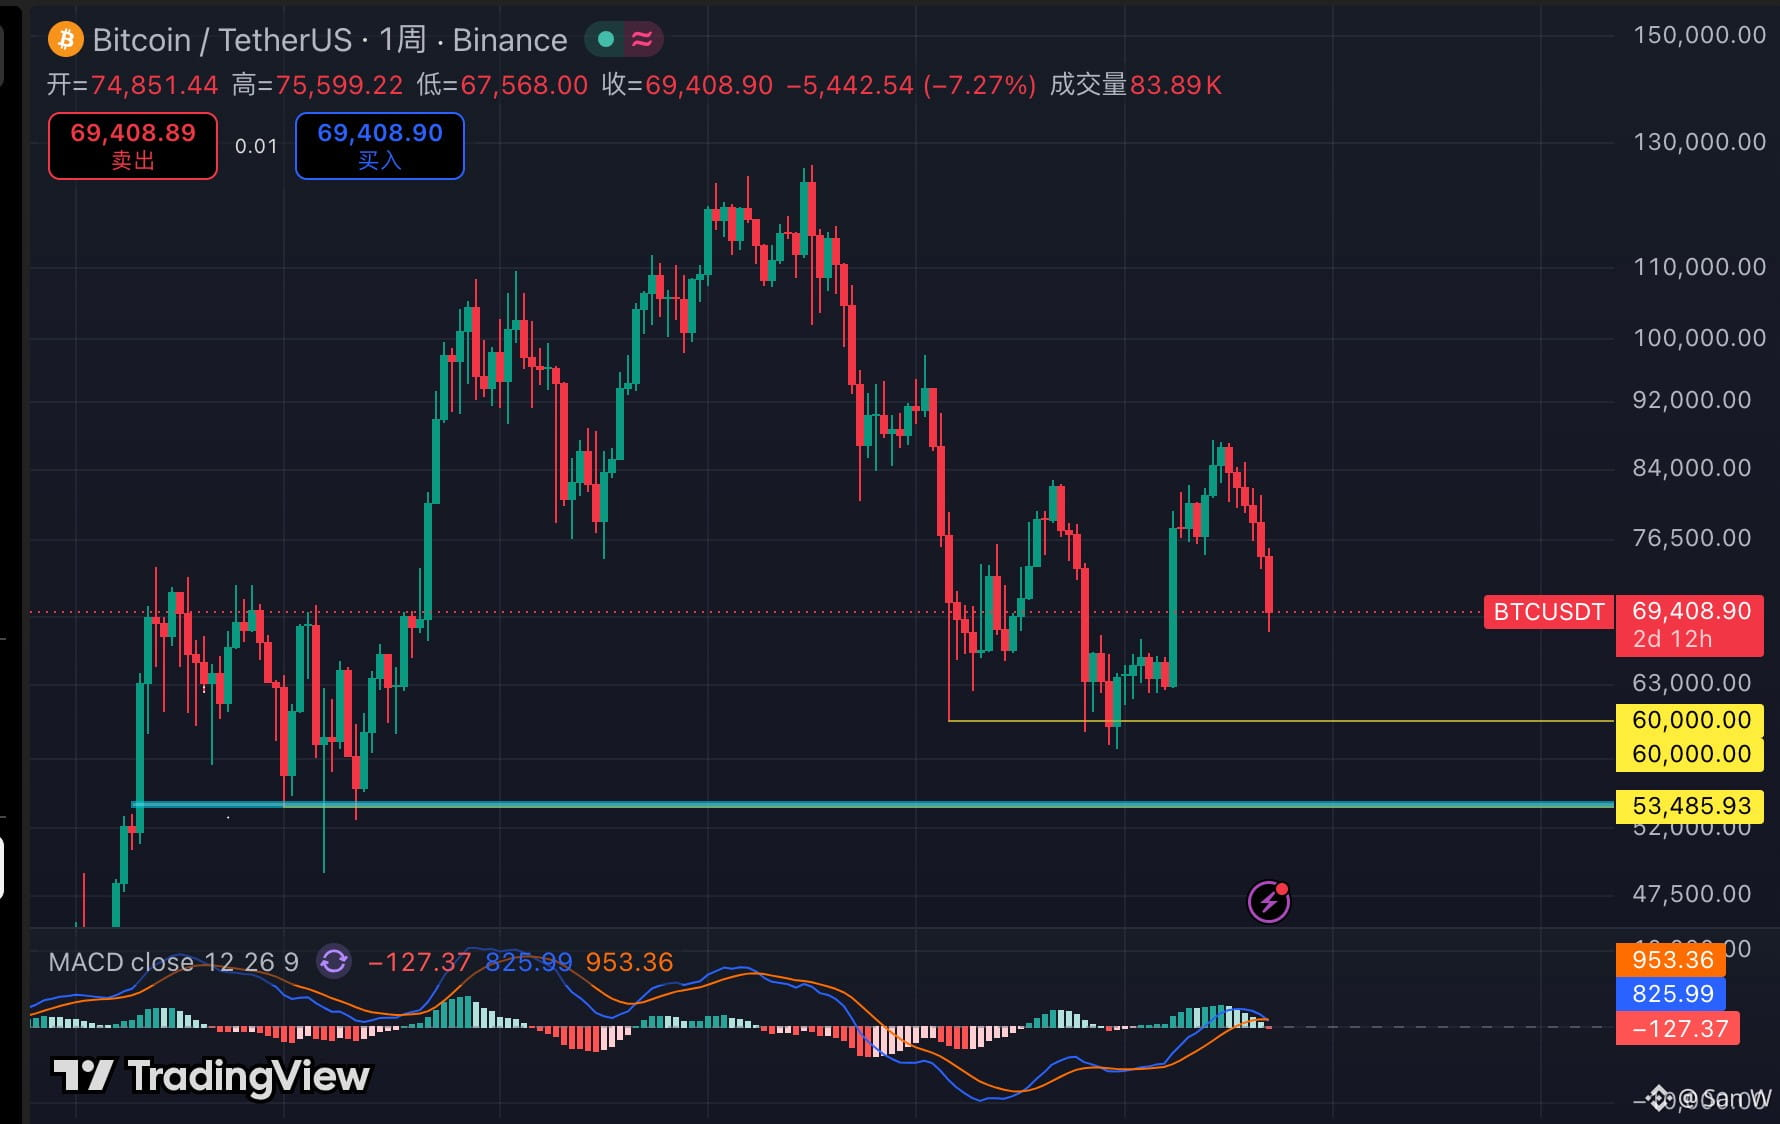
$BTC The weekly chart continues to pull back.
I'm currently watching two spot entry levels:
$60,000: first tranche
Around $53,500: second tranche
I'm not trying to call the bottom, and I'm not rushing to buy the dip.
I'll buy in batches if the price reaches those levels.
$BTC
{future}(BTCUSDT)
⛰️
This is not investment or trading advice.
$BTC The weekly chart continues to pull back.
I'm currently watching two spot entry levels:
$60,000: first tranche
Around $53,500: second tranche
I'm not trying to call the bottom, and I'm not rushing to buy the dip.
I'll buy in batches if the price reaches those levels.
$BTC
⛰️
This is not investment or trading advice.
I'm currently watching two spot entry levels:
$60,000: first tranche
Around $53,500: second tranche
I'm not trying to call the bottom, and I'm not rushing to buy the dip.
I'll buy in batches if the price reaches those levels.
$BTC
⛰️
This is not investment or trading advice.
365
·
--
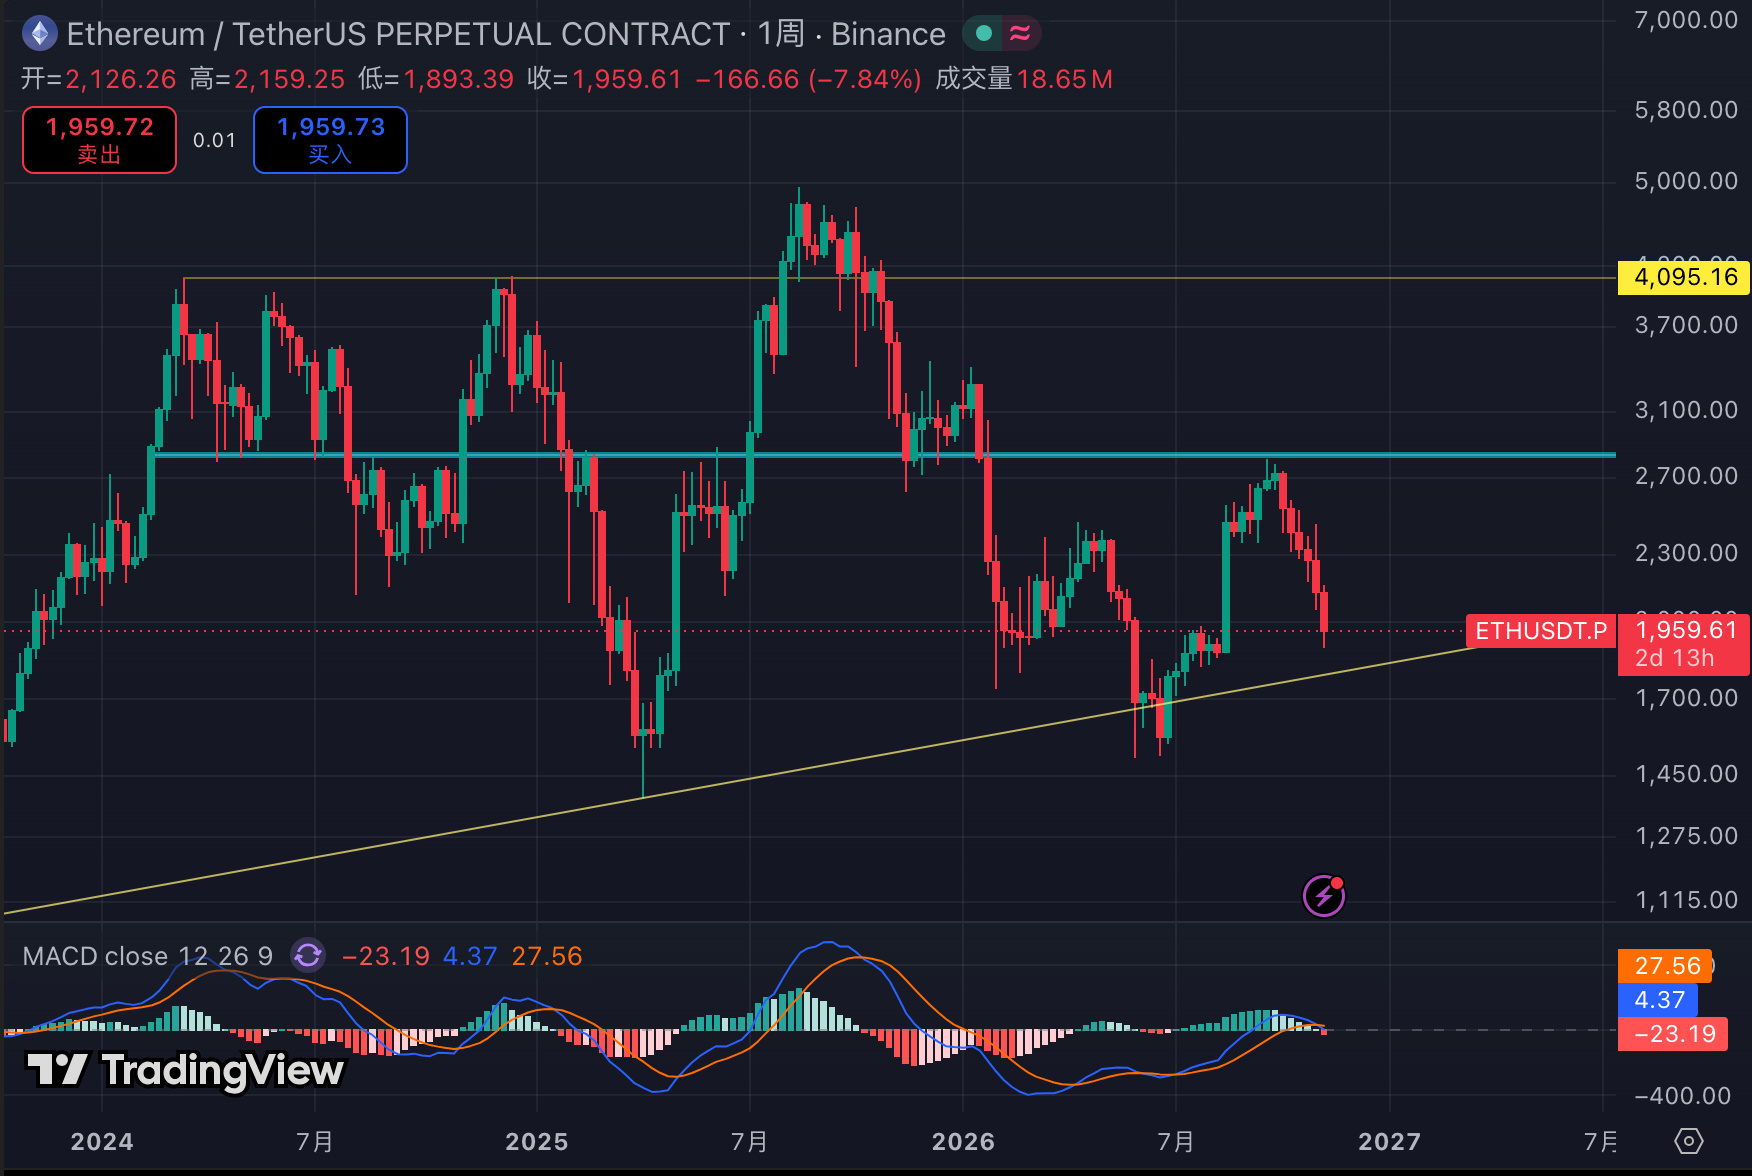
$ETH The weekly chart has reached a key level.
Now around $1960,
it is already close to the long-term uptrend line.
A clear improvement in the structure would require reclaiming the area around $2700 above.
If the trend line fails to hold,
price may need to keep looking for support below.
This is a key level, but not yet a confirmed reversal.
$ETH
{future}(ETHUSDT)
⛰️
This is not investment or trading advice.
$ETH The weekly chart has reached a key level.
Now around $1960,
it is already close to the long-term uptrend line.
A clear improvement in the structure would require reclaiming the area around $2700 above.
If the trend line fails to hold,
price may need to keep looking for support below.
This is a key level, but not yet a confirmed reversal.
$ETH
⛰️
This is not investment or trading advice.
Now around $1960,
it is already close to the long-term uptrend line.
A clear improvement in the structure would require reclaiming the area around $2700 above.
If the trend line fails to hold,
price may need to keep looking for support below.
This is a key level, but not yet a confirmed reversal.
$ETH
⛰️
This is not investment or trading advice.
2k
·
--
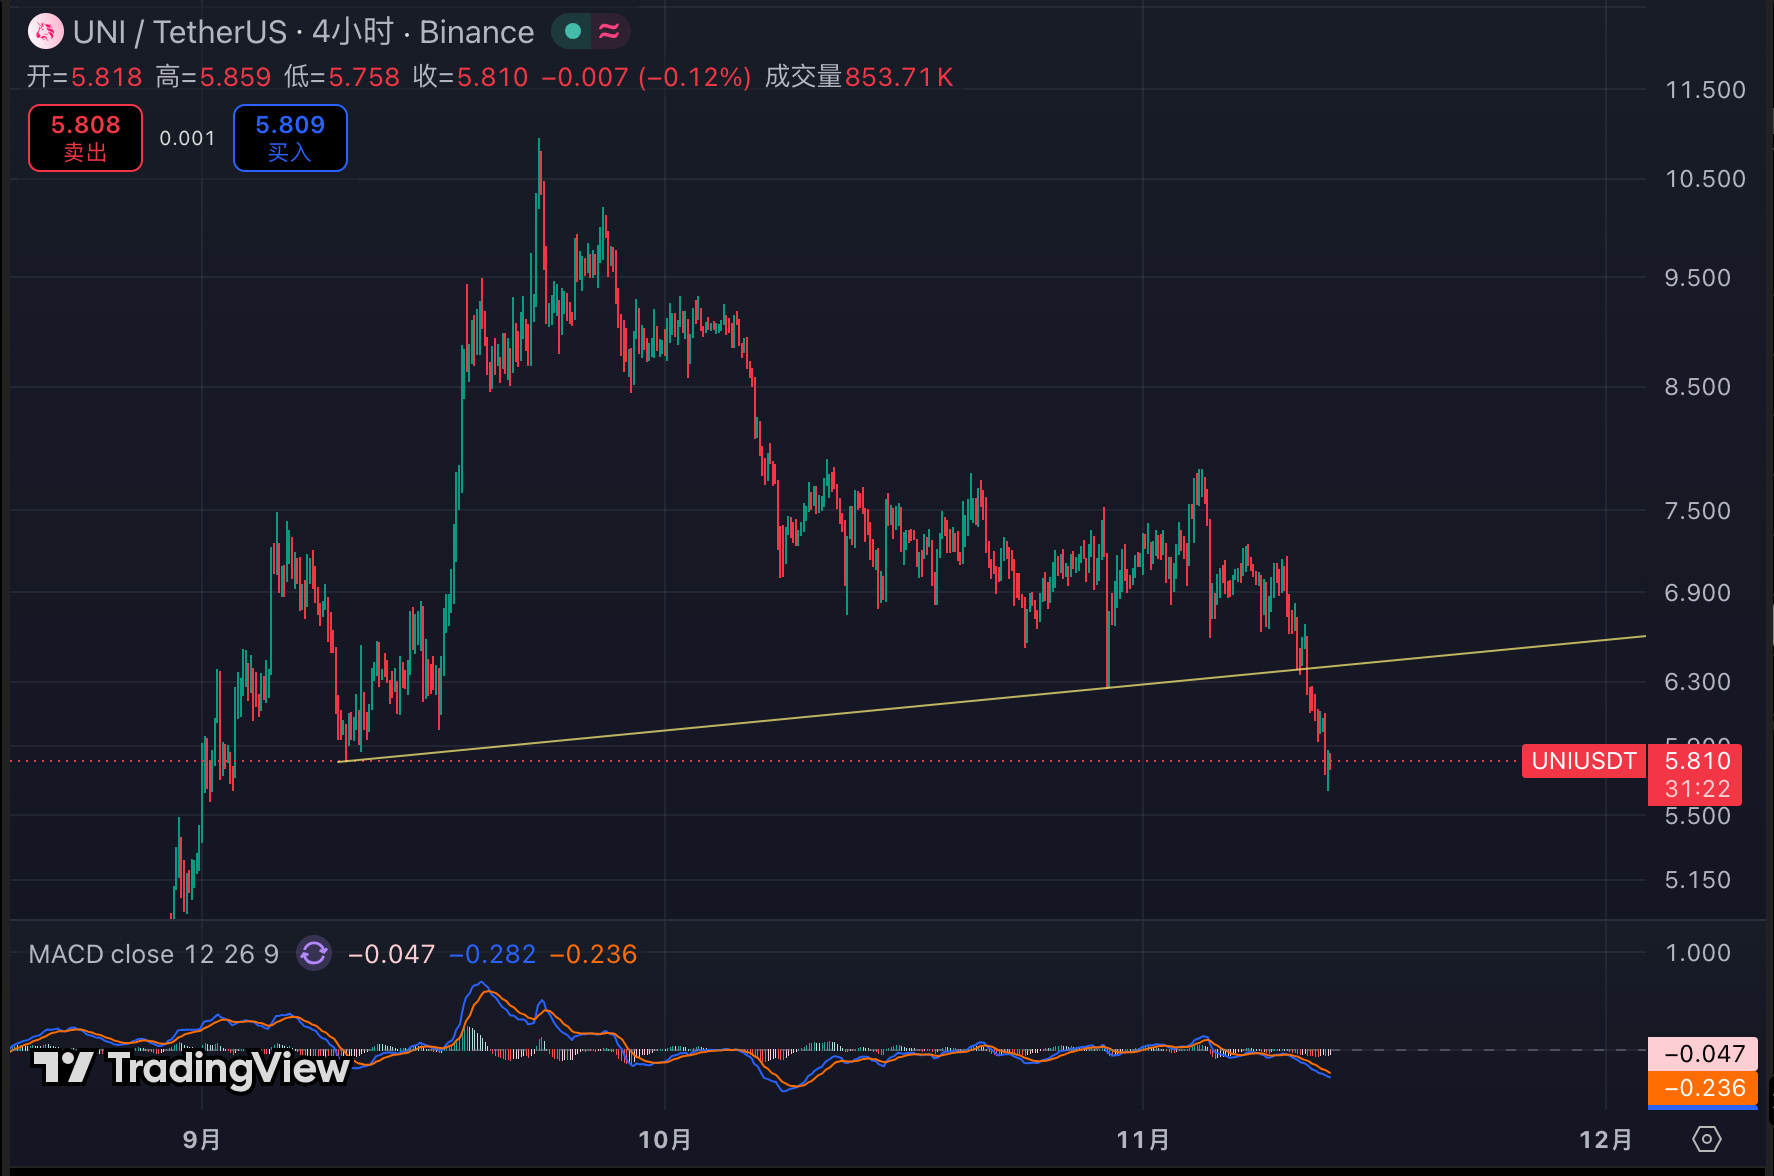
$UNI 4The hourly timeframe has already broken below the uptrend line.
Price is now near $5.8,
and the MACD is still weakening.
The short-term structure has clearly weakened.
If it can't reclaim the trendline, treat any rebound as a weak recovery for now.
$UNI
{future}(UNIUSDT)
⛰️
This is not investment or trading advice.
$UNI 4The hourly timeframe has already broken below the uptrend line.
Price is now near $5.8,
and the MACD is still weakening.
The short-term structure has clearly weakened.
If it can't reclaim the trendline, treat any rebound as a weak recovery for now.
$UNI
⛰️
This is not investment or trading advice.
Price is now near $5.8,
and the MACD is still weakening.
The short-term structure has clearly weakened.
If it can't reclaim the trendline, treat any rebound as a weak recovery for now.
$UNI
⛰️
This is not investment or trading advice.
2.1k
·
--
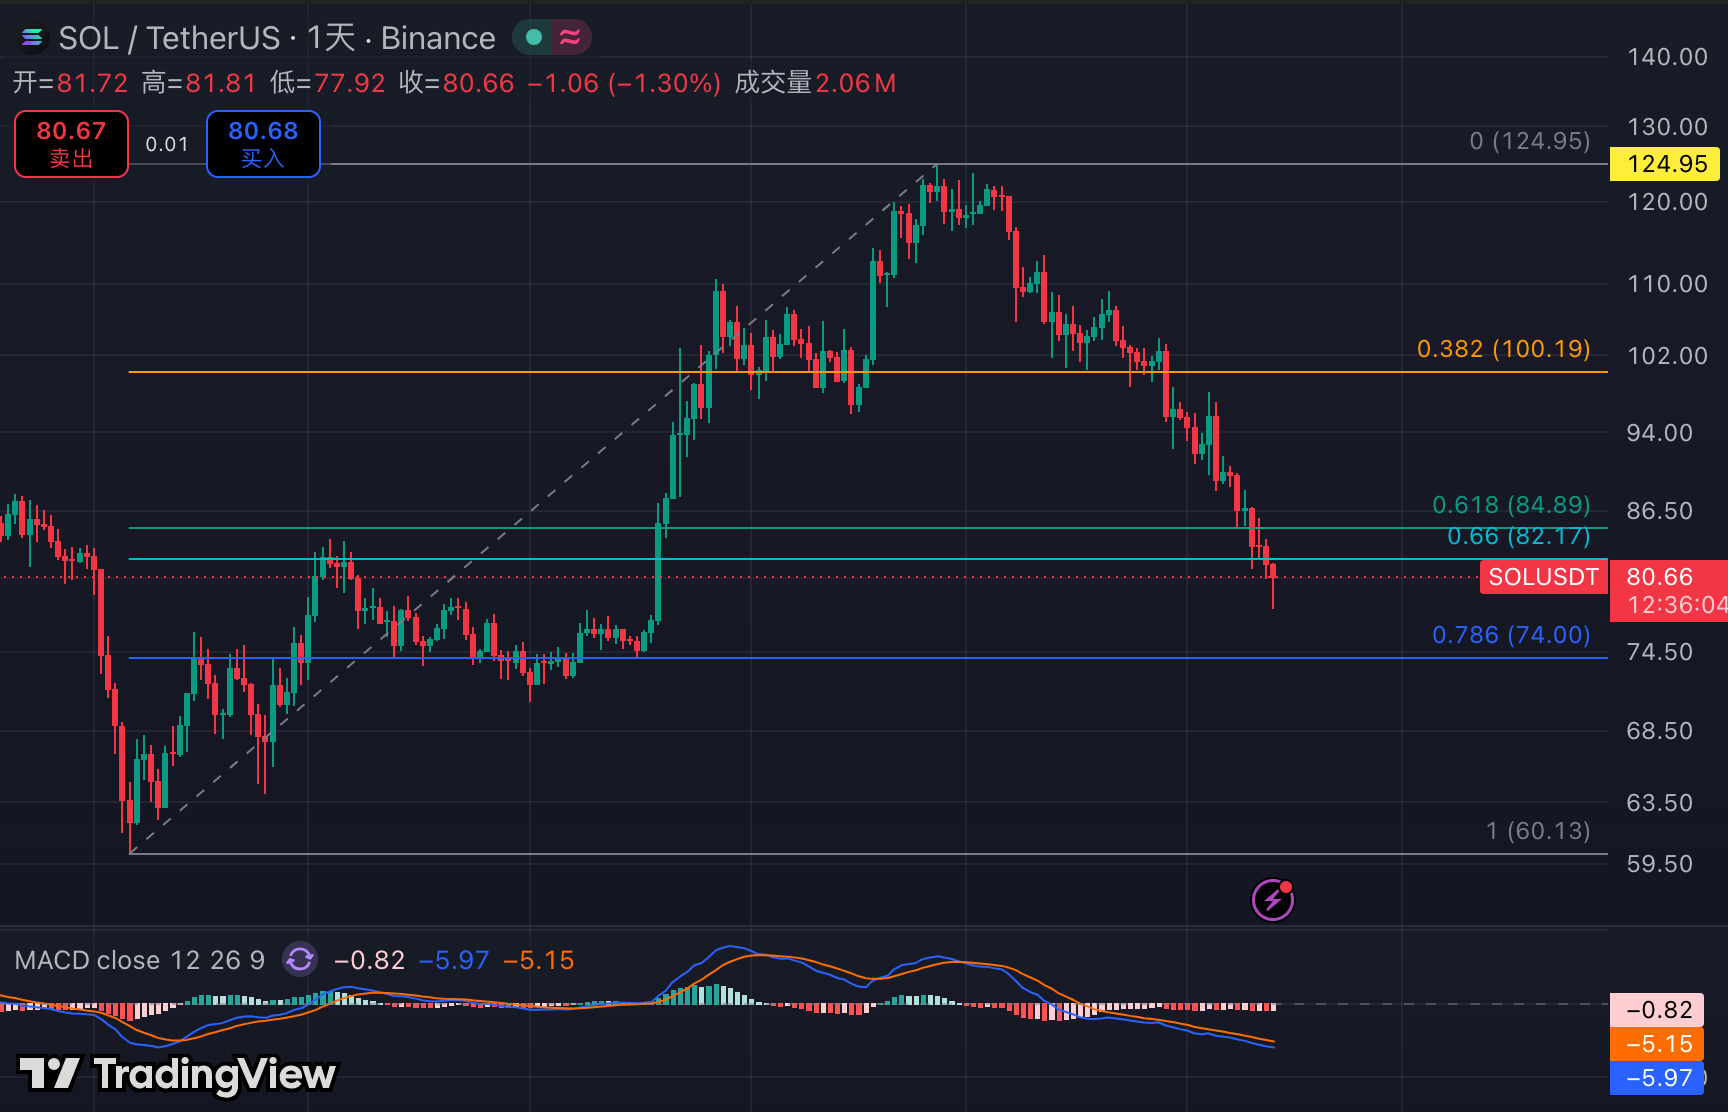
$SOL This pullback is still ongoing.
It has now fallen below the 0.618–0.66 zone,
so the short-term structure remains weak.
The next level I’m watching closely is 0.786: around $74.
If it really reaches this level,
I’ll consider starting to buy some spot in batches.
$SOL
{future}(SOLUSDT)
⛰️
This is not investment or trading advice.
$SOL This pullback is still ongoing.
It has now fallen below the 0.618–0.66 zone,
so the short-term structure remains weak.
The next level I’m watching closely is 0.786: around $74.
If it really reaches this level,
I’ll consider starting to buy some spot in batches.
$SOL
⛰️
This is not investment or trading advice.
It has now fallen below the 0.618–0.66 zone,
so the short-term structure remains weak.
The next level I’m watching closely is 0.786: around $74.
If it really reaches this level,
I’ll consider starting to buy some spot in batches.
$SOL
⛰️
This is not investment or trading advice.
1
1
5k
·
--
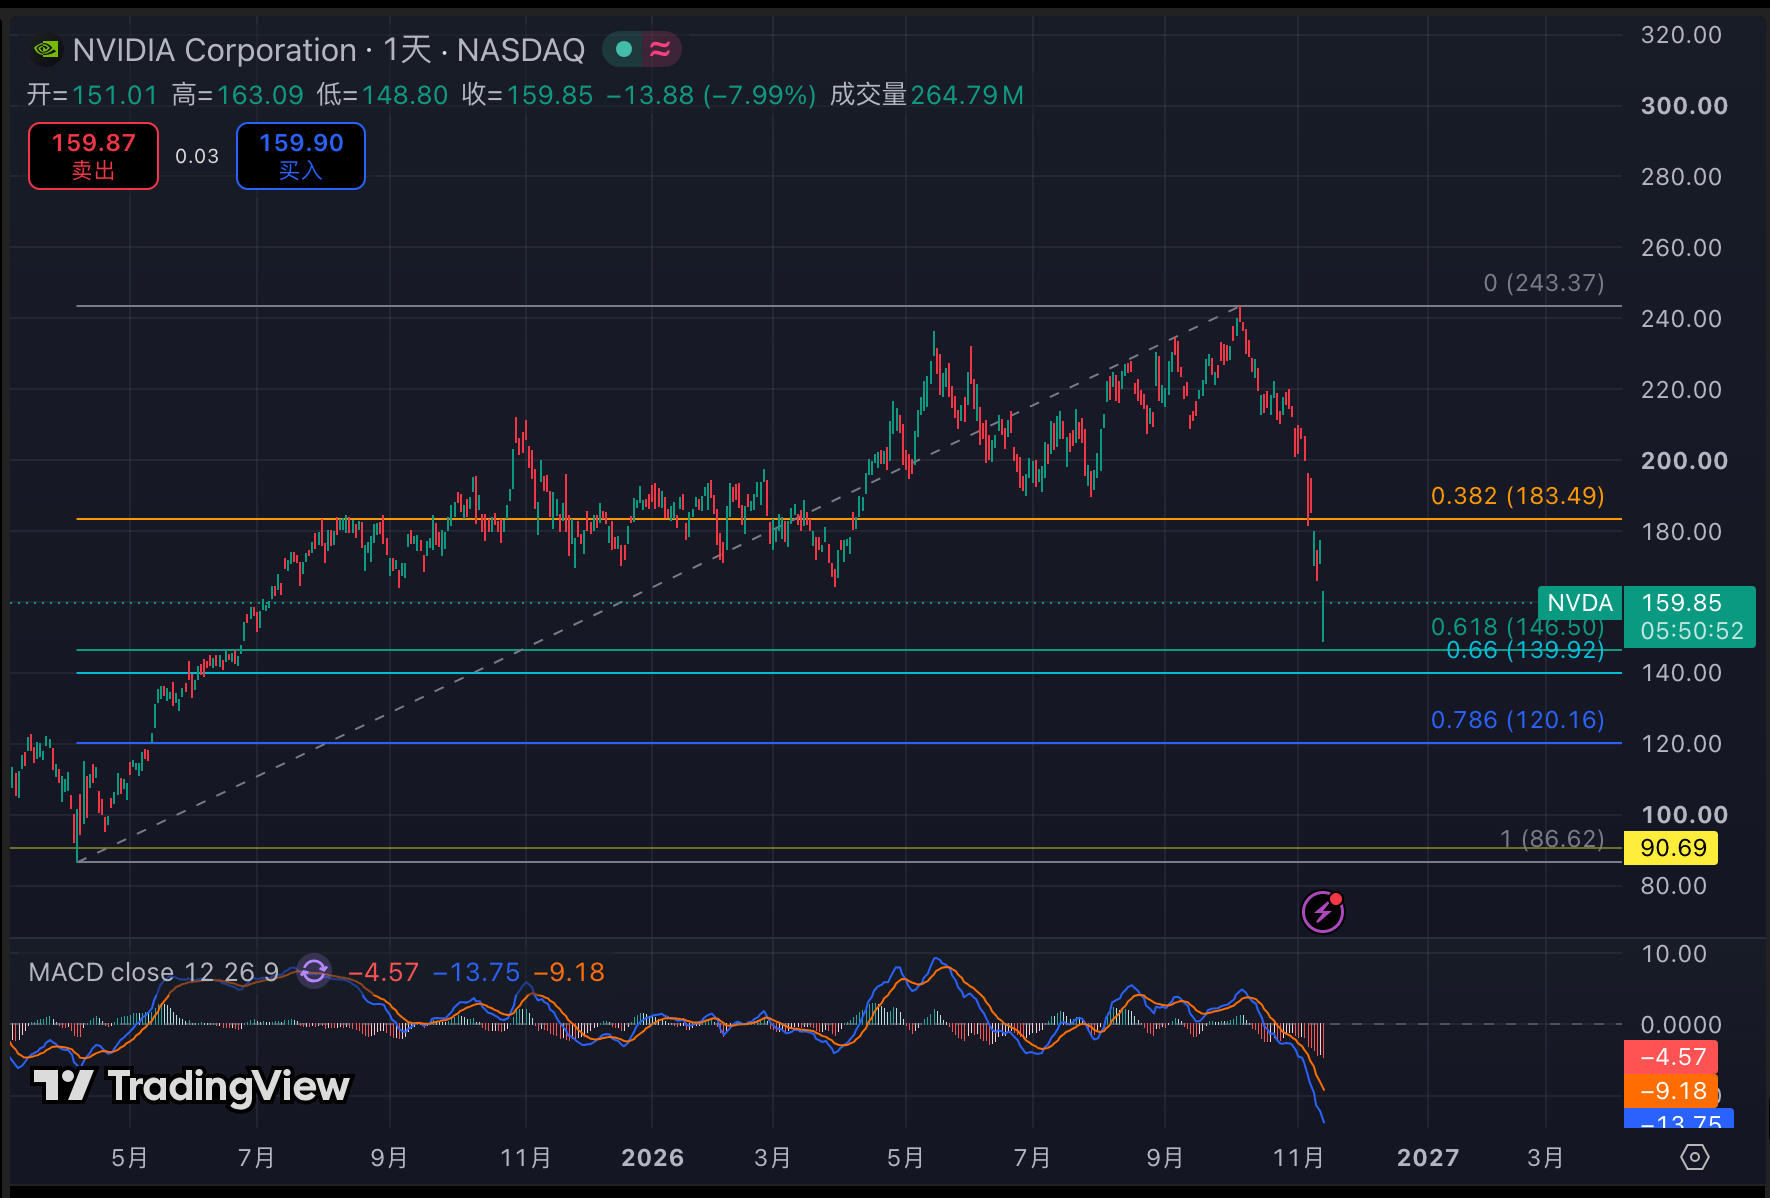
$NVDA has finally pulled back.
The $140 level I've been waiting for
now doesn't seem too far away.
The 0.618–0.66 range on the chart is roughly $146–140.
I wonder if we'll really get an opportunity this time.
$NVDAB
{spot}(NVDABUSDT)
⛰️
This is not investment or trading advice.
$NVDA has finally pulled back.
The $140 level I've been waiting for
now doesn't seem too far away.
The 0.618–0.66 range on the chart is roughly $146–140.
I wonder if we'll really get an opportunity this time.
$NVDAB
⛰️
This is not investment or trading advice.
The $140 level I've been waiting for
now doesn't seem too far away.
The 0.618–0.66 range on the chart is roughly $146–140.
I wonder if we'll really get an opportunity this time.
$NVDAB
⛰️
This is not investment or trading advice.
503
·
--
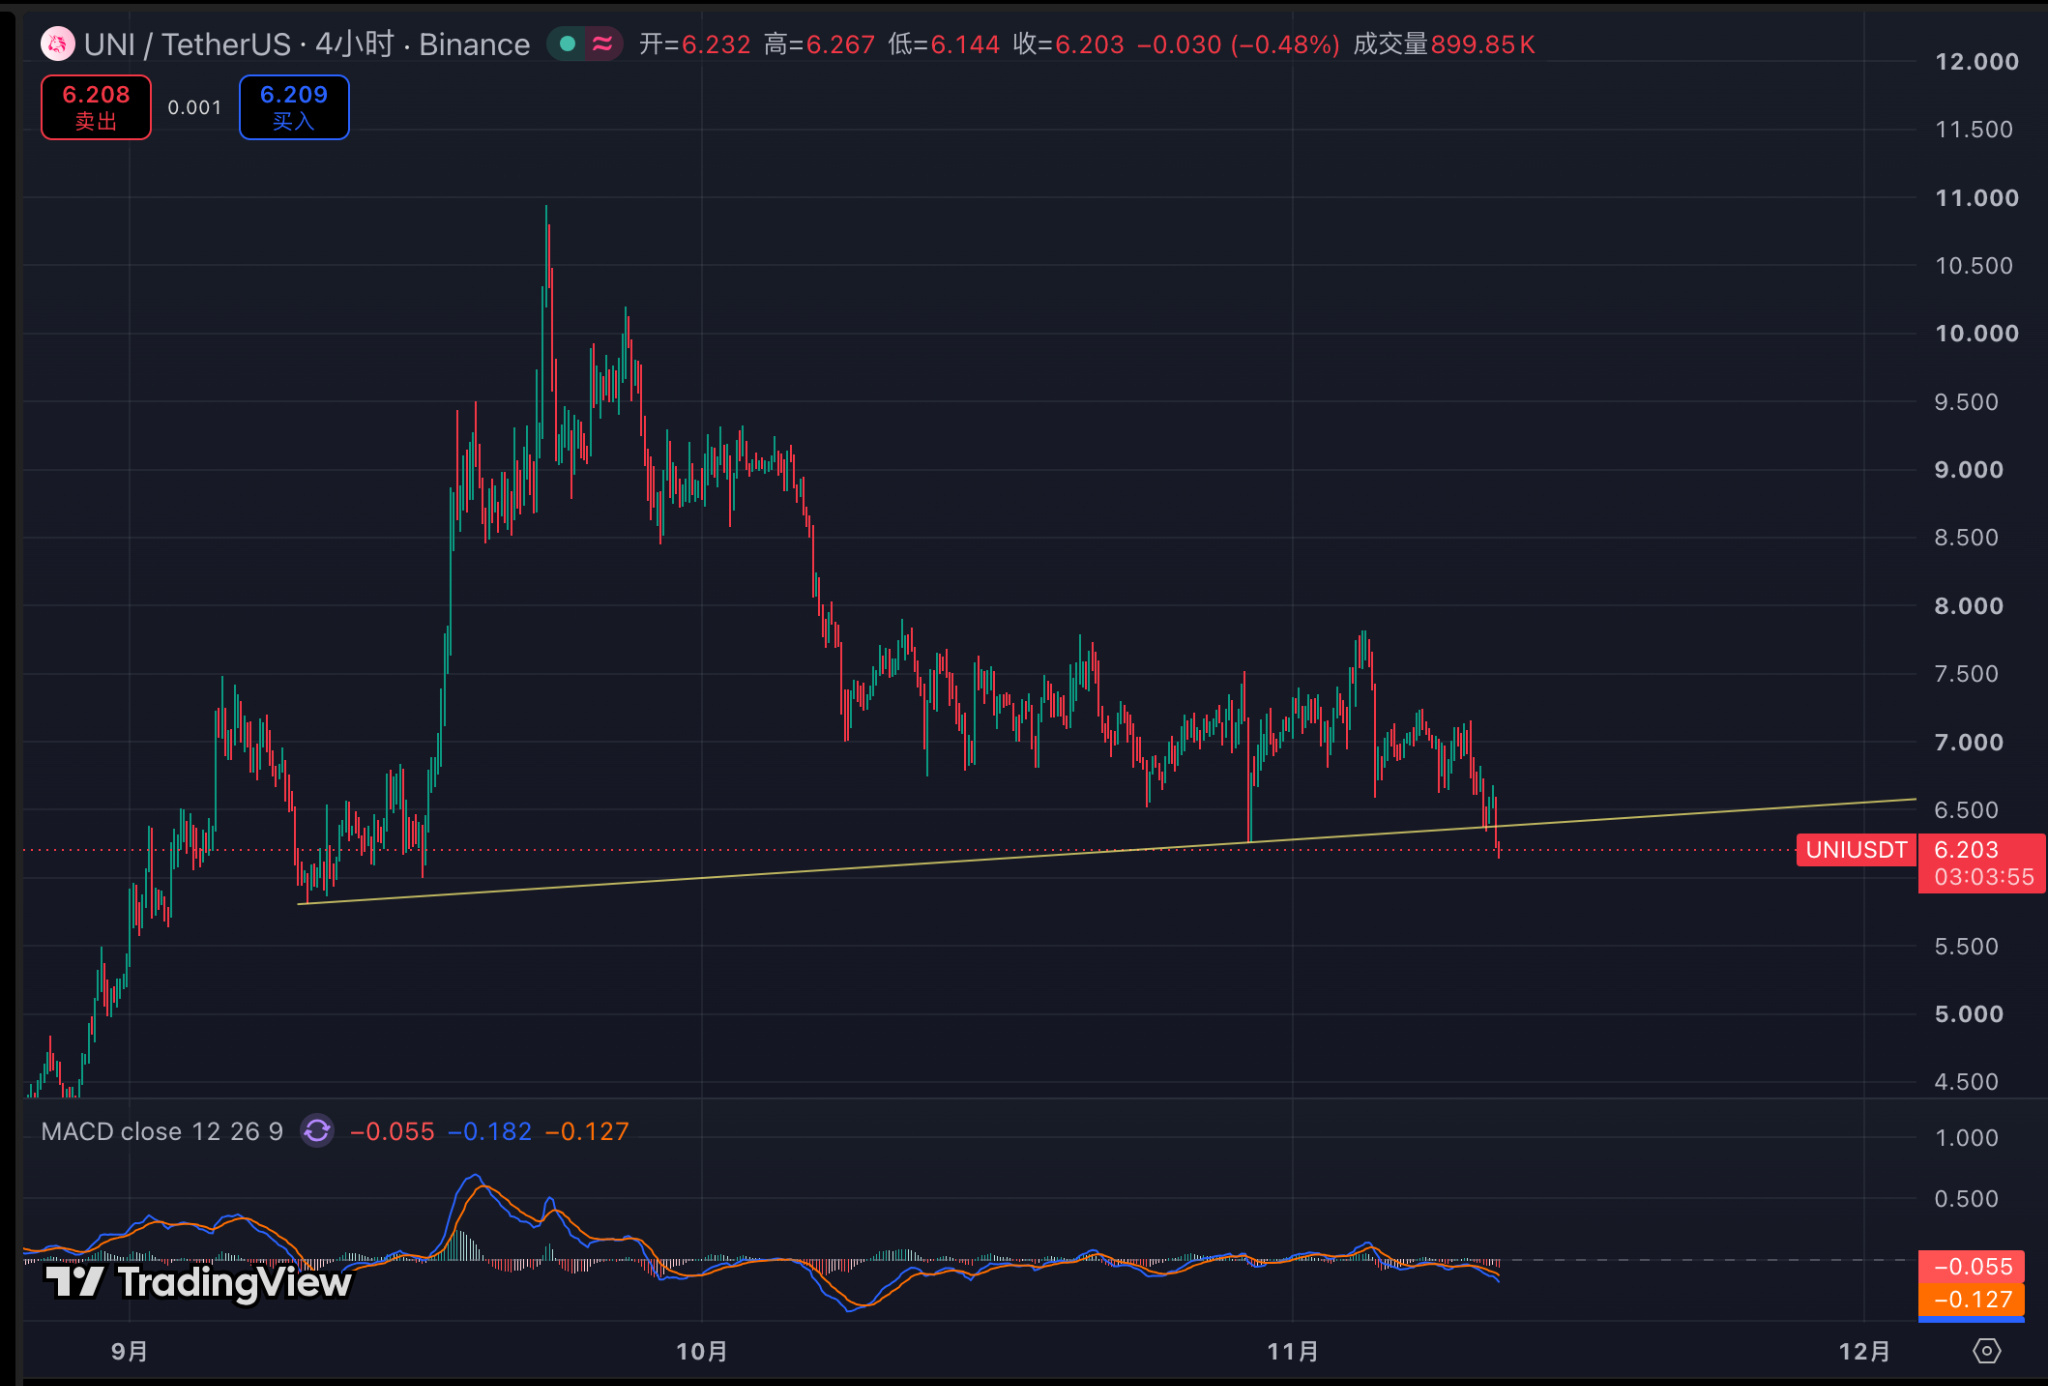
$UNI 4 hours have already fallen below the short-term trendline.
Now it all comes down to whether it can quickly reclaim it.
Reclaim the trendline → there's still a chance of recovery.
Fail to reclaim it → the short-term structure remains weak.
$UNI
{future}(UNIUSDT)
I ⛰️
This does not constitute investment or trading advice.
$UNI 4 hours have already fallen below the short-term trendline.
Now it all comes down to whether it can quickly reclaim it.
Reclaim the trendline → there's still a chance of recovery.
Fail to reclaim it → the short-term structure remains weak.
$UNI
I ⛰️
This does not constitute investment or trading advice.
Now it all comes down to whether it can quickly reclaim it.
Reclaim the trendline → there's still a chance of recovery.
Fail to reclaim it → the short-term structure remains weak.
$UNI
I ⛰️
This does not constitute investment or trading advice.
958
·
--
Semiconductors rebounded across the board last night!
The SOX index rose 5.7%, with all constituents closing higher.
$NBISB rose 15.4%, and $CRWVB rose 24.7%.
The rebound was strong, but I’m more focused on whether future earnings can support valuations.
Continuing to research AMD, NVDA, and SMH.⛰️
Semiconductors rebounded across the board last night!
The SOX index rose 5.7%, with all constituents closing higher.
$NBISB rose 15.4%, and $CRWVB rose 24.7%.
The rebound was strong, but I’m more focused on whether future earnings can support valuations.
Continuing to research AMD, NVDA, and SMH.⛰️
The SOX index rose 5.7%, with all constituents closing higher.
$NBISB rose 15.4%, and $CRWVB rose 24.7%.
The rebound was strong, but I’m more focused on whether future earnings can support valuations.
Continuing to research AMD, NVDA, and SMH.⛰️
308
·
--
$CRWVB Third-quarter revenue was $3.66 billion, up nearly 170% year over year.
The order backlog stood at $132.5 billion, but debt was also as high as $46.9 billion.
AI demand is indeed strong.
But revenue growth does not mean free cash flow growth.
$CRWVB Third-quarter revenue was $3.66 billion, up nearly 170% year over year.
The order backlog stood at $132.5 billion, but debt was also as high as $46.9 billion.
AI demand is indeed strong.
But revenue growth does not mean free cash flow growth.
The order backlog stood at $132.5 billion, but debt was also as high as $46.9 billion.
AI demand is indeed strong.
But revenue growth does not mean free cash flow growth.
65
·
--
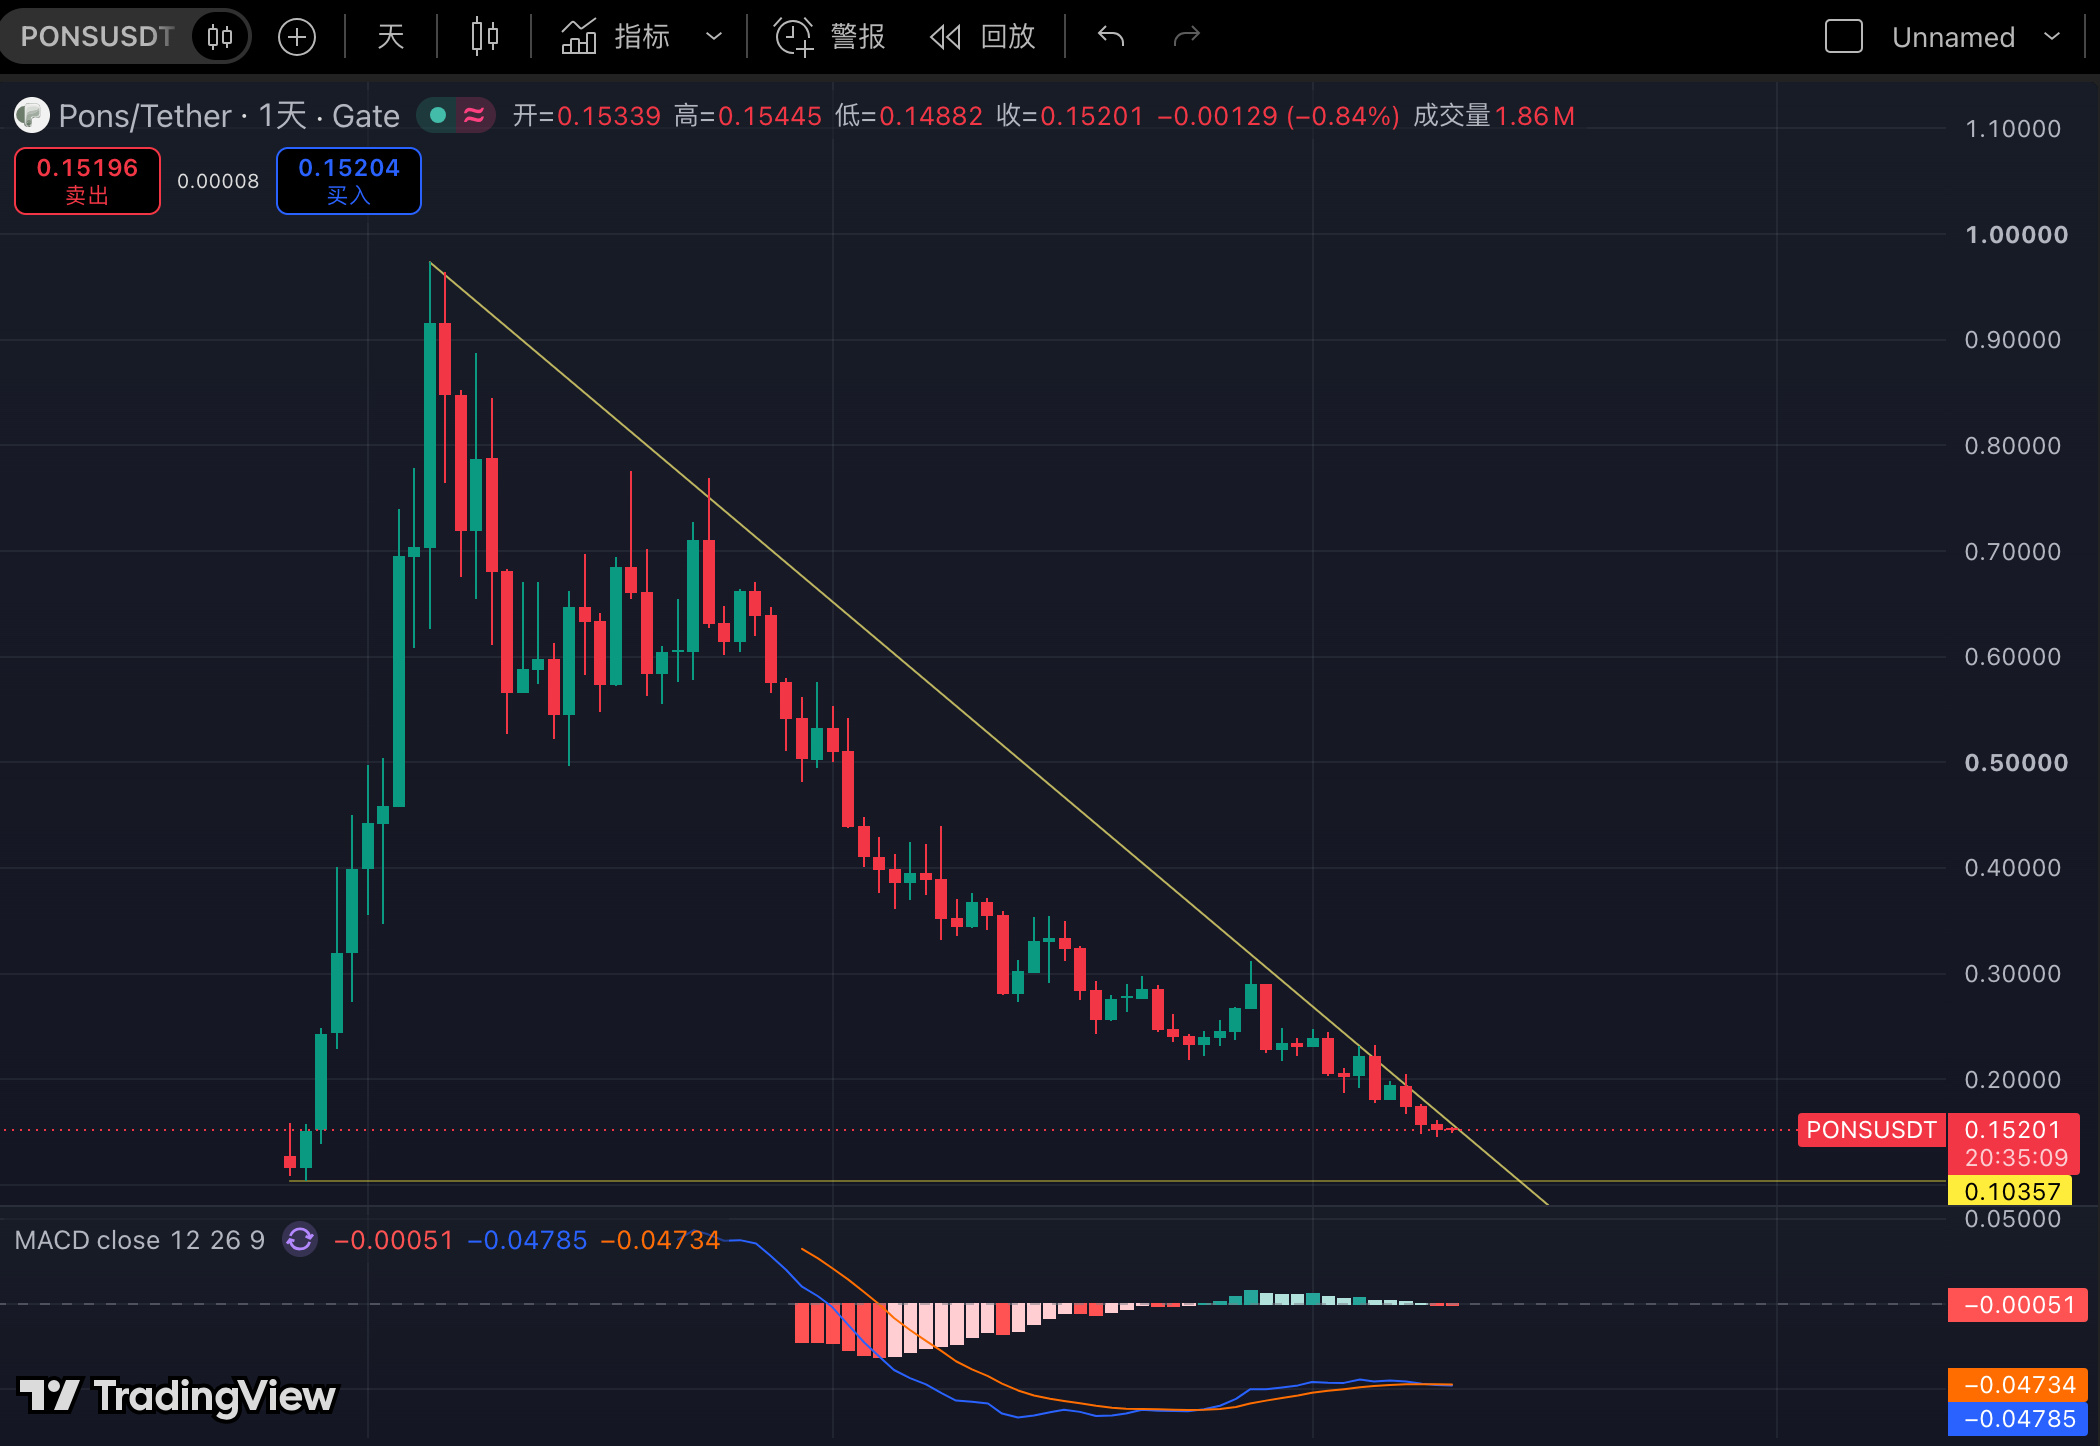
$PONS has been falling for so long,
I finally know where the bottom is.
Probably somewhere around $0.10. 😂
Hope it doesn't change my understanding again.
$PONS
{future}(PONSUSDT)
⛰️
Not investment or trading advice.
$PONS has been falling for so long,
I finally know where the bottom is.
Probably somewhere around $0.10. 😂
Hope it doesn't change my understanding again.
$PONS
⛰️
Not investment or trading advice.
I finally know where the bottom is.
Probably somewhere around $0.10. 😂
Hope it doesn't change my understanding again.
$PONS
⛰️
Not investment or trading advice.
1
844
·
--
Verified
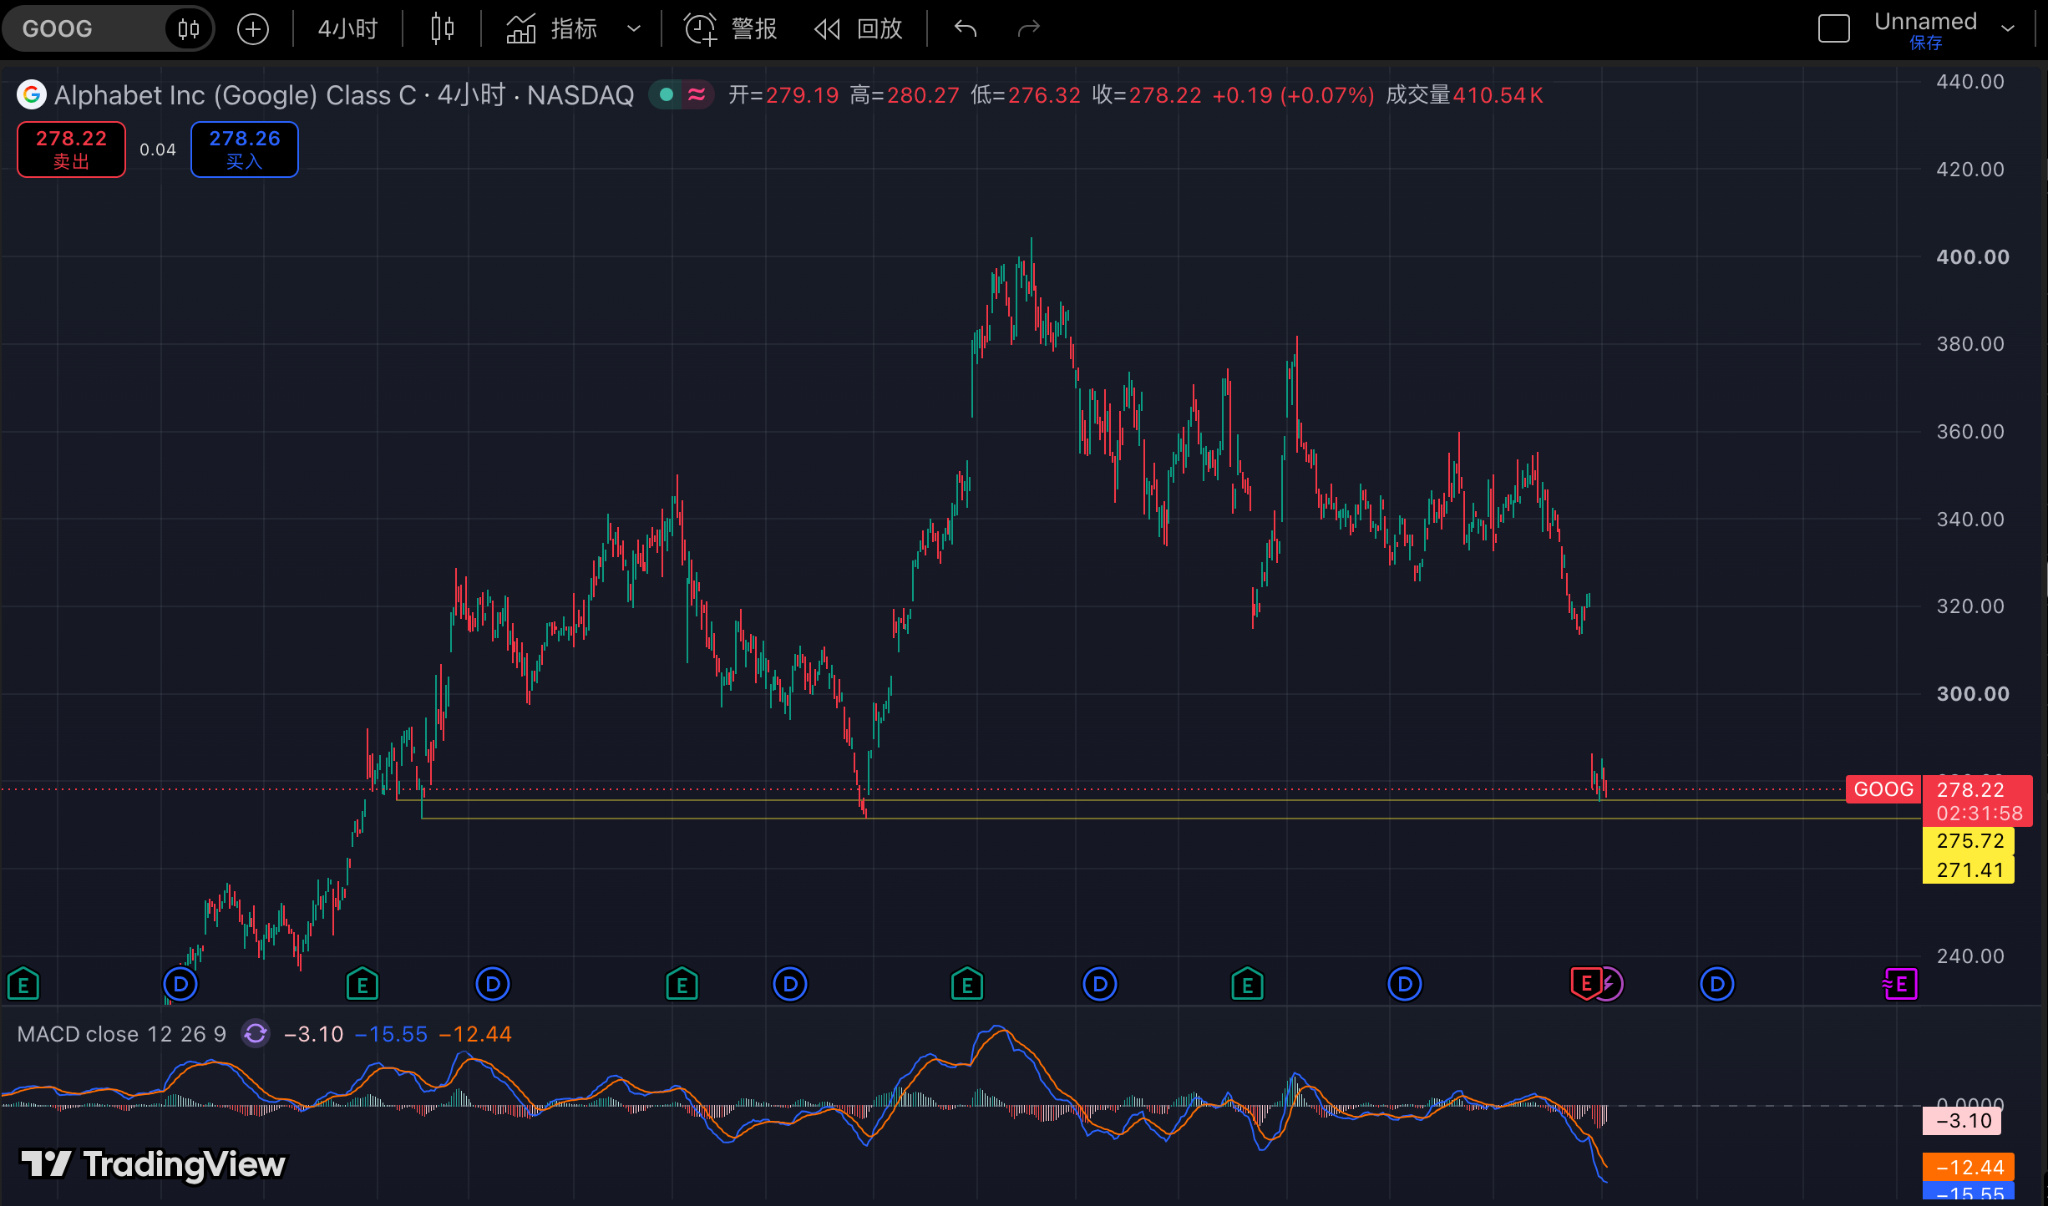
$GOOG has reached the first buying zone I set earlier.
It’s now around $278,
with my focus on $275–270.
I’ll start buying in batches here.
A good company—wait for a good price before buying.
$GOOGLB
⛰️
This is not investment or trading advice.
$GOOG has reached the first buying zone I set earlier.
It’s now around $278,
with my focus on $275–270.
I’ll start buying in batches here.
A good company—wait for a good price before buying.
$GOOGLB
⛰️
This is not investment or trading advice.
It’s now around $278,
with my focus on $275–270.
I’ll start buying in batches here.
A good company—wait for a good price before buying.
$GOOGLB
⛰️
This is not investment or trading advice.
GOOGUS-1.72%
GOOGLB-1.31%
1.3k
·
--
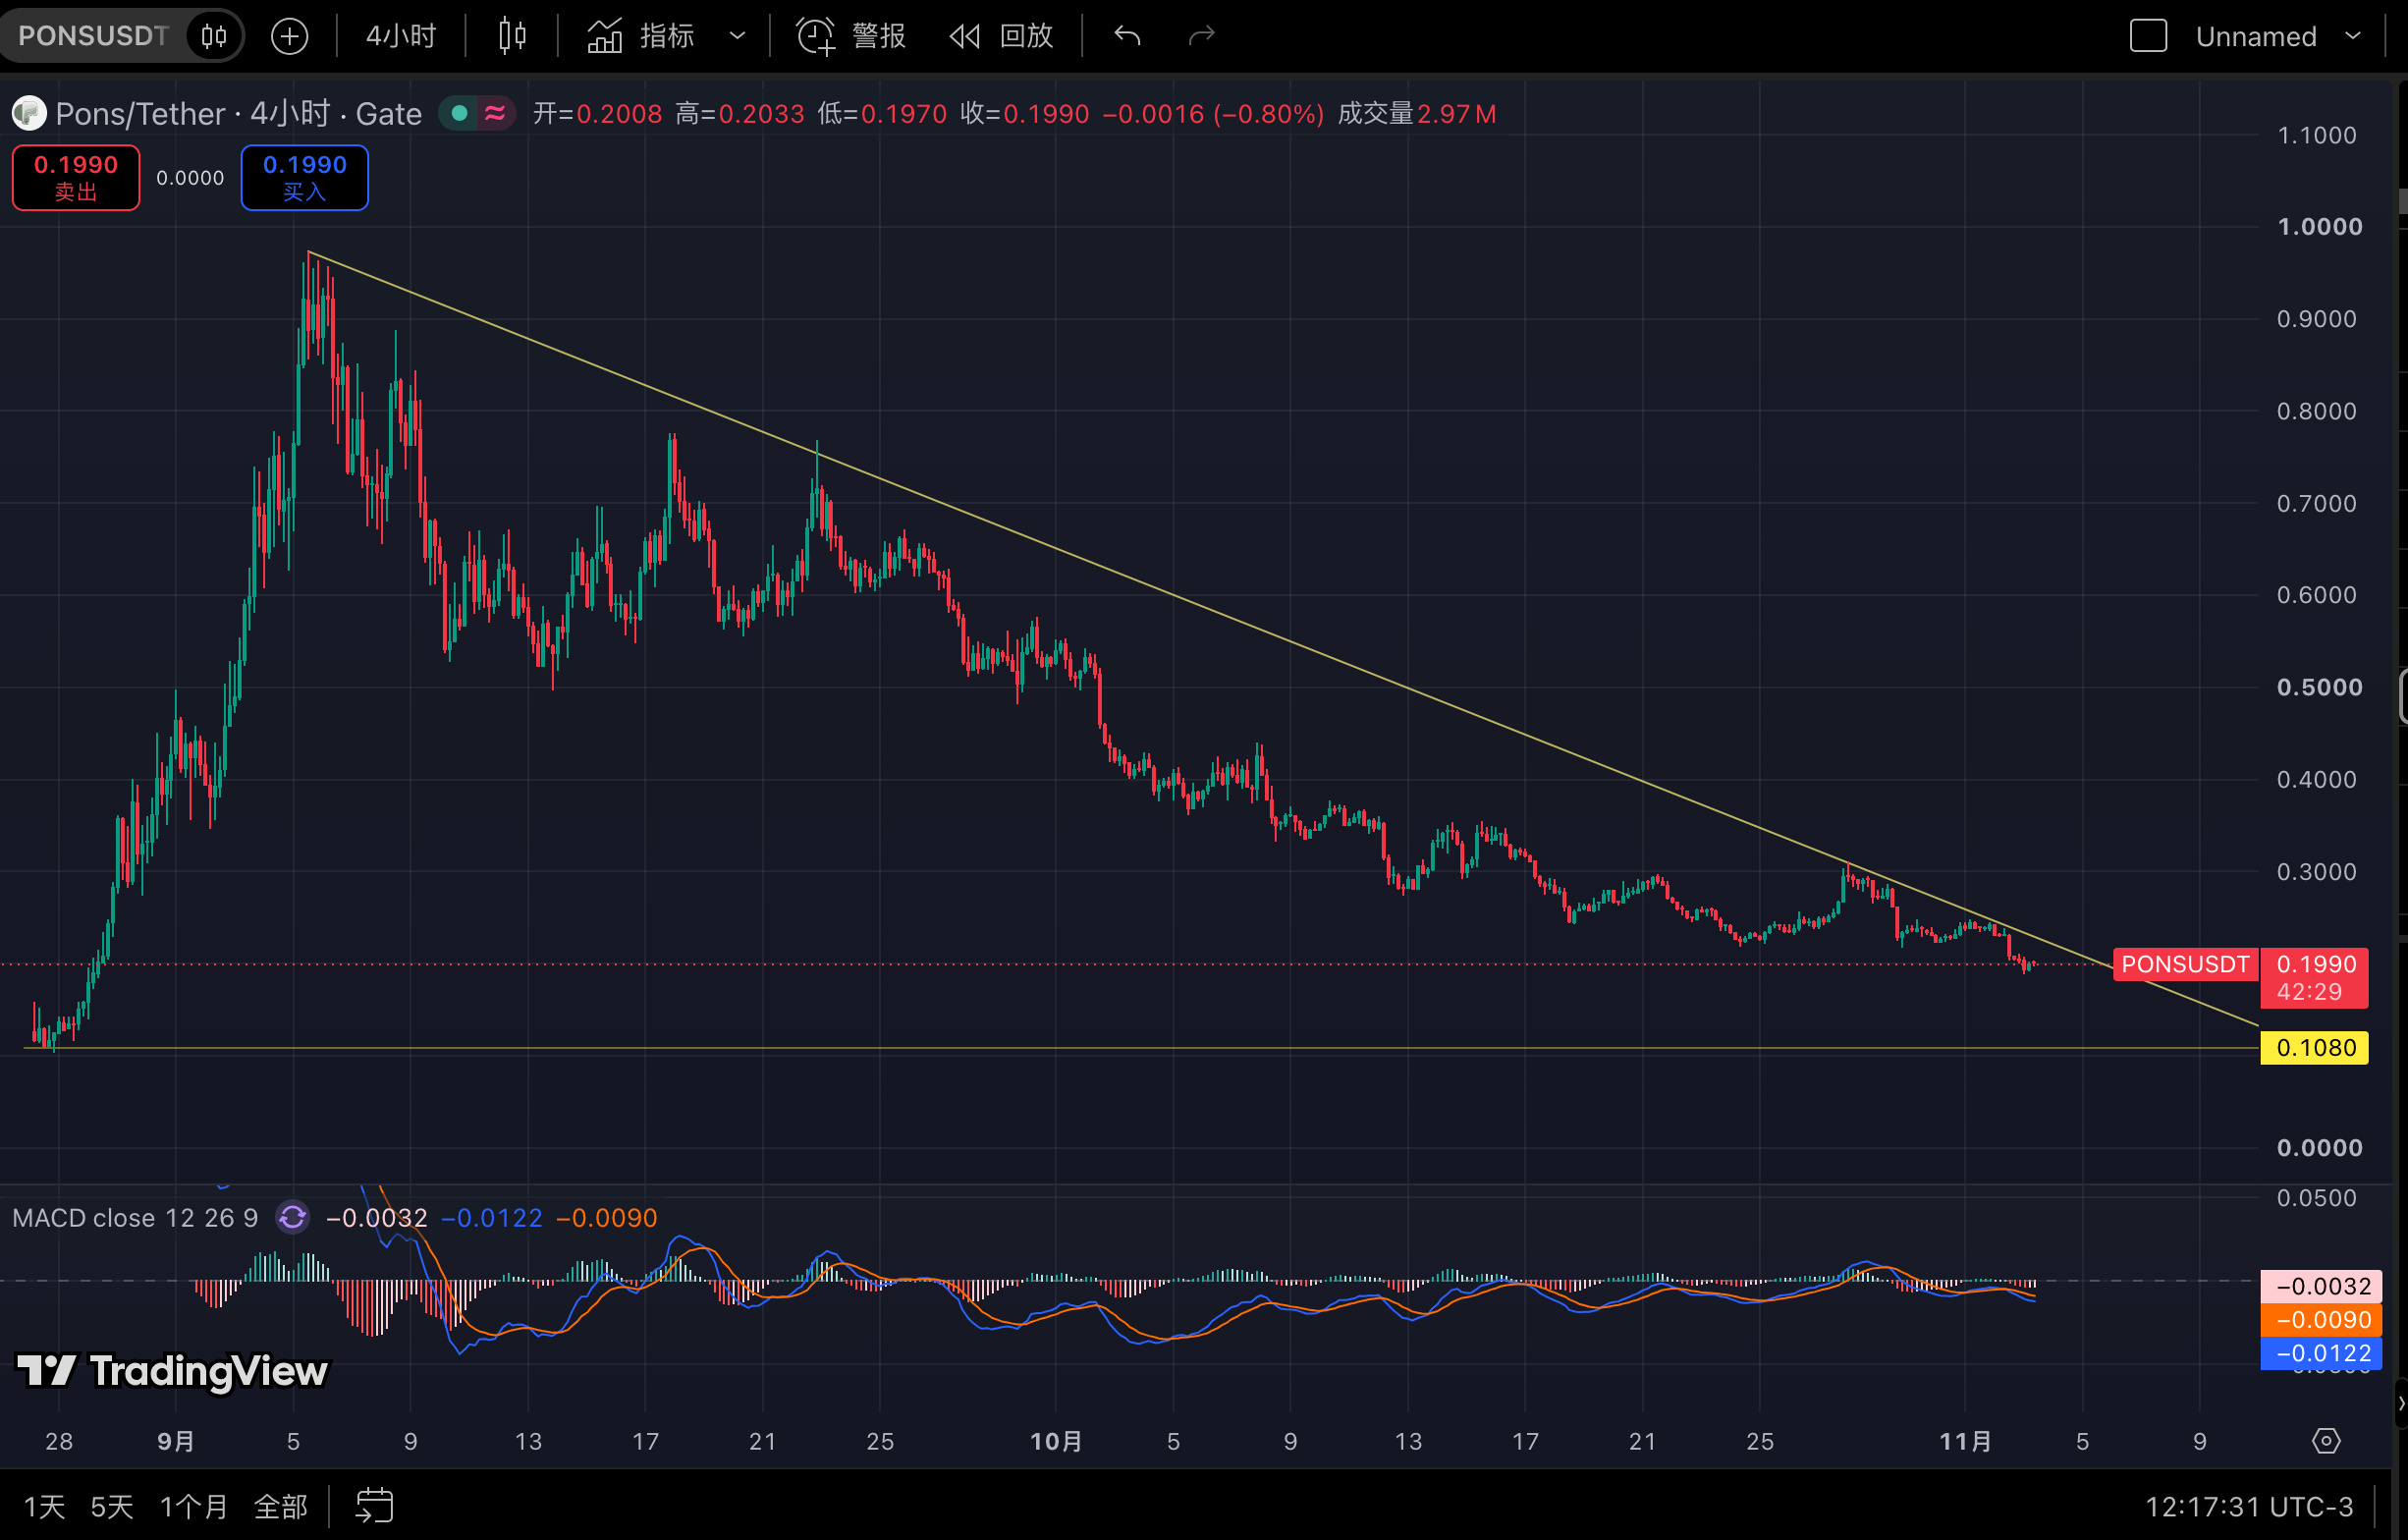
$PONS This price action is looking worse and worse.
A steady downward trend,
and now even the $0.20 level is starting to give way.
There are no clear signs of a short-term bottom,
and support below is getting weaker and weaker.
In short:
PONS isn’t necessarily at a bottom just because it’s fallen a lot.
First, wait to see when it truly bottoms out, then talk about a reversal.
$PONS
{future}(PONSUSDT)
⛰️
This is not investment or trading advice.
$PONS This price action is looking worse and worse.
A steady downward trend,
and now even the $0.20 level is starting to give way.
There are no clear signs of a short-term bottom,
and support below is getting weaker and weaker.
In short:
PONS isn’t necessarily at a bottom just because it’s fallen a lot.
First, wait to see when it truly bottoms out, then talk about a reversal.
$PONS
⛰️
This is not investment or trading advice.
A steady downward trend,
and now even the $0.20 level is starting to give way.
There are no clear signs of a short-term bottom,
and support below is getting weaker and weaker.
In short:
PONS isn’t necessarily at a bottom just because it’s fallen a lot.
First, wait to see when it truly bottoms out, then talk about a reversal.
$PONS
⛰️
This is not investment or trading advice.
1.8k
·
--
$PONS
{future}(PONSUSDT)
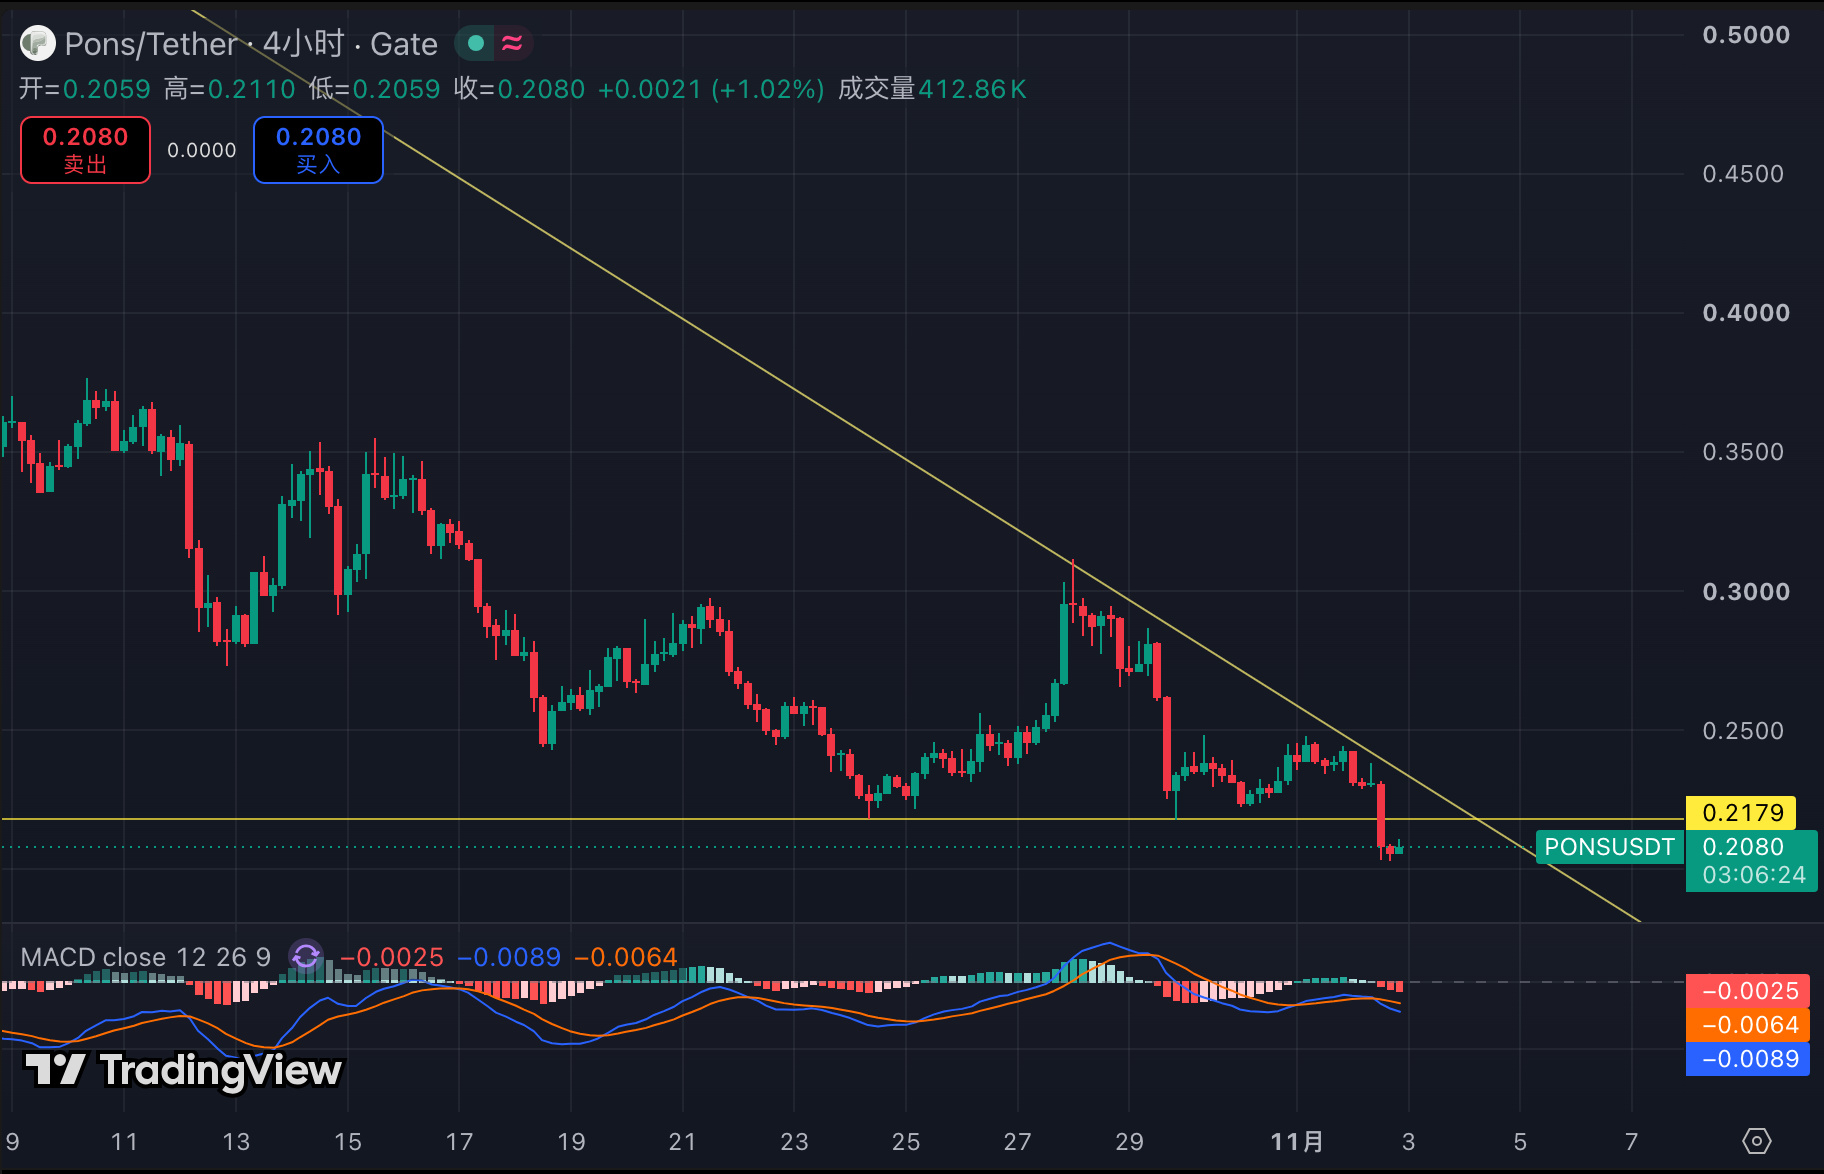
The triangle broke downward.
The $0.218 support level has already been breached,
and the price is now around $0.21.
The short-term outlook remains weak;
first, let's see whether $0.20 can find support.
To turn bullish again,
the price needs to reclaim at least $0.218–0.23.
There's no need to rush to call the bottom.⛰️
This is not investment or trading advice.
$PONS
The triangle broke downward.
The $0.218 support level has already been breached,
and the price is now around $0.21.
The short-term outlook remains weak;
first, let's see whether $0.20 can find support.
To turn bullish again,
the price needs to reclaim at least $0.218–0.23.
There's no need to rush to call the bottom.⛰️
This is not investment or trading advice.
The triangle broke downward.
The $0.218 support level has already been breached,
and the price is now around $0.21.
The short-term outlook remains weak;
first, let's see whether $0.20 can find support.
To turn bullish again,
the price needs to reclaim at least $0.218–0.23.
There's no need to rush to call the bottom.⛰️
This is not investment or trading advice.
1
1.5k
·
--
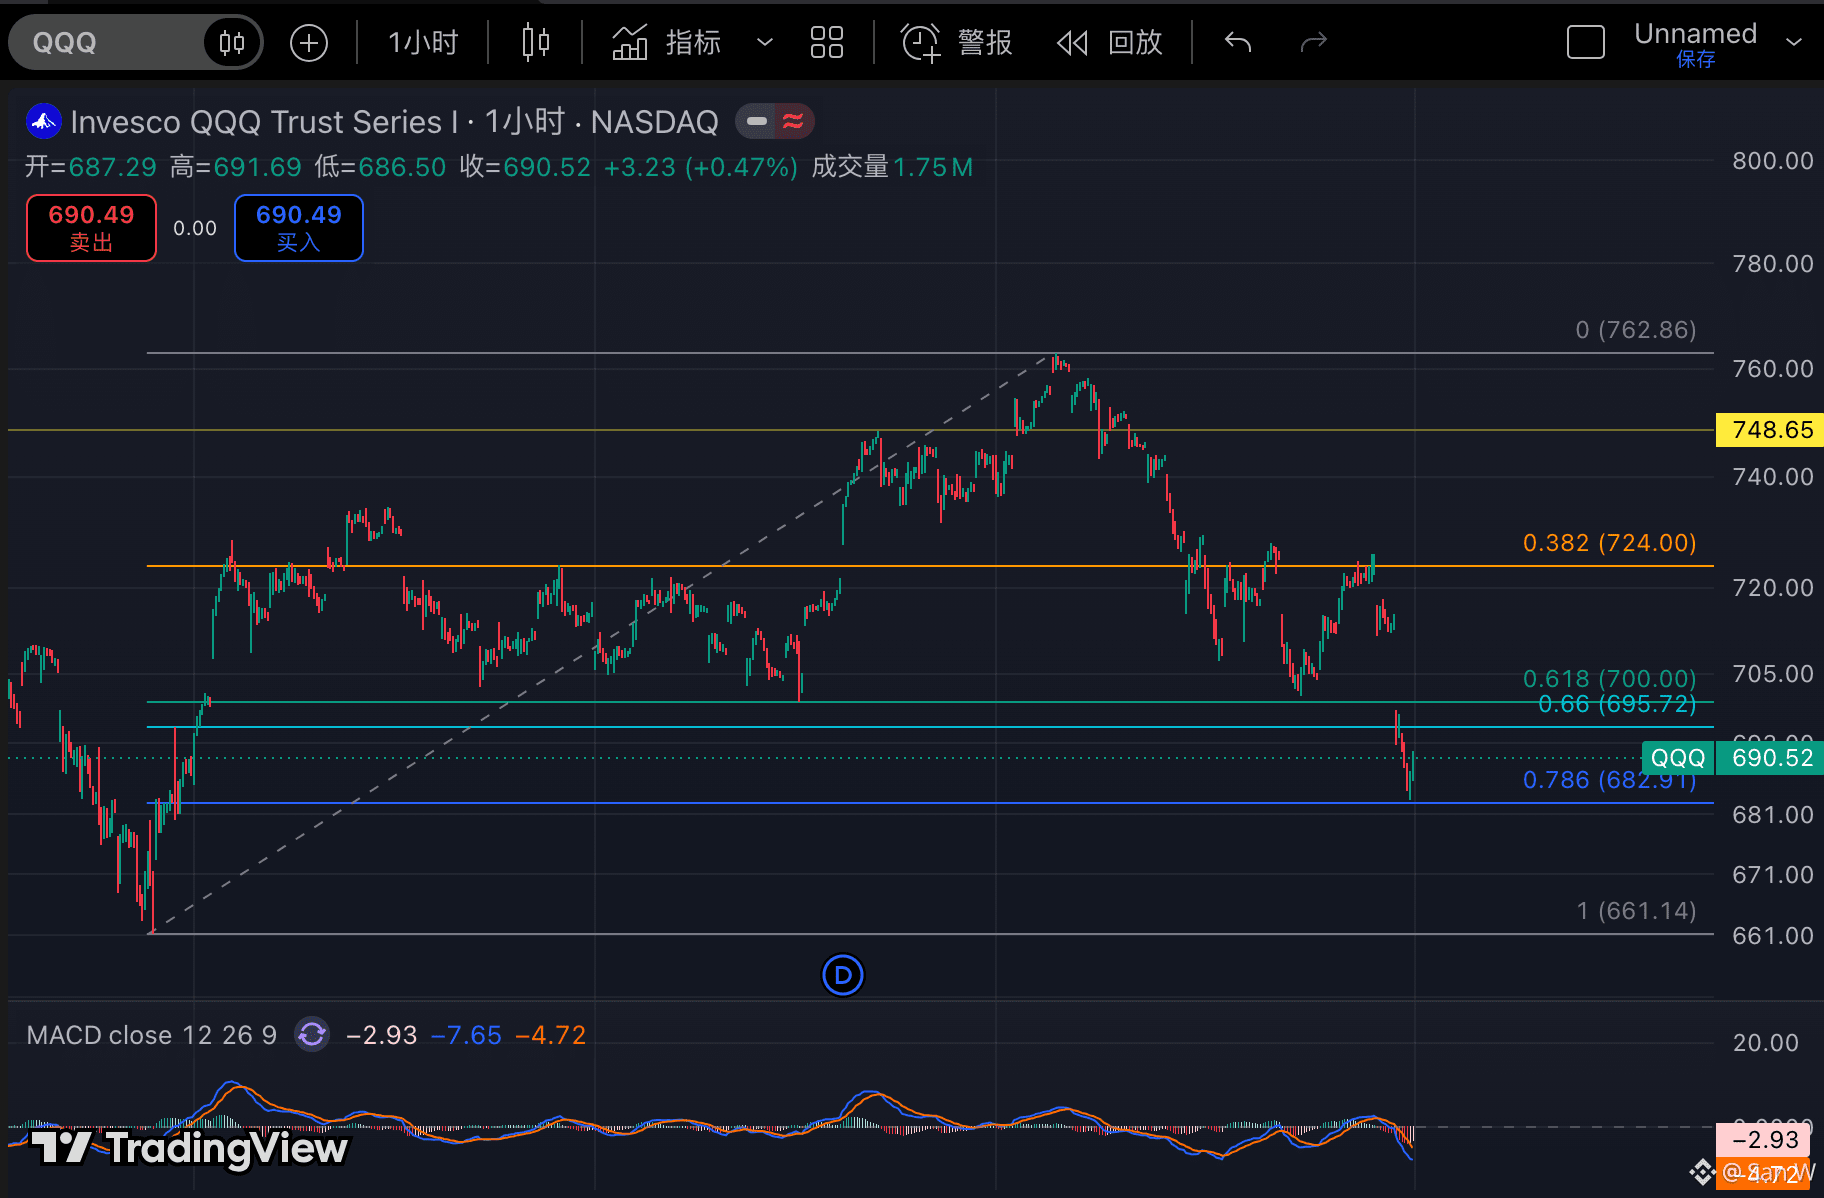
$QQQ has finally reached 0.786 in this pullback.
That’s around $683.
We’re seeing some buying support,
but MACD is still relatively weak.
What I’m watching now:
Hold above 683 → look for a rebound and recovery
Break below 683 → stay alert for a deeper pullback
$QQQB
{spot}(QQQBUSDT)
⛰️
This is not investment or trading advice.
$QQQ has finally reached 0.786 in this pullback.
That’s around $683.
We’re seeing some buying support,
but MACD is still relatively weak.
What I’m watching now:
Hold above 683 → look for a rebound and recovery
Break below 683 → stay alert for a deeper pullback
$QQQB
⛰️
This is not investment or trading advice.
That’s around $683.
We’re seeing some buying support,
but MACD is still relatively weak.
What I’m watching now:
Hold above 683 → look for a rebound and recovery
Break below 683 → stay alert for a deeper pullback
$QQQB
⛰️
This is not investment or trading advice.
194
·
--
Semiconductors took quite a hit last night.
The Philadelphia Semiconductor Index fell 7.2%.
$AMDB fell 10.9%.
$NVDAB fell 4.2%.
But what I’m more focused on now is:
Have earnings forecasts for the future fallen in line with the share prices?
If fundamentals haven’t deteriorated significantly, the valuation adjustment could create an opportunity.
I’ll keep watching—no rush to buy the dip.
Semiconductors took quite a hit last night.
The Philadelphia Semiconductor Index fell 7.2%.
$AMDB fell 10.9%.
$NVDAB fell 4.2%.
But what I’m more focused on now is:
Have earnings forecasts for the future fallen in line with the share prices?
If fundamentals haven’t deteriorated significantly, the valuation adjustment could create an opportunity.
I’ll keep watching—no rush to buy the dip.
The Philadelphia Semiconductor Index fell 7.2%.
$AMDB fell 10.9%.
$NVDAB fell 4.2%.
But what I’m more focused on now is:
Have earnings forecasts for the future fallen in line with the share prices?
If fundamentals haven’t deteriorated significantly, the valuation adjustment could create an opportunity.
I’ll keep watching—no rush to buy the dip.
140
·
--
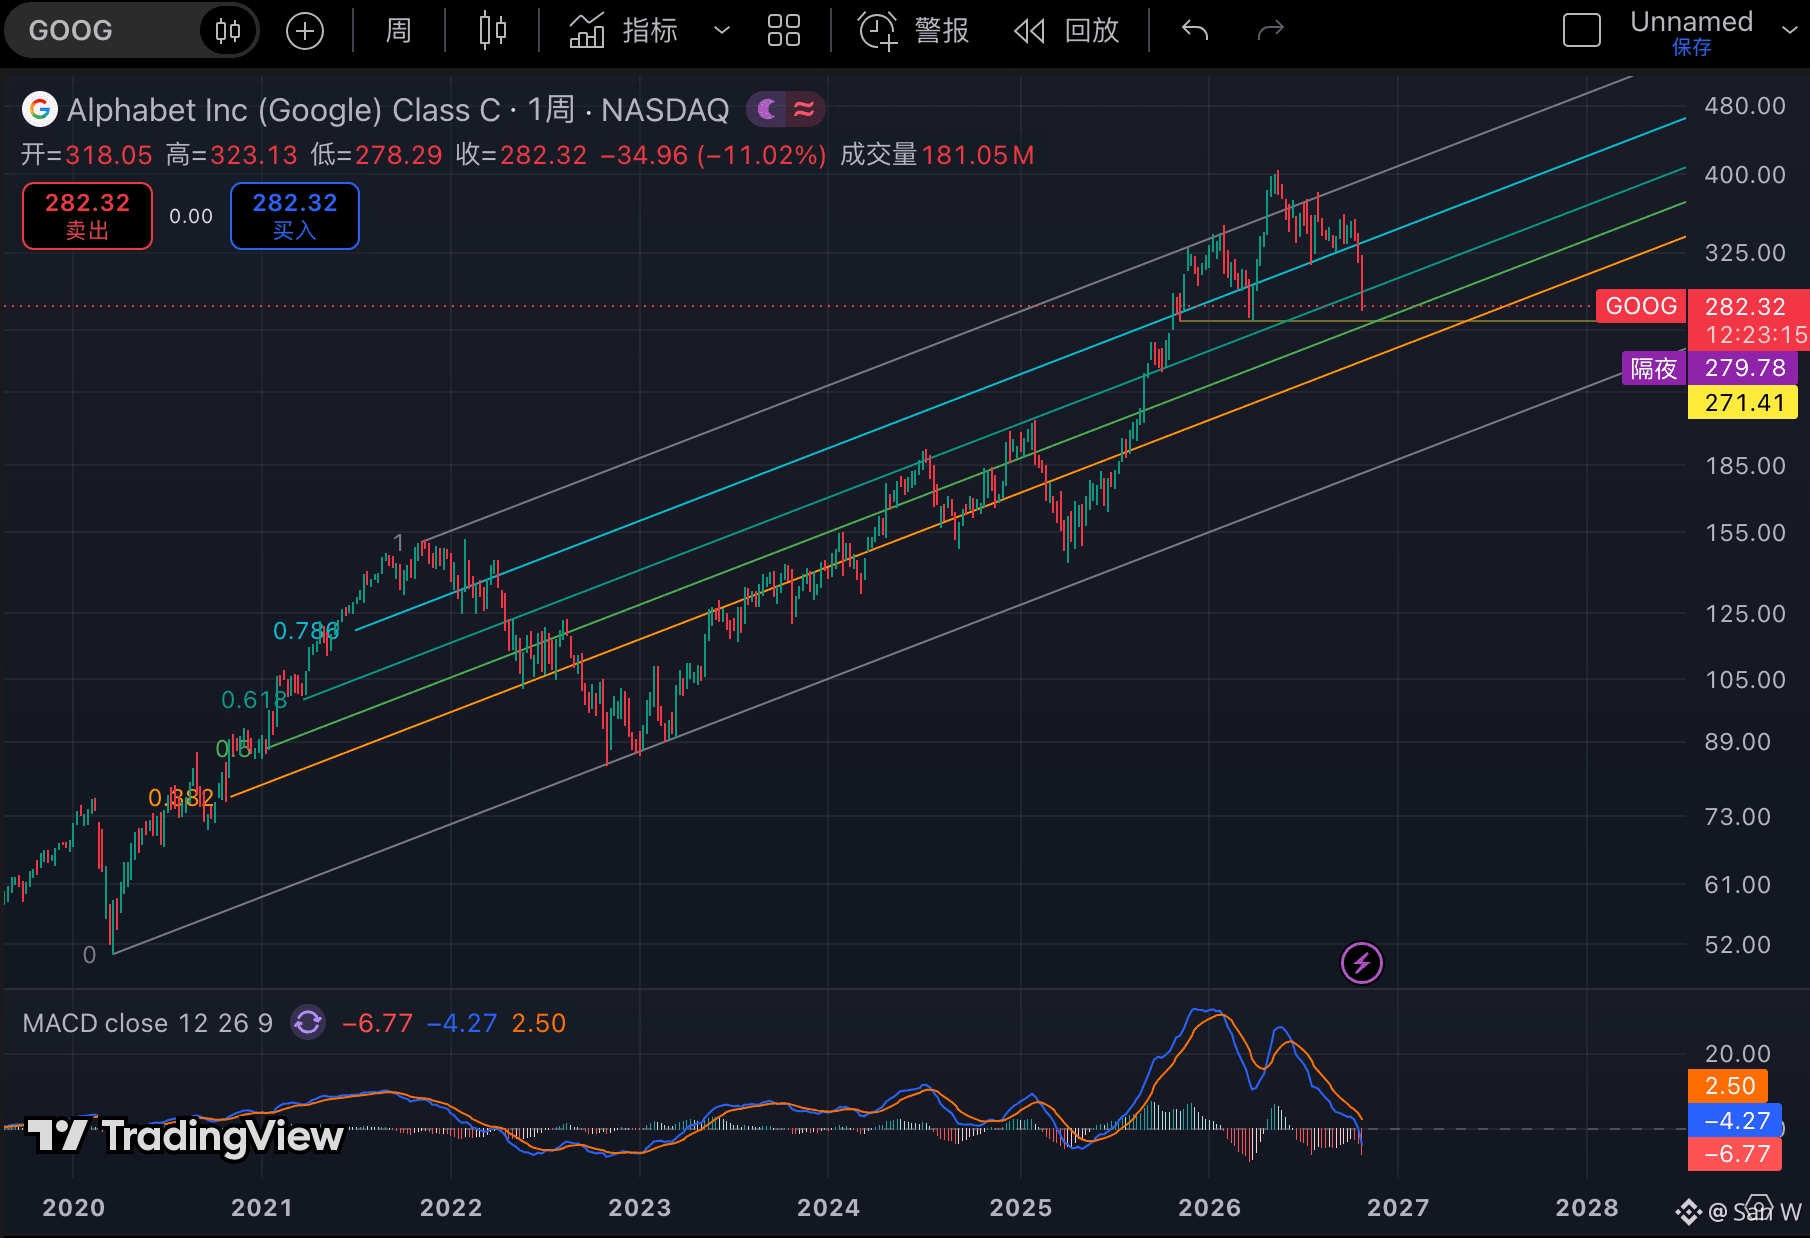
$GOOG has been in a long-term uptrend from March 2020 to now.
Although this pullback is quite deep,
it hasn't yet broken the larger-scale uptrend structure.
I'm paying the most attention to around $270.
MACD is still weakening,
so there's no rush to call a bottom.
If it holds above 270, the long-term trend remains intact.
If it breaks below, I'll reassess.
$GOOGLB
{spot}(GOOGLBUSDT)
⛰️
This is not investment or trading advice.
$GOOG has been in a long-term uptrend from March 2020 to now.
Although this pullback is quite deep,
it hasn't yet broken the larger-scale uptrend structure.
I'm paying the most attention to around $270.
MACD is still weakening,
so there's no rush to call a bottom.
If it holds above 270, the long-term trend remains intact.
If it breaks below, I'll reassess.
$GOOGLB
⛰️
This is not investment or trading advice.
Although this pullback is quite deep,
it hasn't yet broken the larger-scale uptrend structure.
I'm paying the most attention to around $270.
MACD is still weakening,
so there's no rush to call a bottom.
If it holds above 270, the long-term trend remains intact.
If it breaks below, I'll reassess.
$GOOGLB
⛰️
This is not investment or trading advice.
GOOGUS-1.72%
GOOGLB-1.31%
1.8k
·
--
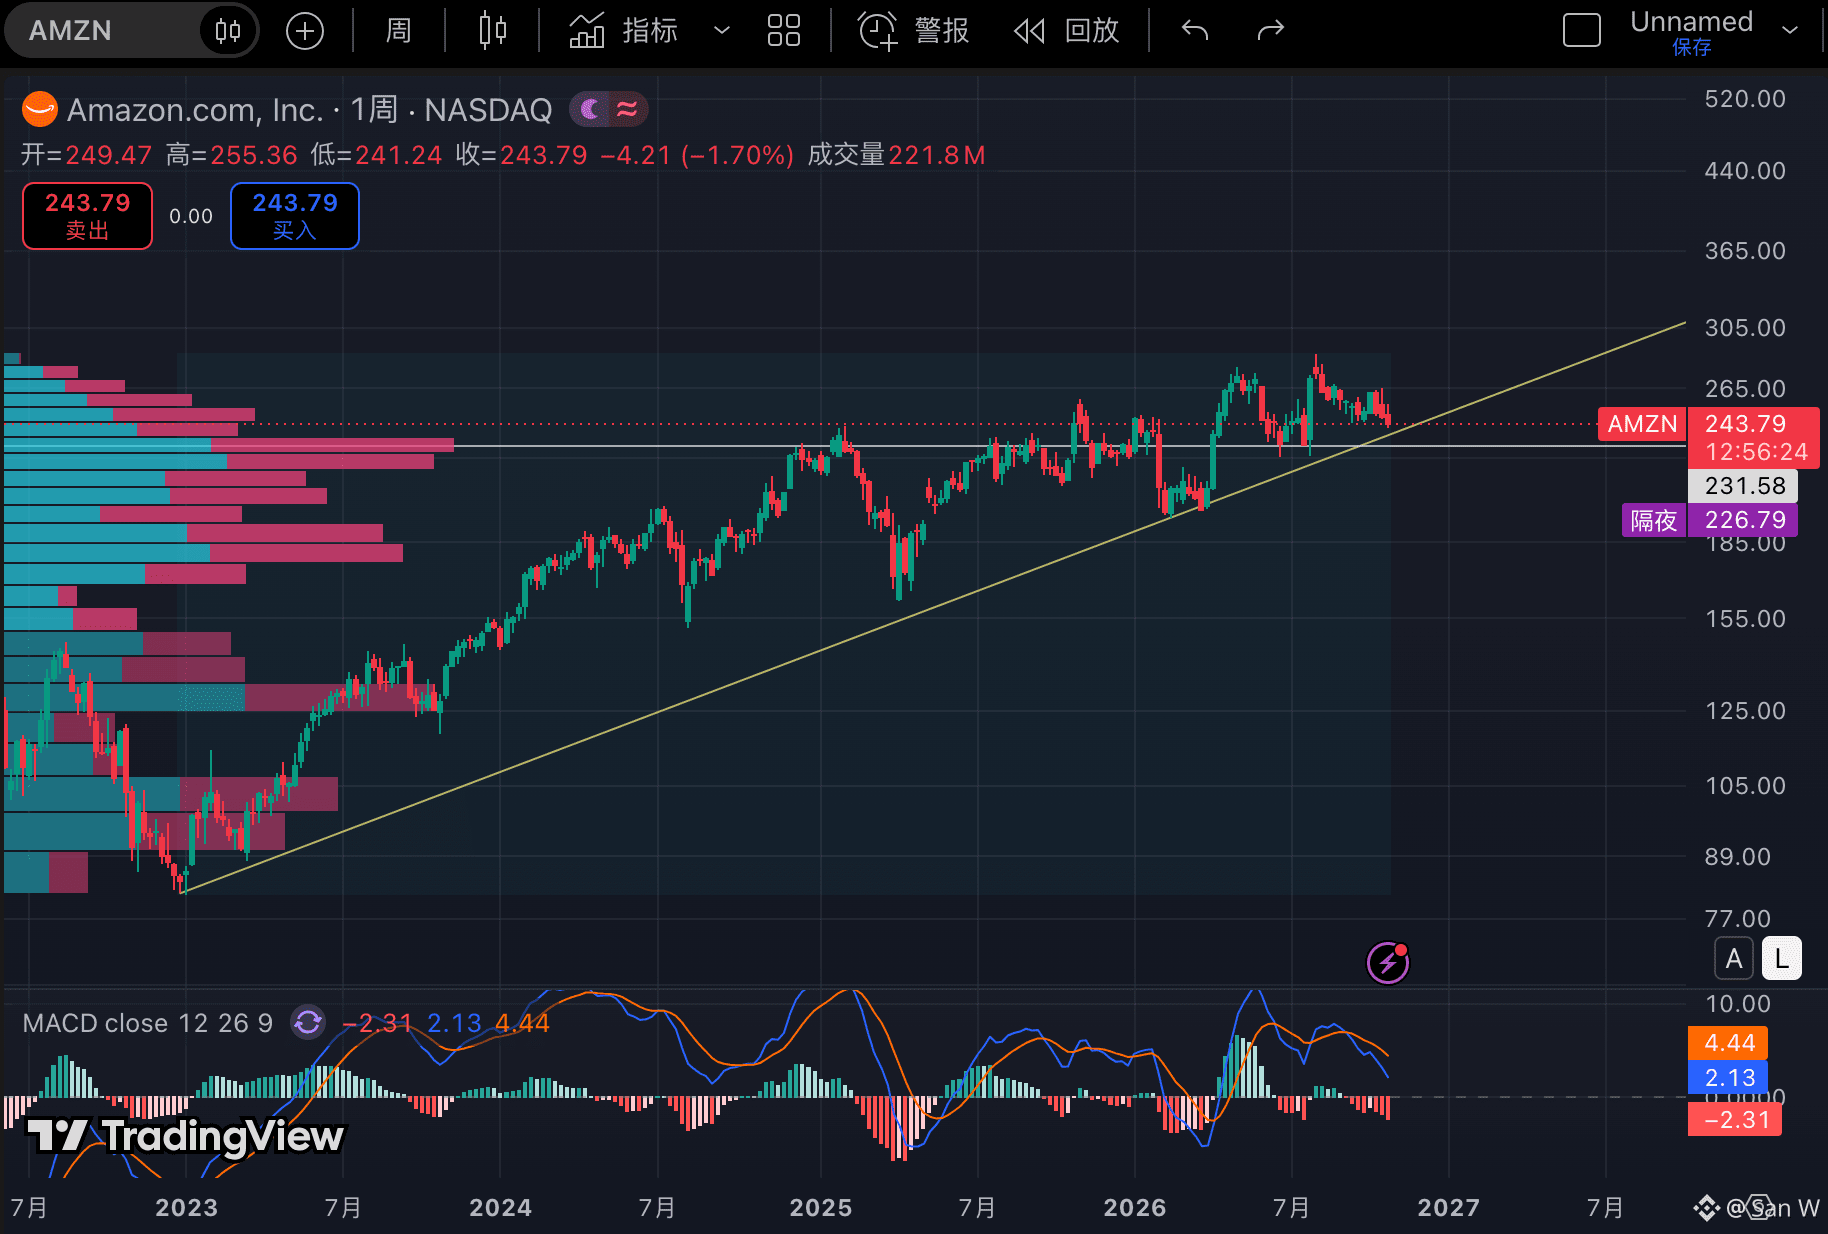
$AMZN has been in an uptrend from 2023 to the present.
The price has now returned to near the long-term trendline.
I’m focusing on the $231–235 range.
This area is both near the trendline
and a clear high-volume zone.
If it holds, the long-term trend remains intact.
If it breaks below, the structure needs to be reassessed.
$AMZNB
{spot}(AMZNBUSDT)
⛰️
This is not investment or trading advice.
$AMZN has been in an uptrend from 2023 to the present.
The price has now returned to near the long-term trendline.
I’m focusing on the $231–235 range.
This area is both near the trendline
and a clear high-volume zone.
If it holds, the long-term trend remains intact.
If it breaks below, the structure needs to be reassessed.
$AMZNB
⛰️
This is not investment or trading advice.
The price has now returned to near the long-term trendline.
I’m focusing on the $231–235 range.
This area is both near the trendline
and a clear high-volume zone.
If it holds, the long-term trend remains intact.
If it breaks below, the structure needs to be reassessed.
$AMZNB
⛰️
This is not investment or trading advice.
394
·
--
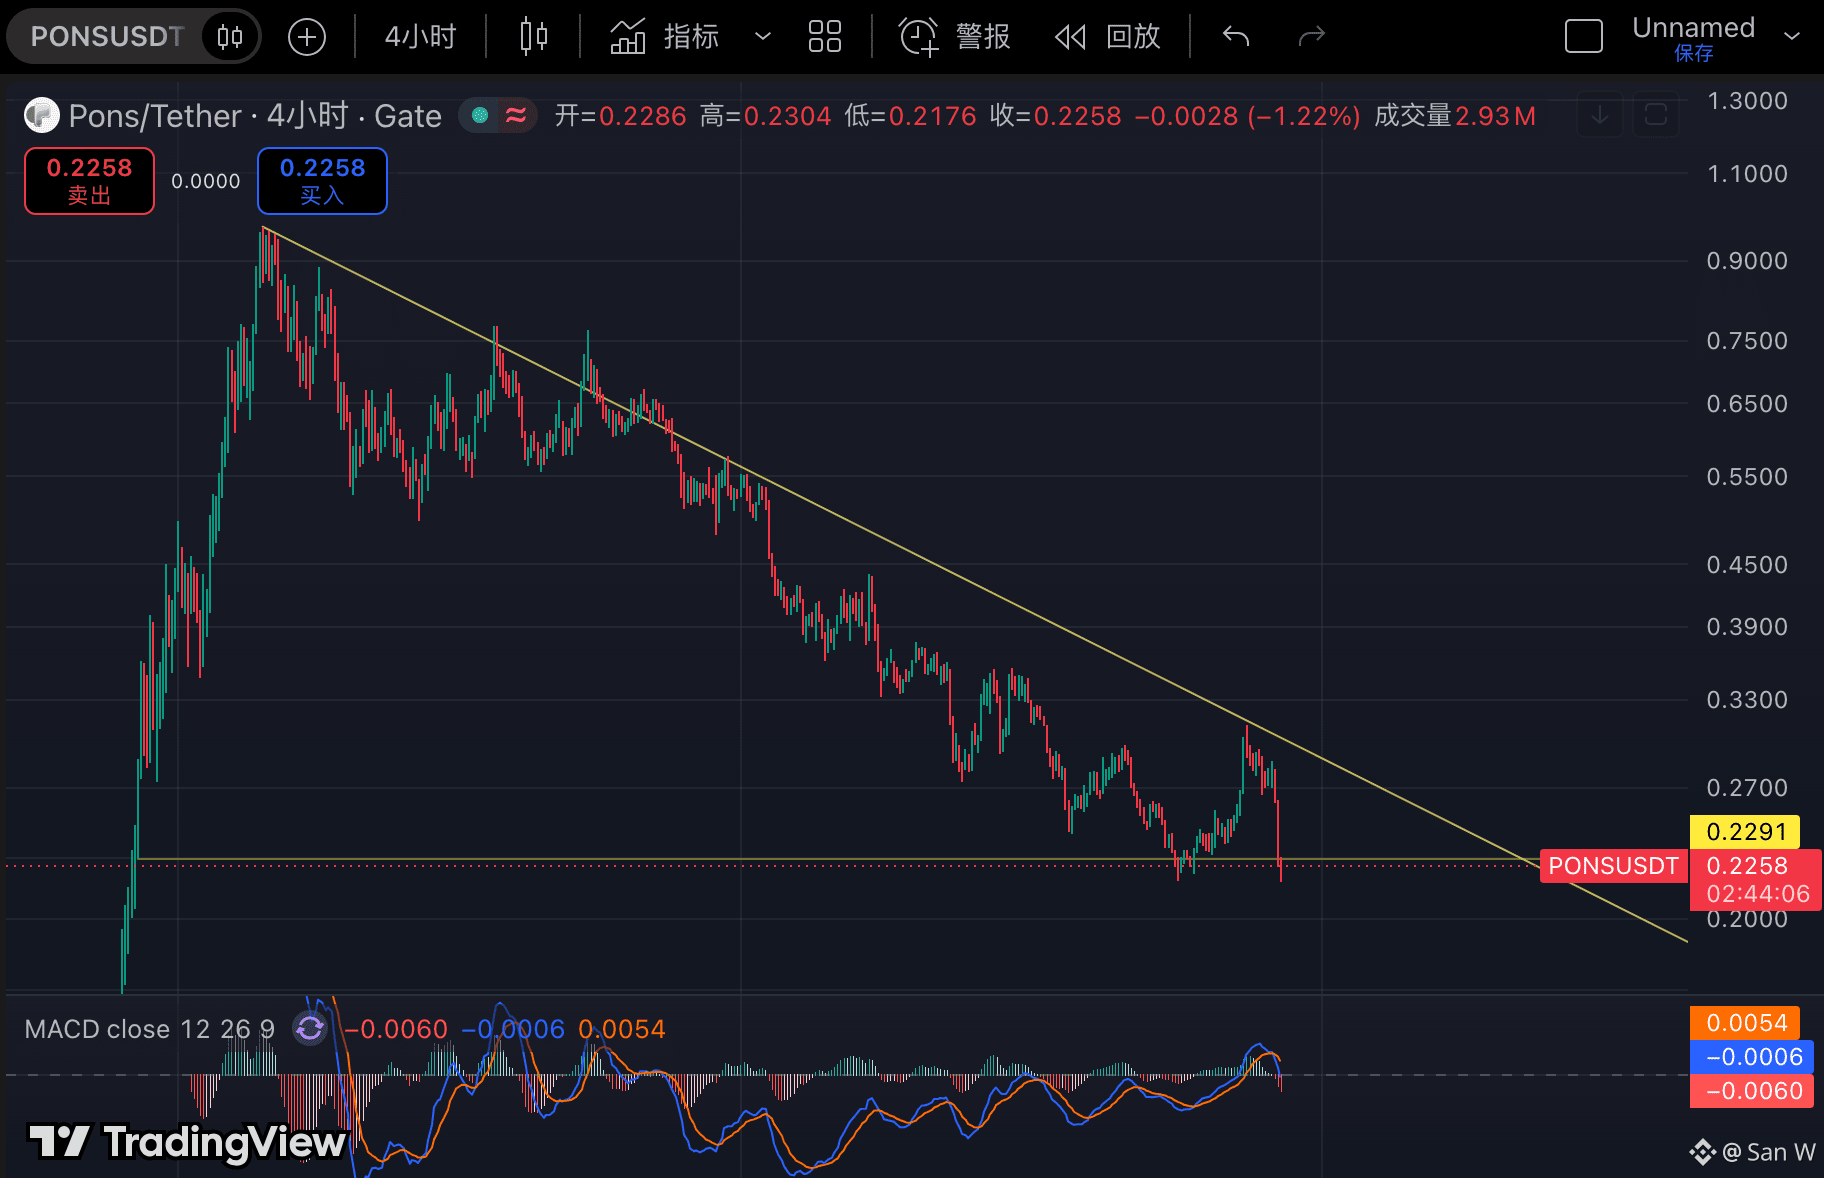
$PONS has returned to the key $0.229 level.
The downtrend isn't over yet,
and the MACD has weakened again.
Now it's all about whether this level can hold.
If it holds, the sideways recovery continues.
If it breaks, support will have to be found again below.
$PONS
{future}(PONSUSDT)
⛰️
This is not investment or trading advice.
$PONS has returned to the key $0.229 level.
The downtrend isn't over yet,
and the MACD has weakened again.
Now it's all about whether this level can hold.
If it holds, the sideways recovery continues.
If it breaks, support will have to be found again below.
$PONS
⛰️
This is not investment or trading advice.
The downtrend isn't over yet,
and the MACD has weakened again.
Now it's all about whether this level can hold.
If it holds, the sideways recovery continues.
If it breaks, support will have to be found again below.
$PONS
⛰️
This is not investment or trading advice.
2.7k
·
--
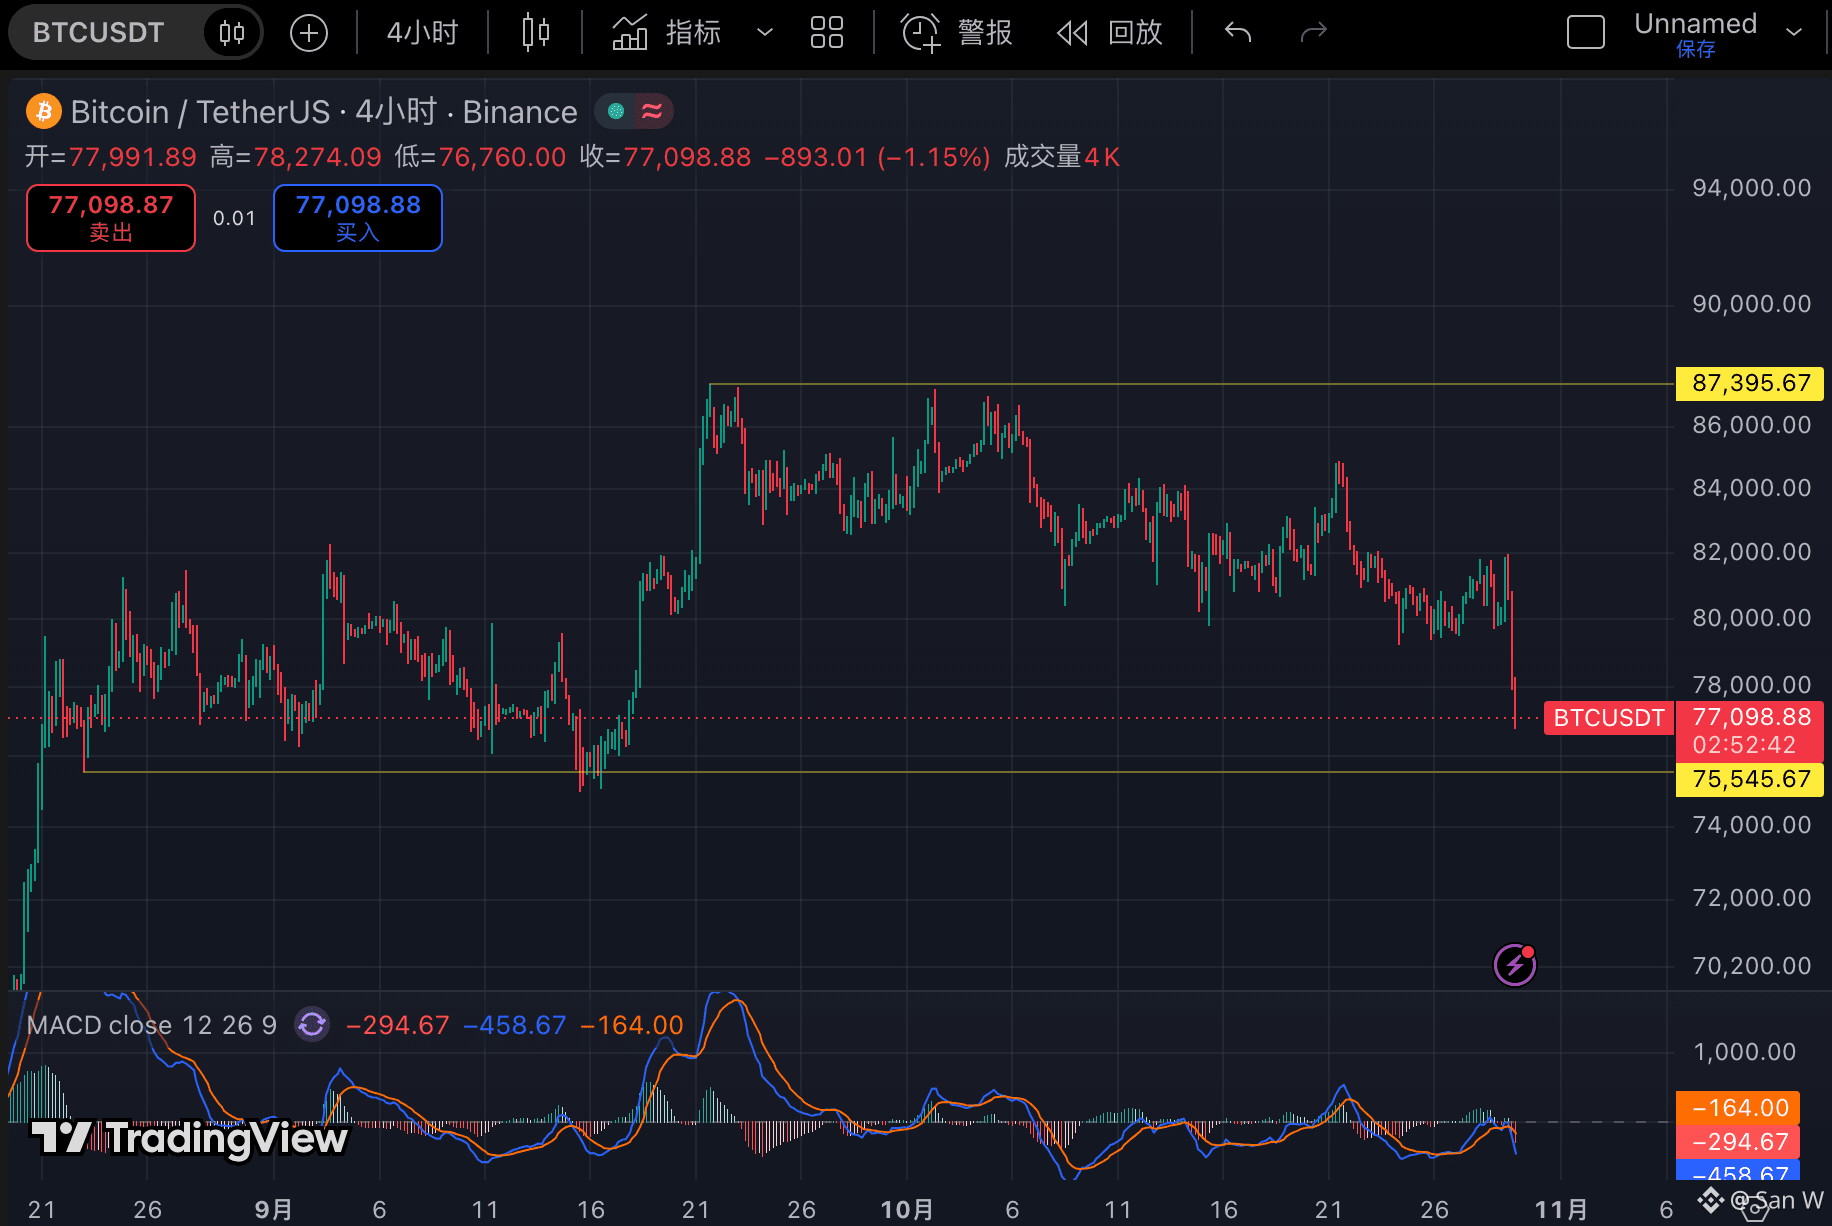
$BTC continues moving toward the lower end of the range.
Around $77K now,
I expect a short-term retest of the lower edge of the range at $75.5K.
Whether it can hold here
will determine the next direction.
$BTC
{future}(BTCUSDT)
⛰️
This is not investment or trading advice.
$BTC continues moving toward the lower end of the range.
Around $77K now,
I expect a short-term retest of the lower edge of the range at $75.5K.
Whether it can hold here
will determine the next direction.
$BTC
⛰️
This is not investment or trading advice.
Around $77K now,
I expect a short-term retest of the lower edge of the range at $75.5K.
Whether it can hold here
will determine the next direction.
$BTC
⛰️
This is not investment or trading advice.
293
Log in to explore more content
Join global crypto users on Binance Square
⚡️ Get latest and useful information about crypto.
💬 Trusted by the world’s largest crypto exchange.
👍 Discover real insights from verified creators.
Email / Phone number
Trending Topics
WhoWillSucceedJensenHuangatNvidia?
149,873 views
1,567 Discussing
Nvidia Says No CEO Talks Underway as "Stand With Jensen" Petition Tops 77,900 Signatures
Binance News
·33 Likes
·57.3k views
WhatWillDriveCryptoandStocks’NextRebound?
546,924 views
3,410 Discussing
BitcoinActiveSupplyInProfitDropsBelow45%
65,509 views
667 Discussing