
交易员-李墨
632 Posts

交易员-李墨
Report
Block User
Open Trade
High-Frequency Trader
5.5 Years
6 Following
4 Followers
7 Liked
Posts
Portfolio
·
--
What is sharding, and why can it improve blockchain performance?
Sharding originated in database technology. It means splitting data and computational tasks into multiple parts, with each shard processing them in parallel.
If an application's state is distributed across multiple shards, calls involve cross-shard communication, adding complexity to both development and the user experience.
$NEAR is NEAR's native token. This public blockchain uses the Nightshade sharding design.
What is sharding, and why can it improve blockchain performance?
Sharding originated in database technology. It means splitting data and computational tasks into multiple parts, with each shard processing them in parallel.
If an application's state is distributed across multiple shards, calls involve cross-shard communication, adding complexity to both development and the user experience.
$NEAR is NEAR's native token. This public blockchain uses the Nightshade sharding design.
Sharding originated in database technology. It means splitting data and computational tasks into multiple parts, with each shard processing them in parallel.
If an application's state is distributed across multiple shards, calls involve cross-shard communication, adding complexity to both development and the user experience.
$NEAR is NEAR's native token. This public blockchain uses the Nightshade sharding design.
·
--
The market is really restless right now 🔥
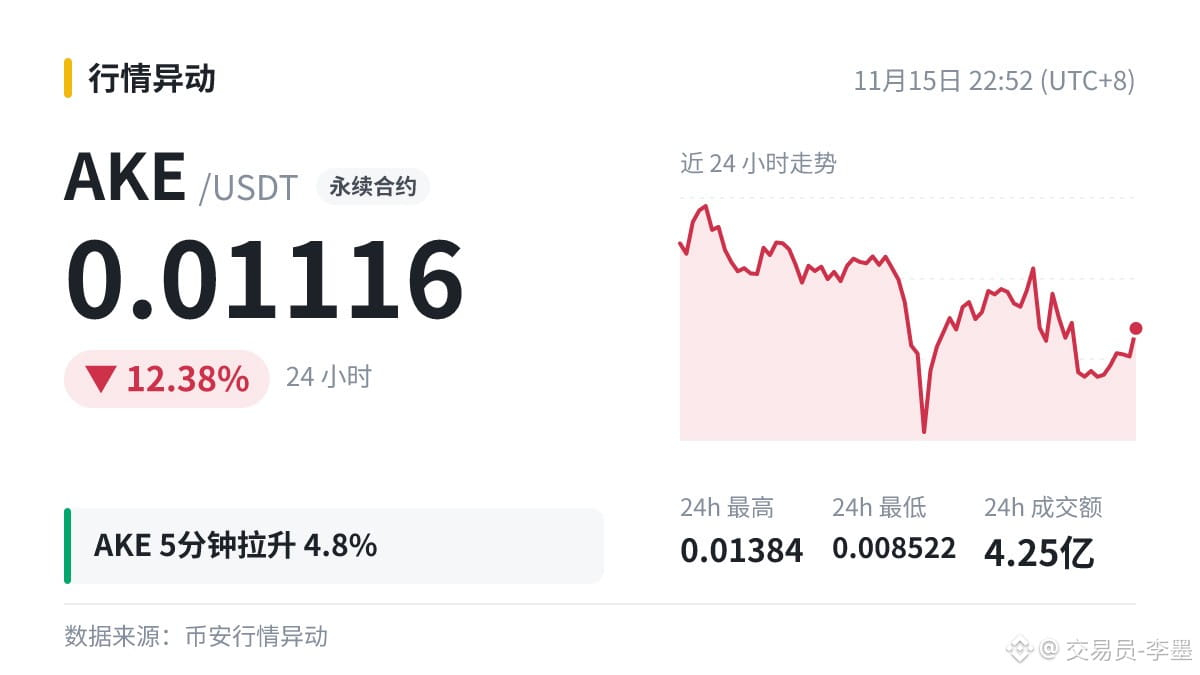
$AKE — up +4.8% in just 5 minutes 🤩🚀
Current price: 0.01116. Bears, you doing okay?
Volume is picking up. The moment FOMO is strongest is often when you need to stay calm the most. Do you think this move is being driven by money flowing in or by sentiment?
The market is really restless right now 🔥
$AKE — up +4.8% in just 5 minutes 🤩🚀
Current price: 0.01116. Bears, you doing okay?
Volume is picking up. The moment FOMO is strongest is often when you need to stay calm the most. Do you think this move is being driven by money flowing in or by sentiment?
$AKE — up +4.8% in just 5 minutes 🤩🚀
Current price: 0.01116. Bears, you doing okay?
Volume is picking up. The moment FOMO is strongest is often when you need to stay calm the most. Do you think this move is being driven by money flowing in or by sentiment?
167
·
--
$XLM lost the 0.14 level.
The first rebound after breaking below it is crucial. If price can't get back above this level, it will turn from support into resistance.
Structurally, this move needs to be assessed alongside the four-hour chart, as moves on shorter timeframes can easily be reversed.
$XLM lost the 0.14 level.
The first rebound after breaking below it is crucial. If price can't get back above this level, it will turn from support into resistance.
Structurally, this move needs to be assessed alongside the four-hour chart, as moves on shorter timeframes can easily be reversed.
The first rebound after breaking below it is crucial. If price can't get back above this level, it will turn from support into resistance.
Structurally, this move needs to be assessed alongside the four-hour chart, as moves on shorter timeframes can easily be reversed.
50
·
--
$AKE 4-hour MACD forms a bearish crossover above the zero line.
Everyone, what exactly is MACD measuring? Here’s a quick explanation 👇
The difference between EMA (exponential moving average) and a simple moving average is that EMA gives more weight to recent prices, so it reacts a little faster.
MACD is often better suited to identifying direction in a one-way market, but it’s not very good at pinpointing exact tops and bottoms.
All indicators describe price action that has already happened, and the market can absolutely move in the opposite direction.
$AKE 4-hour MACD forms a bearish crossover above the zero line.
Everyone, what exactly is MACD measuring? Here’s a quick explanation 👇
The difference between EMA (exponential moving average) and a simple moving average is that EMA gives more weight to recent prices, so it reacts a little faster.
MACD is often better suited to identifying direction in a one-way market, but it’s not very good at pinpointing exact tops and bottoms.
All indicators describe price action that has already happened, and the market can absolutely move in the opposite direction.
Everyone, what exactly is MACD measuring? Here’s a quick explanation 👇
The difference between EMA (exponential moving average) and a simple moving average is that EMA gives more weight to recent prices, so it reacts a little faster.
MACD is often better suited to identifying direction in a one-way market, but it’s not very good at pinpointing exact tops and bottoms.
All indicators describe price action that has already happened, and the market can absolutely move in the opposite direction.
·
--
🐋 Are funds rushing into $LYN ?
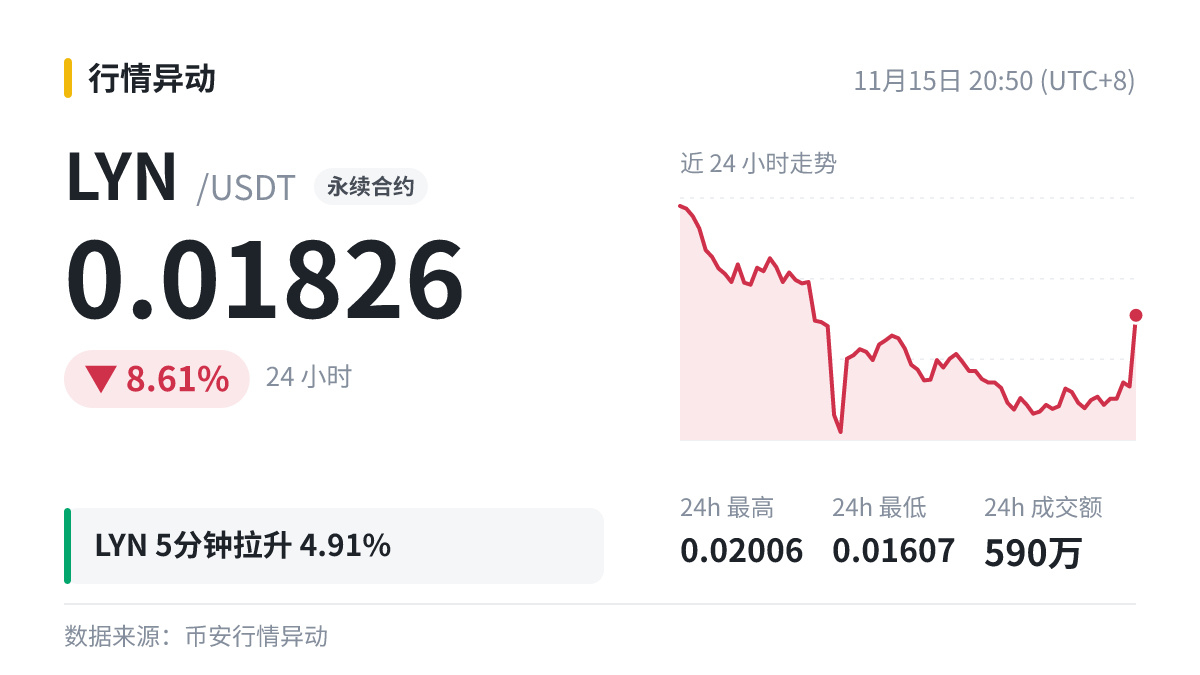
Up 4.91% in 5 minutes, with 24-hour trading volume of $5.9 million. A surge this fast usually means a cluster of aggressive buy orders has entered the market.
The pace is still fairly restrained. Watch to see whether the inflow of funds continues.
Will the market turn later?
🐋 Are funds rushing into $LYN ?
Up 4.91% in 5 minutes, with 24-hour trading volume of $5.9 million. A surge this fast usually means a cluster of aggressive buy orders has entered the market.
The pace is still fairly restrained. Watch to see whether the inflow of funds continues.
Will the market turn later?
Up 4.91% in 5 minutes, with 24-hour trading volume of $5.9 million. A surge this fast usually means a cluster of aggressive buy orders has entered the market.
The pace is still fairly restrained. Watch to see whether the inflow of funds continues.
Will the market turn later?
123
·
--
Post-market notes | Facing losses
Liquidation indicates a problem with position size and leverage, not necessarily the direction of the trade.
In practice: reduce leverage first, then reassess the ratio between position size and capital.
Note: $ETH quoted at 1820.93 (24h -4.62%).
Post-market notes | Facing losses
Liquidation indicates a problem with position size and leverage, not necessarily the direction of the trade.
In practice: reduce leverage first, then reassess the ratio between position size and capital.
Note: $ETH quoted at 1820.93 (24h -4.62%).
Liquidation indicates a problem with position size and leverage, not necessarily the direction of the trade.
In practice: reduce leverage first, then reassess the ratio between position size and capital.
Note: $ETH quoted at 1820.93 (24h -4.62%).
120
·
--
I'll bookmark this one ⭐—I reckon plenty more people will be talking about it later.
“Just how big a deal is BLG taking down four LCK teams in a row?” is trending! Could $SAND in the blockchain gaming sector ride the hype and make a move?
When everyone online is talking about it, emotions can run especially high. It never hurts to stay calm.
#SAND
I'll bookmark this one ⭐—I reckon plenty more people will be talking about it later.
“Just how big a deal is BLG taking down four LCK teams in a row?” is trending! Could $SAND in the blockchain gaming sector ride the hype and make a move?
When everyone online is talking about it, emotions can run especially high. It never hurts to stay calm.
#SAND
“Just how big a deal is BLG taking down four LCK teams in a row?” is trending! Could $SAND in the blockchain gaming sector ride the hype and make a move?
When everyone online is talking about it, emotions can run especially high. It never hurts to stay calm.
#SAND
1
·
--
Guys, a trending topic from outside the crypto world has collided with crypto again 🔥
“Starship captured and recovered by the launch tower’s mechanical arms for the first time” surged to No. 9 on Baidu’s trending searches. The first thing that came to mind was $DOGE (0.05884), which is related to Musk!
These kinds of hot topics are great for attracting traffic, but they can also spike and then quickly fade—the hype dies down, and the candlestick chart often falls along with it.
Before you chase it, think it through: are you riding the sentiment, or do you genuinely believe in the underlying logic?
#DOGE
Guys, a trending topic from outside the crypto world has collided with crypto again 🔥
“Starship captured and recovered by the launch tower’s mechanical arms for the first time” surged to No. 9 on Baidu’s trending searches. The first thing that came to mind was $DOGE (0.05884), which is related to Musk!
These kinds of hot topics are great for attracting traffic, but they can also spike and then quickly fade—the hype dies down, and the candlestick chart often falls along with it.
Before you chase it, think it through: are you riding the sentiment, or do you genuinely believe in the underlying logic?
#DOGE
“Starship captured and recovered by the launch tower’s mechanical arms for the first time” surged to No. 9 on Baidu’s trending searches. The first thing that came to mind was $DOGE (0.05884), which is related to Musk!
These kinds of hot topics are great for attracting traffic, but they can also spike and then quickly fade—the hype dies down, and the candlestick chart often falls along with it.
Before you chase it, think it through: are you riding the sentiment, or do you genuinely believe in the underlying logic?
#DOGE
1
155
·
--
‼️ $ETH A $1.63 million short position was liquidated
Don't rush in—understand liquidation before you make a move 👇
Liquidation (also called getting liquidated) is when losses on a leveraged position cause the margin to fall below the maintenance margin requirement, and the system automatically closes the position.
All data describes price movements that have already happened; prices can reverse direction at any time.
#ETH
‼️ $ETH A $1.63 million short position was liquidated
Don't rush in—understand liquidation before you make a move 👇
Liquidation (also called getting liquidated) is when losses on a leveraged position cause the margin to fall below the maintenance margin requirement, and the system automatically closes the position.
All data describes price movements that have already happened; prices can reverse direction at any time.
#ETH
Don't rush in—understand liquidation before you make a move 👇
Liquidation (also called getting liquidated) is when losses on a leveraged position cause the margin to fall below the maintenance margin requirement, and the system automatically closes the position.
All data describes price movements that have already happened; prices can reverse direction at any time.
#ETH
336
·
--
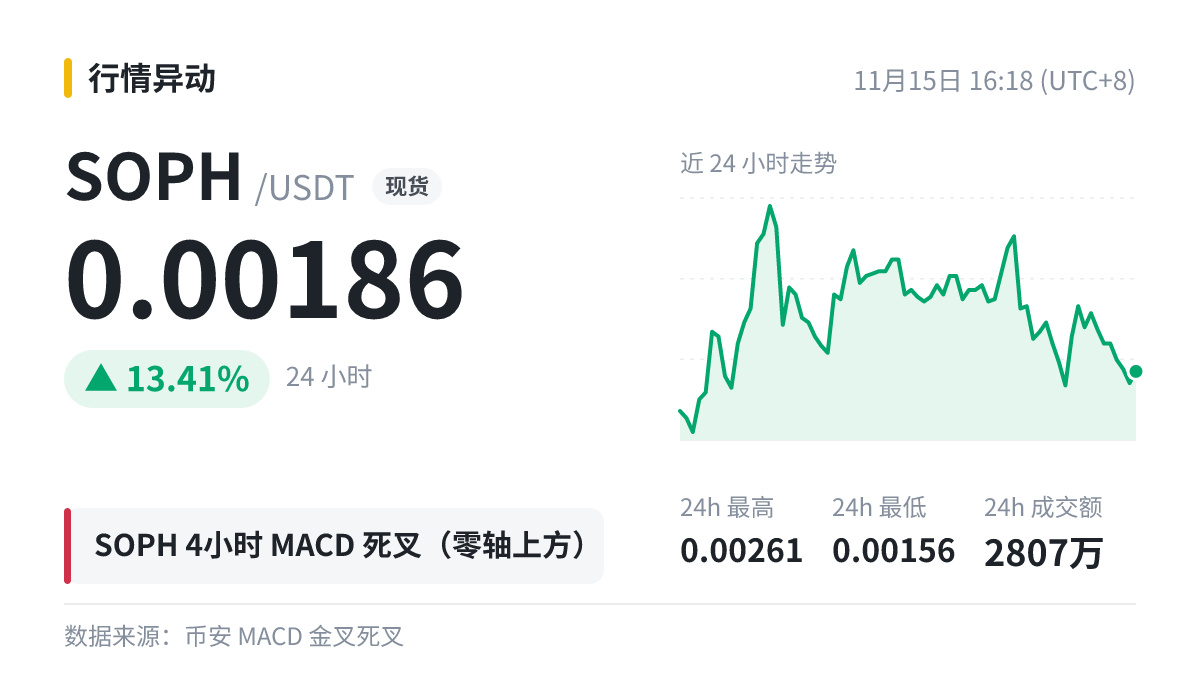
🐋 $SOPH 4-hour MACD death cross above the zero line, with opposite-direction bars persisting for 20 bars before the crossover.
Crossover signals are everywhere; what really matters is where the crossover occurs and the trend leading up to it.
The height of the bars reflects the gap between DIF and DEA. Bars getting taller one by one indicate that momentum in the current direction is strengthening, while shorter bars indicate it is fading.
A death cross above the zero line is often seen as weakening upward momentum, but it does not necessarily mean a trend reversal; a death cross below the zero line is more often viewed as a continuation of the downtrend.
The same reading can mean very different things in different market conditions, so don’t blindly apply a one-size-fits-all rule.
🐋 $SOPH 4-hour MACD death cross above the zero line, with opposite-direction bars persisting for 20 bars before the crossover.
Crossover signals are everywhere; what really matters is where the crossover occurs and the trend leading up to it.
The height of the bars reflects the gap between DIF and DEA. Bars getting taller one by one indicate that momentum in the current direction is strengthening, while shorter bars indicate it is fading.
A death cross above the zero line is often seen as weakening upward momentum, but it does not necessarily mean a trend reversal; a death cross below the zero line is more often viewed as a continuation of the downtrend.
The same reading can mean very different things in different market conditions, so don’t blindly apply a one-size-fits-all rule.
Crossover signals are everywhere; what really matters is where the crossover occurs and the trend leading up to it.
The height of the bars reflects the gap between DIF and DEA. Bars getting taller one by one indicate that momentum in the current direction is strengthening, while shorter bars indicate it is fading.
A death cross above the zero line is often seen as weakening upward momentum, but it does not necessarily mean a trend reversal; a death cross below the zero line is more often viewed as a continuation of the downtrend.
The same reading can mean very different things in different market conditions, so don’t blindly apply a one-size-fits-all rule.
316
·
--
$SHELL 1 hours -13.05%! The market is really restless today 🔥
There’s always another opportunity in the market, so don’t bet everything on a single opportunity. How many times have you seen a market like this? What usually happens next?
$SHELL 1 hours -13.05%! The market is really restless today 🔥
There’s always another opportunity in the market, so don’t bet everything on a single opportunity. How many times have you seen a market like this? What usually happens next?
There’s always another opportunity in the market, so don’t bet everything on a single opportunity. How many times have you seen a market like this? What usually happens next?
147
·
--
Tracking fund flows:
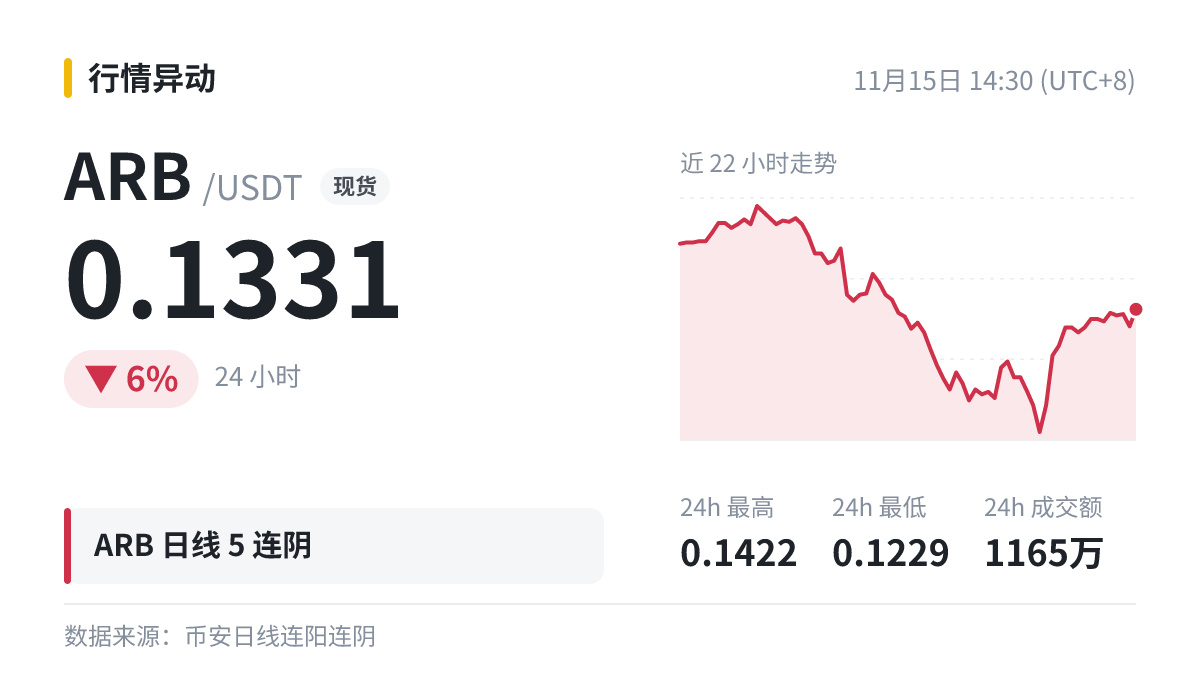
$ARB has posted five consecutive bearish daily candles, down a cumulative 26.79%.
Looking at the cost distribution, most people who bought in over the past few days are sitting on paper losses. If the price rebounds to around their cost basis, they may sell to break even, creating overhead pressure. The key question is whether large buyers are stepping in at these low levels—if support is weak, the gradual decline could continue.
It's up 4.05% so far today. Which direction are you more bullish on?
Tracking fund flows:
$ARB has posted five consecutive bearish daily candles, down a cumulative 26.79%.
Looking at the cost distribution, most people who bought in over the past few days are sitting on paper losses. If the price rebounds to around their cost basis, they may sell to break even, creating overhead pressure. The key question is whether large buyers are stepping in at these low levels—if support is weak, the gradual decline could continue.
It's up 4.05% so far today. Which direction are you more bullish on?
$ARB has posted five consecutive bearish daily candles, down a cumulative 26.79%.
Looking at the cost distribution, most people who bought in over the past few days are sitting on paper losses. If the price rebounds to around their cost basis, they may sell to break even, creating overhead pressure. The key question is whether large buyers are stepping in at these low levels—if support is weak, the gradual decline could continue.
It's up 4.05% so far today. Which direction are you more bullish on?
69
·
--
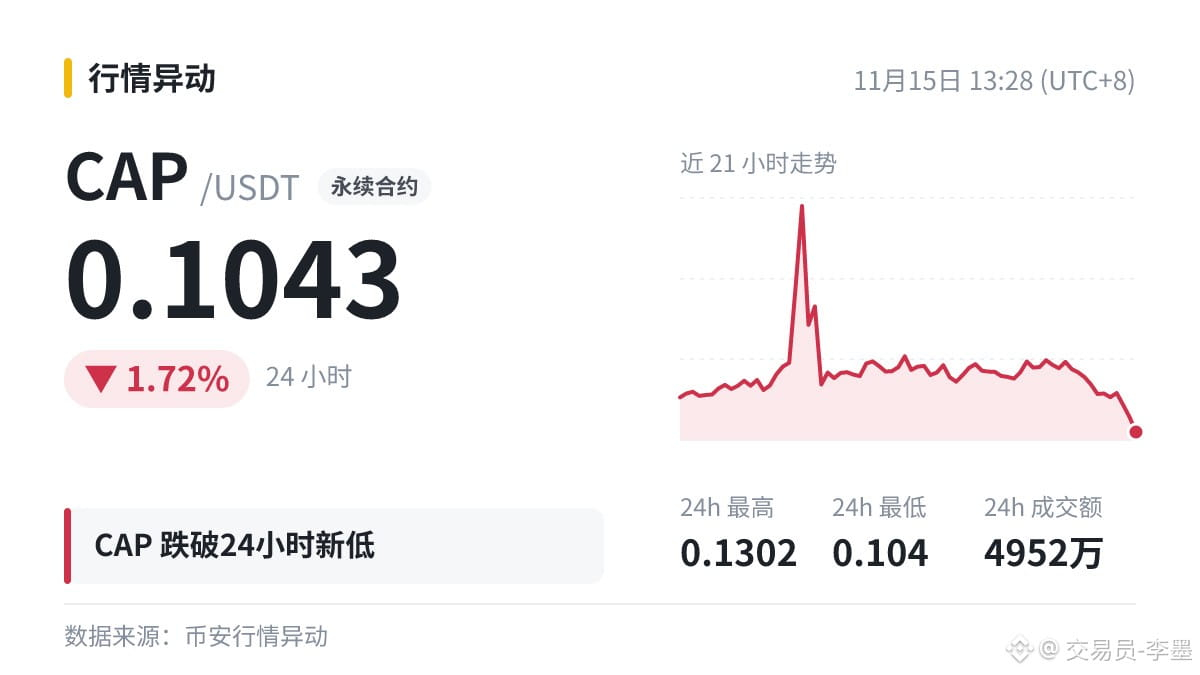
🐋 $CAP broke below its 24-hour low, and selling hasn't let up.
Current price: 0.1043, below the previous low of 0.1052; 24-hour trading volume: $49.52 million.
A large number of long-position stop-losses typically cluster below the previous low, and breaking below it may trigger a cascade of stop-losses. Watch for large buyers stepping in at lower levels.
🐋 $CAP broke below its 24-hour low, and selling hasn't let up.
Current price: 0.1043, below the previous low of 0.1052; 24-hour trading volume: $49.52 million.
A large number of long-position stop-losses typically cluster below the previous low, and breaking below it may trigger a cascade of stop-losses. Watch for large buyers stepping in at lower levels.
Current price: 0.1043, below the previous low of 0.1052; 24-hour trading volume: $49.52 million.
A large number of long-position stop-losses typically cluster below the previous low, and breaking below it may trigger a cascade of stop-losses. Watch for large buyers stepping in at lower levels.
41
·
--
🔥 Essential wallet and security knowledge: blind signing
The risk of signing is that the blockchain only checks whether a signature is valid—it doesn’t ask whether the signer understood what they were signing.
Don’t sign anything you can’t understand, especially requests that show only a string of hashes with no explanation.
Today’s price: $ETH Current price: 1815.89 (24h -4.51%).
If you have any beginners among your friends, feel free to share this with them.
🔥 Essential wallet and security knowledge: blind signing
The risk of signing is that the blockchain only checks whether a signature is valid—it doesn’t ask whether the signer understood what they were signing.
Don’t sign anything you can’t understand, especially requests that show only a string of hashes with no explanation.
Today’s price: $ETH Current price: 1815.89 (24h -4.51%).
If you have any beginners among your friends, feel free to share this with them.
The risk of signing is that the blockchain only checks whether a signature is valid—it doesn’t ask whether the signer understood what they were signing.
Don’t sign anything you can’t understand, especially requests that show only a string of hashes with no explanation.
Today’s price: $ETH Current price: 1815.89 (24h -4.51%).
If you have any beginners among your friends, feel free to share this with them.
220
·
--
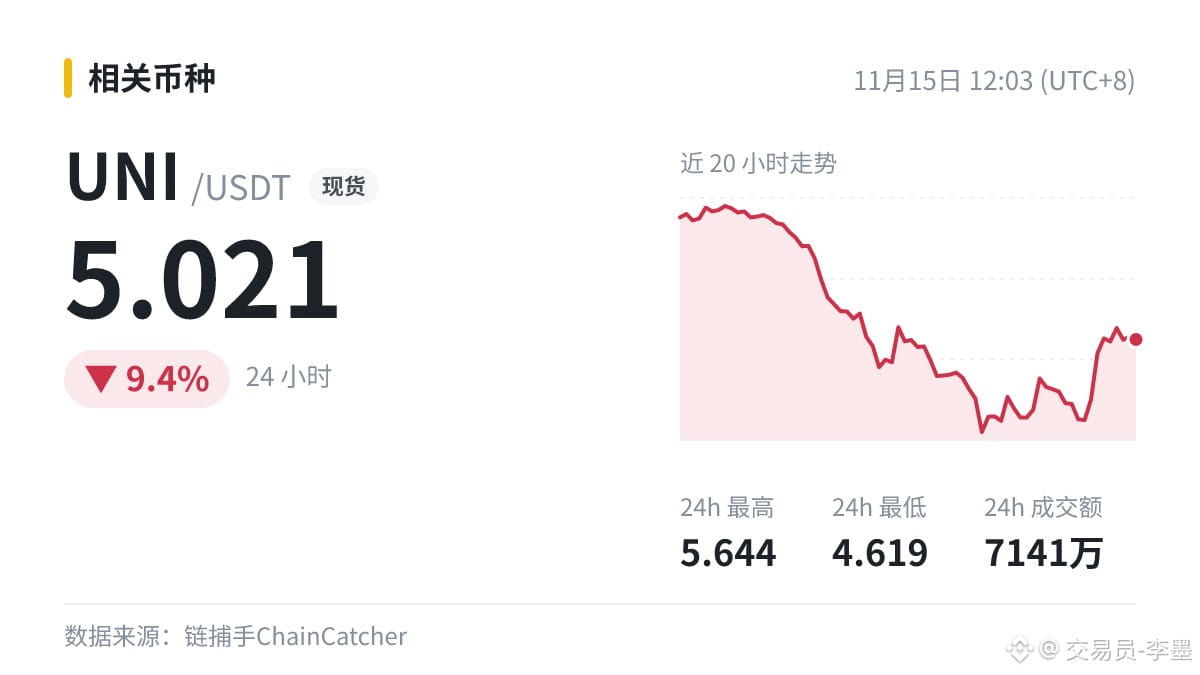
$UNI intraday: down 9.4%, with 71.41 million in trading volume | A whale deposited over 592,800 UNI to Binance; selling is expected to result in a loss of $1.546 million
Where the money flows, prices will most likely follow in the end; the news is just the starting point. On its face, this is bearish—but let the money tell us how much of an impact it will actually have.
#UNI
$UNI intraday: down 9.4%, with 71.41 million in trading volume | A whale deposited over 592,800 UNI to Binance; selling is expected to result in a loss of $1.546 million
Where the money flows, prices will most likely follow in the end; the news is just the starting point. On its face, this is bearish—but let the money tell us how much of an impact it will actually have.
#UNI
Where the money flows, prices will most likely follow in the end; the news is just the starting point. On its face, this is bearish—but let the money tell us how much of an impact it will actually have.
#UNI
23
·
--
Just in: SIGN will unlock approximately $2.48 million worth of tokens tomorrow (Nov 16), equal to 10.5% of the circulating supply.
$SIGN Current price: 0.00852 (24h +0.71%).
The headline is just the starting point; the market's reaction is the real answer. Do you take this kind of news seriously?
Just in: SIGN will unlock approximately $2.48 million worth of tokens tomorrow (Nov 16), equal to 10.5% of the circulating supply.
$SIGN Current price: 0.00852 (24h +0.71%).
The headline is just the starting point; the market's reaction is the real answer. Do you take this kind of news seriously?
$SIGN Current price: 0.00852 (24h +0.71%).
The headline is just the starting point; the market's reaction is the real answer. Do you take this kind of news seriously?
8
·
--
Over the past hour, Binance futures liquidations totaled approximately $20.7 million, with long positions accounting for 6.2%. The largest liquidation was $BTC ($9.08 million).
Let’s use this figure to talk about liquidation data.
Mass liquidations of long positions increase selling pressure, while waves of short liquidations increase buying pressure. This is what causes cascading liquidations to amplify market moves.
When liquidation volumes are high, market sentiment is often equally intense. Placing trades in haste at such times can mean chasing the market at its most volatile extremes.
Any indicator is merely a summary of past market activity; the market can move in the opposite direction at any time.
Over the past hour, Binance futures liquidations totaled approximately $20.7 million, with long positions accounting for 6.2%. The largest liquidation was $BTC ($9.08 million).
Let’s use this figure to talk about liquidation data.
Mass liquidations of long positions increase selling pressure, while waves of short liquidations increase buying pressure. This is what causes cascading liquidations to amplify market moves.
When liquidation volumes are high, market sentiment is often equally intense. Placing trades in haste at such times can mean chasing the market at its most volatile extremes.
Any indicator is merely a summary of past market activity; the market can move in the opposite direction at any time.
Let’s use this figure to talk about liquidation data.
Mass liquidations of long positions increase selling pressure, while waves of short liquidations increase buying pressure. This is what causes cascading liquidations to amplify market moves.
When liquidation volumes are high, market sentiment is often equally intense. Placing trades in haste at such times can mean chasing the market at its most volatile extremes.
Any indicator is merely a summary of past market activity; the market can move in the opposite direction at any time.
275
·
--
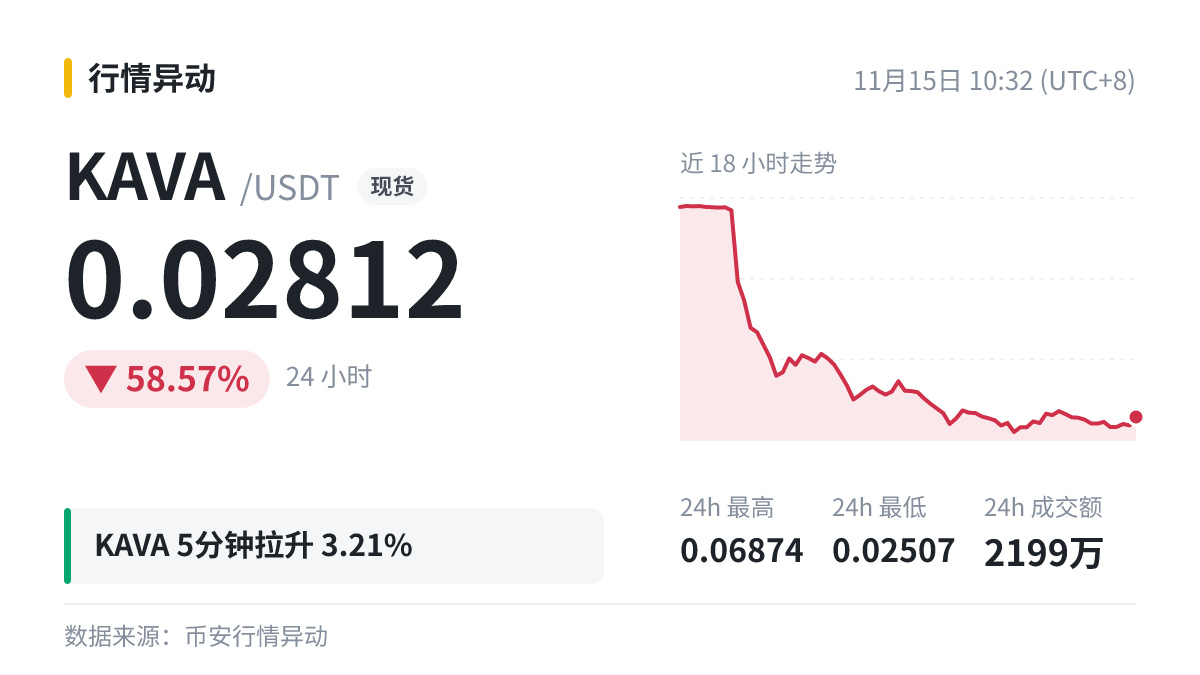
It was stuck for a while, but finally started climbing.
⬆️ $KAVA 5-minute surge +3.21%, current price 0.02812 (24h -58.57%).
When the trend is favorable, protecting profits matters more than chasing gains. Can the bulls hold on to their gains?
It was stuck for a while, but finally started climbing.
⬆️ $KAVA 5-minute surge +3.21%, current price 0.02812 (24h -58.57%).
When the trend is favorable, protecting profits matters more than chasing gains. Can the bulls hold on to their gains?
⬆️ $KAVA 5-minute surge +3.21%, current price 0.02812 (24h -58.57%).
When the trend is favorable, protecting profits matters more than chasing gains. Can the bulls hold on to their gains?
187
·
--
Guys, we need to get this straight: the Cancun upgrade and blobs!
The Fusaka upgrade in December 2025 introduced PeerDAS, which lets nodes check only a portion of the blob data. The blob limit was increased again afterward.
Layer 2 networks only need to make transaction data downloadable by anyone during the period when it needs to be verified, so the results can be checked. The mainnet doesn’t need to store this data forever.
When Layer 2 networks write blob data to the mainnet, blob fees are also paid in $ETH . Currently, 1733.2.
Save this and take your time reading it 👇
Guys, we need to get this straight: the Cancun upgrade and blobs!
The Fusaka upgrade in December 2025 introduced PeerDAS, which lets nodes check only a portion of the blob data. The blob limit was increased again afterward.
Layer 2 networks only need to make transaction data downloadable by anyone during the period when it needs to be verified, so the results can be checked. The mainnet doesn’t need to store this data forever.
When Layer 2 networks write blob data to the mainnet, blob fees are also paid in $ETH . Currently, 1733.2.
Save this and take your time reading it 👇
The Fusaka upgrade in December 2025 introduced PeerDAS, which lets nodes check only a portion of the blob data. The blob limit was increased again afterward.
Layer 2 networks only need to make transaction data downloadable by anyone during the period when it needs to be verified, so the results can be checked. The mainnet doesn’t need to store this data forever.
When Layer 2 networks write blob data to the mainnet, blob fees are also paid in $ETH . Currently, 1733.2.
Save this and take your time reading it 👇
41
·
--
We're taking off, everyone! 🚀
$EVAA 5 minutes +7.74%, already +31.84% in 24h!
The market has come alive in an instant!
Are you in? If you missed the ride, type 1 🙋
Strong coins usually don't pull back much, while weak ones rarely bounce for long.
We're taking off, everyone! 🚀
$EVAA 5 minutes +7.74%, already +31.84% in 24h!
The market has come alive in an instant!
Are you in? If you missed the ride, type 1 🙋
Strong coins usually don't pull back much, while weak ones rarely bounce for long.
$EVAA 5 minutes +7.74%, already +31.84% in 24h!
The market has come alive in an instant!
Are you in? If you missed the ride, type 1 🙋
Strong coins usually don't pull back much, while weak ones rarely bounce for long.
3
723
Log in to explore more content
Join global crypto users on Binance Square
⚡️ Get latest and useful information about crypto.
💬 Trusted by the world’s largest crypto exchange.
👍 Discover real insights from verified creators.
Email / Phone number
Trending Topics
CryptoSelloffTriggersMultipleWhaleLiquidations
150,175 views
1,620 Discussing
Crypto Liquidations Top $2B in 24 Hours as 329,000 Traders Are Wiped Out
Binance News
·39 Likes
·47.6k views
USSpotXRPETFsSeeLargestWeeklyOutflowIn8Months
140,908 views
1,473 Discussing
WillFOMCMinutesReinforceRateHikeExpectations?
39,145 views
681 Discussing