Binance Square
Indexter
18 Posts

Indexter

Experienced cryptocurrency analyst specializing in market trends, technical analysis, and blockchain technology.
4 Following
58 Followers
56 Liked
Posts
·
--
Article
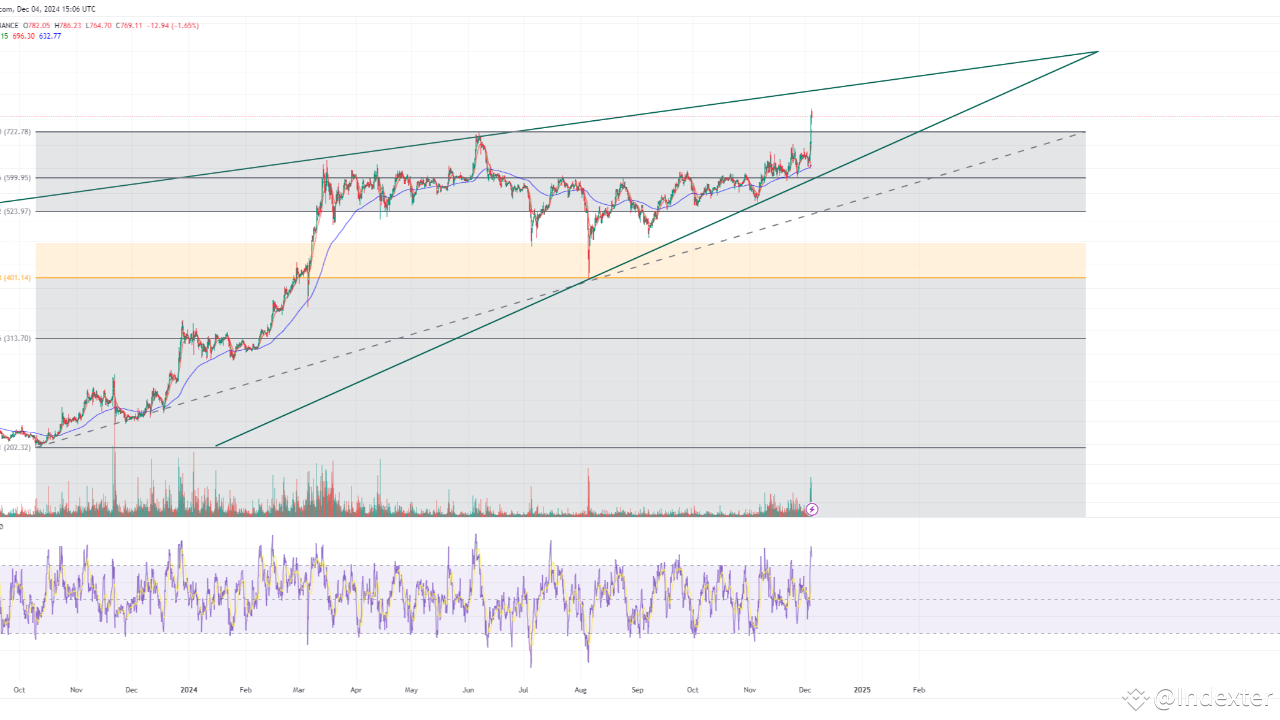
Technical Analysis: BNB Can Reach $999.95Binance Coin (BNB) is showing strong bullish momentum, trading within a well-defined ascending wedge pattern. Despite this being a typically bearish structure, the current market dynamics suggest that BNB has the potential to break higher, targeting the $999.95 level in the coming sessions. Here’s a detailed look at why BNB might be headed for this significant psychological and technical milestone. $BNB {spot}(BNBUSDT) 1. Ascending Wedge and Price Momentum BNB is currently trading near the upper boundary of an ascending wedge pattern, a key resistance level around $759.49. This level has been tested multiple times, indicating that a breakout is becoming increasingly likely. If the price breaks above this wedge with strong volume, the next target aligns with the Fibonacci 0.236 retracement level at $999.95. The wedge formation also shows a strong upward bias, supported by the consistent higher lows and the ongoing uptrend, suggesting that bullish momentum remains intact. 2. Fibonacci Levels Indicating Key Targets Fibonacci retracement levels provide critical insights into BNB’s potential price trajectory: Immediate Resistance: $759.49, near the top of the wedge.Key Target: $999.95, the 0.236 Fibonacci level, which aligns with psychological resistance. A breakout above $759.49 could lead to a sharp rally toward this level.Support Levels: If a pullback occurs, strong support is present at $696.16 (20 EMA) and $401.14 (0.618 Fibonacci retracement), ensuring stability even in case of a correction. 3. Moving Averages Supporting Bullish Momentum BNB is currently trading well above its 9, 20, and 200 EMAs, confirming a strong bullish trend. The 20 EMA at $696.16 is acting as a dynamic support level, helping sustain the ongoing rally. Long-term trends remain bullish as long as the price stays above these key EMAs. 4. RSI Signals Overbought Conditions The Relative Strength Index (RSI) at 74.58 has entered the overbought zone, indicating strong buying pressure. While this suggests a potential short-term pullback or consolidation, it also highlights the strength of the ongoing rally. A consolidation phase near current levels could give BNB the momentum to break past $759.49 and aim for $999.95. 5. Volume Analysis: Breakout Confirmation Recent volume spikes show that buyers are stepping in, supporting the current upward move. For BNB to reach $999.95, sustained or increasing volume will be crucial. A breakout above $759.49 accompanied by strong volume would validate the bullish case. Potential Scenarios Bullish Breakout: If BNB breaks above $759.49 with volume, it could target $999.95, aligning with the 0.236 Fibonacci level and psychological resistance.Support Bounce: A pullback to $696.16 (20 EMA) or $401.14 (0.618 Fibonacci) could attract buyers, offering another opportunity for the price to surge.Bearish Risk: Failure to sustain above the ascending wedge and a breakdown below $696.16 could lead to a deeper correction, but strong support at $401.14 would likely limit losses. Conclusion: BNB Eyes $999.95 BNB’s technical setup is undeniably bullish, supported by key Fibonacci levels, strong moving averages, and rising volume. While the overbought RSI signals a potential short-term pause, a breakout above $759.49 could drive the price toward $999.95, a critical psychological and technical target. As BNB continues to demonstrate strength, traders and investors should watch for confirmation of the breakout, while keeping an eye on support levels in case of a pullback. $BTC $ETH #BNB #BinanceCoin #CryptoAnalysis #BNBUSDT #TechnicalAnalysis #Altcoins #CryptoTrading #Binance

Technical Analysis: BNB Can Reach $999.95

Binance Coin (BNB) is showing strong bullish momentum, trading within a well-defined ascending wedge pattern. Despite this being a typically bearish structure, the current market dynamics suggest that BNB has the potential to break higher, targeting the $999.95 level in the coming sessions. Here’s a detailed look at why BNB might be headed for this significant psychological and technical milestone.
$BNB
1. Ascending Wedge and Price Momentum
BNB is currently trading near the upper boundary of an ascending wedge pattern, a key resistance level around $759.49. This level has been tested multiple times, indicating that a breakout is becoming increasingly likely. If the price breaks above this wedge with strong volume, the next target aligns with the Fibonacci 0.236 retracement level at $999.95.
The wedge formation also shows a strong upward bias, supported by the consistent higher lows and the ongoing uptrend, suggesting that bullish momentum remains intact.
2. Fibonacci Levels Indicating Key Targets
Fibonacci retracement levels provide critical insights into BNB’s potential price trajectory:
Immediate Resistance: $759.49, near the top of the wedge.Key Target: $999.95, the 0.236 Fibonacci level, which aligns with psychological resistance. A breakout above $759.49 could lead to a sharp rally toward this level.Support Levels: If a pullback occurs, strong support is present at $696.16 (20 EMA) and $401.14 (0.618 Fibonacci retracement), ensuring stability even in case of a correction.
3. Moving Averages Supporting Bullish Momentum
BNB is currently trading well above its 9, 20, and 200 EMAs, confirming a strong bullish trend. The 20 EMA at $696.16 is acting as a dynamic support level, helping sustain the ongoing rally. Long-term trends remain bullish as long as the price stays above these key EMAs.
4. RSI Signals Overbought Conditions
The Relative Strength Index (RSI) at 74.58 has entered the overbought zone, indicating strong buying pressure. While this suggests a potential short-term pullback or consolidation, it also highlights the strength of the ongoing rally. A consolidation phase near current levels could give BNB the momentum to break past $759.49 and aim for $999.95.
5. Volume Analysis: Breakout Confirmation
Recent volume spikes show that buyers are stepping in, supporting the current upward move. For BNB to reach $999.95, sustained or increasing volume will be crucial. A breakout above $759.49 accompanied by strong volume would validate the bullish case.
Potential Scenarios
Bullish Breakout:
If BNB breaks above $759.49 with volume, it could target $999.95, aligning with the 0.236 Fibonacci level and psychological resistance.Support Bounce:
A pullback to $696.16 (20 EMA) or $401.14 (0.618 Fibonacci) could attract buyers, offering another opportunity for the price to surge.Bearish Risk:
Failure to sustain above the ascending wedge and a breakdown below $696.16 could lead to a deeper correction, but strong support at $401.14 would likely limit losses.
Conclusion: BNB Eyes $999.95
BNB’s technical setup is undeniably bullish, supported by key Fibonacci levels, strong moving averages, and rising volume. While the overbought RSI signals a potential short-term pause, a breakout above $759.49 could drive the price toward $999.95, a critical psychological and technical target.
As BNB continues to demonstrate strength, traders and investors should watch for confirmation of the breakout, while keeping an eye on support levels in case of a pullback.
$BTC $ETH
#BNB #BinanceCoin #CryptoAnalysis #BNBUSDT #TechnicalAnalysis #Altcoins #CryptoTrading #Binance
So December 01 I did my analysis. You can see how it went $TRX and how much I was right.
Indexter
·
--
Technical Analysis of TRON (TRX/USDT): A Bullish Continuation or Bearish Reversal?
$TRX

TRON (TRX/USDT) has been exhibiting intriguing price action, supported by both bullish momentum and potential bearish risks. Let’s analyze the key insights from the chart to help traders and investors strategize their next moves.

Bullish Analysis: Signs of Strength

1. Ascending Channel Formation

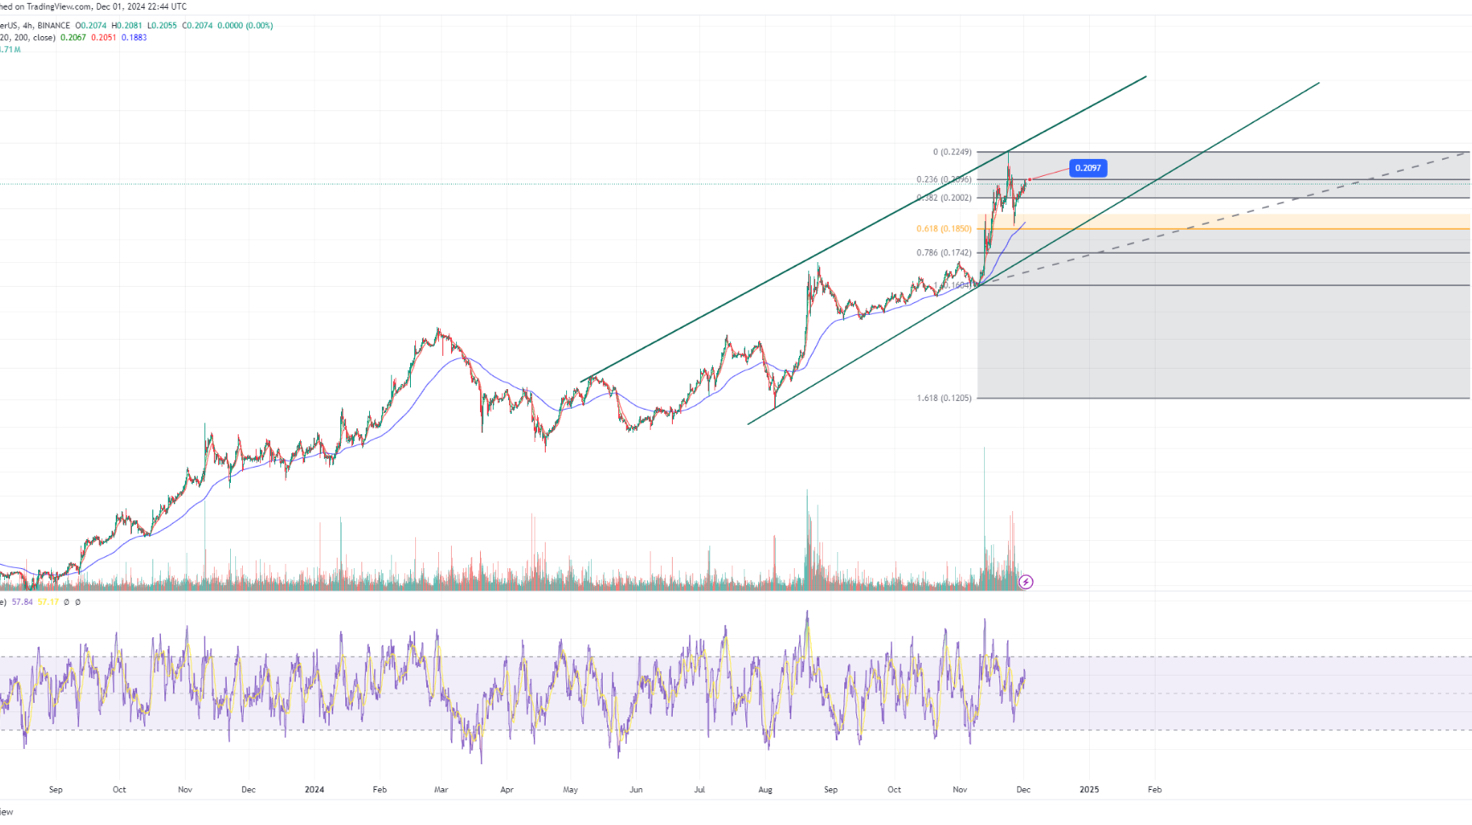
TRX/USDT is trading within a well-defined ascending channel, characterized by higher highs and higher lows. This structured movement signifies a strong uptrend and suggests continued bullish momentum as long as the channel remains intact.

2. Price Above Key Moving Averages (EMAs)

• Short-Term EMAs (9 and 20): The price is comfortably trading above these levels, signaling strong short-term bullish momentum.

• 200 EMA: The price is significantly above the 200 EMA, indicating a strong long-term bullish trend.

3. Fibonacci Retracement Support
The price has consistently respected the 0.618 Fibonacci level (0.1850) as strong support. This golden ratio often acts as a turning point in uptrends, reinforcing the likelihood of further upside.

4. Room to Grow (RSI Neutral Zone)
With the RSI at 57.84, the market is not overbought, leaving room for further bullish moves before reaching critical levels (above 70).

5. Consolidation Near Resistance (0.2097)

The price is consolidating just below the 0.2097 resistance level, often a precursor to a breakout. A successful breakout above this level, coupled with strong volume, could push TRX/USDT toward the next resistance at 0.2249, the upper boundary of the ascending channel.

Bearish Analysis: Risks and Caution

1. Volume Decline
Recent trading volume has declined, which could indicate weakening momentum. A breakout without significant volume may lack conviction and could result in a false breakout.

2. Potential Pullbacks
• If the price fails to break above the 0.2097 resistance, it could pull back to test support levels at 0.2000 or the stronger 0.1850 Fibonacci support.

• A breakdown below 0.1850 would invalidate the bullish trend and could lead to further downside.

3. Overbought Risks (Future RSI Trends)
While the RSI is currently neutral, it is approaching higher levels. If the price climbs rapidly without consolidation, the RSI could enter overbought territory, increasing the likelihood of a correction.

4. Channel Breakdown Risk
If the price breaks below the ascending channel’s lower boundary, it could signal a bearish reversal. In such a scenario, the next target could be 0.1742 or lower Fibonacci levels.

Key Levels to Watch

• Resistance Levels:
• 0.2097: Immediate resistance. A breakout could lead to further gains toward 0.2249.
• 0.2249: The upper boundary of the channel, a critical level for continued bullish momentum.

• Support Levels:
• 0.2000: Short-term support
• 0.1850: Strong Fibonacci retracement support.
• 0.1742: Key level to watch in case of a bearish breakdown.

Conclusion: Bullish Bias with Caution

The current technical indicators and price action suggest a bullish outlook for TRX/USDT. The ascending channel and strong support levels reinforce the potential for further upside. However, traders must remain cautious about declining volume and potential pullbacks.

• For Bulls: Watch for a breakout above 0.2097 with increased volume to confirm continuation. Target the next resistance at 0.2249 while maintaining stops below key support levels.
• For Bears: Monitor for signs of weakening momentum or a breakdown below 0.2000 and the lower boundary of the ascending channel for short opportunities.
BTC’s influence is undeniable, but combining it with analysis creates a stronger trading strategy.
Touseef AHMED Malik
·
--
Wrong
When the movement is linked with Big Boy (BTC), The Analysis of those coins are just a Theory. Simply Observe and investigate the Big Boy (BTC) movement
Article
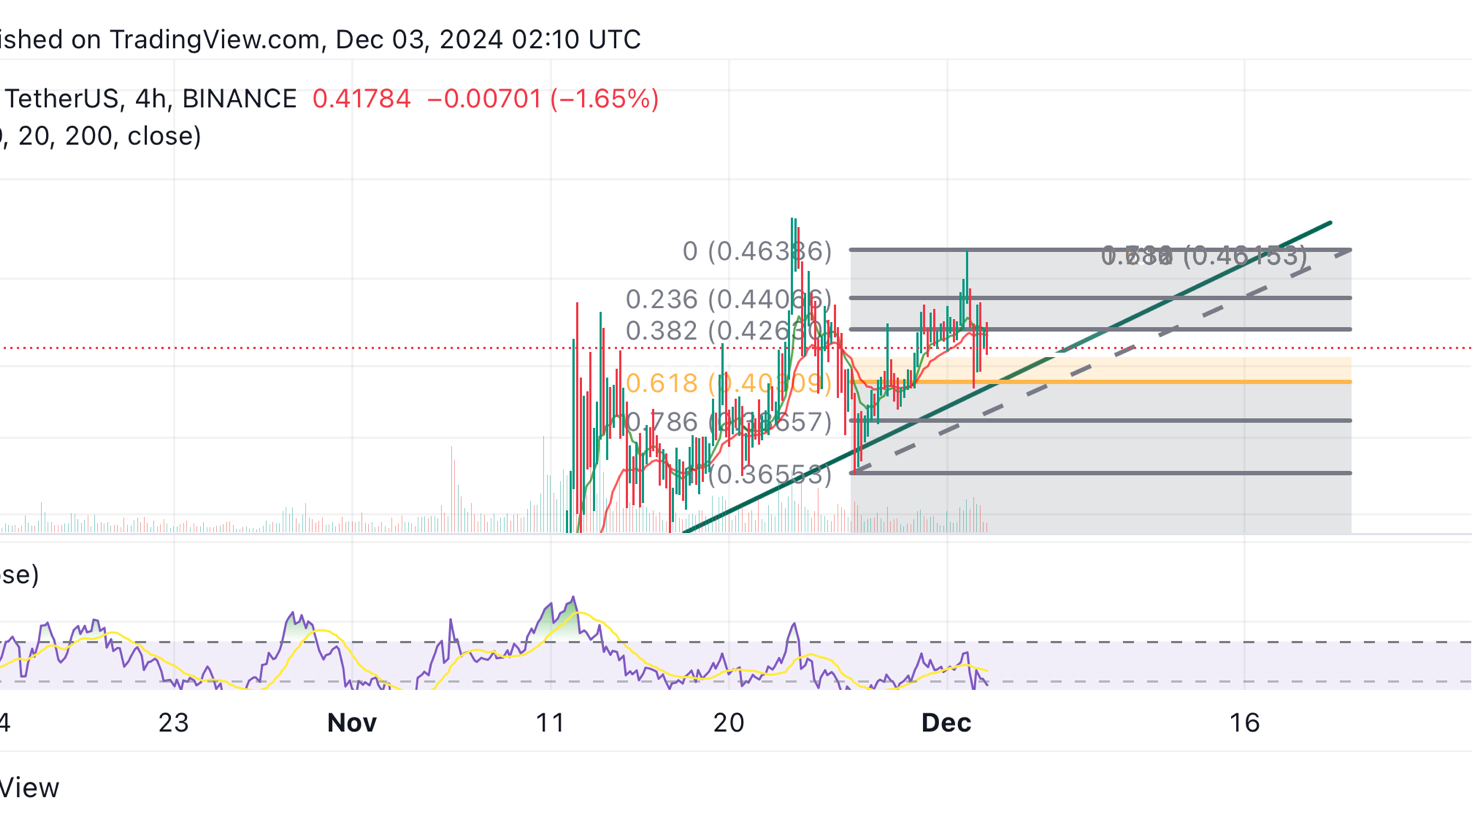
Technical Analysis of Dogecoin (DOGE/USDT) on 4-Hour Chart{future}(DOGEUSDT) Key Highlights • Bullish Trend: DOGE is in an uptrend, forming higher lows and holding above the ascending trendline. • Support Levels: Key support at $0.4095 (0.618 Fibonacci). Holding this level confirms the bullish trend. • Resistance Levels: Immediate resistance at $0.4262 (0.382 Fibonacci) and $0.4400 (0.236 Fibonacci). Indicators • RSI (55.28): Neutral, with no overbought or oversold signals but showing slight bearish divergence. • Volume: Declining, signaling caution; a breakout needs strong volume confirmation. Bullish Scenario: • Holding $0.4095 and breaking above $0.4262 could push DOGE toward $0.4400 and possibly retest $0.4638. Bearish Scenario: • A break below $0.4095 could lead to further decline toward $0.3857 and possibly $0.3650. DOGE’s trend remains bullish, but volume and key levels will determine its next move. $DOGE

Technical Analysis of Dogecoin (DOGE/USDT) on 4-Hour Chart

Key Highlights
• Bullish Trend: DOGE is in an uptrend, forming higher lows and holding above the ascending trendline.
• Support Levels: Key support at $0.4095 (0.618 Fibonacci). Holding this level confirms the bullish trend.
• Resistance Levels: Immediate resistance at $0.4262 (0.382 Fibonacci) and $0.4400 (0.236 Fibonacci).
Indicators
• RSI (55.28): Neutral, with no overbought or oversold signals but showing slight bearish divergence.
• Volume: Declining, signaling caution; a breakout needs strong volume confirmation.
Bullish Scenario:
• Holding $0.4095 and breaking above $0.4262 could push DOGE toward $0.4400 and possibly retest $0.4638.
Bearish Scenario:
• A break below $0.4095 could lead to further decline toward $0.3857 and possibly $0.3650.
DOGE’s trend remains bullish, but volume and key levels will determine its next move.
$DOGE
Article
Technical Analysis of TRON (TRX/USDT): A Bullish Continuation or Bearish Reversal?$TRX TRON (TRX/USDT) has been exhibiting intriguing price action, supported by both bullish momentum and potential bearish risks. Let’s analyze the key insights from the chart to help traders and investors strategize their next moves. Bullish Analysis: Signs of Strength 1. Ascending Channel Formation TRX/USDT is trading within a well-defined ascending channel, characterized by higher highs and higher lows. This structured movement signifies a strong uptrend and suggests continued bullish momentum as long as the channel remains intact. 2. Price Above Key Moving Averages (EMAs) • Short-Term EMAs (9 and 20): The price is comfortably trading above these levels, signaling strong short-term bullish momentum. • 200 EMA: The price is significantly above the 200 EMA, indicating a strong long-term bullish trend. 3. Fibonacci Retracement Support The price has consistently respected the 0.618 Fibonacci level (0.1850) as strong support. This golden ratio often acts as a turning point in uptrends, reinforcing the likelihood of further upside. 4. Room to Grow (RSI Neutral Zone) With the RSI at 57.84, the market is not overbought, leaving room for further bullish moves before reaching critical levels (above 70). 5. Consolidation Near Resistance (0.2097) The price is consolidating just below the 0.2097 resistance level, often a precursor to a breakout. A successful breakout above this level, coupled with strong volume, could push TRX/USDT toward the next resistance at 0.2249, the upper boundary of the ascending channel. Bearish Analysis: Risks and Caution 1. Volume Decline Recent trading volume has declined, which could indicate weakening momentum. A breakout without significant volume may lack conviction and could result in a false breakout. 2. Potential Pullbacks • If the price fails to break above the 0.2097 resistance, it could pull back to test support levels at 0.2000 or the stronger 0.1850 Fibonacci support. • A breakdown below 0.1850 would invalidate the bullish trend and could lead to further downside. 3. Overbought Risks (Future RSI Trends) While the RSI is currently neutral, it is approaching higher levels. If the price climbs rapidly without consolidation, the RSI could enter overbought territory, increasing the likelihood of a correction. 4. Channel Breakdown Risk If the price breaks below the ascending channel’s lower boundary, it could signal a bearish reversal. In such a scenario, the next target could be 0.1742 or lower Fibonacci levels. Key Levels to Watch • Resistance Levels: • 0.2097: Immediate resistance. A breakout could lead to further gains toward 0.2249. • 0.2249: The upper boundary of the channel, a critical level for continued bullish momentum. • Support Levels: • 0.2000: Short-term support • 0.1850: Strong Fibonacci retracement support. • 0.1742: Key level to watch in case of a bearish breakdown. Conclusion: Bullish Bias with Caution The current technical indicators and price action suggest a bullish outlook for TRX/USDT. The ascending channel and strong support levels reinforce the potential for further upside. However, traders must remain cautious about declining volume and potential pullbacks. • For Bulls: Watch for a breakout above 0.2097 with increased volume to confirm continuation. Target the next resistance at 0.2249 while maintaining stops below key support levels. • For Bears: Monitor for signs of weakening momentum or a breakdown below 0.2000 and the lower boundary of the ascending channel for short opportunities. {spot}(TRXUSDT)

Technical Analysis of TRON (TRX/USDT): A Bullish Continuation or Bearish Reversal?

$TRX
TRON (TRX/USDT) has been exhibiting intriguing price action, supported by both bullish momentum and potential bearish risks. Let’s analyze the key insights from the chart to help traders and investors strategize their next moves.
Bullish Analysis: Signs of Strength
1. Ascending Channel Formation
TRX/USDT is trading within a well-defined ascending channel, characterized by higher highs and higher lows. This structured movement signifies a strong uptrend and suggests continued bullish momentum as long as the channel remains intact.
2. Price Above Key Moving Averages (EMAs)
• Short-Term EMAs (9 and 20): The price is comfortably trading above these levels, signaling strong short-term bullish momentum.
• 200 EMA: The price is significantly above the 200 EMA, indicating a strong long-term bullish trend.
3. Fibonacci Retracement Support
The price has consistently respected the 0.618 Fibonacci level (0.1850) as strong support. This golden ratio often acts as a turning point in uptrends, reinforcing the likelihood of further upside.
4. Room to Grow (RSI Neutral Zone)
With the RSI at 57.84, the market is not overbought, leaving room for further bullish moves before reaching critical levels (above 70).
5. Consolidation Near Resistance (0.2097)
The price is consolidating just below the 0.2097 resistance level, often a precursor to a breakout. A successful breakout above this level, coupled with strong volume, could push TRX/USDT toward the next resistance at 0.2249, the upper boundary of the ascending channel.
Bearish Analysis: Risks and Caution
1. Volume Decline
Recent trading volume has declined, which could indicate weakening momentum. A breakout without significant volume may lack conviction and could result in a false breakout.
2. Potential Pullbacks
• If the price fails to break above the 0.2097 resistance, it could pull back to test support levels at 0.2000 or the stronger 0.1850 Fibonacci support.
• A breakdown below 0.1850 would invalidate the bullish trend and could lead to further downside.
3. Overbought Risks (Future RSI Trends)
While the RSI is currently neutral, it is approaching higher levels. If the price climbs rapidly without consolidation, the RSI could enter overbought territory, increasing the likelihood of a correction.
4. Channel Breakdown Risk
If the price breaks below the ascending channel’s lower boundary, it could signal a bearish reversal. In such a scenario, the next target could be 0.1742 or lower Fibonacci levels.
Key Levels to Watch
• Resistance Levels:
• 0.2097: Immediate resistance. A breakout could lead to further gains toward 0.2249.
• 0.2249: The upper boundary of the channel, a critical level for continued bullish momentum.
• Support Levels:
• 0.2000: Short-term support
• 0.1850: Strong Fibonacci retracement support.
• 0.1742: Key level to watch in case of a bearish breakdown.
Conclusion: Bullish Bias with Caution
The current technical indicators and price action suggest a bullish outlook for TRX/USDT. The ascending channel and strong support levels reinforce the potential for further upside. However, traders must remain cautious about declining volume and potential pullbacks.
• For Bulls: Watch for a breakout above 0.2097 with increased volume to confirm continuation. Target the next resistance at 0.2249 while maintaining stops below key support levels.
• For Bears: Monitor for signs of weakening momentum or a breakdown below 0.2000 and the lower boundary of the ascending channel for short opportunities.
Article
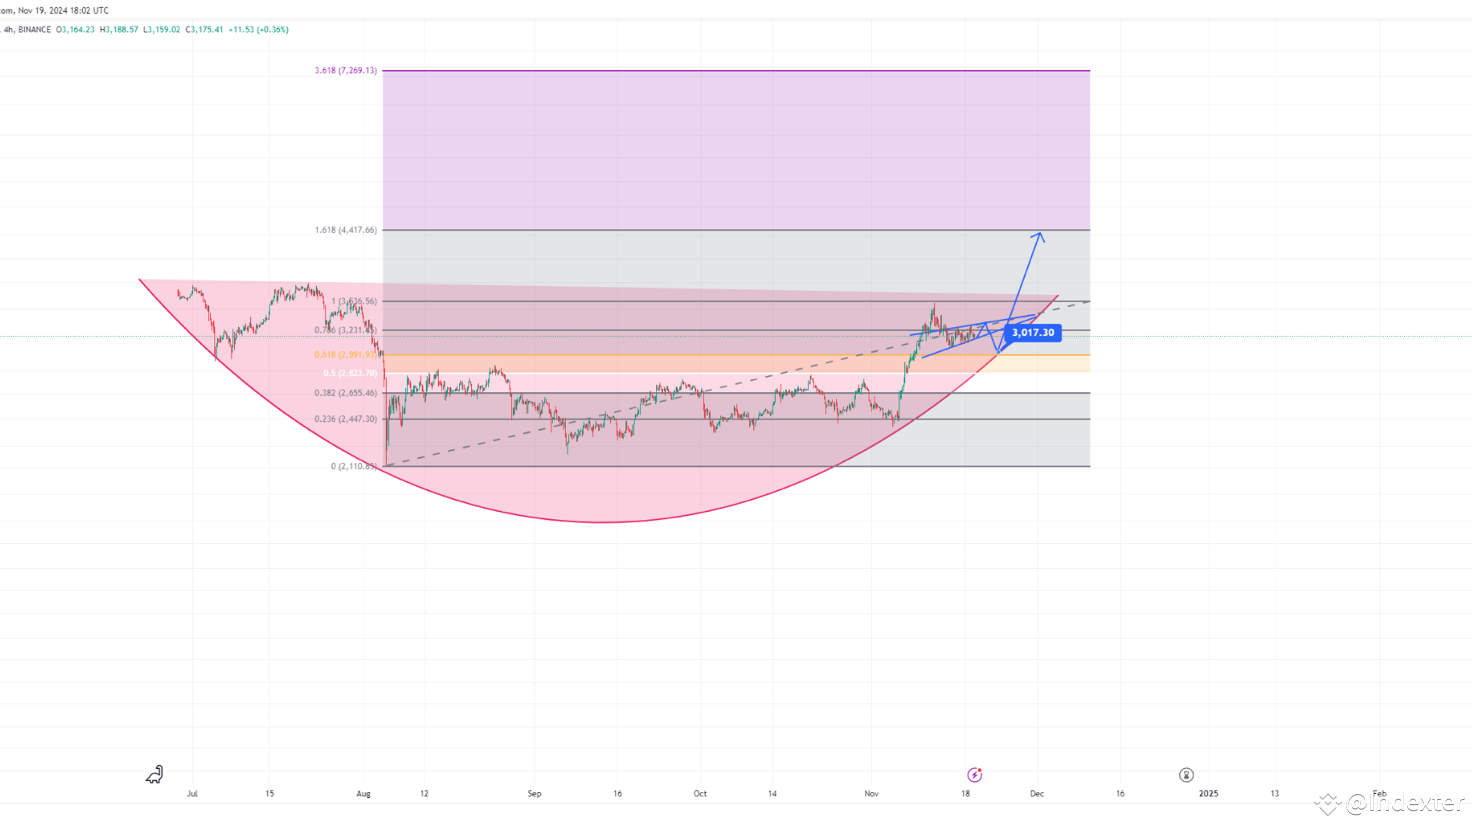
technical analysis of the ETH/USDT trading pair on a 4-hour chartChart Observations: 1. Cup Formation: • The pink curved line indicates a rounded bottom, forming a classic “cup” pattern. • This pattern is typically bullish, suggesting potential upward momentum once the handle completes. 2. Fibonacci Retracement Levels: • The chart has Fibonacci retracement levels drawn, with notable levels such as: • 0.236 (2,447), 0.382 (2,655), 0.5 (2,823), 0.618 (2,991), and 0.786 (3,231). • The price is currently near the 0.618 level, often seen as a key resistance zone in technical analysis. • A breakout above 0.618 could trigger a move toward 0.786 or beyond. 3. Price Action: • The current price is 3,175.41, slightly above the 3,017.30 mark, which aligns with a potential breakout from the curved resistance line. 4. Future Target Levels: • If the price sustains above the 0.786 level and the cup-and-handle breakout occurs, the next significant target could be the 1.618 extension at 4,417.66 or even the 3.618 extension at 7,269.13. 5. Short-Term Consolidation: • A small blue triangle indicates a possible consolidation phase (“handle”) before the breakout. This aligns with typical cup-and-handle behavior. Key Levels to Watch: • Support Levels: • 2,991: Strong support as the 0.618 Fibonacci retracement. • 2,823: Previous resistance-turned-support. • 2,447: Key lower support in case of a pullback. • Resistance Levels: • 3,231: Immediate resistance at the 0.786 retracement. • 4,417: Major Fibonacci extension level (1.618). Scenario Analysis: 1. Bullish Scenario: • If the price breaks above 3,231, expect a rally toward 4,417 or higher. • The cup-and-handle pattern supports this projection, with the measured move matching the height of the cup. 2. Bearish Scenario: • If the price fails to break 3,231 and falls below 2,991, it may retrace to 2,823 or even 2,447. chart shows a strong bullish setup supported by Fibonacci retracement and a potential cup-and-handle pattern. Monitor the 3,231 level closely for confirmation of a breakout or reversal. Implement stop-losses near 2,991 to mitigate risks. $ETH $BTC

technical analysis of the ETH/USDT trading pair on a 4-hour chart

Chart Observations:
1. Cup Formation:
• The pink curved line indicates a rounded bottom, forming a classic “cup” pattern.
• This pattern is typically bullish, suggesting potential upward momentum once the handle completes.
2. Fibonacci Retracement Levels:
• The chart has Fibonacci retracement levels drawn, with notable levels such as:
• 0.236 (2,447), 0.382 (2,655), 0.5 (2,823), 0.618 (2,991), and 0.786 (3,231).
• The price is currently near the 0.618 level, often seen as a key resistance zone in technical analysis.
• A breakout above 0.618 could trigger a move toward 0.786 or beyond.
3. Price Action:
• The current price is 3,175.41, slightly above the 3,017.30 mark, which aligns with a potential breakout from the curved resistance line.
4. Future Target Levels:
• If the price sustains above the 0.786 level and the cup-and-handle breakout occurs, the next significant target could be the 1.618 extension at 4,417.66 or even the 3.618 extension at 7,269.13.
5. Short-Term Consolidation:
• A small blue triangle indicates a possible consolidation phase (“handle”) before the breakout. This aligns with typical cup-and-handle behavior.
Key Levels to Watch:
• Support Levels:
• 2,991: Strong support as the 0.618 Fibonacci retracement.
• 2,823: Previous resistance-turned-support.
• 2,447: Key lower support in case of a pullback.
• Resistance Levels:
• 3,231: Immediate resistance at the 0.786 retracement.
• 4,417: Major Fibonacci extension level (1.618).
Scenario Analysis:
1. Bullish Scenario:
• If the price breaks above 3,231, expect a rally toward 4,417 or higher.
• The cup-and-handle pattern supports this projection, with the measured move matching the height of the cup.
2. Bearish Scenario:
• If the price fails to break 3,231 and falls below 2,991, it may retrace to 2,823 or even 2,447.
chart shows a strong bullish setup supported by Fibonacci retracement and a potential cup-and-handle pattern. Monitor the 3,231 level closely for confirmation of a breakout or reversal. Implement stop-losses near 2,991 to mitigate risks.
$ETH $BTC
Log in to explore more content
Join global crypto users on Binance Square
⚡️ Get latest and useful information about crypto.
💬 Trusted by the world’s largest crypto exchange.
👍 Discover real insights from verified creators.
Email / Phone number
Sitemap
Cookie Preferences
Platform T&Cs