

桃金者
82 Posts

桃金者
Report
Block User
乘风破浪会有时,直挂云帆济沧海!推特x:@taojinzhe166
243 Following
165 Followers
67 Liked
Posts
·
--
🛰️ AIOT: A drop that was flagged 3 hours early
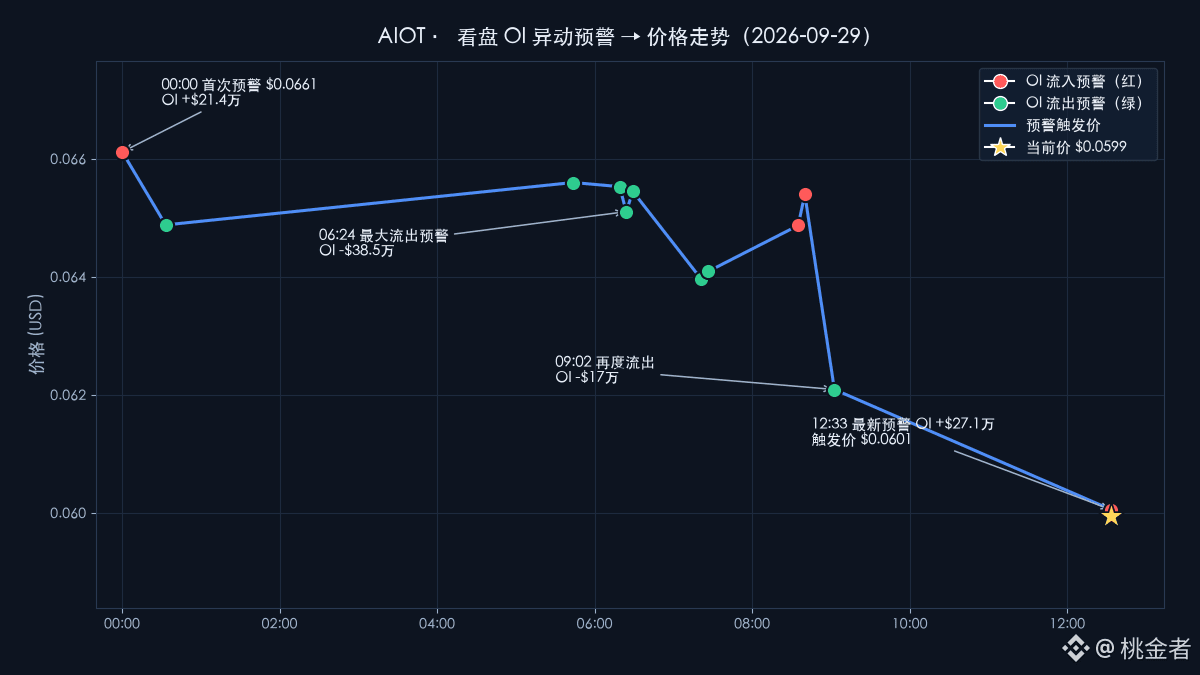
First, look at Figure 1 (blue line = price, red dot = OI inflow alert, green dot = OI outflow alert)
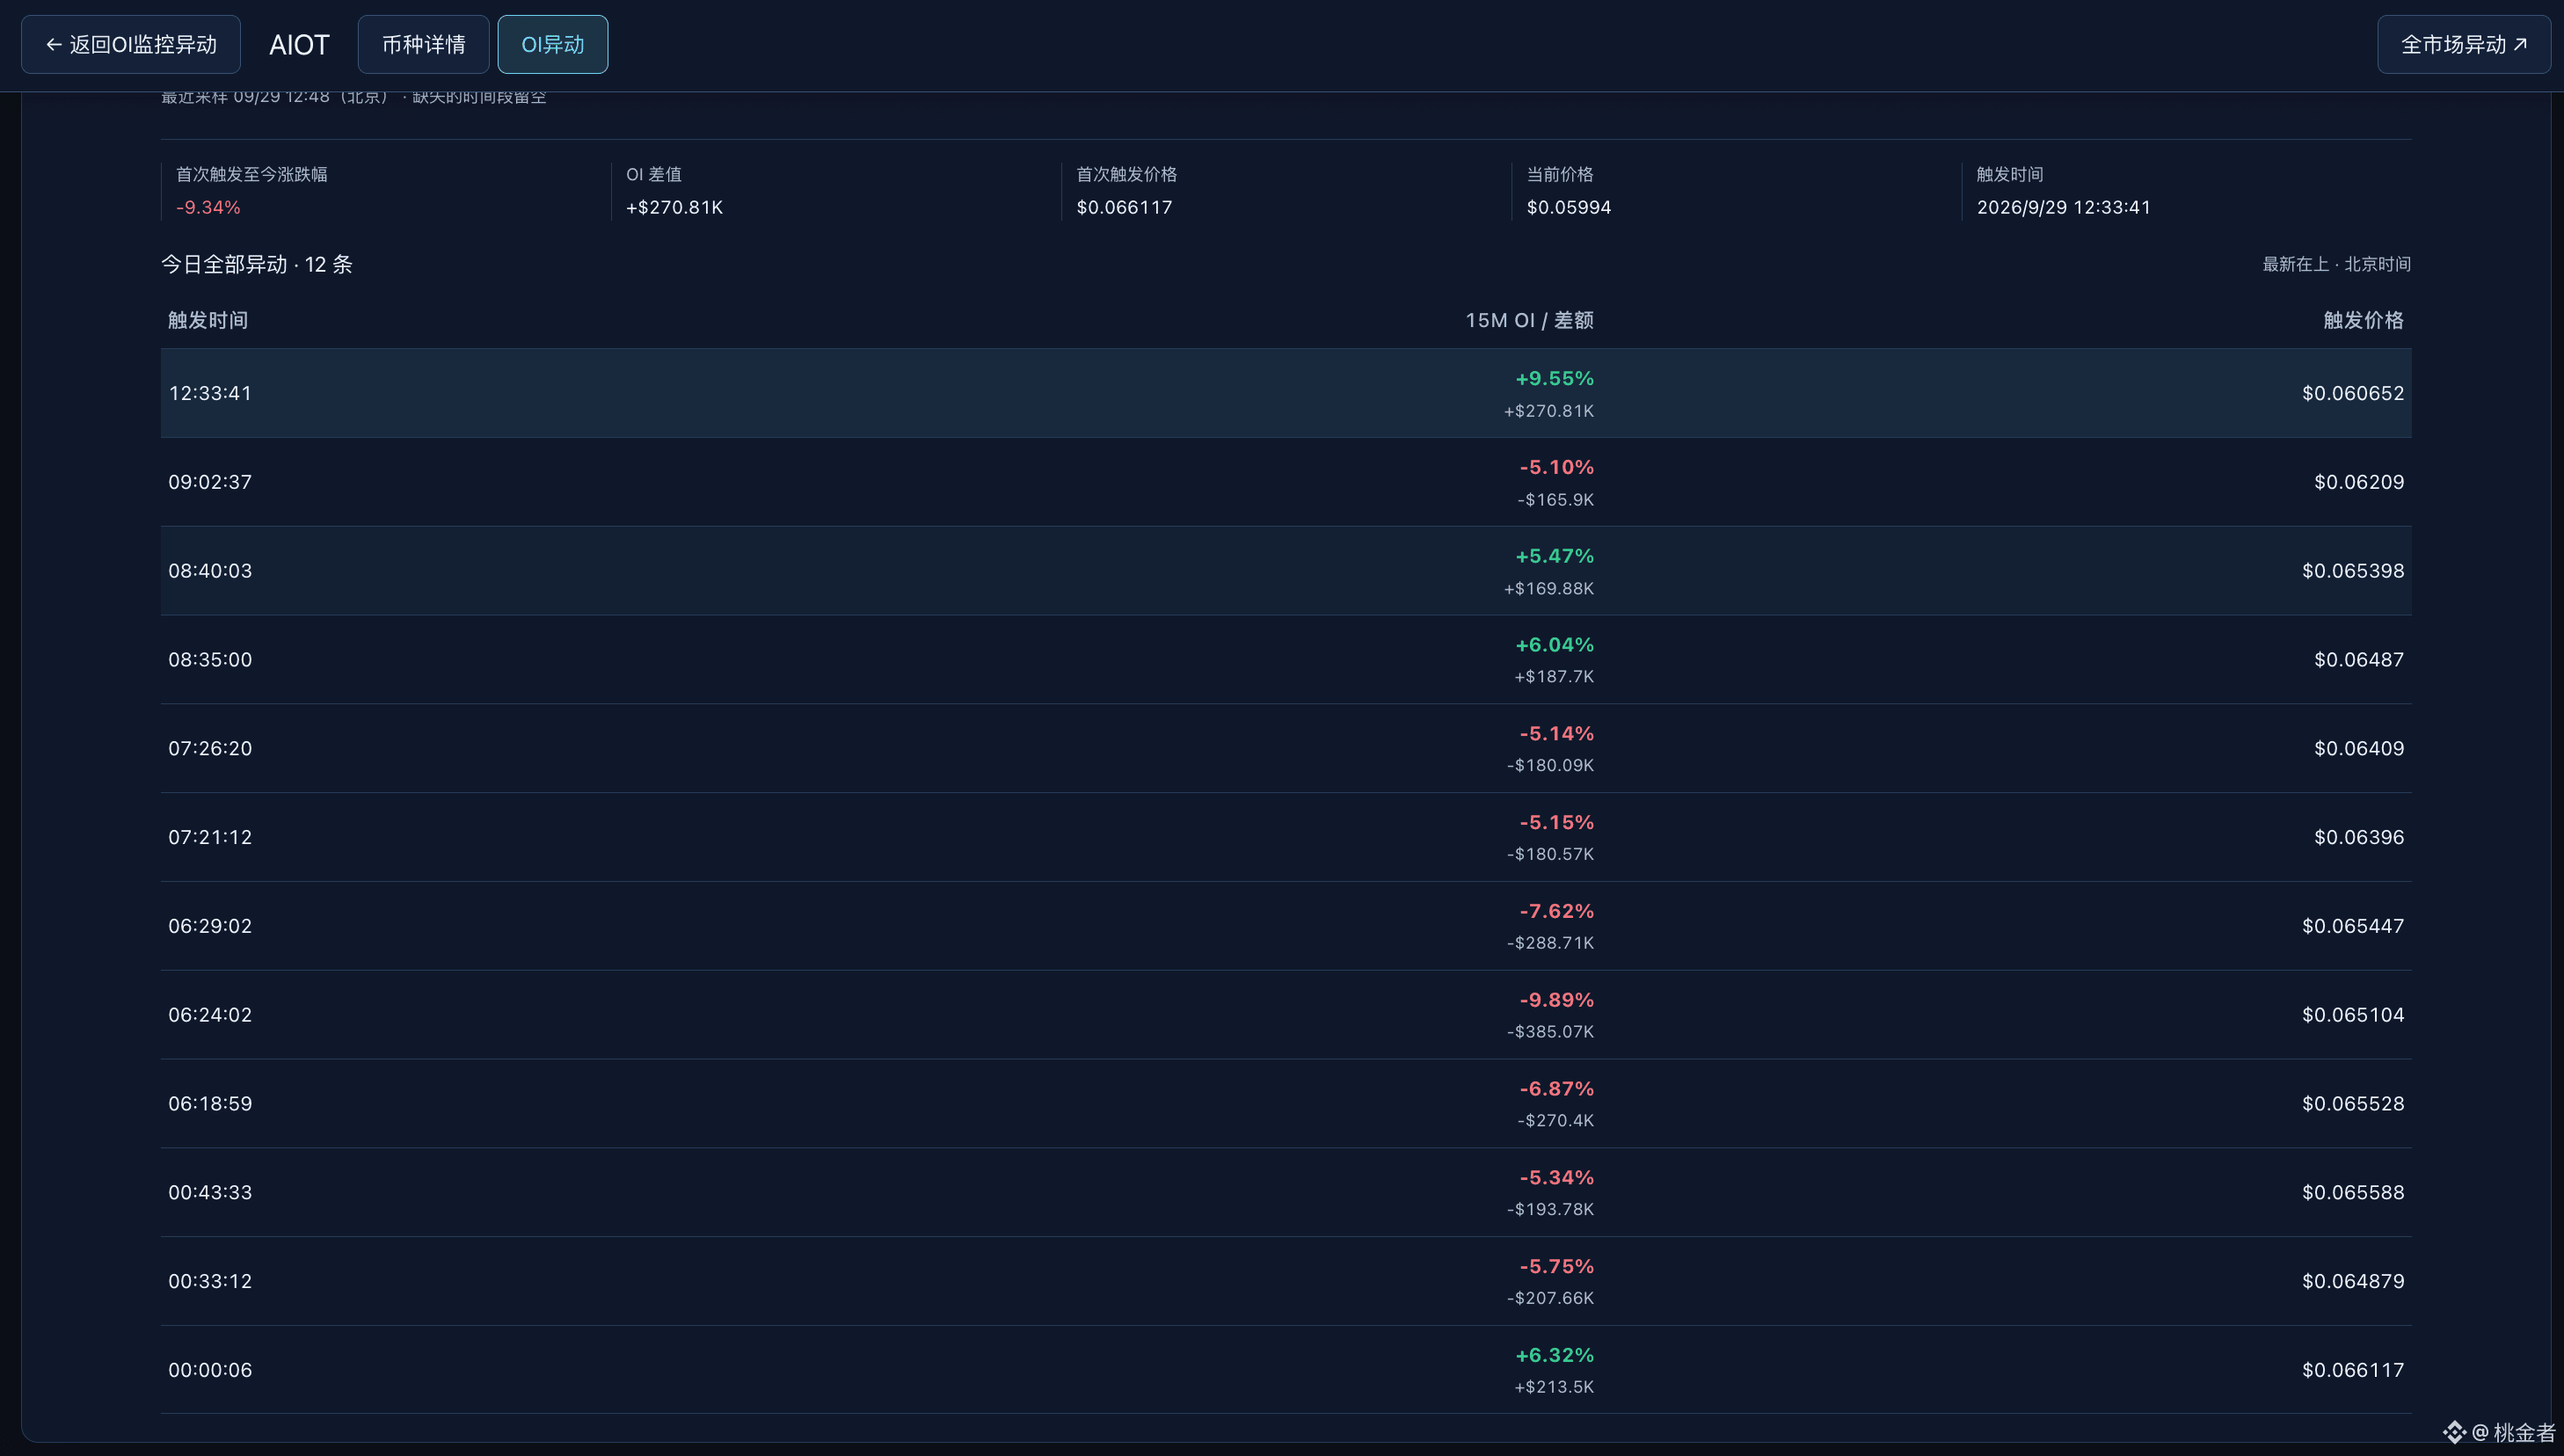
Timeline (data from a trading monitor; Figure 2 is the original alert log. 12 triggers can be matched one by one):
00:00 First alert: OI +6.32%, price $0.0661
Starting at 05:43, the outflow alerts begin to cascade:
05:43 -$194k → 06:18 -$270k
→ 06:24 -$385k → 06:29 -$289k
At 07:21 and 07:26, two more cuts—each -$180k
And at that time, the price was still hovering around $0.065
So what happened next?
09:02 The final outflow alert: -$170k
Price was $0.062, and then it started a steady slide lower
Now it’s $0.0599, and since the first alert, it’s down -9.3%
Translate this 🧠
Continuous large OI outflows = capital is withdrawing
Price hasn’t fallen yet ≠ it won’t fall; it’s just not its turn yet
From the dense outflow alert zone (around $0.065) to now: -8%+
At 12:33, +$271k inflow alert just appeared
Is this a rebound, or are we still catching falling knives? Let the bullets fly a bit longer 🕰️
Tools: monitor charts—automatically track OI end to end
🟢 Continuous inflow = money entering
🔴 Continuous outflow = money pulling out; the price dip is only a matter of time
Not investment advice—manage your own positions 💎🙌
Have you experienced the “OI moves first, price follows later” before? Chat in the comments 👀
#AIOT #OI #on-chain data
🛰️ AIOT: A drop that was flagged 3 hours early
First, look at Figure 1 (blue line = price, red dot = OI inflow alert, green dot = OI outflow alert)
Timeline (data from a trading monitor; Figure 2 is the original alert log. 12 triggers can be matched one by one):
00:00 First alert: OI +6.32%, price $0.0661
Starting at 05:43, the outflow alerts begin to cascade:
05:43 -$194k → 06:18 -$270k
→ 06:24 -$385k → 06:29 -$289k
At 07:21 and 07:26, two more cuts—each -$180k
And at that time, the price was still hovering around $0.065
So what happened next?
09:02 The final outflow alert: -$170k
Price was $0.062, and then it started a steady slide lower
Now it’s $0.0599, and since the first alert, it’s down -9.3%
Translate this 🧠
Continuous large OI outflows = capital is withdrawing
Price hasn’t fallen yet ≠ it won’t fall; it’s just not its turn yet
From the dense outflow alert zone (around $0.065) to now: -8%+
At 12:33, +$271k inflow alert just appeared
Is this a rebound, or are we still catching falling knives? Let the bullets fly a bit longer 🕰️
Tools: monitor charts—automatically track OI end to end
🟢 Continuous inflow = money entering
🔴 Continuous outflow = money pulling out; the price dip is only a matter of time
Not investment advice—manage your own positions 💎🙌
Have you experienced the “OI moves first, price follows later” before? Chat in the comments 👀
#AIOT #OI #on-chain data
First, look at Figure 1 (blue line = price, red dot = OI inflow alert, green dot = OI outflow alert)
Timeline (data from a trading monitor; Figure 2 is the original alert log. 12 triggers can be matched one by one):
00:00 First alert: OI +6.32%, price $0.0661
Starting at 05:43, the outflow alerts begin to cascade:
05:43 -$194k → 06:18 -$270k
→ 06:24 -$385k → 06:29 -$289k
At 07:21 and 07:26, two more cuts—each -$180k
And at that time, the price was still hovering around $0.065
So what happened next?
09:02 The final outflow alert: -$170k
Price was $0.062, and then it started a steady slide lower
Now it’s $0.0599, and since the first alert, it’s down -9.3%
Translate this 🧠
Continuous large OI outflows = capital is withdrawing
Price hasn’t fallen yet ≠ it won’t fall; it’s just not its turn yet
From the dense outflow alert zone (around $0.065) to now: -8%+
At 12:33, +$271k inflow alert just appeared
Is this a rebound, or are we still catching falling knives? Let the bullets fly a bit longer 🕰️
Tools: monitor charts—automatically track OI end to end
🟢 Continuous inflow = money entering
🔴 Continuous outflow = money pulling out; the price dip is only a matter of time
Not investment advice—manage your own positions 💎🙌
Have you experienced the “OI moves first, price follows later” before? Chat in the comments 👀
#AIOT #OI #on-chain data
166
·
--
🦞 I tested an OI monitoring tool—caught a live lobster today
Coin: lobster
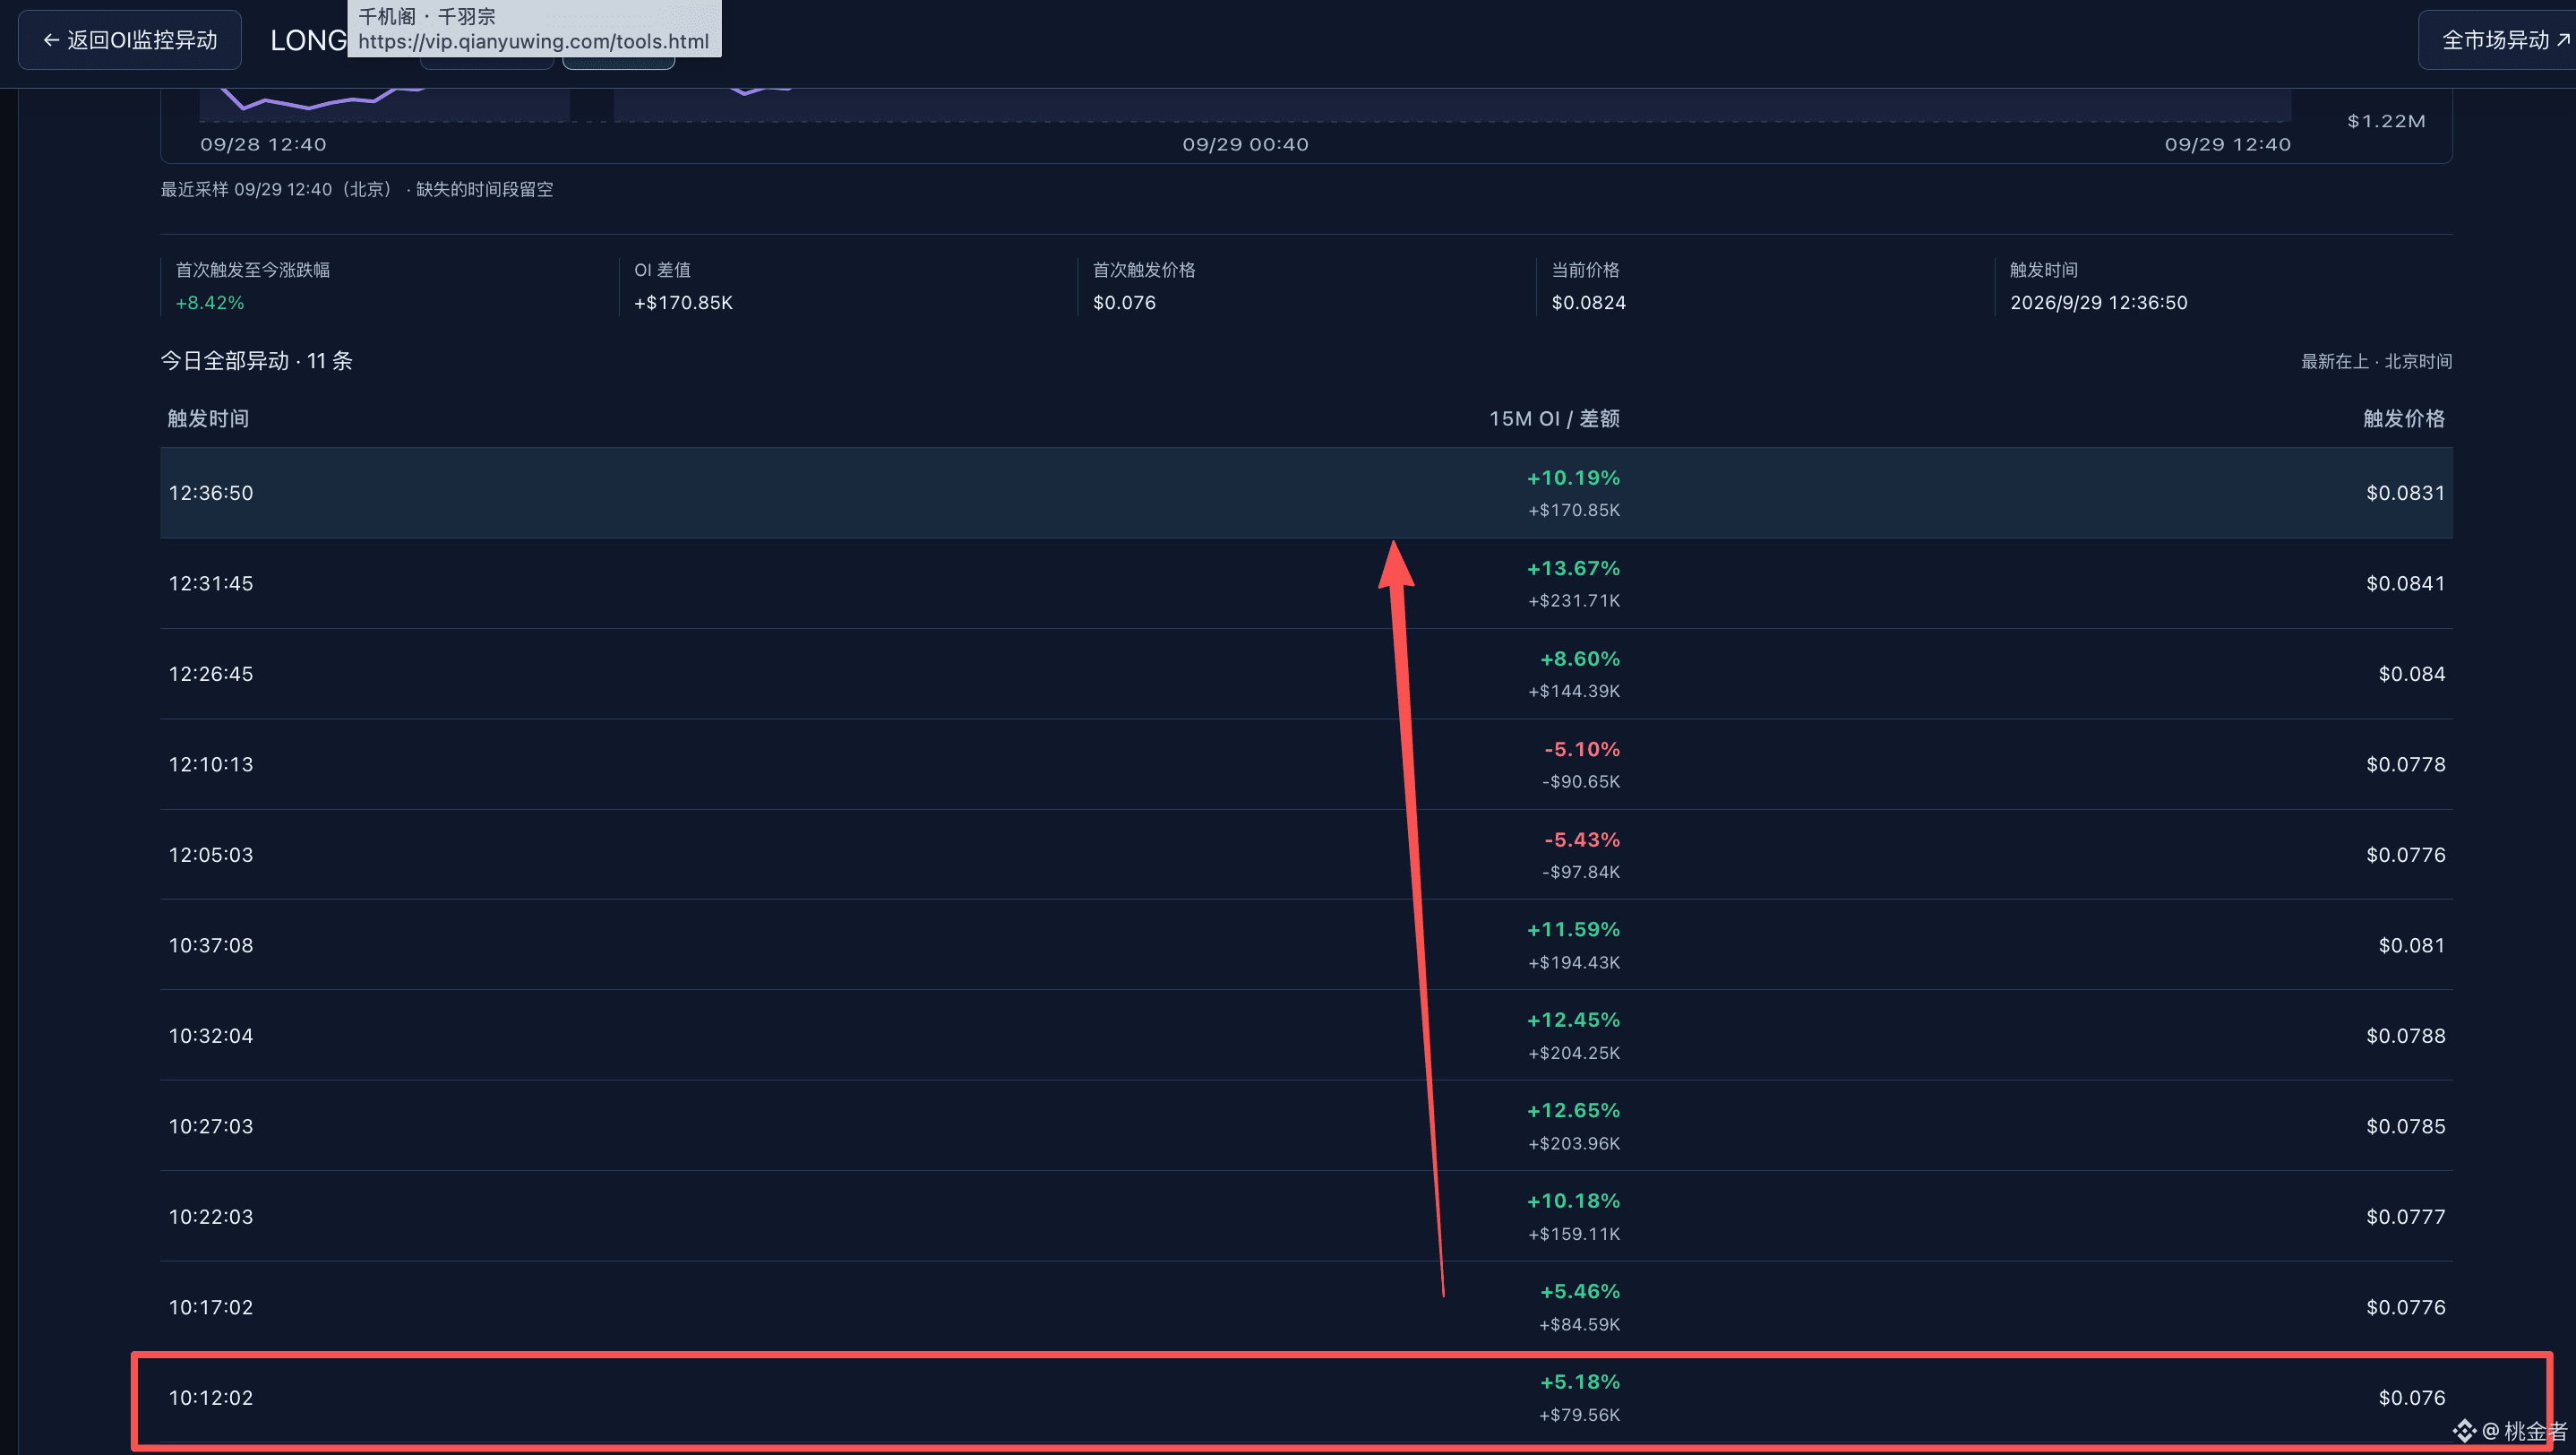
Here’s the full timeline for this afternoon (see screenshot):
10:12 First alert: OI 5 minutes +5.18%, single order +$736k; price was $0.0776 at the time
Then over the next 3 hours, there were 11 consecutive triggers
By the latest trigger at 12:36, the price had already moved to $0.0831
First alert → latest trigger price: +7%
The real value isn’t the percentage gain—it’s the timing 👇
From 10:27 to 10:37, there was a run where the 15-minute OI hit three consecutive times of +12% or more; over the course of a day, hundreds of thousands gets piled in—while the price hadn’t moved much yet
If you wait for the candlesticks to form before entering, your cost is already 6–8% higher
Even more specifically: it also marks two OI pullback alerts at 12:05 and 12:10 (-5.4%, -5.1%)—funds withdrawing and returning; you can see it clearly on the chart
This tool automatically watches OI end-to-end:
🟢 Continuous alerts = there’s capital continuously taking action
🔴 Alert gaps = the pump is likely to pause
From this lobster’s anomaly to the rally, the rhythm was flagged by it ahead of time
Not financial advice—manage your own position 💎🙌
What tool do you use to watch OI? Share in the comments 👀
#龙虾 #OI #onchain data
🦞 I tested an OI monitoring tool—caught a live lobster today
Coin: lobster
Here’s the full timeline for this afternoon (see screenshot):
10:12 First alert: OI 5 minutes +5.18%, single order +$736k; price was $0.0776 at the time
Then over the next 3 hours, there were 11 consecutive triggers
By the latest trigger at 12:36, the price had already moved to $0.0831
First alert → latest trigger price: +7%
The real value isn’t the percentage gain—it’s the timing 👇
From 10:27 to 10:37, there was a run where the 15-minute OI hit three consecutive times of +12% or more; over the course of a day, hundreds of thousands gets piled in—while the price hadn’t moved much yet
If you wait for the candlesticks to form before entering, your cost is already 6–8% higher
Even more specifically: it also marks two OI pullback alerts at 12:05 and 12:10 (-5.4%, -5.1%)—funds withdrawing and returning; you can see it clearly on the chart
This tool automatically watches OI end-to-end:
🟢 Continuous alerts = there’s capital continuously taking action
🔴 Alert gaps = the pump is likely to pause
From this lobster’s anomaly to the rally, the rhythm was flagged by it ahead of time
Not financial advice—manage your own position 💎🙌
What tool do you use to watch OI? Share in the comments 👀
#龙虾 #OI #onchain data
Coin: lobster
Here’s the full timeline for this afternoon (see screenshot):
10:12 First alert: OI 5 minutes +5.18%, single order +$736k; price was $0.0776 at the time
Then over the next 3 hours, there were 11 consecutive triggers
By the latest trigger at 12:36, the price had already moved to $0.0831
First alert → latest trigger price: +7%
The real value isn’t the percentage gain—it’s the timing 👇
From 10:27 to 10:37, there was a run where the 15-minute OI hit three consecutive times of +12% or more; over the course of a day, hundreds of thousands gets piled in—while the price hadn’t moved much yet
If you wait for the candlesticks to form before entering, your cost is already 6–8% higher
Even more specifically: it also marks two OI pullback alerts at 12:05 and 12:10 (-5.4%, -5.1%)—funds withdrawing and returning; you can see it clearly on the chart
This tool automatically watches OI end-to-end:
🟢 Continuous alerts = there’s capital continuously taking action
🔴 Alert gaps = the pump is likely to pause
From this lobster’s anomaly to the rally, the rhythm was flagged by it ahead of time
Not financial advice—manage your own position 💎🙌
What tool do you use to watch OI? Share in the comments 👀
#龙虾 #OI #onchain data
195
·
--
Dropped 11%, but the story isn’t broken: $ONDO is now a contrarian setup
$ONDO 0.5194 (-11.15%)
Binance 24h trading volume: 82.70 million U
Intraday: 0.6089 → 0.5023
First, here’s why it fell today:
It wasn’t the project—it's profit-taking.
From 9/24–27, the RWA sector collectively rallied.
ONDO rose over 30% in a week.
On 9/28, a strong line—RWA and AI together—reversed and gave back.
But the fundamentals have actually been better these past two days:
① On 9/24, three tokenized investment portfolios launched.
② On 9/27, tokenized Treasury bonds TVL topped the industry.
③ Intelligent Portfolios opened up in parallel.
However, “contrarian” doesn’t mean you can pick it up for free:
BlackRock is an authorized strategy, not a direct coin-buying signal.
Most people skip this point completely.
🟢 Bulls: Holding 0.50 and shrinking volume—this is a sentiment squeeze, not a logic break.
🔴 Bears: If 0.5023 breaks, the next clear range is the vacuum zone of 0.42–0.48.
Discipline levels:
Entry: Near 0.50, once you see a high-volume reversal/bottoming signal, then enter.
Invalidation: If the daily candle closes below 0.48, wait and reassess after price returns to the lower end of the range.
TVL is #1 yet it’s down 11%—are you treating this as an opportunity or a trap?
$ONDO #ONDO #RWA #BinanceSquare
Not investment advice
Dropped 11%, but the story isn’t broken: $ONDO is now a contrarian setup
$ONDO 0.5194 (-11.15%)
Binance 24h trading volume: 82.70 million U
Intraday: 0.6089 → 0.5023
First, here’s why it fell today:
It wasn’t the project—it's profit-taking.
From 9/24–27, the RWA sector collectively rallied.
ONDO rose over 30% in a week.
On 9/28, a strong line—RWA and AI together—reversed and gave back.
But the fundamentals have actually been better these past two days:
① On 9/24, three tokenized investment portfolios launched.
② On 9/27, tokenized Treasury bonds TVL topped the industry.
③ Intelligent Portfolios opened up in parallel.
However, “contrarian” doesn’t mean you can pick it up for free:
BlackRock is an authorized strategy, not a direct coin-buying signal.
Most people skip this point completely.
🟢 Bulls: Holding 0.50 and shrinking volume—this is a sentiment squeeze, not a logic break.
🔴 Bears: If 0.5023 breaks, the next clear range is the vacuum zone of 0.42–0.48.
Discipline levels:
Entry: Near 0.50, once you see a high-volume reversal/bottoming signal, then enter.
Invalidation: If the daily candle closes below 0.48, wait and reassess after price returns to the lower end of the range.
TVL is #1 yet it’s down 11%—are you treating this as an opportunity or a trap?
$ONDO #ONDO #RWA #BinanceSquare
Not investment advice
$ONDO 0.5194 (-11.15%)
Binance 24h trading volume: 82.70 million U
Intraday: 0.6089 → 0.5023
First, here’s why it fell today:
It wasn’t the project—it's profit-taking.
From 9/24–27, the RWA sector collectively rallied.
ONDO rose over 30% in a week.
On 9/28, a strong line—RWA and AI together—reversed and gave back.
But the fundamentals have actually been better these past two days:
① On 9/24, three tokenized investment portfolios launched.
② On 9/27, tokenized Treasury bonds TVL topped the industry.
③ Intelligent Portfolios opened up in parallel.
However, “contrarian” doesn’t mean you can pick it up for free:
BlackRock is an authorized strategy, not a direct coin-buying signal.
Most people skip this point completely.
🟢 Bulls: Holding 0.50 and shrinking volume—this is a sentiment squeeze, not a logic break.
🔴 Bears: If 0.5023 breaks, the next clear range is the vacuum zone of 0.42–0.48.
Discipline levels:
Entry: Near 0.50, once you see a high-volume reversal/bottoming signal, then enter.
Invalidation: If the daily candle closes below 0.48, wait and reassess after price returns to the lower end of the range.
TVL is #1 yet it’s down 11%—are you treating this as an opportunity or a trap?
$ONDO #ONDO #RWA #BinanceSquare
Not investment advice

151
·
--
$SUI From 0.81 to 1.29—now back to the original structure
$SUI 1.1663 (-7.78%)
Binance 24h trading volume: 207 million U
Intra-day: 1.2921 → 1.1330
First, let’s lay out this upswing:
On 9/19 the close was still at 0.81
By 9/26 it had already reached 1.16
This week’s first move directly pierced to 1.2921
Then it closed with a long upper wick
The structure now looks bad:
① The 1.28–1.30 resistance zone has been clearly rejected
② The lower trendline of the rising wedge has already been broken through
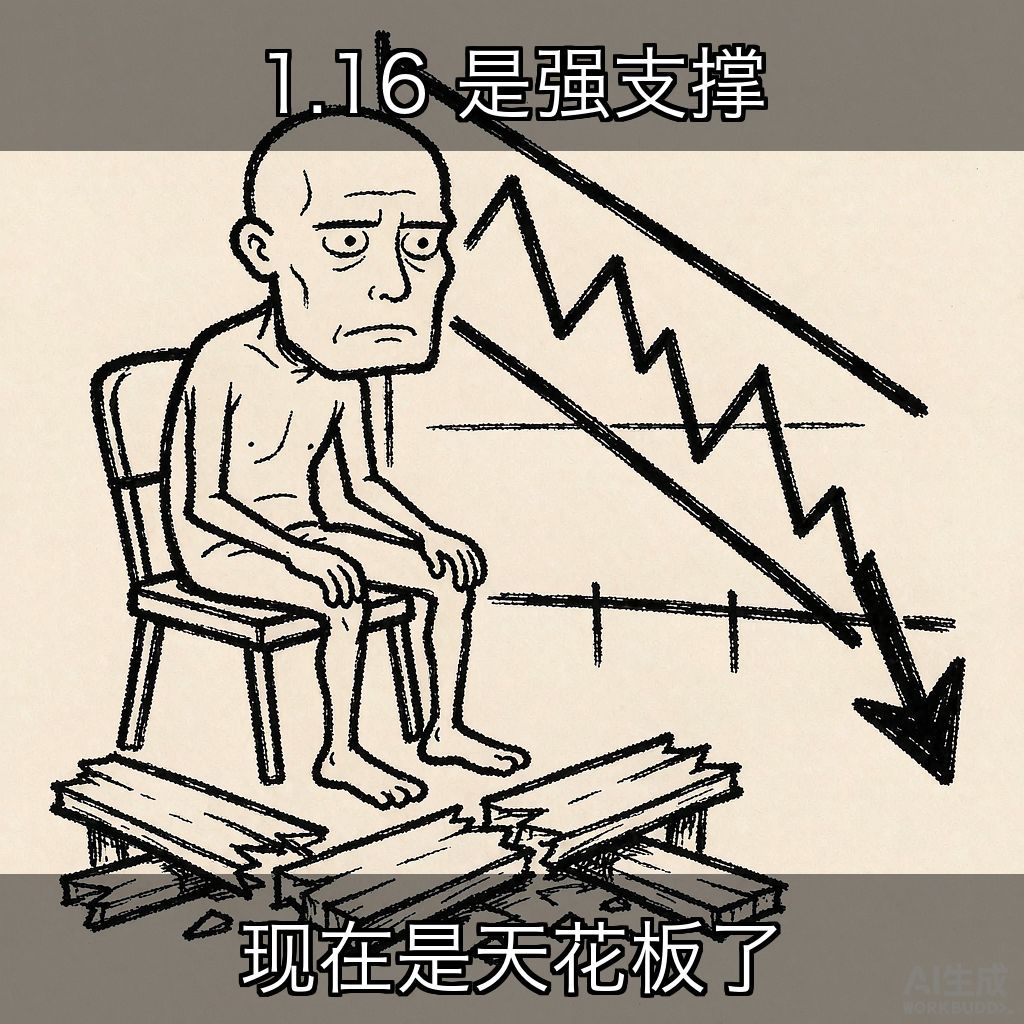
③ That “must-hold” level at 1.16
Intra-day low was 1.1330, and it was broken early
There’s also a calendar factor:
On 10/1, 13.26 million SUI will be released
About 16.84 million U, or 0.32% of the already released amount
The amount isn’t huge, but it happens on the day the level was broken
🟢 Bulls: Quickly reclaim 1.1330 with increased volume, and the structure can still be repaired
🔴 Bears: 1.16 turns into resistance; the next real support is the integer level 1.00
Discipline levels
Entry: Reclaim 1.20 and see volume increase—that counts as repair
Invalidation: A drop below 1.1330 (today’s low); then look down to 1.00
Are you copying support where you are, or waiting for a break and then standing firm?
$SUI #Sui #SUI #BinanceSquare
Not investment advice
$SUI From 0.81 to 1.29—now back to the original structure
$SUI 1.1663 (-7.78%)
Binance 24h trading volume: 207 million U
Intra-day: 1.2921 → 1.1330
First, let’s lay out this upswing:
On 9/19 the close was still at 0.81
By 9/26 it had already reached 1.16
This week’s first move directly pierced to 1.2921
Then it closed with a long upper wick
The structure now looks bad:
① The 1.28–1.30 resistance zone has been clearly rejected
② The lower trendline of the rising wedge has already been broken through
③ That “must-hold” level at 1.16
Intra-day low was 1.1330, and it was broken early
There’s also a calendar factor:
On 10/1, 13.26 million SUI will be released
About 16.84 million U, or 0.32% of the already released amount
The amount isn’t huge, but it happens on the day the level was broken
🟢 Bulls: Quickly reclaim 1.1330 with increased volume, and the structure can still be repaired
🔴 Bears: 1.16 turns into resistance; the next real support is the integer level 1.00
Discipline levels
Entry: Reclaim 1.20 and see volume increase—that counts as repair
Invalidation: A drop below 1.1330 (today’s low); then look down to 1.00
Are you copying support where you are, or waiting for a break and then standing firm?
$SUI #Sui #SUI #BinanceSquare
Not investment advice
$SUI 1.1663 (-7.78%)
Binance 24h trading volume: 207 million U
Intra-day: 1.2921 → 1.1330
First, let’s lay out this upswing:
On 9/19 the close was still at 0.81
By 9/26 it had already reached 1.16
This week’s first move directly pierced to 1.2921
Then it closed with a long upper wick
The structure now looks bad:
① The 1.28–1.30 resistance zone has been clearly rejected
② The lower trendline of the rising wedge has already been broken through
③ That “must-hold” level at 1.16
Intra-day low was 1.1330, and it was broken early
There’s also a calendar factor:
On 10/1, 13.26 million SUI will be released
About 16.84 million U, or 0.32% of the already released amount
The amount isn’t huge, but it happens on the day the level was broken
🟢 Bulls: Quickly reclaim 1.1330 with increased volume, and the structure can still be repaired
🔴 Bears: 1.16 turns into resistance; the next real support is the integer level 1.00
Discipline levels
Entry: Reclaim 1.20 and see volume increase—that counts as repair
Invalidation: A drop below 1.1330 (today’s low); then look down to 1.00
Are you copying support where you are, or waiting for a break and then standing firm?
$SUI #Sui #SUI #BinanceSquare
Not investment advice
2
746
·
--
The buyback story sounds great, but you need to look at two dates: $ENA
$ENA 0.2568 (-5.59%)
Binance 24h trading volume: 70.90 million U
Intraday: 0.2769 → 0.2522
The cash flow on this end is indeed improving:
On 9/2, governance passed the “fee switch”
Up to 95% of net income can buy back ENA
But it’s tiered—it depends on USDe supply
It won’t start the first round until it reaches 7.5 billion U
On 9/25, they added another revenue curve:
Binance tokenized U.S. stocks (bStocks) are used to pledge into USDe
Long-term perpetuals are used for hedging
The addressable market expands from $2.5 trillion to $150 trillion+
On 9/26, the official announcement came again:
Starting 9/30, all USDe token incentives will be fully shut off
That eliminates the last source of dilution
The issue is the timetable:
On 10/5, there will be a one-time unlock of about 1.4 billion ENA
That’s roughly 14% of circulating supply—17 months earlier than the original plan
And a single address, StablecoinX, is still holding 20% of the chips
🟢 Bulls: inflation hits zero + a buyback framework—cleaner long-term structure
🔴 Bears: the buyback doesn’t trigger; instead, they dump 14% in new supply first
Discipline level
Entry: after the unlock, it must hold above 0.263 for 72 hours to count as successfully absorbed
Invalidation: if it breaks below 0.2522 (today’s low), supply overwhelms the buyback narrative
Buyback vs. unlock—which do you think arrives first?
$ENA #Ethena #USDe #Binance Square
Not investment advice
The buyback story sounds great, but you need to look at two dates: $ENA
$ENA 0.2568 (-5.59%)
Binance 24h trading volume: 70.90 million U
Intraday: 0.2769 → 0.2522
The cash flow on this end is indeed improving:
On 9/2, governance passed the “fee switch”
Up to 95% of net income can buy back ENA
But it’s tiered—it depends on USDe supply
It won’t start the first round until it reaches 7.5 billion U
On 9/25, they added another revenue curve:
Binance tokenized U.S. stocks (bStocks) are used to pledge into USDe
Long-term perpetuals are used for hedging
The addressable market expands from $2.5 trillion to $150 trillion+
On 9/26, the official announcement came again:
Starting 9/30, all USDe token incentives will be fully shut off
That eliminates the last source of dilution
The issue is the timetable:
On 10/5, there will be a one-time unlock of about 1.4 billion ENA
That’s roughly 14% of circulating supply—17 months earlier than the original plan
And a single address, StablecoinX, is still holding 20% of the chips
🟢 Bulls: inflation hits zero + a buyback framework—cleaner long-term structure
🔴 Bears: the buyback doesn’t trigger; instead, they dump 14% in new supply first
Discipline level
Entry: after the unlock, it must hold above 0.263 for 72 hours to count as successfully absorbed
Invalidation: if it breaks below 0.2522 (today’s low), supply overwhelms the buyback narrative
Buyback vs. unlock—which do you think arrives first?
$ENA #Ethena #USDe #Binance Square
Not investment advice
$ENA 0.2568 (-5.59%)
Binance 24h trading volume: 70.90 million U
Intraday: 0.2769 → 0.2522
The cash flow on this end is indeed improving:
On 9/2, governance passed the “fee switch”
Up to 95% of net income can buy back ENA
But it’s tiered—it depends on USDe supply
It won’t start the first round until it reaches 7.5 billion U
On 9/25, they added another revenue curve:
Binance tokenized U.S. stocks (bStocks) are used to pledge into USDe
Long-term perpetuals are used for hedging
The addressable market expands from $2.5 trillion to $150 trillion+
On 9/26, the official announcement came again:
Starting 9/30, all USDe token incentives will be fully shut off
That eliminates the last source of dilution
The issue is the timetable:
On 10/5, there will be a one-time unlock of about 1.4 billion ENA
That’s roughly 14% of circulating supply—17 months earlier than the original plan
And a single address, StablecoinX, is still holding 20% of the chips
🟢 Bulls: inflation hits zero + a buyback framework—cleaner long-term structure
🔴 Bears: the buyback doesn’t trigger; instead, they dump 14% in new supply first
Discipline level
Entry: after the unlock, it must hold above 0.263 for 72 hours to count as successfully absorbed
Invalidation: if it breaks below 0.2522 (today’s low), supply overwhelms the buyback narrative
Buyback vs. unlock—which do you think arrives first?
$ENA #Ethena #USDe #Binance Square
Not investment advice

337
·
--
Money didn’t leave—just changed seats: $XLM +8.54%
$XLM 0.2338 (+8.54%)
Binance 24h trading volume: 71.20 million U
Intra-day: 0.2065 → 0.2347
Today’s script is like this:
Oil prices ↑, returns rate ↑ → BTC retreats back to 83,500
Altcoins mostly dump, but three sub-sectors are bought separately
This leg you’re on is called “Institutional Settlement / RWA Payments”
QNT → HBAR → XLM → XRP
This transmission chain is something traders push
Use it as a sentiment map—don’t treat it as a hard rule
$XLM also has plenty going for it today:
① Network TPS hits 217.4, a new all-time high
② On-chain RWA size is about 3.38 billion U, global #4
③ Protocol 28 upgrade, lifting performance a notch
④ BVNK supported native XLM after Mastercard’s acquisition
Technical setup:
Breaks the descending trendline, with volume expanding in sync
🟢 Bulls: hold above 0.213; first look at 0.226, then 0.241
🔴 Bears: rotation capital comes fast and leaves even faster—just one candle can do -8%
Discipline levels
Entry: hold above 0.226 and chase only with increased volume
Invalidation: fall back below 0.2065 (today’s low)—the rotation thesis is falsified
In this rotation—did your coin get called?
$XLM #Stellar #RWA #Binance Square
Not investment advice
Money didn’t leave—just changed seats: $XLM +8.54%
$XLM 0.2338 (+8.54%)
Binance 24h trading volume: 71.20 million U
Intra-day: 0.2065 → 0.2347
Today’s script is like this:
Oil prices ↑, returns rate ↑ → BTC retreats back to 83,500
Altcoins mostly dump, but three sub-sectors are bought separately
This leg you’re on is called “Institutional Settlement / RWA Payments”
QNT → HBAR → XLM → XRP
This transmission chain is something traders push
Use it as a sentiment map—don’t treat it as a hard rule
$XLM also has plenty going for it today:
① Network TPS hits 217.4, a new all-time high
② On-chain RWA size is about 3.38 billion U, global #4
③ Protocol 28 upgrade, lifting performance a notch
④ BVNK supported native XLM after Mastercard’s acquisition
Technical setup:
Breaks the descending trendline, with volume expanding in sync
🟢 Bulls: hold above 0.213; first look at 0.226, then 0.241
🔴 Bears: rotation capital comes fast and leaves even faster—just one candle can do -8%
Discipline levels
Entry: hold above 0.226 and chase only with increased volume
Invalidation: fall back below 0.2065 (today’s low)—the rotation thesis is falsified
In this rotation—did your coin get called?
$XLM #Stellar #RWA #Binance Square
Not investment advice
$XLM 0.2338 (+8.54%)
Binance 24h trading volume: 71.20 million U
Intra-day: 0.2065 → 0.2347
Today’s script is like this:
Oil prices ↑, returns rate ↑ → BTC retreats back to 83,500
Altcoins mostly dump, but three sub-sectors are bought separately
This leg you’re on is called “Institutional Settlement / RWA Payments”
QNT → HBAR → XLM → XRP
This transmission chain is something traders push
Use it as a sentiment map—don’t treat it as a hard rule
$XLM also has plenty going for it today:
① Network TPS hits 217.4, a new all-time high
② On-chain RWA size is about 3.38 billion U, global #4
③ Protocol 28 upgrade, lifting performance a notch
④ BVNK supported native XLM after Mastercard’s acquisition
Technical setup:
Breaks the descending trendline, with volume expanding in sync
🟢 Bulls: hold above 0.213; first look at 0.226, then 0.241
🔴 Bears: rotation capital comes fast and leaves even faster—just one candle can do -8%
Discipline levels
Entry: hold above 0.226 and chase only with increased volume
Invalidation: fall back below 0.2065 (today’s low)—the rotation thesis is falsified
In this rotation—did your coin get called?
$XLM #Stellar #RWA #Binance Square
Not investment advice

258
·
--
$QNT Day -20%, the good news hasn’t changed, but the price first collapsed
$QNT 230.45(-20.40%)
Binance 24h trading volume: 240 million U
Intraday: 320.00 → 195.35
The catalyst is definitely strong:
On 9/24, The Clearing House selected Quant
to build the “on-chain currency program” base
covering RTP and CHIPS, the two major clearing networks
daily cleared volume of over $2 trillion
But three things were skipped:
① The network will only be available to institutions in the first half of 2027
② The announcement didn’t say banks must buy QNT
③ The UK GBTD is still in the real-trading test phase
So the result is:
In a week, it was pushed from over $60 to $320
Today it snapped back in one go, -20%
Open interest once climbed to about 159 million U
🟢 Bulls: reclaim 252 with increased volume, plus a second round of the narrative
🔴 Bears: 252 has already been lost; look next at 214 and today’s low of 195.35
Discipline levels
Board the trade: reclaim 252 first—don’t catch a straight falling knife
Invalidation: a break below 195.35 ends this round of the move
For the things that won’t land until 2027, what multiple of valuation are you giving it right now?
$QNT #Quant #RWA #Binance Square
Not investment advice
$QNT Day -20%, the good news hasn’t changed, but the price first collapsed
$QNT 230.45(-20.40%)
Binance 24h trading volume: 240 million U
Intraday: 320.00 → 195.35
The catalyst is definitely strong:
On 9/24, The Clearing House selected Quant
to build the “on-chain currency program” base
covering RTP and CHIPS, the two major clearing networks
daily cleared volume of over $2 trillion
But three things were skipped:
① The network will only be available to institutions in the first half of 2027
② The announcement didn’t say banks must buy QNT
③ The UK GBTD is still in the real-trading test phase
So the result is:
In a week, it was pushed from over $60 to $320
Today it snapped back in one go, -20%
Open interest once climbed to about 159 million U
🟢 Bulls: reclaim 252 with increased volume, plus a second round of the narrative
🔴 Bears: 252 has already been lost; look next at 214 and today’s low of 195.35
Discipline levels
Board the trade: reclaim 252 first—don’t catch a straight falling knife
Invalidation: a break below 195.35 ends this round of the move
For the things that won’t land until 2027, what multiple of valuation are you giving it right now?
$QNT #Quant #RWA #Binance Square
Not investment advice
$QNT 230.45(-20.40%)
Binance 24h trading volume: 240 million U
Intraday: 320.00 → 195.35
The catalyst is definitely strong:
On 9/24, The Clearing House selected Quant
to build the “on-chain currency program” base
covering RTP and CHIPS, the two major clearing networks
daily cleared volume of over $2 trillion
But three things were skipped:
① The network will only be available to institutions in the first half of 2027
② The announcement didn’t say banks must buy QNT
③ The UK GBTD is still in the real-trading test phase
So the result is:
In a week, it was pushed from over $60 to $320
Today it snapped back in one go, -20%
Open interest once climbed to about 159 million U
🟢 Bulls: reclaim 252 with increased volume, plus a second round of the narrative
🔴 Bears: 252 has already been lost; look next at 214 and today’s low of 195.35
Discipline levels
Board the trade: reclaim 252 first—don’t catch a straight falling knife
Invalidation: a break below 195.35 ends this round of the move
For the things that won’t land until 2027, what multiple of valuation are you giving it right now?
$QNT #Quant #RWA #Binance Square
Not investment advice

79
·
--
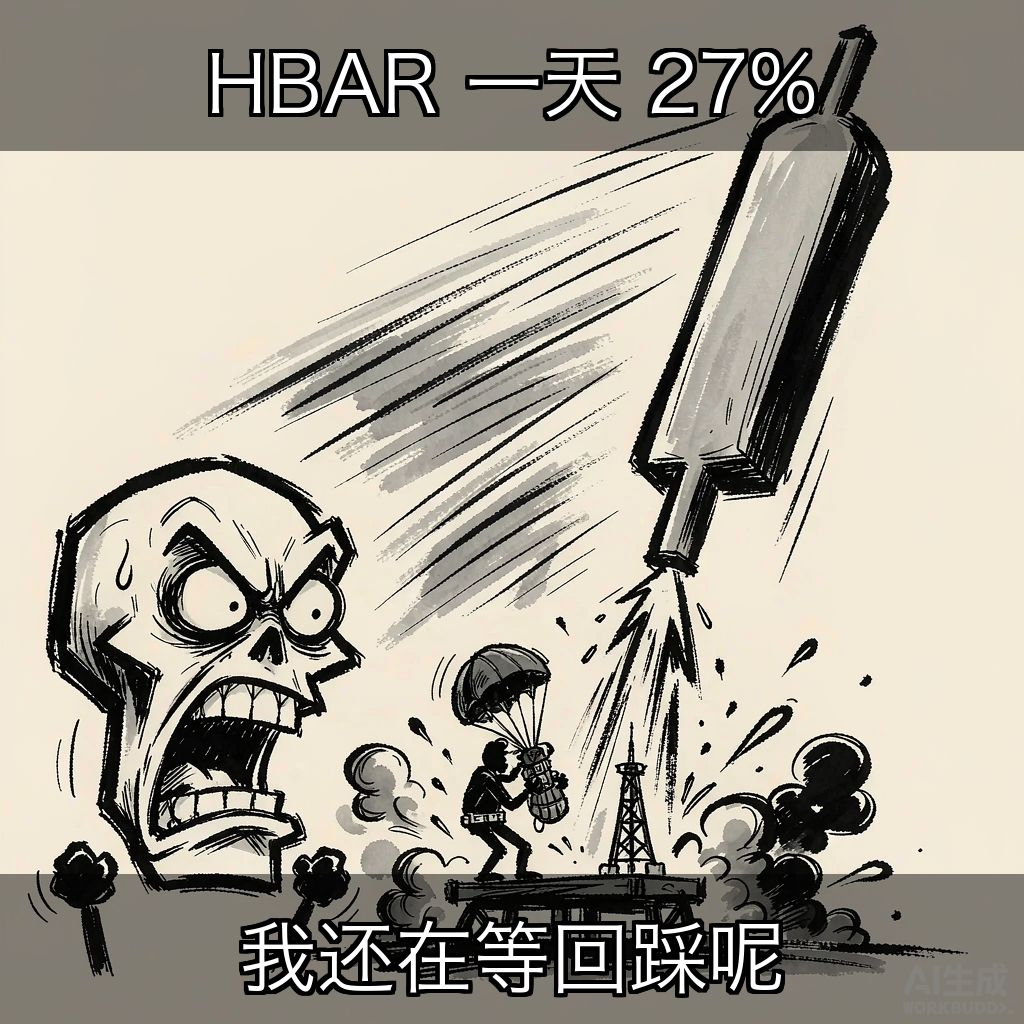
Partly True
$HBAR in one day +27% — why?
$HBAR 0.1219 (+27.03%)
Binance 24h trading volume: 200 million U
Intraday: 0.09415 → 0.13096
The catalyst is real, not just talk:
9/23-24, Hashgraph’s IDTrust
Listed in the IBM Cloud catalog
Provide verifiable identities for humans and AI agents
IBM has been on the Hedera governing council since 2019
9/28 — the official confirmation adds another blow:
Council members appear on the list for Nvidia’s
Open Agent Safety Platform
No backing down on liquidity:
Canary HBAR ETF (HBR)
Holdings about 782 million HBAR, roughly 73.5 million U
Technical analysis:
A single move breaks through six years of 0.10 suppression
But the daily RSI is already 81, in the overbought zone
🟢 Bulls: Hold above 0.12, and if it retraces to 0.11 without breaking, that’s the entry window
🔴 Bears: Buying in at RSI 81, a 20% pullback is completely normal
Discipline levels
Entry: Retrace to 0.11 and reclaim on strong volume, or stand above 0.13 and then chase
Invalidation: Break below 0.09415 (today’s low) — bulls are invalidated
This AI agents + enterprise-grade identity thesis — are you buying it?
$HBAR #HBAR #Hedera #Binance Square
Not investment advice
$HBAR in one day +27% — why?
$HBAR 0.1219 (+27.03%)
Binance 24h trading volume: 200 million U
Intraday: 0.09415 → 0.13096
The catalyst is real, not just talk:
9/23-24, Hashgraph’s IDTrust
Listed in the IBM Cloud catalog
Provide verifiable identities for humans and AI agents
IBM has been on the Hedera governing council since 2019
9/28 — the official confirmation adds another blow:
Council members appear on the list for Nvidia’s
Open Agent Safety Platform
No backing down on liquidity:
Canary HBAR ETF (HBR)
Holdings about 782 million HBAR, roughly 73.5 million U
Technical analysis:
A single move breaks through six years of 0.10 suppression
But the daily RSI is already 81, in the overbought zone
🟢 Bulls: Hold above 0.12, and if it retraces to 0.11 without breaking, that’s the entry window
🔴 Bears: Buying in at RSI 81, a 20% pullback is completely normal
Discipline levels
Entry: Retrace to 0.11 and reclaim on strong volume, or stand above 0.13 and then chase
Invalidation: Break below 0.09415 (today’s low) — bulls are invalidated
This AI agents + enterprise-grade identity thesis — are you buying it?
$HBAR #HBAR #Hedera #Binance Square
Not investment advice
$HBAR 0.1219 (+27.03%)
Binance 24h trading volume: 200 million U
Intraday: 0.09415 → 0.13096
The catalyst is real, not just talk:
9/23-24, Hashgraph’s IDTrust
Listed in the IBM Cloud catalog
Provide verifiable identities for humans and AI agents
IBM has been on the Hedera governing council since 2019
9/28 — the official confirmation adds another blow:
Council members appear on the list for Nvidia’s
Open Agent Safety Platform
No backing down on liquidity:
Canary HBAR ETF (HBR)
Holdings about 782 million HBAR, roughly 73.5 million U
Technical analysis:
A single move breaks through six years of 0.10 suppression
But the daily RSI is already 81, in the overbought zone
🟢 Bulls: Hold above 0.12, and if it retraces to 0.11 without breaking, that’s the entry window
🔴 Bears: Buying in at RSI 81, a 20% pullback is completely normal
Discipline levels
Entry: Retrace to 0.11 and reclaim on strong volume, or stand above 0.13 and then chase
Invalidation: Break below 0.09415 (today’s low) — bulls are invalidated
This AI agents + enterprise-grade identity thesis — are you buying it?
$HBAR #HBAR #Hedera #Binance Square
Not investment advice
218
·
--
Bitcoin breaks below 84,000, first to die is leverage.
$BTC 83,499(-1.24%)
Intraday high/low: 84,999 / 82,563
Total market cap across the entire network falls back to 2.85 trillion
Three hard data points:
① In the past 24h, liquidations were about 487 million U, with longs accounting for 81%
② Brent crude oil surged above $108
③ The 10Y U.S. Treasury yield is 5.26%, near a 20-year high
Causality chain:
Hormuz talks stalled → oil prices rose
→ inflation expectations warmed → rate-hike bets climbed
→ Treasury yields surged → re-pricing of non-yielding assets
→ profit-taking from a four-day winning streak last week was cashed in along the way
→ leveraged longs were forced to liquidate, amplifying the drop
Also, some cushioning:
U.S. spot ETFs have recorded net inflows for 7 straight days
On 9/28 alone, net inflows were still 145 million U
🟢 Longs: 82,563 holds; after leverage is cleared, there is room for recovery
🔴 Shorts: daily chart breaks below 81,722 (ETFs’ average cost basis), and the pullback will accelerate
Key levels
Resistance: 84,999 / 85,000
Support: 82,563 → 81,722
Two variables this week: Wednesday’s PCE, Friday’s nonfarm payrolls.
Before the PCE prints, do you add to positions or reduce leverage?
$BTC $ETH #比特币 #加密货币 #Binance Square
Not investment advice
Bitcoin breaks below 84,000, first to die is leverage.
$BTC 83,499(-1.24%)
Intraday high/low: 84,999 / 82,563
Total market cap across the entire network falls back to 2.85 trillion
Three hard data points:
① In the past 24h, liquidations were about 487 million U, with longs accounting for 81%
② Brent crude oil surged above $108
③ The 10Y U.S. Treasury yield is 5.26%, near a 20-year high
Causality chain:
Hormuz talks stalled → oil prices rose
→ inflation expectations warmed → rate-hike bets climbed
→ Treasury yields surged → re-pricing of non-yielding assets
→ profit-taking from a four-day winning streak last week was cashed in along the way
→ leveraged longs were forced to liquidate, amplifying the drop
Also, some cushioning:
U.S. spot ETFs have recorded net inflows for 7 straight days
On 9/28 alone, net inflows were still 145 million U
🟢 Longs: 82,563 holds; after leverage is cleared, there is room for recovery
🔴 Shorts: daily chart breaks below 81,722 (ETFs’ average cost basis), and the pullback will accelerate
Key levels
Resistance: 84,999 / 85,000
Support: 82,563 → 81,722
Two variables this week: Wednesday’s PCE, Friday’s nonfarm payrolls.
Before the PCE prints, do you add to positions or reduce leverage?
$BTC $ETH #比特币 #加密货币 #Binance Square
Not investment advice
$BTC 83,499(-1.24%)
Intraday high/low: 84,999 / 82,563
Total market cap across the entire network falls back to 2.85 trillion
Three hard data points:
① In the past 24h, liquidations were about 487 million U, with longs accounting for 81%
② Brent crude oil surged above $108
③ The 10Y U.S. Treasury yield is 5.26%, near a 20-year high
Causality chain:
Hormuz talks stalled → oil prices rose
→ inflation expectations warmed → rate-hike bets climbed
→ Treasury yields surged → re-pricing of non-yielding assets
→ profit-taking from a four-day winning streak last week was cashed in along the way
→ leveraged longs were forced to liquidate, amplifying the drop
Also, some cushioning:
U.S. spot ETFs have recorded net inflows for 7 straight days
On 9/28 alone, net inflows were still 145 million U
🟢 Longs: 82,563 holds; after leverage is cleared, there is room for recovery
🔴 Shorts: daily chart breaks below 81,722 (ETFs’ average cost basis), and the pullback will accelerate
Key levels
Resistance: 84,999 / 85,000
Support: 82,563 → 81,722
Two variables this week: Wednesday’s PCE, Friday’s nonfarm payrolls.
Before the PCE prints, do you add to positions or reduce leverage?
$BTC $ETH #比特币 #加密货币 #Binance Square
Not investment advice

120
·
--
Verified
📅 Today let’s talk about a coin with a “certain date”: $NEAR
First, look at the data 📊:
Current price $4.94 (-4.65%)
24h trading volume $235 million
Intra-day 4.83 → 5.58; it has pulled back 11% from the high
Its catalyst isn’t rumors—it’s something that has completed the full process:
① SEC registration statement became effective on 9/24
② NYSE Arca listing approved, ticker NRR
③ Custodian: Coinbase Custody
④ The fund directly holds and stakes NEAR, with about 67% of staking rewards distributed to holders
The key point is this 💡:
For an ETF to issue shares, real money must go into the market to buy NEAR
This isn’t hype—it’s buy pressure determined by the process
Fundamentals are also solid 🧠:
NEAR Intents cumulative processed volume exceeds $27 billion
v2.13.0 shipped with post-quantum signature support + dynamic sharding
But I have to pour some cold water 🧊:
🟢 In one month it rose from $2 to $5.44 (+200%); the trend hasn’t broken
🔴 The 14-day RSI once hit 79. Open interest in futures is $1.56 billion—longs are crowded to the max. The easiest time to “sell the facts” is on the day of the listing
Discipline level:
Want to get on → wait for it to hold above $5.00
Break below $4.50 → this parabolic move ends 🕯️
Not financial advice—manage your own position 💎🙌
Will you set your buy before the ETF listing, or chase after it lists? Comment section is about to get noisy 👀
$NEAR #NEARProtocol #ETF
📅 Today let’s talk about a coin with a “certain date”: $NEAR
First, look at the data 📊:
Current price $4.94 (-4.65%)
24h trading volume $235 million
Intra-day 4.83 → 5.58; it has pulled back 11% from the high
Its catalyst isn’t rumors—it’s something that has completed the full process:
① SEC registration statement became effective on 9/24
② NYSE Arca listing approved, ticker NRR
③ Custodian: Coinbase Custody
④ The fund directly holds and stakes NEAR, with about 67% of staking rewards distributed to holders
The key point is this 💡:
For an ETF to issue shares, real money must go into the market to buy NEAR
This isn’t hype—it’s buy pressure determined by the process
Fundamentals are also solid 🧠:
NEAR Intents cumulative processed volume exceeds $27 billion
v2.13.0 shipped with post-quantum signature support + dynamic sharding
But I have to pour some cold water 🧊:
🟢 In one month it rose from $2 to $5.44 (+200%); the trend hasn’t broken
🔴 The 14-day RSI once hit 79. Open interest in futures is $1.56 billion—longs are crowded to the max. The easiest time to “sell the facts” is on the day of the listing
Discipline level:
Want to get on → wait for it to hold above $5.00
Break below $4.50 → this parabolic move ends 🕯️
Not financial advice—manage your own position 💎🙌
Will you set your buy before the ETF listing, or chase after it lists? Comment section is about to get noisy 👀
$NEAR #NEARProtocol #ETF
First, look at the data 📊:
Current price $4.94 (-4.65%)
24h trading volume $235 million
Intra-day 4.83 → 5.58; it has pulled back 11% from the high
Its catalyst isn’t rumors—it’s something that has completed the full process:
① SEC registration statement became effective on 9/24
② NYSE Arca listing approved, ticker NRR
③ Custodian: Coinbase Custody
④ The fund directly holds and stakes NEAR, with about 67% of staking rewards distributed to holders
The key point is this 💡:
For an ETF to issue shares, real money must go into the market to buy NEAR
This isn’t hype—it’s buy pressure determined by the process
Fundamentals are also solid 🧠:
NEAR Intents cumulative processed volume exceeds $27 billion
v2.13.0 shipped with post-quantum signature support + dynamic sharding
But I have to pour some cold water 🧊:
🟢 In one month it rose from $2 to $5.44 (+200%); the trend hasn’t broken
🔴 The 14-day RSI once hit 79. Open interest in futures is $1.56 billion—longs are crowded to the max. The easiest time to “sell the facts” is on the day of the listing
Discipline level:
Want to get on → wait for it to hold above $5.00
Break below $4.50 → this parabolic move ends 🕯️
Not financial advice—manage your own position 💎🙌
Will you set your buy before the ETF listing, or chase after it lists? Comment section is about to get noisy 👀
$NEAR #NEARProtocol #ETF

648
·
--
🔥 Stop watching the narrative today—watch who’s actually making money: $PUMP
First, look at the data 📊:
Current price $0.0054 (+11.5%)
24h trading volume $96.00M
Intraday: 0.0047 → 0.0056, riding right along the intraday high
Why can it rise while the broader market stays still?
Because it has a machine—every day it throws real cash into the fire 🔥
① Cumulative buybacks: $463.5M, burning 167.9B tokens
= 16.79% of the original supply, permanently destroyed
② On 9/27: single-day buybacks of $1.14M, vs. $1.46M the day before
③ Platform rules: 50% of revenue is forcibly used to buy and burn tokens—this isn’t just a slogan
What’s even more brutal is the revenue ranking 💰:
Over the past 7 days, Pump.fun revenue was $15.16M
Overtaking Hyperliquid ($15.06M)
#3 on the all-chain application revenue leaderboard—only ahead are Tether and Circle
My take:
🟢 A rare “revenue → buyback → burn” loop. What’s moving isn’t the story—it’s the cashflow
🔴 But it’s still 44% below the all-time high. Quebec regulation issued a warning on 9/27, and BONK.fun is still right there competing for attention
Discipline level:
Hold above $0.00464 (breakout becomes support) counts
If it breaks down → watch for $0.00384 (50-day moving average) 🕯️
Not investment advice—manage your own position 💎🙌
Have you ever bought a coin propped up by buybacks? What happened later 👀
$PUMP #Pumpfun #Meme
🔥 Stop watching the narrative today—watch who’s actually making money: $PUMP
First, look at the data 📊:
Current price $0.0054 (+11.5%)
24h trading volume $96.00M
Intraday: 0.0047 → 0.0056, riding right along the intraday high
Why can it rise while the broader market stays still?
Because it has a machine—every day it throws real cash into the fire 🔥
① Cumulative buybacks: $463.5M, burning 167.9B tokens
= 16.79% of the original supply, permanently destroyed
② On 9/27: single-day buybacks of $1.14M, vs. $1.46M the day before
③ Platform rules: 50% of revenue is forcibly used to buy and burn tokens—this isn’t just a slogan
What’s even more brutal is the revenue ranking 💰:
Over the past 7 days, Pump.fun revenue was $15.16M
Overtaking Hyperliquid ($15.06M)
#3 on the all-chain application revenue leaderboard—only ahead are Tether and Circle
My take:
🟢 A rare “revenue → buyback → burn” loop. What’s moving isn’t the story—it’s the cashflow
🔴 But it’s still 44% below the all-time high. Quebec regulation issued a warning on 9/27, and BONK.fun is still right there competing for attention
Discipline level:
Hold above $0.00464 (breakout becomes support) counts
If it breaks down → watch for $0.00384 (50-day moving average) 🕯️
Not investment advice—manage your own position 💎🙌
Have you ever bought a coin propped up by buybacks? What happened later 👀
$PUMP #Pumpfun #Meme
First, look at the data 📊:
Current price $0.0054 (+11.5%)
24h trading volume $96.00M
Intraday: 0.0047 → 0.0056, riding right along the intraday high
Why can it rise while the broader market stays still?
Because it has a machine—every day it throws real cash into the fire 🔥
① Cumulative buybacks: $463.5M, burning 167.9B tokens
= 16.79% of the original supply, permanently destroyed
② On 9/27: single-day buybacks of $1.14M, vs. $1.46M the day before
③ Platform rules: 50% of revenue is forcibly used to buy and burn tokens—this isn’t just a slogan
What’s even more brutal is the revenue ranking 💰:
Over the past 7 days, Pump.fun revenue was $15.16M
Overtaking Hyperliquid ($15.06M)
#3 on the all-chain application revenue leaderboard—only ahead are Tether and Circle
My take:
🟢 A rare “revenue → buyback → burn” loop. What’s moving isn’t the story—it’s the cashflow
🔴 But it’s still 44% below the all-time high. Quebec regulation issued a warning on 9/27, and BONK.fun is still right there competing for attention
Discipline level:
Hold above $0.00464 (breakout becomes support) counts
If it breaks down → watch for $0.00384 (50-day moving average) 🕯️
Not investment advice—manage your own position 💎🙌
Have you ever bought a coin propped up by buybacks? What happened later 👀
$PUMP #Pumpfun #Meme

1
305
·
--
🪦 The $ALGO crawled out of the grave—up +14.7% in a day
First, look at the data 📊:
Current price $0.1342 (+14.7%)
24h volume $23 million
Intraday 0.1149 → 0.1376, clinging right to the intraday high
It’s not just one coin resurrecting 🧟:
HBAR +36%, QNT +26%, ALGO +14.7%
The biggest mover today—all are “enterprise-grade old-chain”
Why is it this one?
① Google tapped its name in the post-quantum protocol
② Robinhood listed it in the US, opening the retail channel
My take:
🟢 The elasticity of old coins is in—clean order flow, no fresh-coin supply to unload; when they run, they actually move more easily
🔴 But the volume is only $23 million—among the sector names it’s the “lightest,” so it also falls fastest
Discipline level:
Want to board → wait for a pullback near 0.12
Break below 0.1149 (today’s low) → then just pretend I didn’t say it 🕯️
Not investment advice—manage your own position 💎🙌
Which old coin is still lying in your wallet? Dig it up in the comments 👀
$ALGO #Algorand #old-coin-revival
🪦 The $ALGO crawled out of the grave—up +14.7% in a day
First, look at the data 📊:
Current price $0.1342 (+14.7%)
24h volume $23 million
Intraday 0.1149 → 0.1376, clinging right to the intraday high
It’s not just one coin resurrecting 🧟:
HBAR +36%, QNT +26%, ALGO +14.7%
The biggest mover today—all are “enterprise-grade old-chain”
Why is it this one?
① Google tapped its name in the post-quantum protocol
② Robinhood listed it in the US, opening the retail channel
My take:
🟢 The elasticity of old coins is in—clean order flow, no fresh-coin supply to unload; when they run, they actually move more easily
🔴 But the volume is only $23 million—among the sector names it’s the “lightest,” so it also falls fastest
Discipline level:
Want to board → wait for a pullback near 0.12
Break below 0.1149 (today’s low) → then just pretend I didn’t say it 🕯️
Not investment advice—manage your own position 💎🙌
Which old coin is still lying in your wallet? Dig it up in the comments 👀
$ALGO #Algorand #old-coin-revival
First, look at the data 📊:
Current price $0.1342 (+14.7%)
24h volume $23 million
Intraday 0.1149 → 0.1376, clinging right to the intraday high
It’s not just one coin resurrecting 🧟:
HBAR +36%, QNT +26%, ALGO +14.7%
The biggest mover today—all are “enterprise-grade old-chain”
Why is it this one?
① Google tapped its name in the post-quantum protocol
② Robinhood listed it in the US, opening the retail channel
My take:
🟢 The elasticity of old coins is in—clean order flow, no fresh-coin supply to unload; when they run, they actually move more easily
🔴 But the volume is only $23 million—among the sector names it’s the “lightest,” so it also falls fastest
Discipline level:
Want to board → wait for a pullback near 0.12
Break below 0.1149 (today’s low) → then just pretend I didn’t say it 🕯️
Not investment advice—manage your own position 💎🙌
Which old coin is still lying in your wallet? Dig it up in the comments 👀
$ALGO #Algorand #old-coin-revival

113
·
--
🔻 Doubling in a month, giving back 18% in four days: was this good hand of $UNI played to ruin?
First, the data 📊:
Current price $8.92 (-7.7%)
Down 18% from the 9/23 high of $10.94
24h volume $110M
It was only $4.27 a month ago, then ran to $10.94 (+112%)
Now it has given back almost one-fifth of it all
Why did it drop?
① The good news is already out: CME futures announced on 9/22 (listing on 10/19), SEC buyback FAQ, fee switch fully on
② Too crowded on the long side: before the announcement, perpetual open interest was $1.83B, with longs across 87 markets
③ Historical curse: ADA and LINK each fell 35-38% between the CME announcement and listing
My take:
🟢 The fundamentals really aren’t bad — 140M transactions processed in August (more than both Cboe BZX and NYSE American), v4 already has 500+ custom hooks, and the fee switch means real buybacks with real cash
🔴 But $9.04 has already broken; the next support is $8.68 (the low on the day CME was announced)
Trade discipline:
Trying to catch the rebound → wait until $8.68 holds
If $8.68 breaks → don’t try to catch a falling knife, next look at the round-number support at $8 🕯️
Not financial advice, manage your own position 💎🙌
Were you chasing above $10, or did you load up at $4? Drop your cost basis in the comments 👀
$UNI #Uniswap #DeFi
🔻 Doubling in a month, giving back 18% in four days: was this good hand of $UNI played to ruin?
First, the data 📊:
Current price $8.92 (-7.7%)
Down 18% from the 9/23 high of $10.94
24h volume $110M
It was only $4.27 a month ago, then ran to $10.94 (+112%)
Now it has given back almost one-fifth of it all
Why did it drop?
① The good news is already out: CME futures announced on 9/22 (listing on 10/19), SEC buyback FAQ, fee switch fully on
② Too crowded on the long side: before the announcement, perpetual open interest was $1.83B, with longs across 87 markets
③ Historical curse: ADA and LINK each fell 35-38% between the CME announcement and listing
My take:
🟢 The fundamentals really aren’t bad — 140M transactions processed in August (more than both Cboe BZX and NYSE American), v4 already has 500+ custom hooks, and the fee switch means real buybacks with real cash
🔴 But $9.04 has already broken; the next support is $8.68 (the low on the day CME was announced)
Trade discipline:
Trying to catch the rebound → wait until $8.68 holds
If $8.68 breaks → don’t try to catch a falling knife, next look at the round-number support at $8 🕯️
Not financial advice, manage your own position 💎🙌
Were you chasing above $10, or did you load up at $4? Drop your cost basis in the comments 👀
$UNI #Uniswap #DeFi
First, the data 📊:
Current price $8.92 (-7.7%)
Down 18% from the 9/23 high of $10.94
24h volume $110M
It was only $4.27 a month ago, then ran to $10.94 (+112%)
Now it has given back almost one-fifth of it all
Why did it drop?
① The good news is already out: CME futures announced on 9/22 (listing on 10/19), SEC buyback FAQ, fee switch fully on
② Too crowded on the long side: before the announcement, perpetual open interest was $1.83B, with longs across 87 markets
③ Historical curse: ADA and LINK each fell 35-38% between the CME announcement and listing
My take:
🟢 The fundamentals really aren’t bad — 140M transactions processed in August (more than both Cboe BZX and NYSE American), v4 already has 500+ custom hooks, and the fee switch means real buybacks with real cash
🔴 But $9.04 has already broken; the next support is $8.68 (the low on the day CME was announced)
Trade discipline:
Trying to catch the rebound → wait until $8.68 holds
If $8.68 breaks → don’t try to catch a falling knife, next look at the round-number support at $8 🕯️
Not financial advice, manage your own position 💎🙌
Were you chasing above $10, or did you load up at $4? Drop your cost basis in the comments 👀
$UNI #Uniswap #DeFi

1.2k
·
--
🔥 Today Single-Coin Watch: $LINK quietly +7.5% — this time the logic is different
Why is it this one?
🧠 The SEC has just approved token buybacks — while LINK already has a “buy-only, never-sell” machine
Chainlink Reserve: 5.96 million LINK (≈ $70.5 million)
Since going live in August 2025, not a single token has been sold
On the data side 📊:
Current price $15.17 (+7.5%)
24h trading volume $90 million
Intraday 13.48 → 15.19, right near the intraday high
Three more sparks:
① In one hour, 13.99 → 14.79; short positions got liquidated for $350k, while long positions were almost never liquidated (pure short squeezing)
② A massive whale accumulated 2.5 million tokens over 10 days
③ CCIP 2.0 + Circle Arc mainnet + Aave V4 — all using their oracle
My take:
🟢 Buybacks + demand + breakout happening in the same week — three things aligning is not a coincidence
🔴 It’s up 20%+ in a week already; even if the good news lands, it could still turn into a “sell the fact” move
Discipline level:
Want to get on board → wait for a pullback around 14
Break below 13.48 (today’s low) → then act like I never said it 🕯️
Not financial advice — manage your own positions 💎🙌
Do you hold LINK? Drop your cost in the comments 👀
$LINK #Chainlink #山寨季
🔥 Today Single-Coin Watch: $LINK quietly +7.5% — this time the logic is different
Why is it this one?
🧠 The SEC has just approved token buybacks — while LINK already has a “buy-only, never-sell” machine
Chainlink Reserve: 5.96 million LINK (≈ $70.5 million)
Since going live in August 2025, not a single token has been sold
On the data side 📊:
Current price $15.17 (+7.5%)
24h trading volume $90 million
Intraday 13.48 → 15.19, right near the intraday high
Three more sparks:
① In one hour, 13.99 → 14.79; short positions got liquidated for $350k, while long positions were almost never liquidated (pure short squeezing)
② A massive whale accumulated 2.5 million tokens over 10 days
③ CCIP 2.0 + Circle Arc mainnet + Aave V4 — all using their oracle
My take:
🟢 Buybacks + demand + breakout happening in the same week — three things aligning is not a coincidence
🔴 It’s up 20%+ in a week already; even if the good news lands, it could still turn into a “sell the fact” move
Discipline level:
Want to get on board → wait for a pullback around 14
Break below 13.48 (today’s low) → then act like I never said it 🕯️
Not financial advice — manage your own positions 💎🙌
Do you hold LINK? Drop your cost in the comments 👀
$LINK #Chainlink #山寨季
Why is it this one?
🧠 The SEC has just approved token buybacks — while LINK already has a “buy-only, never-sell” machine
Chainlink Reserve: 5.96 million LINK (≈ $70.5 million)
Since going live in August 2025, not a single token has been sold
On the data side 📊:
Current price $15.17 (+7.5%)
24h trading volume $90 million
Intraday 13.48 → 15.19, right near the intraday high
Three more sparks:
① In one hour, 13.99 → 14.79; short positions got liquidated for $350k, while long positions were almost never liquidated (pure short squeezing)
② A massive whale accumulated 2.5 million tokens over 10 days
③ CCIP 2.0 + Circle Arc mainnet + Aave V4 — all using their oracle
My take:
🟢 Buybacks + demand + breakout happening in the same week — three things aligning is not a coincidence
🔴 It’s up 20%+ in a week already; even if the good news lands, it could still turn into a “sell the fact” move
Discipline level:
Want to get on board → wait for a pullback around 14
Break below 13.48 (today’s low) → then act like I never said it 🕯️
Not financial advice — manage your own positions 💎🙌
Do you hold LINK? Drop your cost in the comments 👀
$LINK #Chainlink #山寨季

492
·
--
😱 In one night, billions wiped out: $330 million, BTC falls below 83K—who’s dumping?
3 data points to understand tonight:
① Total liquidations hit $330 million; longs held on to $230 million 🕯️
② The US 10-year Treasury yield breaks above 5%
③ But Bitcoin ETFs saw net inflows of $2.4 billion last week—the strongest in the past year
Translation in plain terms 🧠:
It’s not that nobody’s buying—macros are just too scary: Trump rejected the proposal to reopen the Strait of Hormuz → oil prices surged to $93 → the probability of a rate hike in October jumped to 68%
My take:
🟢 $80K is the life-or-death line between bulls and bears—stay there and don’t short
🔴 Before reclaiming $84,800, any rebound is just fooling around
Not investment advice—manage your own position 💎🙌
If you get buried tonight, hit like—count how many fellow brothers are in trouble 🍿
$BTC #比特币 #币安广场
😱 In one night, billions wiped out: $330 million, BTC falls below 83K—who’s dumping?
3 data points to understand tonight:
① Total liquidations hit $330 million; longs held on to $230 million 🕯️
② The US 10-year Treasury yield breaks above 5%
③ But Bitcoin ETFs saw net inflows of $2.4 billion last week—the strongest in the past year
Translation in plain terms 🧠:
It’s not that nobody’s buying—macros are just too scary: Trump rejected the proposal to reopen the Strait of Hormuz → oil prices surged to $93 → the probability of a rate hike in October jumped to 68%
My take:
🟢 $80K is the life-or-death line between bulls and bears—stay there and don’t short
🔴 Before reclaiming $84,800, any rebound is just fooling around
Not investment advice—manage your own position 💎🙌
If you get buried tonight, hit like—count how many fellow brothers are in trouble 🍿
$BTC #比特币 #币安广场
3 data points to understand tonight:
① Total liquidations hit $330 million; longs held on to $230 million 🕯️
② The US 10-year Treasury yield breaks above 5%
③ But Bitcoin ETFs saw net inflows of $2.4 billion last week—the strongest in the past year
Translation in plain terms 🧠:
It’s not that nobody’s buying—macros are just too scary: Trump rejected the proposal to reopen the Strait of Hormuz → oil prices surged to $93 → the probability of a rate hike in October jumped to 68%
My take:
🟢 $80K is the life-or-death line between bulls and bears—stay there and don’t short
🔴 Before reclaiming $84,800, any rebound is just fooling around
Not investment advice—manage your own position 💎🙌
If you get buried tonight, hit like—count how many fellow brothers are in trouble 🍿
$BTC #比特币 #币安广场

57
·
--
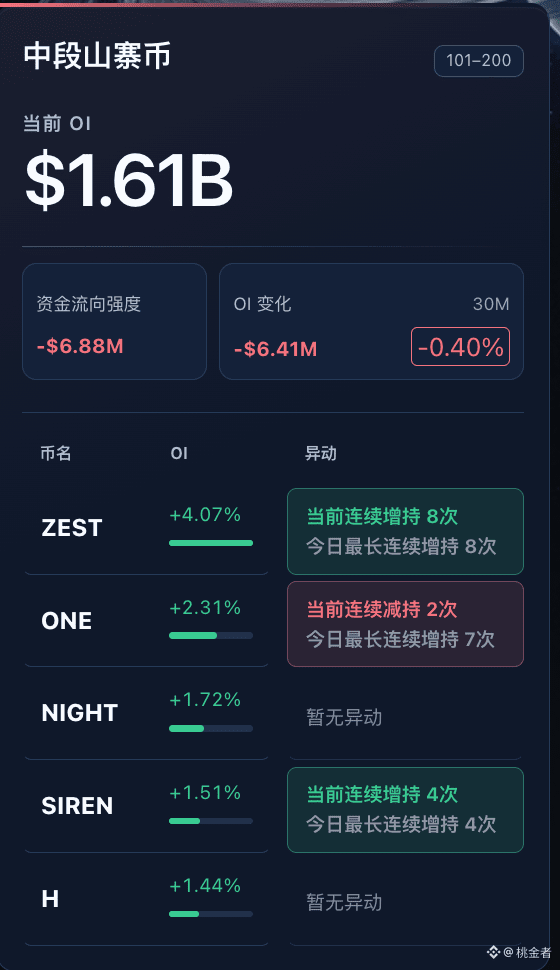
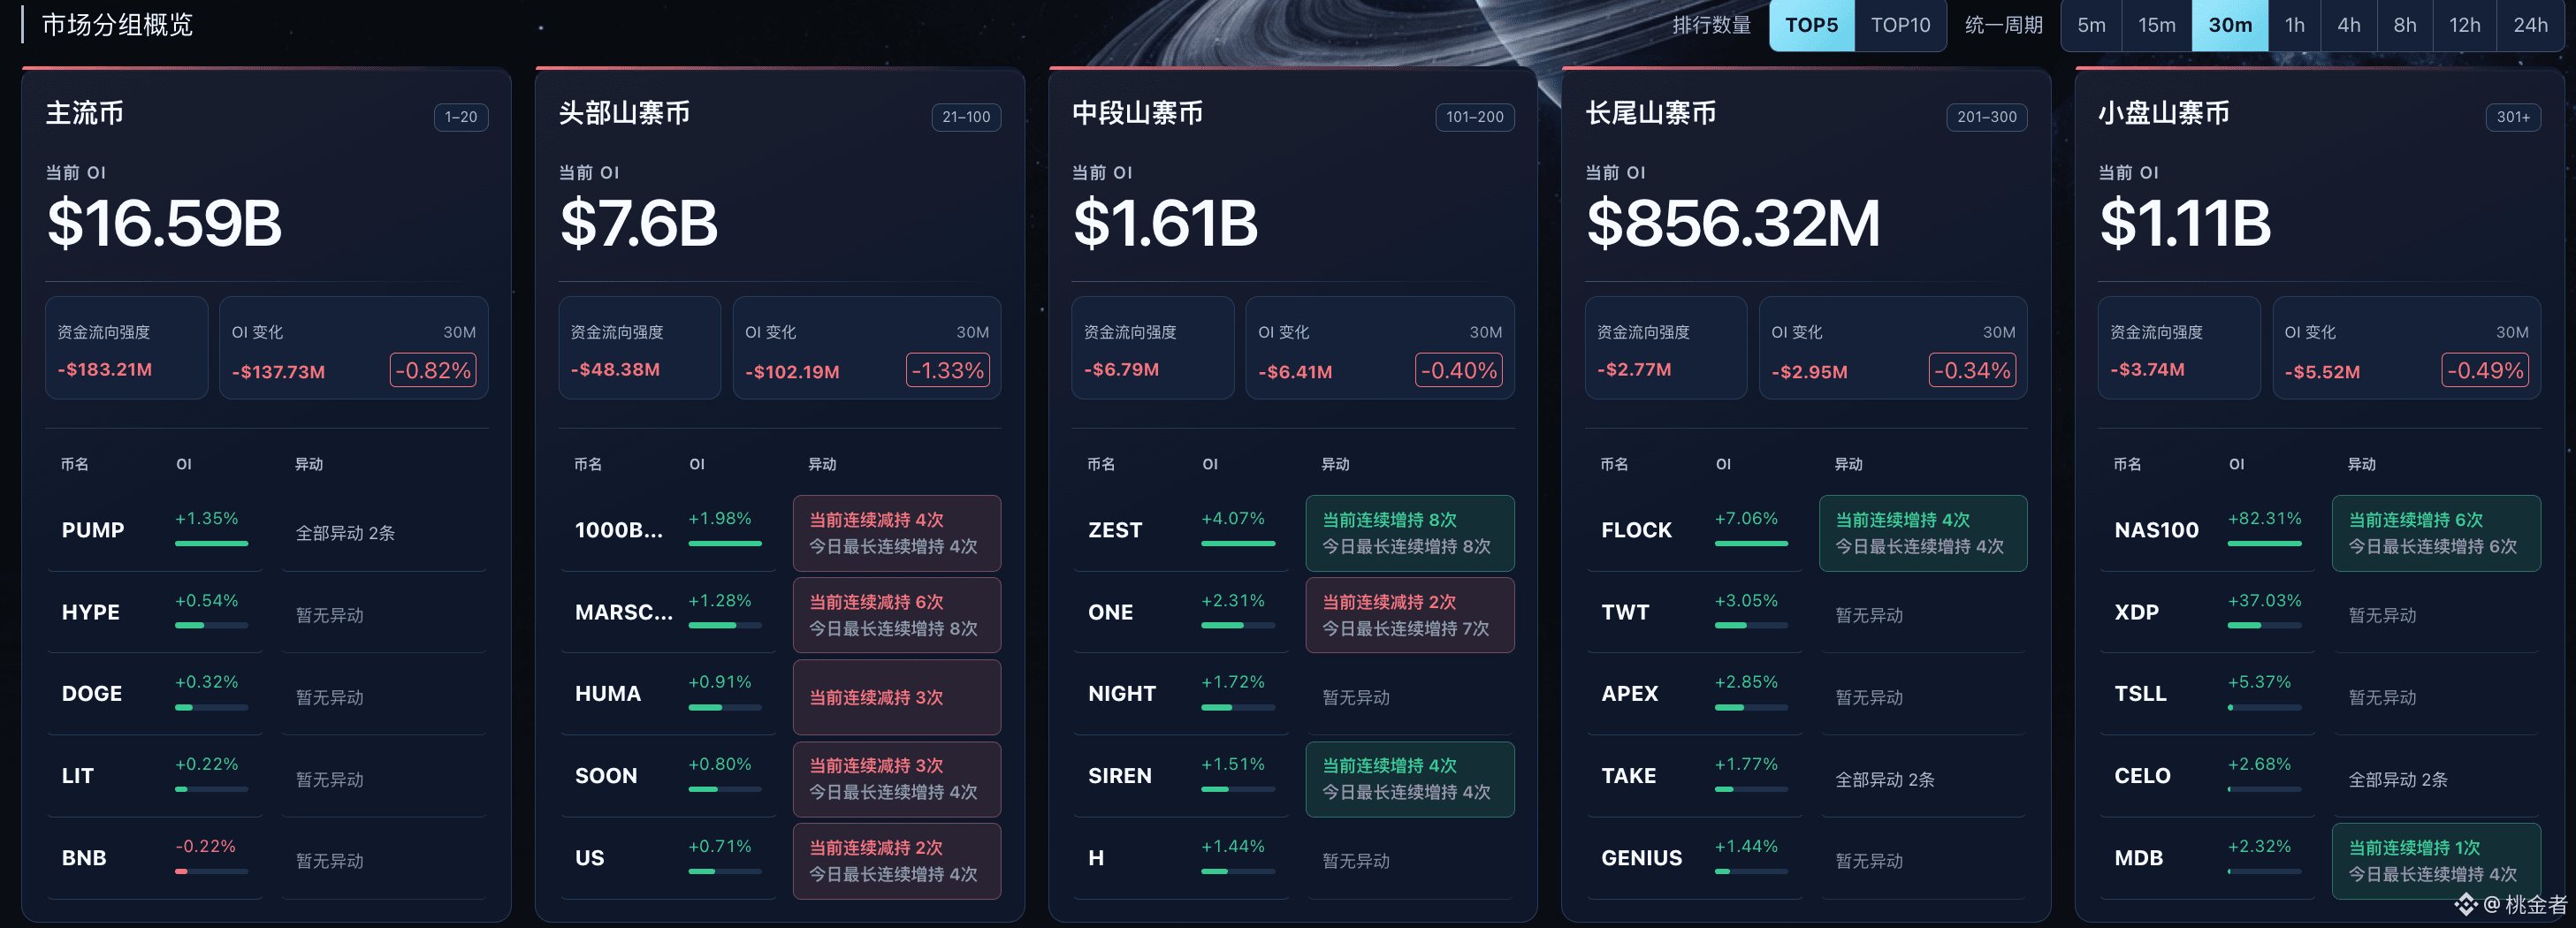
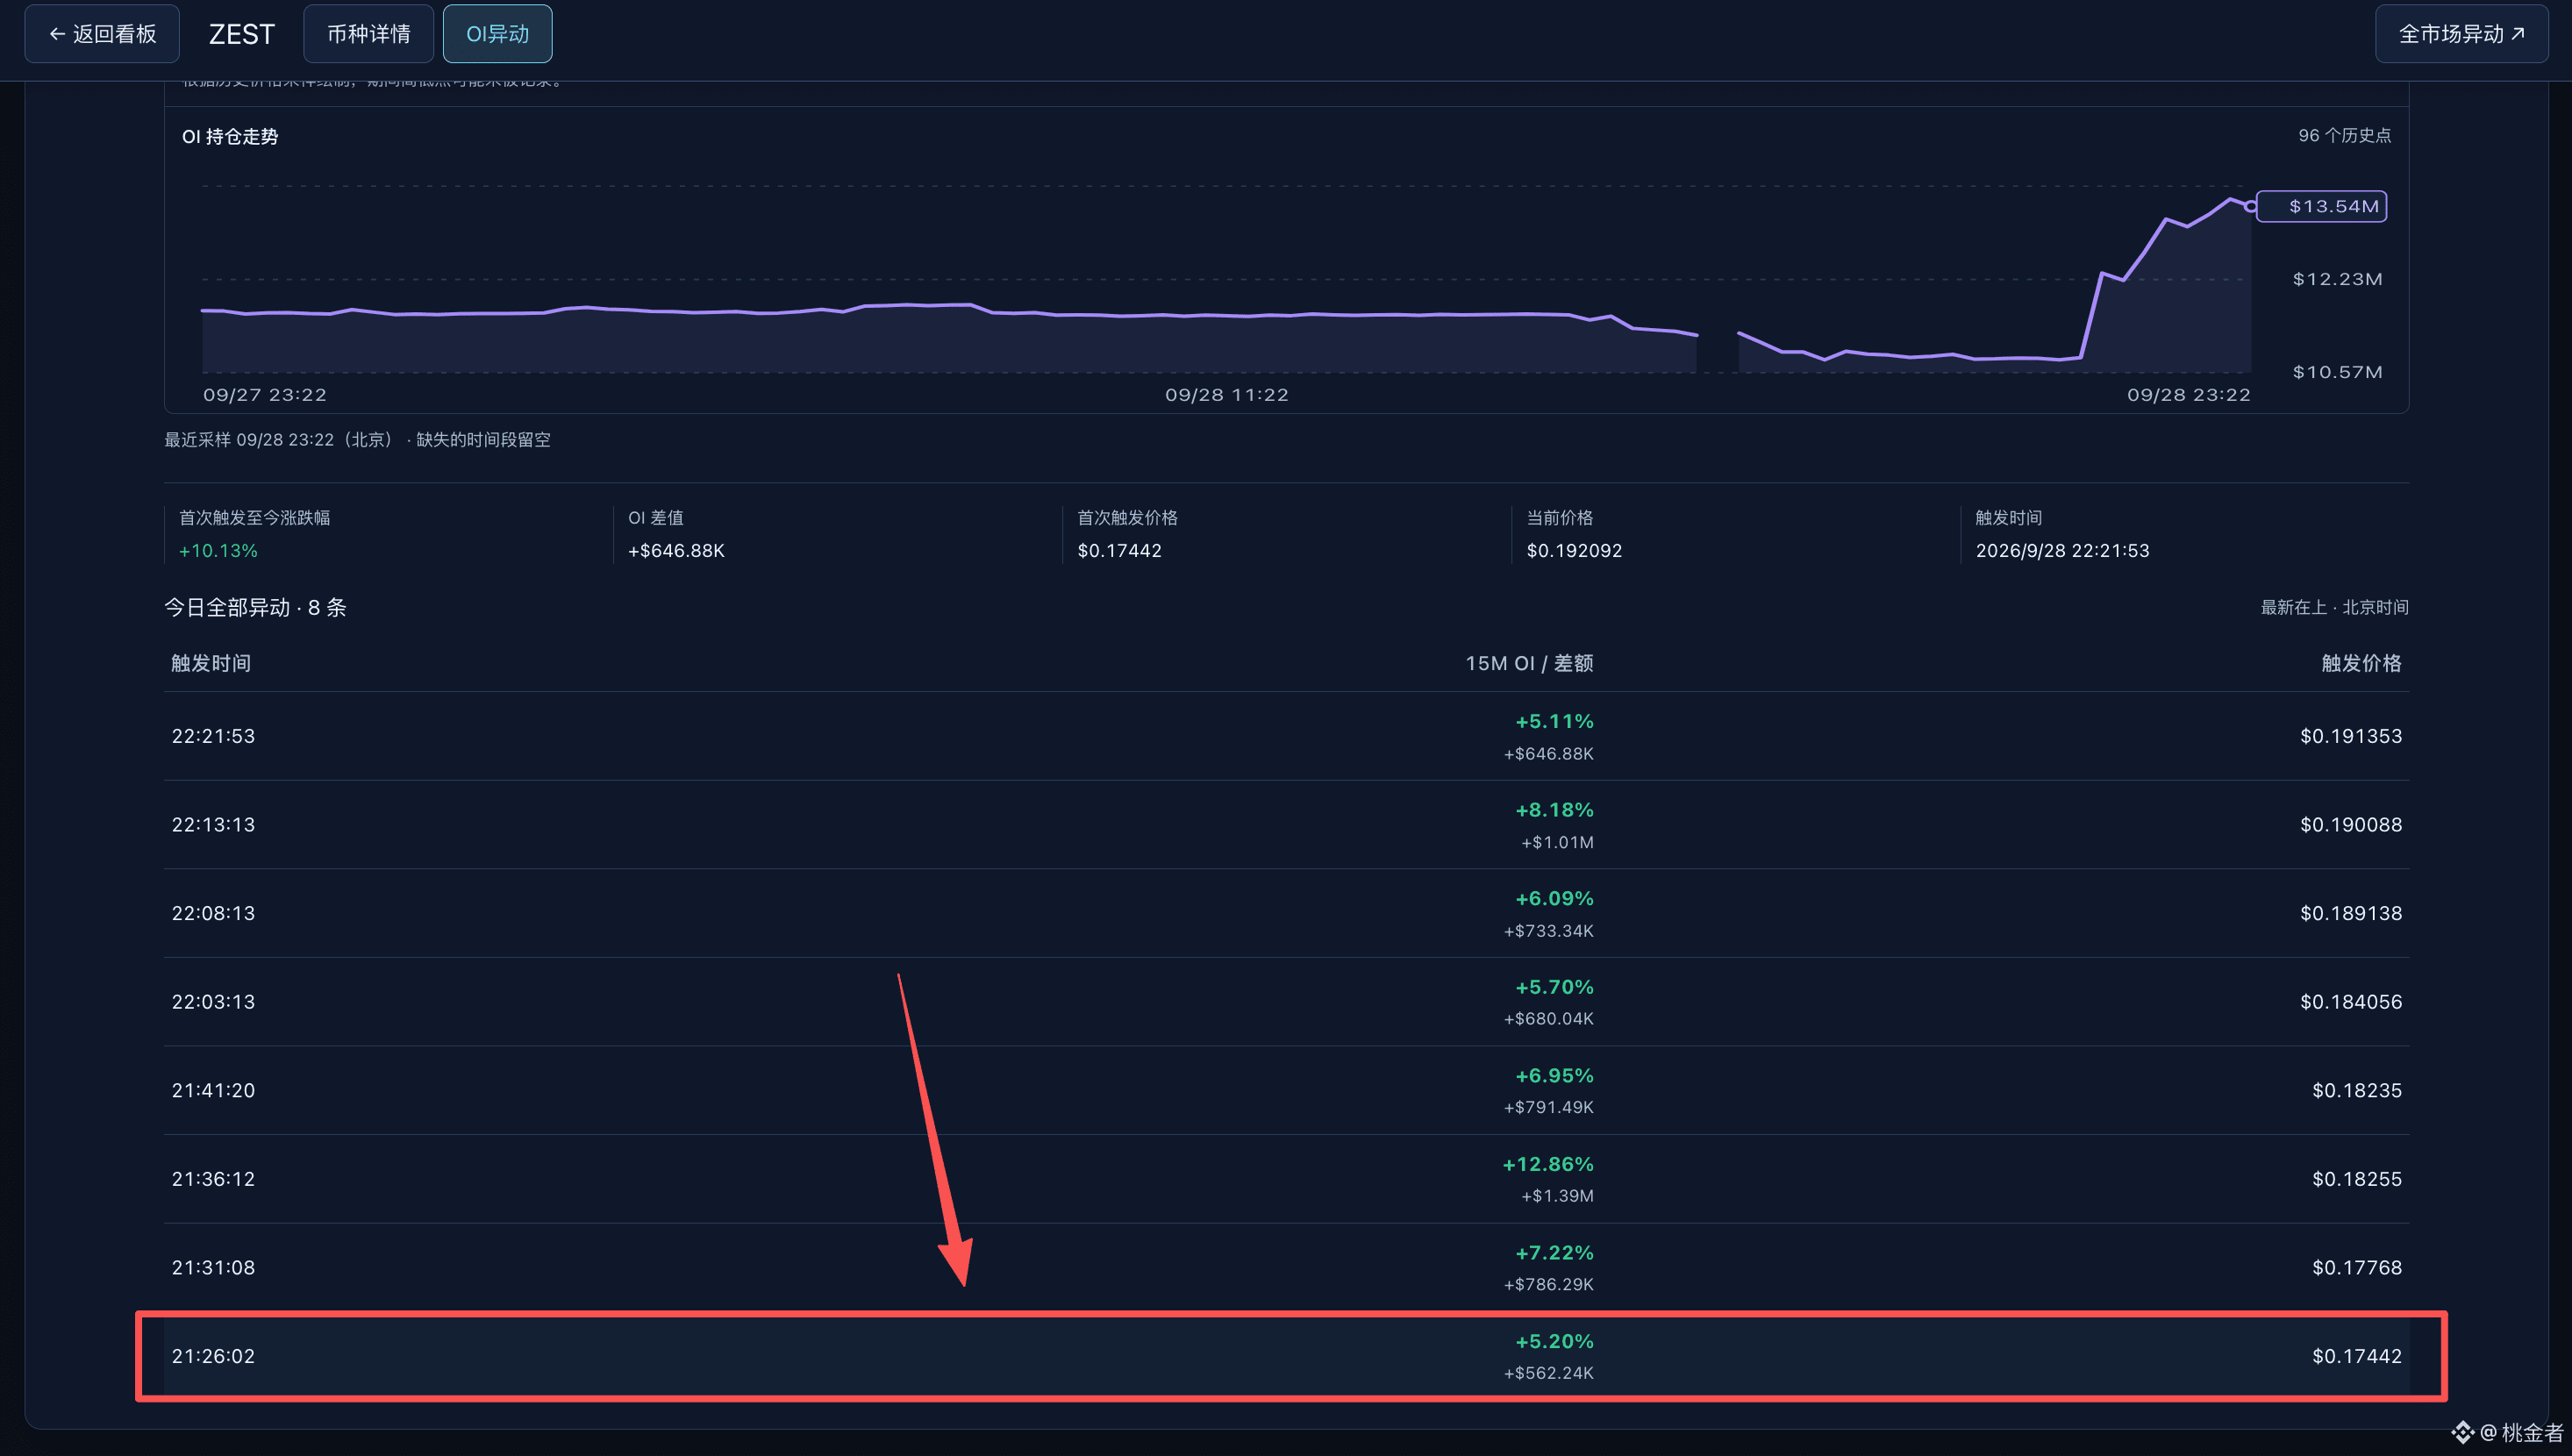
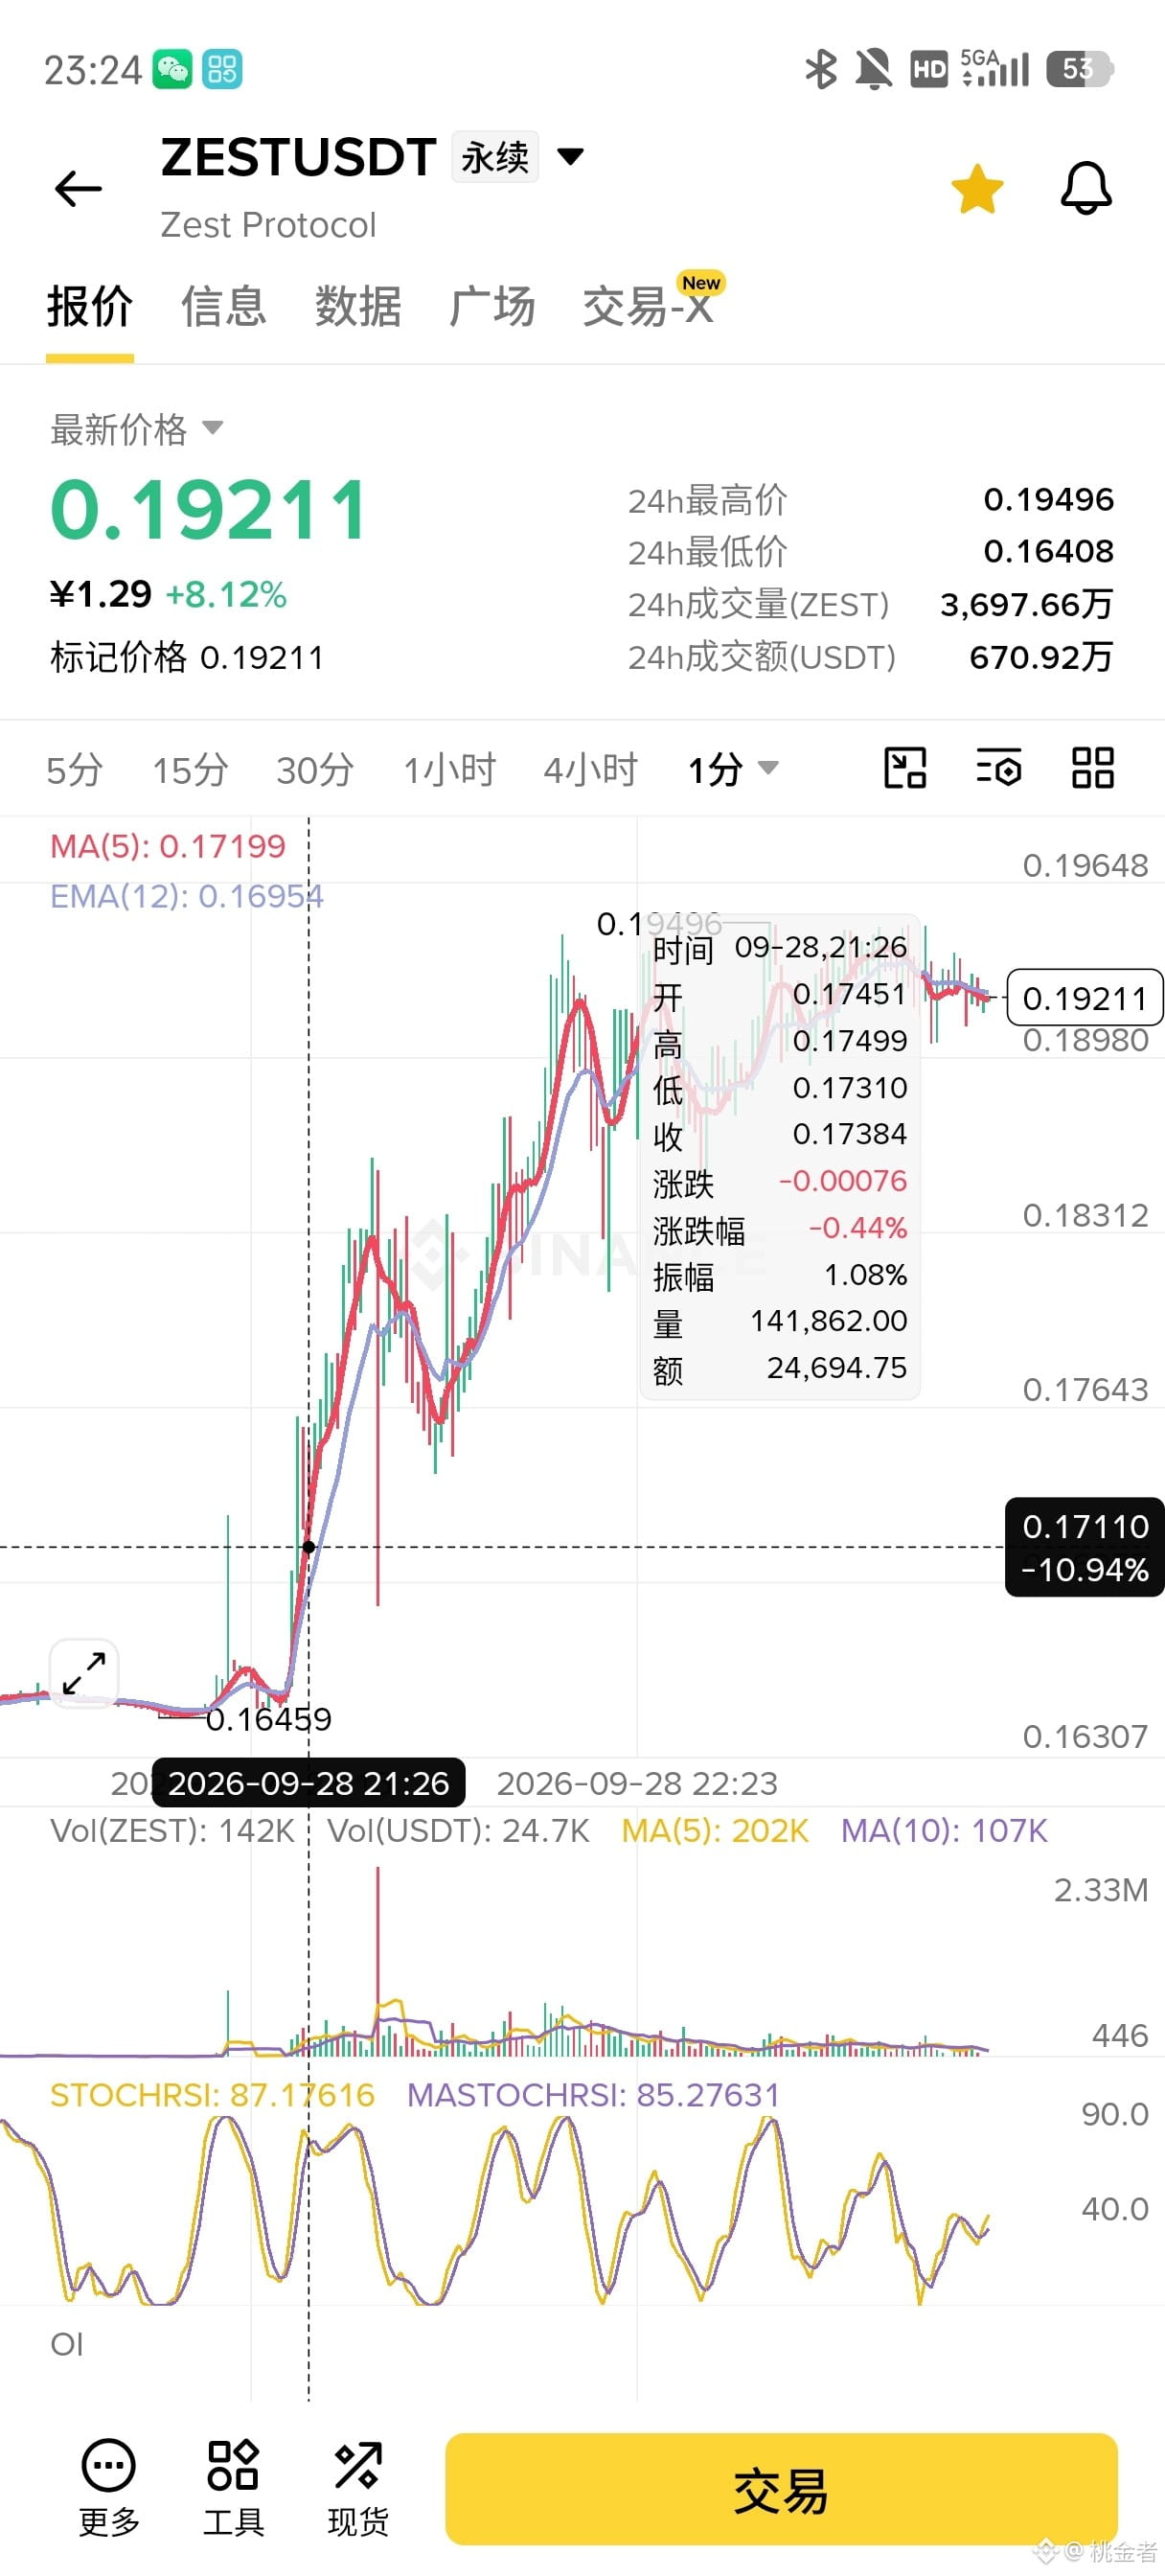
Family, today I also caught zest by watching the chart. The alerts have been going off nonstop. I know this is the God of Wealth knocking on my window—so I went right in. Starting at 9:26:02 PM, the first alert triggered, and then every five minutes it kept triggering, for a total of eight alerts. During that time, there were also chances to get on board. What else is there to say? Let’s charge! We also got 17 and hit 19—that’s just so satisfying. The human brain is indeed smart; watching the chart can improve efficiency. We’re not dumb, either. Why would we hold onto rocks and cut losses? That would basically make us cavemen.
Family, today I also caught zest by watching the chart. The alerts have been going off nonstop. I know this is the God of Wealth knocking on my window—so I went right in. Starting at 9:26:02 PM, the first alert triggered, and then every five minutes it kept triggering, for a total of eight alerts. During that time, there were also chances to get on board. What else is there to say? Let’s charge! We also got 17 and hit 19—that’s just so satisfying. The human brain is indeed smart; watching the chart can improve efficiency. We’re not dumb, either. Why would we hold onto rocks and cut losses? That would basically make us cavemen.
3
924
·
--
😱 In one night, wiped out $330 million — BTC breaks below 83K. Who’s dumping?
Three data points to understand tonight:
① Across the whole network, liquidations total $330 million; longs absorbed $230 million 🕯️ ② US 10-year Treasury yields rise above 5% ③ But Bitcoin ETFs saw net inflows of $2.4 billion last week—the strongest in the past year
Translate this 🧠: It’s not that nobody’s buying—it's that macro is too scary. Trump rejected a proposal to reopen the Strait of Hormuz → oil jumps to $93 → the odds of a rate hike in October surge to 68%
My take: 🟢 $80K is the life-or-death line for bulls and bears. Hold it—don’t short 🔴 Before reclaiming $84,800, any bounce is just messing around
Not investment advice—manage your own position 💎🙌
If you get buried tonight, take away 1. See how many fellow “hard brothers” 🍿
#比特币 #加密货币 #币安广场
😱 In one night, wiped out $330 million — BTC breaks below 83K. Who’s dumping?
Three data points to understand tonight:
① Across the whole network, liquidations total $330 million; longs absorbed $230 million 🕯️ ② US 10-year Treasury yields rise above 5% ③ But Bitcoin ETFs saw net inflows of $2.4 billion last week—the strongest in the past year
Translate this 🧠: It’s not that nobody’s buying—it's that macro is too scary. Trump rejected a proposal to reopen the Strait of Hormuz → oil jumps to $93 → the odds of a rate hike in October surge to 68%
My take: 🟢 $80K is the life-or-death line for bulls and bears. Hold it—don’t short 🔴 Before reclaiming $84,800, any bounce is just messing around
Not investment advice—manage your own position 💎🙌
If you get buried tonight, take away 1. See how many fellow “hard brothers” 🍿
#比特币 #加密货币 #币安广场
Three data points to understand tonight:
① Across the whole network, liquidations total $330 million; longs absorbed $230 million 🕯️ ② US 10-year Treasury yields rise above 5% ③ But Bitcoin ETFs saw net inflows of $2.4 billion last week—the strongest in the past year
Translate this 🧠: It’s not that nobody’s buying—it's that macro is too scary. Trump rejected a proposal to reopen the Strait of Hormuz → oil jumps to $93 → the odds of a rate hike in October surge to 68%
My take: 🟢 $80K is the life-or-death line for bulls and bears. Hold it—don’t short 🔴 Before reclaiming $84,800, any bounce is just messing around
Not investment advice—manage your own position 💎🙌
If you get buried tonight, take away 1. See how many fellow “hard brothers” 🍿
#比特币 #加密货币 #币安广场
385
·
--
$BNB [Risk Level]: Medium to high. The price is approaching a strong resistance zone at this year's high, and volatility may increase sharply. The risk of chasing higher is greater than the opportunity.
[Strategy Suggestion]:
Potential entry range (long): $865 - $873. This range is the lower edge of the recent consolidation platform and the support area of the long lower shadow on January 2nd. After stabilizing, it can be seen as a second entry point. A more conservative entry requires waiting for a breakout above the previous high resistance of $888-$890 with increased volume.
Stop-loss level: below $855 (effective break of the consolidation platform).
Target level: First target $890-$900 (previous high and psychological barrier); if a strong breakout occurs, the second target can be seen in the $920-$930 area.
Operational Notes: It is currently not advisable to chase higher. Prioritize waiting for a stabilization signal in the support range (such as the appearance of a pin bar or bullish engulfing in lower time frame candles), or confirmation of a retest after a breakout above the previous high with increased volume. Position management needs to be more cautious. $BNB
{future}(BNBUSDT)
$BNB [Risk Level]: Medium to high. The price is approaching a strong resistance zone at this year's high, and volatility may increase sharply. The risk of chasing higher is greater than the opportunity.
[Strategy Suggestion]:
Potential entry range (long): $865 - $873. This range is the lower edge of the recent consolidation platform and the support area of the long lower shadow on January 2nd. After stabilizing, it can be seen as a second entry point. A more conservative entry requires waiting for a breakout above the previous high resistance of $888-$890 with increased volume.
Stop-loss level: below $855 (effective break of the consolidation platform).
Target level: First target $890-$900 (previous high and psychological barrier); if a strong breakout occurs, the second target can be seen in the $920-$930 area.
Operational Notes: It is currently not advisable to chase higher. Prioritize waiting for a stabilization signal in the support range (such as the appearance of a pin bar or bullish engulfing in lower time frame candles), or confirmation of a retest after a breakout above the previous high with increased volume. Position management needs to be more cautious. $BNB
[Strategy Suggestion]:
Potential entry range (long): $865 - $873. This range is the lower edge of the recent consolidation platform and the support area of the long lower shadow on January 2nd. After stabilizing, it can be seen as a second entry point. A more conservative entry requires waiting for a breakout above the previous high resistance of $888-$890 with increased volume.
Stop-loss level: below $855 (effective break of the consolidation platform).
Target level: First target $890-$900 (previous high and psychological barrier); if a strong breakout occurs, the second target can be seen in the $920-$930 area.
Operational Notes: It is currently not advisable to chase higher. Prioritize waiting for a stabilization signal in the support range (such as the appearance of a pin bar or bullish engulfing in lower time frame candles), or confirmation of a retest after a breakout above the previous high with increased volume. Position management needs to be more cautious. $BNB
1
196
·
--
$SOL [Risk Level]: Medium to High. Operating at relatively high historical levels, increased volatility, significant risk in chasing highs in the short term. Caution is needed if it breaks key support, which may trigger a long position liquidation.
[Strategy Suggestion]:
Potential Entry Range (Long):
Aggressive: Enter lightly after stabilizing in the range of 132.5 - 133.5 (previous breakout platform and short-term moving average support).
Conservative: Wait for the price to break out with significant volume (notable increase in trading volume) and establish itself above the previous high area of 134.8 - 135.0 before proceeding.
Stop Loss Level:
If going long in the above range, the stop loss should be set below 131.5 (below the lower edge of the hourly chart's consolidation platform).
Target Level:
First Target: 138.0 - 140.0 (1.382 Fibonacci extension of the previous upward wave and psychological level).
Second Target: 145.0 (1.618 Fibonacci extension).
Key Observation Point: If the price breaks below 131.0 with significant volume, the short-term bullish structure is damaged, and one should consider exiting and adopting a wait-and-see approach.$SOL
{future}(SOLUSDT)
$SOL [Risk Level]: Medium to High. Operating at relatively high historical levels, increased volatility, significant risk in chasing highs in the short term. Caution is needed if it breaks key support, which may trigger a long position liquidation.
[Strategy Suggestion]:
Potential Entry Range (Long):
Aggressive: Enter lightly after stabilizing in the range of 132.5 - 133.5 (previous breakout platform and short-term moving average support).
Conservative: Wait for the price to break out with significant volume (notable increase in trading volume) and establish itself above the previous high area of 134.8 - 135.0 before proceeding.
Stop Loss Level:
If going long in the above range, the stop loss should be set below 131.5 (below the lower edge of the hourly chart's consolidation platform).
Target Level:
First Target: 138.0 - 140.0 (1.382 Fibonacci extension of the previous upward wave and psychological level).
Second Target: 145.0 (1.618 Fibonacci extension).
Key Observation Point: If the price breaks below 131.0 with significant volume, the short-term bullish structure is damaged, and one should consider exiting and adopting a wait-and-see approach.$SOL
[Strategy Suggestion]:
Potential Entry Range (Long):
Aggressive: Enter lightly after stabilizing in the range of 132.5 - 133.5 (previous breakout platform and short-term moving average support).
Conservative: Wait for the price to break out with significant volume (notable increase in trading volume) and establish itself above the previous high area of 134.8 - 135.0 before proceeding.
Stop Loss Level:
If going long in the above range, the stop loss should be set below 131.5 (below the lower edge of the hourly chart's consolidation platform).
Target Level:
First Target: 138.0 - 140.0 (1.382 Fibonacci extension of the previous upward wave and psychological level).
Second Target: 145.0 (1.618 Fibonacci extension).
Key Observation Point: If the price breaks below 131.0 with significant volume, the short-term bullish structure is damaged, and one should consider exiting and adopting a wait-and-see approach.$SOL
583
·
--
$ETH [Risk Level]: Medium (The trend has not changed, but it has moved away from the optimal low-cost entry area. The support below is clear, but if it breaks the key support, the adjustment range may increase).
[Strategy Suggestion]:
Potential Entry Range:
Aggressive Long Position: When the price pulls back and stabilizes in the $3100-$3120 support area, consider a light position.
Conservative Long Position: Wait for the price to increase in volume (single-hour trading volume > 150,000) and effectively break and stabilize above $3160 to enter, or wait for a pullback to stronger support at $3070-$3090 (the upper edge of the previous breakout platform and concentrated trading area) to stabilize before entering.
Stop Loss Level: It is recommended to set the stop loss for long positions below $3060 (breaking this level may indicate a destruction of the short-term upward structure).
Target Level:
Short-term Target: $3200 - $3250 (psychological barrier and previous high extension area).
Medium-term Target: If it breaks $3250, it can look towards $3350 - $3450.
Risk Warning: Pay close attention to changes in open interest. If the price stagnates or declines, and open interest begins to show a downward trend, this is a signal for the main force to exit, and timely adjustments to long strategies are necessary. At the same time, it is necessary to guard against systemic risks in the overall cryptocurrency market. $ETH
{future}(ETHUSDT)
$ETH [Risk Level]: Medium (The trend has not changed, but it has moved away from the optimal low-cost entry area. The support below is clear, but if it breaks the key support, the adjustment range may increase).
[Strategy Suggestion]:
Potential Entry Range:
Aggressive Long Position: When the price pulls back and stabilizes in the $3100-$3120 support area, consider a light position.
Conservative Long Position: Wait for the price to increase in volume (single-hour trading volume > 150,000) and effectively break and stabilize above $3160 to enter, or wait for a pullback to stronger support at $3070-$3090 (the upper edge of the previous breakout platform and concentrated trading area) to stabilize before entering.
Stop Loss Level: It is recommended to set the stop loss for long positions below $3060 (breaking this level may indicate a destruction of the short-term upward structure).
Target Level:
Short-term Target: $3200 - $3250 (psychological barrier and previous high extension area).
Medium-term Target: If it breaks $3250, it can look towards $3350 - $3450.
Risk Warning: Pay close attention to changes in open interest. If the price stagnates or declines, and open interest begins to show a downward trend, this is a signal for the main force to exit, and timely adjustments to long strategies are necessary. At the same time, it is necessary to guard against systemic risks in the overall cryptocurrency market. $ETH
[Strategy Suggestion]:
Potential Entry Range:
Aggressive Long Position: When the price pulls back and stabilizes in the $3100-$3120 support area, consider a light position.
Conservative Long Position: Wait for the price to increase in volume (single-hour trading volume > 150,000) and effectively break and stabilize above $3160 to enter, or wait for a pullback to stronger support at $3070-$3090 (the upper edge of the previous breakout platform and concentrated trading area) to stabilize before entering.
Stop Loss Level: It is recommended to set the stop loss for long positions below $3060 (breaking this level may indicate a destruction of the short-term upward structure).
Target Level:
Short-term Target: $3200 - $3250 (psychological barrier and previous high extension area).
Medium-term Target: If it breaks $3250, it can look towards $3350 - $3450.
Risk Warning: Pay close attention to changes in open interest. If the price stagnates or declines, and open interest begins to show a downward trend, this is a signal for the main force to exit, and timely adjustments to long strategies are necessary. At the same time, it is necessary to guard against systemic risks in the overall cryptocurrency market. $ETH
425
Log in to explore more content
Join global crypto users on Binance Square
⚡️ Get latest and useful information about crypto.
💬 Trusted by the world’s largest crypto exchange.
👍 Discover real insights from verified creators.
Email / Phone number
Trending Topics
BitMineETHHoldingsTop6Million
1,737 views
133 Discussing
#bitmineethholdingstop6million
🚨 Institutional Accumulation: Bitmine ETH Holdings Top 6 Million!
The Market Update: On-chain tracking and treasury reports confirm a massive milestone in institutional digital asset accumulation as Bitmine's total Ethereum holdings officially top 6 million ETH (valued at over $6 billion). As corporate and institutional entities aggressively scale their balance sheet exposure to proof-of-stake infrastructure, liquid supply on major exchanges faces sustained downward pressure. 📊
What This Means for Traders:
Massive accumulation by corporate treasuries significantly tightens circulating supply and impacts market depth. Market participants are closely monitoring exchange reserve balances, staking yields, and derivative positioning as large-scale holdings lock up significant portions of circulating supply.
Highlighted Tradeable Coins to Watch:
$ETH (Ethereum): The primary asset under institutional accumulation; tracking validator growth, staking inflows, and supply absorption metrics.
$BTC (Bitcoin): The macro baseline liquidity anchor; observing broader institutional asset allocation trends across major digital stores of value.
$SOL (Solana): High-velocity network benchmark; monitoring alternative layer-1 liquidity rotation and ecosystem volume expansion.
How do you view the impact of multi-million institutional token treasuries on long-term market liquidity and volatility? Let's discuss your strategy in the comments below! 👇
#ETH #InstitutionalCrypto #CryptoTreasury #blockchain
Axiom AlphA
·0 Likes
·1.6k views
StrategyAdds1666BTCHoldingsReach847666
1,088 views
96 Discussing
NvidiaApproves$150BBuyback
2,137 views
54 Discussing