

Leo524
👉Leo524 👈
Trade With Confidence ✔

DOT Holder
High-Frequency Trader
3.5 Years
1 Following
1.5K+ Followers
4.7K+ Liked
Posts
All
Quotes
Videos
PINNED
Leo524
·
--
$BTC Higher Timeframe Update
I started with the 3-Day chart, where the market is still showing a bearish structure. Price continues to make lower highs, and every rally is getting rejected.
Then I zoomed out to the Monthly chart.
Despite the short-term weakness, Bitcoin is still respecting its long-term bullish structure. The monthly trendline has acted as support multiple times in the past, and price is now moving back toward that area once again.
If buyers defend this higher timeframe support, we could see the next major move begin from there.
I started with the 3-Day chart, where the market is still showing a bearish structure. Price continues to make lower highs, and every rally is getting rejected.
Then I zoomed out to the Monthly chart.
Despite the short-term weakness, Bitcoin is still respecting its long-term bullish structure. The monthly trendline has acted as support multiple times in the past, and price is now moving back toward that area once again.
If buyers defend this higher timeframe support, we could see the next major move begin from there.
Leo524
·
--
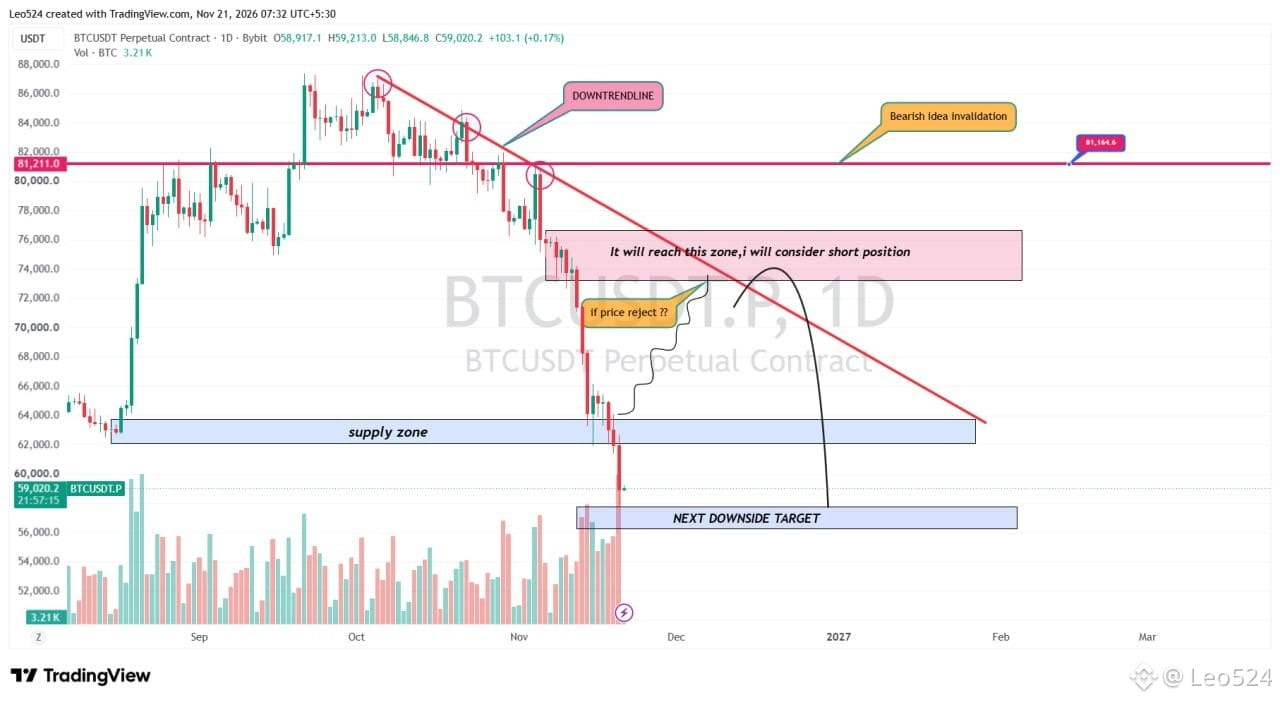
$BTC I'm Not Looking for Longs Here !
BTC is still trading below the major downtrend line, and I'm not interested in opening long positions at the current level. My focus is on a possible relief bounce towards the red supply zone. If price reaches that area and shows a clear rejection, I'll consider opening a short position as a swing trade.
If the rejection plays out, BTC could see another major move down, with $56K–$57K as my next downside target. The bearish idea becomes invalid if BTC breaks above $81.1K. Until then, I'm waiting for the right setup rather than forcing a long entry.
BTC is still trading below the major downtrend line, and I'm not interested in opening long positions at the current level. My focus is on a possible relief bounce towards the red supply zone. If price reaches that area and shows a clear rejection, I'll consider opening a short position as a swing trade.
If the rejection plays out, BTC could see another major move down, with $56K–$57K as my next downside target. The bearish idea becomes invalid if BTC breaks above $81.1K. Until then, I'm waiting for the right setup rather than forcing a long entry.
Leo524
·
--
Bearish$SOL IS BUILDING A BEAR FLAG. ANOTHER LEG DOWN LOADING? 📉
Solana has already experienced a sharp sell-off, with sellers clearly dominating the market. Since then, price has been recovering slowly inside an ascending channel on the 4H chart.
This looks like a classic Bear Flag formation, where the market pauses and retraces before potentially continuing in the direction of the previous trend.
I'm watching the upper side of this structure closely. If price reaches the resistance area and gets rejected, followed by a strong bearish breakdown of the channel, that could be the confirmation I'm waiting for to enter a short position.
My downside target is around $65, with $69.90 being an important level to watch along the way. For now, I'm waiting for price action to confirm the next move. 🔥
Solana has already experienced a sharp sell-off, with sellers clearly dominating the market. Since then, price has been recovering slowly inside an ascending channel on the 4H chart.
This looks like a classic Bear Flag formation, where the market pauses and retraces before potentially continuing in the direction of the previous trend.
I'm watching the upper side of this structure closely. If price reaches the resistance area and gets rejected, followed by a strong bearish breakdown of the channel, that could be the confirmation I'm waiting for to enter a short position.
My downside target is around $65, with $69.90 being an important level to watch along the way. For now, I'm waiting for price action to confirm the next move. 🔥
Leo524
·
--
$HYPE USDT LONG ✅
ENTRY : 63.900 - 62.248 ✅
TARGETS ✅
63.985
64.165
64.340
64.410
64.590
64.785
65.129
65.562
65.761
65.895
66.113
66.690
67.164
67.964
68.515
68.722
69.066
69.617
70.168
70.719
71.821
72.265
STOP LOSS : 60.520 ✅
USE LOW FUNDS !
$HYPE
ENTRY : 63.900 - 62.248 ✅
TARGETS ✅
63.985
64.165
64.340
64.410
64.590
64.785
65.129
65.562
65.761
65.895
66.113
66.690
67.164
67.964
68.515
68.722
69.066
69.617
70.168
70.719
71.821
72.265
STOP LOSS : 60.520 ✅
USE LOW FUNDS !
$HYPE
Leo524
·
--
Bearish$SOL IS BUILDING A BEAR FLAG. ANOTHER LEG DOWN LOADING? 📉
Solana has already experienced a sharp sell-off, with sellers clearly dominating the market. Since then, price has been recovering slowly inside an ascending channel on the 4H chart.
This looks like a classic Bear Flag formation, where the market pauses and retraces before potentially continuing in the direction of the previous trend.
I'm watching the upper side of this structure closely. If price reaches the resistance area and gets rejected, followed by a strong bearish breakdown of the channel, that could be the confirmation I'm waiting for to enter a short position.
My downside target is around $65, with $69.90 being an important level to watch along the way. For now, I'm waiting for price action to confirm the next move. 🔥
Solana has already experienced a sharp sell-off, with sellers clearly dominating the market. Since then, price has been recovering slowly inside an ascending channel on the 4H chart.
This looks like a classic Bear Flag formation, where the market pauses and retraces before potentially continuing in the direction of the previous trend.
I'm watching the upper side of this structure closely. If price reaches the resistance area and gets rejected, followed by a strong bearish breakdown of the channel, that could be the confirmation I'm waiting for to enter a short position.
My downside target is around $65, with $69.90 being an important level to watch along the way. For now, I'm waiting for price action to confirm the next move. 🔥
Leo524
·
--
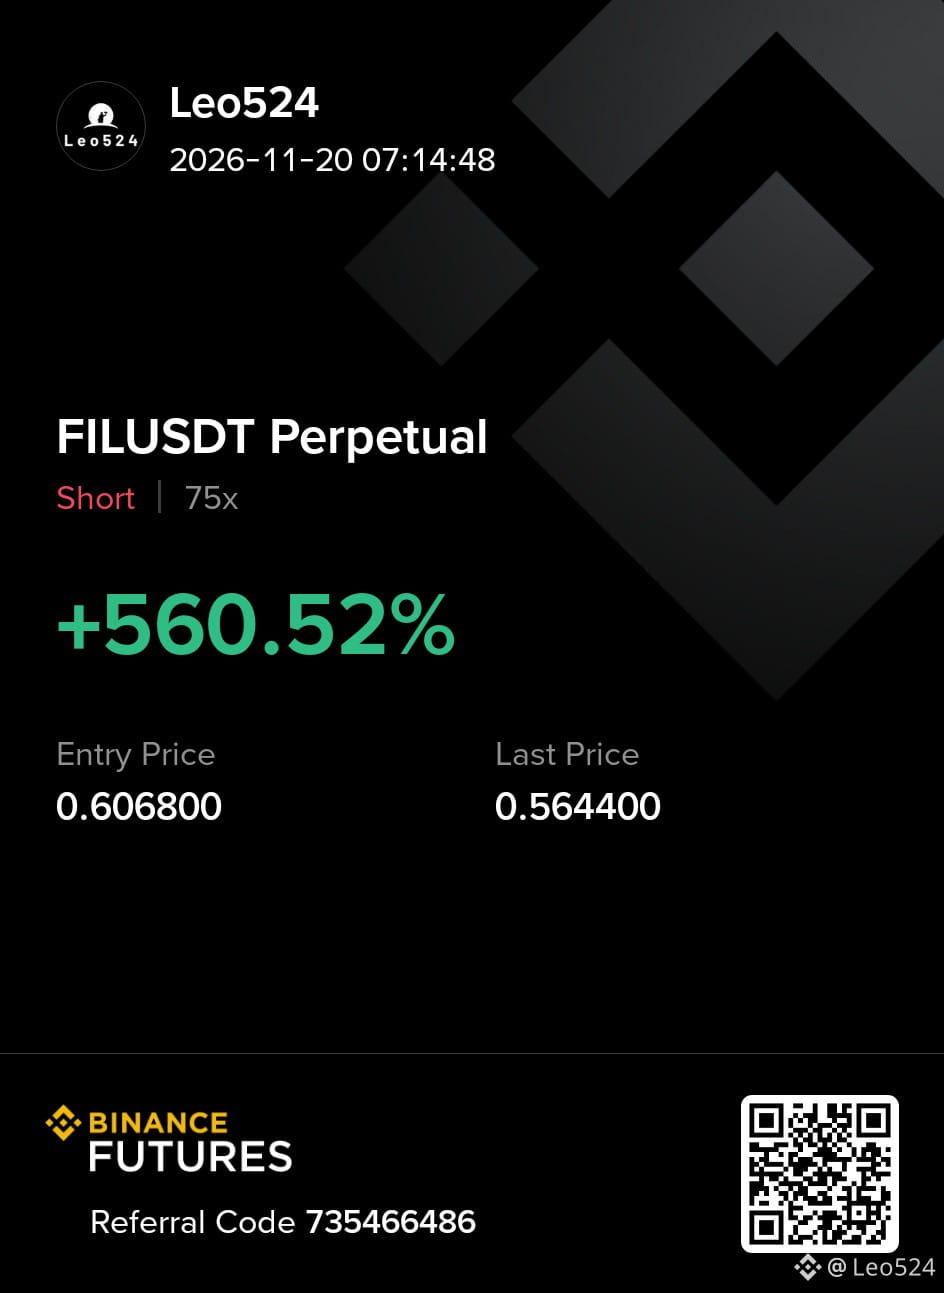
Bullish$FIL Is This the Beginning of a Major Reversal?
Filecoin (FIL) is facing continued selling pressure, recently dropping around 6% amid a broader crypto market selloff. According to the latest market report, this decline appears to be driven mainly by overall market weakness rather than Filecoin-specific negative developments. However, the weekly chart is still showing a clear bearish structure, with price continuing to form lower highs and lower lows.
FIL is now approaching an important support area around $0.42, which also aligns with the descending trendline. If buyers manage to defend this zone, we could see a relief rally and potentially the beginning of a larger recovery. The first major resistance sits around $1.23–$1.30, where previous rallies faced strong selling pressure.
A bullish reversal is still not confirmed. We need to see strong buying pressure, a break of the current lower-high structure, and LTF confirmation before considering a sustainable recovery. If the support fails, further downside remains possible. For now, $0.42 is the key level to watch.
#fil #Filecoin #CryptoAnalysis #Leo524
Analysis by LEO524
Filecoin (FIL) is facing continued selling pressure, recently dropping around 6% amid a broader crypto market selloff. According to the latest market report, this decline appears to be driven mainly by overall market weakness rather than Filecoin-specific negative developments. However, the weekly chart is still showing a clear bearish structure, with price continuing to form lower highs and lower lows.
FIL is now approaching an important support area around $0.42, which also aligns with the descending trendline. If buyers manage to defend this zone, we could see a relief rally and potentially the beginning of a larger recovery. The first major resistance sits around $1.23–$1.30, where previous rallies faced strong selling pressure.
A bullish reversal is still not confirmed. We need to see strong buying pressure, a break of the current lower-high structure, and LTF confirmation before considering a sustainable recovery. If the support fails, further downside remains possible. For now, $0.42 is the key level to watch.
#fil #Filecoin #CryptoAnalysis #Leo524
Analysis by LEO524
Leo524
·
--
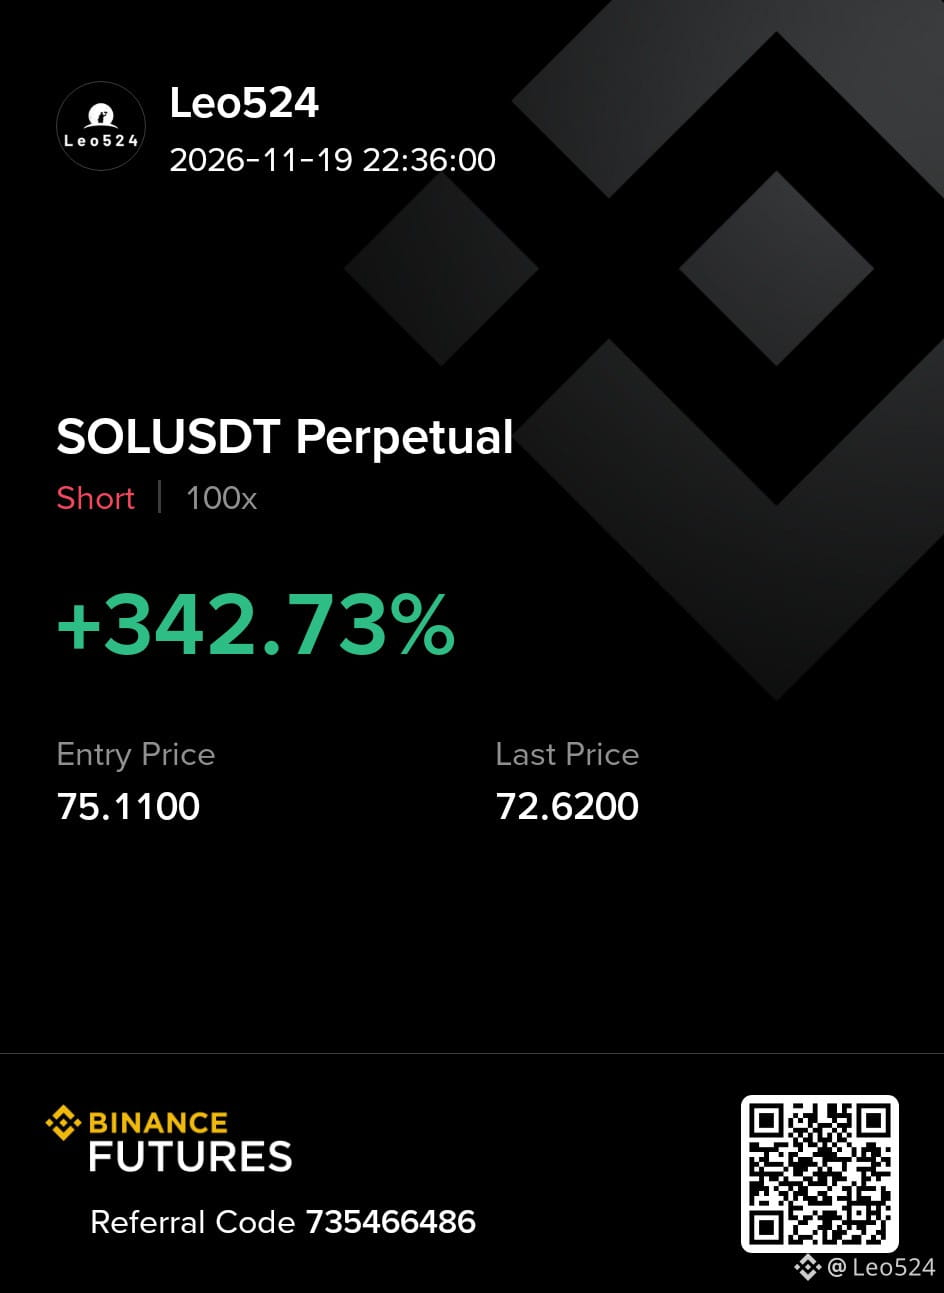
Bullish$FIL Is This the Beginning of a Major Reversal?
Filecoin (FIL) is facing continued selling pressure, recently dropping around 6% amid a broader crypto market selloff. According to the latest market report, this decline appears to be driven mainly by overall market weakness rather than Filecoin-specific negative developments. However, the weekly chart is still showing a clear bearish structure, with price continuing to form lower highs and lower lows.
FIL is now approaching an important support area around $0.42, which also aligns with the descending trendline. If buyers manage to defend this zone, we could see a relief rally and potentially the beginning of a larger recovery. The first major resistance sits around $1.23–$1.30, where previous rallies faced strong selling pressure.
A bullish reversal is still not confirmed. We need to see strong buying pressure, a break of the current lower-high structure, and LTF confirmation before considering a sustainable recovery. If the support fails, further downside remains possible. For now, $0.42 is the key level to watch.
#fil #Filecoin #CryptoAnalysis #Leo524
Analysis by LEO524
Filecoin (FIL) is facing continued selling pressure, recently dropping around 6% amid a broader crypto market selloff. According to the latest market report, this decline appears to be driven mainly by overall market weakness rather than Filecoin-specific negative developments. However, the weekly chart is still showing a clear bearish structure, with price continuing to form lower highs and lower lows.
FIL is now approaching an important support area around $0.42, which also aligns with the descending trendline. If buyers manage to defend this zone, we could see a relief rally and potentially the beginning of a larger recovery. The first major resistance sits around $1.23–$1.30, where previous rallies faced strong selling pressure.
A bullish reversal is still not confirmed. We need to see strong buying pressure, a break of the current lower-high structure, and LTF confirmation before considering a sustainable recovery. If the support fails, further downside remains possible. For now, $0.42 is the key level to watch.
#fil #Filecoin #CryptoAnalysis #Leo524
Analysis by LEO524
Leo524
·
--
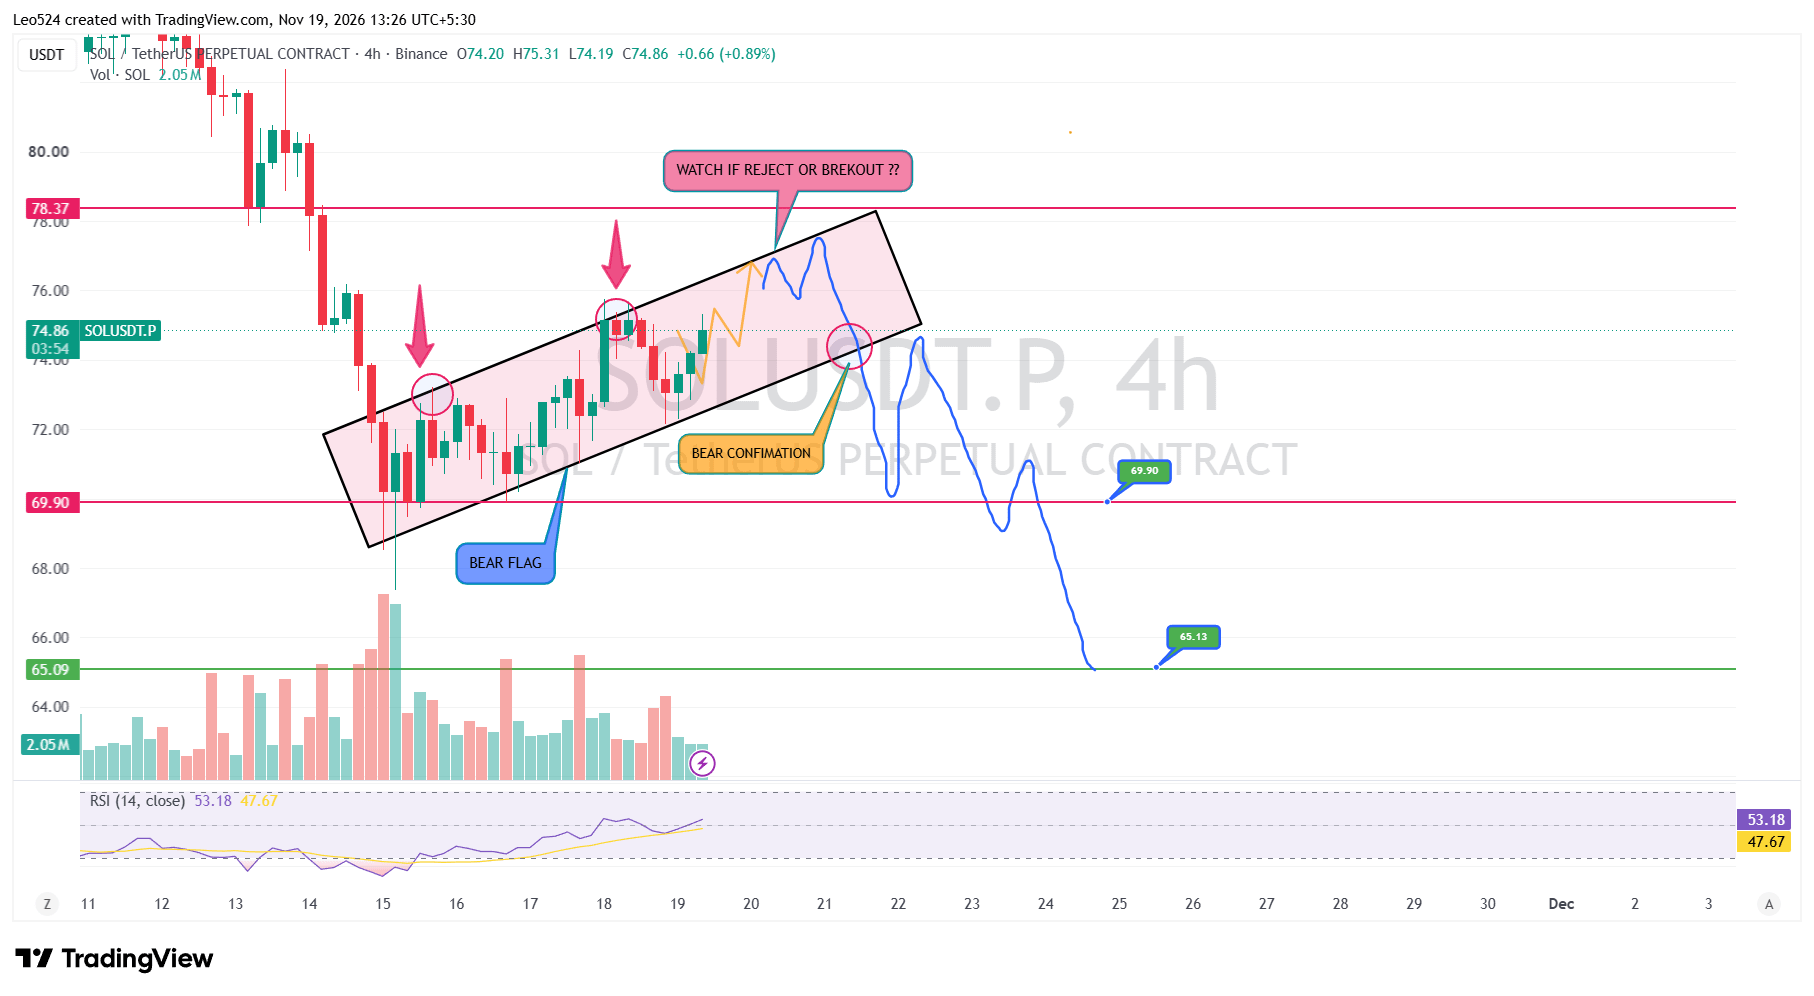
Bearish$SOL IS BUILDING A BEAR FLAG. ANOTHER LEG DOWN LOADING? 📉
Solana has already experienced a sharp sell-off, with sellers clearly dominating the market. Since then, price has been recovering slowly inside an ascending channel on the 4H chart.
This looks like a classic Bear Flag formation, where the market pauses and retraces before potentially continuing in the direction of the previous trend.
I'm watching the upper side of this structure closely. If price reaches the resistance area and gets rejected, followed by a strong bearish breakdown of the channel, that could be the confirmation I'm waiting for to enter a short position.
My downside target is around $65, with $69.90 being an important level to watch along the way. For now, I'm waiting for price action to confirm the next move. 🔥
Solana has already experienced a sharp sell-off, with sellers clearly dominating the market. Since then, price has been recovering slowly inside an ascending channel on the 4H chart.
This looks like a classic Bear Flag formation, where the market pauses and retraces before potentially continuing in the direction of the previous trend.
I'm watching the upper side of this structure closely. If price reaches the resistance area and gets rejected, followed by a strong bearish breakdown of the channel, that could be the confirmation I'm waiting for to enter a short position.
My downside target is around $65, with $69.90 being an important level to watch along the way. For now, I'm waiting for price action to confirm the next move. 🔥
Leo524
·
--
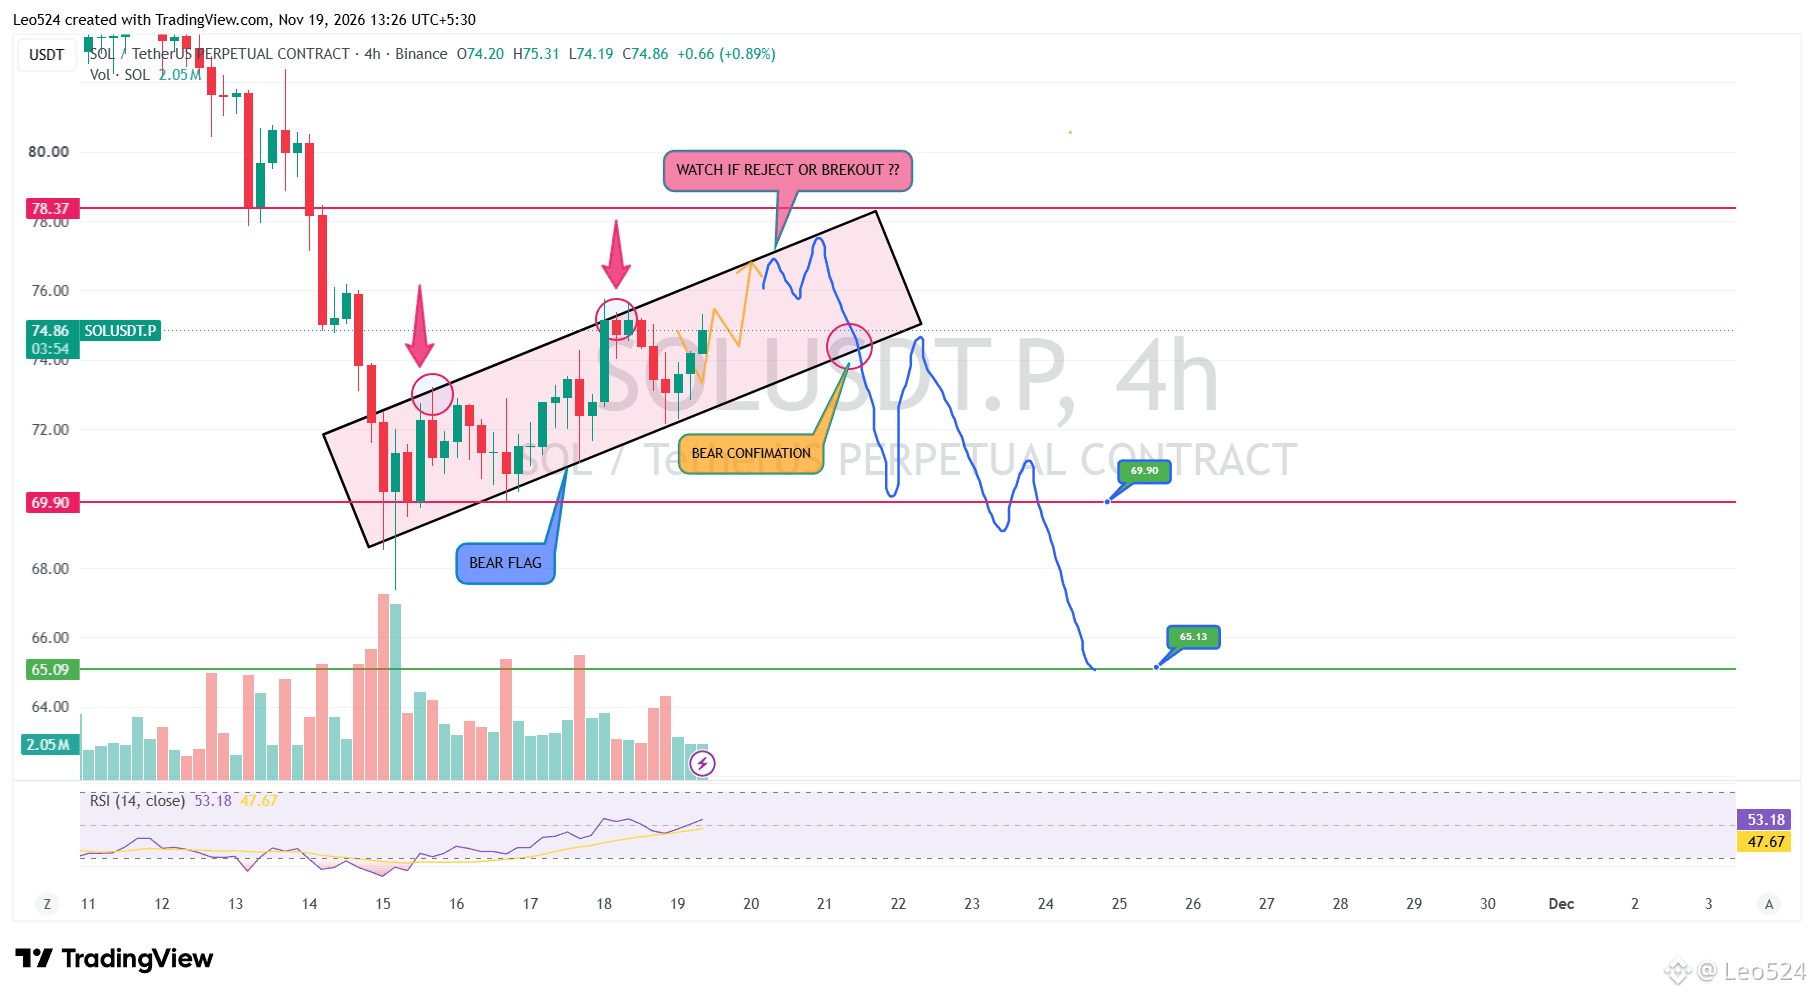
Bearish$SOL IS BUILDING A BEAR FLAG. ANOTHER LEG DOWN LOADING? 📉
Solana has already experienced a sharp sell-off, with sellers clearly dominating the market. Since then, price has been recovering slowly inside an ascending channel on the 4H chart.
This looks like a classic Bear Flag formation, where the market pauses and retraces before potentially continuing in the direction of the previous trend.
I'm watching the upper side of this structure closely. If price reaches the resistance area and gets rejected, followed by a strong bearish breakdown of the channel, that could be the confirmation I'm waiting for to enter a short position.
My downside target is around $65, with $69.90 being an important level to watch along the way. For now, I'm waiting for price action to confirm the next move. 🔥
Solana has already experienced a sharp sell-off, with sellers clearly dominating the market. Since then, price has been recovering slowly inside an ascending channel on the 4H chart.
This looks like a classic Bear Flag formation, where the market pauses and retraces before potentially continuing in the direction of the previous trend.
I'm watching the upper side of this structure closely. If price reaches the resistance area and gets rejected, followed by a strong bearish breakdown of the channel, that could be the confirmation I'm waiting for to enter a short position.
My downside target is around $65, with $69.90 being an important level to watch along the way. For now, I'm waiting for price action to confirm the next move. 🔥
Log in to explore more content