

Клим Самгин
5.3k Posts

Клим Самгин
Report
Block User
Я Позитивен. Я формирую себя по пути чистому и светлому в соответствии с Законами Космоса Великого.
Open Trade
High-Frequency Trader
5.7 Years
191 Following
217 Followers
2.0K+ Liked
Posts
Portfolio
All
Quotes
·
--

Article
$GTC - why Gitcoin surged and what’s behind the moveGreetings, dear friends!
$GTC surged rapidly at the beginning of October. On the Binance chart, the price rose to 0.18377 USDT, then pulled back to 0.1412 USDT. At the time of analysis, the daily increase was about 26%.
The main impulse came on October 1. Over the previous day, the price increased from about 0.094 to 0.142 USDT, while trading volumes also rose.
$GTC - why Gitcoin surged and what’s behind the move
Greetings, dear friends!
$GTC surged rapidly at the beginning of October. On the Binance chart, the price rose to 0.18377 USDT, then pulled back to 0.1412 USDT. At the time of analysis, the daily increase was about 26%.
The main impulse came on October 1. Over the previous day, the price increased from about 0.094 to 0.142 USDT, while trading volumes also rose.
$GTC surged rapidly at the beginning of October. On the Binance chart, the price rose to 0.18377 USDT, then pulled back to 0.1412 USDT. At the time of analysis, the daily increase was about 26%.
The main impulse came on October 1. Over the previous day, the price increased from about 0.094 to 0.142 USDT, while trading volumes also rose.
550
·
--
Verified
Article
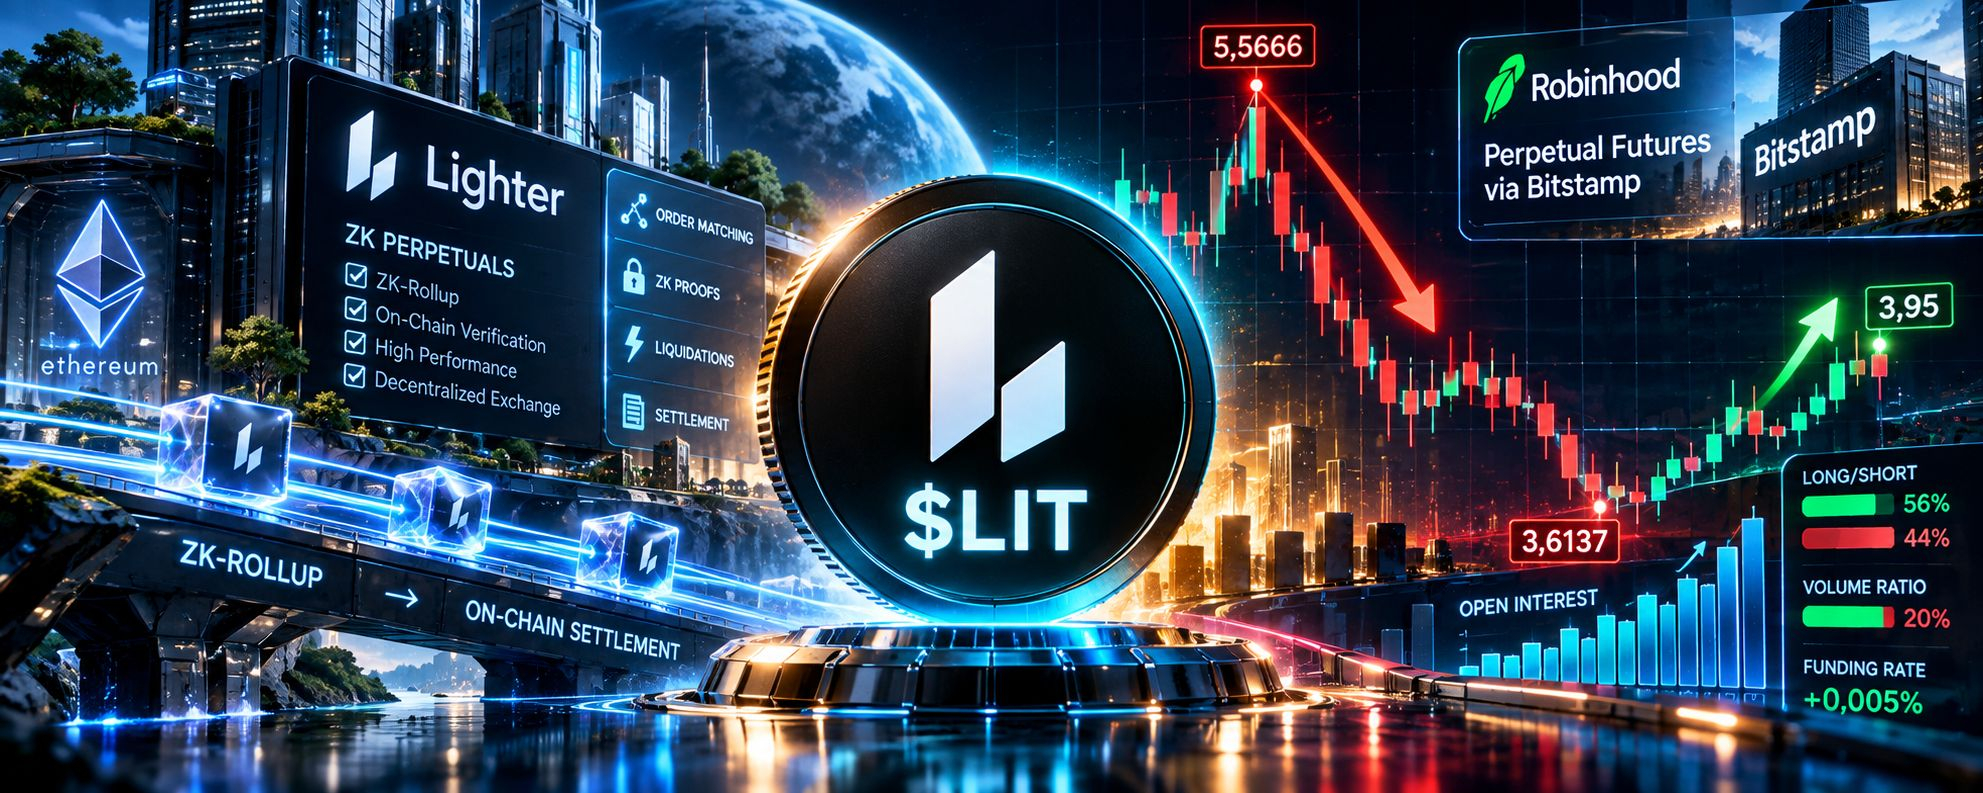
$LIT - Lighter news, analysis and forecast after a 29% dropHello, dear friends!
$LIT is trading around 3.95 USDT; the daily decline is approximately 11.6%. On the Binance chart, the maximum of the current movement is marked at 5.5666 USDT; after that, the price fell to 3.6137 USDT. From the peak to the current levels, the drop is about 29%.
Over the past few hours, the price has recovered from 3.61 to 3.95 USDT. At the same time, open interest increased from about 16.9 to 17.25 million LIT. In other words, the rebound is accompanied by the opening of new positions.
$LIT - Lighter news, analysis and forecast after a 29% drop
Hello, dear friends!
$LIT is trading around 3.95 USDT; the daily decline is approximately 11.6%. On the Binance chart, the maximum of the current movement is marked at 5.5666 USDT; after that, the price fell to 3.6137 USDT. From the peak to the current levels, the drop is about 29%.
Over the past few hours, the price has recovered from 3.61 to 3.95 USDT. At the same time, open interest increased from about 16.9 to 17.25 million LIT. In other words, the rebound is accompanied by the opening of new positions.
$LIT is trading around 3.95 USDT; the daily decline is approximately 11.6%. On the Binance chart, the maximum of the current movement is marked at 5.5666 USDT; after that, the price fell to 3.6137 USDT. From the peak to the current levels, the drop is about 29%.
Over the past few hours, the price has recovered from 3.61 to 3.95 USDT. At the same time, open interest increased from about 16.9 to 17.25 million LIT. In other words, the rebound is accompanied by the opening of new positions.
136
·
--
Verified

Article
$MOVR - about the project, the token, the latest news, and a sudden price moveGreetings, dear friends!
$MOVR Today it has surged sharply. At the time of analysis on Binance, the price was around 1.82 USDT, with growth of approximately +77% over the past day. On the daily chart, the maximum of the current move is marked at 2.077 USDT, whereas not long ago the price was in the range of 0.6–0.9 USDT.
The main event now is not only about the chart. On September 30, the period of migrating MOVR to the Base network comes to an end. The initial migration deadline was set for July 31, and after that, users who missed the main deadline had an additional window. Valid applications submitted before September 30 will be processed.
$MOVR - about the project, the token, the latest news, and a sudden price move
Greetings, dear friends!
$MOVR Today it has surged sharply. At the time of analysis on Binance, the price was around 1.82 USDT, with growth of approximately +77% over the past day. On the daily chart, the maximum of the current move is marked at 2.077 USDT, whereas not long ago the price was in the range of 0.6–0.9 USDT.
The main event now is not only about the chart. On September 30, the period of migrating MOVR to the Base network comes to an end. The initial migration deadline was set for July 31, and after that, users who missed the main deadline had an additional window. Valid applications submitted before September 30 will be processed.
$MOVR Today it has surged sharply. At the time of analysis on Binance, the price was around 1.82 USDT, with growth of approximately +77% over the past day. On the daily chart, the maximum of the current move is marked at 2.077 USDT, whereas not long ago the price was in the range of 0.6–0.9 USDT.
The main event now is not only about the chart. On September 30, the period of migrating MOVR to the Base network comes to an end. The initial migration deadline was set for July 31, and after that, users who missed the main deadline had an additional window. Valid applications submitted before September 30 will be processed.
160
·
--

Article
$NKE - the main Nike news ahead of the release of NKEUSDTGreetings to you, dear friends!
On Binance, the perpetual contract NKEUSDT for Nike shares is about to be released or has already been released. Therefore, before trading begins, briefly about what is happening with the company right now.
The main change in recent years is related to sales channels. Nike has been actively developing NIKE Direct, reducing its dependence on wholesale partners. Now the figures show the opposite direction: in FY2026, wholesale sales increased by 6% to $27.5 billion, while NIKE Direct fell by 6% to $17.7 billion. Nike Brand Digital sales dropped by 12%, and sales from company-owned stores fell by 4%.
$NKE - the main Nike news ahead of the release of NKEUSDT
Greetings to you, dear friends!
On Binance, the perpetual contract NKEUSDT for Nike shares is about to be released or has already been released. Therefore, before trading begins, briefly about what is happening with the company right now.
The main change in recent years is related to sales channels. Nike has been actively developing NIKE Direct, reducing its dependence on wholesale partners. Now the figures show the opposite direction: in FY2026, wholesale sales increased by 6% to $27.5 billion, while NIKE Direct fell by 6% to $17.7 billion. Nike Brand Digital sales dropped by 12%, and sales from company-owned stores fell by 4%.
On Binance, the perpetual contract NKEUSDT for Nike shares is about to be released or has already been released. Therefore, before trading begins, briefly about what is happening with the company right now.
The main change in recent years is related to sales channels. Nike has been actively developing NIKE Direct, reducing its dependence on wholesale partners. Now the figures show the opposite direction: in FY2026, wholesale sales increased by 6% to $27.5 billion, while NIKE Direct fell by 6% to $17.7 billion. Nike Brand Digital sales dropped by 12%, and sales from company-owned stores fell by 4%.
1
138
·
--

Article
$NMR - about the company, news, and a brief analysis of the chartsGreetings, dear friends!
Numerai - a platform that brings together machine learning and quantitative investing. The company runs a tournament in which participants create models to predict financial data. Numerai evaluates the results of these models.
Staked predictions are combined into the Stake-Weighted Meta Model that Numerai uses in its hedge fund.
$NMR - about the company, news, and a brief analysis of the charts
Greetings, dear friends!
Numerai - a platform that brings together machine learning and quantitative investing. The company runs a tournament in which participants create models to predict financial data. Numerai evaluates the results of these models.
Staked predictions are combined into the Stake-Weighted Meta Model that Numerai uses in its hedge fund.
Numerai - a platform that brings together machine learning and quantitative investing. The company runs a tournament in which participants create models to predict financial data. Numerai evaluates the results of these models.
Staked predictions are combined into the Stake-Weighted Meta Model that Numerai uses in its hedge fund.
108
·
--

Article
$BTC: ETFs are being bought, futures are cautious. What the market showsGreetings to you, dear friends!
I would be pleased with any support from your side—like, subscribe... write that it is poorly written and incorrectly analyzed, if you think so..
Any interaction with the post will be useful for promoting the post.
Right now $BTC is trading at about 84,000 USDT. After a strong rise, the price pulled back to 82,500 and then returned to 84,000.
$BTC: ETFs are being bought, futures are cautious. What the market shows
Greetings to you, dear friends!
I would be pleased with any support from your side—like, subscribe... write that it is poorly written and incorrectly analyzed, if you think so..
Any interaction with the post will be useful for promoting the post.
Right now $BTC is trading at about 84,000 USDT. After a strong rise, the price pulled back to 82,500 and then returned to 84,000.
I would be pleased with any support from your side—like, subscribe... write that it is poorly written and incorrectly analyzed, if you think so..
Any interaction with the post will be useful for promoting the post.
Right now $BTC is trading at about 84,000 USDT. After a strong rise, the price pulled back to 82,500 and then returned to 84,000.
534
·
--
Why I didn’t close $ZEC at -$35
Hello, dear friends!
The short #ZECUSDT is open at 1,319.84 USDT. The current price is about 1,419 USDT; the loss is -65 USDT, ROI -14%, leverage 2x. Liquidation is at 1,961.50 USDT.
The main question: why didn’t I close the position when the loss was about $35?
I was waiting for a drop to 1,284 USDT. The price went against me, but I decided to wait. In the end, the loss nearly doubled.
Right now, the picture is ambiguous.
On the 15M chart, the price is around 1,420 USDT, practically at AVL 1,420.67. After falling to 1,357 USDT, ZEC recovered.
On the 4H chart, the price is above AVL 1,389.74, but below SAR 1,624.25 and Supertrend 1,575.24.
On the daily chart, the price is holding above AVL 1,399.96 and Supertrend 1,203.82, but SAR is at 1,693.86.
On futures, open interest grew by roughly from 453 to 458 thousand ZEC, and nominal OI increased from 620 to 648 million USDT.
For the positions of the top traders Long/Short, it’s about 1.29—meaning longs are in the majority. Funding is +0.01000%, long positions are paying shorts.
My key levels:
1,444 and 1,483 USDT at the top.
1,375 and 1,357 USDT at the bottom.
For now, I’m continuing to hold the short and waiting for 1,284 USDT. But now I’m looking at the situation much more strictly.
My mistake was not that the market moved against the position. I saw -35 dollars, decided to wait, and allowed the loss to grow to almost double.
#ZEC #ZECUSDT #cryptotrading
Why I didn’t close $ZEC at -$35
Hello, dear friends!
The short #ZECUSDT is open at 1,319.84 USDT. The current price is about 1,419 USDT; the loss is -65 USDT, ROI -14%, leverage 2x. Liquidation is at 1,961.50 USDT.
The main question: why didn’t I close the position when the loss was about $35?
I was waiting for a drop to 1,284 USDT. The price went against me, but I decided to wait. In the end, the loss nearly doubled.
Right now, the picture is ambiguous.
On the 15M chart, the price is around 1,420 USDT, practically at AVL 1,420.67. After falling to 1,357 USDT, ZEC recovered.
On the 4H chart, the price is above AVL 1,389.74, but below SAR 1,624.25 and Supertrend 1,575.24.
On the daily chart, the price is holding above AVL 1,399.96 and Supertrend 1,203.82, but SAR is at 1,693.86.
On futures, open interest grew by roughly from 453 to 458 thousand ZEC, and nominal OI increased from 620 to 648 million USDT.
For the positions of the top traders Long/Short, it’s about 1.29—meaning longs are in the majority. Funding is +0.01000%, long positions are paying shorts.
My key levels:
1,444 and 1,483 USDT at the top.
1,375 and 1,357 USDT at the bottom.
For now, I’m continuing to hold the short and waiting for 1,284 USDT. But now I’m looking at the situation much more strictly.
My mistake was not that the market moved against the position. I saw -35 dollars, decided to wait, and allowed the loss to grow to almost double.
#ZEC #ZECUSDT #cryptotrading
Hello, dear friends!
The short #ZECUSDT is open at 1,319.84 USDT. The current price is about 1,419 USDT; the loss is -65 USDT, ROI -14%, leverage 2x. Liquidation is at 1,961.50 USDT.
The main question: why didn’t I close the position when the loss was about $35?
I was waiting for a drop to 1,284 USDT. The price went against me, but I decided to wait. In the end, the loss nearly doubled.
Right now, the picture is ambiguous.
On the 15M chart, the price is around 1,420 USDT, practically at AVL 1,420.67. After falling to 1,357 USDT, ZEC recovered.
On the 4H chart, the price is above AVL 1,389.74, but below SAR 1,624.25 and Supertrend 1,575.24.
On the daily chart, the price is holding above AVL 1,399.96 and Supertrend 1,203.82, but SAR is at 1,693.86.
On futures, open interest grew by roughly from 453 to 458 thousand ZEC, and nominal OI increased from 620 to 648 million USDT.
For the positions of the top traders Long/Short, it’s about 1.29—meaning longs are in the majority. Funding is +0.01000%, long positions are paying shorts.
My key levels:
1,444 and 1,483 USDT at the top.
1,375 and 1,357 USDT at the bottom.
For now, I’m continuing to hold the short and waiting for 1,284 USDT. But now I’m looking at the situation much more strictly.
My mistake was not that the market moved against the position. I saw -35 dollars, decided to wait, and allowed the loss to grow to almost double.
#ZEC #ZECUSDT #cryptotrading
2
1.2k
·
--
Verified

Article
HBAR: What has changed around Hedera and why the chart accelerated sharplyGreetings, dear friends!
If you find the news useful, please support it with any interaction with the post. I’ll be glad to welcome new subscribers. For my readers, there are always fresh news in the Markets tab.
Over the past few days, it has accelerated sharply. On the daily chart, the price rose from 0.06423 USDT to 0.13099 USDT, after which it pulled back to 0.1173 USDT.
HBAR: What has changed around Hedera and why the chart accelerated sharply
Greetings, dear friends!
If you find the news useful, please support it with any interaction with the post. I’ll be glad to welcome new subscribers. For my readers, there are always fresh news in the Markets tab.
Over the past few days, it has accelerated sharply. On the daily chart, the price rose from 0.06423 USDT to 0.13099 USDT, after which it pulled back to 0.1173 USDT.
If you find the news useful, please support it with any interaction with the post. I’ll be glad to welcome new subscribers. For my readers, there are always fresh news in the Markets tab.
Over the past few days, it has accelerated sharply. On the daily chart, the price rose from 0.06423 USDT to 0.13099 USDT, after which it pulled back to 0.1173 USDT.
4
2k
·
--
Verified

Article
QNT: what has changed around Quant over the course of a few daysGreetings, dear friends!
In just a few days $QNT it moved from the 60–70 USDT range to 374.50 USDT, after which it pulled back to 238 USDT. On the daily chart, the current candle shows about +46%. Trading volume reached 5.91 million QNT, or approximately 1.49 billion USDT.
During the same period, several major news items appeared around Quant at once.
QNT: what has changed around Quant over the course of a few days
Greetings, dear friends!
In just a few days $QNT it moved from the 60–70 USDT range to 374.50 USDT, after which it pulled back to 238 USDT. On the daily chart, the current candle shows about +46%. Trading volume reached 5.91 million QNT, or approximately 1.49 billion USDT.
During the same period, several major news items appeared around Quant at once.
In just a few days $QNT it moved from the 60–70 USDT range to 374.50 USDT, after which it pulled back to 238 USDT. On the daily chart, the current candle shows about +46%. Trading volume reached 5.91 million QNT, or approximately 1.49 billion USDT.
During the same period, several major news items appeared around Quant at once.
1
704
·
--

Article
Bitcoin received $2.4B in inflows via ETFs, but the market did not continue to riseGreetings to you, dear friends!
$BTC After the rally to 87,395 USDT, it returned to the 83,000 area. I checked the daily, 4-hour, and 15-minute charts, volumes, OBV, and Binance buy/sell data.
Here, the most important thing for me is not the price drop itself, but the discrepancy between different sources of demand. U.S. spot Bitcoin ETFs received about $2.4B in net inflows over the week, but after that, the price failed to continue rising.
Bitcoin received $2.4B in inflows via ETFs, but the market did not continue to rise
Greetings to you, dear friends!
$BTC After the rally to 87,395 USDT, it returned to the 83,000 area. I checked the daily, 4-hour, and 15-minute charts, volumes, OBV, and Binance buy/sell data.
Here, the most important thing for me is not the price drop itself, but the discrepancy between different sources of demand. U.S. spot Bitcoin ETFs received about $2.4B in net inflows over the week, but after that, the price failed to continue rising.
$BTC After the rally to 87,395 USDT, it returned to the 83,000 area. I checked the daily, 4-hour, and 15-minute charts, volumes, OBV, and Binance buy/sell data.
Here, the most important thing for me is not the price drop itself, but the discrepancy between different sources of demand. U.S. spot Bitcoin ETFs received about $2.4B in net inflows over the week, but after that, the price failed to continue rising.
137
·
--

Article
SUI: moving toward $1.16, chart structure and overheating in futuresGreetings, dear friends!
Today I’m looking at $SUI from two angles at once: what the network itself is, what role the token plays in it, and what happens to the price after a sharp move upward.
Sui is a Layer 1 blockchain and a platform for smart contracts. The project was created by the Mysten Labs team, and the development of the ecosystem is handled by the Sui Foundation. At the core of the network is the Move language and an object-based model, which makes it possible to process independent operations in parallel. The public launch of the Sui Mainnet took place on May 3, 2023. (Sui)
SUI: moving toward $1.16, chart structure and overheating in futures
Greetings, dear friends!
Today I’m looking at $SUI from two angles at once: what the network itself is, what role the token plays in it, and what happens to the price after a sharp move upward.
Sui is a Layer 1 blockchain and a platform for smart contracts. The project was created by the Mysten Labs team, and the development of the ecosystem is handled by the Sui Foundation. At the core of the network is the Move language and an object-based model, which makes it possible to process independent operations in parallel. The public launch of the Sui Mainnet took place on May 3, 2023. (Sui)
Today I’m looking at $SUI from two angles at once: what the network itself is, what role the token plays in it, and what happens to the price after a sharp move upward.
Sui is a Layer 1 blockchain and a platform for smart contracts. The project was created by the Mysten Labs team, and the development of the ecosystem is handled by the Sui Foundation. At the core of the network is the Move language and an object-based model, which makes it possible to process independent operations in parallel. The public launch of the Sui Mainnet took place on May 3, 2023. (Sui)
1
200
·
--
Verified

Article
ONDO: from $0.08 to $2.14 and back again. Can the coin return to its previous all-time high?
?Greetings, dear friends!
Today we’ll cover $ONDO : the project’s story, the price path from the first trades to its all-time high, and the current sharp surge.
Ondo Finance appeared in 2021 as a DeFi protocol. Initially, the project worked with fixed-income instruments and risk-isolated vaults. Later, the direction expanded significantly. #ONDO moved on to tokenizing traditional financial assets and creating infrastructure for their trading on the blockchain.
ONDO: from $0.08 to $2.14 and back again. Can the coin return to its previous all-time high? ?
Greetings, dear friends!
Today we’ll cover $ONDO : the project’s story, the price path from the first trades to its all-time high, and the current sharp surge.
Ondo Finance appeared in 2021 as a DeFi protocol. Initially, the project worked with fixed-income instruments and risk-isolated vaults. Later, the direction expanded significantly. #ONDO moved on to tokenizing traditional financial assets and creating infrastructure for their trading on the blockchain.
Today we’ll cover $ONDO : the project’s story, the price path from the first trades to its all-time high, and the current sharp surge.
Ondo Finance appeared in 2021 as a DeFi protocol. Initially, the project worked with fixed-income instruments and risk-isolated vaults. Later, the direction expanded significantly. #ONDO moved on to tokenizing traditional financial assets and creating infrastructure for their trading on the blockchain.
3
201
·
--
Partly True
Article
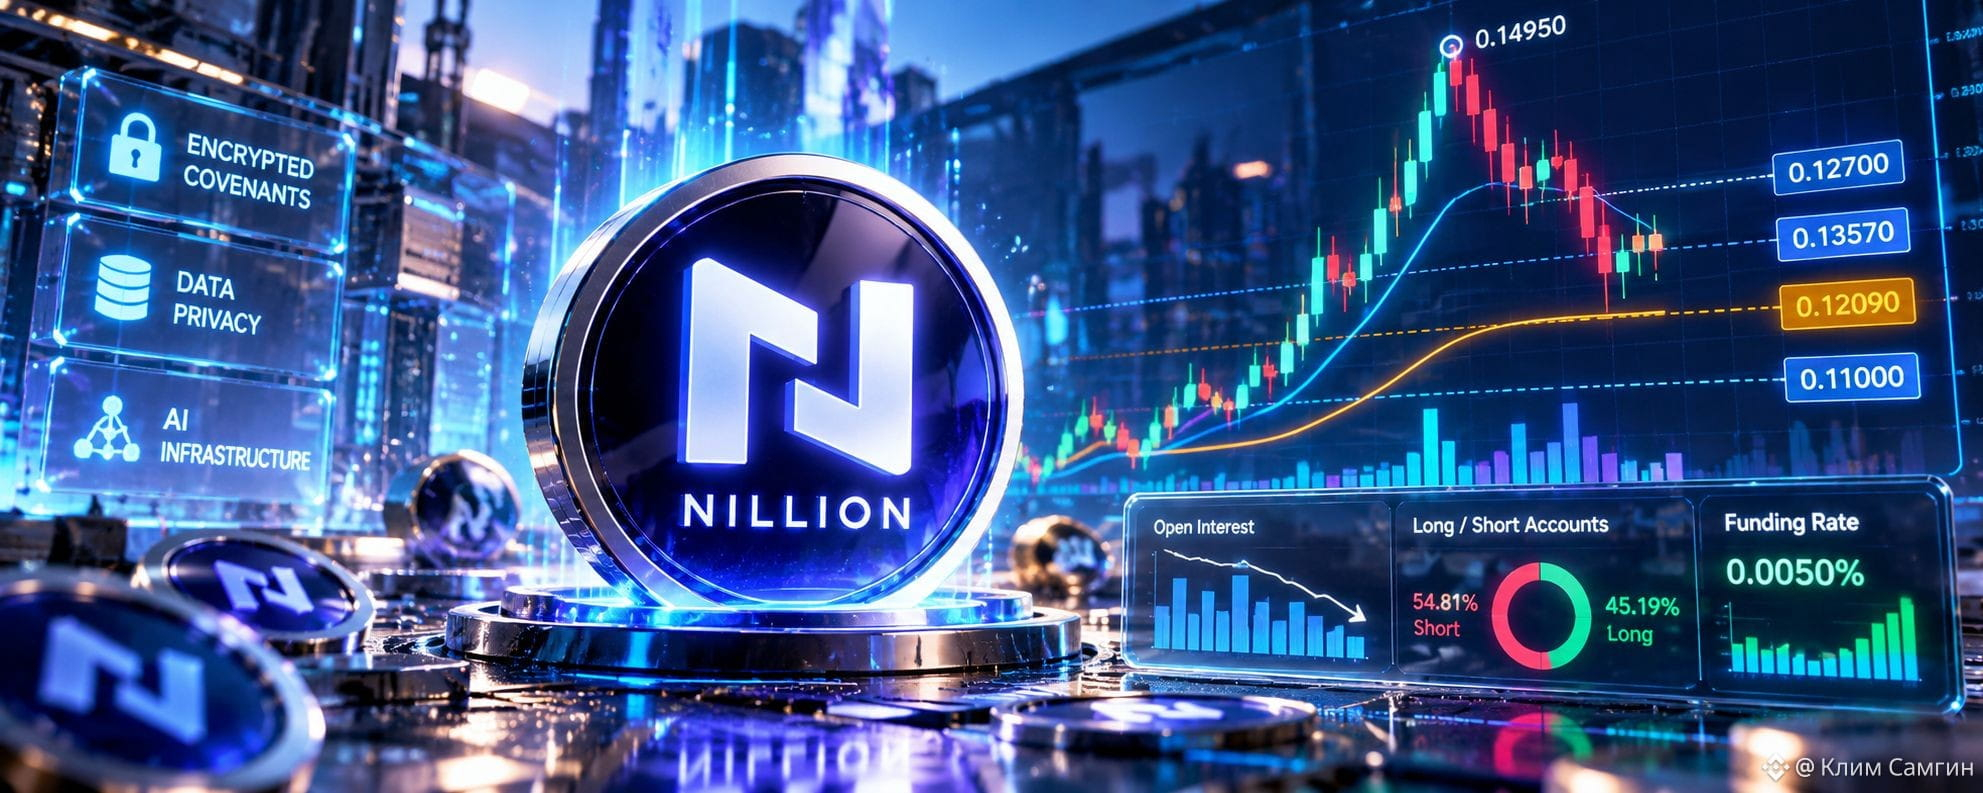
NIL after a 32% pump: will the price hold the key levels?Greetings, dear friends!
$NIL In one day it added about 32%, but after reaching 0.14950 the price has already pulled back to 0.127.
On the 15-minute chart, the price is currently practically at AVL 0.12825. Below it runs the Supertrend at 0.12093. As long as this level holds, it’s too early to talk about a break in the current move.
NIL after a 32% pump: will the price hold the key levels?
Greetings, dear friends!
$NIL In one day it added about 32%, but after reaching 0.14950 the price has already pulled back to 0.127.
On the 15-minute chart, the price is currently practically at AVL 0.12825. Below it runs the Supertrend at 0.12093. As long as this level holds, it’s too early to talk about a break in the current move.
$NIL In one day it added about 32%, but after reaching 0.14950 the price has already pulled back to 0.127.
On the 15-minute chart, the price is currently practically at AVL 0.12825. Below it runs the Supertrend at 0.12093. As long as this level holds, it’s too early to talk about a break in the current move.
2
999
·
--
Article
$BTC: after $87 000 the market is testing supportHello, dear friends.
$BTC after rising to $87,000 it returned to $84,500. It is especially important now to compare price movement with capital flows, futures positions, and the chart’s behavior across different timeframes.
US spot Bitcoin ETFs received a net inflow of $998.95 million on September 21, and another $714.75 million on September 22. Taking into account the inflows from September 17 and 18 as well, the total result over four sessions was about $2.3 billion. (TFTC)
$BTC: after $87 000 the market is testing support
Hello, dear friends.
$BTC after rising to $87,000 it returned to $84,500. It is especially important now to compare price movement with capital flows, futures positions, and the chart’s behavior across different timeframes.
US spot Bitcoin ETFs received a net inflow of $998.95 million on September 21, and another $714.75 million on September 22. Taking into account the inflows from September 17 and 18 as well, the total result over four sessions was about $2.3 billion. (TFTC)
$BTC after rising to $87,000 it returned to $84,500. It is especially important now to compare price movement with capital flows, futures positions, and the chart’s behavior across different timeframes.
US spot Bitcoin ETFs received a net inflow of $998.95 million on September 21, and another $714.75 million on September 22. Taking into account the inflows from September 17 and 18 as well, the total result over four sessions was about $2.3 billion. (TFTC)
1.6k
·
--

Article
$TAKE: strong momentum, new positions, and an important date September 25Greetings to you, dear friends.
Today I want to break down $TAKE specifically based on the chart, without trying to guess the direction from a single candle.
OVERTAKE develops an ecosystem for digital gaming assets: the project connects Web2 and the Web3 economy, and $TAKE is its native utility and governance token. Currently, TAKE is available via Binance Alpha, but it is not a standard spot listing on Binance. (Overtake)
$TAKE: strong momentum, new positions, and an important date September 25
Greetings to you, dear friends.
Today I want to break down $TAKE specifically based on the chart, without trying to guess the direction from a single candle.
OVERTAKE develops an ecosystem for digital gaming assets: the project connects Web2 and the Web3 economy, and $TAKE is its native utility and governance token. Currently, TAKE is available via Binance Alpha, but it is not a standard spot listing on Binance. (Overtake)
Today I want to break down $TAKE specifically based on the chart, without trying to guess the direction from a single candle.
OVERTAKE develops an ecosystem for digital gaming assets: the project connects Web2 and the Web3 economy, and $TAKE is its native utility and governance token. Currently, TAKE is available via Binance Alpha, but it is not a standard spot listing on Binance. (Overtake)
392
·
--
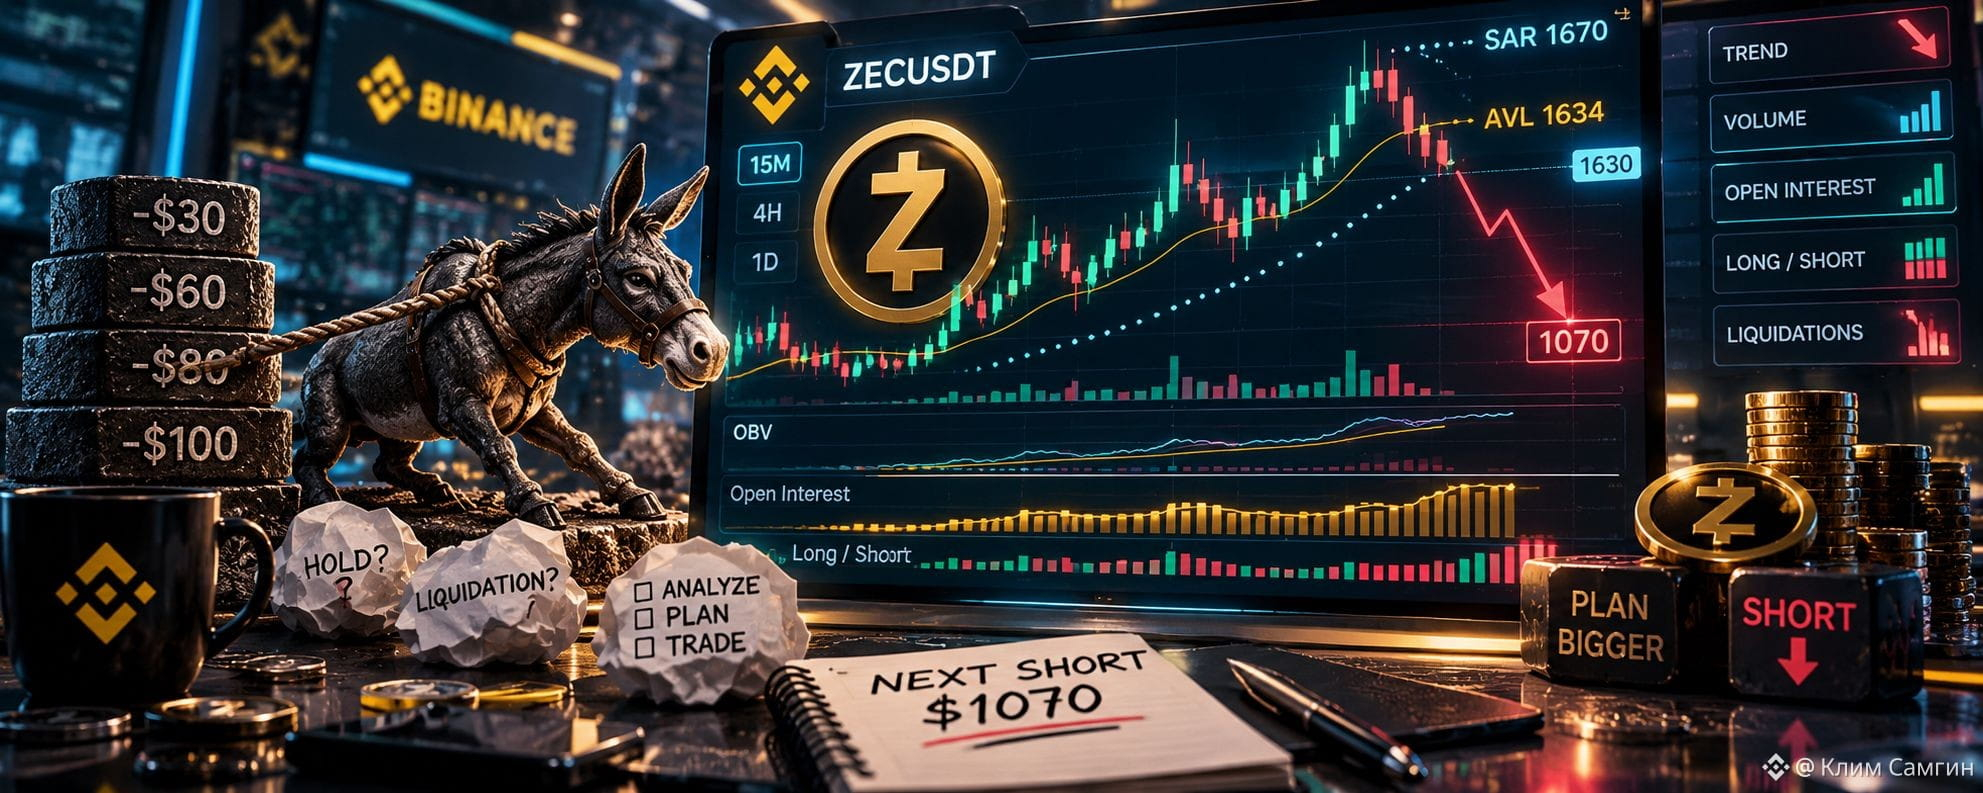
Why am I so stubborn in my stupidity?
I didn’t close when it was minus $30, $60, $80, and especially I didn’t close when it was minus one hundred dollars from the deal.
“Anyway, the price won’t reach liquidation,” I tell myself every time.
During the time I’ve been keeping this amount frozen in an order, with that same amount I would have been able to earn much more than I’m holding it with the stubbornness of an idiot.
Clinic. This can’t be cured.
Right now $ZEC around $1630. On 15M the price has already bumped into AVL $1634, and the SAR is higher at $1670. At the same time, on 4H the price is practically stuck at AVL $1630. So it’s no longer a matter of fantasies— the chart itself already shows where the next check will be.
The price will go down by $1070.
In any case, I’ll be shorting. Only I’ll have to do it with an amount that’s twice the current one.
$ZEC #ZECUSDT
Why am I so stubborn in my stupidity?
I didn’t close when it was minus $30, $60, $80, and especially I didn’t close when it was minus one hundred dollars from the deal.
“Anyway, the price won’t reach liquidation,” I tell myself every time.
During the time I’ve been keeping this amount frozen in an order, with that same amount I would have been able to earn much more than I’m holding it with the stubbornness of an idiot.
Clinic. This can’t be cured.
Right now $ZEC around $1630. On 15M the price has already bumped into AVL $1634, and the SAR is higher at $1670. At the same time, on 4H the price is practically stuck at AVL $1630. So it’s no longer a matter of fantasies— the chart itself already shows where the next check will be.
The price will go down by $1070.
In any case, I’ll be shorting. Only I’ll have to do it with an amount that’s twice the current one.
$ZEC #ZECUSDT
I didn’t close when it was minus $30, $60, $80, and especially I didn’t close when it was minus one hundred dollars from the deal.
“Anyway, the price won’t reach liquidation,” I tell myself every time.
During the time I’ve been keeping this amount frozen in an order, with that same amount I would have been able to earn much more than I’m holding it with the stubbornness of an idiot.
Clinic. This can’t be cured.
Right now $ZEC around $1630. On 15M the price has already bumped into AVL $1634, and the SAR is higher at $1670. At the same time, on 4H the price is practically stuck at AVL $1630. So it’s no longer a matter of fantasies— the chart itself already shows where the next check will be.
The price will go down by $1070.
In any case, I’ll be shorting. Only I’ll have to do it with an amount that’s twice the current one.
$ZEC #ZECUSDT
1.1k
·
--
Article
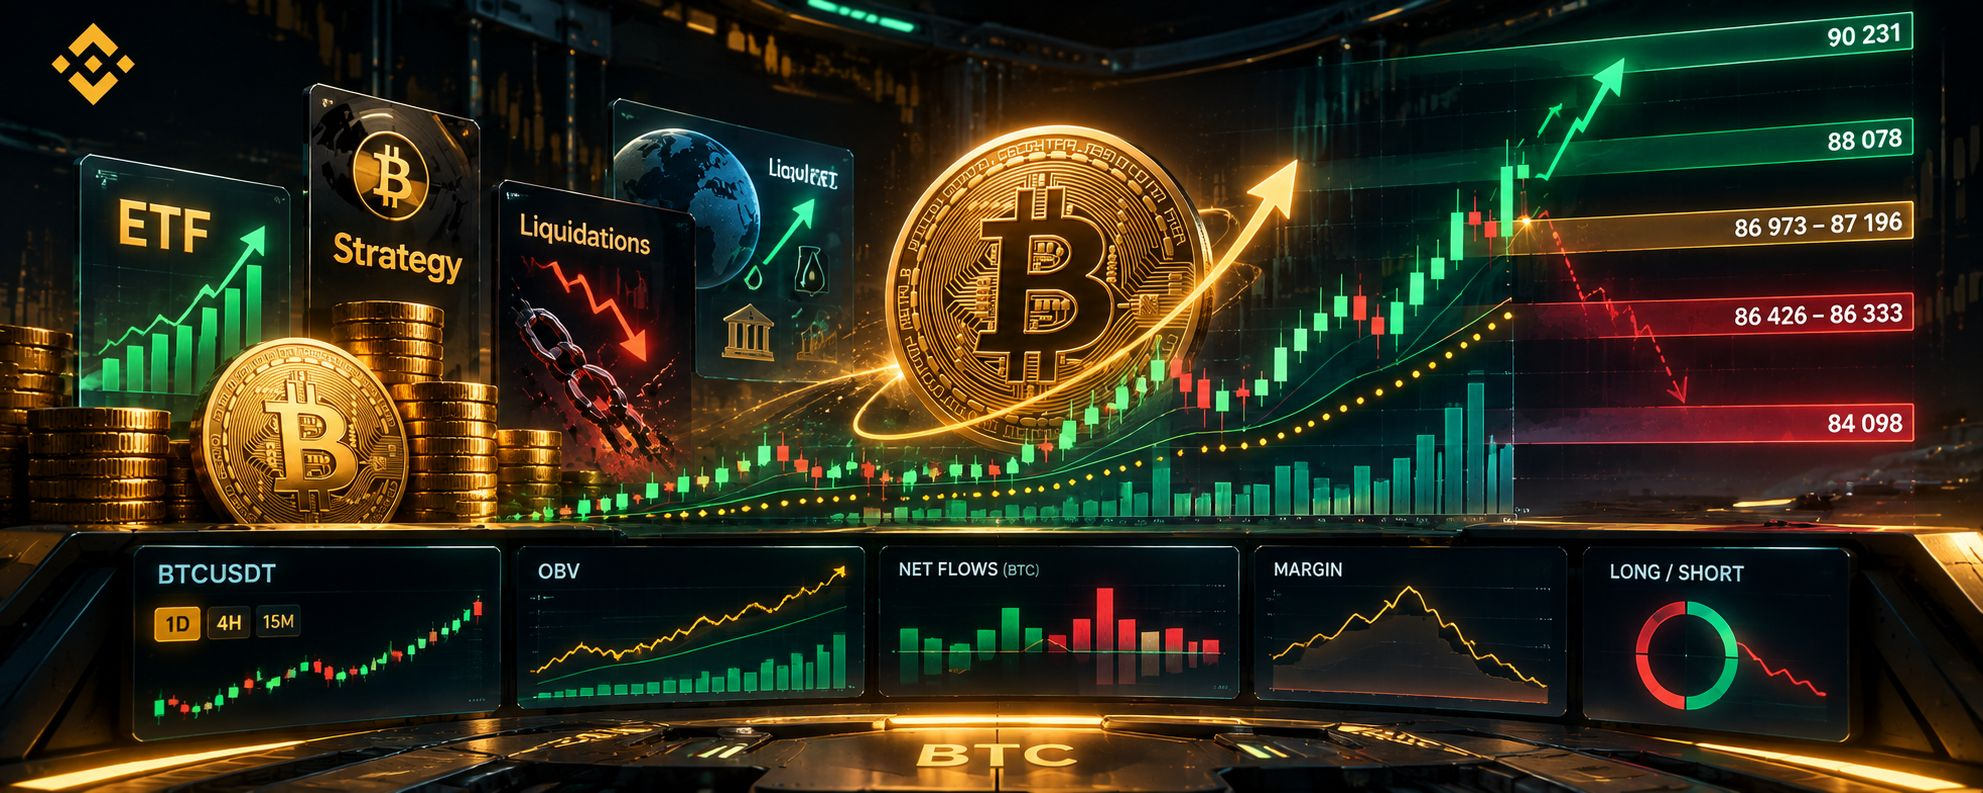
BTCUSDT: what’s behind the sharp rally and where the price is nowGreetings, dear friends!
Today I’m looking at #BTCUSDT across several timeframes at once. After such a move, it’s important not just to see the price rising, but to understand how it looks on the daily, 4H, and 15M charts—where the nearest levels are and what’s happening with volume, flows, and positioning.
BTCUSDT: what’s behind the sharp rally and where the price is now
Greetings, dear friends!
Today I’m looking at #BTCUSDT across several timeframes at once. After such a move, it’s important not just to see the price rising, but to understand how it looks on the daily, 4H, and 15M charts—where the nearest levels are and what’s happening with volume, flows, and positioning.
Today I’m looking at #BTCUSDT across several timeframes at once. After such a move, it’s important not just to see the price rising, but to understand how it looks on the daily, 4H, and 15M charts—where the nearest levels are and what’s happening with volume, flows, and positioning.
917
·
--

Article
ZECUSDT: what the structure shows after the impulseGreetings, dear friends!
Today I'm analyzing #ZECUSDT on three timeframes at once to understand what happens to the price after a strong impulse. For me, it's important here not just to list indicator values, but to show how I read their position relative to the price.
I'll start with the daily chart. The price is above AVL 1 484,55. So right now I'm using AVL as the nearest reference point to assess the price position: as long as the market stays above this line, the price maintains its position above AVL. If the price goes below and consolidates under it, that will be a sign to me that the current structure is weakening.
ZECUSDT: what the structure shows after the impulse
Greetings, dear friends!
Today I'm analyzing #ZECUSDT on three timeframes at once to understand what happens to the price after a strong impulse. For me, it's important here not just to list indicator values, but to show how I read their position relative to the price.
I'll start with the daily chart. The price is above AVL 1 484,55. So right now I'm using AVL as the nearest reference point to assess the price position: as long as the market stays above this line, the price maintains its position above AVL. If the price goes below and consolidates under it, that will be a sign to me that the current structure is weakening.
Today I'm analyzing #ZECUSDT on three timeframes at once to understand what happens to the price after a strong impulse. For me, it's important here not just to list indicator values, but to show how I read their position relative to the price.
I'll start with the daily chart. The price is above AVL 1 484,55. So right now I'm using AVL as the nearest reference point to assess the price position: as long as the market stays above this line, the price maintains its position above AVL. If the price goes below and consolidates under it, that will be a sign to me that the current structure is weakening.
2
1.4k
·
--
Article
$BTC: 87 000 is becoming the main control zoneGreetings, dear friends!
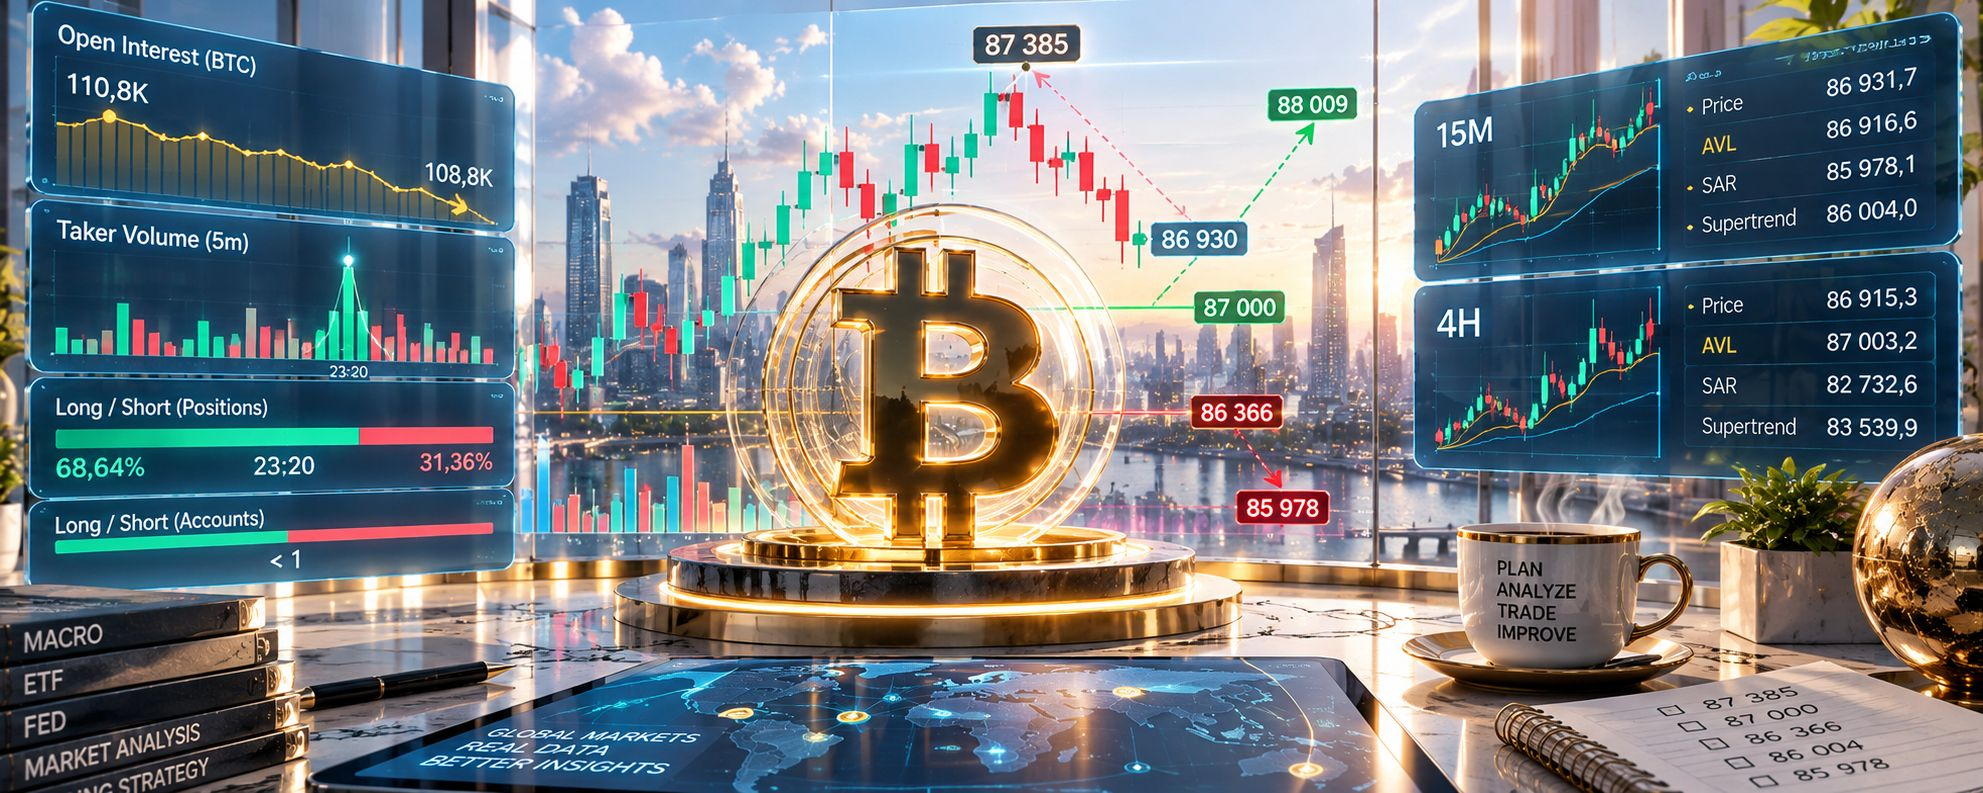
Right now $BTC is around 86 930 USDT, and the local peak on the chart is 87 385 USDT.
The main detail from the latest data: the price is rising, but over the displayed segment the open interest decreased from approximately 110.8 to 108.8 thousand BTC. That is, the price increase is accompanied by a reduction in the total number of open futures positions. From one OI alone, you cannot determine which specific positions were closed.
$BTC: 87 000 is becoming the main control zone
Greetings, dear friends!
Right now $BTC is around 86 930 USDT, and the local peak on the chart is 87 385 USDT.
The main detail from the latest data: the price is rising, but over the displayed segment the open interest decreased from approximately 110.8 to 108.8 thousand BTC. That is, the price increase is accompanied by a reduction in the total number of open futures positions. From one OI alone, you cannot determine which specific positions were closed.
Right now $BTC is around 86 930 USDT, and the local peak on the chart is 87 385 USDT.
The main detail from the latest data: the price is rising, but over the displayed segment the open interest decreased from approximately 110.8 to 108.8 thousand BTC. That is, the price increase is accompanied by a reduction in the total number of open futures positions. From one OI alone, you cannot determine which specific positions were closed.
1
1.5k
·
--
Partly True

Article
$BTC: after a surge to 85,300, the price rolled back from the local highGreetings, dear friends!
Today the chart by $BTC has noticeably changed compared to the previous analysis. At the time the data was captured, BTCUSDT was around 84,188 USDT, with a 24-hour change of approximately +4.77%. During the move, the price reached 85,299.87 USDT, after which a pullback began.
$BTC: after a surge to 85,300, the price rolled back from the local high
Greetings, dear friends!
Today the chart by $BTC has noticeably changed compared to the previous analysis. At the time the data was captured, BTCUSDT was around 84,188 USDT, with a 24-hour change of approximately +4.77%. During the move, the price reached 85,299.87 USDT, after which a pullback began.
Today the chart by $BTC has noticeably changed compared to the previous analysis. At the time the data was captured, BTCUSDT was around 84,188 USDT, with a 24-hour change of approximately +4.77%. During the move, the price reached 85,299.87 USDT, after which a pullback began.
526
Log in to explore more content
Join global crypto users on Binance Square
⚡️ Get latest and useful information about crypto.
💬 Trusted by the world’s largest crypto exchange.
👍 Discover real insights from verified creators.
Email / Phone number