

CryptoTradeMask
9.8k Posts

CryptoTradeMask
Report
Block User
Cryptocurrency market news, financial reviews, courses and training, all about cryptocurrencies and blockchain | 📊Technical analyses, Trading Strategy | 🦈
Open Trade
High-Frequency Trader
8.3 Years
233 Following
1.8K+ Followers
12.2K+ Liked
Posts
Portfolio
All
Quotes
Videos
PINNED
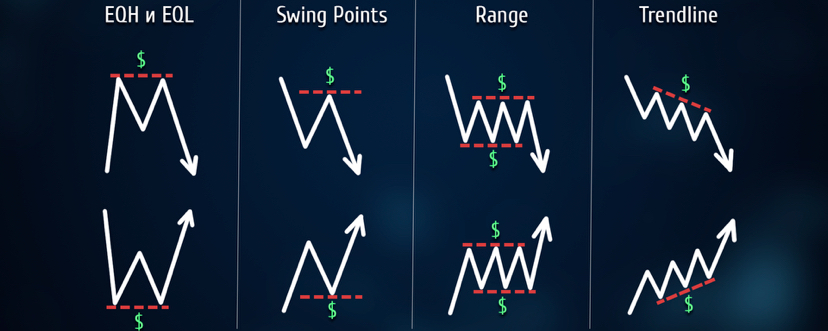
Article
"What the Charts Don't Tell You: The Secret Language of Oscillators, Liquidity, and Smart Money"This is a detailed guide on advanced tools and market mechanics. If you've already outgrown basic technical analysis (like simple trend lines or basic moving averages), these four sections will help you peek behind the price chart and understand what actually drives the price action.
"What the Charts Don't Tell You: The Secret Language of Oscillators, Liquidity, and Smart Money"
This is a detailed guide on advanced tools and market mechanics. If you've already outgrown basic technical analysis (like simple trend lines or basic moving averages), these four sections will help you peek behind the price chart and understand what actually drives the price action.
1
145
PINNED

Article
📖Encyclopedia of Modern Trading: From Smart Money Concepts to Quantum Algorithms📊Trading is not just about buying and selling. It is an intellectual war where each participant uses their weapon: from classical geometry to artificial intelligence. In this article, we will analyze the complete map of methods that shape financial markets.
🧠 I. CONCEPTUAL METHODS: How professionals think
📖Encyclopedia of Modern Trading: From Smart Money Concepts to Quantum Algorithms📊
Trading is not just about buying and selling. It is an intellectual war where each participant uses their weapon: from classical geometry to artificial intelligence. In this article, we will analyze the complete map of methods that shape financial markets.
🧠 I. CONCEPTUAL METHODS: How professionals think
🧠 I. CONCEPTUAL METHODS: How professionals think
10
3
41
414
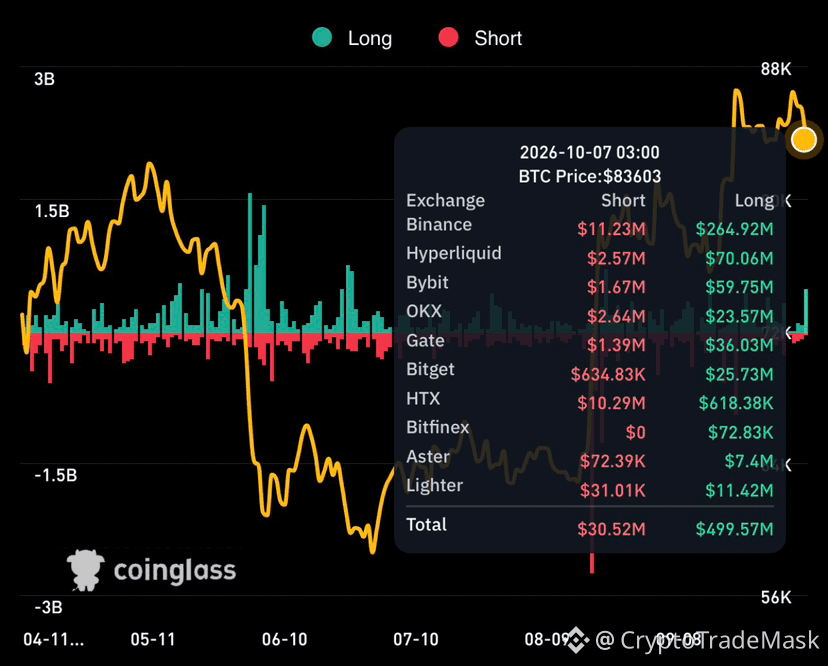
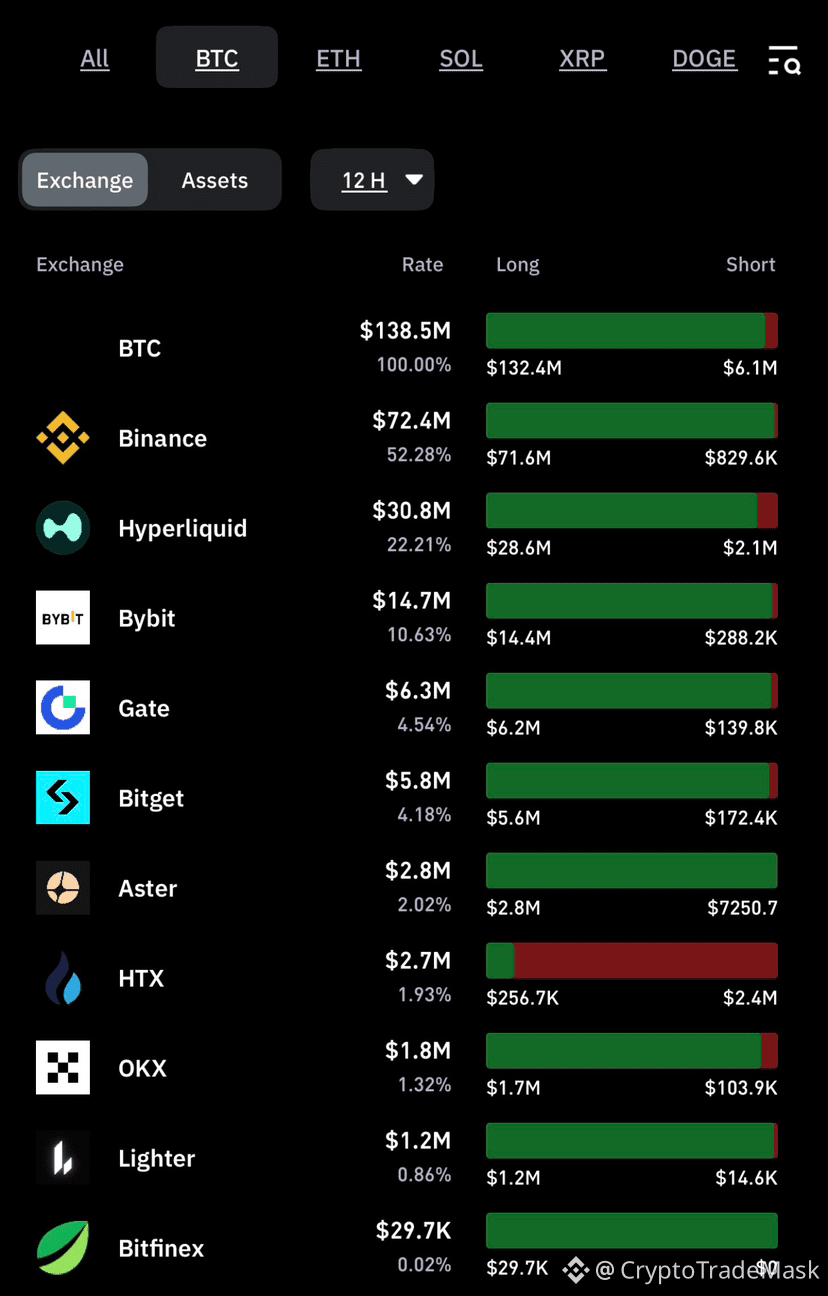
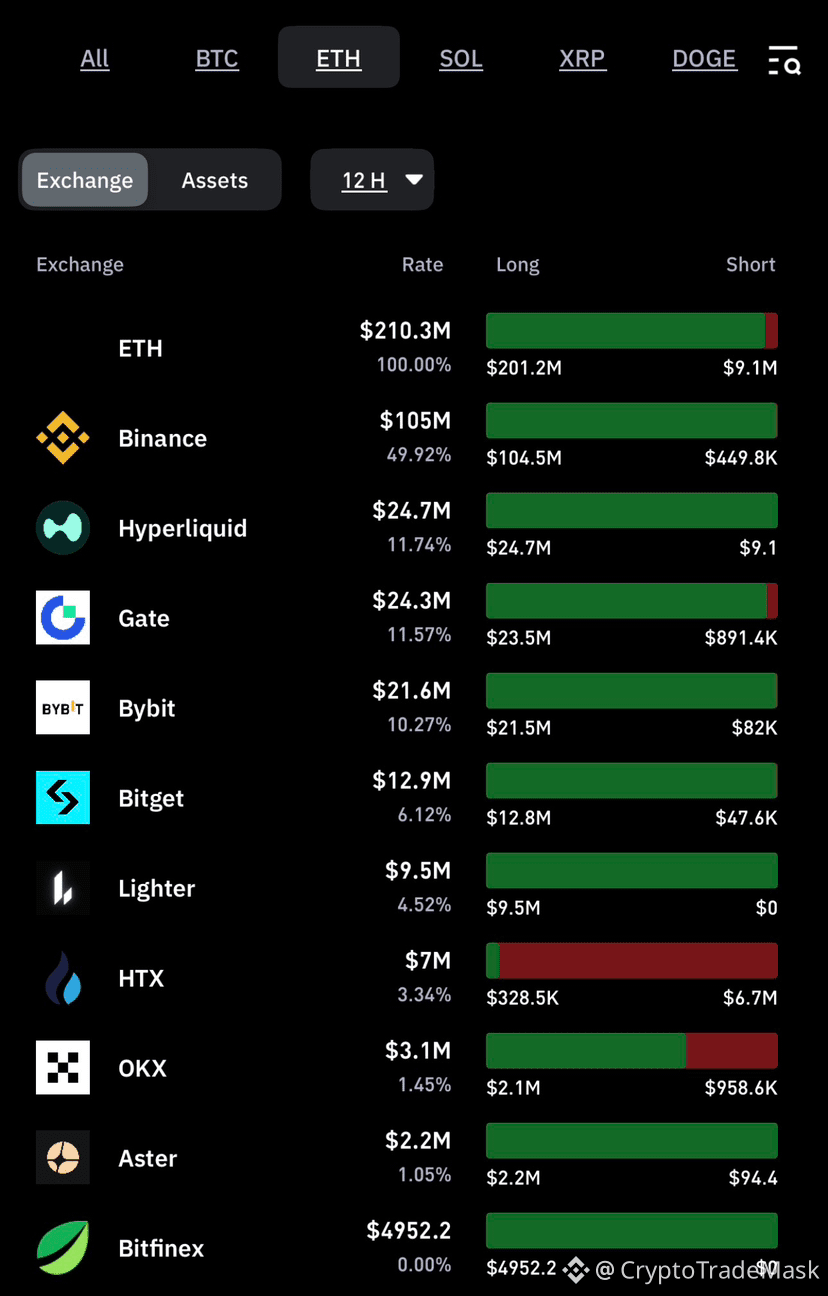
🚨 $500M #long vs $30M #short
The imbalance at $BTC right now is absolutely insane.
Binance: $265M Long / $11M Short
Hyperliquid: $70M / $2.6M
Bybit: $60M / $1.7M
Total: $499.6M Long vs. $30.5M Short.
The market is almost unanimously betting on a rise.
And when everyone is in the same boat, all it takes is one sharp move down to trigger a cascade of liquidations. 👀
{future}(ETHUSDT)
{future}(BTCUSDT)
🚨 $500M #long vs $30M #short
The imbalance at $BTC right now is absolutely insane.
Binance: $265M Long / $11M Short
Hyperliquid: $70M / $2.6M
Bybit: $60M / $1.7M
Total: $499.6M Long vs. $30.5M Short.
The market is almost unanimously betting on a rise.
And when everyone is in the same boat, all it takes is one sharp move down to trigger a cascade of liquidations. 👀
The imbalance at $BTC right now is absolutely insane.
Binance: $265M Long / $11M Short
Hyperliquid: $70M / $2.6M
Bybit: $60M / $1.7M
Total: $499.6M Long vs. $30.5M Short.
The market is almost unanimously betting on a rise.
And when everyone is in the same boat, all it takes is one sharp move down to trigger a cascade of liquidations. 👀
56
#Redworks
🚨 Radworks ($RAD ) Analysis: Is It Worth the Risk?
While some projects are showing rapid growth, Radworks ($RAD ) is sending investors several strong warning signals. Here are three key risks to consider before buying the asset:
🚨 1. Total Uncertainty Regarding Token Utility
Speculative Value: RAD functions primarily as a governance and seed token to fund developers within the Radicle network.
Lack of Demand: The token lacks clear utility in the near term. Network usage does not generate direct demand for RAD, making its value purely speculative.
🚨 2. Extreme Concentration and Delisting Risk
41% of Tokens Locked: A large portion of the supply sits in a "risk zone" with potential for future unlocking.
Whale Dominance: Just 10 wallets control over 76.8% of all tokens.
Loss of Liquidity: Major exchanges are already dropping the token (e.g., delisting from Bitget in 2025). This creates a threat of further market isolation for the token.
🚨 3. Declining Activity and Unprofitability
Ecosystem Decline: Trading volume dropped by another 33.8% in 2026, continuing the negative trend. Capital outflow: Total Value Locked (TVL) has dropped to $22.1 million (across 236 deployments). RAD is losing market share, while developers and investors are gradually shifting to more profitable ecosystems.
⚠️ Summary
Radworks is an example of a token whose value relies on outdated expectations rather than actual economic metrics. High concentration among "whales," declining volumes, and the risk of further delistings make it extremely risky for long-term investment.
{spot}(RADUSDT)
#Redworks
🚨 Radworks ($RAD ) Analysis: Is It Worth the Risk?
While some projects are showing rapid growth, Radworks ($RAD ) is sending investors several strong warning signals. Here are three key risks to consider before buying the asset:
🚨 1. Total Uncertainty Regarding Token Utility
Speculative Value: RAD functions primarily as a governance and seed token to fund developers within the Radicle network.
Lack of Demand: The token lacks clear utility in the near term. Network usage does not generate direct demand for RAD, making its value purely speculative.
🚨 2. Extreme Concentration and Delisting Risk
41% of Tokens Locked: A large portion of the supply sits in a "risk zone" with potential for future unlocking.
Whale Dominance: Just 10 wallets control over 76.8% of all tokens.
Loss of Liquidity: Major exchanges are already dropping the token (e.g., delisting from Bitget in 2025). This creates a threat of further market isolation for the token.
🚨 3. Declining Activity and Unprofitability
Ecosystem Decline: Trading volume dropped by another 33.8% in 2026, continuing the negative trend. Capital outflow: Total Value Locked (TVL) has dropped to $22.1 million (across 236 deployments). RAD is losing market share, while developers and investors are gradually shifting to more profitable ecosystems.
⚠️ Summary
Radworks is an example of a token whose value relies on outdated expectations rather than actual economic metrics. High concentration among "whales," declining volumes, and the risk of further delistings make it extremely risky for long-term investment.
🚨 Radworks ($RAD ) Analysis: Is It Worth the Risk?
While some projects are showing rapid growth, Radworks ($RAD ) is sending investors several strong warning signals. Here are three key risks to consider before buying the asset:
🚨 1. Total Uncertainty Regarding Token Utility
Speculative Value: RAD functions primarily as a governance and seed token to fund developers within the Radicle network.
Lack of Demand: The token lacks clear utility in the near term. Network usage does not generate direct demand for RAD, making its value purely speculative.
🚨 2. Extreme Concentration and Delisting Risk
41% of Tokens Locked: A large portion of the supply sits in a "risk zone" with potential for future unlocking.
Whale Dominance: Just 10 wallets control over 76.8% of all tokens.
Loss of Liquidity: Major exchanges are already dropping the token (e.g., delisting from Bitget in 2025). This creates a threat of further market isolation for the token.
🚨 3. Declining Activity and Unprofitability
Ecosystem Decline: Trading volume dropped by another 33.8% in 2026, continuing the negative trend. Capital outflow: Total Value Locked (TVL) has dropped to $22.1 million (across 236 deployments). RAD is losing market share, while developers and investors are gradually shifting to more profitable ecosystems.
⚠️ Summary
Radworks is an example of a token whose value relies on outdated expectations rather than actual economic metrics. High concentration among "whales," declining volumes, and the risk of further delistings make it extremely risky for long-term investment.

1
47
#MAGIC
📊 Market Analysis: Treasure ($MAGIC )
Over the past 24 hours, $MAGIC has shown moderate growth (+4.74% to $0.0653), yet far more interesting developments are unfolding beneath the surface.
🔥 Key Factors and Anomalies
Trading Volume Surge (+432%): Daily trading volume jumped to $42.67 million. The volume-to-market-cap ratio (1.94) indicates extremely high activity among speculators and short-term traders.
Mixed Altcoin Backdrop: While Bitcoin is rising (+2.67%), the gaming token market and the Treasure ecosystem are showing mixed performance. For instance, MOBOX (MBOX) surged 84%, while the overall Fear & Greed Index remains in the "Greed" zone (62/100).
📉 Key Technical Levels
Current Price: $0.0653
Immediate Resistance: $0.068 – $0.070 (key local liquidity zone).
Support Level: $0.060 (protects against a deeper correction).
🚦 What Does This Mean for Traders?
🟢 Bullish Scenario: Establishing a position above $0.068 would pave the way for a momentum-driven rally.
🔴 Bearish Scenario: If Bitcoin undergoes a correction (e.g., towards $83,000), MAGIC risks testing the $0.060 level.
⚠️ Conclusion: The $MAGIC market is experiencing heightened volatility. High trading volume presents good trading opportunities; however, it is important to closely monitor price action near resistance levels over the next 24–48 hours.
{future}(MAGICUSDT)
#MAGIC
📊 Market Analysis: Treasure ($MAGIC )
Over the past 24 hours, $MAGIC has shown moderate growth (+4.74% to $0.0653), yet far more interesting developments are unfolding beneath the surface.
🔥 Key Factors and Anomalies
Trading Volume Surge (+432%): Daily trading volume jumped to $42.67 million. The volume-to-market-cap ratio (1.94) indicates extremely high activity among speculators and short-term traders.
Mixed Altcoin Backdrop: While Bitcoin is rising (+2.67%), the gaming token market and the Treasure ecosystem are showing mixed performance. For instance, MOBOX (MBOX) surged 84%, while the overall Fear & Greed Index remains in the "Greed" zone (62/100).
📉 Key Technical Levels
Current Price: $0.0653
Immediate Resistance: $0.068 – $0.070 (key local liquidity zone).
Support Level: $0.060 (protects against a deeper correction).
🚦 What Does This Mean for Traders?
🟢 Bullish Scenario: Establishing a position above $0.068 would pave the way for a momentum-driven rally.
🔴 Bearish Scenario: If Bitcoin undergoes a correction (e.g., towards $83,000), MAGIC risks testing the $0.060 level.
⚠️ Conclusion: The $MAGIC market is experiencing heightened volatility. High trading volume presents good trading opportunities; however, it is important to closely monitor price action near resistance levels over the next 24–48 hours.
📊 Market Analysis: Treasure ($MAGIC )
Over the past 24 hours, $MAGIC has shown moderate growth (+4.74% to $0.0653), yet far more interesting developments are unfolding beneath the surface.
🔥 Key Factors and Anomalies
Trading Volume Surge (+432%): Daily trading volume jumped to $42.67 million. The volume-to-market-cap ratio (1.94) indicates extremely high activity among speculators and short-term traders.
Mixed Altcoin Backdrop: While Bitcoin is rising (+2.67%), the gaming token market and the Treasure ecosystem are showing mixed performance. For instance, MOBOX (MBOX) surged 84%, while the overall Fear & Greed Index remains in the "Greed" zone (62/100).
📉 Key Technical Levels
Current Price: $0.0653
Immediate Resistance: $0.068 – $0.070 (key local liquidity zone).
Support Level: $0.060 (protects against a deeper correction).
🚦 What Does This Mean for Traders?
🟢 Bullish Scenario: Establishing a position above $0.068 would pave the way for a momentum-driven rally.
🔴 Bearish Scenario: If Bitcoin undergoes a correction (e.g., towards $83,000), MAGIC risks testing the $0.060 level.
⚠️ Conclusion: The $MAGIC market is experiencing heightened volatility. High trading volume presents good trading opportunities; however, it is important to closely monitor price action near resistance levels over the next 24–48 hours.

24
#etf
📊 Bitcoin ETFs See Renewed Inflows While Ethereum Continues to Lose Capital
Despite a short-term drop in BTC prices, institutional investors are once again buying the dip, whereas Ether funds have recorded outflows for six consecutive sessions.
📊 Key takeaways from SoSoValue and CoinGecko reports:
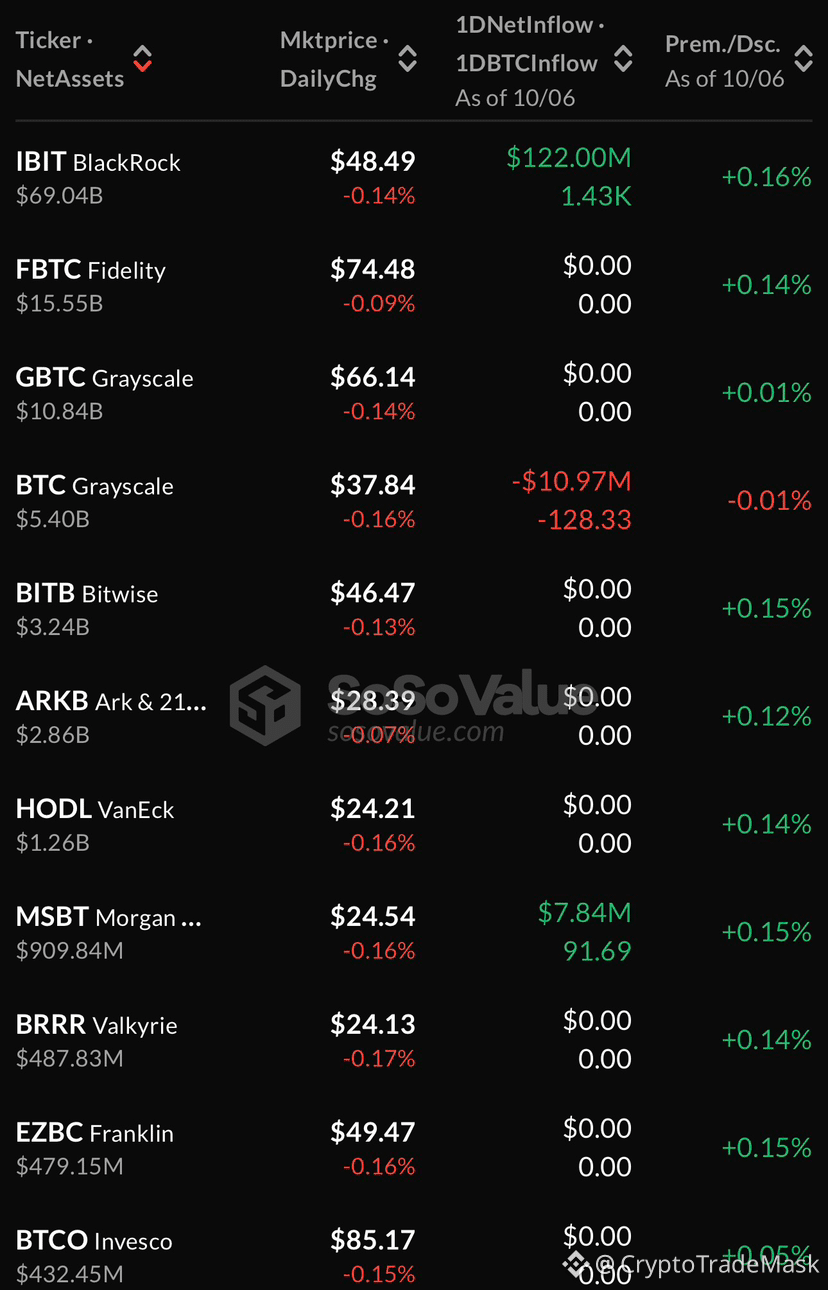
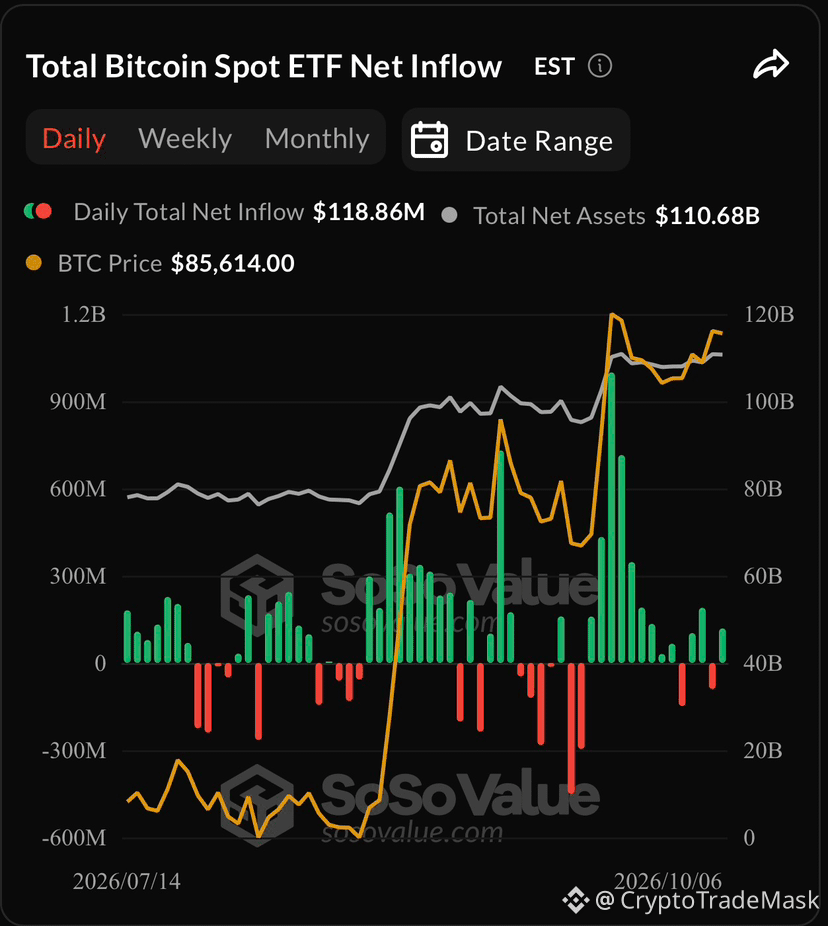
🟢 #bitcoin ETFs: Returned to positive territory, recording +$119 million in net inflows on Tuesday (following a $90 million outflow on Monday).
📉 $BTC Price: Dropped from $86,600 to ~$83,971 (-2.1% over the last 24 hours).
🔴 #Ethereum ETFs: Lost $202 million in a single day. Total outflows over the last six sessions reached $408 million.
⚖️ Other Altcoins: $XRP ETFs attracted +$3.1 million, while Solana ETFs saw outflows of -$3.7 million.
⚠️ What do analysts say?
According to CryptoQuant, Bitcoin's recovery has encountered a wave of profit-taking, as the current price is significantly higher than the average purchase price of active traders ($68,900). Future market movement will depend on whether new demand can absorb this selling pressure.
{future}(ETHUSDT)
{future}(XRPUSDT)
{future}(BTCUSDT)
#etf
📊 Bitcoin ETFs See Renewed Inflows While Ethereum Continues to Lose Capital
Despite a short-term drop in BTC prices, institutional investors are once again buying the dip, whereas Ether funds have recorded outflows for six consecutive sessions.
📊 Key takeaways from SoSoValue and CoinGecko reports:
🟢 #bitcoin ETFs: Returned to positive territory, recording +$119 million in net inflows on Tuesday (following a $90 million outflow on Monday).
📉 $BTC Price: Dropped from $86,600 to ~$83,971 (-2.1% over the last 24 hours).
🔴 #Ethereum ETFs: Lost $202 million in a single day. Total outflows over the last six sessions reached $408 million.
⚖️ Other Altcoins: $XRP ETFs attracted +$3.1 million, while Solana ETFs saw outflows of -$3.7 million.
⚠️ What do analysts say?
According to CryptoQuant, Bitcoin's recovery has encountered a wave of profit-taking, as the current price is significantly higher than the average purchase price of active traders ($68,900). Future market movement will depend on whether new demand can absorb this selling pressure.
📊 Bitcoin ETFs See Renewed Inflows While Ethereum Continues to Lose Capital
Despite a short-term drop in BTC prices, institutional investors are once again buying the dip, whereas Ether funds have recorded outflows for six consecutive sessions.
📊 Key takeaways from SoSoValue and CoinGecko reports:
🟢 #bitcoin ETFs: Returned to positive territory, recording +$119 million in net inflows on Tuesday (following a $90 million outflow on Monday).
📉 $BTC Price: Dropped from $86,600 to ~$83,971 (-2.1% over the last 24 hours).
🔴 #Ethereum ETFs: Lost $202 million in a single day. Total outflows over the last six sessions reached $408 million.
⚖️ Other Altcoins: $XRP ETFs attracted +$3.1 million, while Solana ETFs saw outflows of -$3.7 million.
⚠️ What do analysts say?
According to CryptoQuant, Bitcoin's recovery has encountered a wave of profit-taking, as the current price is significantly higher than the average purchase price of active traders ($68,900). Future market movement will depend on whether new demand can absorb this selling pressure.
87
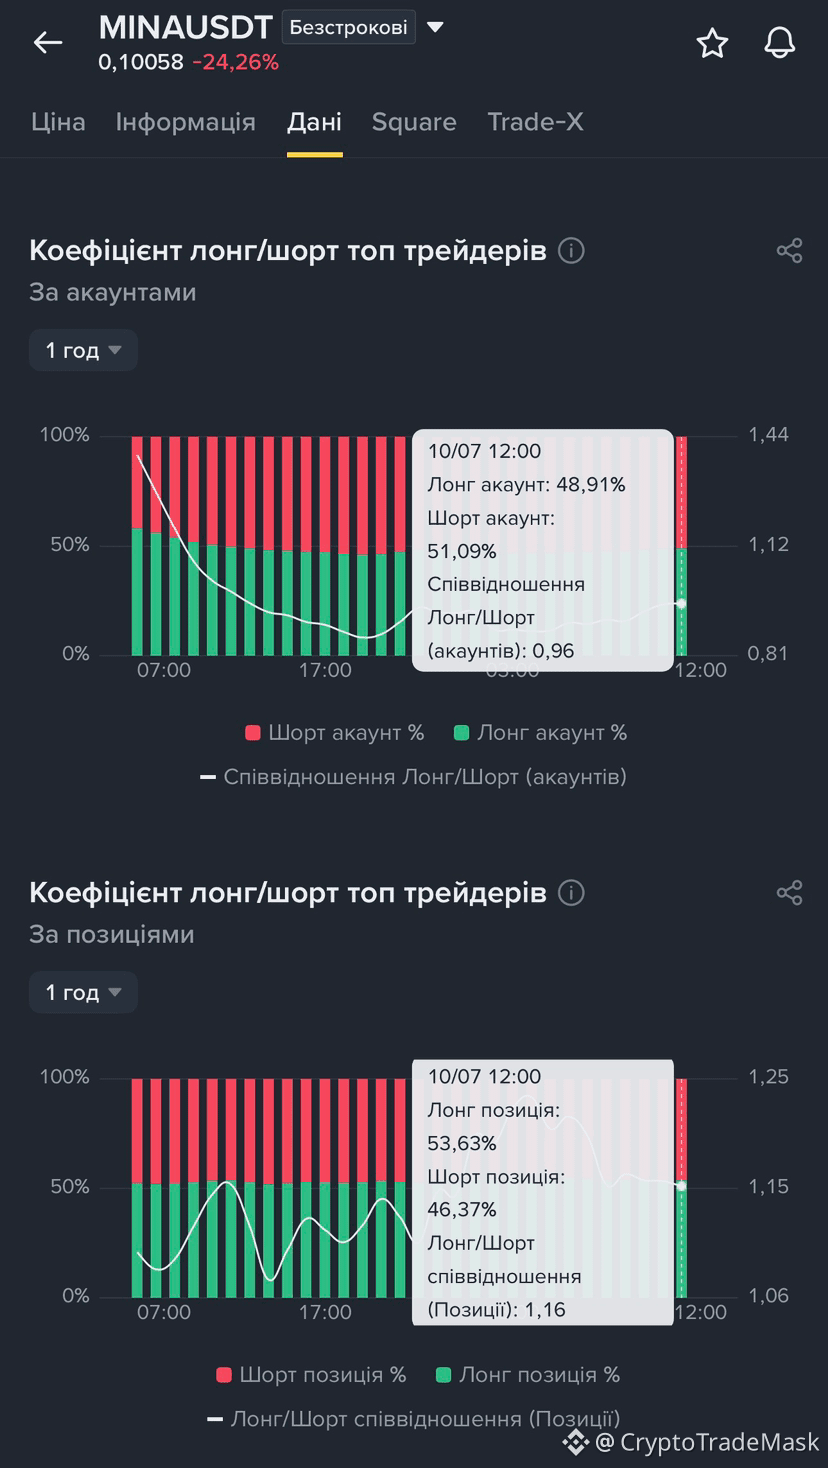
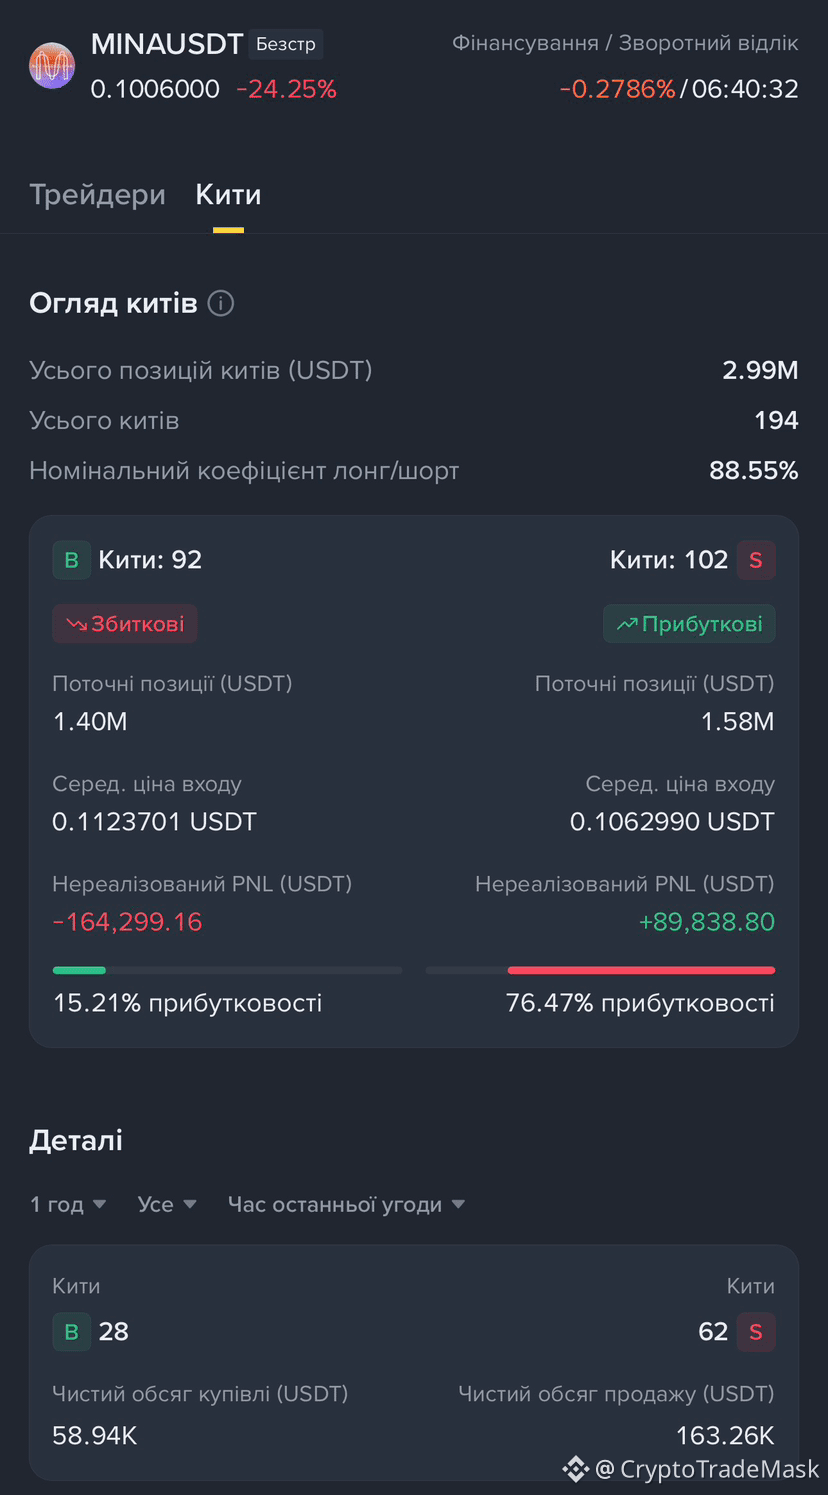
🚀 $MINA /USDT: Potential Short Squeeze Amidst Extreme Funding Rates
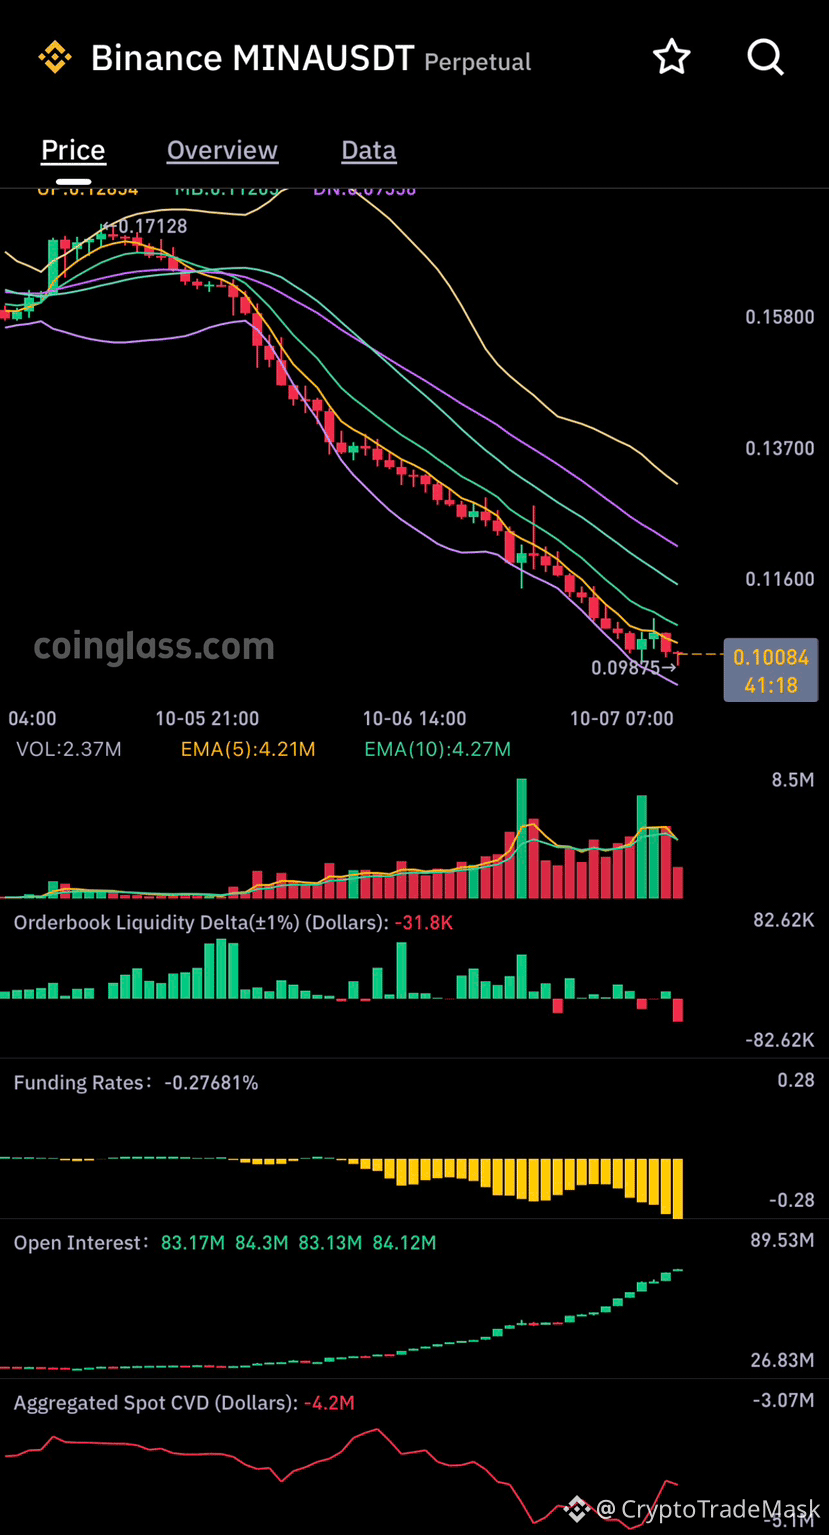
MINA has dropped 24.26%, hitting the $0.10058 mark. Current data points to a high probability of a local rebound:
📊 Key Factors:
Deeply negative funding (-0.2768%): The market is overloaded with short positions, for which traders are paying high fees.
Rising OI: Open Interest has climbed to $89.5M, indicating short accumulation at the lows.
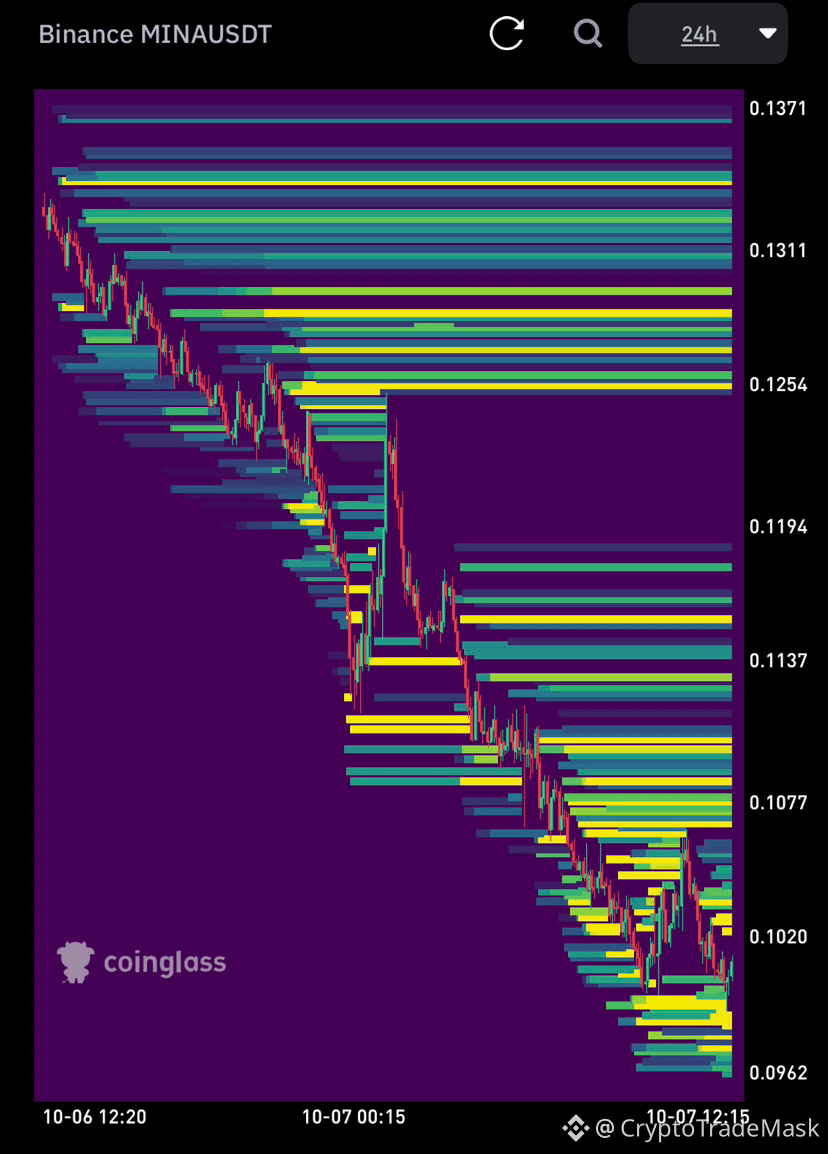
Liquidity overhead: Major clusters of short liquidations are located in the $0.1137 – $0.1254 range.
🟢 Setup (Counter-trend Long):
Entry: $0.0980 – $0.1005
Stop Loss: $0.0955
Take-Profit: $0.1077 / $0.1137 / $0.1254
⚠️ The market is highly volatile. Practice proper risk management and make sure to set stop-loss orders!
{future}(MINAUSDT)
🚀 $MINA /USDT: Potential Short Squeeze Amidst Extreme Funding Rates
MINA has dropped 24.26%, hitting the $0.10058 mark. Current data points to a high probability of a local rebound:
📊 Key Factors:
Deeply negative funding (-0.2768%): The market is overloaded with short positions, for which traders are paying high fees.
Rising OI: Open Interest has climbed to $89.5M, indicating short accumulation at the lows.
Liquidity overhead: Major clusters of short liquidations are located in the $0.1137 – $0.1254 range.
🟢 Setup (Counter-trend Long):
Entry: $0.0980 – $0.1005
Stop Loss: $0.0955
Take-Profit: $0.1077 / $0.1137 / $0.1254
⚠️ The market is highly volatile. Practice proper risk management and make sure to set stop-loss orders!
MINA has dropped 24.26%, hitting the $0.10058 mark. Current data points to a high probability of a local rebound:
📊 Key Factors:
Deeply negative funding (-0.2768%): The market is overloaded with short positions, for which traders are paying high fees.
Rising OI: Open Interest has climbed to $89.5M, indicating short accumulation at the lows.
Liquidity overhead: Major clusters of short liquidations are located in the $0.1137 – $0.1254 range.
🟢 Setup (Counter-trend Long):
Entry: $0.0980 – $0.1005
Stop Loss: $0.0955
Take-Profit: $0.1077 / $0.1137 / $0.1254
⚠️ The market is highly volatile. Practice proper risk management and make sure to set stop-loss orders!
87
#ORCA
Orca ($ORCA ): Rapid growth amidst an overheated market
Over the past 24 hours, the Orca ($ORCA ) token has posted impressive gains of 5.94%, reaching the $2.84 mark. This occurs while Bitcoin has risen by only 2.3%. Despite a generally cautious market sentiment, aggressive trading volumes are driving the token's price upward.
🔑 Key analysis points:
📈 Trading momentum: Trading volume (per CMC) surged by 141.61% (to $381.44 million). Orca is demonstrating significantly stronger momentum than the broader market.
📊 Technical overheating: The Relative Strength Index (RSI14) has hit 89.28. This signals that the token is heavily overbought and faces a high risk of a near-term correction. The accompanying MACD indicator (0.1241) continues to confirm the uptrend.
🎯 Key levels:
Support: $2.50 (38.2% Fibonacci level). If the price drops below this, the next target is the 7-day moving average at $2.08.
Resistance: If momentum holds, the price has the potential to reach the $3.24 mark.
📅 Event to watch
The FOMC meeting is coming up in 7 days. Its results could significantly impact the broader crypto market and set a new direction for macroeconomic expectations.
⚠️ Summary: $ORCA is showing strong upward momentum, though an extremely high RSI signals a potential for profit-taking by traders.
{future}(ORCAUSDT)
#ORCA
Orca ($ORCA ): Rapid growth amidst an overheated market
Over the past 24 hours, the Orca ($ORCA ) token has posted impressive gains of 5.94%, reaching the $2.84 mark. This occurs while Bitcoin has risen by only 2.3%. Despite a generally cautious market sentiment, aggressive trading volumes are driving the token's price upward.
🔑 Key analysis points:
📈 Trading momentum: Trading volume (per CMC) surged by 141.61% (to $381.44 million). Orca is demonstrating significantly stronger momentum than the broader market.
📊 Technical overheating: The Relative Strength Index (RSI14) has hit 89.28. This signals that the token is heavily overbought and faces a high risk of a near-term correction. The accompanying MACD indicator (0.1241) continues to confirm the uptrend.
🎯 Key levels:
Support: $2.50 (38.2% Fibonacci level). If the price drops below this, the next target is the 7-day moving average at $2.08.
Resistance: If momentum holds, the price has the potential to reach the $3.24 mark.
📅 Event to watch
The FOMC meeting is coming up in 7 days. Its results could significantly impact the broader crypto market and set a new direction for macroeconomic expectations.
⚠️ Summary: $ORCA is showing strong upward momentum, though an extremely high RSI signals a potential for profit-taking by traders.
Orca ($ORCA ): Rapid growth amidst an overheated market
Over the past 24 hours, the Orca ($ORCA ) token has posted impressive gains of 5.94%, reaching the $2.84 mark. This occurs while Bitcoin has risen by only 2.3%. Despite a generally cautious market sentiment, aggressive trading volumes are driving the token's price upward.
🔑 Key analysis points:
📈 Trading momentum: Trading volume (per CMC) surged by 141.61% (to $381.44 million). Orca is demonstrating significantly stronger momentum than the broader market.
📊 Technical overheating: The Relative Strength Index (RSI14) has hit 89.28. This signals that the token is heavily overbought and faces a high risk of a near-term correction. The accompanying MACD indicator (0.1241) continues to confirm the uptrend.
🎯 Key levels:
Support: $2.50 (38.2% Fibonacci level). If the price drops below this, the next target is the 7-day moving average at $2.08.
Resistance: If momentum holds, the price has the potential to reach the $3.24 mark.
📅 Event to watch
The FOMC meeting is coming up in 7 days. Its results could significantly impact the broader crypto market and set a new direction for macroeconomic expectations.
⚠️ Summary: $ORCA is showing strong upward momentum, though an extremely high RSI signals a potential for profit-taking by traders.

98
#cryptotradingpro #BTC
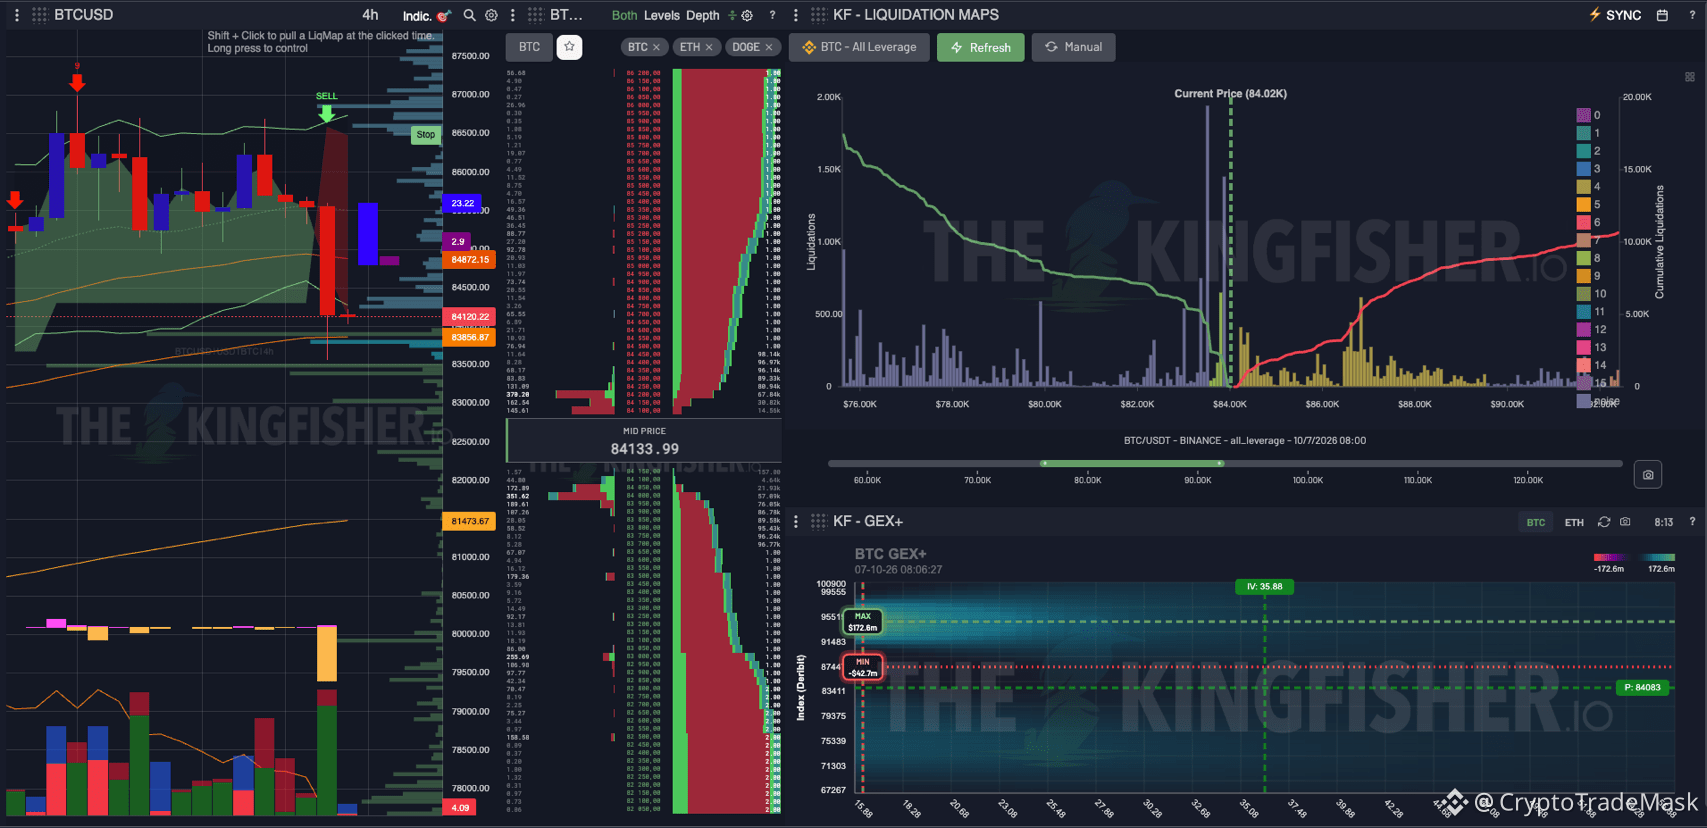
🚀 $BTC /USD Analysis (4H): Signals, Liquidity, and Key Levels
Bitcoin is trading around $84,100–$84,200 following an upward surge to a local high of ~$87,500 and a subsequent sharp pullback. A critical juncture is forming on the chart—let's break down the details:
1️⃣ Technical Outlook and Volume
Local Resistance: Sellers stepped in at the $87,000–$87,500 levels, triggering a red SELL signal.
High Liquidity Zone (POC): The bulk of trading volume is concentrated in the narrow $83,800–$84,500 range. This is precisely where the battle for market control is currently taking place.
2️⃣ Order Book and Liquidation Map (KF Maps)
Selling Pressure from Above: The order book shows a massive wall of limit sell orders (Asks) stretching from $84,500 to $87,000+.
Where is the liquidity?
Longs (Below): A cluster of stop-losses and long-position liquidations extends from $83,000 to $84,000.
Shorts (Above): A large pool of liquidation levels has accumulated in the $85,000–$88,000+ range. Options & GEX+: The key Maximum Exposure (MEX) zone is located at $91,728, while the nearest significant resistance based on the options profile is $87,441.
3️⃣ Potential movement scenarios
1. Long liquidity squeeze (Local sweep):
A quick spike down to the $82,500–$83,500 zone is possible to trigger buyers' stop-losses before a full-scale recovery begins.
2. Short squeeze (Bullish scenario):
If the price breaks and holds above $85,000, a cascade of short liquidations will be triggered, with potential targets at $87,440 and $90,000+.
⚠️ Summary: The market is squeezed between two large liquidation pools. The priority is to monitor the price reaction at the $83,500 and $85,000 levels while maintaining strict risk management.
{future}(BTCUSDT)
#cryptotradingpro #BTC
🚀 $BTC /USD Analysis (4H): Signals, Liquidity, and Key Levels
Bitcoin is trading around $84,100–$84,200 following an upward surge to a local high of ~$87,500 and a subsequent sharp pullback. A critical juncture is forming on the chart—let's break down the details:
1️⃣ Technical Outlook and Volume
Local Resistance: Sellers stepped in at the $87,000–$87,500 levels, triggering a red SELL signal.
High Liquidity Zone (POC): The bulk of trading volume is concentrated in the narrow $83,800–$84,500 range. This is precisely where the battle for market control is currently taking place.
2️⃣ Order Book and Liquidation Map (KF Maps)
Selling Pressure from Above: The order book shows a massive wall of limit sell orders (Asks) stretching from $84,500 to $87,000+.
Where is the liquidity?
Longs (Below): A cluster of stop-losses and long-position liquidations extends from $83,000 to $84,000.
Shorts (Above): A large pool of liquidation levels has accumulated in the $85,000–$88,000+ range. Options & GEX+: The key Maximum Exposure (MEX) zone is located at $91,728, while the nearest significant resistance based on the options profile is $87,441.
3️⃣ Potential movement scenarios
1. Long liquidity squeeze (Local sweep):
A quick spike down to the $82,500–$83,500 zone is possible to trigger buyers' stop-losses before a full-scale recovery begins.
2. Short squeeze (Bullish scenario):
If the price breaks and holds above $85,000, a cascade of short liquidations will be triggered, with potential targets at $87,440 and $90,000+.
⚠️ Summary: The market is squeezed between two large liquidation pools. The priority is to monitor the price reaction at the $83,500 and $85,000 levels while maintaining strict risk management.
🚀 $BTC /USD Analysis (4H): Signals, Liquidity, and Key Levels
Bitcoin is trading around $84,100–$84,200 following an upward surge to a local high of ~$87,500 and a subsequent sharp pullback. A critical juncture is forming on the chart—let's break down the details:
1️⃣ Technical Outlook and Volume
Local Resistance: Sellers stepped in at the $87,000–$87,500 levels, triggering a red SELL signal.
High Liquidity Zone (POC): The bulk of trading volume is concentrated in the narrow $83,800–$84,500 range. This is precisely where the battle for market control is currently taking place.
2️⃣ Order Book and Liquidation Map (KF Maps)
Selling Pressure from Above: The order book shows a massive wall of limit sell orders (Asks) stretching from $84,500 to $87,000+.
Where is the liquidity?
Longs (Below): A cluster of stop-losses and long-position liquidations extends from $83,000 to $84,000.
Shorts (Above): A large pool of liquidation levels has accumulated in the $85,000–$88,000+ range. Options & GEX+: The key Maximum Exposure (MEX) zone is located at $91,728, while the nearest significant resistance based on the options profile is $87,441.
3️⃣ Potential movement scenarios
1. Long liquidity squeeze (Local sweep):
A quick spike down to the $82,500–$83,500 zone is possible to trigger buyers' stop-losses before a full-scale recovery begins.
2. Short squeeze (Bullish scenario):
If the price breaks and holds above $85,000, a cascade of short liquidations will be triggered, with potential targets at $87,440 and $90,000+.
⚠️ Summary: The market is squeezed between two large liquidation pools. The priority is to monitor the price reaction at the $83,500 and $85,000 levels while maintaining strict risk management.
108
#TokenUnlock
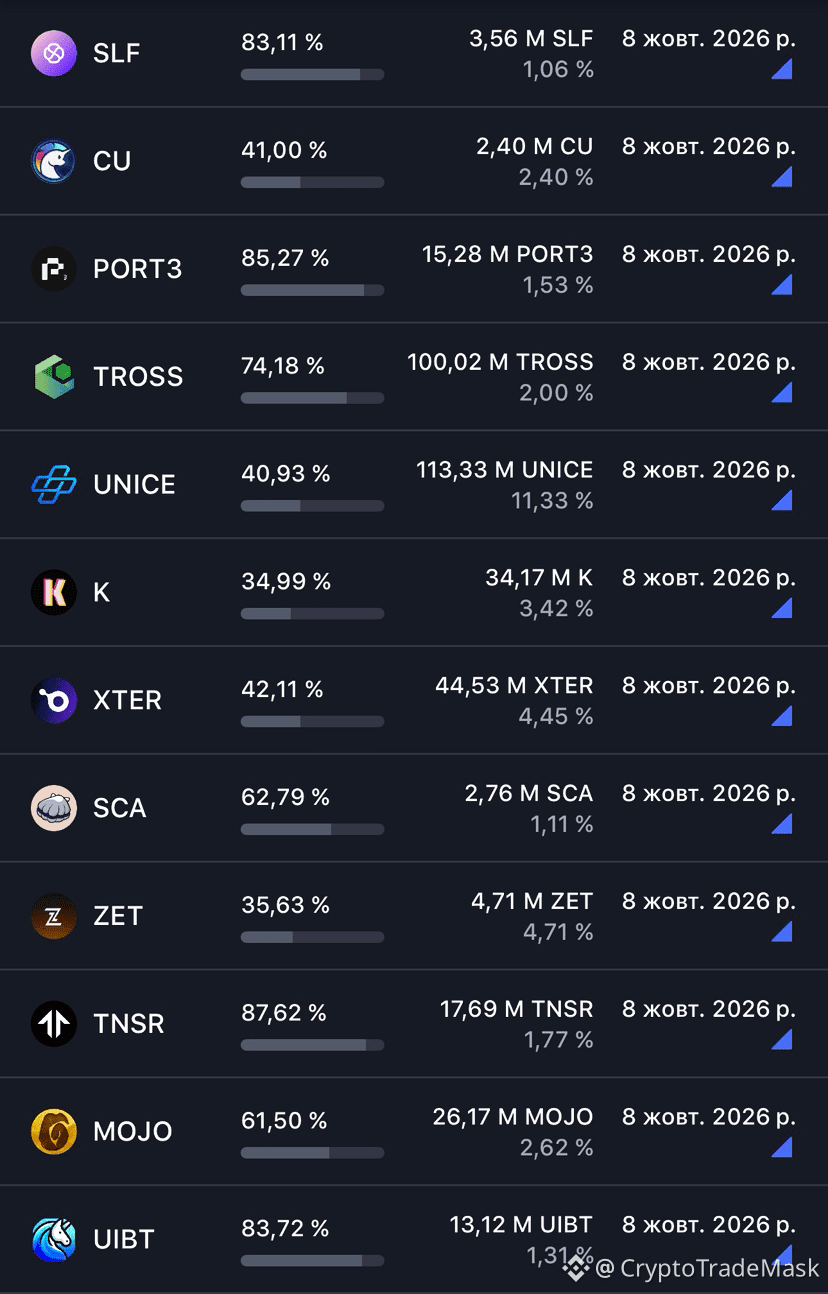
🔓 Token Unlocking – October 8 - 11, 2026 🔓
$ALLO $HOLO $TNSR
📌 What does this mean for the market?
✅ Supply growth – a new number of tokens enters free circulation.
⚖️ This can cause pressure on the price due to a possible excess supply.
📈 Investors are closely following the event, because unlocking sometimes opens up both new opportunities for accumulation and risks for short-term traders.
👀 Be prepared for increased volatility!
DYOR (Do Your Own Research) is always the right approach.
{future}(TNSRUSDT)
{future}(HOLOUSDT)
{future}(ALLOUSDT)
#TokenUnlock
🔓 Token Unlocking – October 8 - 11, 2026 🔓
$ALLO $HOLO $TNSR
📌 What does this mean for the market?
✅ Supply growth – a new number of tokens enters free circulation.
⚖️ This can cause pressure on the price due to a possible excess supply.
📈 Investors are closely following the event, because unlocking sometimes opens up both new opportunities for accumulation and risks for short-term traders.
👀 Be prepared for increased volatility!
DYOR (Do Your Own Research) is always the right approach.
🔓 Token Unlocking – October 8 - 11, 2026 🔓
$ALLO $HOLO $TNSR
📌 What does this mean for the market?
✅ Supply growth – a new number of tokens enters free circulation.
⚖️ This can cause pressure on the price due to a possible excess supply.
📈 Investors are closely following the event, because unlocking sometimes opens up both new opportunities for accumulation and risks for short-term traders.
👀 Be prepared for increased volatility!
DYOR (Do Your Own Research) is always the right approach.
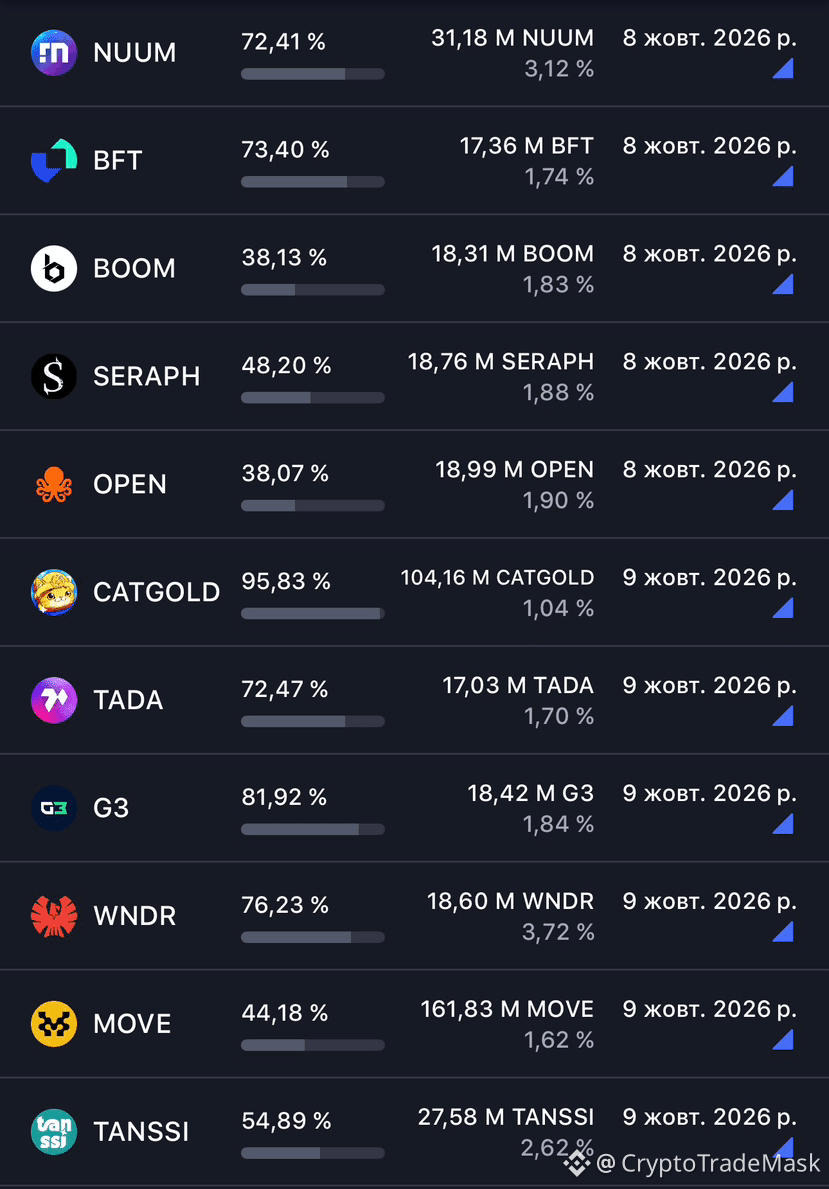
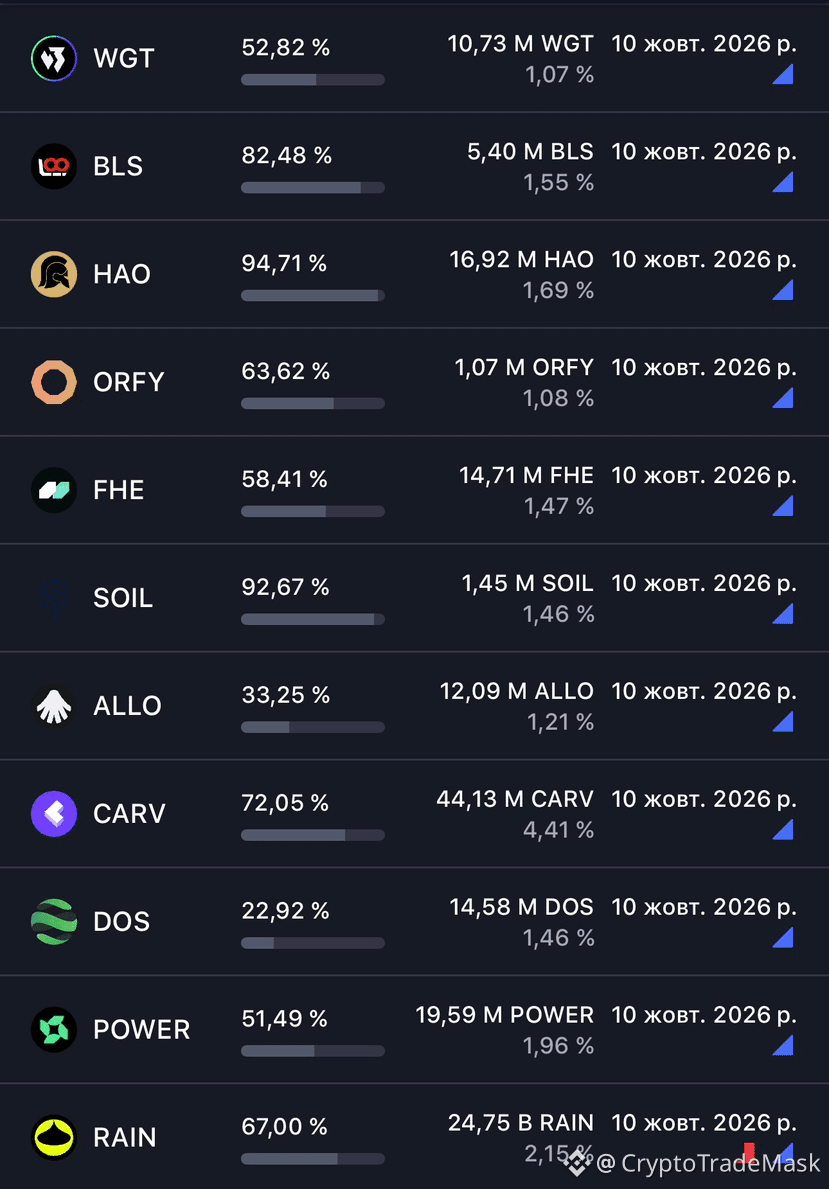
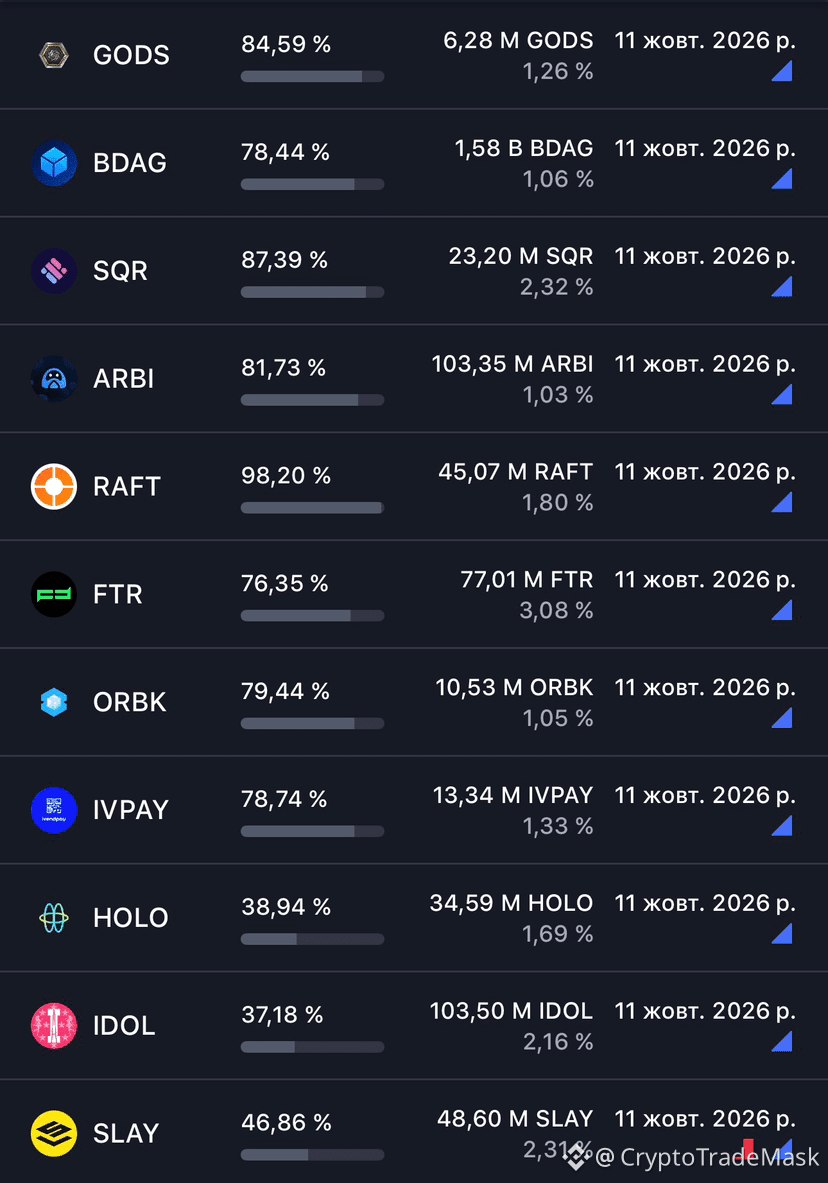
405
#Gitcoin
🚨 Phishing attacks and scams using the Gitcoin ($GTC ) brand: what you need to know
Scammers have recently stepped up efforts to steal user funds by exploiting the name of the well-known platform Gitcoin. Here is a detailed breakdown of two recent incidents and some safety tips.
1️⃣ Compromise of a Gitcoin subdomain (September 21, 2026)
What happened: Security experts at Blockaid discovered that a Gitcoin subdomain—`files.gitcoin.co`—had been compromised. Malicious software known as "Eleven Drainer," designed to automatically drain victims' cryptocurrency wallets, was hosted there.
Official response: The Gitcoin team confirmed the attack, stated that the situation was under control, and launched an investigation. Users were urged not to click links from this subdomain or interact with its content.
2️⃣ GTech Network scam project and fake airdrop on GrowX (September 29, 2026)
What happened: The GTech Network project announced a GTC token airdrop on the GrowX platform, posing as an official Gitcoin initiative. The scam involved price manipulation of the GTech token: the price fluctuated sharply between $0.036 and $0.075 within 24 hours.
Official response: Gitcoin officially denied any involvement with GTech Network or the aforementioned airdrop. The team emphasized that it had no connection to the distribution of these tokens and that the project itself was fraudulent.
🛡️ How can you protect your assets?
1. Verify sources: Always check information via official Gitcoin channels (X/Twitter, Discord, official blog).
2. Avoid connecting wallets to suspicious sites: If a site asks you to sign a transaction to withdraw funds or connect to an unknown source, close the page immediately.
3. Beware of "free" airdrops: Unexpected token giveaways claiming to be from well-known brands are often traps set by wallet drainers.
Stay vigilant and protect your funds!
{future}(GTCUSDT)
#Gitcoin
🚨 Phishing attacks and scams using the Gitcoin ($GTC ) brand: what you need to know
Scammers have recently stepped up efforts to steal user funds by exploiting the name of the well-known platform Gitcoin. Here is a detailed breakdown of two recent incidents and some safety tips.
1️⃣ Compromise of a Gitcoin subdomain (September 21, 2026)
What happened: Security experts at Blockaid discovered that a Gitcoin subdomain—`files.gitcoin.co`—had been compromised. Malicious software known as "Eleven Drainer," designed to automatically drain victims' cryptocurrency wallets, was hosted there.
Official response: The Gitcoin team confirmed the attack, stated that the situation was under control, and launched an investigation. Users were urged not to click links from this subdomain or interact with its content.
2️⃣ GTech Network scam project and fake airdrop on GrowX (September 29, 2026)
What happened: The GTech Network project announced a GTC token airdrop on the GrowX platform, posing as an official Gitcoin initiative. The scam involved price manipulation of the GTech token: the price fluctuated sharply between $0.036 and $0.075 within 24 hours.
Official response: Gitcoin officially denied any involvement with GTech Network or the aforementioned airdrop. The team emphasized that it had no connection to the distribution of these tokens and that the project itself was fraudulent.
🛡️ How can you protect your assets?
1. Verify sources: Always check information via official Gitcoin channels (X/Twitter, Discord, official blog).
2. Avoid connecting wallets to suspicious sites: If a site asks you to sign a transaction to withdraw funds or connect to an unknown source, close the page immediately.
3. Beware of "free" airdrops: Unexpected token giveaways claiming to be from well-known brands are often traps set by wallet drainers.
Stay vigilant and protect your funds!
🚨 Phishing attacks and scams using the Gitcoin ($GTC ) brand: what you need to know
Scammers have recently stepped up efforts to steal user funds by exploiting the name of the well-known platform Gitcoin. Here is a detailed breakdown of two recent incidents and some safety tips.
1️⃣ Compromise of a Gitcoin subdomain (September 21, 2026)
What happened: Security experts at Blockaid discovered that a Gitcoin subdomain—`files.gitcoin.co`—had been compromised. Malicious software known as "Eleven Drainer," designed to automatically drain victims' cryptocurrency wallets, was hosted there.
Official response: The Gitcoin team confirmed the attack, stated that the situation was under control, and launched an investigation. Users were urged not to click links from this subdomain or interact with its content.
2️⃣ GTech Network scam project and fake airdrop on GrowX (September 29, 2026)
What happened: The GTech Network project announced a GTC token airdrop on the GrowX platform, posing as an official Gitcoin initiative. The scam involved price manipulation of the GTech token: the price fluctuated sharply between $0.036 and $0.075 within 24 hours.
Official response: Gitcoin officially denied any involvement with GTech Network or the aforementioned airdrop. The team emphasized that it had no connection to the distribution of these tokens and that the project itself was fraudulent.
🛡️ How can you protect your assets?
1. Verify sources: Always check information via official Gitcoin channels (X/Twitter, Discord, official blog).
2. Avoid connecting wallets to suspicious sites: If a site asks you to sign a transaction to withdraw funds or connect to an unknown source, close the page immediately.
3. Beware of "free" airdrops: Unexpected token giveaways claiming to be from well-known brands are often traps set by wallet drainers.
Stay vigilant and protect your funds!

158
#RLC
🚀 iExec RLC ($RLC ) Analysis: Strong Growth and Technical Overview
The iExec RLC ($RLC ) token is showing rapid growth of +130.16%, reaching the $0.886 mark. This momentum is accompanied by a significant surge in trading volume and a breakout from a prolonged consolidation phase.
🔑 Key Highlights:
📊 Volume and Indicators: 24-hour trading volume has spiked by 15,396.91% ($242.71 million), signaling high market interest. The RSI (14-day) stands at 89.93 (deep in overbought territory), suggesting a potential short-term correction.
🌐 Fundamentals: The project ranks 30th on CoinMarketCap (CMC), with approximately 63% of the total supply currently in circulation.
🎯 Key Profit-Taking Levels (Fibonacci):
First target: $0.895 (127.2% level)
Second target: $1.07 (161.8% level)
⚠️ Summary: The current trend is strongly bullish. However, given the high RSI reading, caution is advised; a pullback is possible before any further move toward the $1.07 mark.
{future}(RLCUSDT)
#RLC
🚀 iExec RLC ($RLC ) Analysis: Strong Growth and Technical Overview
The iExec RLC ($RLC ) token is showing rapid growth of +130.16%, reaching the $0.886 mark. This momentum is accompanied by a significant surge in trading volume and a breakout from a prolonged consolidation phase.
🔑 Key Highlights:
📊 Volume and Indicators: 24-hour trading volume has spiked by 15,396.91% ($242.71 million), signaling high market interest. The RSI (14-day) stands at 89.93 (deep in overbought territory), suggesting a potential short-term correction.
🌐 Fundamentals: The project ranks 30th on CoinMarketCap (CMC), with approximately 63% of the total supply currently in circulation.
🎯 Key Profit-Taking Levels (Fibonacci):
First target: $0.895 (127.2% level)
Second target: $1.07 (161.8% level)
⚠️ Summary: The current trend is strongly bullish. However, given the high RSI reading, caution is advised; a pullback is possible before any further move toward the $1.07 mark.
🚀 iExec RLC ($RLC ) Analysis: Strong Growth and Technical Overview
The iExec RLC ($RLC ) token is showing rapid growth of +130.16%, reaching the $0.886 mark. This momentum is accompanied by a significant surge in trading volume and a breakout from a prolonged consolidation phase.
🔑 Key Highlights:
📊 Volume and Indicators: 24-hour trading volume has spiked by 15,396.91% ($242.71 million), signaling high market interest. The RSI (14-day) stands at 89.93 (deep in overbought territory), suggesting a potential short-term correction.
🌐 Fundamentals: The project ranks 30th on CoinMarketCap (CMC), with approximately 63% of the total supply currently in circulation.
🎯 Key Profit-Taking Levels (Fibonacci):
First target: $0.895 (127.2% level)
Second target: $1.07 (161.8% level)
⚠️ Summary: The current trend is strongly bullish. However, given the high RSI reading, caution is advised; a pullback is possible before any further move toward the $1.07 mark.
128

Article
The ETF and Institutional Era: Why Is Bitcoin No Longer Falling 80%?Typically, one year after reaching its all-time high (ATH), Bitcoin had lost between 70% and 82% of its value. But the current cycle is breaking all the old patterns.
Today, October 6, 2026, one year after reaching an ATH of over $126,000, BTC is trading at around $85,453 — a drop of “only” 32%. Even during its steepest decline in late June (to around $59,000), BTC lost just over 53%, far less than in past bear markets (77%–85%).
The ETF and Institutional Era: Why Is Bitcoin No Longer Falling 80%?
Typically, one year after reaching its all-time high (ATH), Bitcoin had lost between 70% and 82% of its value. But the current cycle is breaking all the old patterns.
Today, October 6, 2026, one year after reaching an ATH of over $126,000, BTC is trading at around $85,453 — a drop of “only” 32%. Even during its steepest decline in late June (to around $59,000), BTC lost just over 53%, far less than in past bear markets (77%–85%).
Today, October 6, 2026, one year after reaching an ATH of over $126,000, BTC is trading at around $85,453 — a drop of “only” 32%. Even during its steepest decline in late June (to around $59,000), BTC lost just over 53%, far less than in past bear markets (77%–85%).
83
#Ethereum
🚀 Ethereum Prepares for a Massive Capacity Leap: Developers Release Urgent Fix Ahead of "Glamsterdam" Test
Today, a crucial test for Ethereum's next major upgrade—"Glamsterdam"—will take place on the Sepolia testnet. Just before the launch, developers had to release an urgent software update at the last minute to ensure the test proceeds correctly.
🔥 What happened and why does it matter?
➡️ A 3x+ capacity leap: The primary goal of today's test is to raise the Sepolia block gas limit from 60 million to 200 million. This will allow the network to be tested against a much higher volume of transactions and more complex smart contracts.
➡️ Urgent fix for Prysm: The Prysm validator client released version 7.2.1. Without this update (or manual configuration), validators would have continued producing blocks with the old 60-million gas limit, effectively invalidating the test results.
➡️ Automatic launch: Validators running the new version will automatically begin proposing blocks with a 200-million gas limit immediately after Glamsterdam activates on Sepolia at 13:53:36 UTC.
⚠️ Why is Ethereum doing this?
Increasing the block gas limit is a pathway to lower fees and higher network throughput. However, developers are proceeding cautiously: excessively large blocks increase hardware requirements for validators and risk compromising decentralization.
#Ethereum
🚀 Ethereum Prepares for a Massive Capacity Leap: Developers Release Urgent Fix Ahead of "Glamsterdam" Test
Today, a crucial test for Ethereum's next major upgrade—"Glamsterdam"—will take place on the Sepolia testnet. Just before the launch, developers had to release an urgent software update at the last minute to ensure the test proceeds correctly.
🔥 What happened and why does it matter?
➡️ A 3x+ capacity leap: The primary goal of today's test is to raise the Sepolia block gas limit from 60 million to 200 million. This will allow the network to be tested against a much higher volume of transactions and more complex smart contracts.
➡️ Urgent fix for Prysm: The Prysm validator client released version 7.2.1. Without this update (or manual configuration), validators would have continued producing blocks with the old 60-million gas limit, effectively invalidating the test results.
➡️ Automatic launch: Validators running the new version will automatically begin proposing blocks with a 200-million gas limit immediately after Glamsterdam activates on Sepolia at 13:53:36 UTC.
⚠️ Why is Ethereum doing this?
Increasing the block gas limit is a pathway to lower fees and higher network throughput. However, developers are proceeding cautiously: excessively large blocks increase hardware requirements for validators and risk compromising decentralization.
🚀 Ethereum Prepares for a Massive Capacity Leap: Developers Release Urgent Fix Ahead of "Glamsterdam" Test
Today, a crucial test for Ethereum's next major upgrade—"Glamsterdam"—will take place on the Sepolia testnet. Just before the launch, developers had to release an urgent software update at the last minute to ensure the test proceeds correctly.
🔥 What happened and why does it matter?
➡️ A 3x+ capacity leap: The primary goal of today's test is to raise the Sepolia block gas limit from 60 million to 200 million. This will allow the network to be tested against a much higher volume of transactions and more complex smart contracts.
➡️ Urgent fix for Prysm: The Prysm validator client released version 7.2.1. Without this update (or manual configuration), validators would have continued producing blocks with the old 60-million gas limit, effectively invalidating the test results.
➡️ Automatic launch: Validators running the new version will automatically begin proposing blocks with a 200-million gas limit immediately after Glamsterdam activates on Sepolia at 13:53:36 UTC.
⚠️ Why is Ethereum doing this?
Increasing the block gas limit is a pathway to lower fees and higher network throughput. However, developers are proceeding cautiously: excessively large blocks increase hardware requirements for validators and risk compromising decentralization.

93
#bitcoin
$BTC : Futures drop by $1.4 billion, but the spot market holds firm.
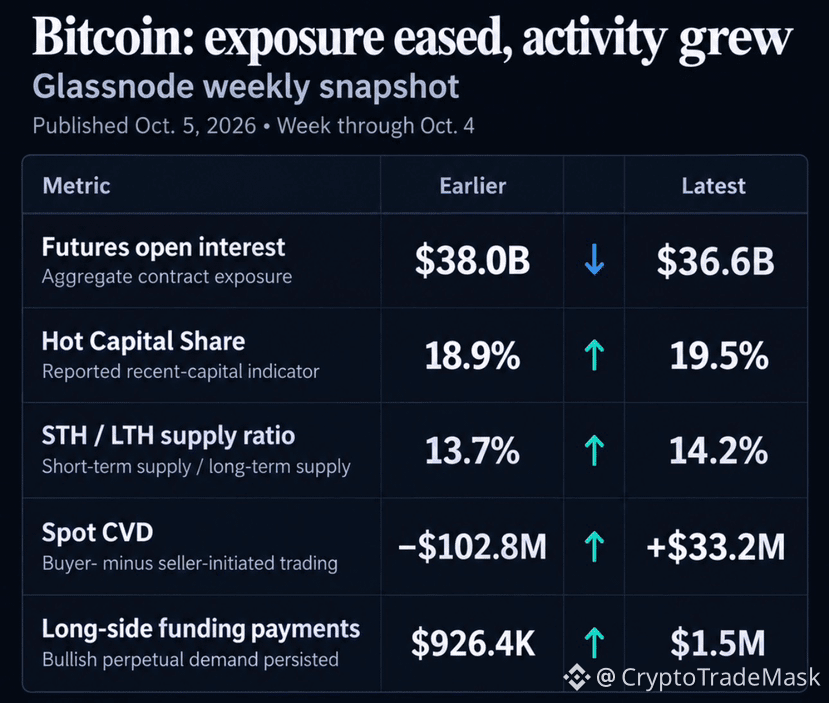
The Bitcoin derivatives market has seen a noticeable cooling off, yet spot buyers are offsetting selling pressure. Glassnode’s weekly report (covering the period up to October 4) highlights several key shifts in the crypto market structure:
📊 Key figures and facts:
Reduction in futures leverage: Derivatives Open Interest fell from $38.0 billion to $36.6 billion (-$1.4 billion).
Demand for "longs" remains high: Despite the drop in Open Interest, long funding payments rose from $926.4k to $1.5 million, indicating continued optimism among perpetual contract traders.
Buyers seizing the initiative: Spot Cumulative Volume Delta (CVD) flipped from -$102.8 million to +$33.2 million.
Capital activity:
"Hot Capital Share" rose to 19.5% (up from 18.9%).
The Short-Term Holder to Long-Term Holder (STH/LTH) ratio climbed to 14.2% (up from 13.7%).
🎯 What does this mean for the market? 1. The network is becoming more sensitive to fluctuations: The rising share of short-term holders and "younger" coins indicates that some of this activity stems from coins moving out of long-term storage (cold storage). "Young" capital is traditionally more prone to panic or profit-taking during periods of volatility.
2. Spot vs. Futures: Reduced futures market leverage lowers the risk of massive cascading liquidations. However, the true test for the market will be the resilience of spot demand. If aggressive spot buying continues, the crypto market will easily absorb the new supply. Conversely, if selling by "takers" resumes, the risk of a downturn will increase.
⚠️ Context: BTC market capitalization stands at ~$1.72T, while 24-hour trading volume has surged by nearly 45% (to $27.28B). The market is seeking a balance between derivatives-related profit-taking and sustained spot accumulation.
{future}(BTCUSDT)
#bitcoin
$BTC : Futures drop by $1.4 billion, but the spot market holds firm.
The Bitcoin derivatives market has seen a noticeable cooling off, yet spot buyers are offsetting selling pressure. Glassnode’s weekly report (covering the period up to October 4) highlights several key shifts in the crypto market structure:
📊 Key figures and facts:
Reduction in futures leverage: Derivatives Open Interest fell from $38.0 billion to $36.6 billion (-$1.4 billion).
Demand for "longs" remains high: Despite the drop in Open Interest, long funding payments rose from $926.4k to $1.5 million, indicating continued optimism among perpetual contract traders.
Buyers seizing the initiative: Spot Cumulative Volume Delta (CVD) flipped from -$102.8 million to +$33.2 million.
Capital activity:
"Hot Capital Share" rose to 19.5% (up from 18.9%).
The Short-Term Holder to Long-Term Holder (STH/LTH) ratio climbed to 14.2% (up from 13.7%).
🎯 What does this mean for the market? 1. The network is becoming more sensitive to fluctuations: The rising share of short-term holders and "younger" coins indicates that some of this activity stems from coins moving out of long-term storage (cold storage). "Young" capital is traditionally more prone to panic or profit-taking during periods of volatility.
2. Spot vs. Futures: Reduced futures market leverage lowers the risk of massive cascading liquidations. However, the true test for the market will be the resilience of spot demand. If aggressive spot buying continues, the crypto market will easily absorb the new supply. Conversely, if selling by "takers" resumes, the risk of a downturn will increase.
⚠️ Context: BTC market capitalization stands at ~$1.72T, while 24-hour trading volume has surged by nearly 45% (to $27.28B). The market is seeking a balance between derivatives-related profit-taking and sustained spot accumulation.
$BTC : Futures drop by $1.4 billion, but the spot market holds firm.
The Bitcoin derivatives market has seen a noticeable cooling off, yet spot buyers are offsetting selling pressure. Glassnode’s weekly report (covering the period up to October 4) highlights several key shifts in the crypto market structure:
📊 Key figures and facts:
Reduction in futures leverage: Derivatives Open Interest fell from $38.0 billion to $36.6 billion (-$1.4 billion).
Demand for "longs" remains high: Despite the drop in Open Interest, long funding payments rose from $926.4k to $1.5 million, indicating continued optimism among perpetual contract traders.
Buyers seizing the initiative: Spot Cumulative Volume Delta (CVD) flipped from -$102.8 million to +$33.2 million.
Capital activity:
"Hot Capital Share" rose to 19.5% (up from 18.9%).
The Short-Term Holder to Long-Term Holder (STH/LTH) ratio climbed to 14.2% (up from 13.7%).
🎯 What does this mean for the market? 1. The network is becoming more sensitive to fluctuations: The rising share of short-term holders and "younger" coins indicates that some of this activity stems from coins moving out of long-term storage (cold storage). "Young" capital is traditionally more prone to panic or profit-taking during periods of volatility.
2. Spot vs. Futures: Reduced futures market leverage lowers the risk of massive cascading liquidations. However, the true test for the market will be the resilience of spot demand. If aggressive spot buying continues, the crypto market will easily absorb the new supply. Conversely, if selling by "takers" resumes, the risk of a downturn will increase.
⚠️ Context: BTC market capitalization stands at ~$1.72T, while 24-hour trading volume has surged by nearly 45% (to $27.28B). The market is seeking a balance between derivatives-related profit-taking and sustained spot accumulation.
97
#bitcoin
📊 Bitcoin Analysis: Are buyers running out of steam after another rejection at $87K?
Following the September pullback, Bitcoin is once again approaching a key resistance zone. The price structure remains bullish, yet technical levels and on-chain metrics point to significant hurdles for further gains.
📉 Technical Outlook:
Daily: $BTC is trading around $85.2K, right up against the $86K–$90K resistance zone. Buyers have firmly held the $83K–$84K support level, signaling sustained demand. A "golden cross" of moving averages (near $71.5K) is potentially on the horizon, though not yet confirmed.
4-Hour: An ascending triangle is forming within an upward-sloping channel on the 4-hour chart. Resistance lies at $87K–$87.3K, while support is shifting higher ($84.5K–$85K). Price compression is occurring, which typically precedes a strong momentum move.
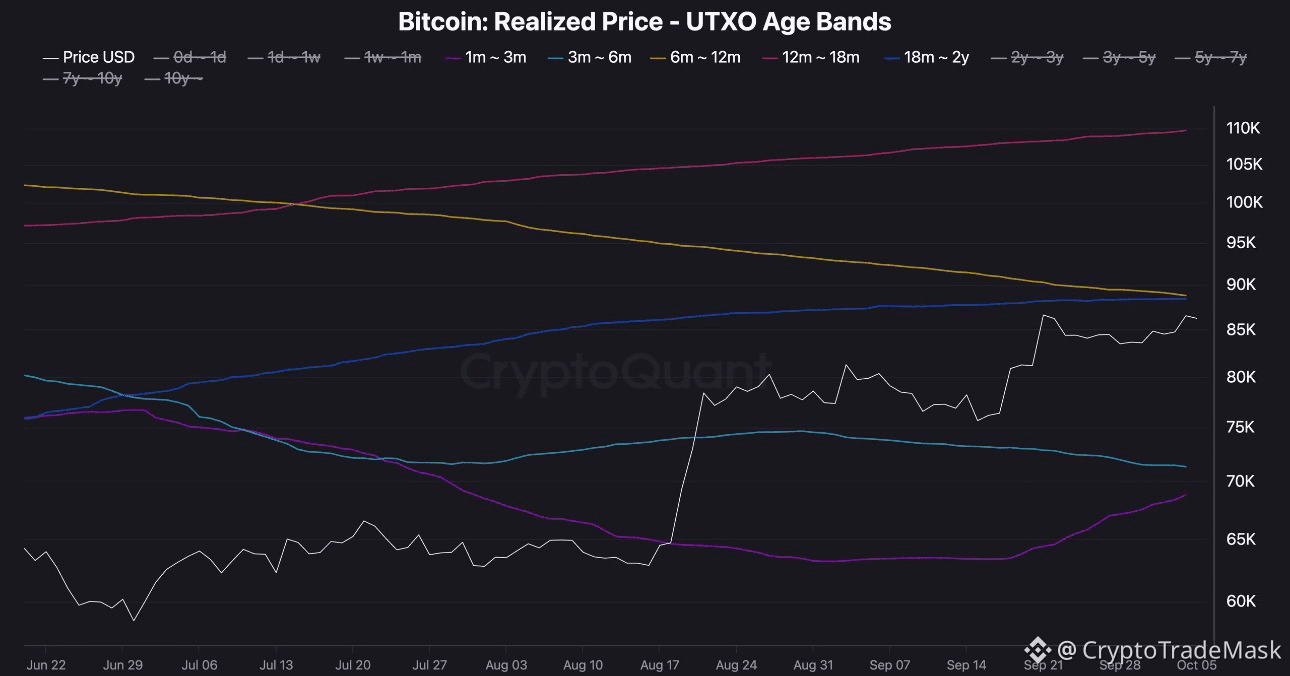
📊 On-chain Sentiment (Realized Price):
The "1–3 month" and "3–6 month" holder cohorts are currently in profit (with average purchase prices of $69K and $71K, respectively).
However, the price remains below the average purchase price for the "6–12 month" and "18–24 month" cohorts ($88K–$89K). The convergence of technical resistance and the break-even point for these investors creates a potential zone of heavy selling pressure.
🎯 Key scenarios:
🟢 Bullish scenario:
A decisive breakout and consolidation above $87.3K–$87.5K would pave the way to $88K–$90K. If the bulls manage to surpass $90K (pushing long-term holders into profit), the next target would be the $94K–$98K range.
🔴 Bearish scenario:
Another rejection and a loss of the $84.5K support level risk driving the price down to $82.5K–$83K, and subsequently to the channel median near $81K. The primary support zone below lies at the $75K–$78K level.
{future}(BTCUSDT)
#bitcoin
📊 Bitcoin Analysis: Are buyers running out of steam after another rejection at $87K?
Following the September pullback, Bitcoin is once again approaching a key resistance zone. The price structure remains bullish, yet technical levels and on-chain metrics point to significant hurdles for further gains.
📉 Technical Outlook:
Daily: $BTC is trading around $85.2K, right up against the $86K–$90K resistance zone. Buyers have firmly held the $83K–$84K support level, signaling sustained demand. A "golden cross" of moving averages (near $71.5K) is potentially on the horizon, though not yet confirmed.
4-Hour: An ascending triangle is forming within an upward-sloping channel on the 4-hour chart. Resistance lies at $87K–$87.3K, while support is shifting higher ($84.5K–$85K). Price compression is occurring, which typically precedes a strong momentum move.
📊 On-chain Sentiment (Realized Price):
The "1–3 month" and "3–6 month" holder cohorts are currently in profit (with average purchase prices of $69K and $71K, respectively).
However, the price remains below the average purchase price for the "6–12 month" and "18–24 month" cohorts ($88K–$89K). The convergence of technical resistance and the break-even point for these investors creates a potential zone of heavy selling pressure.
🎯 Key scenarios:
🟢 Bullish scenario:
A decisive breakout and consolidation above $87.3K–$87.5K would pave the way to $88K–$90K. If the bulls manage to surpass $90K (pushing long-term holders into profit), the next target would be the $94K–$98K range.
🔴 Bearish scenario:
Another rejection and a loss of the $84.5K support level risk driving the price down to $82.5K–$83K, and subsequently to the channel median near $81K. The primary support zone below lies at the $75K–$78K level.
📊 Bitcoin Analysis: Are buyers running out of steam after another rejection at $87K?
Following the September pullback, Bitcoin is once again approaching a key resistance zone. The price structure remains bullish, yet technical levels and on-chain metrics point to significant hurdles for further gains.
📉 Technical Outlook:
Daily: $BTC is trading around $85.2K, right up against the $86K–$90K resistance zone. Buyers have firmly held the $83K–$84K support level, signaling sustained demand. A "golden cross" of moving averages (near $71.5K) is potentially on the horizon, though not yet confirmed.
4-Hour: An ascending triangle is forming within an upward-sloping channel on the 4-hour chart. Resistance lies at $87K–$87.3K, while support is shifting higher ($84.5K–$85K). Price compression is occurring, which typically precedes a strong momentum move.
📊 On-chain Sentiment (Realized Price):
The "1–3 month" and "3–6 month" holder cohorts are currently in profit (with average purchase prices of $69K and $71K, respectively).
However, the price remains below the average purchase price for the "6–12 month" and "18–24 month" cohorts ($88K–$89K). The convergence of technical resistance and the break-even point for these investors creates a potential zone of heavy selling pressure.
🎯 Key scenarios:
🟢 Bullish scenario:
A decisive breakout and consolidation above $87.3K–$87.5K would pave the way to $88K–$90K. If the bulls manage to surpass $90K (pushing long-term holders into profit), the next target would be the $94K–$98K range.
🔴 Bearish scenario:
Another rejection and a loss of the $84.5K support level risk driving the price down to $82.5K–$83K, and subsequently to the channel median near $81K. The primary support zone below lies at the $75K–$78K level.
64
#metaplanet
Metaplanet grows Bitcoin reserves to 44,000 $BTC ($3.8 billion) by the end of Q3 2026 🚀
Japanese company Metaplanet (3350) continues to execute its aggressive Bitcoin strategy, adding a net 1,000 BTC during the third quarter. As of September 30, its holdings reached 44,000 BTC.
📊 Key report details:
➡️ Liquidity maneuver: The company sold 10,000 BTC for $789.2 million ($78,925 per coin) and temporarily held the cash to demonstrate to creditors its ability to cover interest obligations. Subsequently, Metaplanet repurchased 11,000 BTC for $948.7 million ($86,246 per coin).
➡️ Total cost basis: The total cost of all 44,000 BTC on the balance sheet is approximately $4.33 billion, with an average purchase price of $98,454 per BTC.
➡️ New strategy (Net Interest Income): Metaplanet plans to allocate 10–15% of its assets into preferred securities of other companies with significant Bitcoin treasuries to generate a yield exceeding its cost of capital.
➡️ Options revenue: The options business (Bitcoin Income Generation) generated $5.4 million in revenue for Q3 (a 51% drop compared to Q2), but total revenue for the nine-month period reached $35.2 million (marking the eighth consecutive profitable quarter).
➡️ Market reaction: Metaplanet shares in Tokyo closed 2% higher at 297 yen ($1.88).
⚠️ CEO Simon Gerovich emphasized that the company's goal is to move beyond mere BTC accumulation and become a leading Bitcoin financial company in Asia.
{future}(BTCUSDT)
#metaplanet
Metaplanet grows Bitcoin reserves to 44,000 $BTC ($3.8 billion) by the end of Q3 2026 🚀
Japanese company Metaplanet (3350) continues to execute its aggressive Bitcoin strategy, adding a net 1,000 BTC during the third quarter. As of September 30, its holdings reached 44,000 BTC.
📊 Key report details:
➡️ Liquidity maneuver: The company sold 10,000 BTC for $789.2 million ($78,925 per coin) and temporarily held the cash to demonstrate to creditors its ability to cover interest obligations. Subsequently, Metaplanet repurchased 11,000 BTC for $948.7 million ($86,246 per coin).
➡️ Total cost basis: The total cost of all 44,000 BTC on the balance sheet is approximately $4.33 billion, with an average purchase price of $98,454 per BTC.
➡️ New strategy (Net Interest Income): Metaplanet plans to allocate 10–15% of its assets into preferred securities of other companies with significant Bitcoin treasuries to generate a yield exceeding its cost of capital.
➡️ Options revenue: The options business (Bitcoin Income Generation) generated $5.4 million in revenue for Q3 (a 51% drop compared to Q2), but total revenue for the nine-month period reached $35.2 million (marking the eighth consecutive profitable quarter).
➡️ Market reaction: Metaplanet shares in Tokyo closed 2% higher at 297 yen ($1.88).
⚠️ CEO Simon Gerovich emphasized that the company's goal is to move beyond mere BTC accumulation and become a leading Bitcoin financial company in Asia.
Metaplanet grows Bitcoin reserves to 44,000 $BTC ($3.8 billion) by the end of Q3 2026 🚀
Japanese company Metaplanet (3350) continues to execute its aggressive Bitcoin strategy, adding a net 1,000 BTC during the third quarter. As of September 30, its holdings reached 44,000 BTC.
📊 Key report details:
➡️ Liquidity maneuver: The company sold 10,000 BTC for $789.2 million ($78,925 per coin) and temporarily held the cash to demonstrate to creditors its ability to cover interest obligations. Subsequently, Metaplanet repurchased 11,000 BTC for $948.7 million ($86,246 per coin).
➡️ Total cost basis: The total cost of all 44,000 BTC on the balance sheet is approximately $4.33 billion, with an average purchase price of $98,454 per BTC.
➡️ New strategy (Net Interest Income): Metaplanet plans to allocate 10–15% of its assets into preferred securities of other companies with significant Bitcoin treasuries to generate a yield exceeding its cost of capital.
➡️ Options revenue: The options business (Bitcoin Income Generation) generated $5.4 million in revenue for Q3 (a 51% drop compared to Q2), but total revenue for the nine-month period reached $35.2 million (marking the eighth consecutive profitable quarter).
➡️ Market reaction: Metaplanet shares in Tokyo closed 2% higher at 297 yen ($1.88).
⚠️ CEO Simon Gerovich emphasized that the company's goal is to move beyond mere BTC accumulation and become a leading Bitcoin financial company in Asia.

32
#CryptoMarketMoves
Bitcoin bounces off $87K again, while Cardano surges 11%: Market Overview
Despite renewed tensions in the Middle East, the cryptocurrency market is off to a dynamic start this week. Total market capitalization rose by 1% to reach $2.93 trillion.
📊 Key Market Highlights:
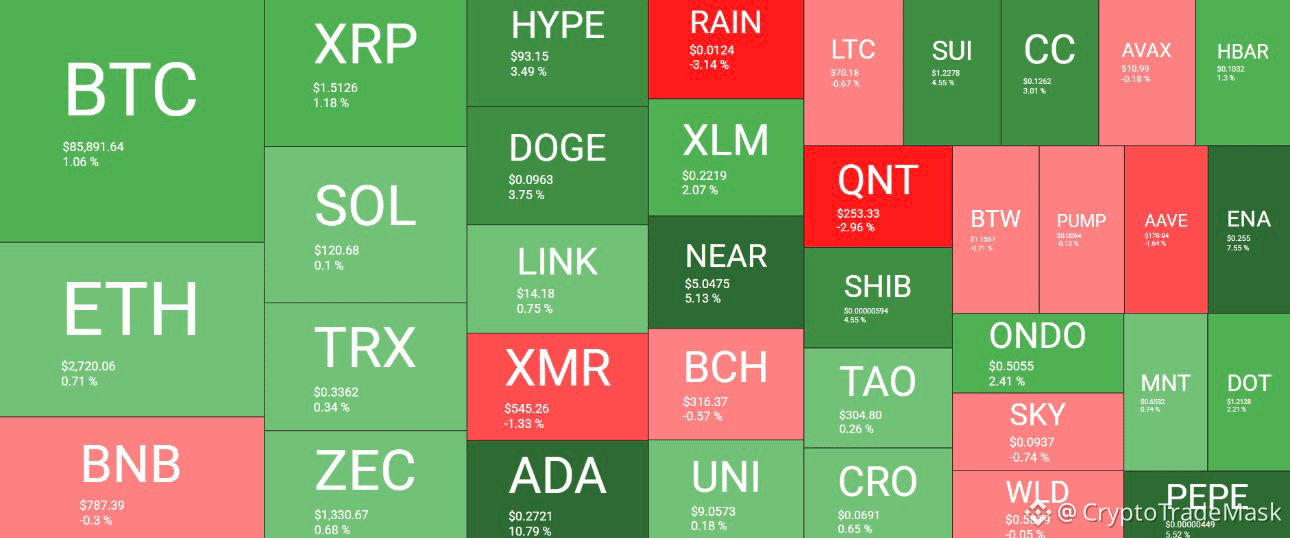
Bitcoin (#BTC ) climbed to $87,000 on Monday morning but once again faced strong selling pressure. After pulling back to $85,500, the price stabilized around the $86,000 mark. BTC's market cap stands at $1.72 trillion, with its dominance index holding steady at 59%.
Cardano (#ADA ) emerged as the clear leader among top altcoins, surging nearly 11% to reach the $0.27 level.
🚀 Altcoin Surge:
$FET rose by over 15%.
$VIRTUAL gained 12%.
$NEAR climbed 5%, reclaiming the $5 mark.
#DOGE (+3.75%), HYPE (+3.5%), and ENA (+7.5%) were also among the day's top performers.
Large caps: Ethereum (#ETH ) consolidated slightly above $2,700, while XRP is trading above $1.50.
{future}(NEARUSDT)
{future}(VIRTUALUSDT)
{future}(FETUSDT)
#CryptoMarketMoves
Bitcoin bounces off $87K again, while Cardano surges 11%: Market Overview
Despite renewed tensions in the Middle East, the cryptocurrency market is off to a dynamic start this week. Total market capitalization rose by 1% to reach $2.93 trillion.
📊 Key Market Highlights:
Bitcoin (#BTC ) climbed to $87,000 on Monday morning but once again faced strong selling pressure. After pulling back to $85,500, the price stabilized around the $86,000 mark. BTC's market cap stands at $1.72 trillion, with its dominance index holding steady at 59%.
Cardano (#ADA ) emerged as the clear leader among top altcoins, surging nearly 11% to reach the $0.27 level.
🚀 Altcoin Surge:
$FET rose by over 15%.
$VIRTUAL gained 12%.
$NEAR climbed 5%, reclaiming the $5 mark.
#DOGE (+3.75%), HYPE (+3.5%), and ENA (+7.5%) were also among the day's top performers.
Large caps: Ethereum (#ETH ) consolidated slightly above $2,700, while XRP is trading above $1.50.
Bitcoin bounces off $87K again, while Cardano surges 11%: Market Overview
Despite renewed tensions in the Middle East, the cryptocurrency market is off to a dynamic start this week. Total market capitalization rose by 1% to reach $2.93 trillion.
📊 Key Market Highlights:
Bitcoin (#BTC ) climbed to $87,000 on Monday morning but once again faced strong selling pressure. After pulling back to $85,500, the price stabilized around the $86,000 mark. BTC's market cap stands at $1.72 trillion, with its dominance index holding steady at 59%.
Cardano (#ADA ) emerged as the clear leader among top altcoins, surging nearly 11% to reach the $0.27 level.
🚀 Altcoin Surge:
$FET rose by over 15%.
$VIRTUAL gained 12%.
$NEAR climbed 5%, reclaiming the $5 mark.
#DOGE (+3.75%), HYPE (+3.5%), and ENA (+7.5%) were also among the day's top performers.
Large caps: Ethereum (#ETH ) consolidated slightly above $2,700, while XRP is trading above $1.50.
108
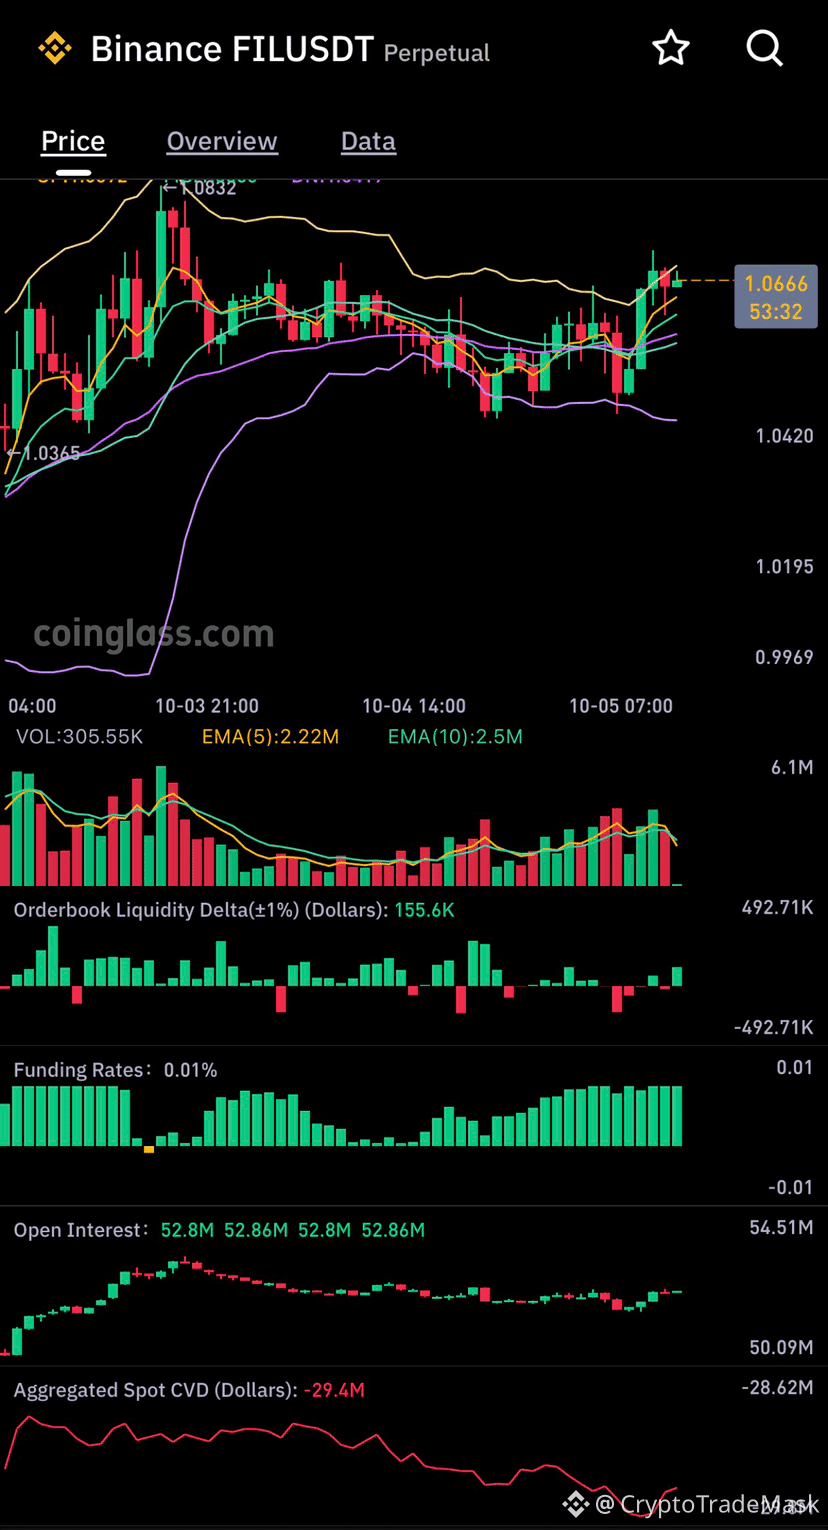
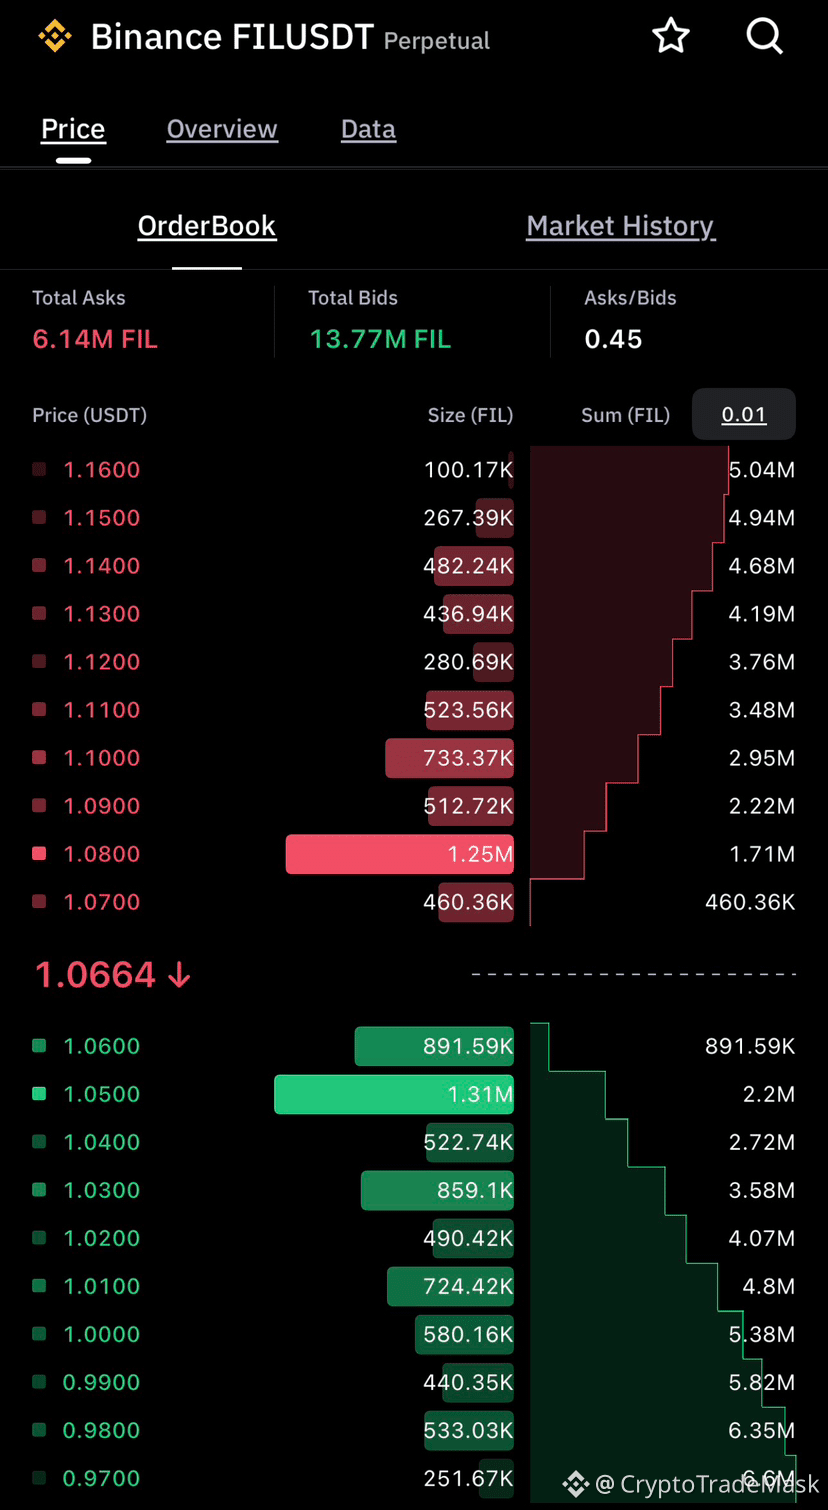
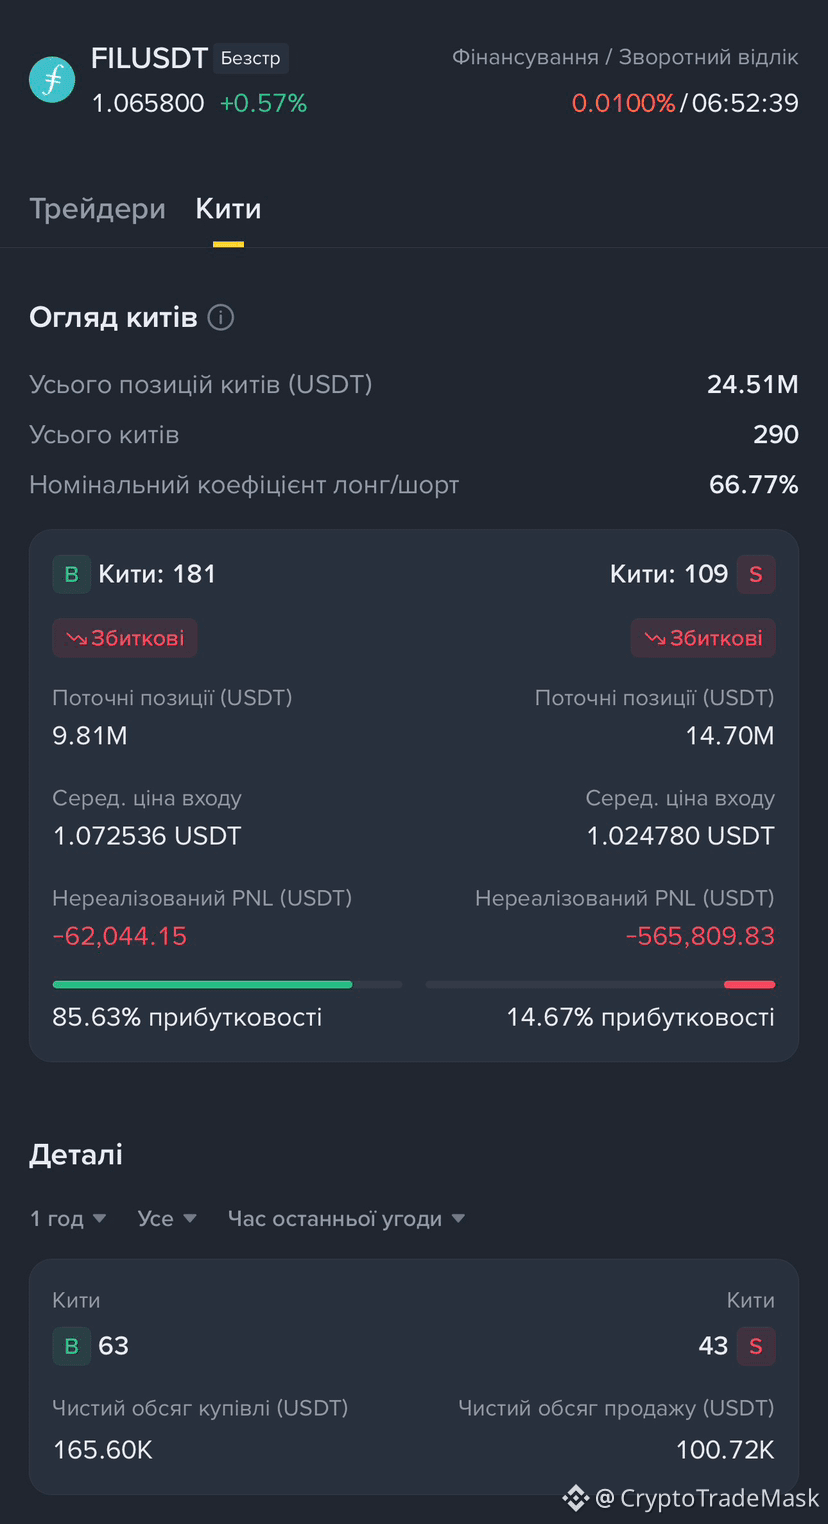
🚀 $FIL /USDT: Local Setup 📊
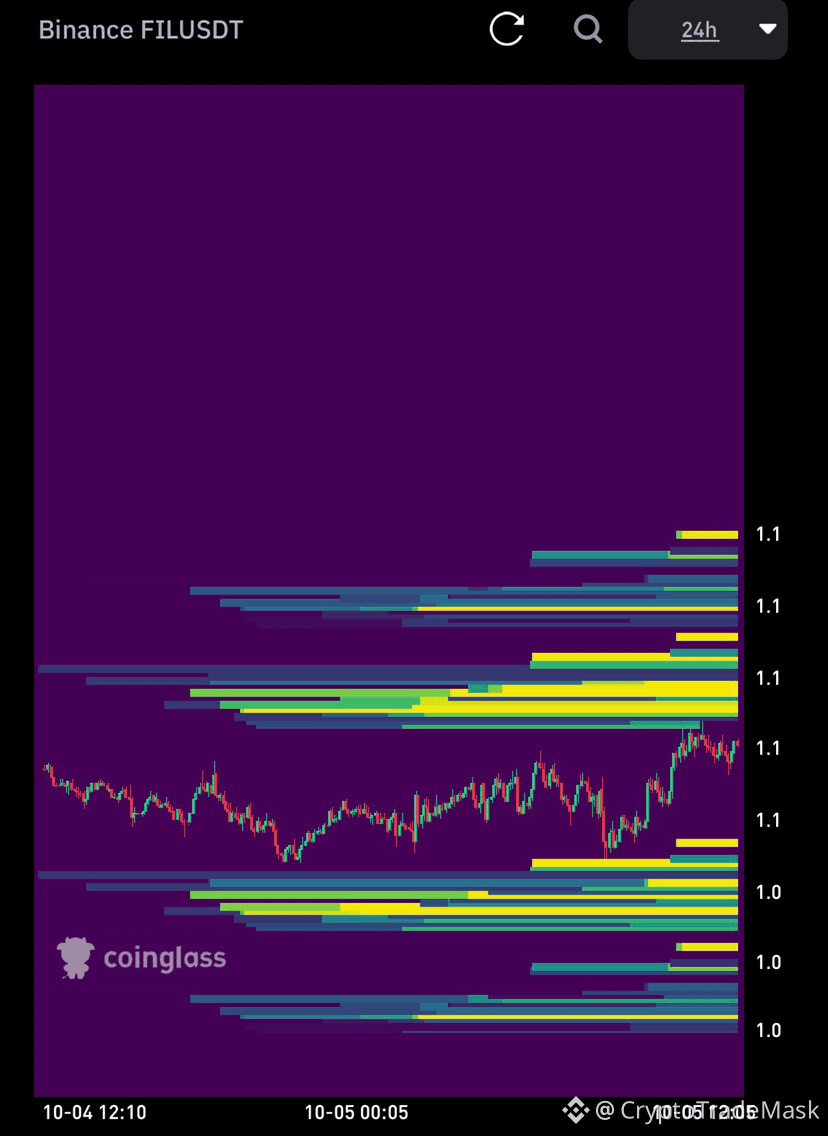
The price is squeezed within the 1.06–1.07 USDT range. There is significant buying pressure in the order book (Bids: 13.77M vs. Asks: 6.14M), and short-selling whales are sitting on losses—conditions are ripe for sweeping liquidity to the upside!
🟢 LONG (Main Scenario)
Entry: 1.0550 – 1.0650 USDT
Stop-Loss: 1.0380 USDT
Take-Profit: 1.0800 | 1.1000 USDT
🔴 SHORT (Counter-trend from resistance)
Entry: 1.0800 – 1.0950 USDT
Stop-Loss: 1.1120 USDT
Take-Profit: 1.0600 | 1.0450 USDT
⚠️ Don't forget risk management: leverage up to 10x, risk up to 2% per trade.
{future}(FILUSDT)
🚀 $FIL /USDT: Local Setup 📊
The price is squeezed within the 1.06–1.07 USDT range. There is significant buying pressure in the order book (Bids: 13.77M vs. Asks: 6.14M), and short-selling whales are sitting on losses—conditions are ripe for sweeping liquidity to the upside!
🟢 LONG (Main Scenario)
Entry: 1.0550 – 1.0650 USDT
Stop-Loss: 1.0380 USDT
Take-Profit: 1.0800 | 1.1000 USDT
🔴 SHORT (Counter-trend from resistance)
Entry: 1.0800 – 1.0950 USDT
Stop-Loss: 1.1120 USDT
Take-Profit: 1.0600 | 1.0450 USDT
⚠️ Don't forget risk management: leverage up to 10x, risk up to 2% per trade.
The price is squeezed within the 1.06–1.07 USDT range. There is significant buying pressure in the order book (Bids: 13.77M vs. Asks: 6.14M), and short-selling whales are sitting on losses—conditions are ripe for sweeping liquidity to the upside!
🟢 LONG (Main Scenario)
Entry: 1.0550 – 1.0650 USDT
Stop-Loss: 1.0380 USDT
Take-Profit: 1.0800 | 1.1000 USDT
🔴 SHORT (Counter-trend from resistance)
Entry: 1.0800 – 1.0950 USDT
Stop-Loss: 1.1120 USDT
Take-Profit: 1.0600 | 1.0450 USDT
⚠️ Don't forget risk management: leverage up to 10x, risk up to 2% per trade.
64
#zcash
⚡ Zcash ($ZEC ) has launched the NU7 upgrade on the testnet: 25-second blocks and a new economic model!
Zcash has activated the major NU7 (Network Upgrade 7) on the public testnet (at block height 4,465,026). The primary goal is to prepare for the full Mainnet launch scheduled for November 5, 2026.
🔑 Key NU7 changes:
➡️ 3x faster block times (ZIP 218): Block generation time has been reduced from 75 to 25 seconds. This will significantly speed up initial transaction confirmations—critical for POS terminals, exchanges, and cross-chain bridges.
Note: Total ZEC supply, the 21-million-coin cap, and the 4-year halving schedule remain unchanged.
➡️ Network resilience mechanism (ZIP 235 & 237): A special reserve is being introduced to ensure long-term network security.
60% of fees from each block are removed from circulation and placed into the reserve, while 40% go to miners.
The reserve periodically redistributes small portions of accumulated funds as an additional block reward. This ensures continued funding for miners even after traditional rewards are significantly reduced by halvings.
➡️ Optimization and spam protection: New limits have been established for private (shielded) transactions. The throughput of the Orchard protocol will more than double, and the potential load from spam attacks on light wallets will decrease by approximately 37%.
🗓 What’s next?
All node operators are urged to update their software and test NU7 on the testnet. A final decision regarding the Mainnet launch date will be made on October 20. If testing is successful, the update will be activated on the main network on November 5.
{future}(ZECUSDT)
#zcash
⚡ Zcash ($ZEC ) has launched the NU7 upgrade on the testnet: 25-second blocks and a new economic model!
Zcash has activated the major NU7 (Network Upgrade 7) on the public testnet (at block height 4,465,026). The primary goal is to prepare for the full Mainnet launch scheduled for November 5, 2026.
🔑 Key NU7 changes:
➡️ 3x faster block times (ZIP 218): Block generation time has been reduced from 75 to 25 seconds. This will significantly speed up initial transaction confirmations—critical for POS terminals, exchanges, and cross-chain bridges.
Note: Total ZEC supply, the 21-million-coin cap, and the 4-year halving schedule remain unchanged.
➡️ Network resilience mechanism (ZIP 235 & 237): A special reserve is being introduced to ensure long-term network security.
60% of fees from each block are removed from circulation and placed into the reserve, while 40% go to miners.
The reserve periodically redistributes small portions of accumulated funds as an additional block reward. This ensures continued funding for miners even after traditional rewards are significantly reduced by halvings.
➡️ Optimization and spam protection: New limits have been established for private (shielded) transactions. The throughput of the Orchard protocol will more than double, and the potential load from spam attacks on light wallets will decrease by approximately 37%.
🗓 What’s next?
All node operators are urged to update their software and test NU7 on the testnet. A final decision regarding the Mainnet launch date will be made on October 20. If testing is successful, the update will be activated on the main network on November 5.
⚡ Zcash ($ZEC ) has launched the NU7 upgrade on the testnet: 25-second blocks and a new economic model!
Zcash has activated the major NU7 (Network Upgrade 7) on the public testnet (at block height 4,465,026). The primary goal is to prepare for the full Mainnet launch scheduled for November 5, 2026.
🔑 Key NU7 changes:
➡️ 3x faster block times (ZIP 218): Block generation time has been reduced from 75 to 25 seconds. This will significantly speed up initial transaction confirmations—critical for POS terminals, exchanges, and cross-chain bridges.
Note: Total ZEC supply, the 21-million-coin cap, and the 4-year halving schedule remain unchanged.
➡️ Network resilience mechanism (ZIP 235 & 237): A special reserve is being introduced to ensure long-term network security.
60% of fees from each block are removed from circulation and placed into the reserve, while 40% go to miners.
The reserve periodically redistributes small portions of accumulated funds as an additional block reward. This ensures continued funding for miners even after traditional rewards are significantly reduced by halvings.
➡️ Optimization and spam protection: New limits have been established for private (shielded) transactions. The throughput of the Orchard protocol will more than double, and the potential load from spam attacks on light wallets will decrease by approximately 37%.
🗓 What’s next?
All node operators are urged to update their software and test NU7 on the testnet. A final decision regarding the Mainnet launch date will be made on October 20. If testing is successful, the update will be activated on the main network on November 5.

74
Log in to explore more content
Join global crypto users on Binance Square
⚡️ Get latest and useful information about crypto.
💬 Trusted by the world’s largest crypto exchange.
👍 Discover real insights from verified creators.
Email / Phone number
Trending Topics
FedMinutesFocusOnOctoberPause
62,533 views
831 Discussing
The latest Federal Reserve meeting minutes are under intense scrutiny, with the market desperately searching for any indication of a potential pause in interest rate hikes for October. This focus highlights the significant impact Fed policy has on cryptocurrency markets, as higher rates often lead to reduced liquidity and investor appetite for riskier assets like digital currencies. Traders and analysts are dissecting every word for signals that could influence market sentiment and potential price movements across major cryptocurrencies. The anticipation itself is creating volatility as participants position themselves ahead of any definitive announcement.
Disclaimer: This is not investment advice. Always do your own research.
#FedMinutesFocusOnOctoberPause $BTC $ETH
Luong Nguyen Ba
·1 Likes
·3.9k views
BinanceLaunchesBinanceIntelligence
1M views
6,099 Discussing
EvernorthDelaysNasdaqDebutToOct12
2,791 views
145 Discussing