
Peter_Parker0
19.3k Posts

Peter_Parker0
 Square Verified
Report
Block User
Crypto trader|Market sniper Spot & Futures| TA wizard | Risk-first Altcoin gems|Bullish vibes only #CryptoTrading $BTC|Twitter|Cryptocobain032 KITE:659646
Open Trade
Frequent Trader
2.7 Years
740 Following
45.8K+ Followers
49.0K+ Liked
Posts
Portfolio
All
Quotes
Videos
Live
$AKE — SELLERS ARE TESTING THE BUYERS! ⚡
I'm watching AKE around an important reaction zone. When leveraged buyers get flushed, the next move often depends on whether fresh demand appears or sellers continue pushing price lower.
🔴 Long Liquidation: $1.404K at $0.00504
The liquidation event puts $0.00504 on my radar. If buyers defend this region, a short-term recovery could develop. Failure to hold support may expose another downside move.
📊 Key Levels (Estimated):
Support S1: $0.00498
Support S2: $0.00488
Resistance R1: $0.00512
Resistance R2: $0.00525
🎯 Trading Setup:
EP: $0.00502–$0.00507
TP: $0.00515 / $0.00525 / $0.00538
SL: $0.00494
I'm waiting for a higher low on the lower timeframe before considering a long entry. No confirmation, no trade.
The next reaction matters. Patience is the strategy.
{future}(AKEUSDT)
#KeplrAdvisesSocialLoginUsersToTransferAssets #TetherPlans€28.8MForJuventusCapitalIncrease #SouthKoreaDraftLawTargets15To20%ShareholderCap #AIChipSlumpNasdaq #BitcoinFiveWeeklyLosses
$AKE — SELLERS ARE TESTING THE BUYERS! ⚡
I'm watching AKE around an important reaction zone. When leveraged buyers get flushed, the next move often depends on whether fresh demand appears or sellers continue pushing price lower.
🔴 Long Liquidation: $1.404K at $0.00504
The liquidation event puts $0.00504 on my radar. If buyers defend this region, a short-term recovery could develop. Failure to hold support may expose another downside move.
📊 Key Levels (Estimated):
Support S1: $0.00498
Support S2: $0.00488
Resistance R1: $0.00512
Resistance R2: $0.00525
🎯 Trading Setup:
EP: $0.00502–$0.00507
TP: $0.00515 / $0.00525 / $0.00538
SL: $0.00494
I'm waiting for a higher low on the lower timeframe before considering a long entry. No confirmation, no trade.
The next reaction matters. Patience is the strategy.
#KeplrAdvisesSocialLoginUsersToTransferAssets #TetherPlans€28.8MForJuventusCapitalIncrease #SouthKoreaDraftLawTargets15To20%ShareholderCap #AIChipSlumpNasdaq #BitcoinFiveWeeklyLosses
I'm watching AKE around an important reaction zone. When leveraged buyers get flushed, the next move often depends on whether fresh demand appears or sellers continue pushing price lower.
🔴 Long Liquidation: $1.404K at $0.00504
The liquidation event puts $0.00504 on my radar. If buyers defend this region, a short-term recovery could develop. Failure to hold support may expose another downside move.
📊 Key Levels (Estimated):
Support S1: $0.00498
Support S2: $0.00488
Resistance R1: $0.00512
Resistance R2: $0.00525
🎯 Trading Setup:
EP: $0.00502–$0.00507
TP: $0.00515 / $0.00525 / $0.00538
SL: $0.00494
I'm waiting for a higher low on the lower timeframe before considering a long entry. No confirmation, no trade.
The next reaction matters. Patience is the strategy.
#KeplrAdvisesSocialLoginUsersToTransferAssets #TetherPlans€28.8MForJuventusCapitalIncrease #SouthKoreaDraftLawTargets15To20%ShareholderCap #AIChipSlumpNasdaq #BitcoinFiveWeeklyLosses
366
$ON — A CRITICAL MOMENT FOR BUYERS! 👀
The latest liquidation activity shows that leveraged longs are facing pressure. I'm interested in seeing whether ON can absorb this selling or whether the market is preparing for another downside test.
🔴 Long Liquidation: $1.103K at $0.18551
The $0.18551 area is an important reference for the next move. A successful recovery could bring buyers back into the picture, while continued weakness may expose lower price levels.
📊 Key Levels (Estimated):
Support S1: $0.1835
Support S2: $0.1800
Resistance R1: $0.1885
Resistance R2: $0.1920
🎯 Trading Setup:
EP: $0.1850–$0.1860
TP: $0.1890 / $0.1920 / $0.1960
SL: $0.1825
My focus is on a confirmed higher low and a reclaim of nearby resistance. I won't rush into a position while sellers remain active.
Let the chart confirm the recovery first.
#TradFiForBeginners #KeplrAdvisesSocialLoginUsersToTransferAssets #BinanceReopensWithdrawalsForHYPE&APT #AIChipSlumpNasdaq #BitcoinFiveWeeklyLosses
$ON — A CRITICAL MOMENT FOR BUYERS! 👀
The latest liquidation activity shows that leveraged longs are facing pressure. I'm interested in seeing whether ON can absorb this selling or whether the market is preparing for another downside test.
🔴 Long Liquidation: $1.103K at $0.18551
The $0.18551 area is an important reference for the next move. A successful recovery could bring buyers back into the picture, while continued weakness may expose lower price levels.
📊 Key Levels (Estimated):
Support S1: $0.1835
Support S2: $0.1800
Resistance R1: $0.1885
Resistance R2: $0.1920
🎯 Trading Setup:
EP: $0.1850–$0.1860
TP: $0.1890 / $0.1920 / $0.1960
SL: $0.1825
My focus is on a confirmed higher low and a reclaim of nearby resistance. I won't rush into a position while sellers remain active.
Let the chart confirm the recovery first.
#TradFiForBeginners #KeplrAdvisesSocialLoginUsersToTransferAssets #BinanceReopensWithdrawalsForHYPE&APT #AIChipSlumpNasdaq #BitcoinFiveWeeklyLosses
The latest liquidation activity shows that leveraged longs are facing pressure. I'm interested in seeing whether ON can absorb this selling or whether the market is preparing for another downside test.
🔴 Long Liquidation: $1.103K at $0.18551
The $0.18551 area is an important reference for the next move. A successful recovery could bring buyers back into the picture, while continued weakness may expose lower price levels.
📊 Key Levels (Estimated):
Support S1: $0.1835
Support S2: $0.1800
Resistance R1: $0.1885
Resistance R2: $0.1920
🎯 Trading Setup:
EP: $0.1850–$0.1860
TP: $0.1890 / $0.1920 / $0.1960
SL: $0.1825
My focus is on a confirmed higher low and a reclaim of nearby resistance. I won't rush into a position while sellers remain active.
Let the chart confirm the recovery first.
#TradFiForBeginners #KeplrAdvisesSocialLoginUsersToTransferAssets #BinanceReopensWithdrawalsForHYPE&APT #AIChipSlumpNasdaq #BitcoinFiveWeeklyLosses
151
$MAGMA — THE NEXT BOUNCE COULD TELL US A LOT! 🔥
I'm paying attention to MAGMA because liquidation pressure can sometimes create interesting reversal conditions. However, a bounce alone isn't enough. Buyers need to demonstrate that they can defend the market structure.
🔴 Long Liquidation: $1.0593K at $0.22324
The $0.22324 level is now an important reference. If price stabilizes above nearby support, a recovery attempt could develop. Losing that region may expose further downside.
📊 Key Levels (Estimated):
Support S1: $0.2210
Support S2: $0.2170
Resistance R1: $0.2270
Resistance R2: $0.2320
🎯 Trading Setup:
EP: $0.2220–$0.2240
TP: $0.2280 / $0.2330 / $0.2390
SL: $0.2180
I'm looking for a higher-low formation and stronger buying confirmation on the lower timeframe before entering.
No blind entries. The market must prove its direction.
#KeplrAdvisesSocialLoginUsersToTransferAssets #TetherPlans€28.8MForJuventusCapitalIncrease #SouthKoreaDraftLawTargets15To20%ShareholderCap #BinanceReopensWithdrawalsForHYPE&APT #BitcoinFiveWeeklyLosses
$MAGMA — THE NEXT BOUNCE COULD TELL US A LOT! 🔥
I'm paying attention to MAGMA because liquidation pressure can sometimes create interesting reversal conditions. However, a bounce alone isn't enough. Buyers need to demonstrate that they can defend the market structure.
🔴 Long Liquidation: $1.0593K at $0.22324
The $0.22324 level is now an important reference. If price stabilizes above nearby support, a recovery attempt could develop. Losing that region may expose further downside.
📊 Key Levels (Estimated):
Support S1: $0.2210
Support S2: $0.2170
Resistance R1: $0.2270
Resistance R2: $0.2320
🎯 Trading Setup:
EP: $0.2220–$0.2240
TP: $0.2280 / $0.2330 / $0.2390
SL: $0.2180
I'm looking for a higher-low formation and stronger buying confirmation on the lower timeframe before entering.
No blind entries. The market must prove its direction.
#KeplrAdvisesSocialLoginUsersToTransferAssets #TetherPlans€28.8MForJuventusCapitalIncrease #SouthKoreaDraftLawTargets15To20%ShareholderCap #BinanceReopensWithdrawalsForHYPE&APT #BitcoinFiveWeeklyLosses
I'm paying attention to MAGMA because liquidation pressure can sometimes create interesting reversal conditions. However, a bounce alone isn't enough. Buyers need to demonstrate that they can defend the market structure.
🔴 Long Liquidation: $1.0593K at $0.22324
The $0.22324 level is now an important reference. If price stabilizes above nearby support, a recovery attempt could develop. Losing that region may expose further downside.
📊 Key Levels (Estimated):
Support S1: $0.2210
Support S2: $0.2170
Resistance R1: $0.2270
Resistance R2: $0.2320
🎯 Trading Setup:
EP: $0.2220–$0.2240
TP: $0.2280 / $0.2330 / $0.2390
SL: $0.2180
I'm looking for a higher-low formation and stronger buying confirmation on the lower timeframe before entering.
No blind entries. The market must prove its direction.
#KeplrAdvisesSocialLoginUsersToTransferAssets #TetherPlans€28.8MForJuventusCapitalIncrease #SouthKoreaDraftLawTargets15To20%ShareholderCap #BinanceReopensWithdrawalsForHYPE&APT #BitcoinFiveWeeklyLosses
295
$RSR — BUYERS HAVE AN IMPORTANT LEVEL TO RECLAIM! 🚨
RSR is worth watching after another liquidation event exposed pressure on leveraged buyers. The interesting part now is whether selling momentum continues or the market starts absorbing supply around the current region.
🔴 Long Liquidation: $3.8696K at $0.0017
The $0.0017 price is an important reference for the next reaction. If buyers regain control, a recovery toward nearby resistance becomes possible. If support breaks, further downside cannot be ruled out.
📊 Key Levels (Estimated):
Support S1: $0.00168
Support S2: $0.00164
Resistance R1: $0.00173
Resistance R2: $0.00178
🎯 Trading Setup:
EP: $0.00169–$0.00171
TP: $0.00174 / $0.00178 / $0.00183
SL: $0.00166
I'm waiting for a lower-timeframe higher low and a convincing resistance reclaim. Entering before confirmation would mean taking unnecessary risk.
RSR remains on watch. Let the price action make the decision.
{future}(RSRUSDT)
#KeplrAdvisesSocialLoginUsersToTransferAssets #SouthKoreaDraftLawTargets15To20%ShareholderCap #BinanceReopensWithdrawalsForHYPE&APT #AIChipSlumpNasdaq #BitcoinFiveWeeklyLosses
$RSR — BUYERS HAVE AN IMPORTANT LEVEL TO RECLAIM! 🚨
RSR is worth watching after another liquidation event exposed pressure on leveraged buyers. The interesting part now is whether selling momentum continues or the market starts absorbing supply around the current region.
🔴 Long Liquidation: $3.8696K at $0.0017
The $0.0017 price is an important reference for the next reaction. If buyers regain control, a recovery toward nearby resistance becomes possible. If support breaks, further downside cannot be ruled out.
📊 Key Levels (Estimated):
Support S1: $0.00168
Support S2: $0.00164
Resistance R1: $0.00173
Resistance R2: $0.00178
🎯 Trading Setup:
EP: $0.00169–$0.00171
TP: $0.00174 / $0.00178 / $0.00183
SL: $0.00166
I'm waiting for a lower-timeframe higher low and a convincing resistance reclaim. Entering before confirmation would mean taking unnecessary risk.
RSR remains on watch. Let the price action make the decision.
#KeplrAdvisesSocialLoginUsersToTransferAssets #SouthKoreaDraftLawTargets15To20%ShareholderCap #BinanceReopensWithdrawalsForHYPE&APT #AIChipSlumpNasdaq #BitcoinFiveWeeklyLosses
RSR is worth watching after another liquidation event exposed pressure on leveraged buyers. The interesting part now is whether selling momentum continues or the market starts absorbing supply around the current region.
🔴 Long Liquidation: $3.8696K at $0.0017
The $0.0017 price is an important reference for the next reaction. If buyers regain control, a recovery toward nearby resistance becomes possible. If support breaks, further downside cannot be ruled out.
📊 Key Levels (Estimated):
Support S1: $0.00168
Support S2: $0.00164
Resistance R1: $0.00173
Resistance R2: $0.00178
🎯 Trading Setup:
EP: $0.00169–$0.00171
TP: $0.00174 / $0.00178 / $0.00183
SL: $0.00166
I'm waiting for a lower-timeframe higher low and a convincing resistance reclaim. Entering before confirmation would mean taking unnecessary risk.
RSR remains on watch. Let the price action make the decision.
#KeplrAdvisesSocialLoginUsersToTransferAssets #SouthKoreaDraftLawTargets15To20%ShareholderCap #BinanceReopensWithdrawalsForHYPE&APT #AIChipSlumpNasdaq #BitcoinFiveWeeklyLosses
121
$JCT — SHORT SELLERS ARE FACING PRESSURE! 🚀
What catches my attention is the latest positioning shift around JCT. When short positions start getting liquidated, the possibility of further upside deserves attention, but continuation depends on actual buying strength.
🟢 Short Liquidation: $2.6113K at $0.01079
The liquidation occurred around $0.01079. If buyers maintain support and reclaim nearby resistance, another upward attempt could develop. A rejection, however, could send price back toward lower support.
📊 Key Levels (Estimated):
Support S1: $0.01060
Support S2: $0.01030
Resistance R1: $0.01100
Resistance R2: $0.01135
🎯 Trading Setup:
EP: $0.01078–$0.01088
TP: $0.01105 / $0.01135 / $0.01170
SL: $0.01050
I'm watching for a fresh higher low followed by a clean breakout on the lower timeframe. I prefer confirmation over chasing sudden momentum.
JCT is on my radar. Ready, patient, and waiting for the right setup.
{future}(JCTUSDT)
#KeplrAdvisesSocialLoginUsersToTransferAssets #SouthKoreaDraftLawTargets15To20%ShareholderCap #BinanceReopensWithdrawalsForHYPE&APT #AIChipSlumpNasdaq #BitcoinFiveWeeklyLosses
$JCT — SHORT SELLERS ARE FACING PRESSURE! 🚀
What catches my attention is the latest positioning shift around JCT. When short positions start getting liquidated, the possibility of further upside deserves attention, but continuation depends on actual buying strength.
🟢 Short Liquidation: $2.6113K at $0.01079
The liquidation occurred around $0.01079. If buyers maintain support and reclaim nearby resistance, another upward attempt could develop. A rejection, however, could send price back toward lower support.
📊 Key Levels (Estimated):
Support S1: $0.01060
Support S2: $0.01030
Resistance R1: $0.01100
Resistance R2: $0.01135
🎯 Trading Setup:
EP: $0.01078–$0.01088
TP: $0.01105 / $0.01135 / $0.01170
SL: $0.01050
I'm watching for a fresh higher low followed by a clean breakout on the lower timeframe. I prefer confirmation over chasing sudden momentum.
JCT is on my radar. Ready, patient, and waiting for the right setup.
#KeplrAdvisesSocialLoginUsersToTransferAssets #SouthKoreaDraftLawTargets15To20%ShareholderCap #BinanceReopensWithdrawalsForHYPE&APT #AIChipSlumpNasdaq #BitcoinFiveWeeklyLosses
What catches my attention is the latest positioning shift around JCT. When short positions start getting liquidated, the possibility of further upside deserves attention, but continuation depends on actual buying strength.
🟢 Short Liquidation: $2.6113K at $0.01079
The liquidation occurred around $0.01079. If buyers maintain support and reclaim nearby resistance, another upward attempt could develop. A rejection, however, could send price back toward lower support.
📊 Key Levels (Estimated):
Support S1: $0.01060
Support S2: $0.01030
Resistance R1: $0.01100
Resistance R2: $0.01135
🎯 Trading Setup:
EP: $0.01078–$0.01088
TP: $0.01105 / $0.01135 / $0.01170
SL: $0.01050
I'm watching for a fresh higher low followed by a clean breakout on the lower timeframe. I prefer confirmation over chasing sudden momentum.
JCT is on my radar. Ready, patient, and waiting for the right setup.
#KeplrAdvisesSocialLoginUsersToTransferAssets #SouthKoreaDraftLawTargets15To20%ShareholderCap #BinanceReopensWithdrawalsForHYPE&APT #AIChipSlumpNasdaq #BitcoinFiveWeeklyLosses
172
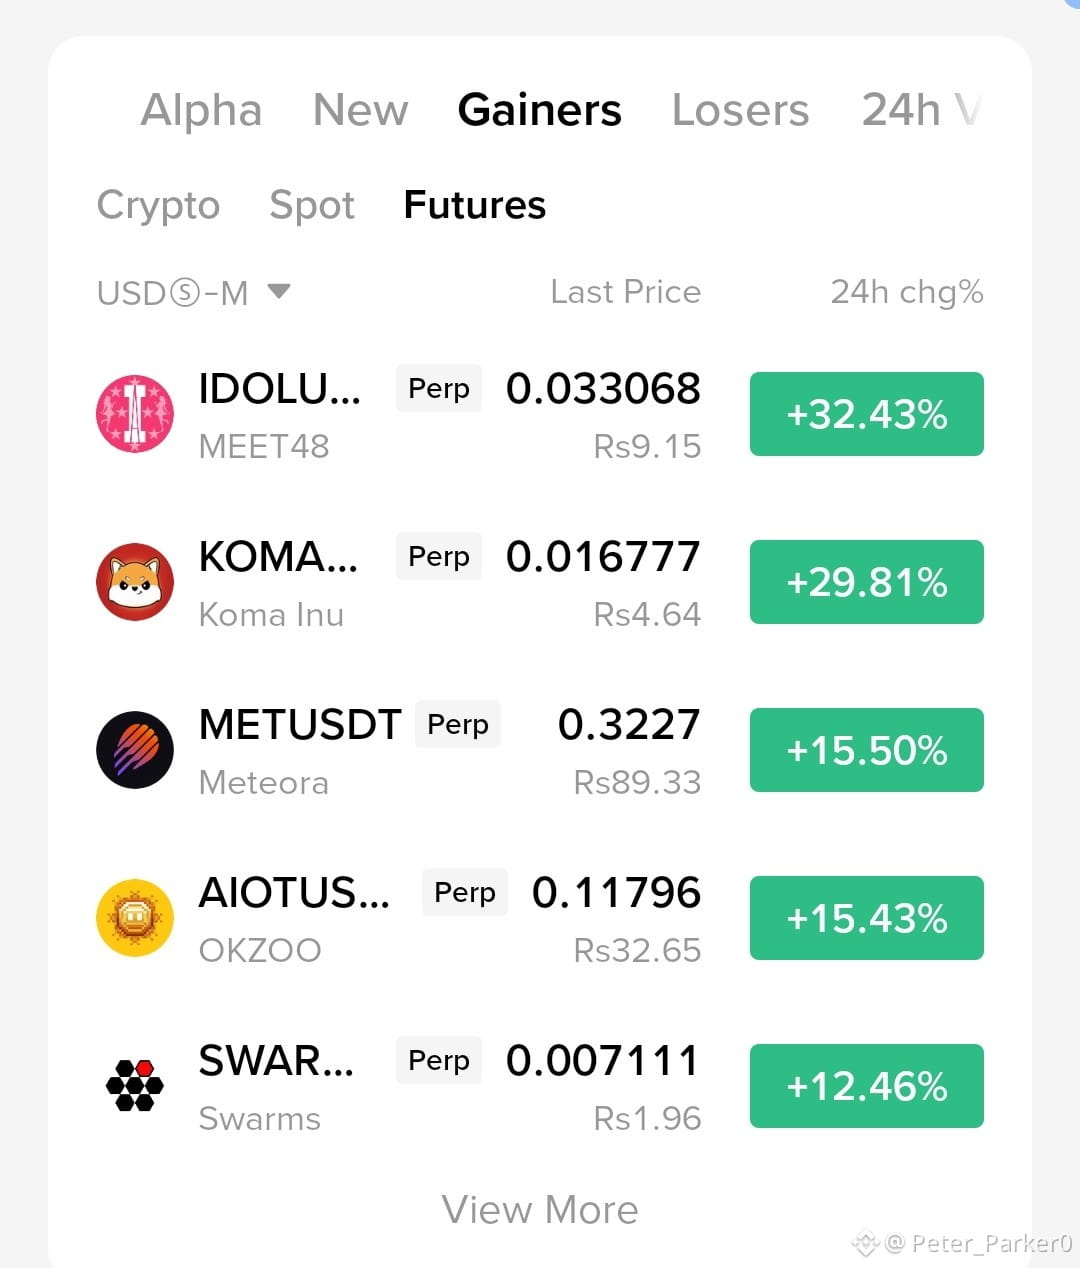
🚀 **FUTURES MARKET IS HEATING UP! THE BULLS ARE MAKING THEIR MOVE!**
Something interesting is happening across the futures market right now. Buyers are stepping in aggressively, and several altcoins are posting impressive 24-hour gains.
🔥 **Top Futures Gainers:**
🥇 MEET48 (IDOLU...)** — +32.43% | $0.033068
🥈 **Koma Inu (#KOMA ...)** — +29.81% | $0.016777
🥉 **Meteora ($MET USDT)** — +15.50% | $0.3227
⚡OKZOO ($AIOT US...)** — +15.43% | $0.11796
🔥 **$SWARMS (SWAR...)** — +12.46% | $0.007111
The standout is MEET48, leading the leaderboard with a massive 32.43% surge. Koma Inu isn't far behind, gaining nearly 30%. Meanwhile, Meteora, OKZOO, and Swarms are also showing strong upside momentum.
**Here's what I'm watching:** When multiple futures assets start climbing together, it can signal improving speculative appetite and increased trading activity. But don't mistake a green leaderboard for a guaranteed continuation.
After such aggressive moves, profit-taking, sudden pullbacks, and liquidation-driven volatility can appear quickly.
👀 The next move matters more than the current pump. Watch volume, price stability, and retests before chasing an entry.
**The market is moving fast. Smart traders stay prepared, not emotional.** 🚀
🚀 **FUTURES MARKET IS HEATING UP! THE BULLS ARE MAKING THEIR MOVE!**
Something interesting is happening across the futures market right now. Buyers are stepping in aggressively, and several altcoins are posting impressive 24-hour gains.
🔥 **Top Futures Gainers:**
🥇 MEET48 (IDOLU...)** — +32.43% | $0.033068
🥈 **Koma Inu (#KOMA ...)** — +29.81% | $0.016777
🥉 **Meteora ($MET USDT)** — +15.50% | $0.3227
⚡OKZOO ($AIOT US...)** — +15.43% | $0.11796
🔥 **$SWARMS (SWAR...)** — +12.46% | $0.007111
The standout is MEET48, leading the leaderboard with a massive 32.43% surge. Koma Inu isn't far behind, gaining nearly 30%. Meanwhile, Meteora, OKZOO, and Swarms are also showing strong upside momentum.
**Here's what I'm watching:** When multiple futures assets start climbing together, it can signal improving speculative appetite and increased trading activity. But don't mistake a green leaderboard for a guaranteed continuation.
After such aggressive moves, profit-taking, sudden pullbacks, and liquidation-driven volatility can appear quickly.
👀 The next move matters more than the current pump. Watch volume, price stability, and retests before chasing an entry.
**The market is moving fast. Smart traders stay prepared, not emotional.** 🚀
Something interesting is happening across the futures market right now. Buyers are stepping in aggressively, and several altcoins are posting impressive 24-hour gains.
🔥 **Top Futures Gainers:**
🥇 MEET48 (IDOLU...)** — +32.43% | $0.033068
🥈 **Koma Inu (#KOMA ...)** — +29.81% | $0.016777
🥉 **Meteora ($MET USDT)** — +15.50% | $0.3227
⚡OKZOO ($AIOT US...)** — +15.43% | $0.11796
🔥 **$SWARMS (SWAR...)** — +12.46% | $0.007111
The standout is MEET48, leading the leaderboard with a massive 32.43% surge. Koma Inu isn't far behind, gaining nearly 30%. Meanwhile, Meteora, OKZOO, and Swarms are also showing strong upside momentum.
**Here's what I'm watching:** When multiple futures assets start climbing together, it can signal improving speculative appetite and increased trading activity. But don't mistake a green leaderboard for a guaranteed continuation.
After such aggressive moves, profit-taking, sudden pullbacks, and liquidation-driven volatility can appear quickly.
👀 The next move matters more than the current pump. Watch volume, price stability, and retests before chasing an entry.
**The market is moving fast. Smart traders stay prepared, not emotional.** 🚀
1
581
$PUMP — BUYERS ARE BEING TESTED! ⚡
Sometimes the most important market signal isn't a breakout, but how price behaves after leveraged positions get flushed. I'm watching whether PUMP can stabilize and attract fresh buying interest after this liquidation event.
🔴 Long Liquidation: $2.6502K at $0.00364
The liquidation around $0.00364 highlights pressure on leveraged buyers. If sellers continue dominating, another downside test is possible. However, a strong recovery could create an opportunity for a short-term rebound.
📊 Key Levels (Estimated):
Support S1: $0.00360
Support S2: $0.00354
Resistance R1: $0.00370
Resistance R2: $0.00378
🎯 Trading Setup:
EP: $0.00361–$0.00365
TP: $0.00370 / $0.00376 / $0.00383
SL: $0.00355
I'm waiting for a lower-timeframe higher low and buying confirmation before considering an entry.
No rushing. Let the price action confirm the opportunity.
{future}(PUMPUSDT)
#TradFiForBeginners #WillAnthropicListOnTime #CPITestsDecemberRateOutlook #JobsReportRaisesHikeOdds
$PUMP — BUYERS ARE BEING TESTED! ⚡
Sometimes the most important market signal isn't a breakout, but how price behaves after leveraged positions get flushed. I'm watching whether PUMP can stabilize and attract fresh buying interest after this liquidation event.
🔴 Long Liquidation: $2.6502K at $0.00364
The liquidation around $0.00364 highlights pressure on leveraged buyers. If sellers continue dominating, another downside test is possible. However, a strong recovery could create an opportunity for a short-term rebound.
📊 Key Levels (Estimated):
Support S1: $0.00360
Support S2: $0.00354
Resistance R1: $0.00370
Resistance R2: $0.00378
🎯 Trading Setup:
EP: $0.00361–$0.00365
TP: $0.00370 / $0.00376 / $0.00383
SL: $0.00355
I'm waiting for a lower-timeframe higher low and buying confirmation before considering an entry.
No rushing. Let the price action confirm the opportunity.
#TradFiForBeginners #WillAnthropicListOnTime #CPITestsDecemberRateOutlook #JobsReportRaisesHikeOdds
Sometimes the most important market signal isn't a breakout, but how price behaves after leveraged positions get flushed. I'm watching whether PUMP can stabilize and attract fresh buying interest after this liquidation event.
🔴 Long Liquidation: $2.6502K at $0.00364
The liquidation around $0.00364 highlights pressure on leveraged buyers. If sellers continue dominating, another downside test is possible. However, a strong recovery could create an opportunity for a short-term rebound.
📊 Key Levels (Estimated):
Support S1: $0.00360
Support S2: $0.00354
Resistance R1: $0.00370
Resistance R2: $0.00378
🎯 Trading Setup:
EP: $0.00361–$0.00365
TP: $0.00370 / $0.00376 / $0.00383
SL: $0.00355
I'm waiting for a lower-timeframe higher low and buying confirmation before considering an entry.
No rushing. Let the price action confirm the opportunity.
#TradFiForBeginners #WillAnthropicListOnTime #CPITestsDecemberRateOutlook #JobsReportRaisesHikeOdds
413
$ENA — THE NEXT REACTION COULD BE IMPORTANT! 🔥
I'm paying attention to how ENA reacts after leveraged buyers face another round of pressure. Liquidation events can create opportunities, but the real signal comes from whether buyers manage to reclaim lost ground.
🔴 Long Liquidation: $3.2795K at $0.15594
The $0.15594 area is an important reference. If selling pressure continues, ENA could search for lower support. A recovery above nearby resistance, however, could open the door to a relief rally.
📊 Key Levels (Estimated):
Support S1: $0.1540
Support S2: $0.1515
Resistance R1: $0.1580
Resistance R2: $0.1610
🎯 Trading Setup:
EP: $0.1545–$0.1560
TP: $0.1585 / $0.1610 / $0.1640
SL: $0.1525
I'll be watching for a higher-low formation and renewed buying pressure before taking a position.
The opportunity matters, but entry confirmation matters more.
{future}(ENAUSDT)
#TradFiForBeginners #WillUS-IranTensionsBoostSafe-HavenDemand? #WillAnthropicListOnTime #JobsReportRaisesHikeOdds #TradFiForBeginners
$ENA — THE NEXT REACTION COULD BE IMPORTANT! 🔥
I'm paying attention to how ENA reacts after leveraged buyers face another round of pressure. Liquidation events can create opportunities, but the real signal comes from whether buyers manage to reclaim lost ground.
🔴 Long Liquidation: $3.2795K at $0.15594
The $0.15594 area is an important reference. If selling pressure continues, ENA could search for lower support. A recovery above nearby resistance, however, could open the door to a relief rally.
📊 Key Levels (Estimated):
Support S1: $0.1540
Support S2: $0.1515
Resistance R1: $0.1580
Resistance R2: $0.1610
🎯 Trading Setup:
EP: $0.1545–$0.1560
TP: $0.1585 / $0.1610 / $0.1640
SL: $0.1525
I'll be watching for a higher-low formation and renewed buying pressure before taking a position.
The opportunity matters, but entry confirmation matters more.
#TradFiForBeginners #WillUS-IranTensionsBoostSafe-HavenDemand? #WillAnthropicListOnTime #JobsReportRaisesHikeOdds #TradFiForBeginners
I'm paying attention to how ENA reacts after leveraged buyers face another round of pressure. Liquidation events can create opportunities, but the real signal comes from whether buyers manage to reclaim lost ground.
🔴 Long Liquidation: $3.2795K at $0.15594
The $0.15594 area is an important reference. If selling pressure continues, ENA could search for lower support. A recovery above nearby resistance, however, could open the door to a relief rally.
📊 Key Levels (Estimated):
Support S1: $0.1540
Support S2: $0.1515
Resistance R1: $0.1580
Resistance R2: $0.1610
🎯 Trading Setup:
EP: $0.1545–$0.1560
TP: $0.1585 / $0.1610 / $0.1640
SL: $0.1525
I'll be watching for a higher-low formation and renewed buying pressure before taking a position.
The opportunity matters, but entry confirmation matters more.
#TradFiForBeginners #WillUS-IranTensionsBoostSafe-HavenDemand? #WillAnthropicListOnTime #JobsReportRaisesHikeOdds #TradFiForBeginners
2
834
$THE
{future}(THEUSDT)
— A BIGGER LIQUIDATION EVENT DESERVES ATTENTION! 🚨
The market is constantly testing leveraged positioning, and THE has just recorded a notable long liquidation event. What matters now is whether sellers use this weakness to push lower or buyers step in to absorb the pressure.
🔴 Long Liquidation: $8.7672K at $0.03703
The $0.03703 level is an important reference for the next reaction. Continued weakness could expose additional downside, while a successful recovery may create room for a bullish rebound.
📊 Key Levels (Estimated):
Support S1: $0.0365
Support S2: $0.0358
Resistance R1: $0.0378
Resistance R2: $0.0386
🎯 Trading Setup:
EP: $0.0368–$0.0372
TP: $0.0379 / $0.0386 / $0.0395
SL: $0.0360
I'm not interested in catching a falling candle. I want to see buyers establish a higher low on the lower timeframe before considering a long position.
THE is worth monitoring closely. Patience will determine the entry.
#TradFiForBeginners #HKSFCPlansToRestrictCryptoAndExchangeTerms #WillUS-IranTensionsBoostSafe-HavenDemand? #WillAnthropicListOnTime #CPITestsDecemberRateOutlook
$THE
— A BIGGER LIQUIDATION EVENT DESERVES ATTENTION! 🚨
The market is constantly testing leveraged positioning, and THE has just recorded a notable long liquidation event. What matters now is whether sellers use this weakness to push lower or buyers step in to absorb the pressure.
🔴 Long Liquidation: $8.7672K at $0.03703
The $0.03703 level is an important reference for the next reaction. Continued weakness could expose additional downside, while a successful recovery may create room for a bullish rebound.
📊 Key Levels (Estimated):
Support S1: $0.0365
Support S2: $0.0358
Resistance R1: $0.0378
Resistance R2: $0.0386
🎯 Trading Setup:
EP: $0.0368–$0.0372
TP: $0.0379 / $0.0386 / $0.0395
SL: $0.0360
I'm not interested in catching a falling candle. I want to see buyers establish a higher low on the lower timeframe before considering a long position.
THE is worth monitoring closely. Patience will determine the entry.
#TradFiForBeginners #HKSFCPlansToRestrictCryptoAndExchangeTerms #WillUS-IranTensionsBoostSafe-HavenDemand? #WillAnthropicListOnTime #CPITestsDecemberRateOutlook
— A BIGGER LIQUIDATION EVENT DESERVES ATTENTION! 🚨
The market is constantly testing leveraged positioning, and THE has just recorded a notable long liquidation event. What matters now is whether sellers use this weakness to push lower or buyers step in to absorb the pressure.
🔴 Long Liquidation: $8.7672K at $0.03703
The $0.03703 level is an important reference for the next reaction. Continued weakness could expose additional downside, while a successful recovery may create room for a bullish rebound.
📊 Key Levels (Estimated):
Support S1: $0.0365
Support S2: $0.0358
Resistance R1: $0.0378
Resistance R2: $0.0386
🎯 Trading Setup:
EP: $0.0368–$0.0372
TP: $0.0379 / $0.0386 / $0.0395
SL: $0.0360
I'm not interested in catching a falling candle. I want to see buyers establish a higher low on the lower timeframe before considering a long position.
THE is worth monitoring closely. Patience will determine the entry.
#TradFiForBeginners #HKSFCPlansToRestrictCryptoAndExchangeTerms #WillUS-IranTensionsBoostSafe-HavenDemand? #WillAnthropicListOnTime #CPITestsDecemberRateOutlook
690
$AIOT — SELLING PRESSURE OR A RECOVERY OPPORTUNITY? 👀
One liquidation event doesn't define the entire trend, but it can highlight where leveraged traders are getting caught. AIOT now has an important price area to defend if buyers want to prevent further weakness.
🔴 Long Liquidation: $1.4485K at $0.11641
The liquidation occurred around $0.11641. If sellers maintain control, price could revisit lower support. On the other hand, a recovery above resistance could create an opportunity for a short-term bullish move.
📊 Key Levels (Estimated):
Support S1: $0.1150
Support S2: $0.1130
Resistance R1: $0.1180
Resistance R2: $0.1205
🎯 Trading Setup:
EP: $0.1158–$0.1166
TP: $0.1180 / $0.1200 / $0.1225
SL: $0.1140
My focus is on lower-timeframe structure. A confirmed higher low would make the recovery setup more interesting.
I'm staying patient until price gives a convincing signal.
{future}(AIOTUSDT)
#HKSFCPlansToRestrictCryptoAndExchangeTerms #WillUS-IranTensionsBoostSafe-HavenDemand? #WillAnthropicListOnTime #CPITestsDecemberRateOutlook #JobsReportRaisesHikeOdds
$AIOT — SELLING PRESSURE OR A RECOVERY OPPORTUNITY? 👀
One liquidation event doesn't define the entire trend, but it can highlight where leveraged traders are getting caught. AIOT now has an important price area to defend if buyers want to prevent further weakness.
🔴 Long Liquidation: $1.4485K at $0.11641
The liquidation occurred around $0.11641. If sellers maintain control, price could revisit lower support. On the other hand, a recovery above resistance could create an opportunity for a short-term bullish move.
📊 Key Levels (Estimated):
Support S1: $0.1150
Support S2: $0.1130
Resistance R1: $0.1180
Resistance R2: $0.1205
🎯 Trading Setup:
EP: $0.1158–$0.1166
TP: $0.1180 / $0.1200 / $0.1225
SL: $0.1140
My focus is on lower-timeframe structure. A confirmed higher low would make the recovery setup more interesting.
I'm staying patient until price gives a convincing signal.
#HKSFCPlansToRestrictCryptoAndExchangeTerms #WillUS-IranTensionsBoostSafe-HavenDemand? #WillAnthropicListOnTime #CPITestsDecemberRateOutlook #JobsReportRaisesHikeOdds
One liquidation event doesn't define the entire trend, but it can highlight where leveraged traders are getting caught. AIOT now has an important price area to defend if buyers want to prevent further weakness.
🔴 Long Liquidation: $1.4485K at $0.11641
The liquidation occurred around $0.11641. If sellers maintain control, price could revisit lower support. On the other hand, a recovery above resistance could create an opportunity for a short-term bullish move.
📊 Key Levels (Estimated):
Support S1: $0.1150
Support S2: $0.1130
Resistance R1: $0.1180
Resistance R2: $0.1205
🎯 Trading Setup:
EP: $0.1158–$0.1166
TP: $0.1180 / $0.1200 / $0.1225
SL: $0.1140
My focus is on lower-timeframe structure. A confirmed higher low would make the recovery setup more interesting.
I'm staying patient until price gives a convincing signal.
#HKSFCPlansToRestrictCryptoAndExchangeTerms #WillUS-IranTensionsBoostSafe-HavenDemand? #WillAnthropicListOnTime #CPITestsDecemberRateOutlook #JobsReportRaisesHikeOdds
290
$ONE — SHORT SELLERS ARE GETTING CAUGHT! 🚀
I'm watching ONE closely because the latest liquidation event puts attention on the possibility of a short-term momentum shift. The important question is whether buyers can maintain pressure and turn this reaction into a stronger upward move.
🟢 Short Liquidation: $1.1893K at $0.00208
Short positions were liquidated around $0.00208. This could support another recovery attempt if buyers remain active, although continuation still needs confirmation.
📊 Key Levels (Estimated):
Support S1: $0.00205
Support S2: $0.00201
Resistance R1: $0.00212
Resistance R2: $0.00217
🎯 Trading Setup:
EP: $0.002075–$0.002090
TP: $0.00212 / $0.00217 / $0.00222
SL: $0.00204
I'm looking for a clean higher low followed by a resistance breakout on the lower timeframe. I won't chase price if momentum becomes extended.
ONE is on my radar. Waiting for confirmation before making the move.
{future}(ONEUSDT)
#CPITestsDecemberRateOutlook #JobsReportRaisesHikeOdds #TradFiForBeginners #HKSFCPlansToRestrictCryptoAndExchangeTerms is
$ONE — SHORT SELLERS ARE GETTING CAUGHT! 🚀
I'm watching ONE closely because the latest liquidation event puts attention on the possibility of a short-term momentum shift. The important question is whether buyers can maintain pressure and turn this reaction into a stronger upward move.
🟢 Short Liquidation: $1.1893K at $0.00208
Short positions were liquidated around $0.00208. This could support another recovery attempt if buyers remain active, although continuation still needs confirmation.
📊 Key Levels (Estimated):
Support S1: $0.00205
Support S2: $0.00201
Resistance R1: $0.00212
Resistance R2: $0.00217
🎯 Trading Setup:
EP: $0.002075–$0.002090
TP: $0.00212 / $0.00217 / $0.00222
SL: $0.00204
I'm looking for a clean higher low followed by a resistance breakout on the lower timeframe. I won't chase price if momentum becomes extended.
ONE is on my radar. Waiting for confirmation before making the move.
#CPITestsDecemberRateOutlook #JobsReportRaisesHikeOdds #TradFiForBeginners #HKSFCPlansToRestrictCryptoAndExchangeTerms is
I'm watching ONE closely because the latest liquidation event puts attention on the possibility of a short-term momentum shift. The important question is whether buyers can maintain pressure and turn this reaction into a stronger upward move.
🟢 Short Liquidation: $1.1893K at $0.00208
Short positions were liquidated around $0.00208. This could support another recovery attempt if buyers remain active, although continuation still needs confirmation.
📊 Key Levels (Estimated):
Support S1: $0.00205
Support S2: $0.00201
Resistance R1: $0.00212
Resistance R2: $0.00217
🎯 Trading Setup:
EP: $0.002075–$0.002090
TP: $0.00212 / $0.00217 / $0.00222
SL: $0.00204
I'm looking for a clean higher low followed by a resistance breakout on the lower timeframe. I won't chase price if momentum becomes extended.
ONE is on my radar. Waiting for confirmation before making the move.
#CPITestsDecemberRateOutlook #JobsReportRaisesHikeOdds #TradFiForBeginners #HKSFCPlansToRestrictCryptoAndExchangeTerms is
487
📍 $STXB – Bullish Momentum Setup
STX is showing bullish momentum after pushing through the $0.3441 liquidation level. Buyers could maintain control if price holds above $0.3400.
Support: $0.3400
Resistance: $0.3510
🎯 Targets:
TP1: $0.3510
TP2: $0.3580
⚠️ Invalidation:
A breakdown below $0.3360 could weaken the bullish structure and trigger a correction toward $0.3280.
#HKSFCPlansToRestrictCryptoAndExchangeTerms #HKSFCPlansToRestrictCryptoAndExchangeTerms #WillAnthropicListOnTime #CPITestsDecemberRateOutlook #WillUS-IranTensionsBoostSafe-HavenDemand?
📍 $STXB – Bullish Momentum Setup
STX is showing bullish momentum after pushing through the $0.3441 liquidation level. Buyers could maintain control if price holds above $0.3400.
Support: $0.3400
Resistance: $0.3510
🎯 Targets:
TP1: $0.3510
TP2: $0.3580
⚠️ Invalidation:
A breakdown below $0.3360 could weaken the bullish structure and trigger a correction toward $0.3280.
#HKSFCPlansToRestrictCryptoAndExchangeTerms #HKSFCPlansToRestrictCryptoAndExchangeTerms #WillAnthropicListOnTime #CPITestsDecemberRateOutlook #WillUS-IranTensionsBoostSafe-HavenDemand?
STX is showing bullish momentum after pushing through the $0.3441 liquidation level. Buyers could maintain control if price holds above $0.3400.
Support: $0.3400
Resistance: $0.3510
🎯 Targets:
TP1: $0.3510
TP2: $0.3580
⚠️ Invalidation:
A breakdown below $0.3360 could weaken the bullish structure and trigger a correction toward $0.3280.
#HKSFCPlansToRestrictCryptoAndExchangeTerms #HKSFCPlansToRestrictCryptoAndExchangeTerms #WillAnthropicListOnTime #CPITestsDecemberRateOutlook #WillUS-IranTensionsBoostSafe-HavenDemand?
87
🚀 $AIOT – Bullish Breakout Structure
AIOT is showing positive momentum after pushing above the $0.11404 liquidation level. Holding above $0.1125 could keep buyers in control.
Support: $0.1125
Resistance: $0.1165
🎯 Targets:
TP1: $0.1165
TP2: $0.1190
⚠️ Invalidation:
A breakdown below $0.1105 could trigger bearish pressure, opening a correction toward $0.1075.
#CPITestsDecemberRateOutlook #WillUS-IranTensionsBoostSafe-HavenDemand? #WillAnthropicListOnTime #WillAnthropicListOnTime #WillAnthropicListOnTime
🚀 $AIOT – Bullish Breakout Structure
AIOT is showing positive momentum after pushing above the $0.11404 liquidation level. Holding above $0.1125 could keep buyers in control.
Support: $0.1125
Resistance: $0.1165
🎯 Targets:
TP1: $0.1165
TP2: $0.1190
⚠️ Invalidation:
A breakdown below $0.1105 could trigger bearish pressure, opening a correction toward $0.1075.
#CPITestsDecemberRateOutlook #WillUS-IranTensionsBoostSafe-HavenDemand? #WillAnthropicListOnTime #WillAnthropicListOnTime #WillAnthropicListOnTime
AIOT is showing positive momentum after pushing above the $0.11404 liquidation level. Holding above $0.1125 could keep buyers in control.
Support: $0.1125
Resistance: $0.1165
🎯 Targets:
TP1: $0.1165
TP2: $0.1190
⚠️ Invalidation:
A breakdown below $0.1105 could trigger bearish pressure, opening a correction toward $0.1075.
#CPITestsDecemberRateOutlook #WillUS-IranTensionsBoostSafe-HavenDemand? #WillAnthropicListOnTime #WillAnthropicListOnTime #WillAnthropicListOnTime
354
🎯 $ARIA – Bullish Continuation Setup
ARIA is attempting to maintain its bullish structure after moving through the $0.15919 level. Buyers need to defend $0.1565 to sustain upward momentum.
Support: $0.1565
Resistance: $0.1630
🎯 Targets:
TP1: $0.1630
TP2: $0.1670
⚠️ Invalidation:
A breakdown below $0.1535 could weaken the recovery structure and expose $0.1490.
#HKSFCPlansToRestrictCryptoAndExchangeTerms #TradFiForBeginners #WillAnthropicListOnTime #JobsReportRaisesHikeOdds #WillAnthropicListOnTime
🎯 $ARIA – Bullish Continuation Setup
ARIA is attempting to maintain its bullish structure after moving through the $0.15919 level. Buyers need to defend $0.1565 to sustain upward momentum.
Support: $0.1565
Resistance: $0.1630
🎯 Targets:
TP1: $0.1630
TP2: $0.1670
⚠️ Invalidation:
A breakdown below $0.1535 could weaken the recovery structure and expose $0.1490.
#HKSFCPlansToRestrictCryptoAndExchangeTerms #TradFiForBeginners #WillAnthropicListOnTime #JobsReportRaisesHikeOdds #WillAnthropicListOnTime
ARIA is attempting to maintain its bullish structure after moving through the $0.15919 level. Buyers need to defend $0.1565 to sustain upward momentum.
Support: $0.1565
Resistance: $0.1630
🎯 Targets:
TP1: $0.1630
TP2: $0.1670
⚠️ Invalidation:
A breakdown below $0.1535 could weaken the recovery structure and expose $0.1490.
#HKSFCPlansToRestrictCryptoAndExchangeTerms #TradFiForBeginners #WillAnthropicListOnTime #JobsReportRaisesHikeOdds #WillAnthropicListOnTime
281
🔻 $CYBER – Bearish Breakdown Setup
CYBER is facing selling pressure after the long liquidation at $0.30471. Sellers could maintain control while price remains below $0.3075.
Resistance: $0.3075
Support: $0.2990
🎯 Targets:
TP1: $0.2990
TP2: $0.2940
⚠️ Invalidation:
A breakout above $0.3110 could invalidate the bearish setup and trigger a reversal toward $0.3160.
#TradFiForBeginners #WillAnthropicListOnTime #CPITestsDecemberRateOutlook #WillAnthropicListOnTime
🔻 $CYBER – Bearish Breakdown Setup
CYBER is facing selling pressure after the long liquidation at $0.30471. Sellers could maintain control while price remains below $0.3075.
Resistance: $0.3075
Support: $0.2990
🎯 Targets:
TP1: $0.2990
TP2: $0.2940
⚠️ Invalidation:
A breakout above $0.3110 could invalidate the bearish setup and trigger a reversal toward $0.3160.
#TradFiForBeginners #WillAnthropicListOnTime #CPITestsDecemberRateOutlook #WillAnthropicListOnTime
CYBER is facing selling pressure after the long liquidation at $0.30471. Sellers could maintain control while price remains below $0.3075.
Resistance: $0.3075
Support: $0.2990
🎯 Targets:
TP1: $0.2990
TP2: $0.2940
⚠️ Invalidation:
A breakout above $0.3110 could invalidate the bearish setup and trigger a reversal toward $0.3160.
#TradFiForBeginners #WillAnthropicListOnTime #CPITestsDecemberRateOutlook #WillAnthropicListOnTime
350
📍 $ONE – Bullish Recovery Setup
ONE is showing early bullish momentum after pushing through the $0.00197 liquidation level. Holding above $0.00194 could support another upward move.
Support: $0.00194
Resistance: $0.00201
🎯 Targets:
TP1: $0.00201
TP2: $0.00205
⚠️ Invalidation:
A breakdown below $0.00191 could shift momentum toward sellers, exposing $0.00187.
#TradFiForBeginners #WillUS-IranTensionsBoostSafe-HavenDemand? #CPITestsDecemberRateOutlook #JobsReportRaisesHikeOdds #WillUS-IranTensionsBoostSafe-HavenDemand?
📍 $ONE – Bullish Recovery Setup
ONE is showing early bullish momentum after pushing through the $0.00197 liquidation level. Holding above $0.00194 could support another upward move.
Support: $0.00194
Resistance: $0.00201
🎯 Targets:
TP1: $0.00201
TP2: $0.00205
⚠️ Invalidation:
A breakdown below $0.00191 could shift momentum toward sellers, exposing $0.00187.
#TradFiForBeginners #WillUS-IranTensionsBoostSafe-HavenDemand? #CPITestsDecemberRateOutlook #JobsReportRaisesHikeOdds #WillUS-IranTensionsBoostSafe-HavenDemand?
ONE is showing early bullish momentum after pushing through the $0.00197 liquidation level. Holding above $0.00194 could support another upward move.
Support: $0.00194
Resistance: $0.00201
🎯 Targets:
TP1: $0.00201
TP2: $0.00205
⚠️ Invalidation:
A breakdown below $0.00191 could shift momentum toward sellers, exposing $0.00187.
#TradFiForBeginners #WillUS-IranTensionsBoostSafe-HavenDemand? #CPITestsDecemberRateOutlook #JobsReportRaisesHikeOdds #WillUS-IranTensionsBoostSafe-HavenDemand?
431
$PEPE
{spot}(PEPEUSDT)
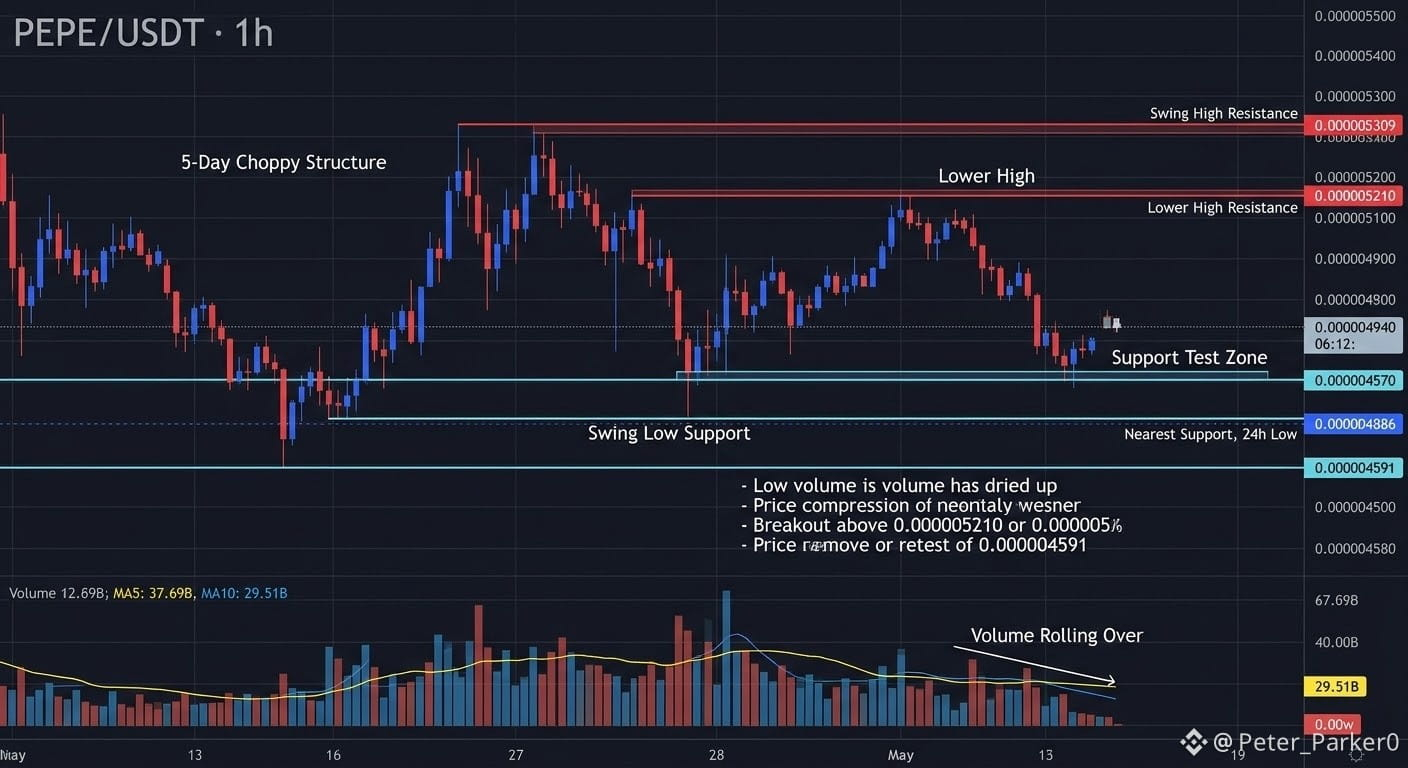
PEPE/USDT on the 1h chart caught my eye because the volume has dried up almost completely while price sits in the middle of a wide range.
Zooming out, the five-day structure has been choppy. Price dropped to a swing low at 0.000004591, bounced hard to a high at 0.000005309, then pulled back, made a lower high near 0.000005210, and is now trading around 0.000004940, down roughly 3% on the day. That lower high matters. Buyers are still defending dips, but they are no longer pushing to new highs.
On the indicators, the volume moving averages (MA5 around 37.69B, MA10 around 29.51B) are both rolling over, and current volume is thin. That suggests compression and indecision rather than conviction. The 24h low at 0.000004886 is the nearest support, while 0.000005210 is the nearest resistance. Price is sandwiched between them, so neither bulls nor bears have control. None of this guarantees a direction.
This is where FOMO usually costs people money. One green candle on low volume can easily be a bounce inside a range, and buying it means paying a worse price with no confirmation behind it.
On the setup, I haven't defined a firm entry, stop-loss, or targets here, and I won't invent them. Without a set entry and stop, a risk-to-reward ratio can't be calculated honestly. I'd only build one once price reacts at the levels above.
For confirmation, I want to see a 1h close above 0.000005210 with volume expanding, which would break the lower-high structure. A clean loss of 0.000004886 would invalidate any bullish idea and put the 0.000004591 low back in play.
This is an uncertain setup. Protect capital first, size small, and accept that sitting out is a valid trade.
Do you see this as accumulation inside the range, or a slow bleed toward the 0.000004591 low?
#JobsReportRaisesHikeOdds
#CPITestsDecemberRateOutlook #WillAnthropicListOnTime #HKSFCPlansToRestrictCryptoAndExchangeTerms #TradFiForBeginners
$PEPE
PEPE/USDT on the 1h chart caught my eye because the volume has dried up almost completely while price sits in the middle of a wide range.
Zooming out, the five-day structure has been choppy. Price dropped to a swing low at 0.000004591, bounced hard to a high at 0.000005309, then pulled back, made a lower high near 0.000005210, and is now trading around 0.000004940, down roughly 3% on the day. That lower high matters. Buyers are still defending dips, but they are no longer pushing to new highs.
On the indicators, the volume moving averages (MA5 around 37.69B, MA10 around 29.51B) are both rolling over, and current volume is thin. That suggests compression and indecision rather than conviction. The 24h low at 0.000004886 is the nearest support, while 0.000005210 is the nearest resistance. Price is sandwiched between them, so neither bulls nor bears have control. None of this guarantees a direction.
This is where FOMO usually costs people money. One green candle on low volume can easily be a bounce inside a range, and buying it means paying a worse price with no confirmation behind it.
On the setup, I haven't defined a firm entry, stop-loss, or targets here, and I won't invent them. Without a set entry and stop, a risk-to-reward ratio can't be calculated honestly. I'd only build one once price reacts at the levels above.
For confirmation, I want to see a 1h close above 0.000005210 with volume expanding, which would break the lower-high structure. A clean loss of 0.000004886 would invalidate any bullish idea and put the 0.000004591 low back in play.
This is an uncertain setup. Protect capital first, size small, and accept that sitting out is a valid trade.
Do you see this as accumulation inside the range, or a slow bleed toward the 0.000004591 low?
#JobsReportRaisesHikeOdds
#CPITestsDecemberRateOutlook #WillAnthropicListOnTime #HKSFCPlansToRestrictCryptoAndExchangeTerms #TradFiForBeginners
PEPE/USDT on the 1h chart caught my eye because the volume has dried up almost completely while price sits in the middle of a wide range.
Zooming out, the five-day structure has been choppy. Price dropped to a swing low at 0.000004591, bounced hard to a high at 0.000005309, then pulled back, made a lower high near 0.000005210, and is now trading around 0.000004940, down roughly 3% on the day. That lower high matters. Buyers are still defending dips, but they are no longer pushing to new highs.
On the indicators, the volume moving averages (MA5 around 37.69B, MA10 around 29.51B) are both rolling over, and current volume is thin. That suggests compression and indecision rather than conviction. The 24h low at 0.000004886 is the nearest support, while 0.000005210 is the nearest resistance. Price is sandwiched between them, so neither bulls nor bears have control. None of this guarantees a direction.
This is where FOMO usually costs people money. One green candle on low volume can easily be a bounce inside a range, and buying it means paying a worse price with no confirmation behind it.
On the setup, I haven't defined a firm entry, stop-loss, or targets here, and I won't invent them. Without a set entry and stop, a risk-to-reward ratio can't be calculated honestly. I'd only build one once price reacts at the levels above.
For confirmation, I want to see a 1h close above 0.000005210 with volume expanding, which would break the lower-high structure. A clean loss of 0.000004886 would invalidate any bullish idea and put the 0.000004591 low back in play.
This is an uncertain setup. Protect capital first, size small, and accept that sitting out is a valid trade.
Do you see this as accumulation inside the range, or a slow bleed toward the 0.000004591 low?
#JobsReportRaisesHikeOdds
#CPITestsDecemberRateOutlook #WillAnthropicListOnTime #HKSFCPlansToRestrictCryptoAndExchangeTerms #TradFiForBeginners
2
489
🚨 $ICNT — VIP SHORT SIGNAL
📍 Liquidation Alert: $1.0006K at $0.28912 (Binance)
📉 Entry Zone: $0.2880 – $0.2910
🎯 TP1: $0.2840
🎯 TP2: $0.2790
🎯 TP3: $0.2730
🎯 TP4: $0.2660
🛑 Stop Loss: $0.2960
⚡ Market Outlook:
Watch for rejection around the entry zone. If sellers regain control, downside continuation could develop. Avoid entering without confirmation.
Manage your risk!
{future}(ICNTUSDT)
#CanUSStocksReboundAfterNonfarmPayrolls? #JobsReportRaisesHikeOdds #AnthropicIPOValuationDoubts #USMidtermsCouldShakeUpUS-IranTies #BinanceReopensWithdrawalsForMoreAssets
🚨 $ICNT — VIP SHORT SIGNAL
📍 Liquidation Alert: $1.0006K at $0.28912 (Binance)
📉 Entry Zone: $0.2880 – $0.2910
🎯 TP1: $0.2840
🎯 TP2: $0.2790
🎯 TP3: $0.2730
🎯 TP4: $0.2660
🛑 Stop Loss: $0.2960
⚡ Market Outlook:
Watch for rejection around the entry zone. If sellers regain control, downside continuation could develop. Avoid entering without confirmation.
Manage your risk!
#CanUSStocksReboundAfterNonfarmPayrolls? #JobsReportRaisesHikeOdds #AnthropicIPOValuationDoubts #USMidtermsCouldShakeUpUS-IranTies #BinanceReopensWithdrawalsForMoreAssets
📍 Liquidation Alert: $1.0006K at $0.28912 (Binance)
📉 Entry Zone: $0.2880 – $0.2910
🎯 TP1: $0.2840
🎯 TP2: $0.2790
🎯 TP3: $0.2730
🎯 TP4: $0.2660
🛑 Stop Loss: $0.2960
⚡ Market Outlook:
Watch for rejection around the entry zone. If sellers regain control, downside continuation could develop. Avoid entering without confirmation.
Manage your risk!
#CanUSStocksReboundAfterNonfarmPayrolls? #JobsReportRaisesHikeOdds #AnthropicIPOValuationDoubts #USMidtermsCouldShakeUpUS-IranTies #BinanceReopensWithdrawalsForMoreAssets
329
🔴 $CYBER — VIP MARKET SIGNAL
📍 Liquidation Alert: $1.1333K at $0.38507
📉 Entry Zone: $0.3820 – $0.3880
🎯 TP1: $0.3760
🎯 TP2: $0.3690
🎯 TP3: $0.3610
🎯 TP4: $0.3520
🛑 Stop Loss: $0.3970
⚡ Market Outlook:
Long liquidations suggest downside pressure, but wait for a failed recovery or bearish retest before considering a short.
Risk management comes first!
{future}(CYBERUSDT)
#USMidtermsCouldShakeUpUS-IranTies #USNovemberMichiganExpectationsIndexPrelimAt50.9 #CanUSStocksReboundAfterNonfarmPayrolls? #JobsReportRaisesHikeOdds
🔴 $CYBER — VIP MARKET SIGNAL
📍 Liquidation Alert: $1.1333K at $0.38507
📉 Entry Zone: $0.3820 – $0.3880
🎯 TP1: $0.3760
🎯 TP2: $0.3690
🎯 TP3: $0.3610
🎯 TP4: $0.3520
🛑 Stop Loss: $0.3970
⚡ Market Outlook:
Long liquidations suggest downside pressure, but wait for a failed recovery or bearish retest before considering a short.
Risk management comes first!
#USMidtermsCouldShakeUpUS-IranTies #USNovemberMichiganExpectationsIndexPrelimAt50.9 #CanUSStocksReboundAfterNonfarmPayrolls? #JobsReportRaisesHikeOdds
📍 Liquidation Alert: $1.1333K at $0.38507
📉 Entry Zone: $0.3820 – $0.3880
🎯 TP1: $0.3760
🎯 TP2: $0.3690
🎯 TP3: $0.3610
🎯 TP4: $0.3520
🛑 Stop Loss: $0.3970
⚡ Market Outlook:
Long liquidations suggest downside pressure, but wait for a failed recovery or bearish retest before considering a short.
Risk management comes first!
#USMidtermsCouldShakeUpUS-IranTies #USNovemberMichiganExpectationsIndexPrelimAt50.9 #CanUSStocksReboundAfterNonfarmPayrolls? #JobsReportRaisesHikeOdds
1
660
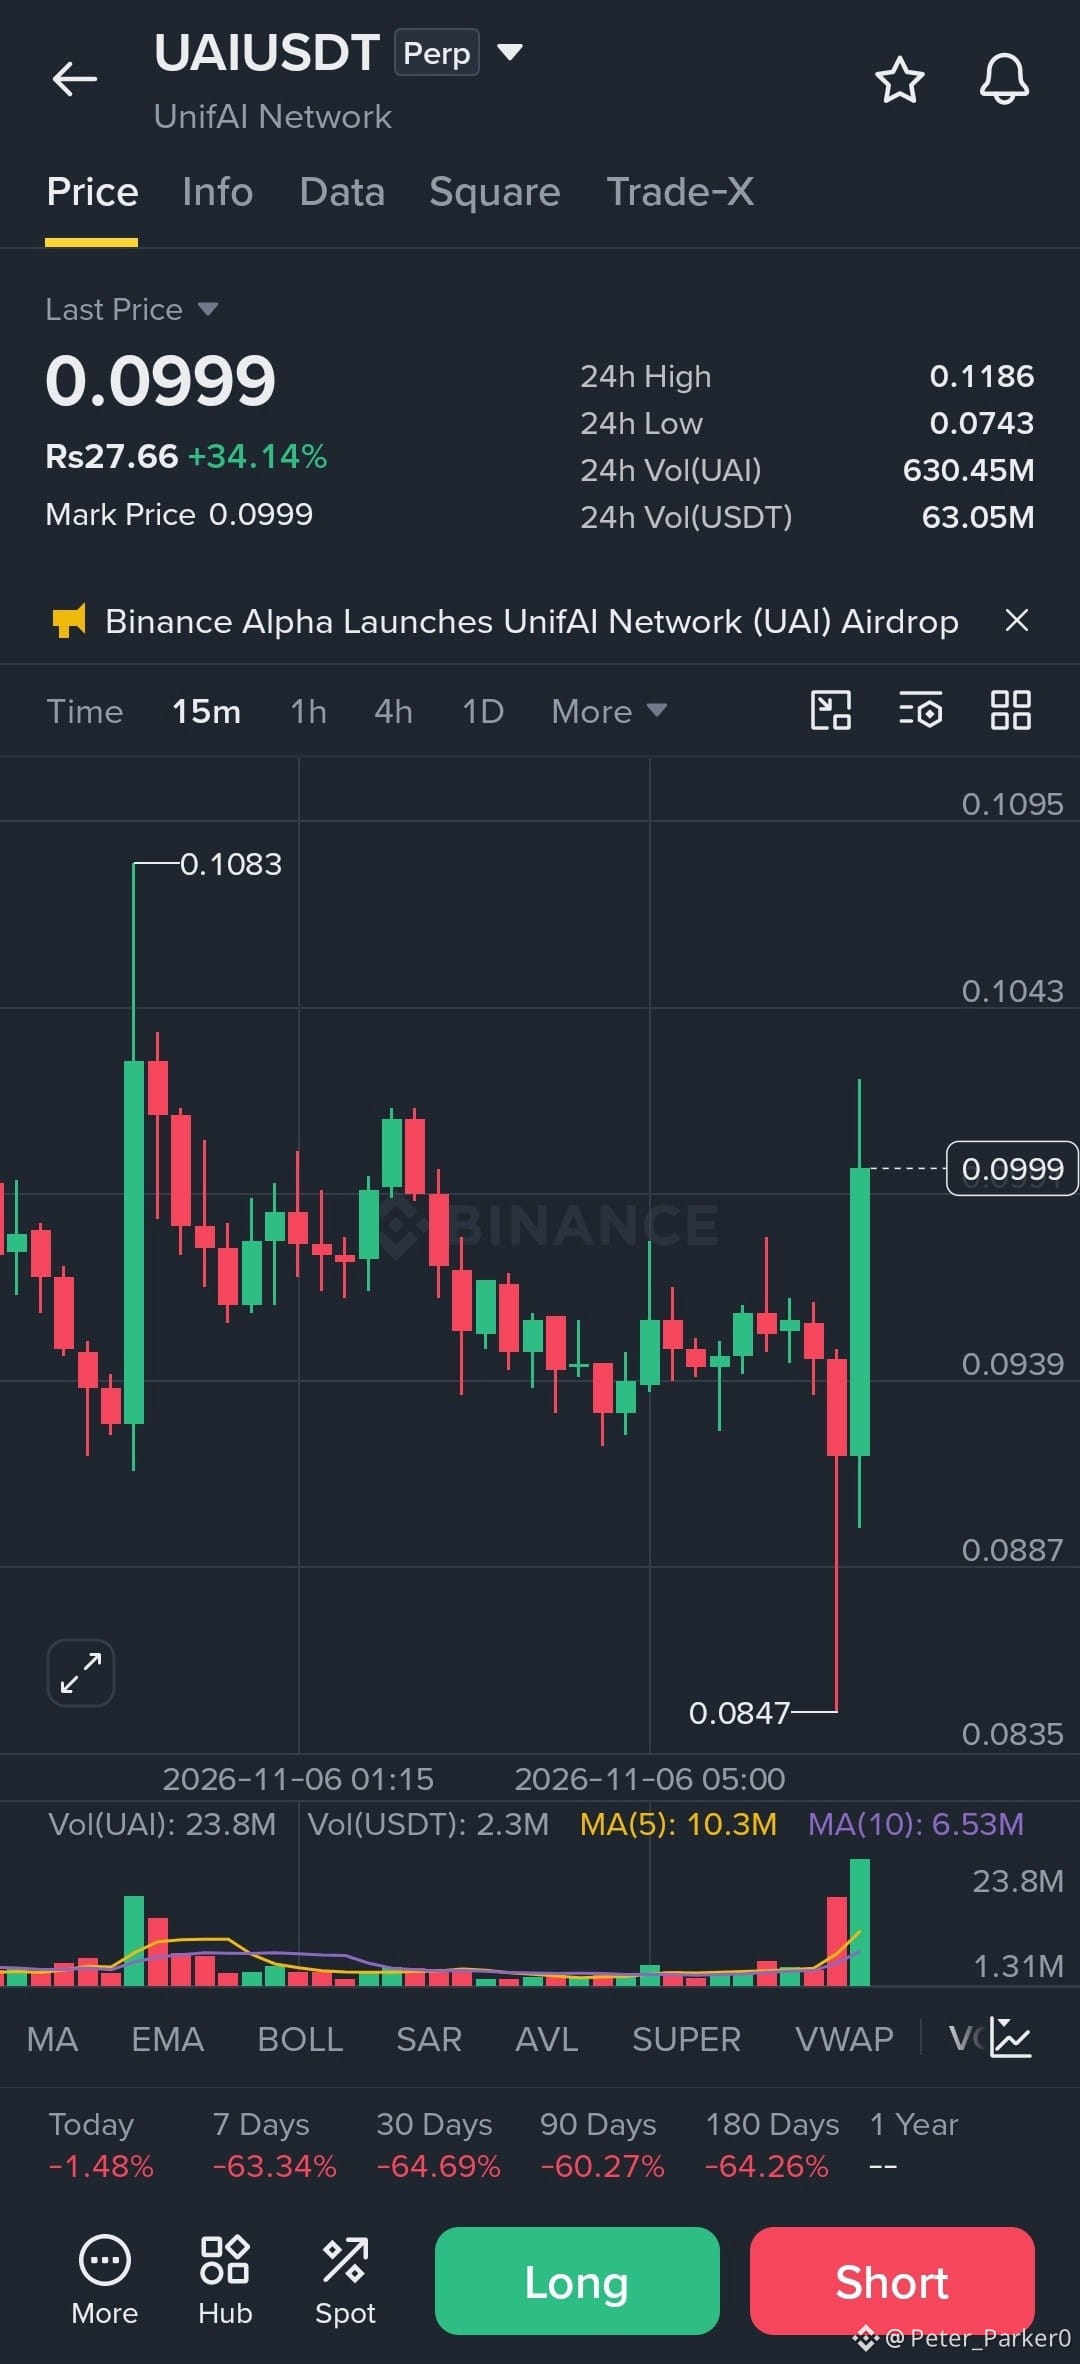
🚨 $UAI — SHORT SQUEEZE ALERT! THE BEARS ARE UNDER PRESSURE! 🔥
Something interesting is happening around $UAI, and this is the kind of market activity I wouldn't ignore.
🔴 Liquidation Alert
- Coin: $UAI
- Position: Short
- Exchange: Binance
- Liquidated Amount: $1.5852K
- Liquidation Price: $0.10168
⚡ WHAT DOES THIS SIGNAL?
A short liquidation at $0.10168 indicates that bearish traders holding leveraged positions were forced out as price moved against them. This could be an early sign of buying pressure building in the market.
The interesting part is what happens next. If buyers continue defending higher prices, additional short positions could come under pressure, potentially creating a squeeze-driven move.
📊 KEY LEVELS TO WATCH
- Immediate Support: $0.1000
- Stronger Support: $0.0970
- First Resistance: $0.1035
- Major Resistance: $0.1060
- Upside Watch Zone: $0.1100
🎯 MY MARKET OUTLOOK
I'm watching whether UAI can maintain momentum above $0.10168. A sustained move above $0.1035 could strengthen the bullish scenario and open the door toward $0.1060–$0.1100.
However, rejection around resistance could bring sellers back into control. A breakdown below $0.1000 would weaken the immediate bullish outlook.
⚠️ TRADING STRATEGY: Avoid chasing sudden candles. Wait for confirmation, monitor volume, and manage leverage carefully.
The next move matters more than the liquidation itself. Keep $UAI on your radar! 🚀
{future}(UAIUSDT)
#AnthropicIPOValuationDoubts
#BinanceReopensWithdrawalsForMoreAssets
#USStocksSlipandCryptoMarketUnderBroadPressure
#StrategySTRCResumesIssuanceAfterOver170Days #GreekParliamentPasses10%CryptoCapitalGainsTaxBill
🚨 $UAI — SHORT SQUEEZE ALERT! THE BEARS ARE UNDER PRESSURE! 🔥
Something interesting is happening around $UAI , and this is the kind of market activity I wouldn't ignore.
🔴 Liquidation Alert
- Coin: $UAI
- Position: Short
- Exchange: Binance
- Liquidated Amount: $1.5852K
- Liquidation Price: $0.10168
⚡ WHAT DOES THIS SIGNAL?
A short liquidation at $0.10168 indicates that bearish traders holding leveraged positions were forced out as price moved against them. This could be an early sign of buying pressure building in the market.
The interesting part is what happens next. If buyers continue defending higher prices, additional short positions could come under pressure, potentially creating a squeeze-driven move.
📊 KEY LEVELS TO WATCH
- Immediate Support: $0.1000
- Stronger Support: $0.0970
- First Resistance: $0.1035
- Major Resistance: $0.1060
- Upside Watch Zone: $0.1100
🎯 MY MARKET OUTLOOK
I'm watching whether UAI can maintain momentum above $0.10168. A sustained move above $0.1035 could strengthen the bullish scenario and open the door toward $0.1060–$0.1100.
However, rejection around resistance could bring sellers back into control. A breakdown below $0.1000 would weaken the immediate bullish outlook.
⚠️ TRADING STRATEGY: Avoid chasing sudden candles. Wait for confirmation, monitor volume, and manage leverage carefully.
The next move matters more than the liquidation itself. Keep $UAI on your radar! 🚀
#AnthropicIPOValuationDoubts
#BinanceReopensWithdrawalsForMoreAssets
#USStocksSlipandCryptoMarketUnderBroadPressure
#StrategySTRCResumesIssuanceAfterOver170Days #GreekParliamentPasses10%CryptoCapitalGainsTaxBill
Something interesting is happening around $UAI , and this is the kind of market activity I wouldn't ignore.
🔴 Liquidation Alert
- Coin: $UAI
- Position: Short
- Exchange: Binance
- Liquidated Amount: $1.5852K
- Liquidation Price: $0.10168
⚡ WHAT DOES THIS SIGNAL?
A short liquidation at $0.10168 indicates that bearish traders holding leveraged positions were forced out as price moved against them. This could be an early sign of buying pressure building in the market.
The interesting part is what happens next. If buyers continue defending higher prices, additional short positions could come under pressure, potentially creating a squeeze-driven move.
📊 KEY LEVELS TO WATCH
- Immediate Support: $0.1000
- Stronger Support: $0.0970
- First Resistance: $0.1035
- Major Resistance: $0.1060
- Upside Watch Zone: $0.1100
🎯 MY MARKET OUTLOOK
I'm watching whether UAI can maintain momentum above $0.10168. A sustained move above $0.1035 could strengthen the bullish scenario and open the door toward $0.1060–$0.1100.
However, rejection around resistance could bring sellers back into control. A breakdown below $0.1000 would weaken the immediate bullish outlook.
⚠️ TRADING STRATEGY: Avoid chasing sudden candles. Wait for confirmation, monitor volume, and manage leverage carefully.
The next move matters more than the liquidation itself. Keep $UAI on your radar! 🚀
#AnthropicIPOValuationDoubts
#BinanceReopensWithdrawalsForMoreAssets
#USStocksSlipandCryptoMarketUnderBroadPressure
#StrategySTRCResumesIssuanceAfterOver170Days #GreekParliamentPasses10%CryptoCapitalGainsTaxBill
433
Log in to explore more content
Join global crypto users on Binance Square
⚡️ Get latest and useful information about crypto.
💬 Trusted by the world’s largest crypto exchange.
👍 Discover real insights from verified creators.
Email / Phone number
Trending Topics
HuangRisksOusterOverReportedAffairWithSubordinate
8,853 views
167 Discussing
Nvidia Board Meets to Decide Jensen Huang's Future as Crisis Deepens
Binance News
·9 Likes
·5.4k views
AnthropicRejectsIPODelayValuationinQuestion
435,582 views
3,692 Discussing
CoreWeaveJumps10%On168%RevenueGrowth
50,701 views
716 Discussing