
币圈十二叔
3.4k Posts

币圈十二叔
Report
Block User
量化交易员🤠量化带单中欢迎跟单🤖币安手续费八折返佣码: SR988
High-Frequency Trader
1.1 Years
12 Following
1.1K+ Followers
412 Liked
Posts
All
Quotes
Videos
·
--
I observed that $SKYAI 's current market value is approximately $58.62 million, and the sentiment in the past 24 hours is neutral.
The long orders for SC02 M1 are still waiting; the entry level is within the LVN, and it has not been affected by the weak zone.
The current support zone width is about 2.67%.
This upward move has been going on for 3 hours and 47 minutes already, with a maximum increase of 13.91%.
The "Dragon Strategy" is to go long only when potential is >95 to start; "Slaying the Dragon" is to short when momentum is overheated and has burned out—one set of rules is crystal clear, and it’s not based on guesswork. If you want to follow, go to my homepage.
I observed that $SKYAI 's current market value is approximately $58.62 million, and the sentiment in the past 24 hours is neutral.
The long orders for SC02 M1 are still waiting; the entry level is within the LVN, and it has not been affected by the weak zone.
The current support zone width is about 2.67%.
This upward move has been going on for 3 hours and 47 minutes already, with a maximum increase of 13.91%.
The "Dragon Strategy" is to go long only when potential is >95 to start; "Slaying the Dragon" is to short when momentum is overheated and has burned out—one set of rules is crystal clear, and it’s not based on guesswork. If you want to follow, go to my homepage.
The long orders for SC02 M1 are still waiting; the entry level is within the LVN, and it has not been affected by the weak zone.
The current support zone width is about 2.67%.
This upward move has been going on for 3 hours and 47 minutes already, with a maximum increase of 13.91%.
The "Dragon Strategy" is to go long only when potential is >95 to start; "Slaying the Dragon" is to short when momentum is overheated and has burned out—one set of rules is crystal clear, and it’s not based on guesswork. If you want to follow, go to my homepage.
23
·
--
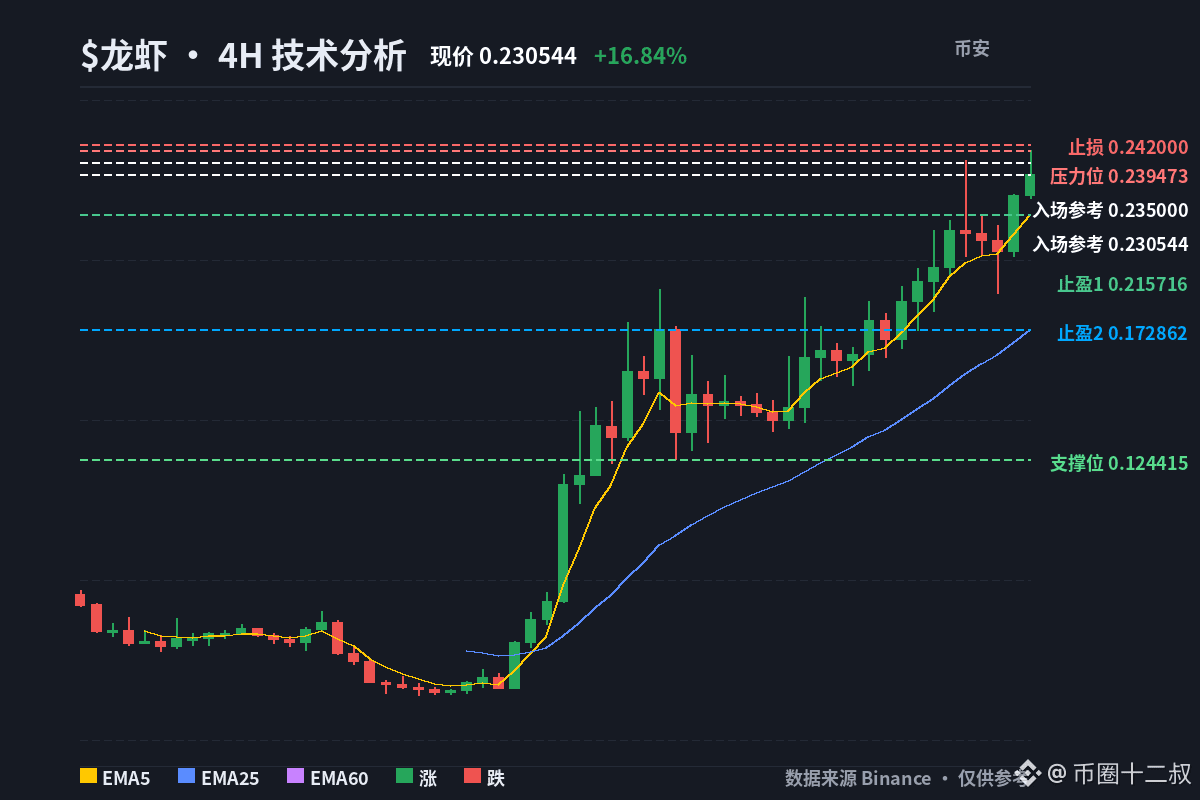
Chasing the highs is exhilarating for a moment; when it falls, it turns into a cremation pit. $Lobster: In 4 hours, it was pulled from 0.04 to 0.24. On the daily timeframe, 30 candles rose 1080.7%. RSI 7/14 hit 83.6 and 78.2 respectively. I won’t chase the current price—I’ll wait for a bounce to short.
The technical structure really is strong. On the 4-hour chart, EMA5, 25, and 60 are still in a bullish alignment; on the daily chart, EMA5 is also far above EMA25. But a strong trend stacked with extreme overbought means the recent 3 4-hour candles show volatility of 10.17%, and the daily is even at 27.79%. The odds for anyone buying at this point aren’t great anymore.
The real danger is positioning. OI is $182 million—close to 80% of the market cap of about $23 million. The 24-hour funding rate cumulative is +0.1977%. The longs are paying to keep the crowd crowded. The long/short ratio in the account is only 0.4316, but whales hold 1.6861 times—there’s a clear divergence in positioning. If price meets resistance in the 0.235—0.240 area on a bounce, the ones more likely to let go first are the higher-cost longs.
$Lobster is stronger than BTC relative to it, but the whole market is down 1.48% over the last 24 hours—this is an independent pump. When the tide goes out, there’s no broad-market support. The contract has been listed for 188 days—price discovery hasn’t fully played out, and volatility won’t give hesitant people too much time. If it holds above 0.240, I’ll admit defeat; if it doesn’t, I’ll first look for a drop back to the 4-hour EMA5, then the EMA25.
📊 Direction: wait for a bounce to short
💰 Entry reference: short after a bounce meets resistance around 0.235—0.240
🛑 Stop loss: above 0.242—immediately exit after triggered
🎯 Take profit 1: 0.215716, corresponding to 4-hour EMA5
🎯 Take profit 2: 0.172862, corresponding to 4-hour EMA25
You can respect the trend, but crowded positions can’t be used as a reason to buy.
Are you going to keep squeezing the shorts above 0.240, or will the longs let go after a bounce meets resistance? Pick one.
$Lobster #技术分析 #Twelve Uncle
If you can see the rhythm of this Lobster move, go check out my copy-trading approach on the Binance homepage—only follow if it fits】【
Click my homepage to copy trade now
https://www.binance.com/zh-CN/copy-trading/lead-details/5051200019981811968
Chasing the highs is exhilarating for a moment; when it falls, it turns into a cremation pit. $Lobster: In 4 hours, it was pulled from 0.04 to 0.24. On the daily timeframe, 30 candles rose 1080.7%. RSI 7/14 hit 83.6 and 78.2 respectively. I won’t chase the current price—I’ll wait for a bounce to short.
The technical structure really is strong. On the 4-hour chart, EMA5, 25, and 60 are still in a bullish alignment; on the daily chart, EMA5 is also far above EMA25. But a strong trend stacked with extreme overbought means the recent 3 4-hour candles show volatility of 10.17%, and the daily is even at 27.79%. The odds for anyone buying at this point aren’t great anymore.
The real danger is positioning. OI is $182 million—close to 80% of the market cap of about $23 million. The 24-hour funding rate cumulative is +0.1977%. The longs are paying to keep the crowd crowded. The long/short ratio in the account is only 0.4316, but whales hold 1.6861 times—there’s a clear divergence in positioning. If price meets resistance in the 0.235—0.240 area on a bounce, the ones more likely to let go first are the higher-cost longs.
$Lobster is stronger than BTC relative to it, but the whole market is down 1.48% over the last 24 hours—this is an independent pump. When the tide goes out, there’s no broad-market support. The contract has been listed for 188 days—price discovery hasn’t fully played out, and volatility won’t give hesitant people too much time. If it holds above 0.240, I’ll admit defeat; if it doesn’t, I’ll first look for a drop back to the 4-hour EMA5, then the EMA25.
📊 Direction: wait for a bounce to short
💰 Entry reference: short after a bounce meets resistance around 0.235—0.240
🛑 Stop loss: above 0.242—immediately exit after triggered
🎯 Take profit 1: 0.215716, corresponding to 4-hour EMA5
🎯 Take profit 2: 0.172862, corresponding to 4-hour EMA25
You can respect the trend, but crowded positions can’t be used as a reason to buy.
Are you going to keep squeezing the shorts above 0.240, or will the longs let go after a bounce meets resistance? Pick one.
$Lobster #技术分析 #Twelve Uncle
If you can see the rhythm of this Lobster move, go check out my copy-trading approach on the Binance homepage—only follow if it fits】【
Click my homepage to copy trade now
https://www.binance.com/zh-CN/copy-trading/lead-details/5051200019981811968
The technical structure really is strong. On the 4-hour chart, EMA5, 25, and 60 are still in a bullish alignment; on the daily chart, EMA5 is also far above EMA25. But a strong trend stacked with extreme overbought means the recent 3 4-hour candles show volatility of 10.17%, and the daily is even at 27.79%. The odds for anyone buying at this point aren’t great anymore.
The real danger is positioning. OI is $182 million—close to 80% of the market cap of about $23 million. The 24-hour funding rate cumulative is +0.1977%. The longs are paying to keep the crowd crowded. The long/short ratio in the account is only 0.4316, but whales hold 1.6861 times—there’s a clear divergence in positioning. If price meets resistance in the 0.235—0.240 area on a bounce, the ones more likely to let go first are the higher-cost longs.
$Lobster is stronger than BTC relative to it, but the whole market is down 1.48% over the last 24 hours—this is an independent pump. When the tide goes out, there’s no broad-market support. The contract has been listed for 188 days—price discovery hasn’t fully played out, and volatility won’t give hesitant people too much time. If it holds above 0.240, I’ll admit defeat; if it doesn’t, I’ll first look for a drop back to the 4-hour EMA5, then the EMA25.
📊 Direction: wait for a bounce to short
💰 Entry reference: short after a bounce meets resistance around 0.235—0.240
🛑 Stop loss: above 0.242—immediately exit after triggered
🎯 Take profit 1: 0.215716, corresponding to 4-hour EMA5
🎯 Take profit 2: 0.172862, corresponding to 4-hour EMA25
You can respect the trend, but crowded positions can’t be used as a reason to buy.
Are you going to keep squeezing the shorts above 0.240, or will the longs let go after a bounce meets resistance? Pick one.
$Lobster #技术分析 #Twelve Uncle
If you can see the rhythm of this Lobster move, go check out my copy-trading approach on the Binance homepage—only follow if it fits】【
Click my homepage to copy trade now
https://www.binance.com/zh-CN/copy-trading/lead-details/5051200019981811968
11
·
--
I find this Leopold move quite interesting: I just bought an AI bullish call option for a day, and then news comes out that AI progress is slowing down—there’s a bit of a contradiction.
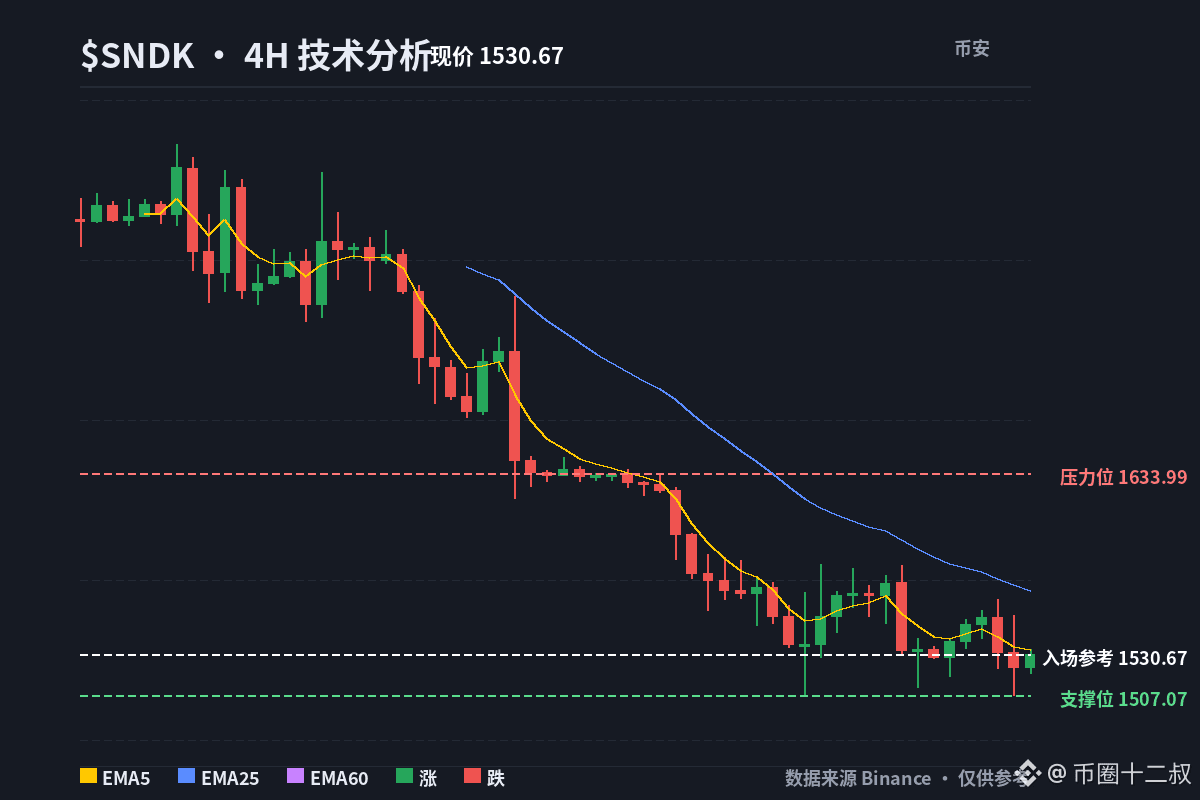
The real core is actually very clear—fully overweighting storage: $SNDK 28.1% and $MU 27.6%, with the two together at 55.7%.
AI infrastructure hasn’t been neglected either—$TSM is 6.3%, and there are also allocations to energy infrastructure and European AI cloud, with the other positions at roughly 22.5%.
This isn’t buying a bunch of stories scattered around—the main bet is clearly on the storage theme.
My capital will automatically rotate from weaker strategies into stronger modules: contract in headwinds, add more in tailwinds, and the drawdown guardrails are dynamic. There’s a live-trading entry point on the homepage.
I find this Leopold move quite interesting: I just bought an AI bullish call option for a day, and then news comes out that AI progress is slowing down—there’s a bit of a contradiction.
The real core is actually very clear—fully overweighting storage: $SNDK 28.1% and $MU 27.6%, with the two together at 55.7%.
AI infrastructure hasn’t been neglected either—$TSM is 6.3%, and there are also allocations to energy infrastructure and European AI cloud, with the other positions at roughly 22.5%.
This isn’t buying a bunch of stories scattered around—the main bet is clearly on the storage theme.
My capital will automatically rotate from weaker strategies into stronger modules: contract in headwinds, add more in tailwinds, and the drawdown guardrails are dynamic. There’s a live-trading entry point on the homepage.
The real core is actually very clear—fully overweighting storage: $SNDK 28.1% and $MU 27.6%, with the two together at 55.7%.
AI infrastructure hasn’t been neglected either—$TSM is 6.3%, and there are also allocations to energy infrastructure and European AI cloud, with the other positions at roughly 22.5%.
This isn’t buying a bunch of stories scattered around—the main bet is clearly on the storage theme.
My capital will automatically rotate from weaker strategies into stronger modules: contract in headwinds, add more in tailwinds, and the drawdown guardrails are dynamic. There’s a live-trading entry point on the homepage.
81
·
--
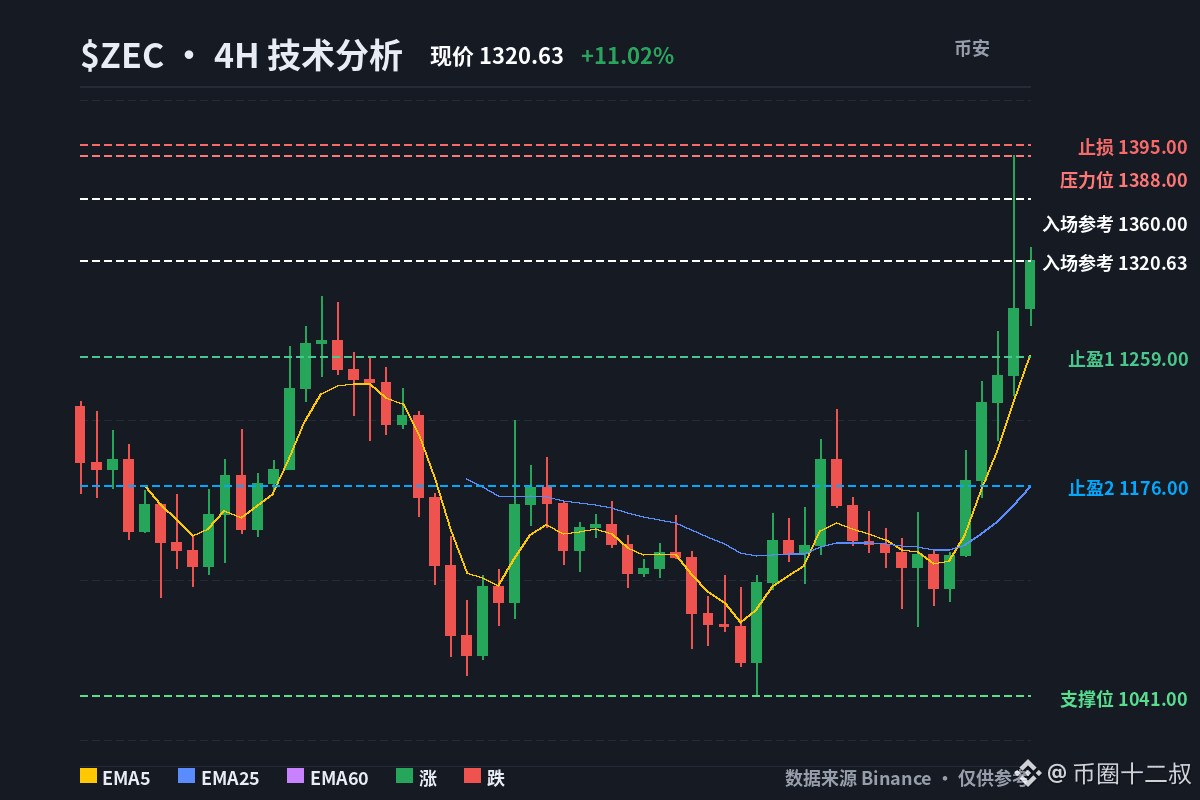
$ZEC —the stronger it rallies, the less I want to chase a long directly at $1320.63. The 4-hour RSI(7) is already at 85.6. The price has clearly pulled away from the EMA25 at $1175.51. The recent three candlesticks’ volatility is still 7.11%. This isn’t a comfortable spot to chase; it’s a place to wait for sentiment to cool down.
What’s more interesting on the board: the cumulative 24-hour funding rate is -0.0482%, and the long/short account ratio is only 0.4031—shorts are paying. That really provides squeeze fuel. But the price has already risen from the daily range low of $500.3 to $1321.25, with OI at about 13.4% of market cap. Leverage participation isn’t light. If the shorts keep covering, $ZEC could test the prior high at $1388. But once it faces pressure near $1388, both low-entry shorting and high-entry longs will start to loosen.
The daily chart is still bullish in alignment: EMA5 is at $1188.48, RSI(14) is 69.5—the trend hasn’t broken. However, for the short term, the odds no longer fit a mark-to-market chase. BTC is only up 0.21%, while the whole market is down 1.82%. That’s independent strength for $ZEC . Independent price action can keep forcing a squeeze, and it also means that during the tide-out there won’t be strong support from the broader market.
My plan is simple: wait to short when the rebound comes close to $1360. Only when price approaches the prior-high area will the risk-reward start to look reasonable. There’s no point to keep hard-holding once it stands above $1388—admit the mistake and exit.
📊 Direction: Short
💰 Entry reference: Around $1360
🛑 Stop loss: $1395. Exit after it stands above the prior high $1388
🎯 Take profit 1: $1259—watch the 4-hour EMA5
🎯 Take profit 2: $1176—watch the 4-hour EMA25
You can respect the trend, but you can’t take trades with overheated odds.
When you see $1388 get rejected and drop, will you still be short—or will you continue squeezing it with negative funding? Pick one.
$ZEC #技术分析 #Uncle Twelve
If you want to save time watching the screen, you can go to my Binance public domain copy-trading lead page and follow along
Click my profile to copy trade immediately
https://www.binance.com/zh-CN/copy-trading/lead-details/5051200019981811968
$ZEC —the stronger it rallies, the less I want to chase a long directly at $1320.63. The 4-hour RSI(7) is already at 85.6. The price has clearly pulled away from the EMA25 at $1175.51. The recent three candlesticks’ volatility is still 7.11%. This isn’t a comfortable spot to chase; it’s a place to wait for sentiment to cool down.
What’s more interesting on the board: the cumulative 24-hour funding rate is -0.0482%, and the long/short account ratio is only 0.4031—shorts are paying. That really provides squeeze fuel. But the price has already risen from the daily range low of $500.3 to $1321.25, with OI at about 13.4% of market cap. Leverage participation isn’t light. If the shorts keep covering, $ZEC could test the prior high at $1388. But once it faces pressure near $1388, both low-entry shorting and high-entry longs will start to loosen.
The daily chart is still bullish in alignment: EMA5 is at $1188.48, RSI(14) is 69.5—the trend hasn’t broken. However, for the short term, the odds no longer fit a mark-to-market chase. BTC is only up 0.21%, while the whole market is down 1.82%. That’s independent strength for $ZEC . Independent price action can keep forcing a squeeze, and it also means that during the tide-out there won’t be strong support from the broader market.
My plan is simple: wait to short when the rebound comes close to $1360. Only when price approaches the prior-high area will the risk-reward start to look reasonable. There’s no point to keep hard-holding once it stands above $1388—admit the mistake and exit.
📊 Direction: Short
💰 Entry reference: Around $1360
🛑 Stop loss: $1395. Exit after it stands above the prior high $1388
🎯 Take profit 1: $1259—watch the 4-hour EMA5
🎯 Take profit 2: $1176—watch the 4-hour EMA25
You can respect the trend, but you can’t take trades with overheated odds.
When you see $1388 get rejected and drop, will you still be short—or will you continue squeezing it with negative funding? Pick one.
$ZEC #技术分析 #Uncle Twelve
If you want to save time watching the screen, you can go to my Binance public domain copy-trading lead page and follow along
Click my profile to copy trade immediately
https://www.binance.com/zh-CN/copy-trading/lead-details/5051200019981811968
What’s more interesting on the board: the cumulative 24-hour funding rate is -0.0482%, and the long/short account ratio is only 0.4031—shorts are paying. That really provides squeeze fuel. But the price has already risen from the daily range low of $500.3 to $1321.25, with OI at about 13.4% of market cap. Leverage participation isn’t light. If the shorts keep covering, $ZEC could test the prior high at $1388. But once it faces pressure near $1388, both low-entry shorting and high-entry longs will start to loosen.
The daily chart is still bullish in alignment: EMA5 is at $1188.48, RSI(14) is 69.5—the trend hasn’t broken. However, for the short term, the odds no longer fit a mark-to-market chase. BTC is only up 0.21%, while the whole market is down 1.82%. That’s independent strength for $ZEC . Independent price action can keep forcing a squeeze, and it also means that during the tide-out there won’t be strong support from the broader market.
My plan is simple: wait to short when the rebound comes close to $1360. Only when price approaches the prior-high area will the risk-reward start to look reasonable. There’s no point to keep hard-holding once it stands above $1388—admit the mistake and exit.
📊 Direction: Short
💰 Entry reference: Around $1360
🛑 Stop loss: $1395. Exit after it stands above the prior high $1388
🎯 Take profit 1: $1259—watch the 4-hour EMA5
🎯 Take profit 2: $1176—watch the 4-hour EMA25
You can respect the trend, but you can’t take trades with overheated odds.
When you see $1388 get rejected and drop, will you still be short—or will you continue squeezing it with negative funding? Pick one.
$ZEC #技术分析 #Uncle Twelve
If you want to save time watching the screen, you can go to my Binance public domain copy-trading lead page and follow along
Click my profile to copy trade immediately
https://www.binance.com/zh-CN/copy-trading/lead-details/5051200019981811968
6
·
--
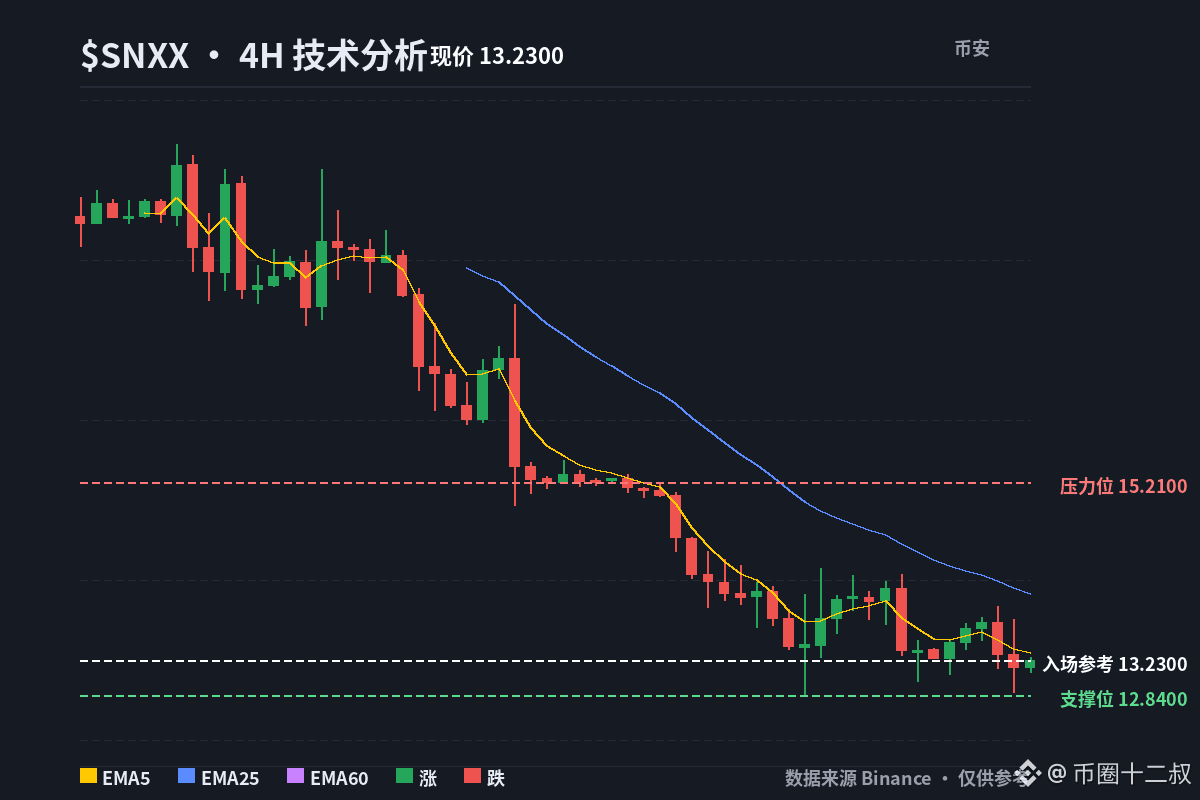
I’m thinking, if the broader market really turns strong, which has more upside potential—$SNXX or $NBIL?
In the leading-stock playbook, the potential for “going long” comes only when the market is still early (potential > 95) and hasn’t fully started. “Slaying the dragon” means when the heat is already exhausted, you go short. The rules are clear and straightforward—no guesswork. If you want to follow along, go to my homepage.
I’m thinking, if the broader market really turns strong, which has more upside potential—$SNXX or $NBIL?
In the leading-stock playbook, the potential for “going long” comes only when the market is still early (potential > 95) and hasn’t fully started. “Slaying the dragon” means when the heat is already exhausted, you go short. The rules are clear and straightforward—no guesswork. If you want to follow along, go to my homepage.
In the leading-stock playbook, the potential for “going long” comes only when the market is still early (potential > 95) and hasn’t fully started. “Slaying the dragon” means when the heat is already exhausted, you go short. The rules are clear and straightforward—no guesswork. If you want to follow along, go to my homepage.
2
·
--
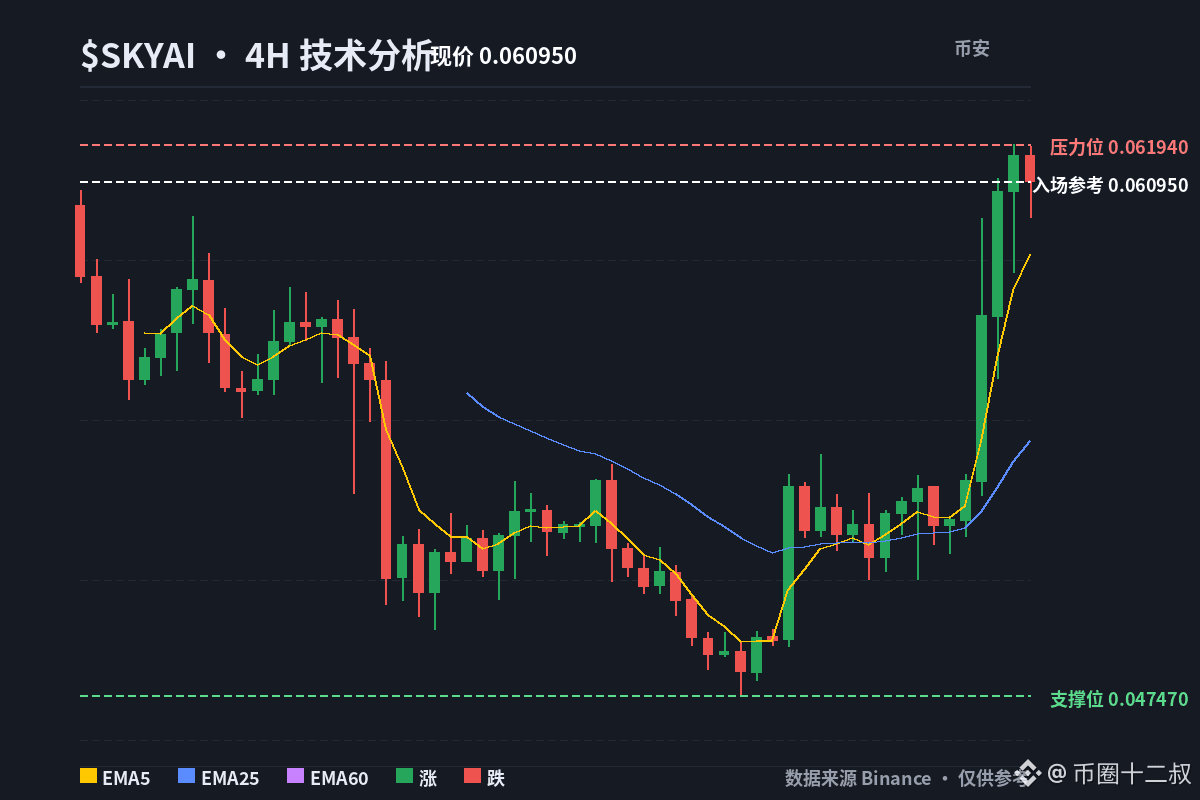
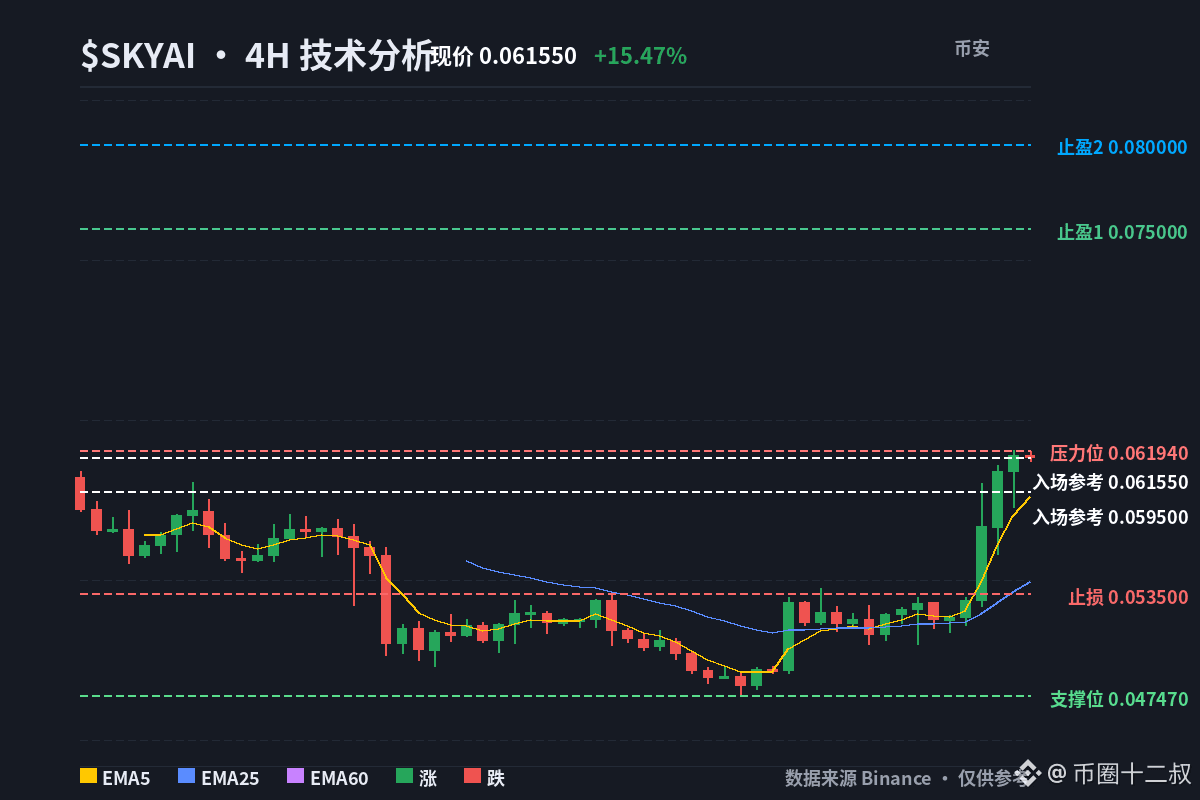
$SKYAI The real thing to watch is $0.0595: it’s clinging to the 4-hour EMA5 at $0.059243. Pullbacks that hold—then I go long; current price $0.0607—don’t chase.
In the past 4 hours, the single-candlestick traded value is about 116k USDT; the most recent daily candle is about $19.63 million. Trading is active, but there hasn’t been enough consecutive volume to serve as evidence, so you can’t just treat +15.47% as a confirmed breakout. The volatility of the last 3 four-hour candles is already over 5%, and the daily is 11.4%—your margin for chasing is shrinking.
The moving-average structure is still bullish: on the 4-hour chart, EMA5 is above EMA25 and EMA60. However, RSI7=87.5 and RSI14=76.3—short-term is clearly overheated. Funding rate over the last 24 hours is cumulatively +0.0796%, and both the account and big holders are also leaning long. OI is about 65.6% of market cap, so the long positions aren’t light. The overall market is weak; this move by $SKYAI is standalone strength. It can keep pushing higher, but during pullbacks there’s also a lack of broader market support.
I only wait for a pullback and confirmation around $0.0595. If it breaks below $0.0535, it means the 4-hour long structure is broken—cut and step aside immediately.
First, look for the daily rebound upside to $0.075; then, also watch the $0.08 area near the highs of the prior range. Don’t chase the emotion in the middle.
📈 Direction: Long
💰 Entry reference: Pullback confirmation around $0.0595
🛑 Stop loss: $0.0535; exit after a break
🎯 Take profit 1: $0.075; refer to rebound space before the upper edge of the daily range
🎯 Take profit 2: $0.08; refer to the pressure area below the prior $0.09 high
You can hold the trend, but don’t chase the overheating.
Are you going to stand at $0.0595 for the pullback bounce and hold—or are you going to break down after the crowded long positions fail at $0.0535? Choose one.
$SKYAI #技术分析 #Twelve Uncle
If you like Twelve Uncle’s thought process, just go to Binance homepage and follow the copy trade
Click my profile to start following immediately
https://www.binance.com/zh-CN/copy-trading/lead-details/5051200019981811968
$SKYAI The real thing to watch is $0.0595: it’s clinging to the 4-hour EMA5 at $0.059243. Pullbacks that hold—then I go long; current price $0.0607—don’t chase.
In the past 4 hours, the single-candlestick traded value is about 116k USDT; the most recent daily candle is about $19.63 million. Trading is active, but there hasn’t been enough consecutive volume to serve as evidence, so you can’t just treat +15.47% as a confirmed breakout. The volatility of the last 3 four-hour candles is already over 5%, and the daily is 11.4%—your margin for chasing is shrinking.
The moving-average structure is still bullish: on the 4-hour chart, EMA5 is above EMA25 and EMA60. However, RSI7=87.5 and RSI14=76.3—short-term is clearly overheated. Funding rate over the last 24 hours is cumulatively +0.0796%, and both the account and big holders are also leaning long. OI is about 65.6% of market cap, so the long positions aren’t light. The overall market is weak; this move by $SKYAI is standalone strength. It can keep pushing higher, but during pullbacks there’s also a lack of broader market support.
I only wait for a pullback and confirmation around $0.0595. If it breaks below $0.0535, it means the 4-hour long structure is broken—cut and step aside immediately.
First, look for the daily rebound upside to $0.075; then, also watch the $0.08 area near the highs of the prior range. Don’t chase the emotion in the middle.
📈 Direction: Long
💰 Entry reference: Pullback confirmation around $0.0595
🛑 Stop loss: $0.0535; exit after a break
🎯 Take profit 1: $0.075; refer to rebound space before the upper edge of the daily range
🎯 Take profit 2: $0.08; refer to the pressure area below the prior $0.09 high
You can hold the trend, but don’t chase the overheating.
Are you going to stand at $0.0595 for the pullback bounce and hold—or are you going to break down after the crowded long positions fail at $0.0535? Choose one.
$SKYAI #技术分析 #Twelve Uncle
If you like Twelve Uncle’s thought process, just go to Binance homepage and follow the copy trade
Click my profile to start following immediately
https://www.binance.com/zh-CN/copy-trading/lead-details/5051200019981811968
In the past 4 hours, the single-candlestick traded value is about 116k USDT; the most recent daily candle is about $19.63 million. Trading is active, but there hasn’t been enough consecutive volume to serve as evidence, so you can’t just treat +15.47% as a confirmed breakout. The volatility of the last 3 four-hour candles is already over 5%, and the daily is 11.4%—your margin for chasing is shrinking.
The moving-average structure is still bullish: on the 4-hour chart, EMA5 is above EMA25 and EMA60. However, RSI7=87.5 and RSI14=76.3—short-term is clearly overheated. Funding rate over the last 24 hours is cumulatively +0.0796%, and both the account and big holders are also leaning long. OI is about 65.6% of market cap, so the long positions aren’t light. The overall market is weak; this move by $SKYAI is standalone strength. It can keep pushing higher, but during pullbacks there’s also a lack of broader market support.
I only wait for a pullback and confirmation around $0.0595. If it breaks below $0.0535, it means the 4-hour long structure is broken—cut and step aside immediately.
First, look for the daily rebound upside to $0.075; then, also watch the $0.08 area near the highs of the prior range. Don’t chase the emotion in the middle.
📈 Direction: Long
💰 Entry reference: Pullback confirmation around $0.0595
🛑 Stop loss: $0.0535; exit after a break
🎯 Take profit 1: $0.075; refer to rebound space before the upper edge of the daily range
🎯 Take profit 2: $0.08; refer to the pressure area below the prior $0.09 high
You can hold the trend, but don’t chase the overheating.
Are you going to stand at $0.0595 for the pullback bounce and hold—or are you going to break down after the crowded long positions fail at $0.0535? Choose one.
$SKYAI #技术分析 #Twelve Uncle
If you like Twelve Uncle’s thought process, just go to Binance homepage and follow the copy trade
Click my profile to start following immediately
https://www.binance.com/zh-CN/copy-trading/lead-details/5051200019981811968
36
·
--
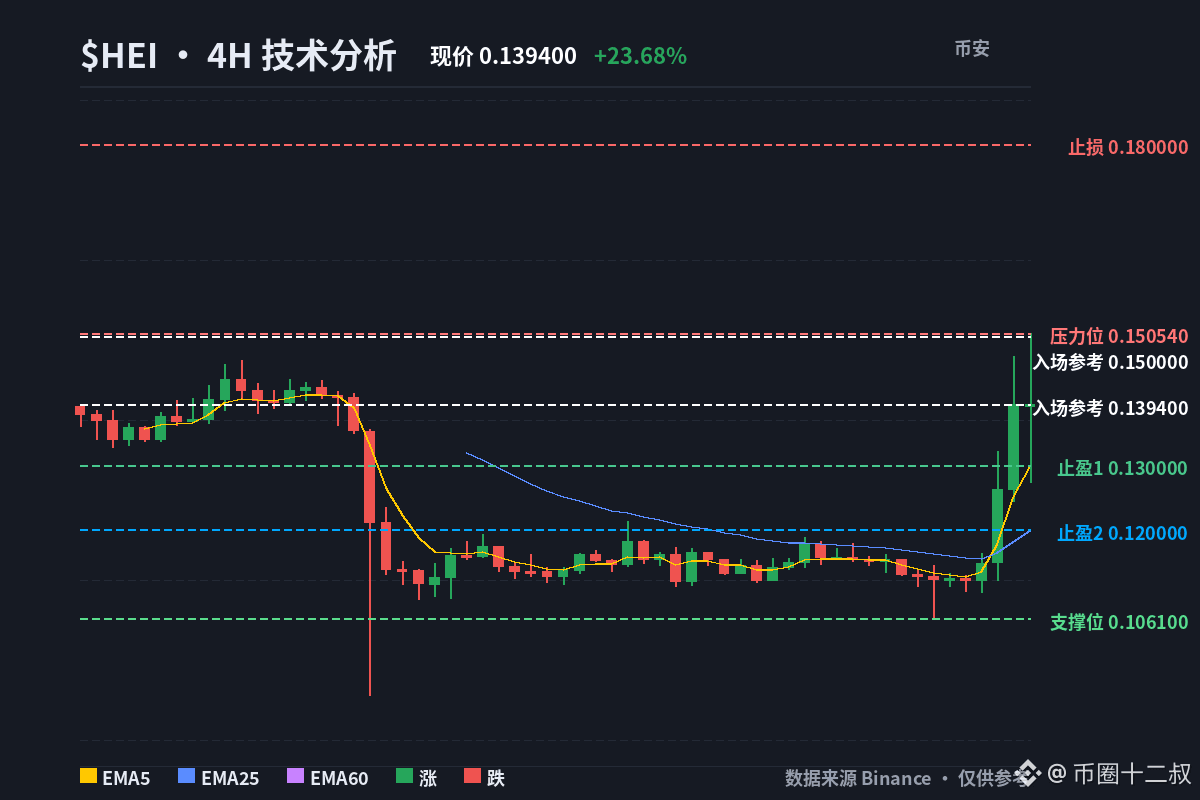
The divergence in $HEI is set out right here: the long/short ratio is only 0.981, but the whales’ positioning ratio is 1.7764. The whales are clearly net long, while ordinary accounts are close to net short; I won’t chase longs at $0.1394—I’ll wait for the rebound and look to short.
What’s truly dangerous is how fast both price and sentiment are surging. The 4-hour RSI7 is already at 91.3, and RSI14 is also at 78.4. In the last 3 candles, volatility is 16.28%, and the most recent contract trade value is about $15.75 million. The trend is strong, but volatility at these highs is no longer suitable for using emotion as a stop-loss.
The negative funding rate has accumulated to -4.7326% over 24 hours. Shorts are continuously paying, which suggests the rebound could still force shorts higher. The question is: if shorts cover, who will catch $0.15 to $0.17 at these high levels? If the push higher fails, the positions that chased in earlier will release faster than the shorts.
The 4-hour price is far above the EMA25 at $0.119797, and the daily chart is also above the EMA5 at $0.123433—but RSI has already compressed the odds of chasing price. $HEI is noticeably stronger than BTC and the entire market, but the broader market is weak; during the “low tide,” there’s little to support pullbacks, so drawdowns may come more directly. My playbook is to wait for the rebound to face pressure around $0.15 and then short; if price breaks above the prior high at $0.17, I’ll admit I’m wrong.
📊 Direction: Short
💰 Entry reference: $0.150 — participate after the rebound into this area faces pressure
🛑 Stop loss: $0.180 — if it breaks and holds, exit after stopping out
🎯 Take profit 1: $0.130 — near the daily EMA25 at $0.130438
🎯 Take profit 2: $0.120 — near the 4-hour EMA25 at $0.119797
Strength can be respected, but odds can’t be discounted.
When you stand on negative funding pushing shorts to continue squeezing higher, will you stick with it—or after RSI overheats and longs let go at the high? Choose one.
$HEI #技术分析 #Uncle Twelve
If you like this approach, come to the Binance public domain copy-trading page and follow Uncle Twelve
Click my profile to start copy-trading immediately
https://www.binance.com/zh-CN/copy-trading/lead-details/5051200019981811968
The divergence in $HEI is set out right here: the long/short ratio is only 0.981, but the whales’ positioning ratio is 1.7764. The whales are clearly net long, while ordinary accounts are close to net short; I won’t chase longs at $0.1394—I’ll wait for the rebound and look to short.
What’s truly dangerous is how fast both price and sentiment are surging. The 4-hour RSI7 is already at 91.3, and RSI14 is also at 78.4. In the last 3 candles, volatility is 16.28%, and the most recent contract trade value is about $15.75 million. The trend is strong, but volatility at these highs is no longer suitable for using emotion as a stop-loss.
The negative funding rate has accumulated to -4.7326% over 24 hours. Shorts are continuously paying, which suggests the rebound could still force shorts higher. The question is: if shorts cover, who will catch $0.15 to $0.17 at these high levels? If the push higher fails, the positions that chased in earlier will release faster than the shorts.
The 4-hour price is far above the EMA25 at $0.119797, and the daily chart is also above the EMA5 at $0.123433—but RSI has already compressed the odds of chasing price. $HEI is noticeably stronger than BTC and the entire market, but the broader market is weak; during the “low tide,” there’s little to support pullbacks, so drawdowns may come more directly. My playbook is to wait for the rebound to face pressure around $0.15 and then short; if price breaks above the prior high at $0.17, I’ll admit I’m wrong.
📊 Direction: Short
💰 Entry reference: $0.150 — participate after the rebound into this area faces pressure
🛑 Stop loss: $0.180 — if it breaks and holds, exit after stopping out
🎯 Take profit 1: $0.130 — near the daily EMA25 at $0.130438
🎯 Take profit 2: $0.120 — near the 4-hour EMA25 at $0.119797
Strength can be respected, but odds can’t be discounted.
When you stand on negative funding pushing shorts to continue squeezing higher, will you stick with it—or after RSI overheats and longs let go at the high? Choose one.
$HEI #技术分析 #Uncle Twelve
If you like this approach, come to the Binance public domain copy-trading page and follow Uncle Twelve
Click my profile to start copy-trading immediately
https://www.binance.com/zh-CN/copy-trading/lead-details/5051200019981811968
What’s truly dangerous is how fast both price and sentiment are surging. The 4-hour RSI7 is already at 91.3, and RSI14 is also at 78.4. In the last 3 candles, volatility is 16.28%, and the most recent contract trade value is about $15.75 million. The trend is strong, but volatility at these highs is no longer suitable for using emotion as a stop-loss.
The negative funding rate has accumulated to -4.7326% over 24 hours. Shorts are continuously paying, which suggests the rebound could still force shorts higher. The question is: if shorts cover, who will catch $0.15 to $0.17 at these high levels? If the push higher fails, the positions that chased in earlier will release faster than the shorts.
The 4-hour price is far above the EMA25 at $0.119797, and the daily chart is also above the EMA5 at $0.123433—but RSI has already compressed the odds of chasing price. $HEI is noticeably stronger than BTC and the entire market, but the broader market is weak; during the “low tide,” there’s little to support pullbacks, so drawdowns may come more directly. My playbook is to wait for the rebound to face pressure around $0.15 and then short; if price breaks above the prior high at $0.17, I’ll admit I’m wrong.
📊 Direction: Short
💰 Entry reference: $0.150 — participate after the rebound into this area faces pressure
🛑 Stop loss: $0.180 — if it breaks and holds, exit after stopping out
🎯 Take profit 1: $0.130 — near the daily EMA25 at $0.130438
🎯 Take profit 2: $0.120 — near the 4-hour EMA25 at $0.119797
Strength can be respected, but odds can’t be discounted.
When you stand on negative funding pushing shorts to continue squeezing higher, will you stick with it—or after RSI overheats and longs let go at the high? Choose one.
$HEI #技术分析 #Uncle Twelve
If you like this approach, come to the Binance public domain copy-trading page and follow Uncle Twelve
Click my profile to start copy-trading immediately
https://www.binance.com/zh-CN/copy-trading/lead-details/5051200019981811968
406
·
--
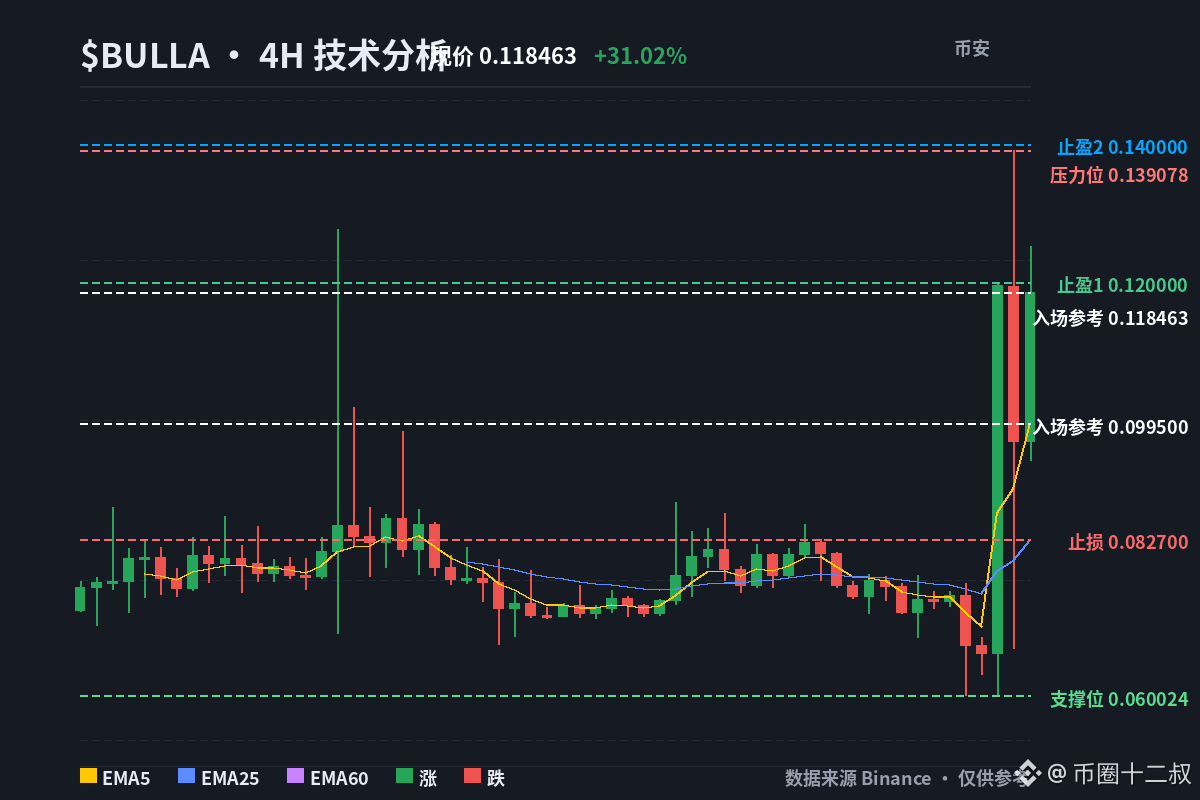
$BULLA 逆着 $BTC 的下跌趋势拉到 0.14 附近;this isn’t just chasing the tail end—it’s independent strength. But I’m not going long near 0.12; I’m waiting for a pullback to go long.
What’s most interesting now is the position conflict: funding rate is +0.0300%, longs are paying the protection fee. The long/short ratio in the account is 0.9088, slightly bearish, while the big holders’ position ratio is 1.035, slightly bullish. OI of 45M versus market cap value of 115M, leverage participation isn’t light. This structure can rise, but once 0.0995 is lost, the pullback will happen faster than words.
Technicals aren’t broken yet. On the 4-hour chart, price is still above EMA5 0.0995, EMA25 0.0827, and EMA60 0.0787. On the daily chart, RSI is already 81+, showing the trend is strong—but the current odds have been discounted. 0.0995 is the watershed level I’m watching: only if the pullback holds will you have the资格 to continue HODL. If it breaks, admit defeat—don’t use belief as a reason to buy without a stop-loss. $BTC is still falling. $BULLA is strong, yes, but when the tide goes out there’s no broad-market support—don’t get carried away.
📊 Direction: wait for the pullback to go long
💰 Entry reference: pull back to 0.0995 and confirm before entering
🛑 Stop-loss: if it breaks 0.0827, admit defeat
🎯 Take-profit 1: 0.12, back to the current strong zone
🎯 Take-profit 2: 0.14, prior high resistance
Respect strength, but don’t let the odds be discounted.
When you stand above 0.0995 and it pulls back for support, or after support fails and you loosen your position—pick one.
$BULLA #技术分析 #十二叔
My real-time trading rhythm is posted in Binance’s copy-trading public domain under the lead trading page—find ones who agree with the idea and follow.
Click my profile to copy-trade now.
https://www.binance.com/zh-CN/copy-trading/lead-details/5051200019981811968
$BULLA 逆着 $BTC 的下跌趋势拉到 0.14 附近;this isn’t just chasing the tail end—it’s independent strength. But I’m not going long near 0.12; I’m waiting for a pullback to go long.
What’s most interesting now is the position conflict: funding rate is +0.0300%, longs are paying the protection fee. The long/short ratio in the account is 0.9088, slightly bearish, while the big holders’ position ratio is 1.035, slightly bullish. OI of 45M versus market cap value of 115M, leverage participation isn’t light. This structure can rise, but once 0.0995 is lost, the pullback will happen faster than words.
Technicals aren’t broken yet. On the 4-hour chart, price is still above EMA5 0.0995, EMA25 0.0827, and EMA60 0.0787. On the daily chart, RSI is already 81+, showing the trend is strong—but the current odds have been discounted. 0.0995 is the watershed level I’m watching: only if the pullback holds will you have the资格 to continue HODL. If it breaks, admit defeat—don’t use belief as a reason to buy without a stop-loss. $BTC is still falling. $BULLA is strong, yes, but when the tide goes out there’s no broad-market support—don’t get carried away.
📊 Direction: wait for the pullback to go long
💰 Entry reference: pull back to 0.0995 and confirm before entering
🛑 Stop-loss: if it breaks 0.0827, admit defeat
🎯 Take-profit 1: 0.12, back to the current strong zone
🎯 Take-profit 2: 0.14, prior high resistance
Respect strength, but don’t let the odds be discounted.
When you stand above 0.0995 and it pulls back for support, or after support fails and you loosen your position—pick one.
$BULLA #技术分析 #十二叔
My real-time trading rhythm is posted in Binance’s copy-trading public domain under the lead trading page—find ones who agree with the idea and follow.
Click my profile to copy-trade now.
https://www.binance.com/zh-CN/copy-trading/lead-details/5051200019981811968
What’s most interesting now is the position conflict: funding rate is +0.0300%, longs are paying the protection fee. The long/short ratio in the account is 0.9088, slightly bearish, while the big holders’ position ratio is 1.035, slightly bullish. OI of 45M versus market cap value of 115M, leverage participation isn’t light. This structure can rise, but once 0.0995 is lost, the pullback will happen faster than words.
Technicals aren’t broken yet. On the 4-hour chart, price is still above EMA5 0.0995, EMA25 0.0827, and EMA60 0.0787. On the daily chart, RSI is already 81+, showing the trend is strong—but the current odds have been discounted. 0.0995 is the watershed level I’m watching: only if the pullback holds will you have the资格 to continue HODL. If it breaks, admit defeat—don’t use belief as a reason to buy without a stop-loss. $BTC is still falling. $BULLA is strong, yes, but when the tide goes out there’s no broad-market support—don’t get carried away.
📊 Direction: wait for the pullback to go long
💰 Entry reference: pull back to 0.0995 and confirm before entering
🛑 Stop-loss: if it breaks 0.0827, admit defeat
🎯 Take-profit 1: 0.12, back to the current strong zone
🎯 Take-profit 2: 0.14, prior high resistance
Respect strength, but don’t let the odds be discounted.
When you stand above 0.0995 and it pulls back for support, or after support fails and you loosen your position—pick one.
$BULLA #技术分析 #十二叔
My real-time trading rhythm is posted in Binance’s copy-trading public domain under the lead trading page—find ones who agree with the idea and follow.
Click my profile to copy-trade now.
https://www.binance.com/zh-CN/copy-trading/lead-details/5051200019981811968
832
·
--
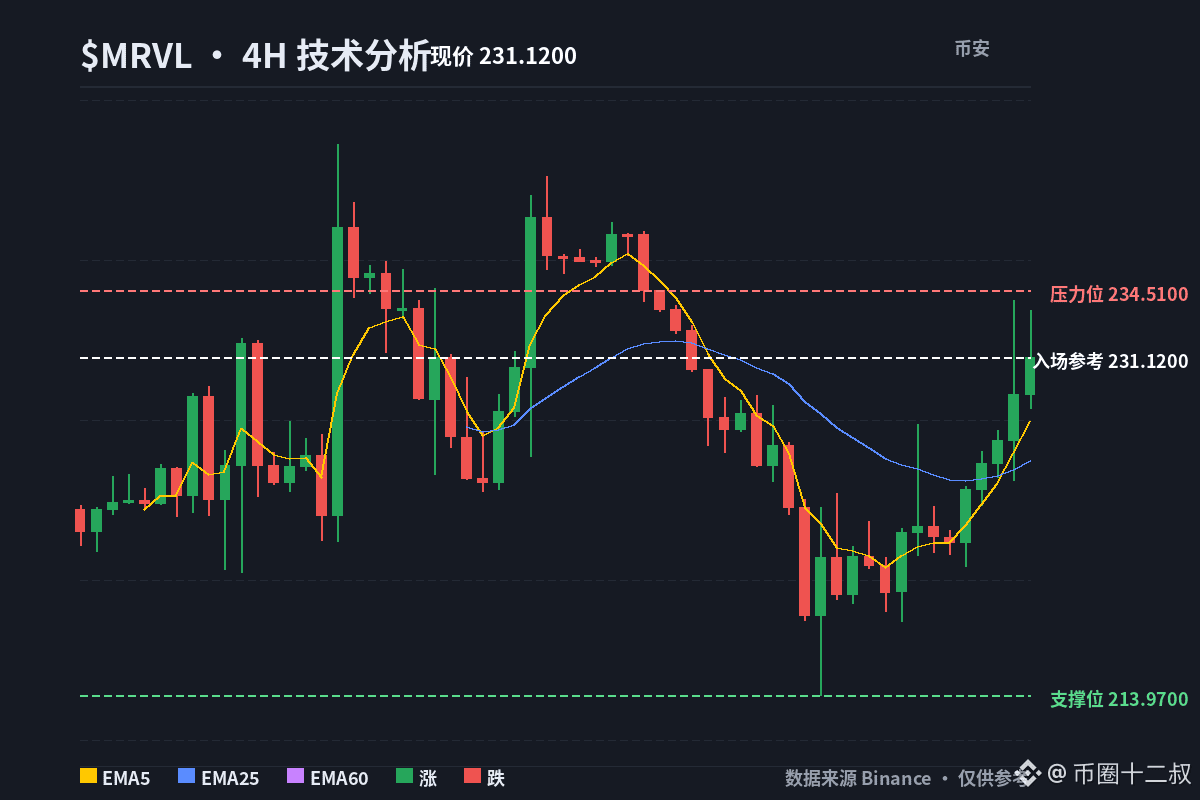
For this CPO/NPO line, the biggest pitfall, I think, is seeing a huge TAM and then directly forcing it onto market cap.
What you really need to watch is who is the first to ramp volumes, who gets stuck at bottlenecks, and whose earnings upside relative to the valuation is still big enough.
$MRVL, $AVGO, $COHR —these are just examples. Other stocks related to optical communications should be evaluated with the same logic too. Don’t get carried away and use the story as valuation.
Chasing price spikes, selling on impulse, or trading based on rumors is all too easy to get treated as “liquidity-only.” I trade when my quant system signals trigger—no FOMO. If you want to sync with my live trades, go to my profile.
For this CPO/NPO line, the biggest pitfall, I think, is seeing a huge TAM and then directly forcing it onto market cap.
What you really need to watch is who is the first to ramp volumes, who gets stuck at bottlenecks, and whose earnings upside relative to the valuation is still big enough.
$MRVL , $AVGO , $COHR —these are just examples. Other stocks related to optical communications should be evaluated with the same logic too. Don’t get carried away and use the story as valuation.
Chasing price spikes, selling on impulse, or trading based on rumors is all too easy to get treated as “liquidity-only.” I trade when my quant system signals trigger—no FOMO. If you want to sync with my live trades, go to my profile.
What you really need to watch is who is the first to ramp volumes, who gets stuck at bottlenecks, and whose earnings upside relative to the valuation is still big enough.
$MRVL , $AVGO , $COHR —these are just examples. Other stocks related to optical communications should be evaluated with the same logic too. Don’t get carried away and use the story as valuation.
Chasing price spikes, selling on impulse, or trading based on rumors is all too easy to get treated as “liquidity-only.” I trade when my quant system signals trigger—no FOMO. If you want to sync with my live trades, go to my profile.
128
·
--
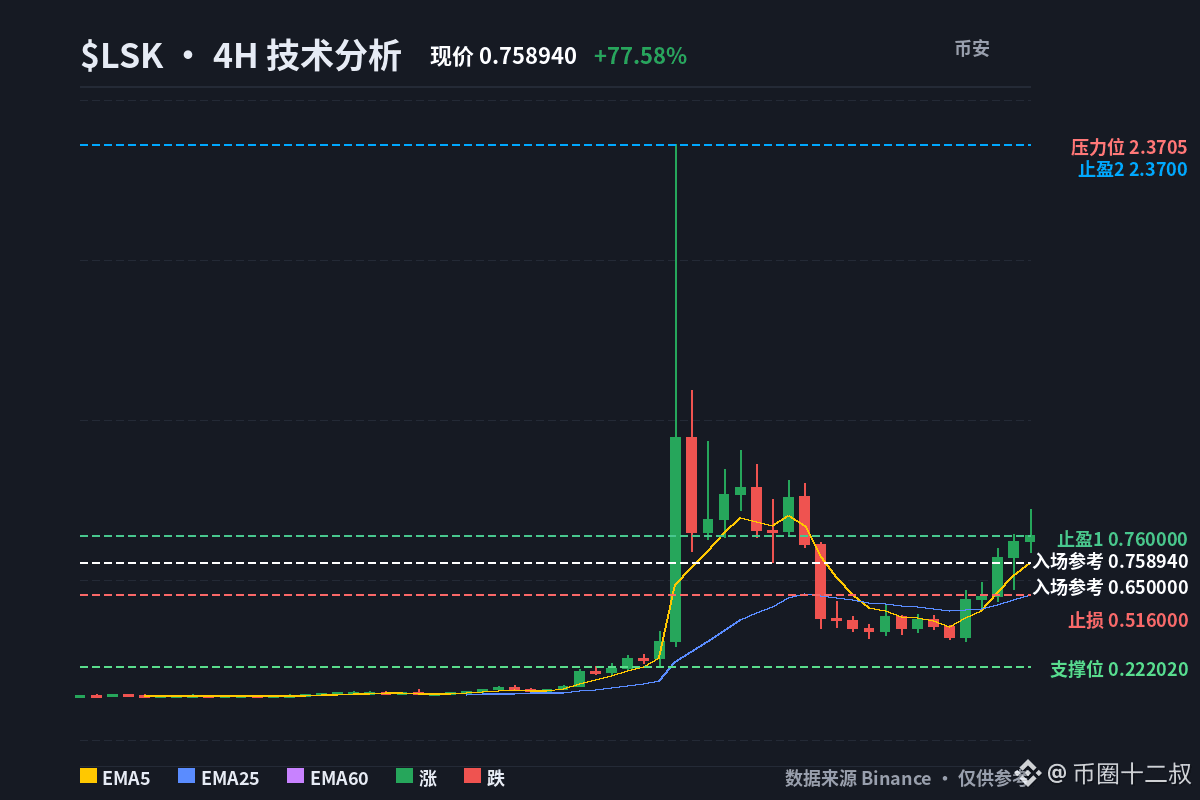
The OI for $LSK is already 94M, about 35% of a $268M market cap. This isn’t a neglected contract—it’s a powder keg. I’m bullish, but I’m only taking longs on pullbacks.
The shorts are still paying a -0.824% protection fee, while the price is stuck at around $0.76, keeping the squeeze fuel burning. The daily RSI is near 71. I’m not going to take emotional risk here on a K-line just because.
The long/short ratio in the account is 1.6874, and the big holders’ positioning ratio is 0.8291. The positioning disagreement is very direct: the account side wants to push up, while the big holders lean bearish. Whoever loosens first will amplify volatility.
Against BTC -2.03% and ALL -4.32%, $LSK can still rise—showing independent strength. But during the tide pullback, there’s no broad market backing, so the drawdown could be harsher.
Execution depends on $0.65—around the 4h EMA5. If I’m buying the dip and it holds, great. If it breaks below the $0.516 4h EMA25, the trend-acceleration logic is invalid and I’ll back off.
First look above: reclaim $0.76. Only if it truly squeezes shorts will it be eligible to challenge the range high at $2.37.
📊 Direction: Long
💰 Entry reference: $0.65 pullback confirmation
🛑 Stop loss: Break below $0.516—exit
🎯 Take profit 1: $0.76, current-price tug-of-war zone
🎯 Take profit 2: $2.37, the range’s prior high
I’m making money from the short squeeze—not taking the risk of chasing a rally.
You either hold $0.65 and guard the continuation of the squeeze… or you stand when it breaks below $0.516 and loosen your position. Two choices.
$LSK #技术分析 #Uncle Twelve
LSK this round I’ll keep watching. If you want to follow my rhythm, go check the Binance homepage
Click my profile to copy-trade immediately
https://www.binance.com/zh-CN/copy-trading/lead-details/5051200019981811968
The OI for $LSK is already 94M, about 35% of a $268M market cap. This isn’t a neglected contract—it’s a powder keg. I’m bullish, but I’m only taking longs on pullbacks.
The shorts are still paying a -0.824% protection fee, while the price is stuck at around $0.76, keeping the squeeze fuel burning. The daily RSI is near 71. I’m not going to take emotional risk here on a K-line just because.
The long/short ratio in the account is 1.6874, and the big holders’ positioning ratio is 0.8291. The positioning disagreement is very direct: the account side wants to push up, while the big holders lean bearish. Whoever loosens first will amplify volatility.
Against BTC -2.03% and ALL -4.32%, $LSK can still rise—showing independent strength. But during the tide pullback, there’s no broad market backing, so the drawdown could be harsher.
Execution depends on $0.65—around the 4h EMA5. If I’m buying the dip and it holds, great. If it breaks below the $0.516 4h EMA25, the trend-acceleration logic is invalid and I’ll back off.
First look above: reclaim $0.76. Only if it truly squeezes shorts will it be eligible to challenge the range high at $2.37.
📊 Direction: Long
💰 Entry reference: $0.65 pullback confirmation
🛑 Stop loss: Break below $0.516—exit
🎯 Take profit 1: $0.76, current-price tug-of-war zone
🎯 Take profit 2: $2.37, the range’s prior high
I’m making money from the short squeeze—not taking the risk of chasing a rally.
You either hold $0.65 and guard the continuation of the squeeze… or you stand when it breaks below $0.516 and loosen your position. Two choices.
$LSK #技术分析 #Uncle Twelve
LSK this round I’ll keep watching. If you want to follow my rhythm, go check the Binance homepage
Click my profile to copy-trade immediately
https://www.binance.com/zh-CN/copy-trading/lead-details/5051200019981811968
The shorts are still paying a -0.824% protection fee, while the price is stuck at around $0.76, keeping the squeeze fuel burning. The daily RSI is near 71. I’m not going to take emotional risk here on a K-line just because.
The long/short ratio in the account is 1.6874, and the big holders’ positioning ratio is 0.8291. The positioning disagreement is very direct: the account side wants to push up, while the big holders lean bearish. Whoever loosens first will amplify volatility.
Against BTC -2.03% and ALL -4.32%, $LSK can still rise—showing independent strength. But during the tide pullback, there’s no broad market backing, so the drawdown could be harsher.
Execution depends on $0.65—around the 4h EMA5. If I’m buying the dip and it holds, great. If it breaks below the $0.516 4h EMA25, the trend-acceleration logic is invalid and I’ll back off.
First look above: reclaim $0.76. Only if it truly squeezes shorts will it be eligible to challenge the range high at $2.37.
📊 Direction: Long
💰 Entry reference: $0.65 pullback confirmation
🛑 Stop loss: Break below $0.516—exit
🎯 Take profit 1: $0.76, current-price tug-of-war zone
🎯 Take profit 2: $2.37, the range’s prior high
I’m making money from the short squeeze—not taking the risk of chasing a rally.
You either hold $0.65 and guard the continuation of the squeeze… or you stand when it breaks below $0.516 and loosen your position. Two choices.
$LSK #技术分析 #Uncle Twelve
LSK this round I’ll keep watching. If you want to follow my rhythm, go check the Binance homepage
Click my profile to copy-trade immediately
https://www.binance.com/zh-CN/copy-trading/lead-details/5051200019981811968
17
·
--
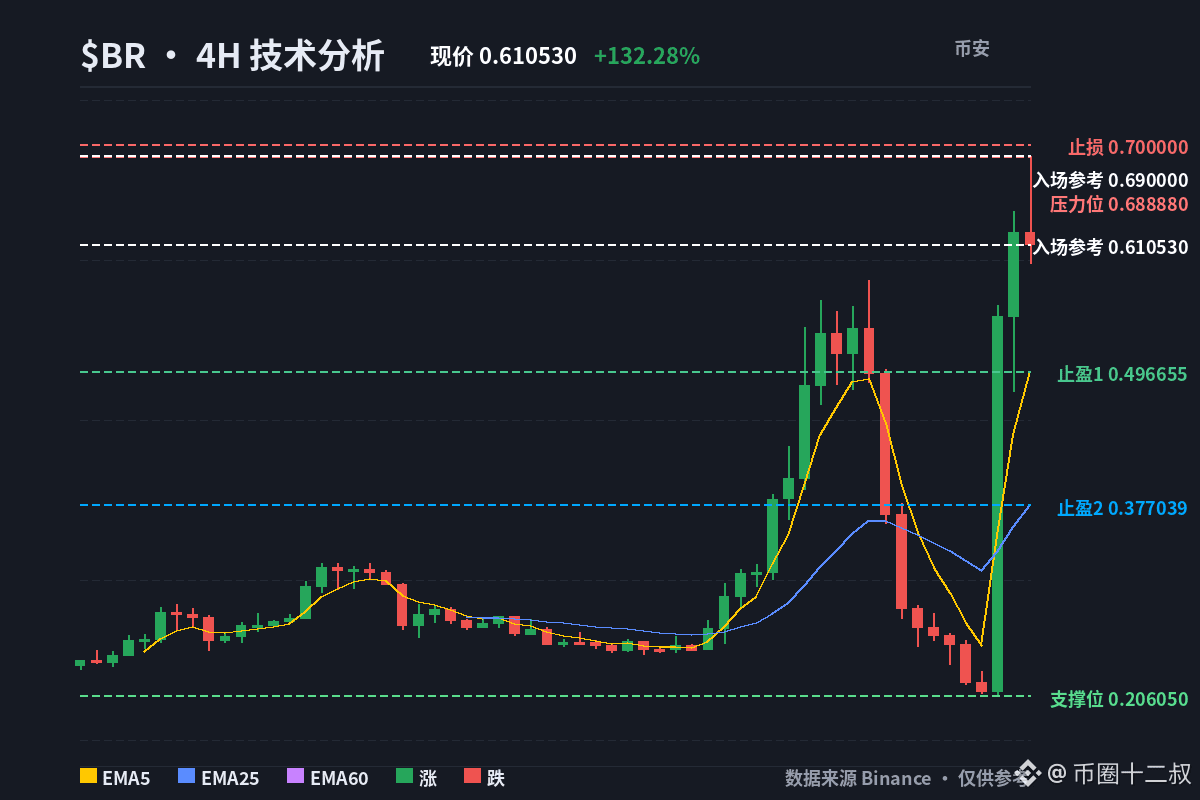
Funding rate: 24-hour cumulative +0.2892%. Longs are still continuously paying protection fees; meanwhile, the price has already surged from 0.19 to 0.69. I won’t chase longs at 0.62078—I'll wait for a rebound to short.
The trend of $BR is indeed strong: the 4-hour and daily EMA5 are both above EMA25, but RSI7 is already at 75, and the daily near-3-candle volatility is as high as 88.1%. The odds for buyers are clearly worse now. OI is about $96 million, roughly half of the market cap. Leverage positions are heavy—once the price loosens, volatility won’t be gentle.
More importantly, the long/short ratio in the account is only 0.8646, while large holders are at 1.6354. The positional disagreement is already on the table. BTC and the whole market are falling. $BR is independently strong, but when the tide goes out, there’s no broad-market support. 0.69 is the recent high point. I entered when the rebound met resistance here; if it holds, I’ll back off the short.
📊 Direction: wait for a rebound to short
💰 Entry reference: 0.69
🛑 Stop loss: 0.70—after triggered, exit
🎯 Take profit 1: 0.496655, look back at the 4-hour EMA5
🎯 Take profit 2: 0.377039, look back at the 4-hour EMA25
You can respect the trend, but you can’t force your way into crowded prices.
Once you’ve got resistance at 0.69 and it falls back, or once it breaks through and squeezes further—pick one.
$BR #技术分析 #Twelve Uncle
If you can understand this kind of rhythm, come to Binance’s public domain to follow signals—take a look at my lead homepage and do it together with me.
Click my homepage to follow immediately
https://www.binance.com/zh-CN/copy-trading/lead-details/5051200019981811968
Funding rate: 24-hour cumulative +0.2892%. Longs are still continuously paying protection fees; meanwhile, the price has already surged from 0.19 to 0.69. I won’t chase longs at 0.62078—I'll wait for a rebound to short.
The trend of $BR is indeed strong: the 4-hour and daily EMA5 are both above EMA25, but RSI7 is already at 75, and the daily near-3-candle volatility is as high as 88.1%. The odds for buyers are clearly worse now. OI is about $96 million, roughly half of the market cap. Leverage positions are heavy—once the price loosens, volatility won’t be gentle.
More importantly, the long/short ratio in the account is only 0.8646, while large holders are at 1.6354. The positional disagreement is already on the table. BTC and the whole market are falling. $BR is independently strong, but when the tide goes out, there’s no broad-market support. 0.69 is the recent high point. I entered when the rebound met resistance here; if it holds, I’ll back off the short.
📊 Direction: wait for a rebound to short
💰 Entry reference: 0.69
🛑 Stop loss: 0.70—after triggered, exit
🎯 Take profit 1: 0.496655, look back at the 4-hour EMA5
🎯 Take profit 2: 0.377039, look back at the 4-hour EMA25
You can respect the trend, but you can’t force your way into crowded prices.
Once you’ve got resistance at 0.69 and it falls back, or once it breaks through and squeezes further—pick one.
$BR #技术分析 #Twelve Uncle
If you can understand this kind of rhythm, come to Binance’s public domain to follow signals—take a look at my lead homepage and do it together with me.
Click my homepage to follow immediately
https://www.binance.com/zh-CN/copy-trading/lead-details/5051200019981811968
The trend of $BR is indeed strong: the 4-hour and daily EMA5 are both above EMA25, but RSI7 is already at 75, and the daily near-3-candle volatility is as high as 88.1%. The odds for buyers are clearly worse now. OI is about $96 million, roughly half of the market cap. Leverage positions are heavy—once the price loosens, volatility won’t be gentle.
More importantly, the long/short ratio in the account is only 0.8646, while large holders are at 1.6354. The positional disagreement is already on the table. BTC and the whole market are falling. $BR is independently strong, but when the tide goes out, there’s no broad-market support. 0.69 is the recent high point. I entered when the rebound met resistance here; if it holds, I’ll back off the short.
📊 Direction: wait for a rebound to short
💰 Entry reference: 0.69
🛑 Stop loss: 0.70—after triggered, exit
🎯 Take profit 1: 0.496655, look back at the 4-hour EMA5
🎯 Take profit 2: 0.377039, look back at the 4-hour EMA25
You can respect the trend, but you can’t force your way into crowded prices.
Once you’ve got resistance at 0.69 and it falls back, or once it breaks through and squeezes further—pick one.
$BR #技术分析 #Twelve Uncle
If you can understand this kind of rhythm, come to Binance’s public domain to follow signals—take a look at my lead homepage and do it together with me.
Click my homepage to follow immediately
https://www.binance.com/zh-CN/copy-trading/lead-details/5051200019981811968
43
·
--
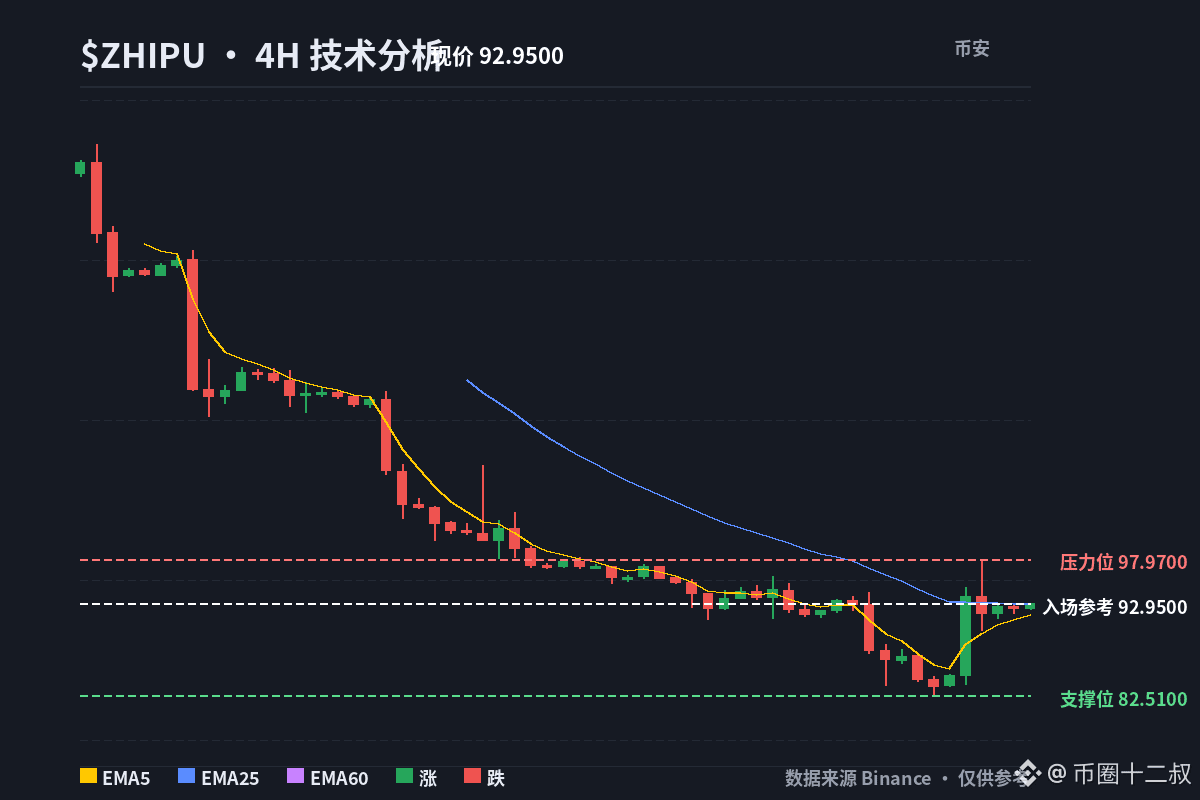
I’ve looked at this “Silver crumb hour” and it basically left no real trace.
About $1.2K in long positions across 1 cluster and 5 wallets, with 0 shorts.
Among them, $ZHIPU (Zhipu AI) contributed about $1.2K, with the largest single order around $1.2K. It entered at UTC time 03:51, with the price around $94.49.
My take is: this is only after a quiet liquidation—$ZHIPU flashed on its own, and there are still no shorts.
24/7 monitoring across multiple markets: as soon as the price action appears, it responds immediately without missing a single one—something humans can’t do, I make the machine do. The live trading sync entry is on my homepage.
I’ve looked at this “Silver crumb hour” and it basically left no real trace.
About $1.2K in long positions across 1 cluster and 5 wallets, with 0 shorts.
Among them, $ZHIPU (Zhipu AI) contributed about $1.2K, with the largest single order around $1.2K. It entered at UTC time 03:51, with the price around $94.49.
My take is: this is only after a quiet liquidation—$ZHIPU flashed on its own, and there are still no shorts.
24/7 monitoring across multiple markets: as soon as the price action appears, it responds immediately without missing a single one—something humans can’t do, I make the machine do. The live trading sync entry is on my homepage.
About $1.2K in long positions across 1 cluster and 5 wallets, with 0 shorts.
Among them, $ZHIPU (Zhipu AI) contributed about $1.2K, with the largest single order around $1.2K. It entered at UTC time 03:51, with the price around $94.49.
My take is: this is only after a quiet liquidation—$ZHIPU flashed on its own, and there are still no shorts.
24/7 monitoring across multiple markets: as soon as the price action appears, it responds immediately without missing a single one—something humans can’t do, I make the machine do. The live trading sync entry is on my homepage.
6
·
--
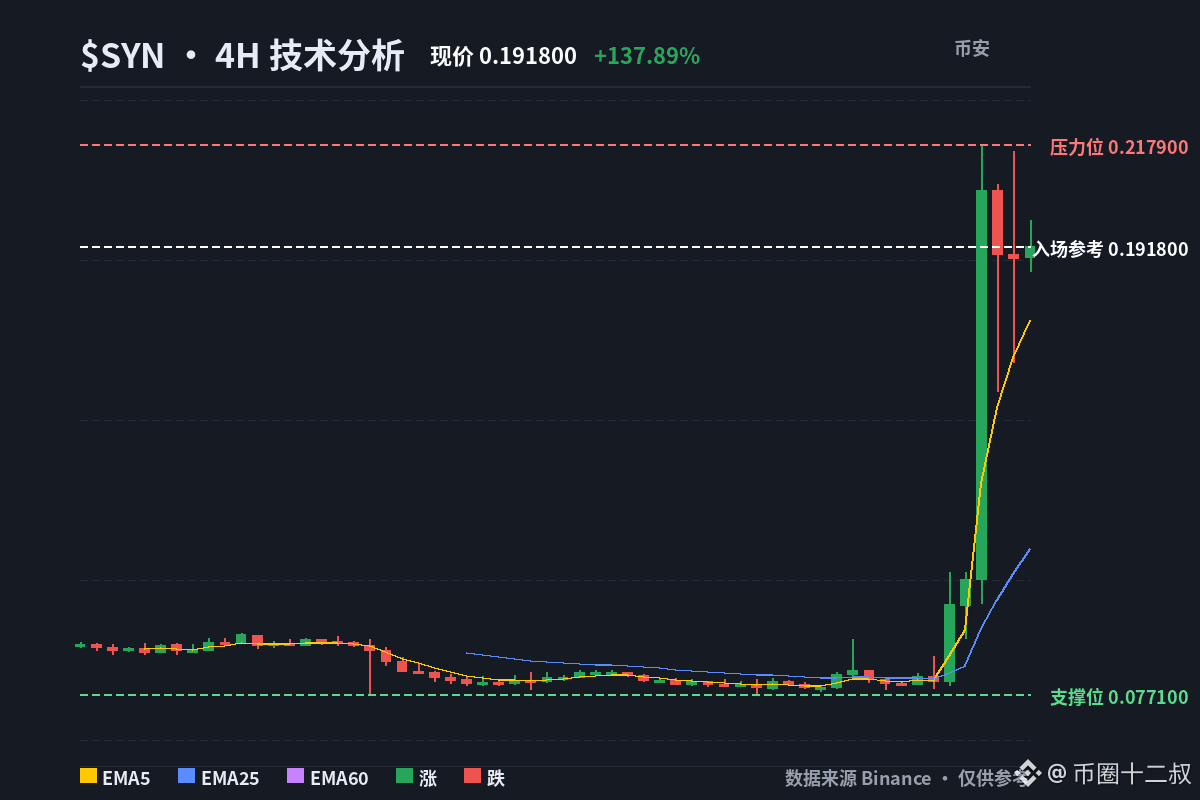
$SYN has nothing to do with $BTC — the overall market is red in the past 24h, yet it pulled itself up +137.89% and surged to #1 on the gainers list. I won’t chase the current price, but I also don’t plan to short.
First, let’s look at the sentiment: the funding rate for 24h is -0.0465%, negative—shorts are paying. The long/short ratio in the accounts is 1.20, and the large-holder position ratio is 2.18. Both sides are leaning long, but the big players are even more aggressive. OI (29M) is facing a 45M market cap, so leveraged participation isn’t light. Shorts are paying fees while the price keeps moving up—this is squeeze-fuel, not a top signal.
On the technical side, I’ll be honest: the 4h EMA5 is 0.173 and EMA25 is 0.114. On the daily, RSI7 is already 92.9, and the volatility over the last 3 daily candles is 37%. The trend hasn’t broken, but the current price of 0.19 is too far away from EMA5. Chasing longs here means you’re taking risk as the high-level longs.
BTC is -0.76%, the whole market is -3.32%. $SYN is a purely independent move. If the squeeze can continue, it can keep going—but when the tide turns, nobody will prop it up, and pullbacks will be just as direct.
So my play is to wait for a retest around 0.172 (4h EMA5 support). If it holds, I’ll keep holding; if it breaks below 0.156, the short-term moving-average support fails and I’ll immediately back off.
$SYN #技术分析 #Uncle Twelve
SYN this round I’ll do it in Binance’s public domain—if it looks good, I’ll follow along with Uncle Twelve’s trade.
Click my profile to copy trade now
https://www.binance.com/zh-CN/copy-trading/lead-details/5051200019981811968
$SYN has nothing to do with $BTC — the overall market is red in the past 24h, yet it pulled itself up +137.89% and surged to #1 on the gainers list. I won’t chase the current price, but I also don’t plan to short.
First, let’s look at the sentiment: the funding rate for 24h is -0.0465%, negative—shorts are paying. The long/short ratio in the accounts is 1.20, and the large-holder position ratio is 2.18. Both sides are leaning long, but the big players are even more aggressive. OI (29M) is facing a 45M market cap, so leveraged participation isn’t light. Shorts are paying fees while the price keeps moving up—this is squeeze-fuel, not a top signal.
On the technical side, I’ll be honest: the 4h EMA5 is 0.173 and EMA25 is 0.114. On the daily, RSI7 is already 92.9, and the volatility over the last 3 daily candles is 37%. The trend hasn’t broken, but the current price of 0.19 is too far away from EMA5. Chasing longs here means you’re taking risk as the high-level longs.
BTC is -0.76%, the whole market is -3.32%. $SYN is a purely independent move. If the squeeze can continue, it can keep going—but when the tide turns, nobody will prop it up, and pullbacks will be just as direct.
So my play is to wait for a retest around 0.172 (4h EMA5 support). If it holds, I’ll keep holding; if it breaks below 0.156, the short-term moving-average support fails and I’ll immediately back off.
$SYN #技术分析 #Uncle Twelve
SYN this round I’ll do it in Binance’s public domain—if it looks good, I’ll follow along with Uncle Twelve’s trade.
Click my profile to copy trade now
https://www.binance.com/zh-CN/copy-trading/lead-details/5051200019981811968
First, let’s look at the sentiment: the funding rate for 24h is -0.0465%, negative—shorts are paying. The long/short ratio in the accounts is 1.20, and the large-holder position ratio is 2.18. Both sides are leaning long, but the big players are even more aggressive. OI (29M) is facing a 45M market cap, so leveraged participation isn’t light. Shorts are paying fees while the price keeps moving up—this is squeeze-fuel, not a top signal.
On the technical side, I’ll be honest: the 4h EMA5 is 0.173 and EMA25 is 0.114. On the daily, RSI7 is already 92.9, and the volatility over the last 3 daily candles is 37%. The trend hasn’t broken, but the current price of 0.19 is too far away from EMA5. Chasing longs here means you’re taking risk as the high-level longs.
BTC is -0.76%, the whole market is -3.32%. $SYN is a purely independent move. If the squeeze can continue, it can keep going—but when the tide turns, nobody will prop it up, and pullbacks will be just as direct.
So my play is to wait for a retest around 0.172 (4h EMA5 support). If it holds, I’ll keep holding; if it breaks below 0.156, the short-term moving-average support fails and I’ll immediately back off.
$SYN #技术分析 #Uncle Twelve
SYN this round I’ll do it in Binance’s public domain—if it looks good, I’ll follow along with Uncle Twelve’s trade.
Click my profile to copy trade now
https://www.binance.com/zh-CN/copy-trading/lead-details/5051200019981811968
37
·
--
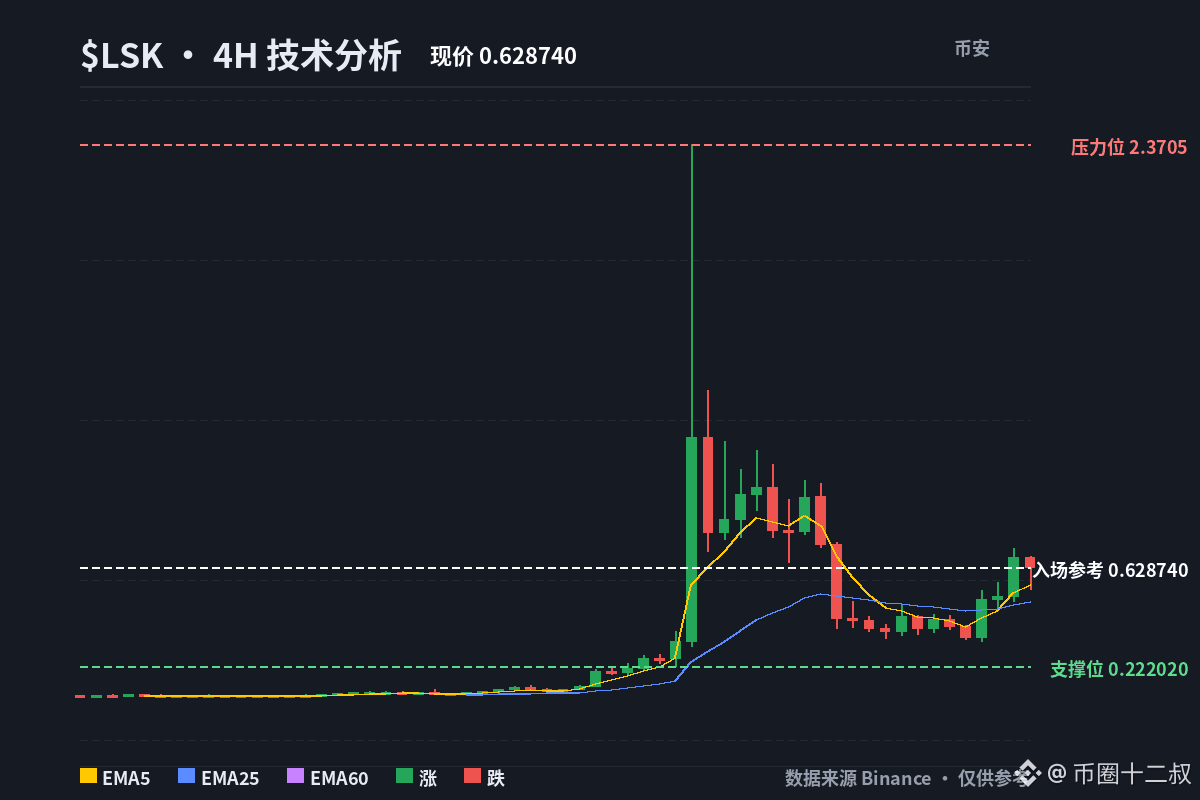
I noticed that the $0.34 zone support at $LSK is working well. After the price reached this level, it has rebounded by 80%.
Manually trading this kind of market is easiest to end up getting slapped on both sides. In my quant matrix, shorting indices is originally a standard move—once triggered it executes, and if it’s wrong it sets a stop-loss. You can see the live trading on the homepage to understand how it runs.
I noticed that the $0.34 zone support at $LSK is working well. After the price reached this level, it has rebounded by 80%.
Manually trading this kind of market is easiest to end up getting slapped on both sides. In my quant matrix, shorting indices is originally a standard move—once triggered it executes, and if it’s wrong it sets a stop-loss. You can see the live trading on the homepage to understand how it runs.
Manually trading this kind of market is easiest to end up getting slapped on both sides. In my quant matrix, shorting indices is originally a standard move—once triggered it executes, and if it’s wrong it sets a stop-loss. You can see the live trading on the homepage to understand how it runs.
133
·
--
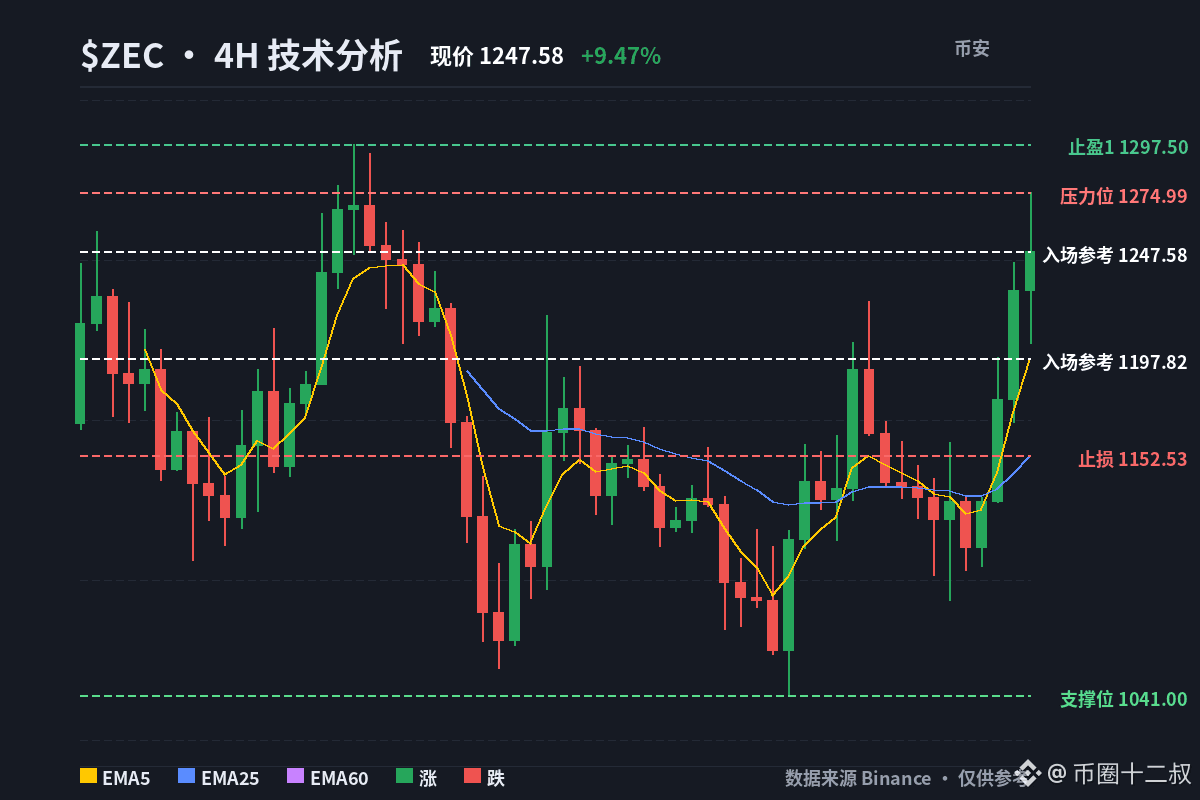
$ZEC 24-hour funding rate cumulative -0.0301% — shorts are still paying protection fees; the price is going the opposite way while BTC and the whole market strengthen. I won’t chase longs above $1247; I’ll wait for a pullback.
This isn’t a normal rebound. The long/short ratio on the account is only 0.4031—shorts are clearly crowded. Once price reclaims $1297.5, the short-covering could keep pushing higher. More importantly, in the $ZEC 4 4-hour price action, price is still above EMA5 $1197.82 and EMA25 $1152.53, and the daily chart is also holding above EMA5 $1163.92— the trend structure hasn’t been broken.
But RSI7 is already at 78; the last 3 4-hour candles’ volatility is 5.81%. The most recent futures candle saw trading value of about $640 million. Strength is real, but the current price doesn’t offer good odds—don’t turn yourself into the one who chases longs at the top and takes the risk. I’ll enter only if a pullback around $1197.82 stabilizes. If it breaks below $1152.53, it means this pullback isn’t a healthy rotation anymore—immediately back off.
📊 Direction: Long
💰 Entry reference: Long pullback confirmation around $1197.82
🛑 Stop loss: $1152.53 — exit if broken
🎯 Take profit 1: $1297.50 — resistance at prior high
🎯 Take profit 2: No reliable higher target
Negative funding provides the squeeze fuel; EMA provides the trend bottom line. The key is not to turn strength into chasing.
Do you get in on a pullback holding at $1197.82, or do you accept a trend reversal after $1152.53 is lost? It’s one of the two.
$ZEC #技术分析 #Uncle Twelve
This ZEC move, I’ll keep watching. If you want to trade following my rhythm, come check my Binance homepage
Click my profile to copy-trade now
https://www.binance.com/zh-CN/copy-trading/lead-details/5051200019981811968
$ZEC 24-hour funding rate cumulative -0.0301% — shorts are still paying protection fees; the price is going the opposite way while BTC and the whole market strengthen. I won’t chase longs above $1247; I’ll wait for a pullback.
This isn’t a normal rebound. The long/short ratio on the account is only 0.4031—shorts are clearly crowded. Once price reclaims $1297.5, the short-covering could keep pushing higher. More importantly, in the $ZEC 4 4-hour price action, price is still above EMA5 $1197.82 and EMA25 $1152.53, and the daily chart is also holding above EMA5 $1163.92— the trend structure hasn’t been broken.
But RSI7 is already at 78; the last 3 4-hour candles’ volatility is 5.81%. The most recent futures candle saw trading value of about $640 million. Strength is real, but the current price doesn’t offer good odds—don’t turn yourself into the one who chases longs at the top and takes the risk. I’ll enter only if a pullback around $1197.82 stabilizes. If it breaks below $1152.53, it means this pullback isn’t a healthy rotation anymore—immediately back off.
📊 Direction: Long
💰 Entry reference: Long pullback confirmation around $1197.82
🛑 Stop loss: $1152.53 — exit if broken
🎯 Take profit 1: $1297.50 — resistance at prior high
🎯 Take profit 2: No reliable higher target
Negative funding provides the squeeze fuel; EMA provides the trend bottom line. The key is not to turn strength into chasing.
Do you get in on a pullback holding at $1197.82, or do you accept a trend reversal after $1152.53 is lost? It’s one of the two.
$ZEC #技术分析 #Uncle Twelve
This ZEC move, I’ll keep watching. If you want to trade following my rhythm, come check my Binance homepage
Click my profile to copy-trade now
https://www.binance.com/zh-CN/copy-trading/lead-details/5051200019981811968
This isn’t a normal rebound. The long/short ratio on the account is only 0.4031—shorts are clearly crowded. Once price reclaims $1297.5, the short-covering could keep pushing higher. More importantly, in the $ZEC 4 4-hour price action, price is still above EMA5 $1197.82 and EMA25 $1152.53, and the daily chart is also holding above EMA5 $1163.92— the trend structure hasn’t been broken.
But RSI7 is already at 78; the last 3 4-hour candles’ volatility is 5.81%. The most recent futures candle saw trading value of about $640 million. Strength is real, but the current price doesn’t offer good odds—don’t turn yourself into the one who chases longs at the top and takes the risk. I’ll enter only if a pullback around $1197.82 stabilizes. If it breaks below $1152.53, it means this pullback isn’t a healthy rotation anymore—immediately back off.
📊 Direction: Long
💰 Entry reference: Long pullback confirmation around $1197.82
🛑 Stop loss: $1152.53 — exit if broken
🎯 Take profit 1: $1297.50 — resistance at prior high
🎯 Take profit 2: No reliable higher target
Negative funding provides the squeeze fuel; EMA provides the trend bottom line. The key is not to turn strength into chasing.
Do you get in on a pullback holding at $1197.82, or do you accept a trend reversal after $1152.53 is lost? It’s one of the two.
$ZEC #技术分析 #Uncle Twelve
This ZEC move, I’ll keep watching. If you want to trade following my rhythm, come check my Binance homepage
Click my profile to copy-trade now
https://www.binance.com/zh-CN/copy-trading/lead-details/5051200019981811968
8
·
--
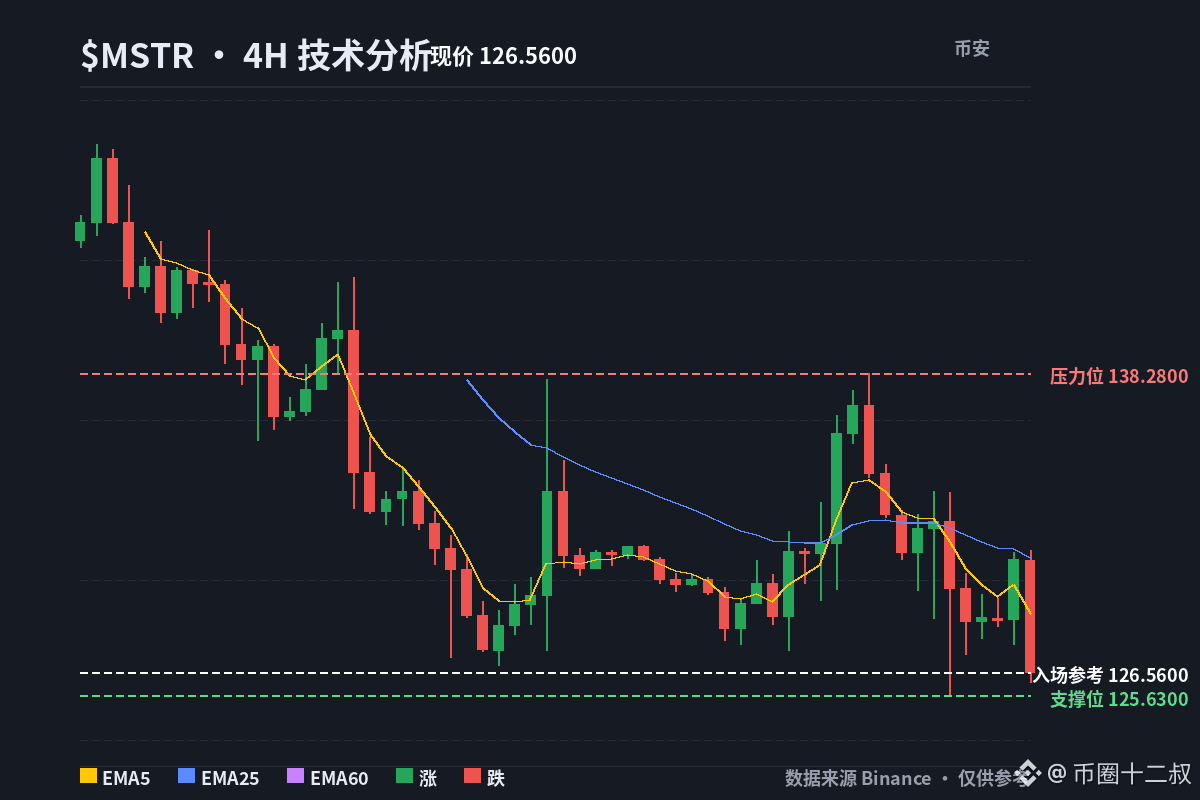
This morning I looked at $COIN, $CRCL , and $MSTR—shorting is relatively straightforward.
Since the Clarity Vote has already failed, it’s not hard to make money by shorting these names today.
The worst are those who get stuck holding the bag after the big V calls out FOMO entries. I’ve fully systematized everything, and backtested it—if you pay attention, you can sync real trading strategies with one click. Go to the homepage to check.
This morning I looked at $COIN , $CRCL , and $MSTR —shorting is relatively straightforward.
Since the Clarity Vote has already failed, it’s not hard to make money by shorting these names today.
The worst are those who get stuck holding the bag after the big V calls out FOMO entries. I’ve fully systematized everything, and backtested it—if you pay attention, you can sync real trading strategies with one click. Go to the homepage to check.
Since the Clarity Vote has already failed, it’s not hard to make money by shorting these names today.
The worst are those who get stuck holding the bag after the big V calls out FOMO entries. I’ve fully systematized everything, and backtested it—if you pay attention, you can sync real trading strategies with one click. Go to the homepage to check.
11
·
--
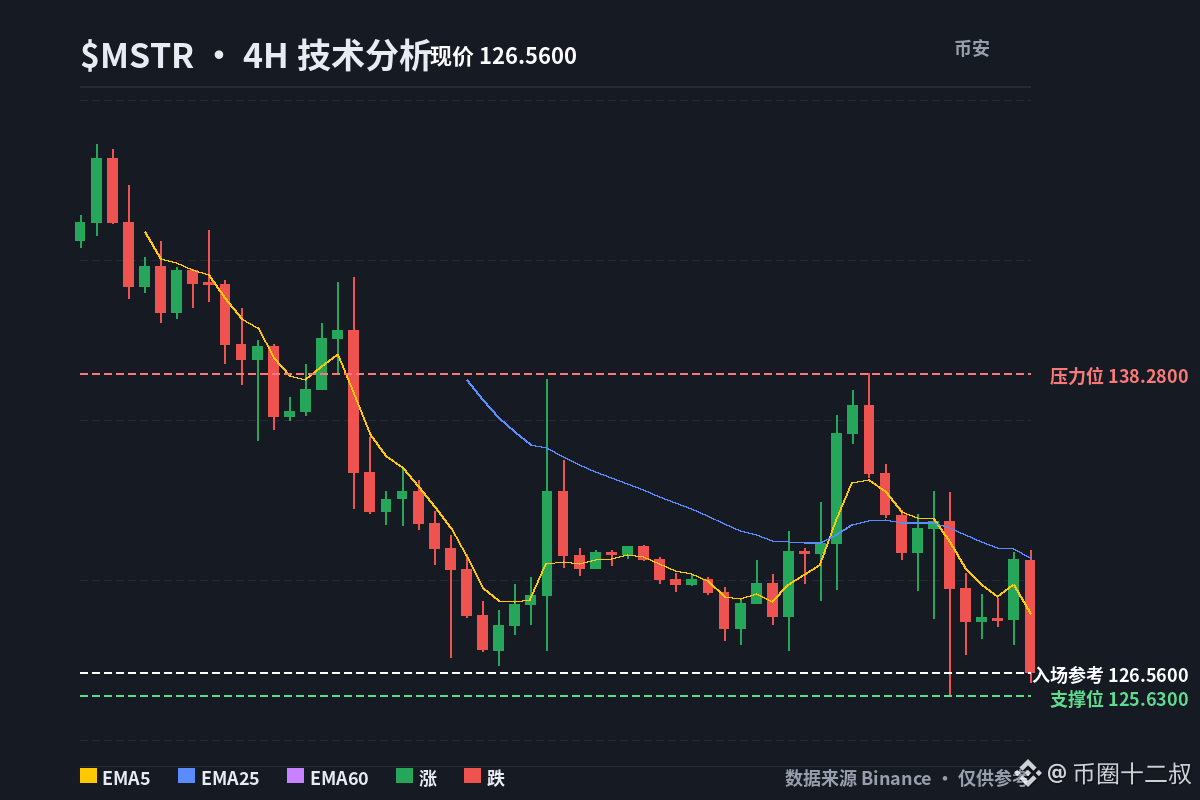
I think the current dilution calculations for MSTR are starting to get quite interesting now.
My dragon-hunting strategy is to go short in line with momentum from the higher end; when it’s time to slay dragons, if it’s overheated then I harvest. The directional strategy is driven in a unified way by the scoring central system. I want to see how it runs—go to the homepage.
I think the current dilution calculations for MSTR are starting to get quite interesting now.
My dragon-hunting strategy is to go short in line with momentum from the higher end; when it’s time to slay dragons, if it’s overheated then I harvest. The directional strategy is driven in a unified way by the scoring central system. I want to see how it runs—go to the homepage.
My dragon-hunting strategy is to go short in line with momentum from the higher end; when it’s time to slay dragons, if it’s overheated then I harvest. The directional strategy is driven in a unified way by the scoring central system. I want to see how it runs—go to the homepage.
23
·
--
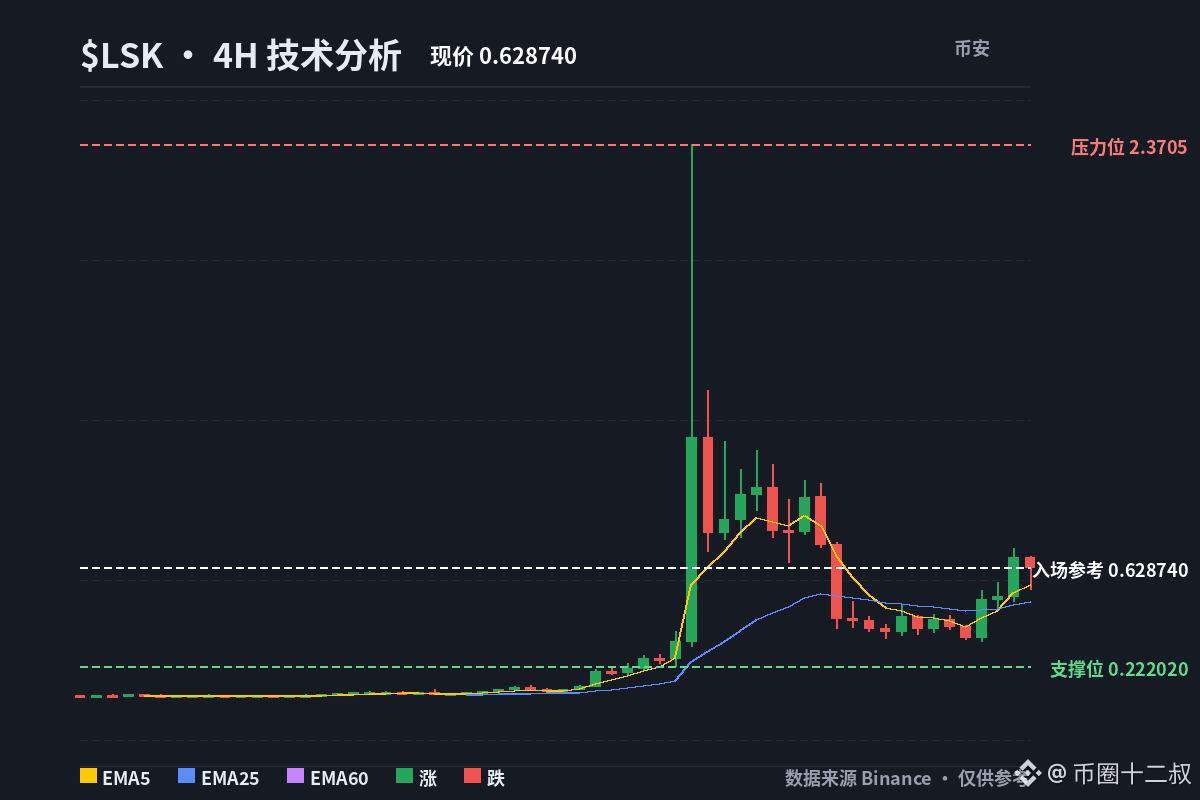
I shorted $LSK before the delisting news came out—this takes quite strong judgment and conviction.
In the leading-stock strategy, you go long only when the potential is >95 and the move can really start. To “slay the dragon,” if the momentum has already been overheated, you short instead. It’s a clear set of rules—no impulse decisions. If you want to follow, go to my homepage.
I shorted $LSK before the delisting news came out—this takes quite strong judgment and conviction.
In the leading-stock strategy, you go long only when the potential is >95 and the move can really start. To “slay the dragon,” if the momentum has already been overheated, you short instead. It’s a clear set of rules—no impulse decisions. If you want to follow, go to my homepage.
In the leading-stock strategy, you go long only when the potential is >95 and the move can really start. To “slay the dragon,” if the momentum has already been overheated, you short instead. It’s a clear set of rules—no impulse decisions. If you want to follow, go to my homepage.
8
·
--
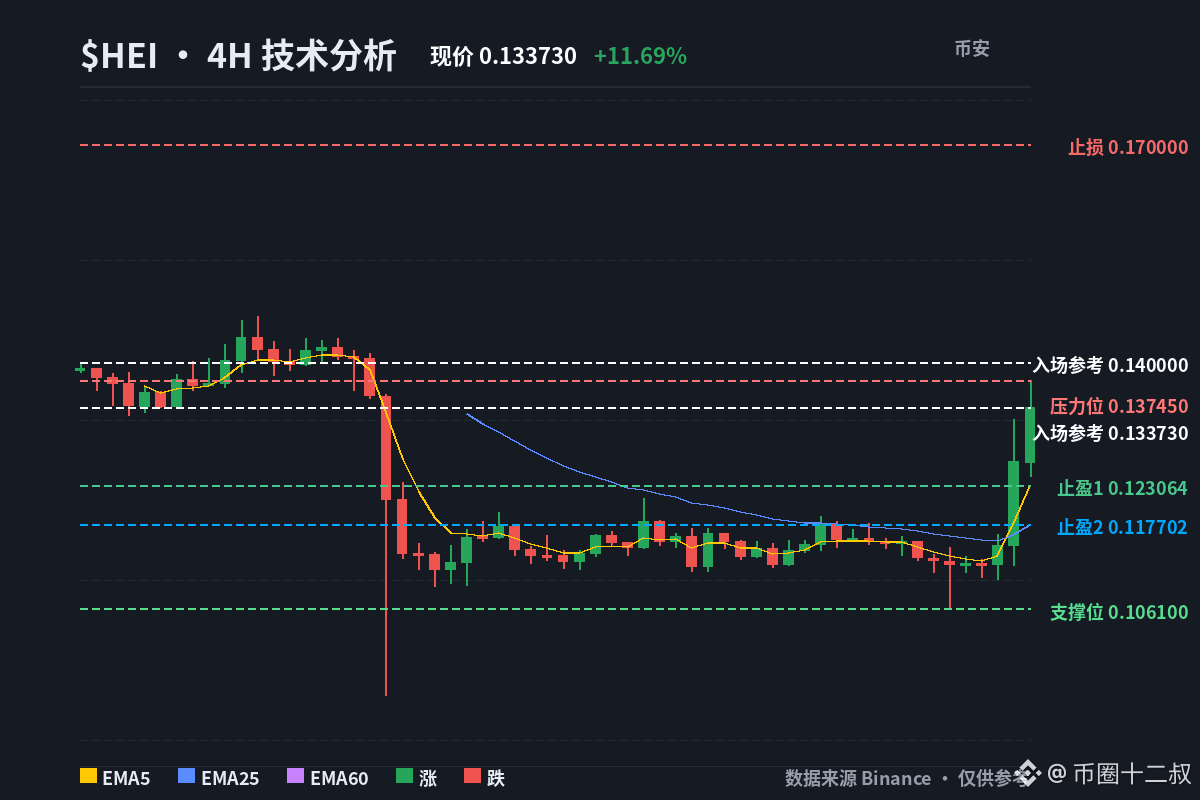
The RSI7 for $HEI has already hit 89.2. It’s not that the short-term can’t rise—it's just that the odds are poor for continuing to chase longs. I’m inclined to wait for a rebound and then look for a short. First, I want to see whether this wave of sentiment can push the price back toward around 0.14.
In the past three 4-hour candles, it has risen 16.49%, with single-candle trading volume of about $9.16 million, and volatility at 10.35%. This shows that trading is indeed active, but high volatility alone cannot prove that it’s a real breakout. Price is trading above the 4-hour EMA5 at 0.123064 and above the 4-hour EMA60 at 0.122751; however, on the daily chart, price is still capped below the EMA25 at 0.130006. The short-term move is fast, but the daily structure hasn’t fully opened up yet.
What’s more troublesome is that the cumulative 24-hour funding rate is -0.5488%—the shorts are paying. OI is already near market cap, and the large-holder long-to-short ratio is 1.7764. This isn’t a comfortable place to chase a short. If the shorts continue covering, price could first surge higher; but if the 0.14 to 0.15 area faces pressure, longs at the highs and breakout chasing positions will start to loosen. Both BTC and the whole market are weakening. $HEI’s independent rally lacks strong support from the broader market, and we can’t underestimate the pullback.
My plan is simple: wait for the price to rebound to around 0.14, then execute. I will not chase a short at the market price near 0.12631. If it breaks and holds above 0.17, it means this suppression logic has failed—I'll directly admit I'm wrong. Downside: first watch the 4-hour moving averages, then look near 0.117702 for intraday support.
📊 Direction: Short
💰 Entry reference: Enter after a rebound and rejection around 0.14
🛑 Stop loss: 0.17—triggering it means exit
🎯 Take profit 1: 0.123064 (watch the 4-hour EMA5)
🎯 Take profit 2: 0.117702 (watch the 4-hour EMA25)
RSI is there to remind me not to chase. The key levels determine whether I’m wrong and need to change my mind.
When you’re at 0.14, do you see rejection and pullback, or does negative funding push a short squeeze to continue? Pick one.
$HEI #技术分析 #Uncle Twelve
If you want to follow Uncle Twelve, go check his Binance homepage for real-trade ideas and decide whether to copy trade
Click my profile to start copying trade
https://www.binance.com/zh-CN/copy-trading/lead-details/5051200019981811968
The RSI7 for $HEI has already hit 89.2. It’s not that the short-term can’t rise—it's just that the odds are poor for continuing to chase longs. I’m inclined to wait for a rebound and then look for a short. First, I want to see whether this wave of sentiment can push the price back toward around 0.14.
In the past three 4-hour candles, it has risen 16.49%, with single-candle trading volume of about $9.16 million, and volatility at 10.35%. This shows that trading is indeed active, but high volatility alone cannot prove that it’s a real breakout. Price is trading above the 4-hour EMA5 at 0.123064 and above the 4-hour EMA60 at 0.122751; however, on the daily chart, price is still capped below the EMA25 at 0.130006. The short-term move is fast, but the daily structure hasn’t fully opened up yet.
What’s more troublesome is that the cumulative 24-hour funding rate is -0.5488%—the shorts are paying. OI is already near market cap, and the large-holder long-to-short ratio is 1.7764. This isn’t a comfortable place to chase a short. If the shorts continue covering, price could first surge higher; but if the 0.14 to 0.15 area faces pressure, longs at the highs and breakout chasing positions will start to loosen. Both BTC and the whole market are weakening. $HEI ’s independent rally lacks strong support from the broader market, and we can’t underestimate the pullback.
My plan is simple: wait for the price to rebound to around 0.14, then execute. I will not chase a short at the market price near 0.12631. If it breaks and holds above 0.17, it means this suppression logic has failed—I'll directly admit I'm wrong. Downside: first watch the 4-hour moving averages, then look near 0.117702 for intraday support.
📊 Direction: Short
💰 Entry reference: Enter after a rebound and rejection around 0.14
🛑 Stop loss: 0.17—triggering it means exit
🎯 Take profit 1: 0.123064 (watch the 4-hour EMA5)
🎯 Take profit 2: 0.117702 (watch the 4-hour EMA25)
RSI is there to remind me not to chase. The key levels determine whether I’m wrong and need to change my mind.
When you’re at 0.14, do you see rejection and pullback, or does negative funding push a short squeeze to continue? Pick one.
$HEI #技术分析 #Uncle Twelve
If you want to follow Uncle Twelve, go check his Binance homepage for real-trade ideas and decide whether to copy trade
Click my profile to start copying trade
https://www.binance.com/zh-CN/copy-trading/lead-details/5051200019981811968
In the past three 4-hour candles, it has risen 16.49%, with single-candle trading volume of about $9.16 million, and volatility at 10.35%. This shows that trading is indeed active, but high volatility alone cannot prove that it’s a real breakout. Price is trading above the 4-hour EMA5 at 0.123064 and above the 4-hour EMA60 at 0.122751; however, on the daily chart, price is still capped below the EMA25 at 0.130006. The short-term move is fast, but the daily structure hasn’t fully opened up yet.
What’s more troublesome is that the cumulative 24-hour funding rate is -0.5488%—the shorts are paying. OI is already near market cap, and the large-holder long-to-short ratio is 1.7764. This isn’t a comfortable place to chase a short. If the shorts continue covering, price could first surge higher; but if the 0.14 to 0.15 area faces pressure, longs at the highs and breakout chasing positions will start to loosen. Both BTC and the whole market are weakening. $HEI ’s independent rally lacks strong support from the broader market, and we can’t underestimate the pullback.
My plan is simple: wait for the price to rebound to around 0.14, then execute. I will not chase a short at the market price near 0.12631. If it breaks and holds above 0.17, it means this suppression logic has failed—I'll directly admit I'm wrong. Downside: first watch the 4-hour moving averages, then look near 0.117702 for intraday support.
📊 Direction: Short
💰 Entry reference: Enter after a rebound and rejection around 0.14
🛑 Stop loss: 0.17—triggering it means exit
🎯 Take profit 1: 0.123064 (watch the 4-hour EMA5)
🎯 Take profit 2: 0.117702 (watch the 4-hour EMA25)
RSI is there to remind me not to chase. The key levels determine whether I’m wrong and need to change my mind.
When you’re at 0.14, do you see rejection and pullback, or does negative funding push a short squeeze to continue? Pick one.
$HEI #技术分析 #Uncle Twelve
If you want to follow Uncle Twelve, go check his Binance homepage for real-trade ideas and decide whether to copy trade
Click my profile to start copying trade
https://www.binance.com/zh-CN/copy-trading/lead-details/5051200019981811968
144
·
--
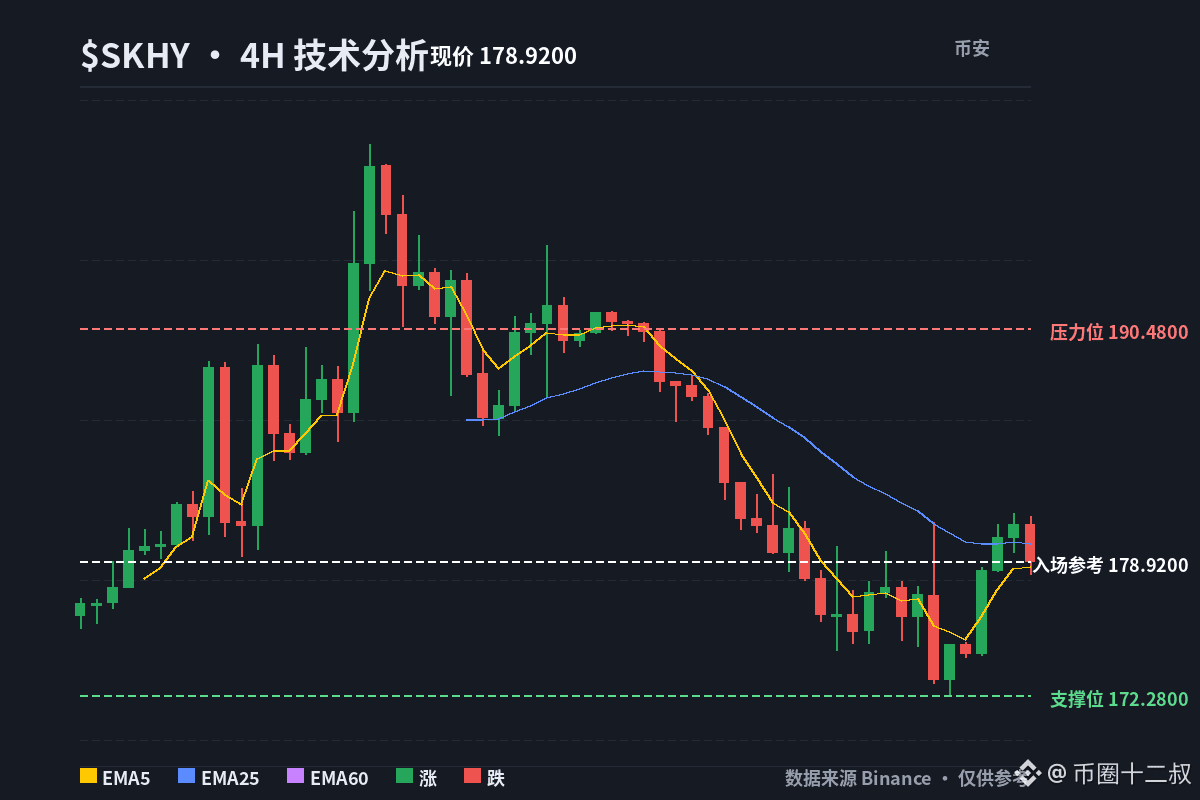
I saw that mid-cap stocks and single-stock traders were mainly selling cash-secured put options in the afternoon, building a bullish return buffer by collecting premiums.
There was about $4.88 million of bullish selling in put options expiring on December 18 with strike prices of $170 and $155 on $SKHY ;
$KRE also saw a large trade of about $4.84 million.
What I fear most is manually holding through a losing position and chasing the wrong direction. The scoring system automatically launches a dragon-slaying short on names with “overheated popularity,” and index shorts are also part of it; the machine follows discipline without emotion. Check the live trading on my homepage.
I saw that mid-cap stocks and single-stock traders were mainly selling cash-secured put options in the afternoon, building a bullish return buffer by collecting premiums.
There was about $4.88 million of bullish selling in put options expiring on December 18 with strike prices of $170 and $155 on $SKHY ;
$KRE also saw a large trade of about $4.84 million.
What I fear most is manually holding through a losing position and chasing the wrong direction. The scoring system automatically launches a dragon-slaying short on names with “overheated popularity,” and index shorts are also part of it; the machine follows discipline without emotion. Check the live trading on my homepage.
There was about $4.88 million of bullish selling in put options expiring on December 18 with strike prices of $170 and $155 on $SKHY ;
$KRE also saw a large trade of about $4.84 million.
What I fear most is manually holding through a losing position and chasing the wrong direction. The scoring system automatically launches a dragon-slaying short on names with “overheated popularity,” and index shorts are also part of it; the machine follows discipline without emotion. Check the live trading on my homepage.
58
Log in to explore more content
Join global crypto users on Binance Square
⚡️ Get latest and useful information about crypto.
💬 Trusted by the world’s largest crypto exchange.
👍 Discover real insights from verified creators.
Email / Phone number
Trending Topics
FedRateWatch
1.5M views
6,850 Discussing
Share & Win Traffic Reward in our Trending Hashtag Campaign
✨Topic: FOMC September, What's The Fed's Next Move?
👉How to Join:
Publish a short post or article with hashtag #FedRateWatch
Create content based on the below angles:
- August core CPI rose 0.3% month-over-month, and the odds of a 25bp hike this week are now close to 90%. Do you anticipate a rate hike this week? Is it a one-off, or the start of a longer hiking cycle?
- If the hike lands, how does it play out for BTC, tech stocks, and gold? Bullish or bearish?
- How are you planning to trade next? Share your BTC, stocks or gold trade/holdings with our trade sharing widget.
⏰Campaign Period:
- 2026-09-15 11:00 - 2026-09-17 3:00 UTC
🎁Reward:
- Qualified posts that comply with the above guidelines and contain more than 100 words will be reviewed and may receive a random traffic boost of 500 to 3,000 views. You will receive a notification from your feed secretary if your post is selected.
- Get a chance to have your article featured on Binance Square Official
Need ideas for your post? Visit the topic page #FedRateWatch or the Square Guide on How to Post for Better Reach.
Binance Square Official
·651 Likes
·1.7M views
ZcashRises6%
60,017 views
691 Discussing
XRPSinks10%
39,813 views
456 Discussing