
加密脉搏
25 Posts

加密脉搏
Report
Block User
用 3 分钟看懂今天的币圈|宏观数据、ETF 资金流、热门代币|欢迎评论区一起聊
18 Following
75 Followers
7 Liked
Posts
·
--
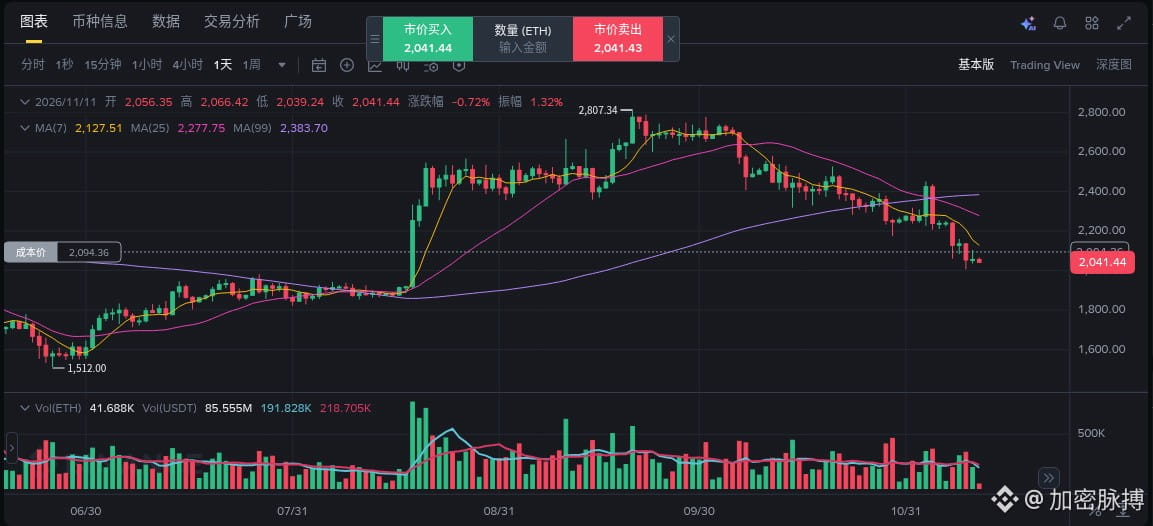
I just saw the U.S. spot Ethereum ETF data for November 11, Eastern Time, and it gave me pause.
According to SoSoValue, U.S. spot Ethereum ETFs saw net outflows of $144.81 million that day, marking the fifth consecutive trading day of net outflows. Even more striking, BlackRock’s ETHA alone saw $129.78 million flow out, and none of the 11 funds recorded net inflows. The entire market had seen outflows of just $1.32 million the previous day, so the figure jumped roughly 110-fold in a single day.
On the price front, $ETH is still hovering around the $2,000 mark. Today, it traded roughly between $2,035 and $2,100. The fact that it held up against such heavy redemptions without breaking down suggests there are still buyers in the spot market. But I wouldn’t interpret that as confirmation of a bottom. Outflows have suddenly surged, led by the flagship product, so for now I see this as short-term pressure. If it falls back below $2,000, that would mean buying support wasn’t strong enough, and my assessment would be wrong. To turn more optimistic, I’d need to see at least one day of positive net flows—not just a price holding firm.
Do you think $ETH will break below $2,000 first, or will spot ETFs post a day of net inflows first?
Personal opinion, not investment advice.
I just saw the U.S. spot Ethereum ETF data for November 11, Eastern Time, and it gave me pause.
According to SoSoValue, U.S. spot Ethereum ETFs saw net outflows of $144.81 million that day, marking the fifth consecutive trading day of net outflows. Even more striking, BlackRock’s ETHA alone saw $129.78 million flow out, and none of the 11 funds recorded net inflows. The entire market had seen outflows of just $1.32 million the previous day, so the figure jumped roughly 110-fold in a single day.
On the price front, $ETH is still hovering around the $2,000 mark. Today, it traded roughly between $2,035 and $2,100. The fact that it held up against such heavy redemptions without breaking down suggests there are still buyers in the spot market. But I wouldn’t interpret that as confirmation of a bottom. Outflows have suddenly surged, led by the flagship product, so for now I see this as short-term pressure. If it falls back below $2,000, that would mean buying support wasn’t strong enough, and my assessment would be wrong. To turn more optimistic, I’d need to see at least one day of positive net flows—not just a price holding firm.
Do you think $ETH will break below $2,000 first, or will spot ETFs post a day of net inflows first?
Personal opinion, not investment advice.
According to SoSoValue, U.S. spot Ethereum ETFs saw net outflows of $144.81 million that day, marking the fifth consecutive trading day of net outflows. Even more striking, BlackRock’s ETHA alone saw $129.78 million flow out, and none of the 11 funds recorded net inflows. The entire market had seen outflows of just $1.32 million the previous day, so the figure jumped roughly 110-fold in a single day.
On the price front, $ETH is still hovering around the $2,000 mark. Today, it traded roughly between $2,035 and $2,100. The fact that it held up against such heavy redemptions without breaking down suggests there are still buyers in the spot market. But I wouldn’t interpret that as confirmation of a bottom. Outflows have suddenly surged, led by the flagship product, so for now I see this as short-term pressure. If it falls back below $2,000, that would mean buying support wasn’t strong enough, and my assessment would be wrong. To turn more optimistic, I’d need to see at least one day of positive net flows—not just a price holding firm.
Do you think $ETH will break below $2,000 first, or will spot ETFs post a day of net inflows first?
Personal opinion, not investment advice.
2
·
--
$PEPE fell 15% in a day, leading the entire meme sector—is this a shakeout or a top? 👇
1️⃣ Market: PEPE is currently trading at around 0.00000447 on Binance Spot, down about 15% in 24 hours, after reaching an intraday high of 0.00000526. According to Phemex data, the meme sector is down about 3.8% overall in the past 24 hours. PEPE has fallen the most, while $BONK is down about 5%.
2️⃣ Longs flushed out: According to swolecharts, around $6.5 million worth of PEPE contracts were liquidated in the past 24 hours, with long positions accounting for 96%. Binance alone accounted for over 70%. CoinGlass data shows PEPE open interest down around 10%, with funding rates turning negative, meaning shorts are paying to hold their positions.
3️⃣ $DOGE is weaker: FXStreet says DOGE has fallen for seven straight weeks, reaching a three-year low, and is now trading at around 0.067. DOGE and SHIB are both down over 40% so far this year, while PEPE is down only about 7% year to date—so this looks like a catch-up decline.
4️⃣ The broader environment is chilly: U.S. spot Bitcoin ETFs have seen net outflows for five consecutive days, totaling around $1.44 billion (Farside data). BTC is currently around 73,600, down about 8% for the week. The market is waiting for Friday’s PPI data.
📌 My take: This PEPE decline came after a steady sell-off from the high of 0.00000568. Nearly all liquidations were long positions, suggesting leverage had built up too much—this is a classic deleveraging event. The good news is that trading volume didn’t surge during the drop, and shorts are starting to get crowded now that funding rates have turned negative. In the short term, watch the rising trendline around 0.0000043. If it holds, there may be a chance for a bounce. First resistance is around 0.00000477; if it holds above that, the next level to watch is the psychological 0.000005 mark. If the daily candle closes below 0.0000042, this uptrend channel will be broken, so don’t rush to buy the dip. Memes are the most sentiment-sensitive sector, so keep your position size small until BTC stabilizes.
With PEPE down to this level, are you buying the dip or waiting for confirmation at 0.0000043? Let’s discuss in the comments 👇
#PEPE #MemeCoin #币安广场
These are personal opinions only and do not constitute investment advice
$PEPE fell 15% in a day, leading the entire meme sector—is this a shakeout or a top? 👇
1️⃣ Market: PEPE is currently trading at around 0.00000447 on Binance Spot, down about 15% in 24 hours, after reaching an intraday high of 0.00000526. According to Phemex data, the meme sector is down about 3.8% overall in the past 24 hours. PEPE has fallen the most, while $BONK is down about 5%.
2️⃣ Longs flushed out: According to swolecharts, around $6.5 million worth of PEPE contracts were liquidated in the past 24 hours, with long positions accounting for 96%. Binance alone accounted for over 70%. CoinGlass data shows PEPE open interest down around 10%, with funding rates turning negative, meaning shorts are paying to hold their positions.
3️⃣ $DOGE is weaker: FXStreet says DOGE has fallen for seven straight weeks, reaching a three-year low, and is now trading at around 0.067. DOGE and SHIB are both down over 40% so far this year, while PEPE is down only about 7% year to date—so this looks like a catch-up decline.
4️⃣ The broader environment is chilly: U.S. spot Bitcoin ETFs have seen net outflows for five consecutive days, totaling around $1.44 billion (Farside data). BTC is currently around 73,600, down about 8% for the week. The market is waiting for Friday’s PPI data.
📌 My take: This PEPE decline came after a steady sell-off from the high of 0.00000568. Nearly all liquidations were long positions, suggesting leverage had built up too much—this is a classic deleveraging event. The good news is that trading volume didn’t surge during the drop, and shorts are starting to get crowded now that funding rates have turned negative. In the short term, watch the rising trendline around 0.0000043. If it holds, there may be a chance for a bounce. First resistance is around 0.00000477; if it holds above that, the next level to watch is the psychological 0.000005 mark. If the daily candle closes below 0.0000042, this uptrend channel will be broken, so don’t rush to buy the dip. Memes are the most sentiment-sensitive sector, so keep your position size small until BTC stabilizes.
With PEPE down to this level, are you buying the dip or waiting for confirmation at 0.0000043? Let’s discuss in the comments 👇
#PEPE #MemeCoin #币安广场
These are personal opinions only and do not constitute investment advice
1️⃣ Market: PEPE is currently trading at around 0.00000447 on Binance Spot, down about 15% in 24 hours, after reaching an intraday high of 0.00000526. According to Phemex data, the meme sector is down about 3.8% overall in the past 24 hours. PEPE has fallen the most, while $BONK is down about 5%.
2️⃣ Longs flushed out: According to swolecharts, around $6.5 million worth of PEPE contracts were liquidated in the past 24 hours, with long positions accounting for 96%. Binance alone accounted for over 70%. CoinGlass data shows PEPE open interest down around 10%, with funding rates turning negative, meaning shorts are paying to hold their positions.
3️⃣ $DOGE is weaker: FXStreet says DOGE has fallen for seven straight weeks, reaching a three-year low, and is now trading at around 0.067. DOGE and SHIB are both down over 40% so far this year, while PEPE is down only about 7% year to date—so this looks like a catch-up decline.
4️⃣ The broader environment is chilly: U.S. spot Bitcoin ETFs have seen net outflows for five consecutive days, totaling around $1.44 billion (Farside data). BTC is currently around 73,600, down about 8% for the week. The market is waiting for Friday’s PPI data.
📌 My take: This PEPE decline came after a steady sell-off from the high of 0.00000568. Nearly all liquidations were long positions, suggesting leverage had built up too much—this is a classic deleveraging event. The good news is that trading volume didn’t surge during the drop, and shorts are starting to get crowded now that funding rates have turned negative. In the short term, watch the rising trendline around 0.0000043. If it holds, there may be a chance for a bounce. First resistance is around 0.00000477; if it holds above that, the next level to watch is the psychological 0.000005 mark. If the daily candle closes below 0.0000042, this uptrend channel will be broken, so don’t rush to buy the dip. Memes are the most sentiment-sensitive sector, so keep your position size small until BTC stabilizes.
With PEPE down to this level, are you buying the dip or waiting for confirmation at 0.0000043? Let’s discuss in the comments 👇
#PEPE #MemeCoin #币安广场
These are personal opinions only and do not constitute investment advice
2
425
·
--
Both are privacy coins, but they’ve gone in completely different directions this week.
The broader market’s Fear & Greed Index is at 28 (Fear), and most coins are down. $XMR , however, is up about 4% over the past 24 hours and is now around $582;
by contrast, $ZEC is down 4% over 24 hours and nearly 27% over 7 days, with its price already below $1,000 (around $994).
My take:
ZEC surged too hard earlier, and this move is giving back some of those gains as profit-takers cash out. XMR hasn’t been hyped much, so its holders are relatively steadfast, making it more resilient in a down market.
But don’t take this as a signal that “XMR is about to take off.” Coins that rise against the trend in a weak market can easily fall to catch up if the broader market drops again. I’m more focused on whether ZEC can hold the $1,000 psychological level. Only if it does will it be worth discussing an oversold rebound.
Which privacy coin do you favor—or are you staying away from both?
(Personal opinion, not investment advice)
Both are privacy coins, but they’ve gone in completely different directions this week.
The broader market’s Fear & Greed Index is at 28 (Fear), and most coins are down. $XMR , however, is up about 4% over the past 24 hours and is now around $582;
by contrast, $ZEC is down 4% over 24 hours and nearly 27% over 7 days, with its price already below $1,000 (around $994).
My take:
ZEC surged too hard earlier, and this move is giving back some of those gains as profit-takers cash out. XMR hasn’t been hyped much, so its holders are relatively steadfast, making it more resilient in a down market.
But don’t take this as a signal that “XMR is about to take off.” Coins that rise against the trend in a weak market can easily fall to catch up if the broader market drops again. I’m more focused on whether ZEC can hold the $1,000 psychological level. Only if it does will it be worth discussing an oversold rebound.
Which privacy coin do you favor—or are you staying away from both?
(Personal opinion, not investment advice)
The broader market’s Fear & Greed Index is at 28 (Fear), and most coins are down. $XMR , however, is up about 4% over the past 24 hours and is now around $582;
by contrast, $ZEC is down 4% over 24 hours and nearly 27% over 7 days, with its price already below $1,000 (around $994).
My take:
ZEC surged too hard earlier, and this move is giving back some of those gains as profit-takers cash out. XMR hasn’t been hyped much, so its holders are relatively steadfast, making it more resilient in a down market.
But don’t take this as a signal that “XMR is about to take off.” Coins that rise against the trend in a weak market can easily fall to catch up if the broader market drops again. I’m more focused on whether ZEC can hold the $1,000 psychological level. Only if it does will it be worth discussing an oversold rebound.
Which privacy coin do you favor—or are you staying away from both?
(Personal opinion, not investment advice)
297
·
--
The probability of a rate hike in December is 87%—this may be the most underestimated bearish factor in crypto lately.
After CPI came in hotter than expected, fed funds futures put the probability of a 25-basis-point hike at the December 8–9 meeting at 87.3%.
There’s another figure I find even more worrying: total stablecoin supply fell by about $14.2 billion over 30 days, its fastest contraction since June 2022. Money is leaving, not just rotating within the market.
$ETH has been hit the hardest: it’s now around 2,060, down more than 15% over the past 7 days—much weaker than $BTC at -8%. When liquidity tightens, funds usually flee higher-beta assets first.
My take:
I’m not rushing to buy the ETH dip until rate-hike expectations have been priced in and stablecoins start flowing back in. If I’m looking for a reversal signal, I’d trust a bottoming and recovery in stablecoin supply more than a candlestick chart.
Do you think once the rate hike happens, the bad news will be behind us—or is the downturn just beginning?
(Just my personal opinion, not investment advice)
The probability of a rate hike in December is 87%—this may be the most underestimated bearish factor in crypto lately.
After CPI came in hotter than expected, fed funds futures put the probability of a 25-basis-point hike at the December 8–9 meeting at 87.3%.
There’s another figure I find even more worrying: total stablecoin supply fell by about $14.2 billion over 30 days, its fastest contraction since June 2022. Money is leaving, not just rotating within the market.
$ETH has been hit the hardest: it’s now around 2,060, down more than 15% over the past 7 days—much weaker than $BTC at -8%. When liquidity tightens, funds usually flee higher-beta assets first.
My take:
I’m not rushing to buy the ETH dip until rate-hike expectations have been priced in and stablecoins start flowing back in. If I’m looking for a reversal signal, I’d trust a bottoming and recovery in stablecoin supply more than a candlestick chart.
Do you think once the rate hike happens, the bad news will be behind us—or is the downturn just beginning?
(Just my personal opinion, not investment advice)
After CPI came in hotter than expected, fed funds futures put the probability of a 25-basis-point hike at the December 8–9 meeting at 87.3%.
There’s another figure I find even more worrying: total stablecoin supply fell by about $14.2 billion over 30 days, its fastest contraction since June 2022. Money is leaving, not just rotating within the market.
$ETH has been hit the hardest: it’s now around 2,060, down more than 15% over the past 7 days—much weaker than $BTC at -8%. When liquidity tightens, funds usually flee higher-beta assets first.
My take:
I’m not rushing to buy the ETH dip until rate-hike expectations have been priced in and stablecoins start flowing back in. If I’m looking for a reversal signal, I’d trust a bottoming and recovery in stablecoin supply more than a candlestick chart.
Do you think once the rate hike happens, the bad news will be behind us—or is the downturn just beginning?
(Just my personal opinion, not investment advice)
148
·
--
ETFs have been selling for 4 trading days in a row, while whales are quietly buying. Who should $BTC listen to?
First, the data:
U.S. spot BTC ETFs have seen net outflows of about $1.6 billion so far in November. Another $95 million flowed out on 11/10, and IBIT has seen redemptions for 8 consecutive days.
But on-chain data from Glassnode shows that two groups of whales—those holding 100–1,000 BTC and 1,000–10,000 BTC—started accumulating again during the week ending 11/9.
My take: Outflows are getting smaller day by day (430M → 412M → 201M → 95M). Selling pressure is easing, but we haven’t seen a reversal yet.
I’m watching two key levels:
🔸 75,600: The average cost basis for short-term holders. Getting back above it would suggest this downturn was more of a shakeout.
🔸 73,000: If this level doesn’t hold, we’ll probably see more deleveraging.
At around 74,000 right now, we’re stuck in the middle. I’m choosing to wait for a clear direction before making a move—not guess while we’re in between.
Are you siding with the ETFs or the whales? Which do you think we’ll hit first: 75,600 or 73,000?
(Personal opinion, not investment advice)
ETFs have been selling for 4 trading days in a row, while whales are quietly buying. Who should $BTC listen to?
First, the data:
U.S. spot BTC ETFs have seen net outflows of about $1.6 billion so far in November. Another $95 million flowed out on 11/10, and IBIT has seen redemptions for 8 consecutive days.
But on-chain data from Glassnode shows that two groups of whales—those holding 100–1,000 BTC and 1,000–10,000 BTC—started accumulating again during the week ending 11/9.
My take: Outflows are getting smaller day by day (430M → 412M → 201M → 95M). Selling pressure is easing, but we haven’t seen a reversal yet.
I’m watching two key levels:
🔸 75,600: The average cost basis for short-term holders. Getting back above it would suggest this downturn was more of a shakeout.
🔸 73,000: If this level doesn’t hold, we’ll probably see more deleveraging.
At around 74,000 right now, we’re stuck in the middle. I’m choosing to wait for a clear direction before making a move—not guess while we’re in between.
Are you siding with the ETFs or the whales? Which do you think we’ll hit first: 75,600 or 73,000?
(Personal opinion, not investment advice)
First, the data:
U.S. spot BTC ETFs have seen net outflows of about $1.6 billion so far in November. Another $95 million flowed out on 11/10, and IBIT has seen redemptions for 8 consecutive days.
But on-chain data from Glassnode shows that two groups of whales—those holding 100–1,000 BTC and 1,000–10,000 BTC—started accumulating again during the week ending 11/9.
My take: Outflows are getting smaller day by day (430M → 412M → 201M → 95M). Selling pressure is easing, but we haven’t seen a reversal yet.
I’m watching two key levels:
🔸 75,600: The average cost basis for short-term holders. Getting back above it would suggest this downturn was more of a shakeout.
🔸 73,000: If this level doesn’t hold, we’ll probably see more deleveraging.
At around 74,000 right now, we’re stuck in the middle. I’m choosing to wait for a clear direction before making a move—not guess while we’re in between.
Are you siding with the ETFs or the whales? Which do you think we’ll hit first: 75,600 or 73,000?
(Personal opinion, not investment advice)
BTC-0.43%
IBITETF-1.59%
68
·
--
When the broader market tightens, meme coins tend to fall harder. $PEPE has been sliding with market sentiment over the past couple of days, and its Binance spot price briefly approached the round-number level of 0.000005. In the short term, liquidations of long positions have clearly outnumbered those of shorts, and buyers seem hesitant around this level. I think 0.000005 is the key psychological level right now. If it holds, the price might catch its breath, but it has failed to break above the 0.0000055 area several times before, so don't expect it to rally on its own without a surge in volume. The Fear Index is still around 26, and in times like these, meme coins are driven more by sentiment than by stories. Would you take a look around 0.000005, or wait for the broader market to stabilize first?
When the broader market tightens, meme coins tend to fall harder. $PEPE has been sliding with market sentiment over the past couple of days, and its Binance spot price briefly approached the round-number level of 0.000005. In the short term, liquidations of long positions have clearly outnumbered those of shorts, and buyers seem hesitant around this level. I think 0.000005 is the key psychological level right now. If it holds, the price might catch its breath, but it has failed to break above the 0.0000055 area several times before, so don't expect it to rally on its own without a surge in volume. The Fear Index is still around 26, and in times like these, meme coins are driven more by sentiment than by stories. Would you take a look around 0.000005, or wait for the broader market to stabilize first?
817
·
--
$XRP is back around $1.06 for now, after dipping to nearly $1.03 intraday. It’s down about 15% this week. More striking than the price is the money flowing out: U.S. spot XRP ETFs recorded about $10.42 million in net outflows on the 9th, their largest single-day outflow since March. What makes things even more awkward is that futures funding rates remain elevated, suggesting some traders are still stubbornly holding long positions through this downturn. Technically, $1.05 is the immediate support; if it breaks, the $1 mark is next. For some breathing room, XRP needs to reclaim the $1.08–$1.10 range. Being oversold doesn’t mean a reversal is imminent. Until outflows stop, I’m more concerned with whether support can hold. Do you think the $1 level will hold?
$XRP is back around $1.06 for now, after dipping to nearly $1.03 intraday. It’s down about 15% this week. More striking than the price is the money flowing out: U.S. spot XRP ETFs recorded about $10.42 million in net outflows on the 9th, their largest single-day outflow since March. What makes things even more awkward is that futures funding rates remain elevated, suggesting some traders are still stubbornly holding long positions through this downturn. Technically, $1.05 is the immediate support; if it breaks, the $1 mark is next. For some breathing room, XRP needs to reclaim the $1.08–$1.10 range. Being oversold doesn’t mean a reversal is imminent. Until outflows stop, I’m more concerned with whether support can hold. Do you think the $1 level will hold?
19
·
--
After CPI came out, everyone was watching to see whether $BTC could hold 73,000, but I think $SOL is in a tougher spot. It had mostly stayed above $85 last week, but plunged straight through after the data was released. It’s now hovering around $83, and at one point dipped below $82 intraday. Spot SOL ETFs haven’t been holding up either: they were still seeing net outflows in early November, with institutions pulling out. My take is simple: $82 to $77 is the most important near-term support zone. If it doesn’t hold, there’s room to fall further. To turn things around, it needs to reclaim $85 first. No matter how impressive the network upgrade is, short-term prices are still driven by capital flows. Do you think it can stay above $80 this time?
After CPI came out, everyone was watching to see whether $BTC could hold 73,000, but I think $SOL is in a tougher spot. It had mostly stayed above $85 last week, but plunged straight through after the data was released. It’s now hovering around $83, and at one point dipped below $82 intraday. Spot SOL ETFs haven’t been holding up either: they were still seeing net outflows in early November, with institutions pulling out. My take is simple: $82 to $77 is the most important near-term support zone. If it doesn’t hold, there’s room to fall further. To turn things around, it needs to reclaim $85 first. No matter how impressive the network upgrade is, short-term prices are still driven by capital flows. Do you think it can stay above $80 this time?
99
·
--
Privacy coin leader $ZEC falls back to $1,000 — has the bullish news around the NU7 upgrade been wiped out? 👇
1️⃣ Market action: ZEC is currently trading at around $1,000 on Binance spot, down about 13% in 24 hours. It hit a low of 966 today. On November 6, the day of the NU7 upgrade, it surged to a high of 1,388, then pulled back about 30% over five days.
2️⃣ The upgrade itself is working fine: NU7 activated at block height 3,543,405. Block times have shortened from 75 seconds to 25 seconds, and 60% of fees go into a reserve pool, with funds flowing back to miners starting in 2031. The total supply cap remains 21 million coins.
3️⃣ Funds are flowing out: According to The Block, Grayscale’s Zcash product ZCSH saw net outflows of over $15 million in the first 10 days of November, following outflows of about $46 million in October.
4️⃣ Macro headwinds: US CPI rose 0.4% month over month in October, above the expected 0.3%. FXStreet, citing CME FedWatch, says the probability of a 25-basis-point rate hike in December is around 90%. More than $700 million in positions were liquidated across the market in 24 hours, including about $580 million in long positions. $BTC is currently around $74,150, down about 1%—holding up much better. $DASH is down about 3%, around $44, and privacy coins are generally weak.
📌 My take: This ZEC downturn looks more like profit-taking after a sharp run-up ahead of the upgrade, compounded by a cascade of liquidations in leveraged long positions—not a problem with the project’s fundamentals. $1,000 is a psychological level. It briefly dipped to 966 today before rebounding. In the short term, watch whether it can hold the 960–1,000 range. If it does, you could try a small long position, with 1,080 as the first target, followed by 1,150. If the daily candle closes below 960, the next support is around 880; there’s no rush to consider buying before then. Volatility may pick up further ahead of the US PPI release on Friday (November 13).
ZEC has fallen to 1,000—are you buying the dip or staying on the sidelines? Let’s talk in the comments 👇
#ZEC #PrivacyCoins #币安广场
Personal opinion only; not investment advice
Privacy coin leader $ZEC falls back to $1,000 — has the bullish news around the NU7 upgrade been wiped out? 👇
1️⃣ Market action: ZEC is currently trading at around $1,000 on Binance spot, down about 13% in 24 hours. It hit a low of 966 today. On November 6, the day of the NU7 upgrade, it surged to a high of 1,388, then pulled back about 30% over five days.
2️⃣ The upgrade itself is working fine: NU7 activated at block height 3,543,405. Block times have shortened from 75 seconds to 25 seconds, and 60% of fees go into a reserve pool, with funds flowing back to miners starting in 2031. The total supply cap remains 21 million coins.
3️⃣ Funds are flowing out: According to The Block, Grayscale’s Zcash product ZCSH saw net outflows of over $15 million in the first 10 days of November, following outflows of about $46 million in October.
4️⃣ Macro headwinds: US CPI rose 0.4% month over month in October, above the expected 0.3%. FXStreet, citing CME FedWatch, says the probability of a 25-basis-point rate hike in December is around 90%. More than $700 million in positions were liquidated across the market in 24 hours, including about $580 million in long positions. $BTC is currently around $74,150, down about 1%—holding up much better. $DASH is down about 3%, around $44, and privacy coins are generally weak.
📌 My take: This ZEC downturn looks more like profit-taking after a sharp run-up ahead of the upgrade, compounded by a cascade of liquidations in leveraged long positions—not a problem with the project’s fundamentals. $1,000 is a psychological level. It briefly dipped to 966 today before rebounding. In the short term, watch whether it can hold the 960–1,000 range. If it does, you could try a small long position, with 1,080 as the first target, followed by 1,150. If the daily candle closes below 960, the next support is around 880; there’s no rush to consider buying before then. Volatility may pick up further ahead of the US PPI release on Friday (November 13).
ZEC has fallen to 1,000—are you buying the dip or staying on the sidelines? Let’s talk in the comments 👇
#ZEC #PrivacyCoins #币安广场
Personal opinion only; not investment advice
1️⃣ Market action: ZEC is currently trading at around $1,000 on Binance spot, down about 13% in 24 hours. It hit a low of 966 today. On November 6, the day of the NU7 upgrade, it surged to a high of 1,388, then pulled back about 30% over five days.
2️⃣ The upgrade itself is working fine: NU7 activated at block height 3,543,405. Block times have shortened from 75 seconds to 25 seconds, and 60% of fees go into a reserve pool, with funds flowing back to miners starting in 2031. The total supply cap remains 21 million coins.
3️⃣ Funds are flowing out: According to The Block, Grayscale’s Zcash product ZCSH saw net outflows of over $15 million in the first 10 days of November, following outflows of about $46 million in October.
4️⃣ Macro headwinds: US CPI rose 0.4% month over month in October, above the expected 0.3%. FXStreet, citing CME FedWatch, says the probability of a 25-basis-point rate hike in December is around 90%. More than $700 million in positions were liquidated across the market in 24 hours, including about $580 million in long positions. $BTC is currently around $74,150, down about 1%—holding up much better. $DASH is down about 3%, around $44, and privacy coins are generally weak.
📌 My take: This ZEC downturn looks more like profit-taking after a sharp run-up ahead of the upgrade, compounded by a cascade of liquidations in leveraged long positions—not a problem with the project’s fundamentals. $1,000 is a psychological level. It briefly dipped to 966 today before rebounding. In the short term, watch whether it can hold the 960–1,000 range. If it does, you could try a small long position, with 1,080 as the first target, followed by 1,150. If the daily candle closes below 960, the next support is around 880; there’s no rush to consider buying before then. Volatility may pick up further ahead of the US PPI release on Friday (November 13).
ZEC has fallen to 1,000—are you buying the dip or staying on the sidelines? Let’s talk in the comments 👇
#ZEC #PrivacyCoins #币安广场
Personal opinion only; not investment advice
43
·
--
Ethereum ETFs have seen continuous outflows, yet $ETH has held above 2,000. Is this a good entry point? 👇
1️⃣ Fund flows: According to Farside data, U.S. spot Ethereum ETFs saw net outflows of about $185 million on November 9. Across the 11 trading days since October 26, there were outflows on 10 days, totaling about $980 million. BlackRock’s ETHA alone saw about $465 million in redemptions since the start of November.
2️⃣ Outflows are slowing noticeably: SoSoValue data shows outflows of only about $1.32 million on November 10, down 99% from the previous day.
3️⃣ Market action: $ETH is currently around $2,067, down about 2.3% over 24 hours. After CPI was released last night, it dipped to a low of $2,006, then closed higher for several consecutive 4-hour candles. $BTC is around $73,800, down about 1%, and is holding up a little better than ETH.
4️⃣ Altcoins are under more pressure: $ARB is down about 6.5%, trading near $0.16, with another token unlock scheduled for November 16. UNI is down about 5% at $6.63, and has fallen more than 13% in a week. There’s no obvious project-specific negative news for now; it’s mainly moving with the broader market.
📌 My take: $2,000 is a level ETH has repeatedly tested during this cycle. Even after last night’s CPI shock, it only dipped to $2,006 before buyers stepped in. With ETF outflows also slowing, I’d lean toward scaling in on dips between $2,000 and $2,030 rather than chasing the price higher. I’d place my defense below $1,960; a break below that would mean this support has failed. To the upside, I’d look first at $2,150, then $2,250. If ETH can hold above those levels with rising volume, it could reach around $2,400. I wouldn’t rush to buy the dip on ARB before the unlock; I’d wait until after the 16th and reassess.
ETF outflows are slowing. Do you think ETH can hold above 2,000? Let’s discuss in the comments 👇
#ETH #以太坊ETF #ARB #币安广场
These are my personal opinions only and do not constitute investment advice.
Ethereum ETFs have seen continuous outflows, yet $ETH has held above 2,000. Is this a good entry point? 👇
1️⃣ Fund flows: According to Farside data, U.S. spot Ethereum ETFs saw net outflows of about $185 million on November 9. Across the 11 trading days since October 26, there were outflows on 10 days, totaling about $980 million. BlackRock’s ETHA alone saw about $465 million in redemptions since the start of November.
2️⃣ Outflows are slowing noticeably: SoSoValue data shows outflows of only about $1.32 million on November 10, down 99% from the previous day.
3️⃣ Market action: $ETH is currently around $2,067, down about 2.3% over 24 hours. After CPI was released last night, it dipped to a low of $2,006, then closed higher for several consecutive 4-hour candles. $BTC is around $73,800, down about 1%, and is holding up a little better than ETH.
4️⃣ Altcoins are under more pressure: $ARB is down about 6.5%, trading near $0.16, with another token unlock scheduled for November 16. UNI is down about 5% at $6.63, and has fallen more than 13% in a week. There’s no obvious project-specific negative news for now; it’s mainly moving with the broader market.
📌 My take: $2,000 is a level ETH has repeatedly tested during this cycle. Even after last night’s CPI shock, it only dipped to $2,006 before buyers stepped in. With ETF outflows also slowing, I’d lean toward scaling in on dips between $2,000 and $2,030 rather than chasing the price higher. I’d place my defense below $1,960; a break below that would mean this support has failed. To the upside, I’d look first at $2,150, then $2,250. If ETH can hold above those levels with rising volume, it could reach around $2,400. I wouldn’t rush to buy the dip on ARB before the unlock; I’d wait until after the 16th and reassess.
ETF outflows are slowing. Do you think ETH can hold above 2,000? Let’s discuss in the comments 👇
#ETH #以太坊ETF #ARB #币安广场
These are my personal opinions only and do not constitute investment advice.
1️⃣ Fund flows: According to Farside data, U.S. spot Ethereum ETFs saw net outflows of about $185 million on November 9. Across the 11 trading days since October 26, there were outflows on 10 days, totaling about $980 million. BlackRock’s ETHA alone saw about $465 million in redemptions since the start of November.
2️⃣ Outflows are slowing noticeably: SoSoValue data shows outflows of only about $1.32 million on November 10, down 99% from the previous day.
3️⃣ Market action: $ETH is currently around $2,067, down about 2.3% over 24 hours. After CPI was released last night, it dipped to a low of $2,006, then closed higher for several consecutive 4-hour candles. $BTC is around $73,800, down about 1%, and is holding up a little better than ETH.
4️⃣ Altcoins are under more pressure: $ARB is down about 6.5%, trading near $0.16, with another token unlock scheduled for November 16. UNI is down about 5% at $6.63, and has fallen more than 13% in a week. There’s no obvious project-specific negative news for now; it’s mainly moving with the broader market.
📌 My take: $2,000 is a level ETH has repeatedly tested during this cycle. Even after last night’s CPI shock, it only dipped to $2,006 before buyers stepped in. With ETF outflows also slowing, I’d lean toward scaling in on dips between $2,000 and $2,030 rather than chasing the price higher. I’d place my defense below $1,960; a break below that would mean this support has failed. To the upside, I’d look first at $2,150, then $2,250. If ETH can hold above those levels with rising volume, it could reach around $2,400. I wouldn’t rush to buy the dip on ARB before the unlock; I’d wait until after the 16th and reassess.
ETF outflows are slowing. Do you think ETH can hold above 2,000? Let’s discuss in the comments 👇
#ETH #以太坊ETF #ARB #币安广场
These are my personal opinions only and do not constitute investment advice.
31
·
--
The chain was hacked and halted, yet the token price doubled? $INIT surged over 140% in two days. What kind of money is behind this move? 👇
1️⃣ $INIT is currently around $0.31, up about 64% on Binance over the past 24 hours, with an intraday high of $0.332. It was still hovering around $0.13 on November 9, so it’s more than doubled in two days.
2️⃣ The fundamentals tell a different story: Initia’s mainnet was halted on November 10 after keys for its rollup infrastructure were stolen. This was the second such incident in three weeks. According to the latest official update, about $3.27 million in assets was transferred, including $2.16 million still locked on the suspended chain. The attacker did not take any INIT. The team has pledged to make users whole, but restarting the chain will take longer than usual, and there is no timeline yet.
3️⃣ The rally looks more like a short squeeze: while the chain is halted, deposits and withdrawals are unavailable, making it difficult for shorts to buy spot tokens to cover their positions. Coinglass data shows the funding rate briefly hit -1.8% on the 10th, meaning shorts were paying longs, while open interest doubled. Upbit also still lists INIT under its warning review.
4️⃣ Another strong performer is $ONE: currently around $0.00166, up about 20% in 24 hours, after reaching a high of $0.00208. That’s close to a double from its November 5 low of $0.00103, but the project team has made no announcements—it’s a move driven purely by capital flows.
5️⃣ The broader market is weak: $BTC is around $73,800, down about 1% over 24 hours, with capital clearly looking for higher-beta opportunities in smaller coins.
📌 My take: INIT’s move is driven by a market structure where it’s “impossible to dump,” not by positive news. First, watch the area around $0.23 below; it held on two retests today. The previous high at $0.33 is the resistance above. The real risk comes when the chain restarts: once tokens on-chain can move freely, selling pressure could be unleashed all at once. Be very cautious about chasing the rally. For ONE, watch support at $0.0015; if it fails to hold, the gains could easily be given back.
The chain is halted, yet the token is surging—would you chase it, or wait for the restart? Let’s talk in the comments 👇
#INIT #Initia #ONE #Altcoins #币安广场
Personal opinion only; not investment advice
The chain was hacked and halted, yet the token price doubled? $INIT surged over 140% in two days. What kind of money is behind this move? 👇
1️⃣ $INIT is currently around $0.31, up about 64% on Binance over the past 24 hours, with an intraday high of $0.332. It was still hovering around $0.13 on November 9, so it’s more than doubled in two days.
2️⃣ The fundamentals tell a different story: Initia’s mainnet was halted on November 10 after keys for its rollup infrastructure were stolen. This was the second such incident in three weeks. According to the latest official update, about $3.27 million in assets was transferred, including $2.16 million still locked on the suspended chain. The attacker did not take any INIT. The team has pledged to make users whole, but restarting the chain will take longer than usual, and there is no timeline yet.
3️⃣ The rally looks more like a short squeeze: while the chain is halted, deposits and withdrawals are unavailable, making it difficult for shorts to buy spot tokens to cover their positions. Coinglass data shows the funding rate briefly hit -1.8% on the 10th, meaning shorts were paying longs, while open interest doubled. Upbit also still lists INIT under its warning review.
4️⃣ Another strong performer is $ONE: currently around $0.00166, up about 20% in 24 hours, after reaching a high of $0.00208. That’s close to a double from its November 5 low of $0.00103, but the project team has made no announcements—it’s a move driven purely by capital flows.
5️⃣ The broader market is weak: $BTC is around $73,800, down about 1% over 24 hours, with capital clearly looking for higher-beta opportunities in smaller coins.
📌 My take: INIT’s move is driven by a market structure where it’s “impossible to dump,” not by positive news. First, watch the area around $0.23 below; it held on two retests today. The previous high at $0.33 is the resistance above. The real risk comes when the chain restarts: once tokens on-chain can move freely, selling pressure could be unleashed all at once. Be very cautious about chasing the rally. For ONE, watch support at $0.0015; if it fails to hold, the gains could easily be given back.
The chain is halted, yet the token is surging—would you chase it, or wait for the restart? Let’s talk in the comments 👇
#INIT #Initia #ONE #Altcoins #币安广场
Personal opinion only; not investment advice
1️⃣ $INIT is currently around $0.31, up about 64% on Binance over the past 24 hours, with an intraday high of $0.332. It was still hovering around $0.13 on November 9, so it’s more than doubled in two days.
2️⃣ The fundamentals tell a different story: Initia’s mainnet was halted on November 10 after keys for its rollup infrastructure were stolen. This was the second such incident in three weeks. According to the latest official update, about $3.27 million in assets was transferred, including $2.16 million still locked on the suspended chain. The attacker did not take any INIT. The team has pledged to make users whole, but restarting the chain will take longer than usual, and there is no timeline yet.
3️⃣ The rally looks more like a short squeeze: while the chain is halted, deposits and withdrawals are unavailable, making it difficult for shorts to buy spot tokens to cover their positions. Coinglass data shows the funding rate briefly hit -1.8% on the 10th, meaning shorts were paying longs, while open interest doubled. Upbit also still lists INIT under its warning review.
4️⃣ Another strong performer is $ONE: currently around $0.00166, up about 20% in 24 hours, after reaching a high of $0.00208. That’s close to a double from its November 5 low of $0.00103, but the project team has made no announcements—it’s a move driven purely by capital flows.
5️⃣ The broader market is weak: $BTC is around $73,800, down about 1% over 24 hours, with capital clearly looking for higher-beta opportunities in smaller coins.
📌 My take: INIT’s move is driven by a market structure where it’s “impossible to dump,” not by positive news. First, watch the area around $0.23 below; it held on two retests today. The previous high at $0.33 is the resistance above. The real risk comes when the chain restarts: once tokens on-chain can move freely, selling pressure could be unleashed all at once. Be very cautious about chasing the rally. For ONE, watch support at $0.0015; if it fails to hold, the gains could easily be given back.
The chain is halted, yet the token is surging—would you chase it, or wait for the restart? Let’s talk in the comments 👇
#INIT #Initia #ONE #Altcoins #币安广场
Personal opinion only; not investment advice
589
·
--
MSCI will announce its list tomorrow morning, and Strategy is likely to be kicked out of the index. Will $BTC be dragged down? 👇
1️⃣ MSCI will announce the results of its November index review at around 6 a.m. Beijing time tomorrow. Under the new rules set in October, “non-operating companies” cannot remain in the index. The draft has already marked Strategy and Metaplanet for removal, effective at the close on November 30.
2️⃣ JPMorgan previously estimated that MSCI’s removal alone could trigger around $2.8 billion in passive selling, rising to as much as $8.8 billion if other index providers follow suit. But the selling would be in MSTR shares; Strategy does not need to sell the approximately 849,000 BTC it holds.
3️⃣ Fund flows remain weak: spot Bitcoin ETFs saw net outflows of $201 million on Monday, bringing cumulative outflows since November 2 to around $1.5 billion. BlackRock’s IBIT has seen redemptions for seven consecutive trading days. Miner MARA sold 13,597 BTC over the past six weeks, worth around $1.1 billion.
4️⃣ Market snapshot: $BTC is currently around $73,400, down about 2% in 24 hours, with a low of $72,727. $ZEC has been hit particularly hard, briefly falling below $1,000. It’s down about 13% in 24 hours and has retraced around 40% from its September high of $1,695, mainly due to concentrated liquidations of leveraged longs.
5️⃣ Some are bucking the trend: $PEPE 24 is up about 6.5% over 24 hours; $ETH is around $2,050, down about 3.5%.
📌 My take: The removal is largely already priced in. What really matters is whether tomorrow morning’s list contains any “surprises,” such as more crypto treasury companies being named. If $BTC can hold around $72,500 and climb back above $75,000 after the announcement, it could see a relief rally once the bad news is out. If it falls below $72,000, the next level to watch is the $70,000 mark. For ZEC, first see whether it can hold $1,000—don’t rush to buy the dip.
What do you think: once the MSCI list comes out, will the bad news be behind us, or will we see another sell-off? Let’s talk in the comments 👇
#BTC #MSCI #MSTR #ZEC #币安广场
Personal opinion only; not investment advice
MSCI will announce its list tomorrow morning, and Strategy is likely to be kicked out of the index. Will $BTC be dragged down? 👇
1️⃣ MSCI will announce the results of its November index review at around 6 a.m. Beijing time tomorrow. Under the new rules set in October, “non-operating companies” cannot remain in the index. The draft has already marked Strategy and Metaplanet for removal, effective at the close on November 30.
2️⃣ JPMorgan previously estimated that MSCI’s removal alone could trigger around $2.8 billion in passive selling, rising to as much as $8.8 billion if other index providers follow suit. But the selling would be in MSTR shares; Strategy does not need to sell the approximately 849,000 BTC it holds.
3️⃣ Fund flows remain weak: spot Bitcoin ETFs saw net outflows of $201 million on Monday, bringing cumulative outflows since November 2 to around $1.5 billion. BlackRock’s IBIT has seen redemptions for seven consecutive trading days. Miner MARA sold 13,597 BTC over the past six weeks, worth around $1.1 billion.
4️⃣ Market snapshot: $BTC is currently around $73,400, down about 2% in 24 hours, with a low of $72,727. $ZEC has been hit particularly hard, briefly falling below $1,000. It’s down about 13% in 24 hours and has retraced around 40% from its September high of $1,695, mainly due to concentrated liquidations of leveraged longs.
5️⃣ Some are bucking the trend: $PEPE 24 is up about 6.5% over 24 hours; $ETH is around $2,050, down about 3.5%.
📌 My take: The removal is largely already priced in. What really matters is whether tomorrow morning’s list contains any “surprises,” such as more crypto treasury companies being named. If $BTC can hold around $72,500 and climb back above $75,000 after the announcement, it could see a relief rally once the bad news is out. If it falls below $72,000, the next level to watch is the $70,000 mark. For ZEC, first see whether it can hold $1,000—don’t rush to buy the dip.
What do you think: once the MSCI list comes out, will the bad news be behind us, or will we see another sell-off? Let’s talk in the comments 👇
#BTC #MSCI #MSTR #ZEC #币安广场
Personal opinion only; not investment advice
1️⃣ MSCI will announce the results of its November index review at around 6 a.m. Beijing time tomorrow. Under the new rules set in October, “non-operating companies” cannot remain in the index. The draft has already marked Strategy and Metaplanet for removal, effective at the close on November 30.
2️⃣ JPMorgan previously estimated that MSCI’s removal alone could trigger around $2.8 billion in passive selling, rising to as much as $8.8 billion if other index providers follow suit. But the selling would be in MSTR shares; Strategy does not need to sell the approximately 849,000 BTC it holds.
3️⃣ Fund flows remain weak: spot Bitcoin ETFs saw net outflows of $201 million on Monday, bringing cumulative outflows since November 2 to around $1.5 billion. BlackRock’s IBIT has seen redemptions for seven consecutive trading days. Miner MARA sold 13,597 BTC over the past six weeks, worth around $1.1 billion.
4️⃣ Market snapshot: $BTC is currently around $73,400, down about 2% in 24 hours, with a low of $72,727. $ZEC has been hit particularly hard, briefly falling below $1,000. It’s down about 13% in 24 hours and has retraced around 40% from its September high of $1,695, mainly due to concentrated liquidations of leveraged longs.
5️⃣ Some are bucking the trend: $PEPE 24 is up about 6.5% over 24 hours; $ETH is around $2,050, down about 3.5%.
📌 My take: The removal is largely already priced in. What really matters is whether tomorrow morning’s list contains any “surprises,” such as more crypto treasury companies being named. If $BTC can hold around $72,500 and climb back above $75,000 after the announcement, it could see a relief rally once the bad news is out. If it falls below $72,000, the next level to watch is the $70,000 mark. For ZEC, first see whether it can hold $1,000—don’t rush to buy the dip.
What do you think: once the MSCI list comes out, will the bad news be behind us, or will we see another sell-off? Let’s talk in the comments 👇
#BTC #MSCI #MSTR #ZEC #币安广场
Personal opinion only; not investment advice
507
·
--
Last night, CPI came in hotter than expected, and $BTC briefly fell below $73,000. Here are a few signals worth watching 👇
1️⃣ US CPI rose 0.4% month over month in October, while core CPI rose 0.3%—both above expectations of 0.3% and 0.2%, respectively. Because of last year's government shutdown, year-over-year figures weren't released this time. This is the final CPI report before the December rate decision.
2️⃣ $BTC fell as low as $72,787, briefly dropping below $73,000. It has now recovered to around $73,500, down about 2.2% over 24 hours. $ETH came close to $2,000 overnight and is now around $2,048, down about 3.7%.
3️⃣ More than $650 million in positions were liquidated across the crypto market over the past 24 hours, with longs accounting for over $530 million. The Fear & Greed Index dropped from 32 to 26, remaining in the fear zone.
4️⃣ Altcoins fell harder: $SOL and $XRP were both down more than 4%; $BNB held up relatively well, down about 1.6%.
5️⃣ Rate hike expectations have been repriced: a December hike is now almost a foregone conclusion, and the core figures also hit the threshold Waller previously cited as potentially warranting a 50-basis-point hike.
📌 My take: In the short term, watch the $73,000 support level. It was already breached overnight, dipping to $72,800, but recovered by morning. If BTC can't reclaim $74,000, the rebound remains weak; a break below last night's low would significantly increase pressure. For $ETH, keep a close eye on $2,000. Don't take on too much leverage—PPI is also due Friday.
Do you think the $73,000 support level will hold? Let's talk in the comments 👇
#BTC #ETH #SOL #BNB #CPI #币安广场
These are solely my personal views and do not constitute investment advice
Last night, CPI came in hotter than expected, and $BTC briefly fell below $73,000. Here are a few signals worth watching 👇
1️⃣ US CPI rose 0.4% month over month in October, while core CPI rose 0.3%—both above expectations of 0.3% and 0.2%, respectively. Because of last year's government shutdown, year-over-year figures weren't released this time. This is the final CPI report before the December rate decision.
2️⃣ $BTC fell as low as $72,787, briefly dropping below $73,000. It has now recovered to around $73,500, down about 2.2% over 24 hours. $ETH came close to $2,000 overnight and is now around $2,048, down about 3.7%.
3️⃣ More than $650 million in positions were liquidated across the crypto market over the past 24 hours, with longs accounting for over $530 million. The Fear & Greed Index dropped from 32 to 26, remaining in the fear zone.
4️⃣ Altcoins fell harder: $SOL and $XRP were both down more than 4%; $BNB held up relatively well, down about 1.6%.
5️⃣ Rate hike expectations have been repriced: a December hike is now almost a foregone conclusion, and the core figures also hit the threshold Waller previously cited as potentially warranting a 50-basis-point hike.
📌 My take: In the short term, watch the $73,000 support level. It was already breached overnight, dipping to $72,800, but recovered by morning. If BTC can't reclaim $74,000, the rebound remains weak; a break below last night's low would significantly increase pressure. For $ETH, keep a close eye on $2,000. Don't take on too much leverage—PPI is also due Friday.
Do you think the $73,000 support level will hold? Let's talk in the comments 👇
#BTC #ETH #SOL #BNB #CPI #币安广场
These are solely my personal views and do not constitute investment advice
1️⃣ US CPI rose 0.4% month over month in October, while core CPI rose 0.3%—both above expectations of 0.3% and 0.2%, respectively. Because of last year's government shutdown, year-over-year figures weren't released this time. This is the final CPI report before the December rate decision.
2️⃣ $BTC fell as low as $72,787, briefly dropping below $73,000. It has now recovered to around $73,500, down about 2.2% over 24 hours. $ETH came close to $2,000 overnight and is now around $2,048, down about 3.7%.
3️⃣ More than $650 million in positions were liquidated across the crypto market over the past 24 hours, with longs accounting for over $530 million. The Fear & Greed Index dropped from 32 to 26, remaining in the fear zone.
4️⃣ Altcoins fell harder: $SOL and $XRP were both down more than 4%; $BNB held up relatively well, down about 1.6%.
5️⃣ Rate hike expectations have been repriced: a December hike is now almost a foregone conclusion, and the core figures also hit the threshold Waller previously cited as potentially warranting a 50-basis-point hike.
📌 My take: In the short term, watch the $73,000 support level. It was already breached overnight, dipping to $72,800, but recovered by morning. If BTC can't reclaim $74,000, the rebound remains weak; a break below last night's low would significantly increase pressure. For $ETH, keep a close eye on $2,000. Don't take on too much leverage—PPI is also due Friday.
Do you think the $73,000 support level will hold? Let's talk in the comments 👇
#BTC #ETH #SOL #BNB #CPI #币安广场
These are solely my personal views and do not constitute investment advice
368
·
--
#币安神算子 Predict and split the rewards—earn more together
#币安神算子 Predict and split the rewards—earn more together

From Binance Pick
Log in to explore more content
Join global crypto users on Binance Square
⚡️ Get latest and useful information about crypto.
💬 Trusted by the world’s largest crypto exchange.
👍 Discover real insights from verified creators.
Email / Phone number
Trending Topics
HuangRisksOusterOverReportedAffairWithSubordinate
44,711 views
674 Discussing
Nvidia Board Meets to Decide Jensen Huang's Future as Crisis Deepens
Binance News
·37 Likes
·40.9k views
AnthropicRejectsIPODelayValuationinQuestion
495,592 views
4,097 Discussing
CoreWeaveJumps10%On168%RevenueGrowth
78,958 views
993 Discussing