
DreamWorld
6.7k Posts

DreamWorld
 Square Verified+
Report
Block User

#BinanceTurns7

#BinanceTurns7 task 2

BNB Holder
High-Frequency Trader
4.9 Years
100K Following
46.0K+ Followers
21.1K+ Liked
2 Badges
Posts
All
Quotes
Videos
Live
PINNED
·
--
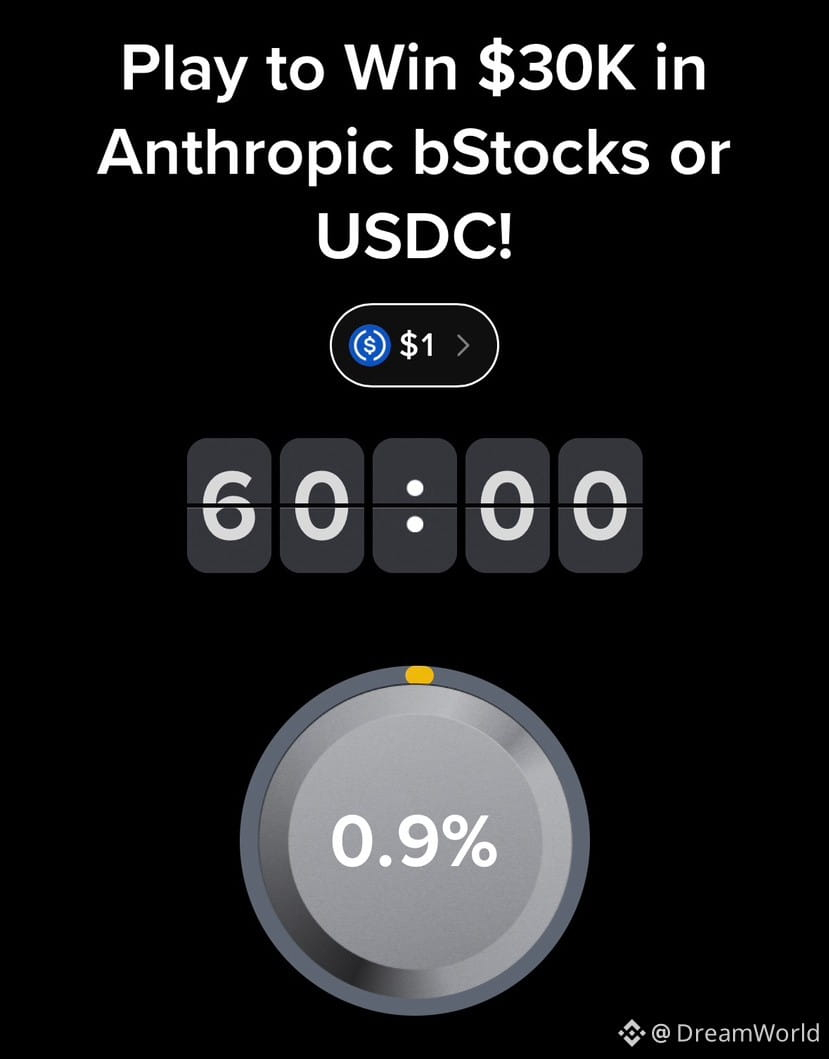
🚨 Binance is giving away $30,000 in $ANTHROPIC or USD! Join the Button Game, keep an eye on the timer, and try your luck to win the grand prize!
🔗 [HERE](https://www.binance.com/game/button/AnthropicButtonGame?ref=GRO_100038835_N9NQO®isterChannel=GRO-BTN-AnthropicButtonGame&utm_source=share)
{future}(ANTHROPICUSDT)
🚨 Binance is giving away $30,000 in $ANTHROPIC or USD! Join the Button Game, keep an eye on the timer, and try your luck to win the grand prize!
🔗 HERE
🔗 HERE
1
4
231
·
--
Verified
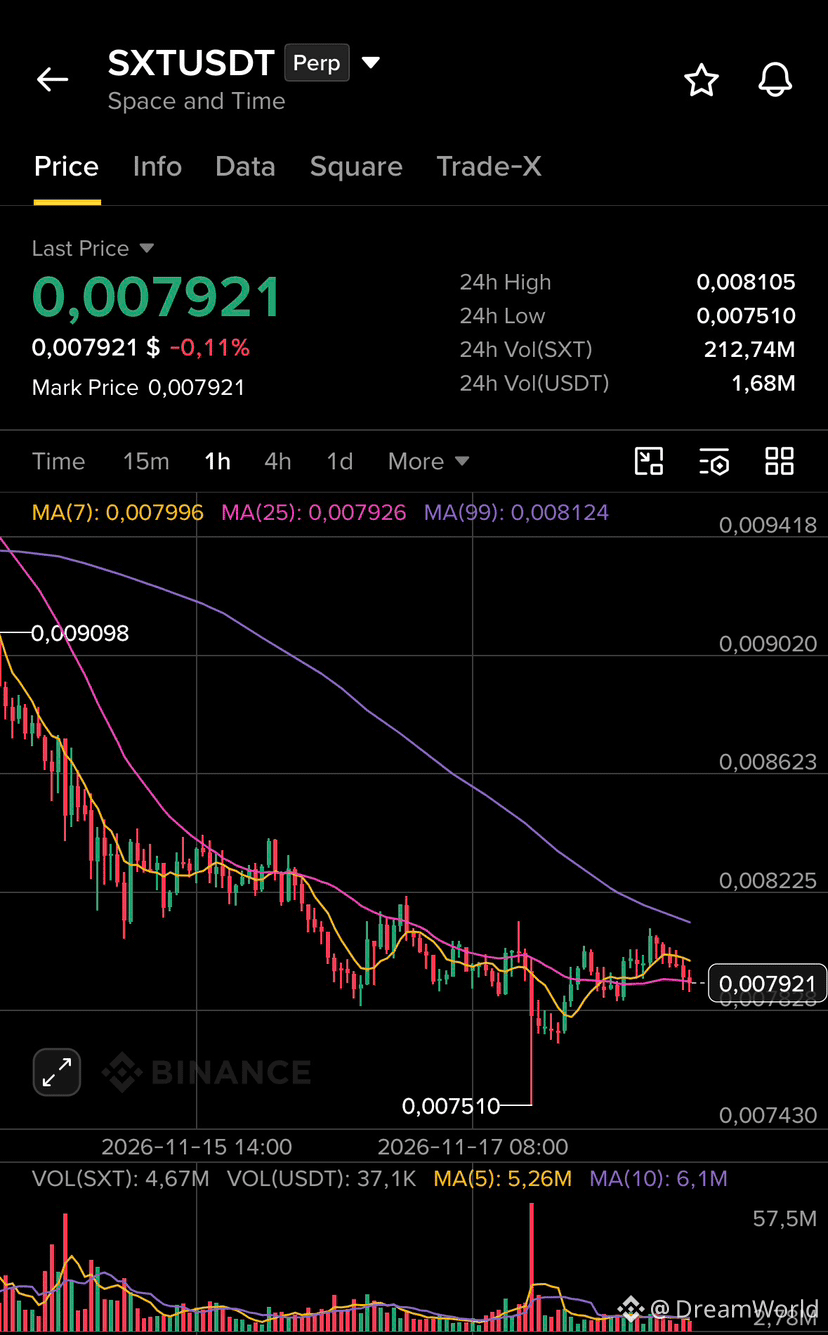
The next big breakthrough in Web3 won’t just be about faster transactions. It will be about TRUST in data. 🌐
AI, DeFi, and tokenization are growing rapidly, but there is one fundamental challenge: how can applications prove that the data they rely on is accurate?
This is exactly where @SpaceandTimeDB comes into the picture.
Space and Time is building infrastructure that makes data verifiable, allowing smart contracts and AI systems to work with information that can be cryptographically proven.
Think about the possibilities:
🔹 AI powered by verifiable data.
🔹 DeFi protocols with greater transparency.
🔹 Tokenized assets backed by trustworthy information.
I believe verifiable data will become one of the most important foundations of the next generation of Web3.
It’s not just about accessing data anymore. It’s about proving that the data is real.
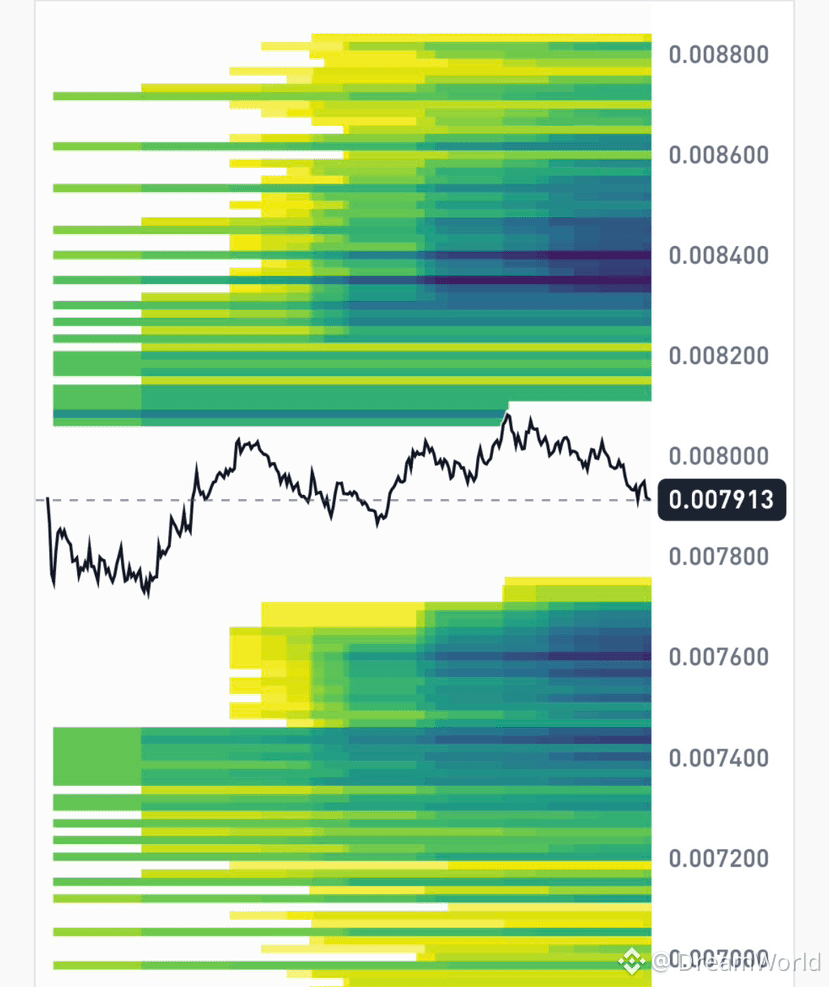
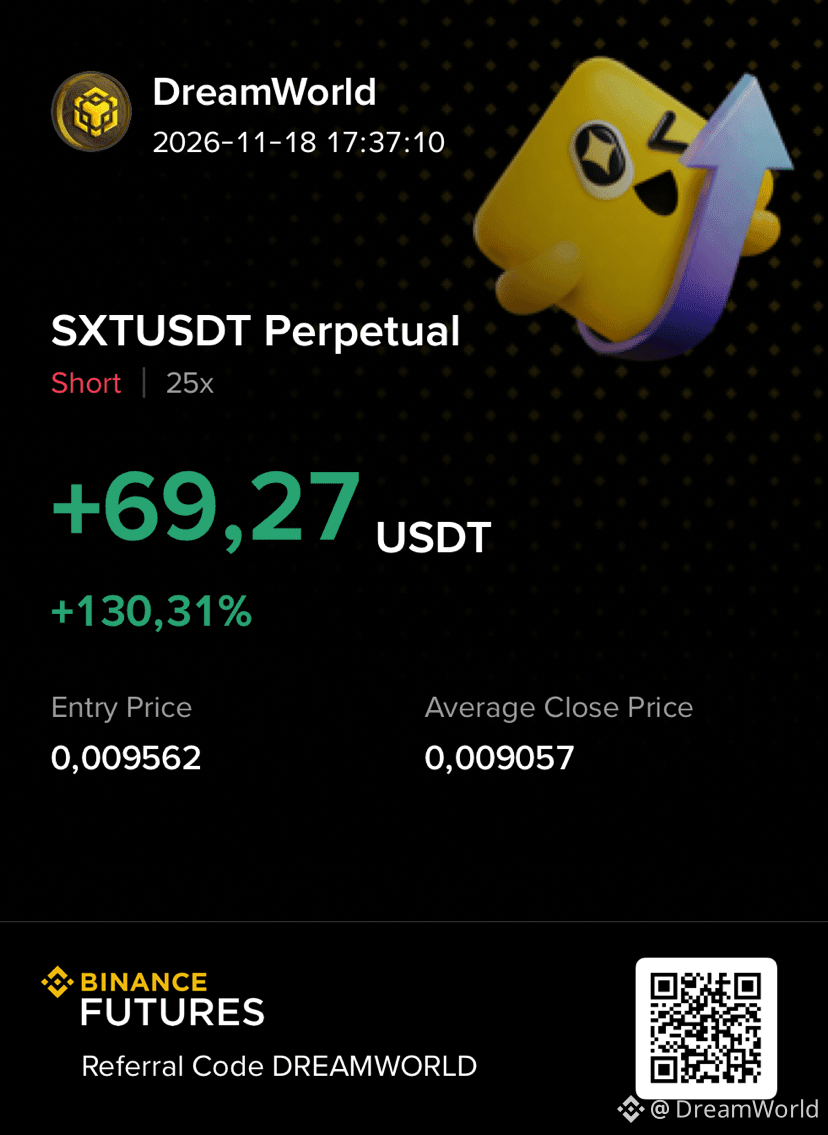
That’s why I’m keeping an eye on $SXT .
#sxt $SXT @SpaceandTime
The next big breakthrough in Web3 won’t just be about faster transactions. It will be about TRUST in data. 🌐
AI, DeFi, and tokenization are growing rapidly, but there is one fundamental challenge: how can applications prove that the data they rely on is accurate?
This is exactly where @SpaceandTime comes into the picture.
Space and Time is building infrastructure that makes data verifiable, allowing smart contracts and AI systems to work with information that can be cryptographically proven.
Think about the possibilities:
🔹 AI powered by verifiable data.
🔹 DeFi protocols with greater transparency.
🔹 Tokenized assets backed by trustworthy information.
I believe verifiable data will become one of the most important foundations of the next generation of Web3.
It’s not just about accessing data anymore. It’s about proving that the data is real.
That’s why I’m keeping an eye on $SXT .
#sxt $SXT @SpaceandTime
AI, DeFi, and tokenization are growing rapidly, but there is one fundamental challenge: how can applications prove that the data they rely on is accurate?
This is exactly where @SpaceandTime comes into the picture.
Space and Time is building infrastructure that makes data verifiable, allowing smart contracts and AI systems to work with information that can be cryptographically proven.
Think about the possibilities:
🔹 AI powered by verifiable data.
🔹 DeFi protocols with greater transparency.
🔹 Tokenized assets backed by trustworthy information.
I believe verifiable data will become one of the most important foundations of the next generation of Web3.
It’s not just about accessing data anymore. It’s about proving that the data is real.
That’s why I’m keeping an eye on $SXT .
#sxt $SXT @SpaceandTime
2
1.1k
·
--
Bullish
Buy $DASH for $5 and forget about it for a while
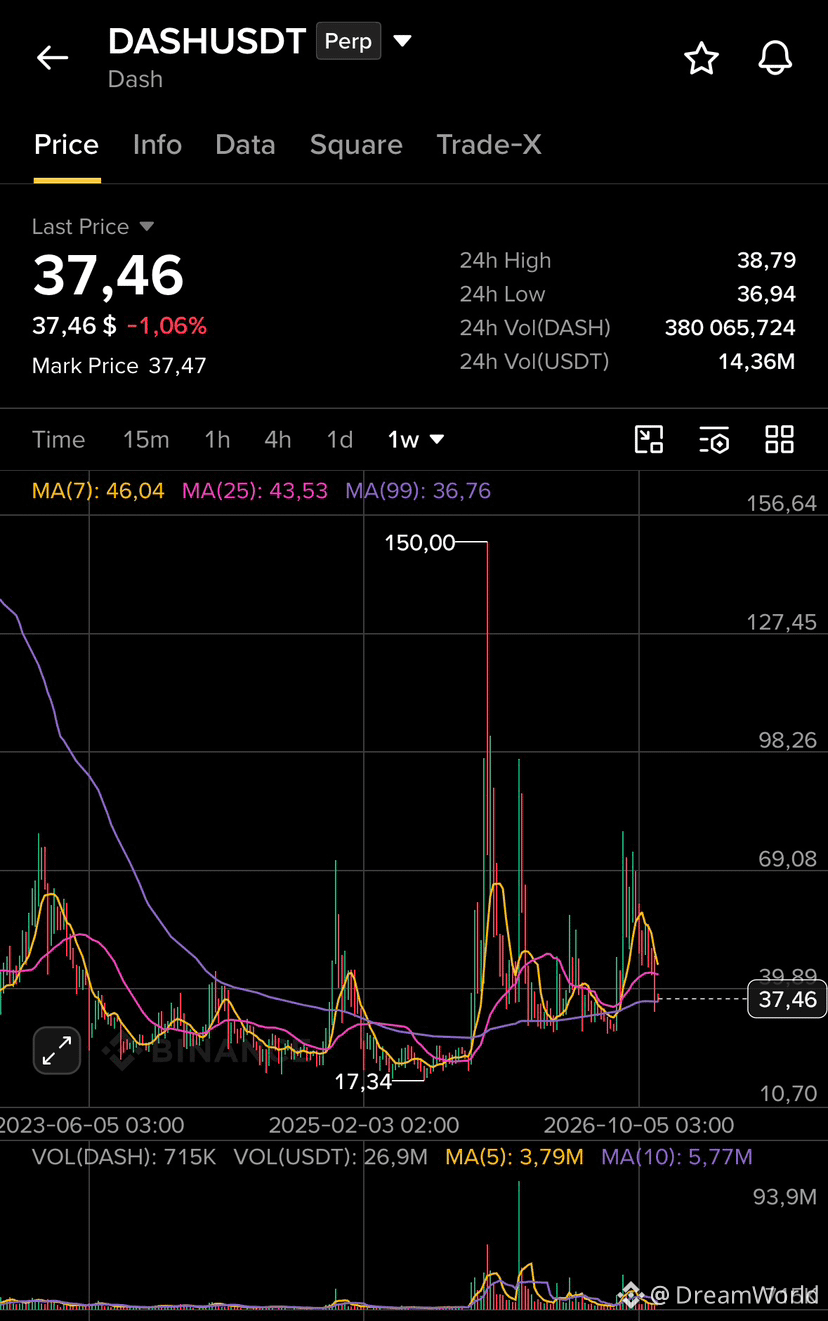
$DASH has been around since 2014; it’s one of the oldest payment projects. Its supply is limited: a maximum of around 18.9 million coins, with no more to be issued. From its peak of $150, the price has fallen to $37—a 75% drop.
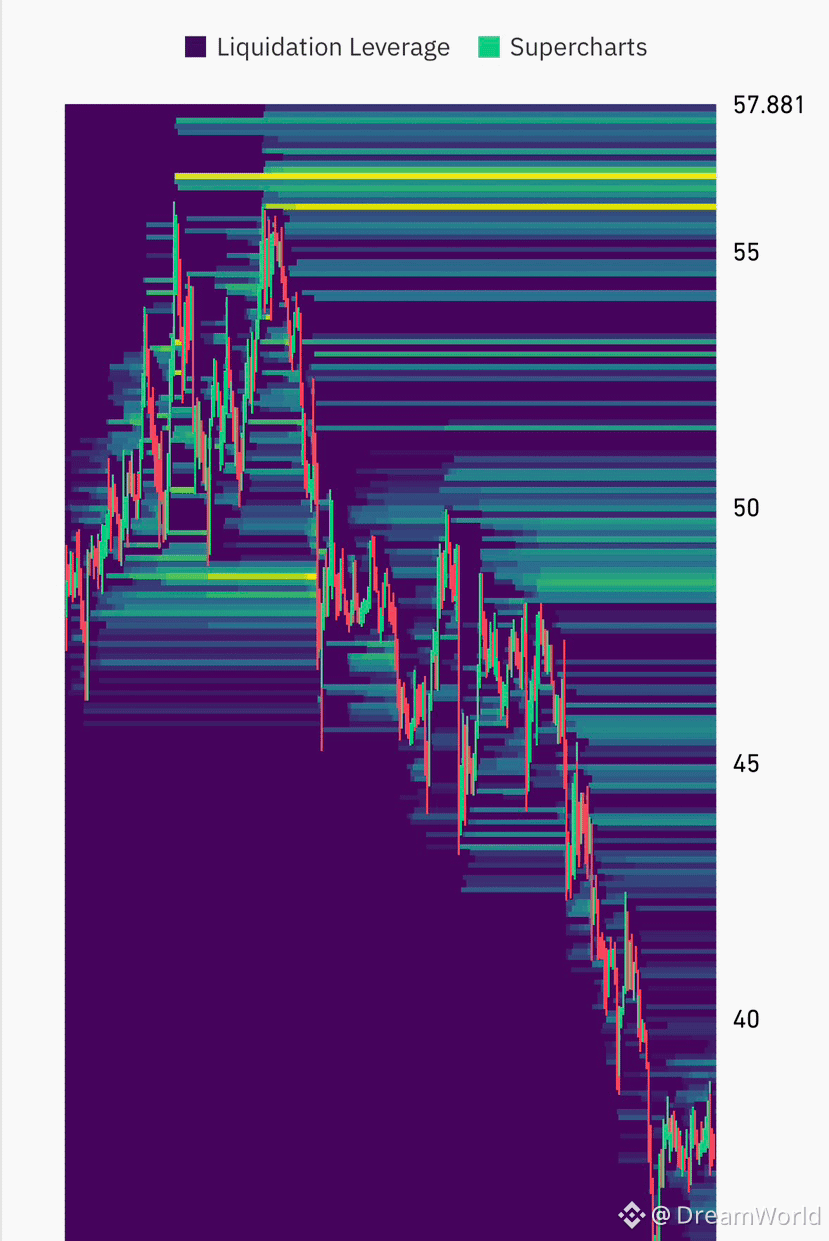
After such a sell-off, $5 is a small bet on a possible bounce. The nearest area of interest on the liquidation map is around $48, followed by $55.
Only invest an amount you can afford to lose. This is not financial advice; do your own research.
#DASH #Crypto
Buy $DASH for $5 and forget about it for a while
$DASH has been around since 2014; it’s one of the oldest payment projects. Its supply is limited: a maximum of around 18.9 million coins, with no more to be issued. From its peak of $150, the price has fallen to $37—a 75% drop.
After such a sell-off, $5 is a small bet on a possible bounce. The nearest area of interest on the liquidation map is around $48, followed by $55.
Only invest an amount you can afford to lose. This is not financial advice; do your own research.
#DASH #Crypto
$DASH has been around since 2014; it’s one of the oldest payment projects. Its supply is limited: a maximum of around 18.9 million coins, with no more to be issued. From its peak of $150, the price has fallen to $37—a 75% drop.
After such a sell-off, $5 is a small bet on a possible bounce. The nearest area of interest on the liquidation map is around $48, followed by $55.
Only invest an amount you can afford to lose. This is not financial advice; do your own research.
#DASH #Crypto
1
4
2.9k
·
--
Bullish
Buy $RVN for $5 and forget about it for a while 🔥
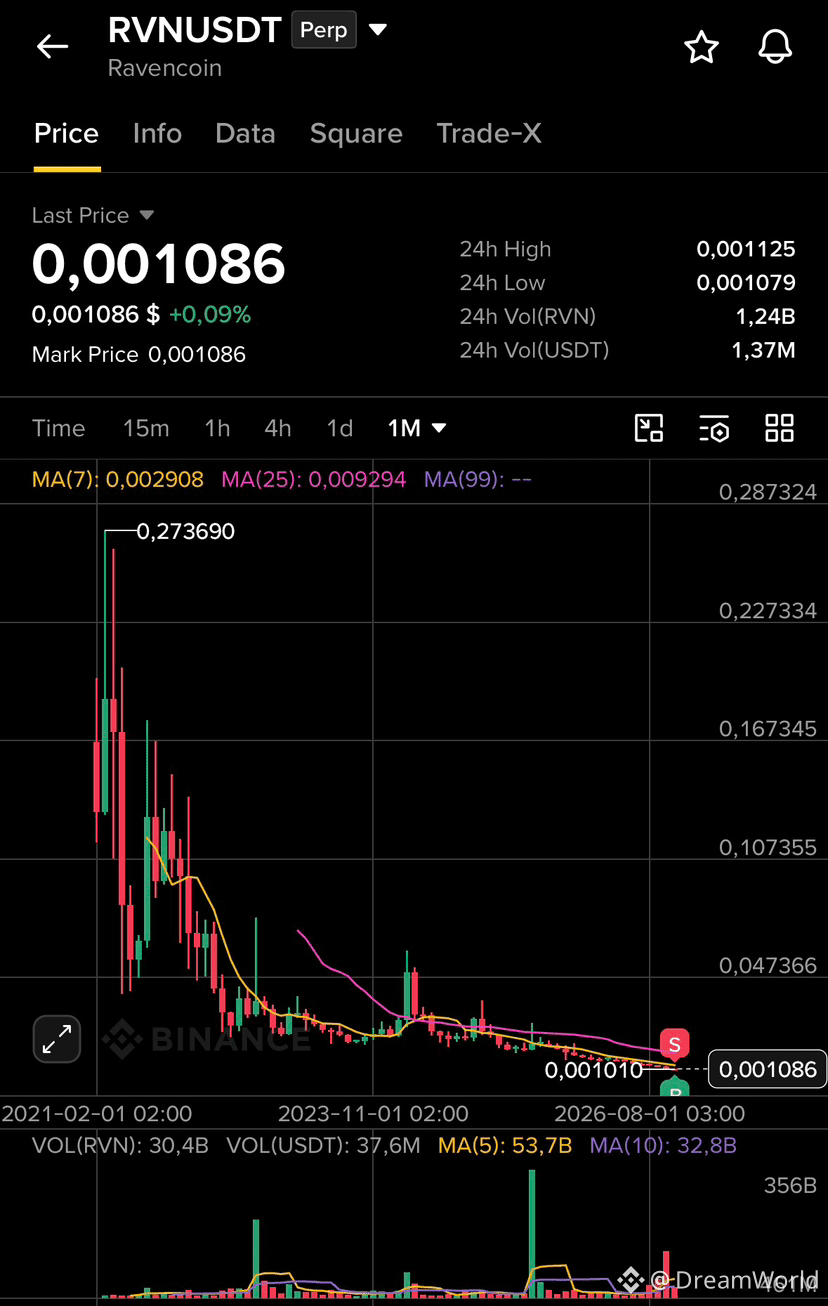
Ravencoin has been around since 2018, and its supply is strictly limited: 21 billion coins, with no more to be created. From its peak of $0.27, the price fell to $0.0010—a drop of 99%.
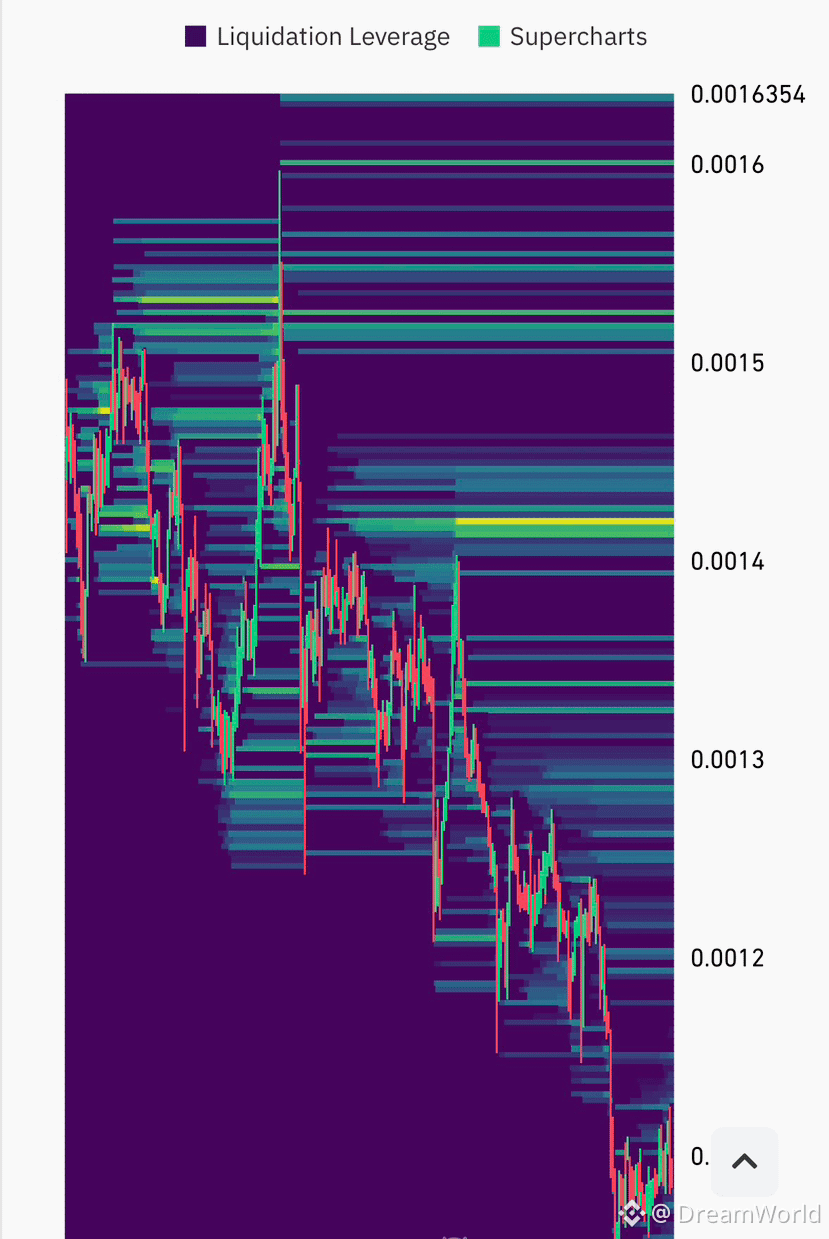
After a plunge like that, $5 is a small bet on a possible rebound. The nearest area of interest on the liquidation map is around $0.0014.
Only invest an amount you can afford to lose. This is not financial advice; do your own research.
#rvn #Ravencoin
Buy $RVN for $5 and forget about it for a while 🔥
Ravencoin has been around since 2018, and its supply is strictly limited: 21 billion coins, with no more to be created. From its peak of $0.27, the price fell to $0.0010—a drop of 99%.
After a plunge like that, $5 is a small bet on a possible rebound. The nearest area of interest on the liquidation map is around $0.0014.
Only invest an amount you can afford to lose. This is not financial advice; do your own research.
#rvn #Ravencoin
Ravencoin has been around since 2018, and its supply is strictly limited: 21 billion coins, with no more to be created. From its peak of $0.27, the price fell to $0.0010—a drop of 99%.
After a plunge like that, $5 is a small bet on a possible rebound. The nearest area of interest on the liquidation map is around $0.0014.
Only invest an amount you can afford to lose. This is not financial advice; do your own research.
#rvn #Ravencoin
1
4
454
·
--
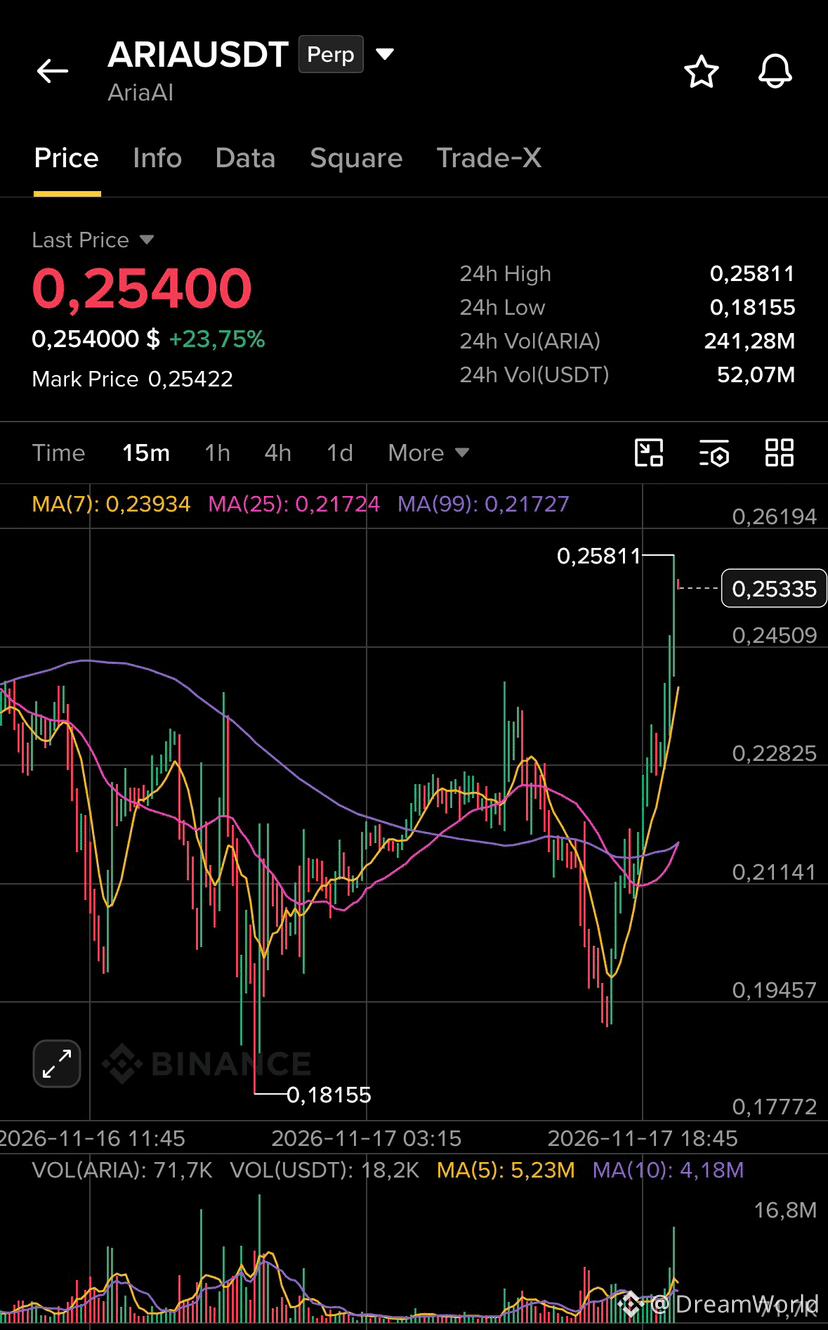
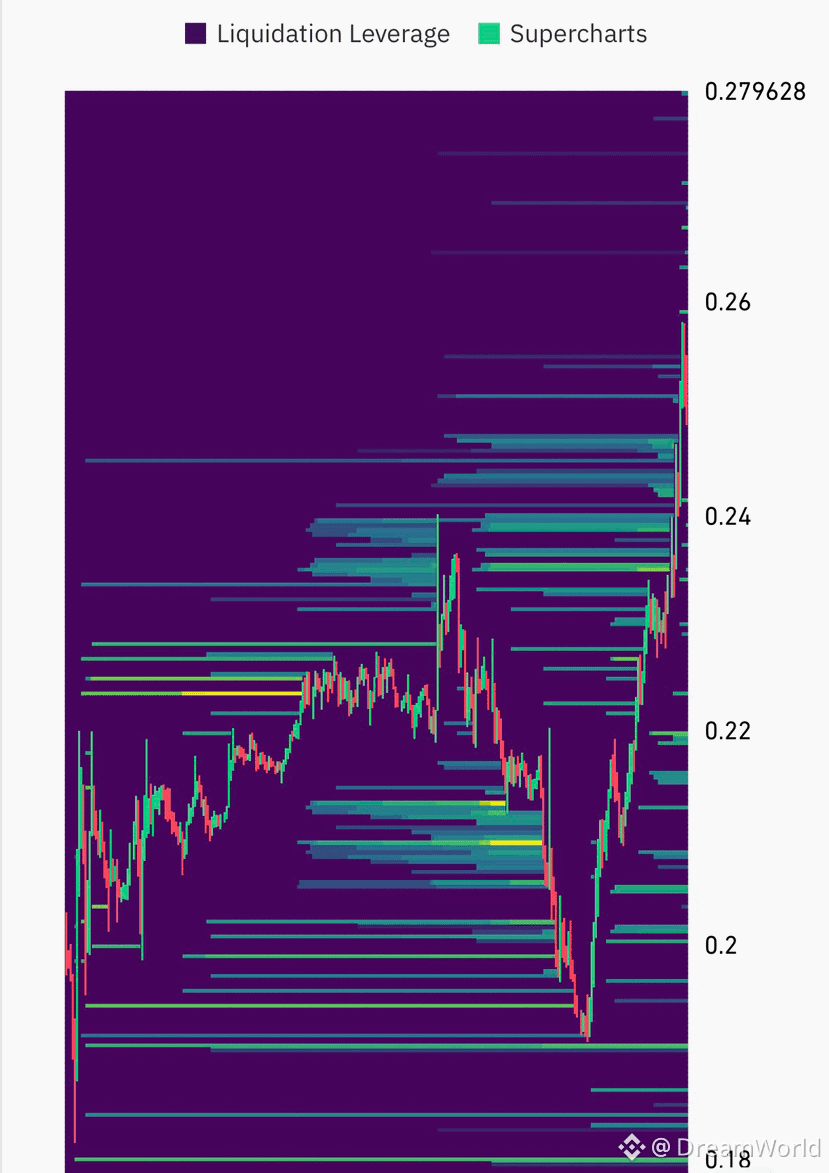
$ARIA : +23% move and what the liquidation map shows
Over the past 24 hours, the price moved from 0.18155 to 0.25811 and is currently trading near 0.254. The momentum on the 15-minute chart is confirmed by rising volume: the latest candle has the highest volume of the entire period shown on the chart.
What the technical picture shows:
1. The price moved above MA(7) at 0.239, and is also well above MA(25) at 0.217 and MA(99) at 0.217. The moving averages converged in one zone, and the price sharply broke away to the upside.
2. The liquidation map showed dense clusters of positions in the 0.235–0.245 range. The price moved through them, so a significant number of short positions were liquidated, adding fuel to the move.
3. Only thin clusters remain above the price (0.255–0.26 and higher), meaning there is less liquidity-based resistance there, but the momentum itself is already stretched.
4. Large clusters are visible below, in the 0.205–0.215 zone and near 0.19. After such a vertical move, the market often retraces to seek liquidity.
Scenarios:
Bullish: holding 0.24–0.245 as support and retesting the 0.258 high, followed by a move higher.
Correction: settling below 0.24 opens the way for a pullback to 0.228 and then to the MA zone near 0.217.
After a +23% daily move, chasing the price is risky. It’s better to wait for a pullback and confirmation of the level, avoid entering on emotion, and always set a stop.
$ARIA : +23% move and what the liquidation map shows
Over the past 24 hours, the price moved from 0.18155 to 0.25811 and is currently trading near 0.254. The momentum on the 15-minute chart is confirmed by rising volume: the latest candle has the highest volume of the entire period shown on the chart.
What the technical picture shows:
1. The price moved above MA(7) at 0.239, and is also well above MA(25) at 0.217 and MA(99) at 0.217. The moving averages converged in one zone, and the price sharply broke away to the upside.
2. The liquidation map showed dense clusters of positions in the 0.235–0.245 range. The price moved through them, so a significant number of short positions were liquidated, adding fuel to the move.
3. Only thin clusters remain above the price (0.255–0.26 and higher), meaning there is less liquidity-based resistance there, but the momentum itself is already stretched.
4. Large clusters are visible below, in the 0.205–0.215 zone and near 0.19. After such a vertical move, the market often retraces to seek liquidity.
Scenarios:
Bullish: holding 0.24–0.245 as support and retesting the 0.258 high, followed by a move higher.
Correction: settling below 0.24 opens the way for a pullback to 0.228 and then to the MA zone near 0.217.
After a +23% daily move, chasing the price is risky. It’s better to wait for a pullback and confirmation of the level, avoid entering on emotion, and always set a stop.
Over the past 24 hours, the price moved from 0.18155 to 0.25811 and is currently trading near 0.254. The momentum on the 15-minute chart is confirmed by rising volume: the latest candle has the highest volume of the entire period shown on the chart.
What the technical picture shows:
1. The price moved above MA(7) at 0.239, and is also well above MA(25) at 0.217 and MA(99) at 0.217. The moving averages converged in one zone, and the price sharply broke away to the upside.
2. The liquidation map showed dense clusters of positions in the 0.235–0.245 range. The price moved through them, so a significant number of short positions were liquidated, adding fuel to the move.
3. Only thin clusters remain above the price (0.255–0.26 and higher), meaning there is less liquidity-based resistance there, but the momentum itself is already stretched.
4. Large clusters are visible below, in the 0.205–0.215 zone and near 0.19. After such a vertical move, the market often retraces to seek liquidity.
Scenarios:
Bullish: holding 0.24–0.245 as support and retesting the 0.258 high, followed by a move higher.
Correction: settling below 0.24 opens the way for a pullback to 0.228 and then to the MA zone near 0.217.
After a +23% daily move, chasing the price is risky. It’s better to wait for a pullback and confirmation of the level, avoid entering on emotion, and always set a stop.
5
680
·
--
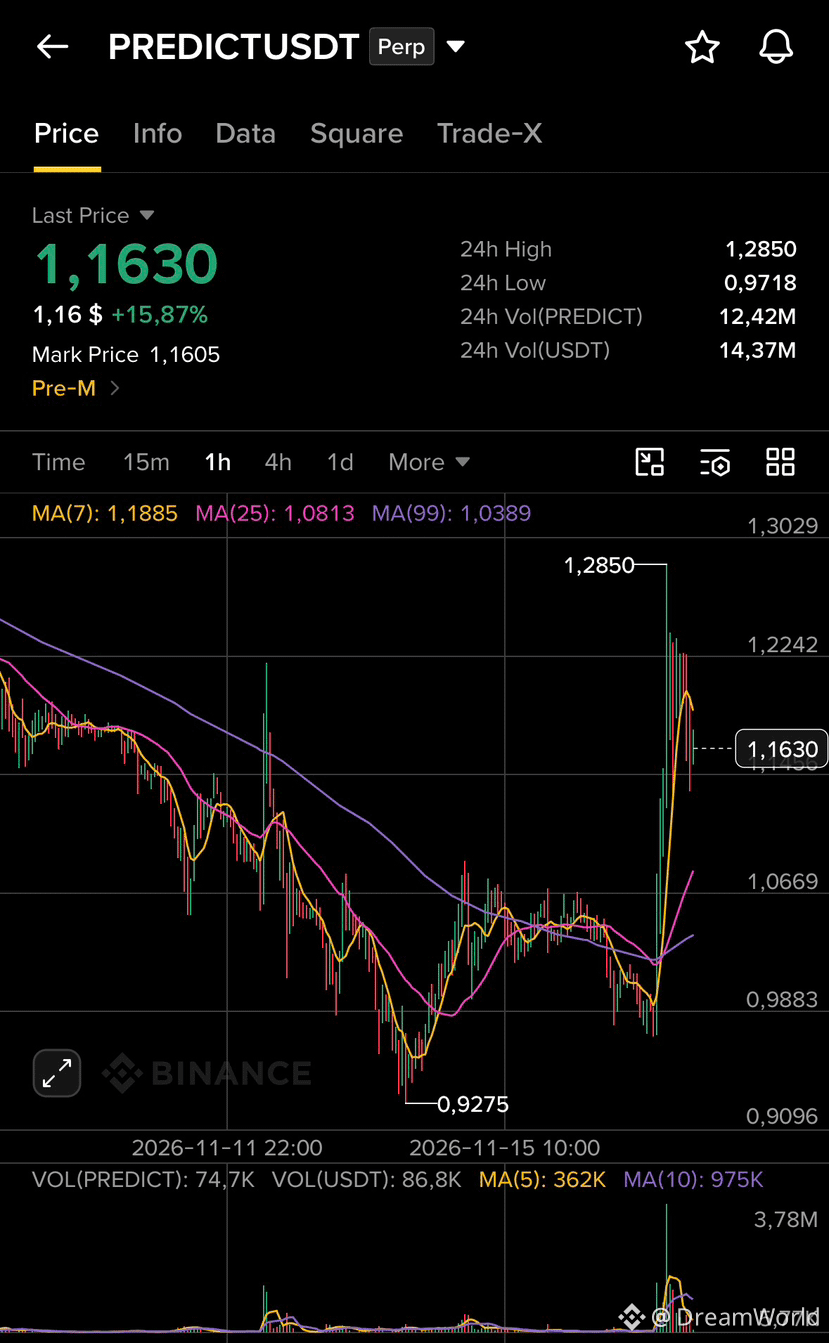
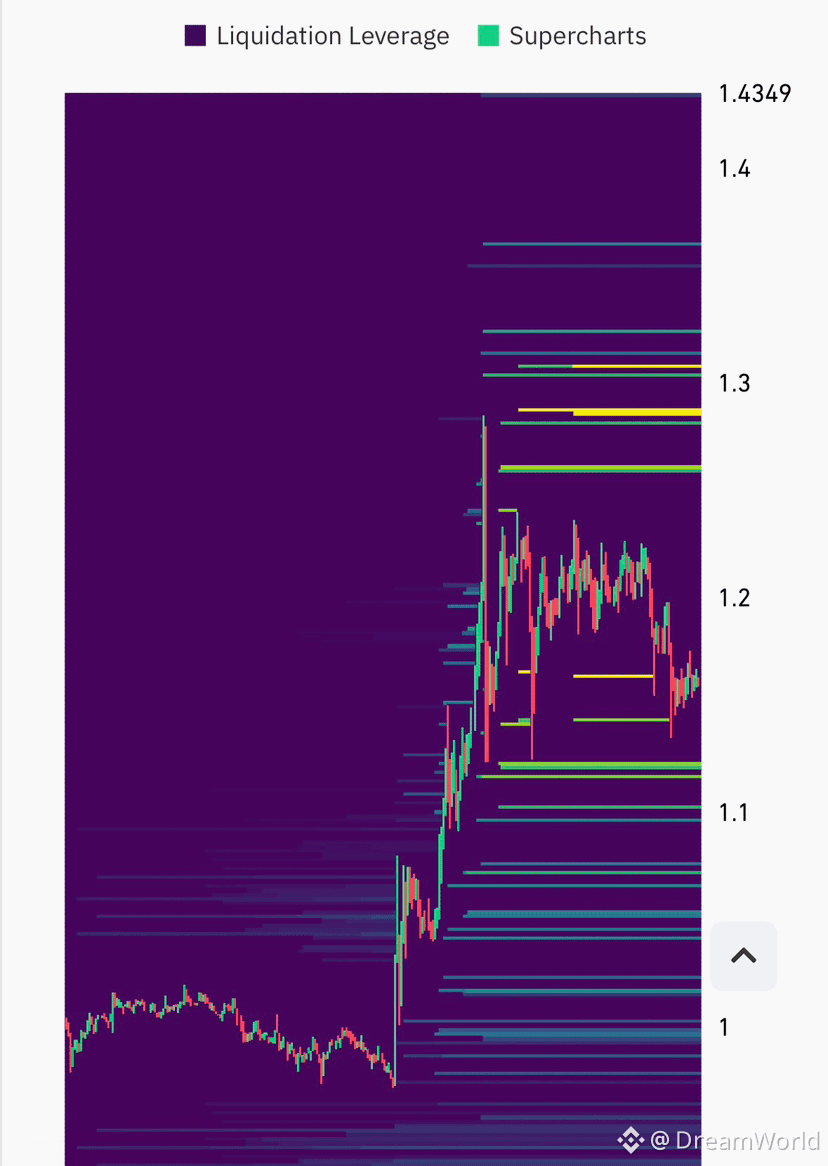
🚀 $PREDICT +15.87% per day
After a long decline below MA99, the price reversed and on 1H, with a sharp candle, shot up from 0.97 to a peak of 1.2850. Then a pullback followed, and now it is trading near 1.1630, which is about 9% below the maximum. 24-hour volume: 14.37M USDT, with the main spike occurring on the impulse candle.
Technical picture: the price is holding above MA25 (1.0813) and MA99 (1.0389), but below MA7 (1.1885), so in the short term buyers have not yet regained control. The Pre-M label indicates that this is a pre-market contract, and such assets usually have increased volatility.
Liquidation map: above the price, thin but distinct liquidity lines are visible in the 1.26–1.30 zone, where the peak extended. Below, around 1.12 and 1.05–1.10, there are a few more leverage zones that the price may test during a pullback.
Levels:
Support: 1.0813 (MA25), then 1.0389 (MA99)
Resistance: 1.1885 (MA7), then 1.2850
A hold above MA7 will return the initiative to the bulls. Losing 1.08 will mean a full retracement of the impulse. Use stop losses and low leverage; in Pre-M, the price can move sharply.
Not financial advice. DYOR.
#PREDICT
{future}(PREDICTUSDT)
🚀 $PREDICT +15.87% per day
After a long decline below MA99, the price reversed and on 1H, with a sharp candle, shot up from 0.97 to a peak of 1.2850. Then a pullback followed, and now it is trading near 1.1630, which is about 9% below the maximum. 24-hour volume: 14.37M USDT, with the main spike occurring on the impulse candle.
Technical picture: the price is holding above MA25 (1.0813) and MA99 (1.0389), but below MA7 (1.1885), so in the short term buyers have not yet regained control. The Pre-M label indicates that this is a pre-market contract, and such assets usually have increased volatility.
Liquidation map: above the price, thin but distinct liquidity lines are visible in the 1.26–1.30 zone, where the peak extended. Below, around 1.12 and 1.05–1.10, there are a few more leverage zones that the price may test during a pullback.
Levels:
Support: 1.0813 (MA25), then 1.0389 (MA99)
Resistance: 1.1885 (MA7), then 1.2850
A hold above MA7 will return the initiative to the bulls. Losing 1.08 will mean a full retracement of the impulse. Use stop losses and low leverage; in Pre-M, the price can move sharply.
Not financial advice. DYOR.
#PREDICT
After a long decline below MA99, the price reversed and on 1H, with a sharp candle, shot up from 0.97 to a peak of 1.2850. Then a pullback followed, and now it is trading near 1.1630, which is about 9% below the maximum. 24-hour volume: 14.37M USDT, with the main spike occurring on the impulse candle.
Technical picture: the price is holding above MA25 (1.0813) and MA99 (1.0389), but below MA7 (1.1885), so in the short term buyers have not yet regained control. The Pre-M label indicates that this is a pre-market contract, and such assets usually have increased volatility.
Liquidation map: above the price, thin but distinct liquidity lines are visible in the 1.26–1.30 zone, where the peak extended. Below, around 1.12 and 1.05–1.10, there are a few more leverage zones that the price may test during a pullback.
Levels:
Support: 1.0813 (MA25), then 1.0389 (MA99)
Resistance: 1.1885 (MA7), then 1.2850
A hold above MA7 will return the initiative to the bulls. Losing 1.08 will mean a full retracement of the impulse. Use stop losses and low leverage; in Pre-M, the price can move sharply.
Not financial advice. DYOR.
#PREDICT
1
226
·
--
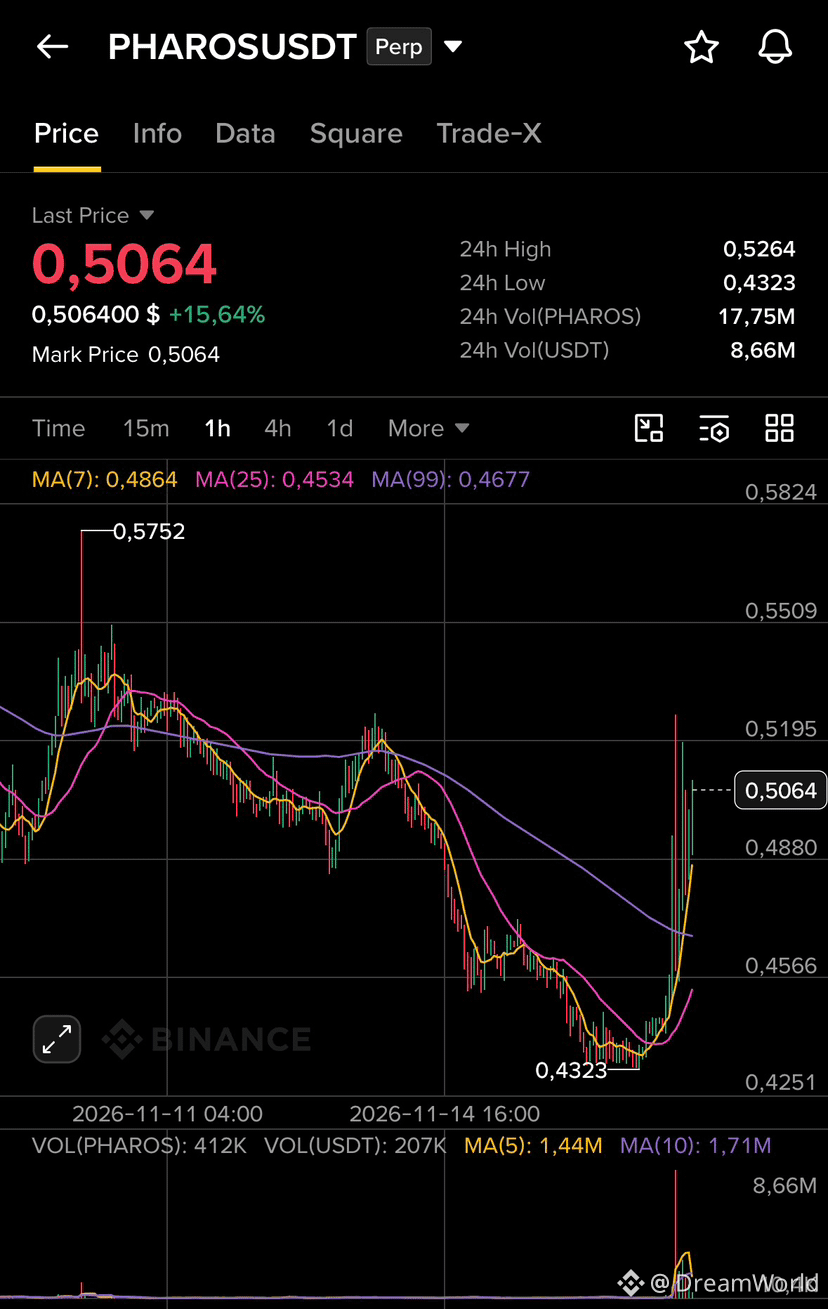
🚀 $PHAROS +15.64% in 24 hours
After a long correction from the peak of 0.5752, the price reached 0.4323, then reversed and, with a sharp impulse on the 1H chart, broke through all three moving averages: MA25 (0.4534), MA99 (0.4677), and MA7 (0.4864). It is now trading around 0.5064, with a 24-hour high of 0.5264. The rebound from the low is about 17%.
24-hour volume: 8.66M USDT. A sharp spike is visible on the impulse candle, confirming buyer interest.
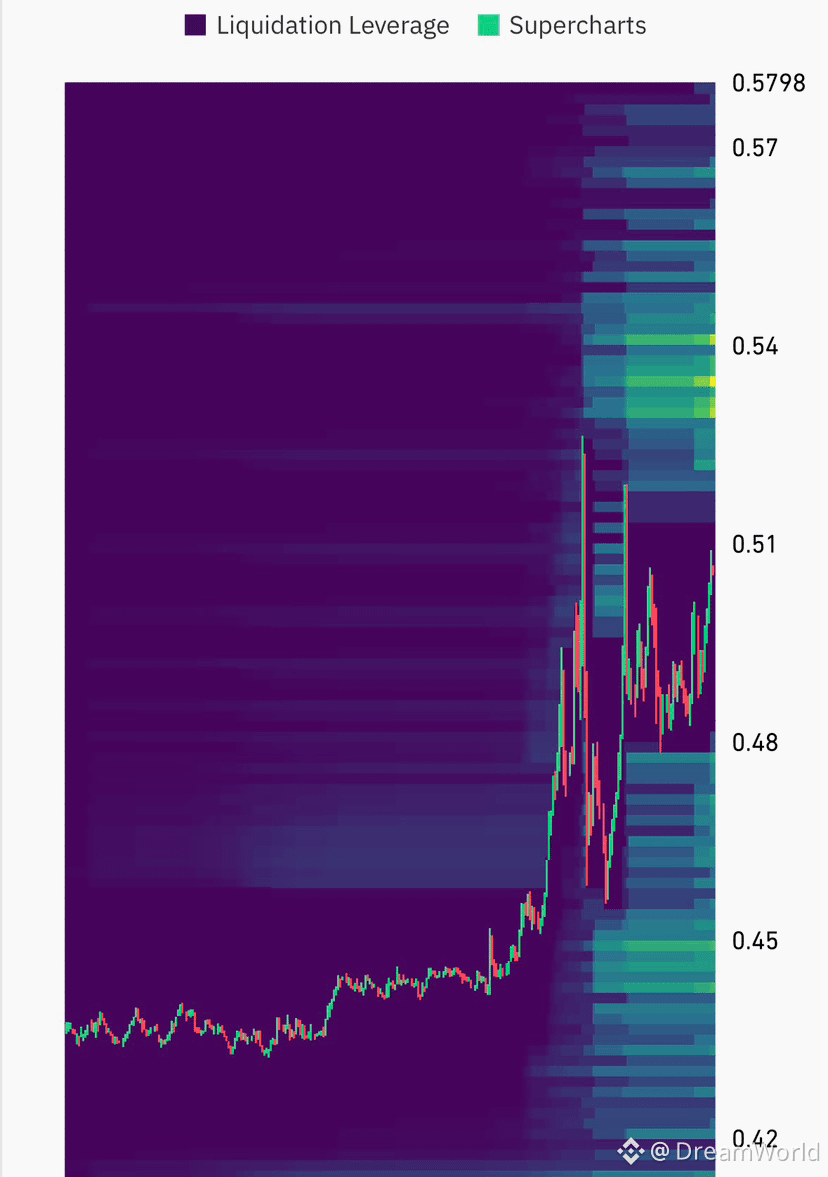
Liquidation map: the densest leverage clusters are above, in the 0.53–0.54 zone, where the price could be drawn if the rally continues. Below, around 0.45 and 0.48, there are also liquidity zones that the price has already cleared during the reversal.
Key levels:
Support: 0.4864 (MA7), then 0.4677 (MA99)
Resistance: 0.5264, then 0.54 and 0.5752
Holding above 0.4864 would preserve the bullish scenario. A move back below MA99 would mean a false breakout. A pullback is possible after a vertical candle, so don't chase the price; use stop-losses and low leverage.
Not financial advice. DYOR.
#Pharos #Crypto
{future}(PHAROSUSDT)
🚀 $PHAROS +15.64% in 24 hours
After a long correction from the peak of 0.5752, the price reached 0.4323, then reversed and, with a sharp impulse on the 1H chart, broke through all three moving averages: MA25 (0.4534), MA99 (0.4677), and MA7 (0.4864). It is now trading around 0.5064, with a 24-hour high of 0.5264. The rebound from the low is about 17%.
24-hour volume: 8.66M USDT. A sharp spike is visible on the impulse candle, confirming buyer interest.
Liquidation map: the densest leverage clusters are above, in the 0.53–0.54 zone, where the price could be drawn if the rally continues. Below, around 0.45 and 0.48, there are also liquidity zones that the price has already cleared during the reversal.
Key levels:
Support: 0.4864 (MA7), then 0.4677 (MA99)
Resistance: 0.5264, then 0.54 and 0.5752
Holding above 0.4864 would preserve the bullish scenario. A move back below MA99 would mean a false breakout. A pullback is possible after a vertical candle, so don't chase the price; use stop-losses and low leverage.
Not financial advice. DYOR.
#Pharos #Crypto
After a long correction from the peak of 0.5752, the price reached 0.4323, then reversed and, with a sharp impulse on the 1H chart, broke through all three moving averages: MA25 (0.4534), MA99 (0.4677), and MA7 (0.4864). It is now trading around 0.5064, with a 24-hour high of 0.5264. The rebound from the low is about 17%.
24-hour volume: 8.66M USDT. A sharp spike is visible on the impulse candle, confirming buyer interest.
Liquidation map: the densest leverage clusters are above, in the 0.53–0.54 zone, where the price could be drawn if the rally continues. Below, around 0.45 and 0.48, there are also liquidity zones that the price has already cleared during the reversal.
Key levels:
Support: 0.4864 (MA7), then 0.4677 (MA99)
Resistance: 0.5264, then 0.54 and 0.5752
Holding above 0.4864 would preserve the bullish scenario. A move back below MA99 would mean a false breakout. A pullback is possible after a vertical candle, so don't chase the price; use stop-losses and low leverage.
Not financial advice. DYOR.
#Pharos #Crypto
1
114
·
--
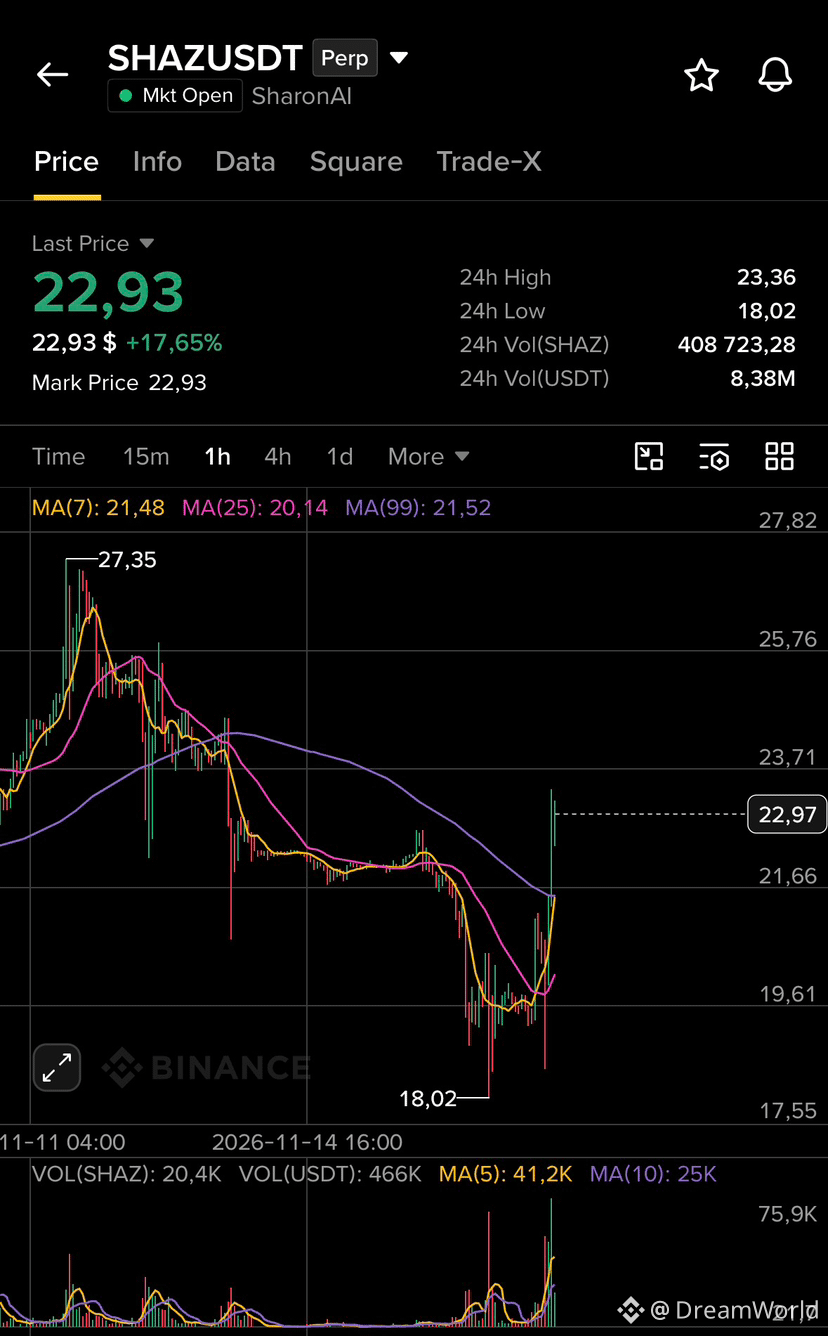
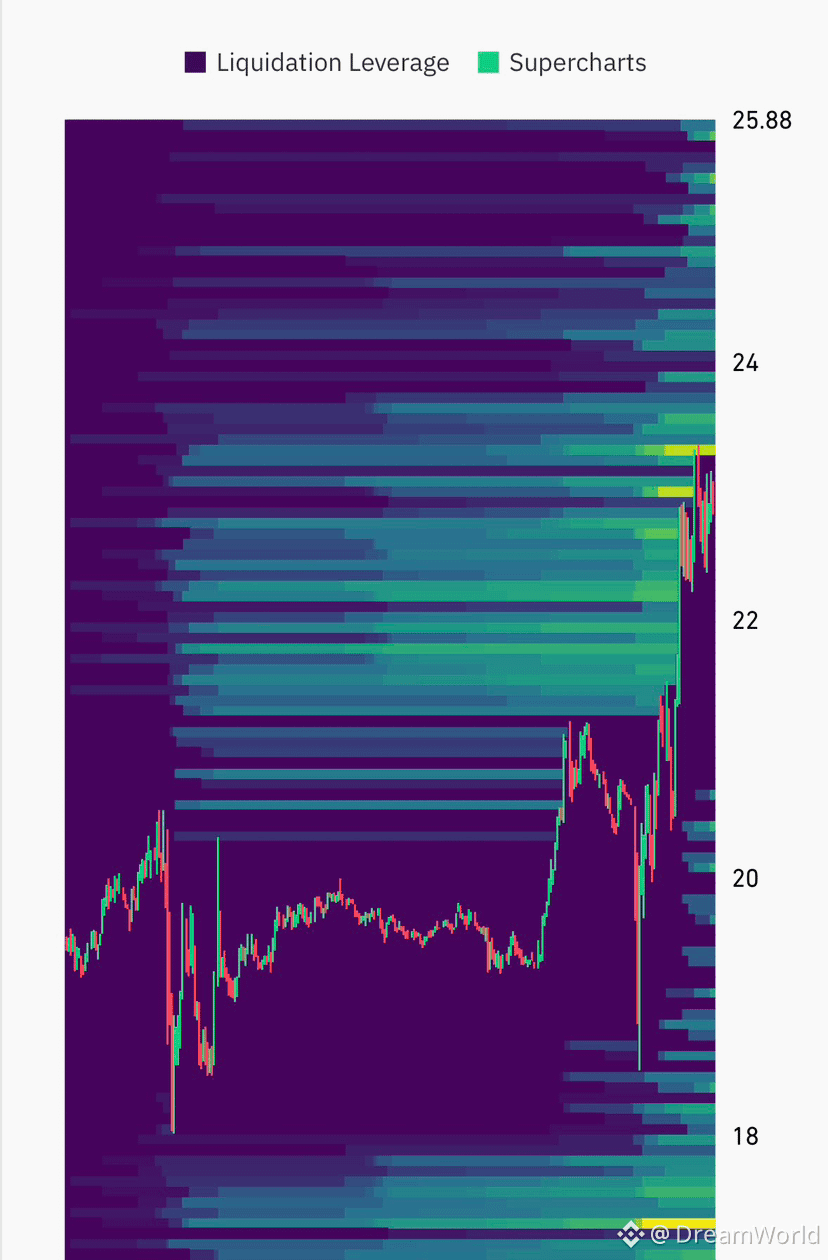
🚀 $SHAZ (SharonAI) +17.65% in 24 hours
After correcting from a peak of 27.35, the price reached 18.02, then reversed and quickly broke through all three moving averages on the 1H chart: MA7 (21.48), MA25 (20.14), and MA99 (21.52). It is currently trading around 22.93, with a 24-hour high of 23.36. The rebound from the low is about 27%.
24-hour volume: 8.38M USDT. Volume increased on the impulse candle, confirming buyer interest.
Key levels:
Support: 21.5 (MA99 and MA7), then 20.14 (MA25)
Resistance: 23.36, then 25.76 and 27.35
Holding above 21.5 would keep the bullish scenario intact. A move back below MA99 would mean the breakout was false. A pullback is possible after a vertical candle—don't chase the price; use stop-losses and low leverage.
Not financial advice. DYOR.
#SHAZ
{future}(SHAZUSDT)
🚀 $SHAZ (SharonAI) +17.65% in 24 hours
After correcting from a peak of 27.35, the price reached 18.02, then reversed and quickly broke through all three moving averages on the 1H chart: MA7 (21.48), MA25 (20.14), and MA99 (21.52). It is currently trading around 22.93, with a 24-hour high of 23.36. The rebound from the low is about 27%.
24-hour volume: 8.38M USDT. Volume increased on the impulse candle, confirming buyer interest.
Key levels:
Support: 21.5 (MA99 and MA7), then 20.14 (MA25)
Resistance: 23.36, then 25.76 and 27.35
Holding above 21.5 would keep the bullish scenario intact. A move back below MA99 would mean the breakout was false. A pullback is possible after a vertical candle—don't chase the price; use stop-losses and low leverage.
Not financial advice. DYOR.
#SHAZ
After correcting from a peak of 27.35, the price reached 18.02, then reversed and quickly broke through all three moving averages on the 1H chart: MA7 (21.48), MA25 (20.14), and MA99 (21.52). It is currently trading around 22.93, with a 24-hour high of 23.36. The rebound from the low is about 27%.
24-hour volume: 8.38M USDT. Volume increased on the impulse candle, confirming buyer interest.
Key levels:
Support: 21.5 (MA99 and MA7), then 20.14 (MA25)
Resistance: 23.36, then 25.76 and 27.35
Holding above 21.5 would keep the bullish scenario intact. A move back below MA99 would mean the breakout was false. A pullback is possible after a vertical candle—don't chase the price; use stop-losses and low leverage.
Not financial advice. DYOR.
#SHAZ
1
106
·
--
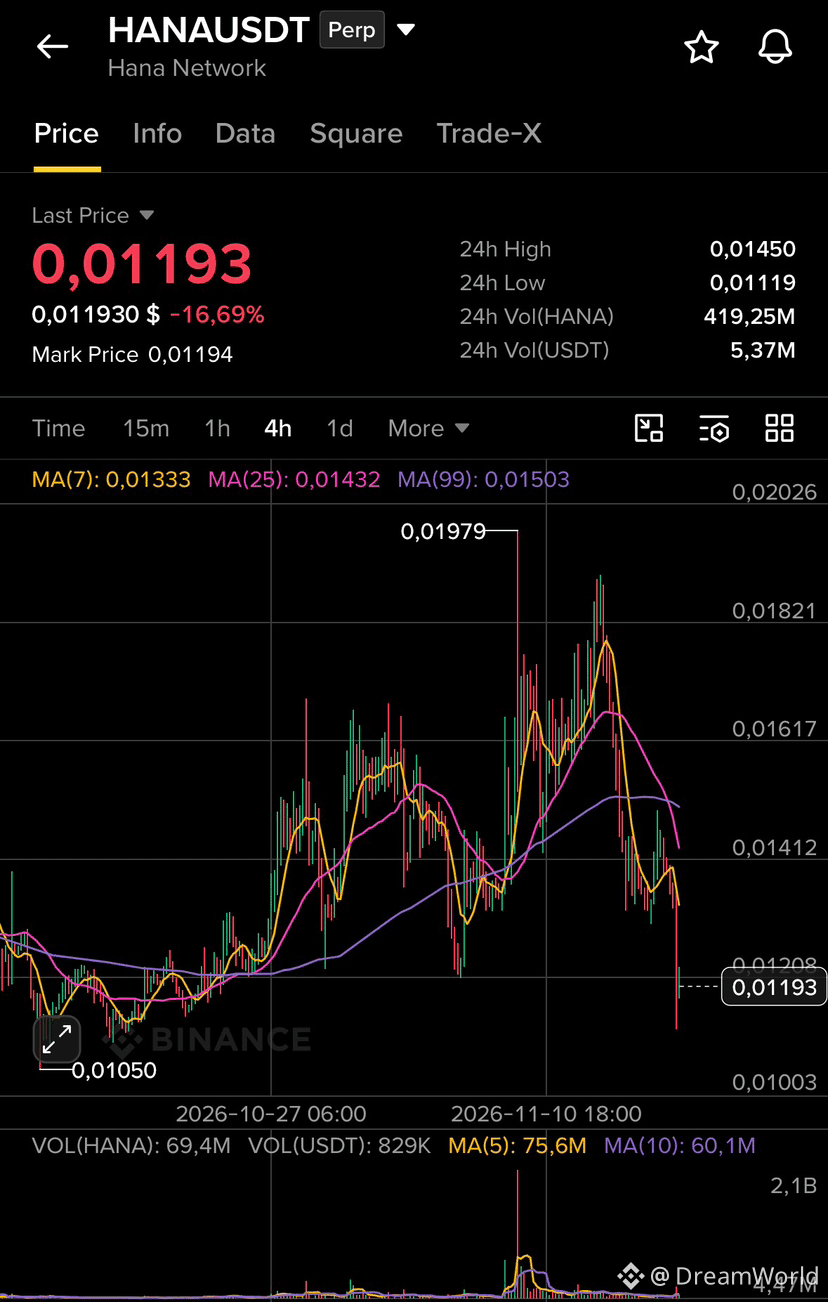
🔻 $HANA (Hana Network) -16.7% in 24 hours
After peaking at 0.01979 on the 4H chart, the price underwent a long correction, then plunged over the past day from 0.0145 to a low of 0.01119. It is now trading around 0.01193, rebounding from the bottom, but the structure remains weak. The price is below all three moving averages: MA7 (0.01333), MA25 (0.01432), and MA99 (0.01503).
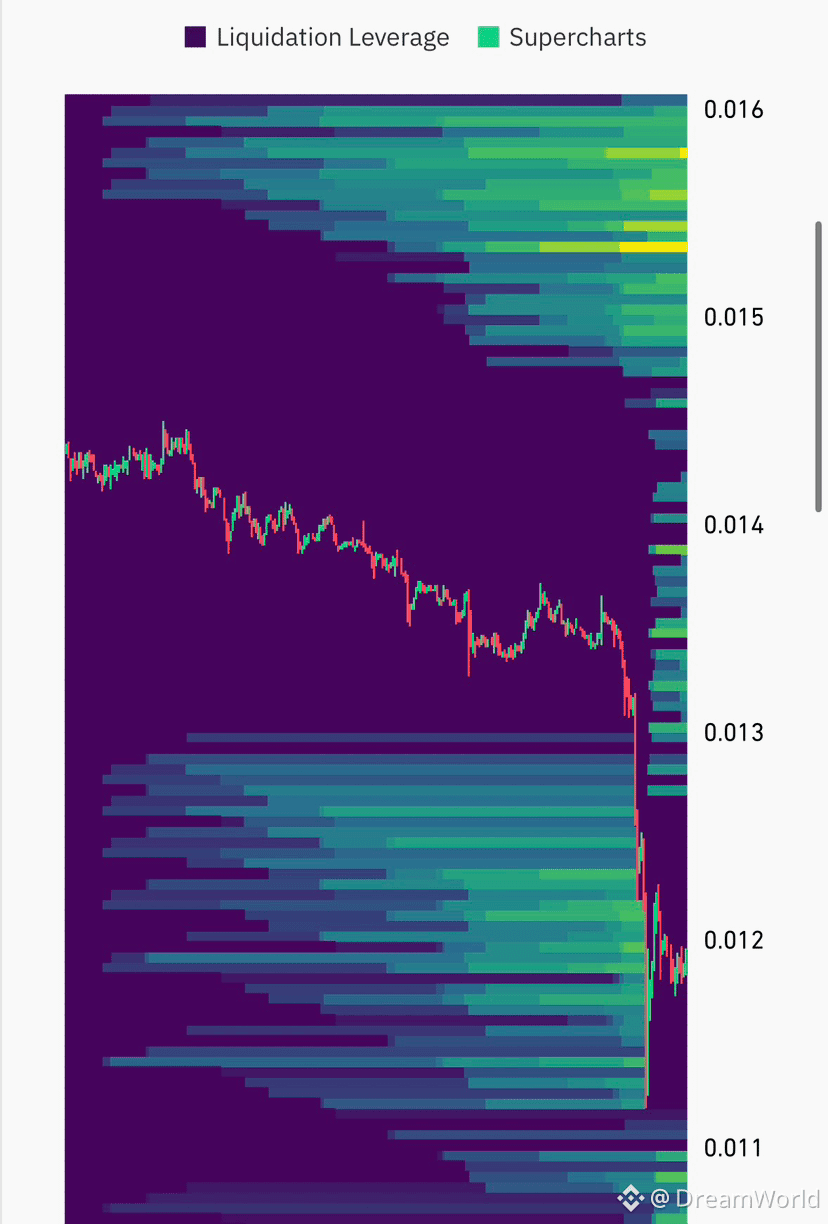
Liquidation map: During the decline, the price passed through a dense leverage zone in the 0.012–0.013 range, where stops and long liquidations were clustered. There is still plenty of liquidity below 0.011, so a retest of the low is possible. Above, a large cluster is visible in the 0.0150–0.0160 zone, which the price could be drawn toward in the event of a strong rebound.
Key levels:
Support: 0.01119, then 0.01050
Resistance: 0.01333 (MA7), then 0.01432 (MA25)
As long as the price remains below MA7, sellers have the advantage. A rebound without volume confirmation may be merely technical. Use stop-losses and low leverage.
Not financial advice. DYOR.
#HANA
{future}(HANAUSDT)
🔻 $HANA (Hana Network) -16.7% in 24 hours
After peaking at 0.01979 on the 4H chart, the price underwent a long correction, then plunged over the past day from 0.0145 to a low of 0.01119. It is now trading around 0.01193, rebounding from the bottom, but the structure remains weak. The price is below all three moving averages: MA7 (0.01333), MA25 (0.01432), and MA99 (0.01503).
Liquidation map: During the decline, the price passed through a dense leverage zone in the 0.012–0.013 range, where stops and long liquidations were clustered. There is still plenty of liquidity below 0.011, so a retest of the low is possible. Above, a large cluster is visible in the 0.0150–0.0160 zone, which the price could be drawn toward in the event of a strong rebound.
Key levels:
Support: 0.01119, then 0.01050
Resistance: 0.01333 (MA7), then 0.01432 (MA25)
As long as the price remains below MA7, sellers have the advantage. A rebound without volume confirmation may be merely technical. Use stop-losses and low leverage.
Not financial advice. DYOR.
#HANA
After peaking at 0.01979 on the 4H chart, the price underwent a long correction, then plunged over the past day from 0.0145 to a low of 0.01119. It is now trading around 0.01193, rebounding from the bottom, but the structure remains weak. The price is below all three moving averages: MA7 (0.01333), MA25 (0.01432), and MA99 (0.01503).
Liquidation map: During the decline, the price passed through a dense leverage zone in the 0.012–0.013 range, where stops and long liquidations were clustered. There is still plenty of liquidity below 0.011, so a retest of the low is possible. Above, a large cluster is visible in the 0.0150–0.0160 zone, which the price could be drawn toward in the event of a strong rebound.
Key levels:
Support: 0.01119, then 0.01050
Resistance: 0.01333 (MA7), then 0.01432 (MA25)
As long as the price remains below MA7, sellers have the advantage. A rebound without volume confirmation may be merely technical. Use stop-losses and low leverage.
Not financial advice. DYOR.
#HANA
1
208
·
--
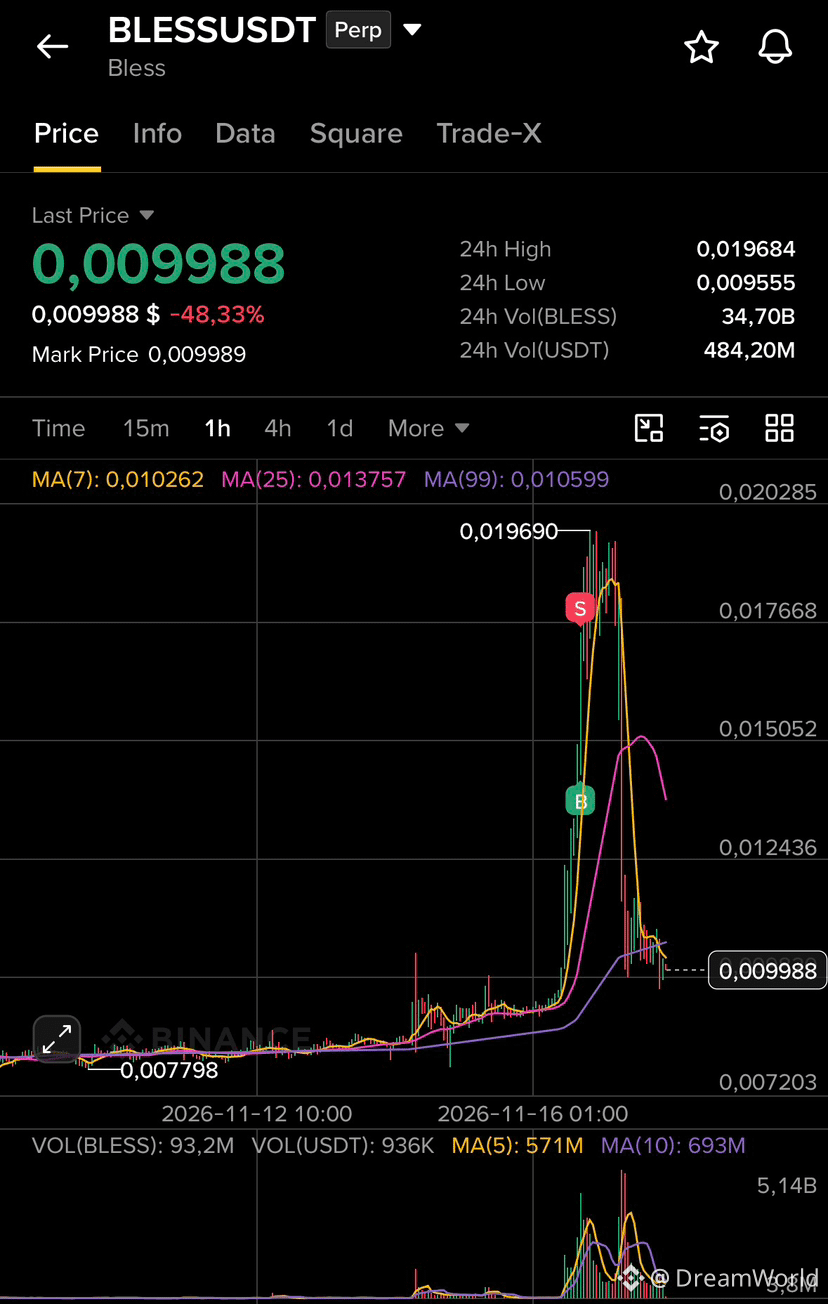
🔻 $BLESS (Bless) -48% in 24 hours
After a sharp surge from 0.0078 to a peak of 0.01969, the price gave back the entire move and is trading around 0.009988. This is a classic pump and dump: nearly all the gains were wiped out within a few hours. 24-hour volume: 484M USDT, with noticeable spikes in selling during the decline.
Technical picture: the price has fallen below MA7 (0.010262) and MA25 (0.013757), while MA99 (0.010599) is now acting as resistance. The 24-hour low of 0.009555 is key support. Losing this level would open the way to 0.0078, where the move began.
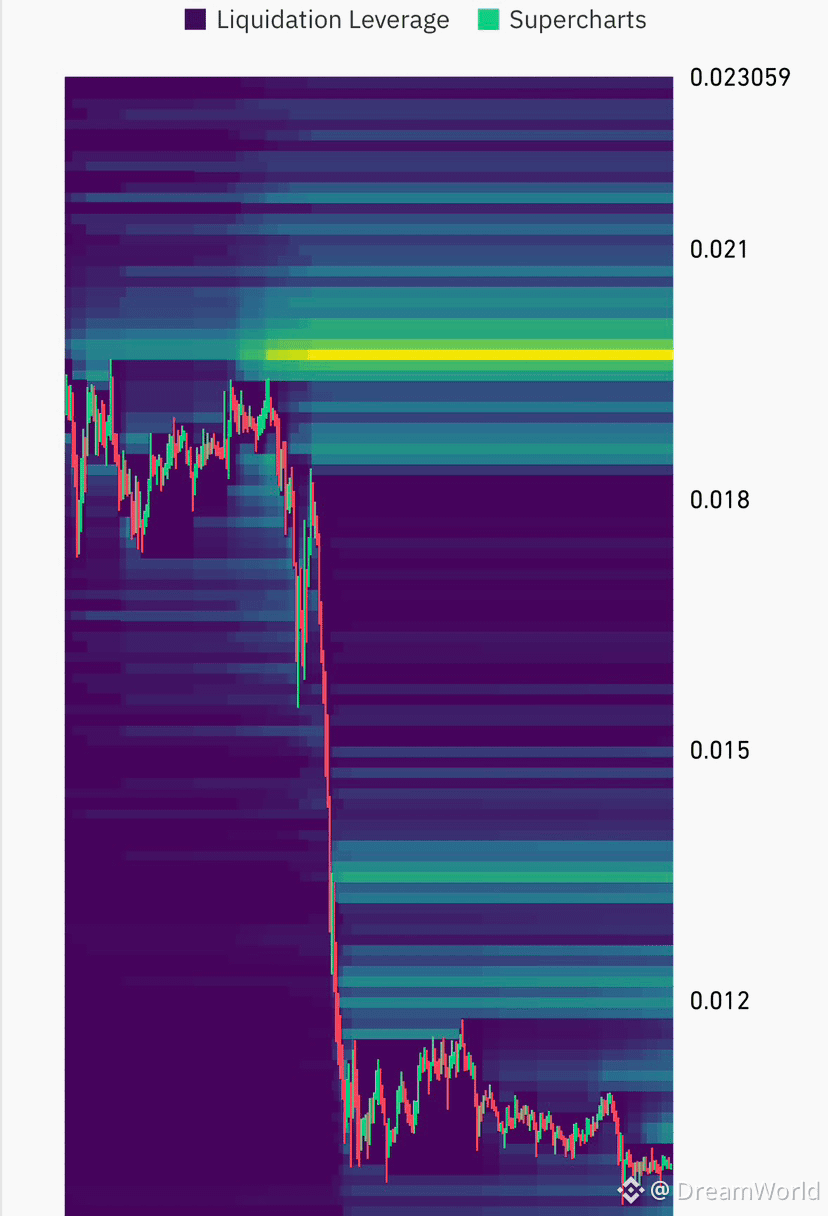
Liquidation map: the largest leverage cluster remains in the 0.019–0.020 zone, where longs entered at the peak. Below, around 0.012–0.0135, several more liquidity zones are visible, which the price has already moved through.
Key levels:
Support: 0.009555, then 0.0078
Resistance: 0.0106 (MA99), then 0.0137 (MA25)
A rebound is possible after such a drop, but the trend remains weak for now. Don't rush to catch the bottom; use stop-losses and low leverage.
Not financial advice. DYOR.
#BLESS
🔻 $BLESS (Bless) -48% in 24 hours
After a sharp surge from 0.0078 to a peak of 0.01969, the price gave back the entire move and is trading around 0.009988. This is a classic pump and dump: nearly all the gains were wiped out within a few hours. 24-hour volume: 484M USDT, with noticeable spikes in selling during the decline.
Technical picture: the price has fallen below MA7 (0.010262) and MA25 (0.013757), while MA99 (0.010599) is now acting as resistance. The 24-hour low of 0.009555 is key support. Losing this level would open the way to 0.0078, where the move began.
Liquidation map: the largest leverage cluster remains in the 0.019–0.020 zone, where longs entered at the peak. Below, around 0.012–0.0135, several more liquidity zones are visible, which the price has already moved through.
Key levels:
Support: 0.009555, then 0.0078
Resistance: 0.0106 (MA99), then 0.0137 (MA25)
A rebound is possible after such a drop, but the trend remains weak for now. Don't rush to catch the bottom; use stop-losses and low leverage.
Not financial advice. DYOR.
#BLESS
After a sharp surge from 0.0078 to a peak of 0.01969, the price gave back the entire move and is trading around 0.009988. This is a classic pump and dump: nearly all the gains were wiped out within a few hours. 24-hour volume: 484M USDT, with noticeable spikes in selling during the decline.
Technical picture: the price has fallen below MA7 (0.010262) and MA25 (0.013757), while MA99 (0.010599) is now acting as resistance. The 24-hour low of 0.009555 is key support. Losing this level would open the way to 0.0078, where the move began.
Liquidation map: the largest leverage cluster remains in the 0.019–0.020 zone, where longs entered at the peak. Below, around 0.012–0.0135, several more liquidity zones are visible, which the price has already moved through.
Key levels:
Support: 0.009555, then 0.0078
Resistance: 0.0106 (MA99), then 0.0137 (MA25)
A rebound is possible after such a drop, but the trend remains weak for now. Don't rush to catch the bottom; use stop-losses and low leverage.
Not financial advice. DYOR.
#BLESS
1
558
·
--
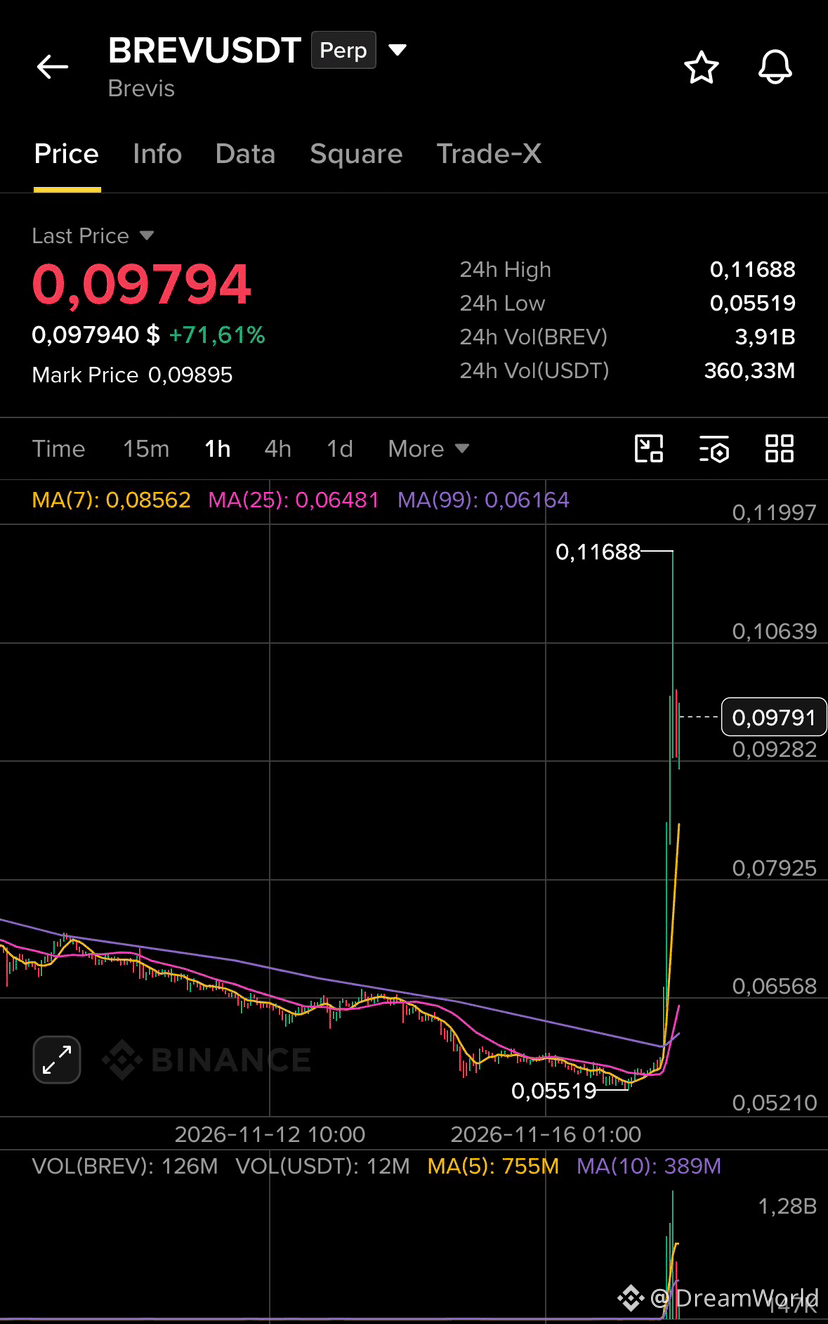
🔥 $BREV (Brevis) +71% in 24 hours
For a month, the price slowly slipped below MA99, then exploded sharply: from 0.05519 to a peak of 0.11688. It’s now trading around 0.0979, having already pulled back about 16% from its high. 24-hour volume: 360M USDT, showing genuine interest in the move.
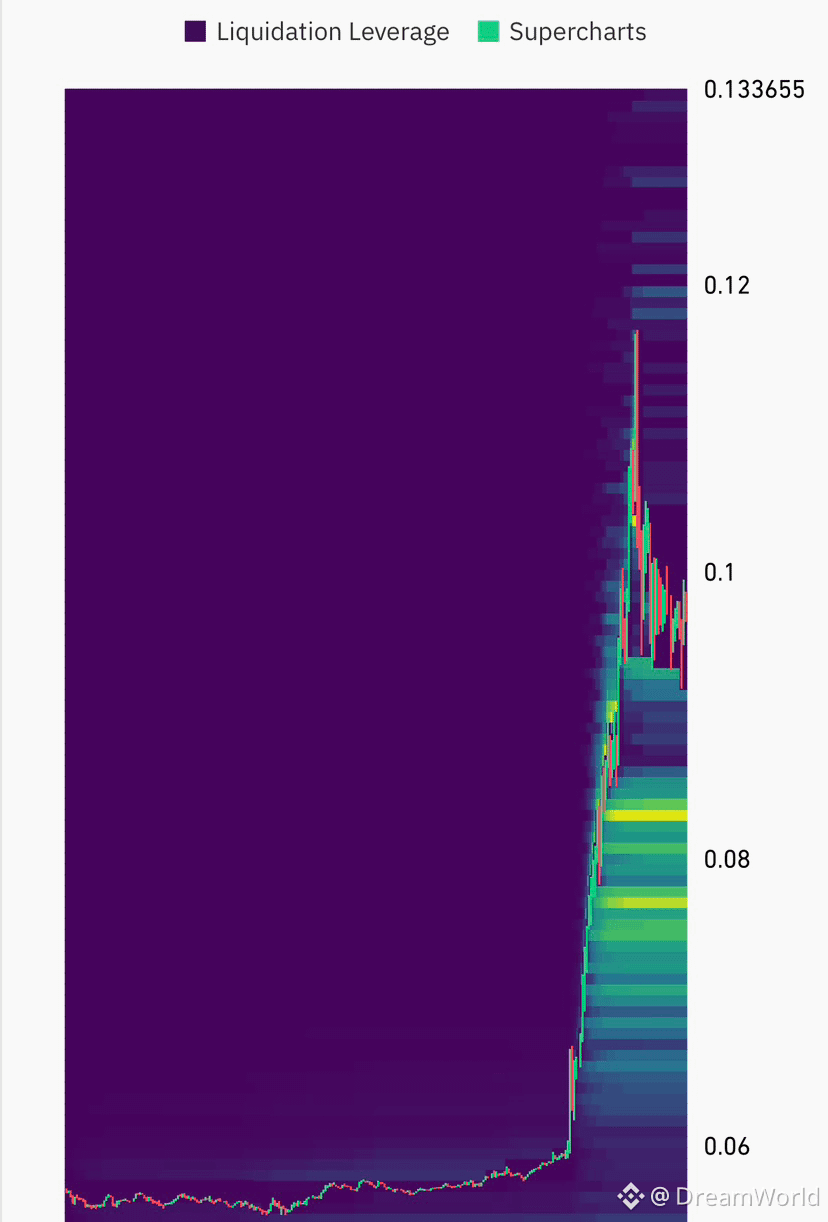
Liquidation map: powerful leverage clusters remained in the 0.065–0.085 zone, and the price shot straight through them. There is little liquidity above 0.1, so moves there could be sharp in either direction.
Key levels:
Support: 0.0856 (MA7), then 0.0648 (MA25)
Resistance: 0.1169, then 0.12
The price is very far from its averages, so a pullback or consolidation would be completely natural. Don’t chase the candle; use stop-losses and low leverage.
Not financial advice. DYOR.
#BREV
{future}(BREVUSDT)
🔥 $BREV (Brevis) +71% in 24 hours
For a month, the price slowly slipped below MA99, then exploded sharply: from 0.05519 to a peak of 0.11688. It’s now trading around 0.0979, having already pulled back about 16% from its high. 24-hour volume: 360M USDT, showing genuine interest in the move.
Liquidation map: powerful leverage clusters remained in the 0.065–0.085 zone, and the price shot straight through them. There is little liquidity above 0.1, so moves there could be sharp in either direction.
Key levels:
Support: 0.0856 (MA7), then 0.0648 (MA25)
Resistance: 0.1169, then 0.12
The price is very far from its averages, so a pullback or consolidation would be completely natural. Don’t chase the candle; use stop-losses and low leverage.
Not financial advice. DYOR.
#BREV
For a month, the price slowly slipped below MA99, then exploded sharply: from 0.05519 to a peak of 0.11688. It’s now trading around 0.0979, having already pulled back about 16% from its high. 24-hour volume: 360M USDT, showing genuine interest in the move.
Liquidation map: powerful leverage clusters remained in the 0.065–0.085 zone, and the price shot straight through them. There is little liquidity above 0.1, so moves there could be sharp in either direction.
Key levels:
Support: 0.0856 (MA7), then 0.0648 (MA25)
Resistance: 0.1169, then 0.12
The price is very far from its averages, so a pullback or consolidation would be completely natural. Don’t chase the candle; use stop-losses and low leverage.
Not financial advice. DYOR.
#BREV
2
814
·
--
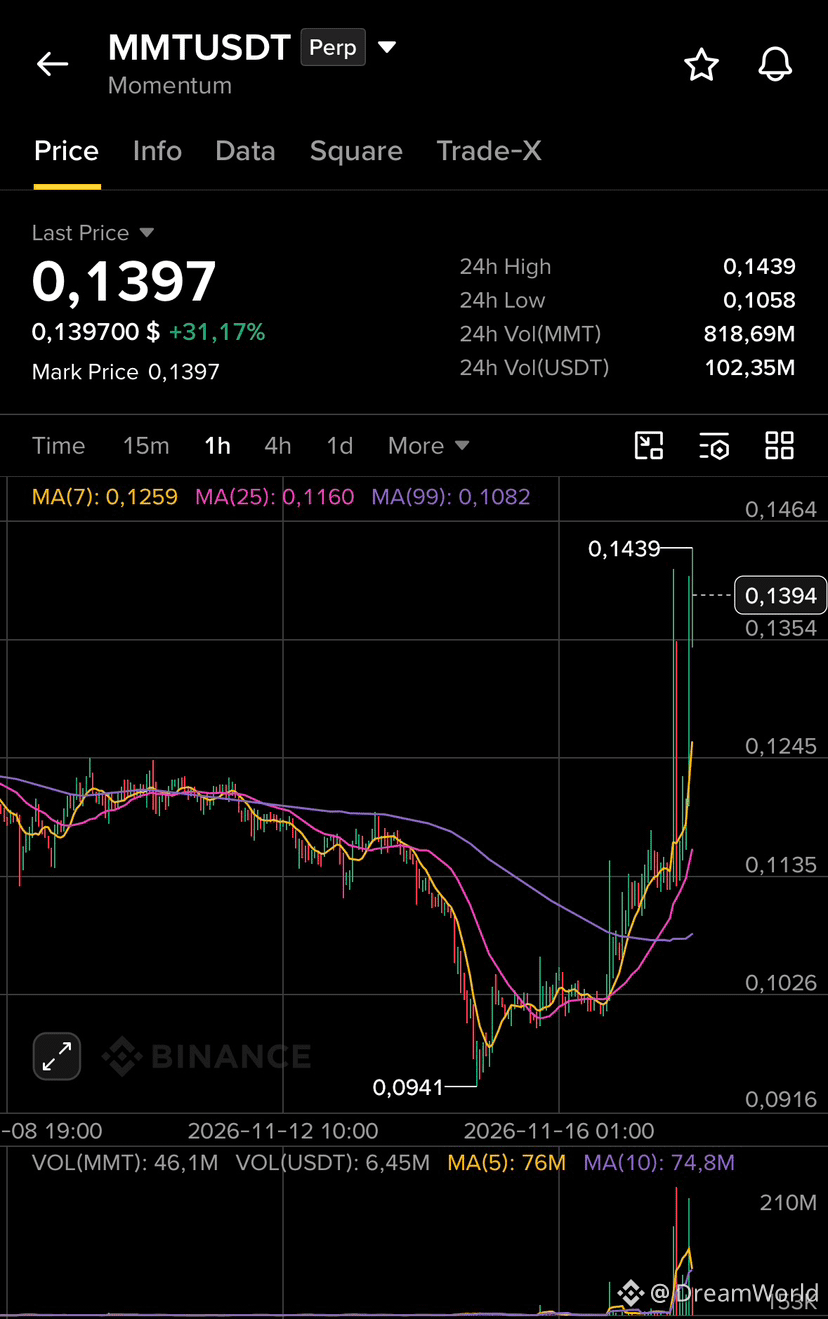
🔥 $MMT (Momentum) surged +31% in 24 hours
After falling to 0.0941, the price reversed and broke through MA99 (0.1082) and MA25 (0.1160) on the 1H chart. It is now trading around 0.1397, with a local high of 0.1439. 24-hour volume: over 102M USDT, confirming market interest in the momentum.
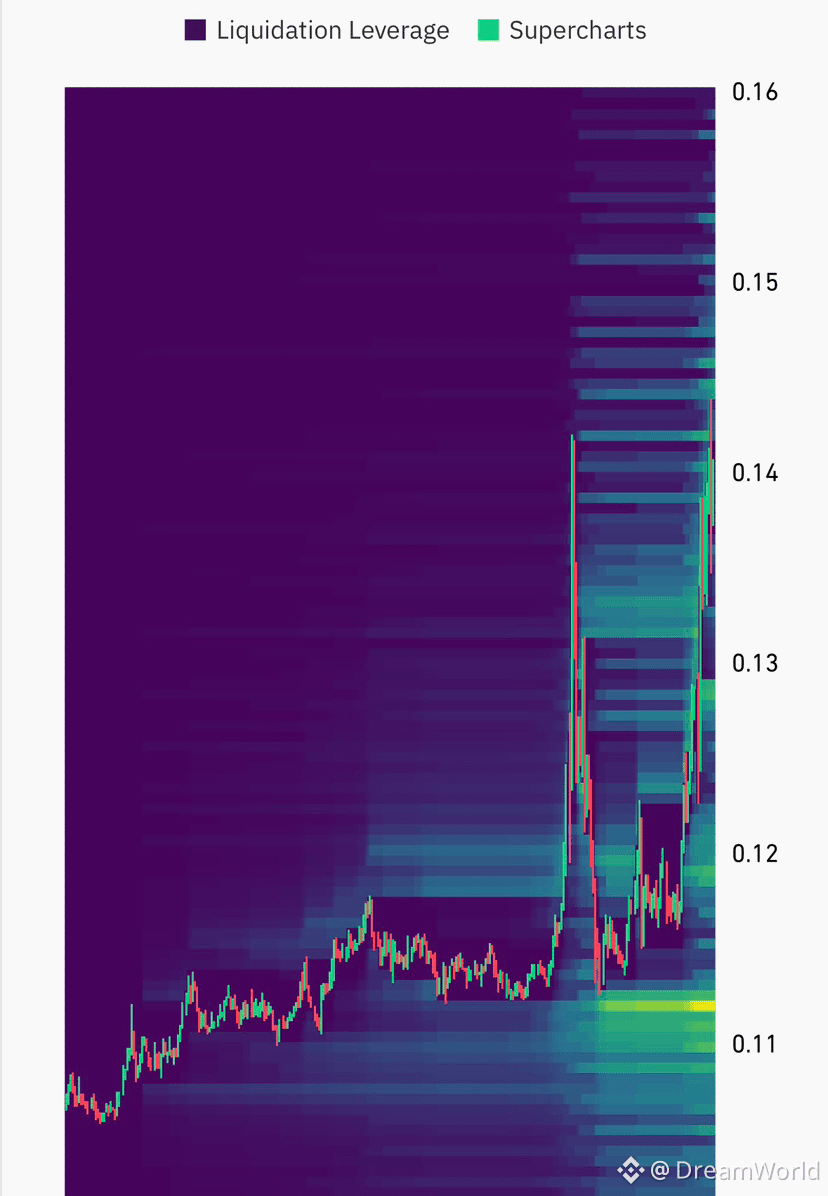
What the liquidation map shows: a strong cluster of leveraged positions was around 0.11, and the price has already moved through it. Higher up, in the 0.13–0.145 zone, liquidity is distributed more evenly, so price action there could be sharp in either direction.
Key levels:
Support: 0.1259 (MA7), then 0.1160 (MA25)
Resistance: 0.1439, then 0.15 and 0.16
A pullback is possible after a vertical rise. Don’t chase the candle; manage your risk and use stop-losses.
Not financial advice. DYOR.
#MMT
{future}(MMTUSDT)
🔥 $MMT (Momentum) surged +31% in 24 hours
After falling to 0.0941, the price reversed and broke through MA99 (0.1082) and MA25 (0.1160) on the 1H chart. It is now trading around 0.1397, with a local high of 0.1439. 24-hour volume: over 102M USDT, confirming market interest in the momentum.
What the liquidation map shows: a strong cluster of leveraged positions was around 0.11, and the price has already moved through it. Higher up, in the 0.13–0.145 zone, liquidity is distributed more evenly, so price action there could be sharp in either direction.
Key levels:
Support: 0.1259 (MA7), then 0.1160 (MA25)
Resistance: 0.1439, then 0.15 and 0.16
A pullback is possible after a vertical rise. Don’t chase the candle; manage your risk and use stop-losses.
Not financial advice. DYOR.
#MMT
After falling to 0.0941, the price reversed and broke through MA99 (0.1082) and MA25 (0.1160) on the 1H chart. It is now trading around 0.1397, with a local high of 0.1439. 24-hour volume: over 102M USDT, confirming market interest in the momentum.
What the liquidation map shows: a strong cluster of leveraged positions was around 0.11, and the price has already moved through it. Higher up, in the 0.13–0.145 zone, liquidity is distributed more evenly, so price action there could be sharp in either direction.
Key levels:
Support: 0.1259 (MA7), then 0.1160 (MA25)
Resistance: 0.1439, then 0.15 and 0.16
A pullback is possible after a vertical rise. Don’t chase the candle; manage your risk and use stop-losses.
Not financial advice. DYOR.
#MMT
3
763
·
--

Article
👀 The big show late tonight.Meanwhile, Dow futures are down 0.8%, while Nasdaq 100 futures are up 0.4%.
Asian and European markets are falling.
🤩 Nvidia (NVDA) reports its October-quarter results after the close today.
FactSet forecast: revenue of $109 billion (+91% year over year), adjusted earnings of $2.48 per share (+90%). Options imply a ±7% move in the stock.
▪️NVDA fell 4.1% to $156 on Monday, is down 10% since Huang’s resignation, and 35% from its peak. The stock is cheap—it trades at just 10 times annual earnings versus 18 for the S&P 500.
👀 The big show late tonight.
Meanwhile, Dow futures are down 0.8%, while Nasdaq 100 futures are up 0.4%.
Asian and European markets are falling.
🤩 Nvidia (NVDA) reports its October-quarter results after the close today.
FactSet forecast: revenue of $109 billion (+91% year over year), adjusted earnings of $2.48 per share (+90%). Options imply a ±7% move in the stock.
▪️NVDA fell 4.1% to $156 on Monday, is down 10% since Huang’s resignation, and 35% from its peak. The stock is cheap—it trades at just 10 times annual earnings versus 18 for the S&P 500.
Asian and European markets are falling.
🤩 Nvidia (NVDA) reports its October-quarter results after the close today.
FactSet forecast: revenue of $109 billion (+91% year over year), adjusted earnings of $2.48 per share (+90%). Options imply a ±7% move in the stock.
▪️NVDA fell 4.1% to $156 on Monday, is down 10% since Huang’s resignation, and 35% from its peak. The stock is cheap—it trades at just 10 times annual earnings versus 18 for the S&P 500.
3
411
·
--
Verified

Article
Charlie Munger: Smart Men Can Go Broke in 3 Ways: “Alcohol, Women, and Leverage”Huang got into trouble because of the second item on this list. He won’t go broke, but he’s already lost a good job.
Huang’s departure shook stocks in AI-related companies. We promised you buying opportunities after the U.S. midterm elections. There were plenty last Thursday, and a few more emerged this week.
Charlie Munger: Smart Men Can Go Broke in 3 Ways: “Alcohol, Women, and Leverage”
Huang got into trouble because of the second item on this list. He won’t go broke, but he’s already lost a good job.
Huang’s departure shook stocks in AI-related companies. We promised you buying opportunities after the U.S. midterm elections. There were plenty last Thursday, and a few more emerged this week.
Huang’s departure shook stocks in AI-related companies. We promised you buying opportunities after the U.S. midterm elections. There were plenty last Thursday, and a few more emerged this week.
4
602
·
--
Bullish
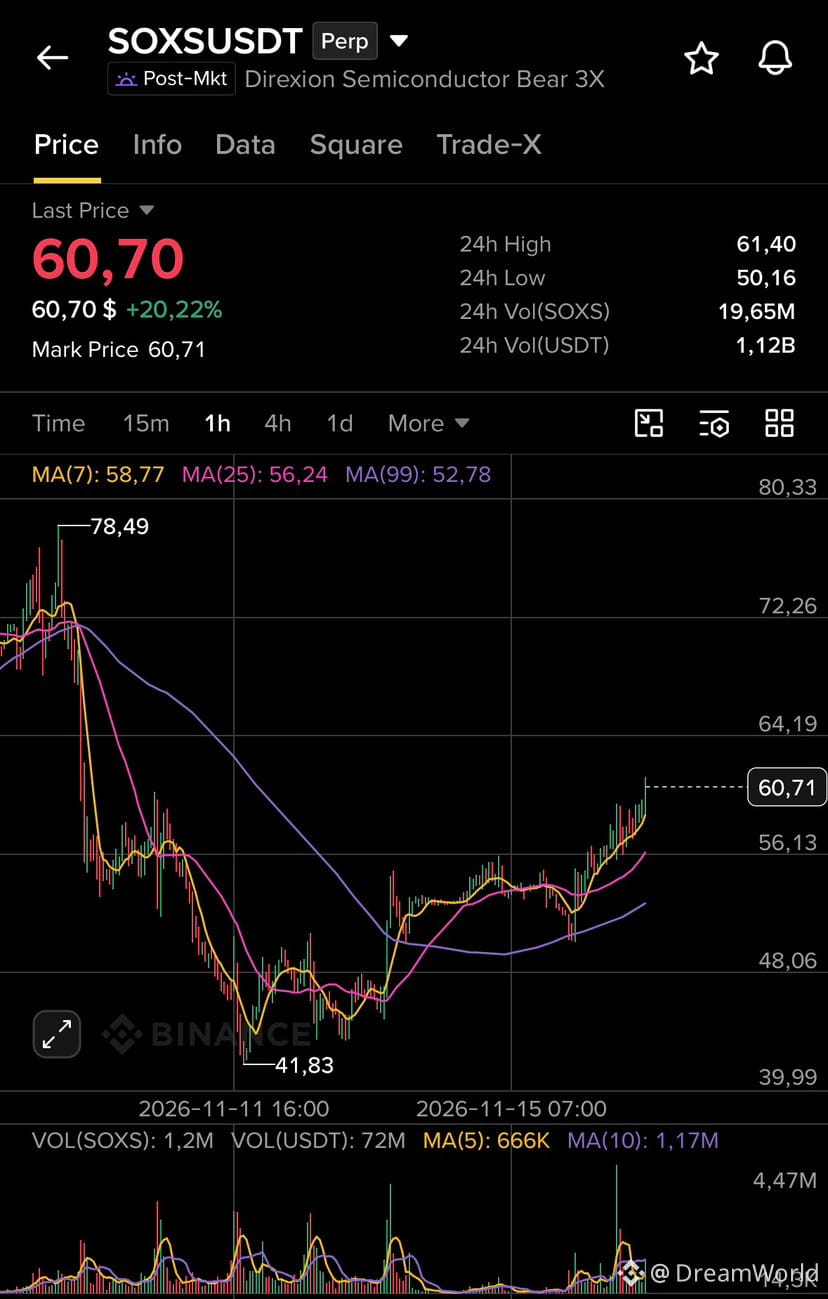
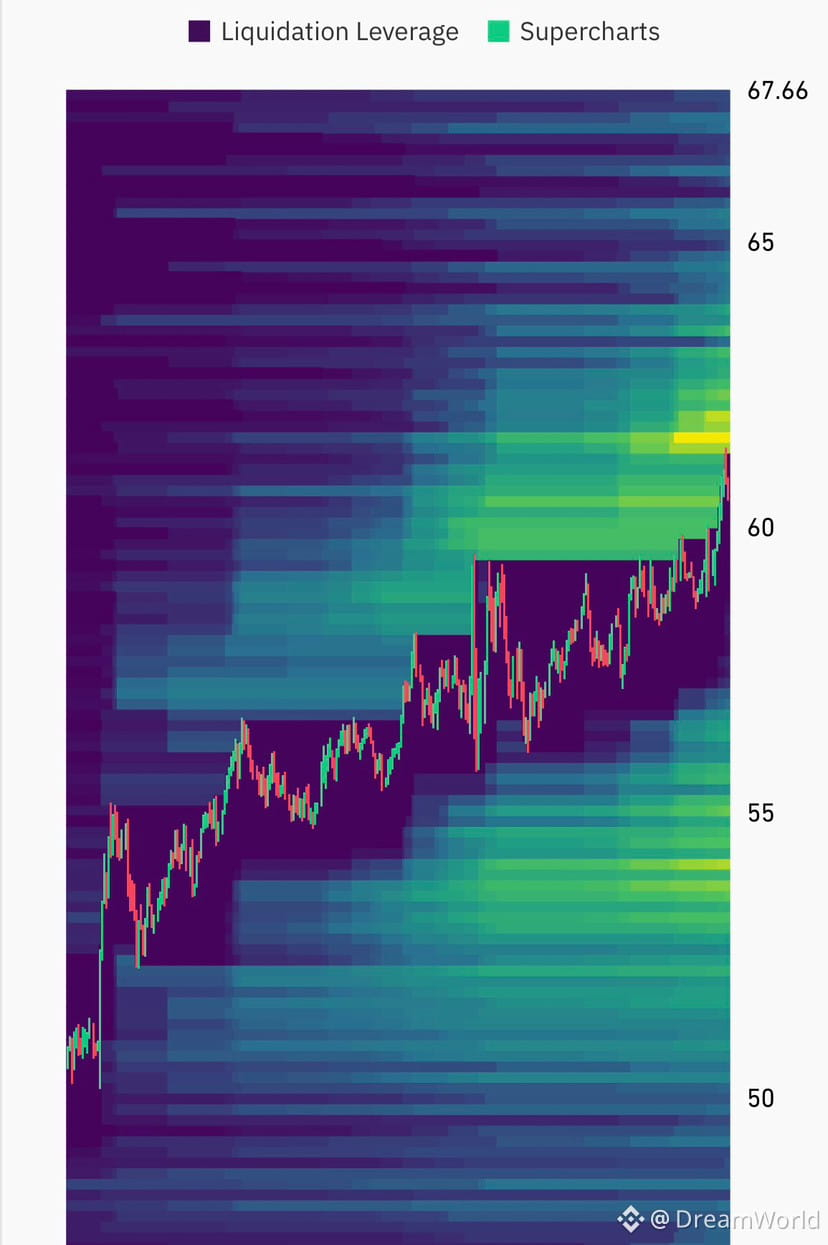
📈 $SOXS /USDT is trading at $60.70 (+20.22% in 24 hours) on strong volume of $1.12B. After bouncing from a low of $41.83, the price has held above all moving averages, while a dense cluster of liquidity above current levels (up to $65–$67) creates potential for further gains as short sellers’ stops are swept.
{future}(SOXSUSDT)
#soxs
📈 $SOXS /USDT is trading at $60.70 (+20.22% in 24 hours) on strong volume of $1.12B. After bouncing from a low of $41.83, the price has held above all moving averages, while a dense cluster of liquidity above current levels (up to $65–$67) creates potential for further gains as short sellers’ stops are swept.
#soxs
#soxs
1
277
·
--
🔥 $HUMA (Huma Finance) is waking up: +50% momentum in 24 hours!
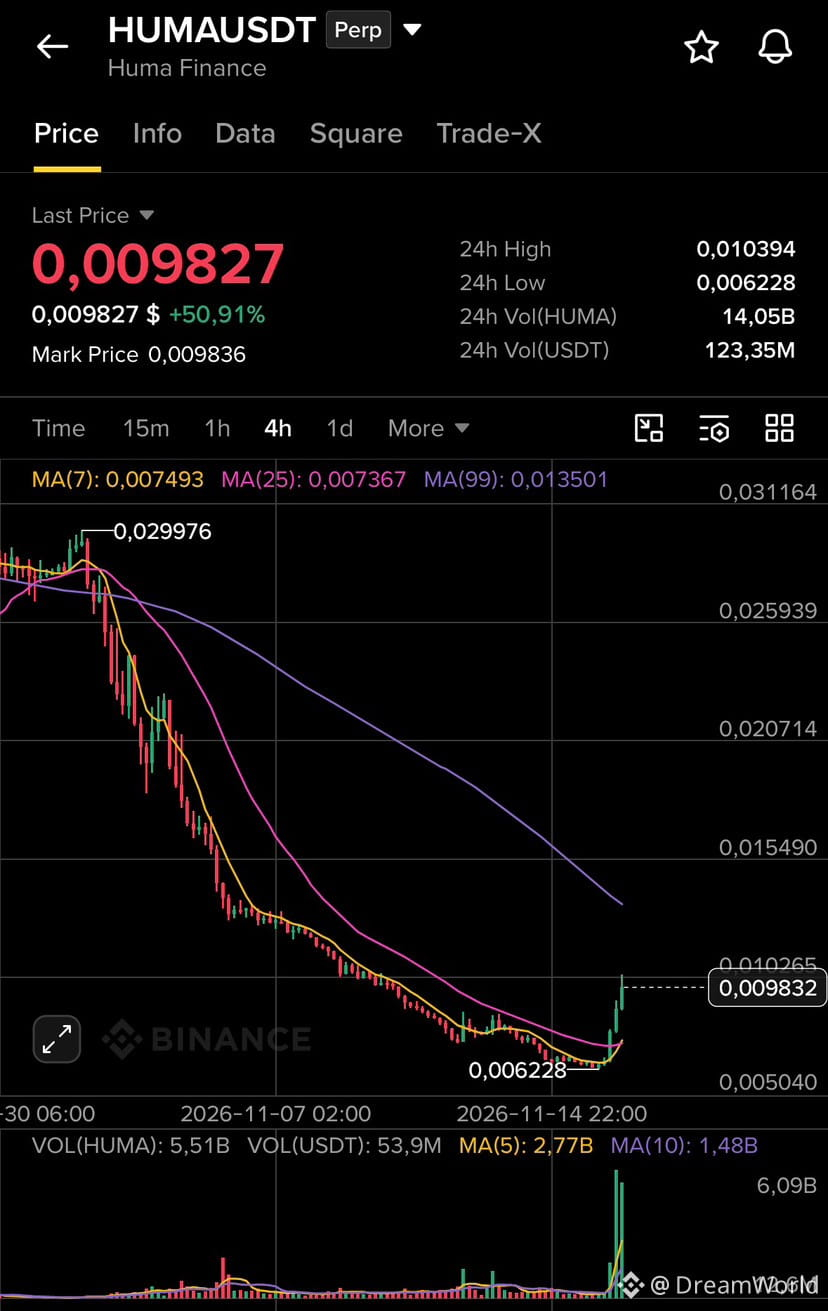
After a long sell-off from around $0.03 and a bottom at $0.00622, the coin made a sharp reversal and is already trading around $0.0098.
📊 A look at the current chart situation:
Volume marker: Significant volume came in — daily turnover exceeded 123.35M USDT (14.05B HUMA). A powerful green buyback candle is visible, indicating clear interest from a major player or speculators.
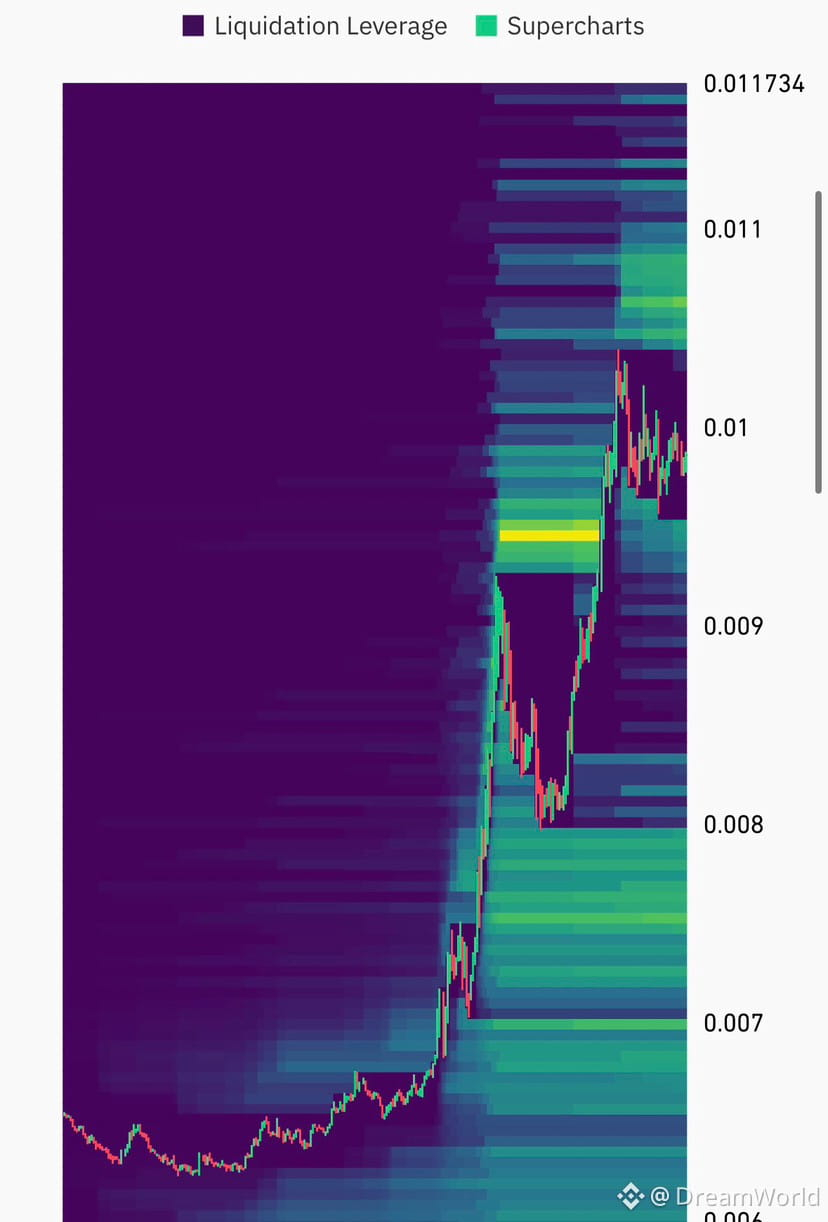
Liquidation heatmap marker: Dense liquidity has accumulated above, in the $0.010–$0.011+ zone. The market maker could easily push the price higher to sweep short sellers’ stop-losses.
Technical marker: The price has confidently broken above the local moving averages (MA7 and MA25) on the 4-hour timeframe and is now testing the psychological $0.01 level.
⚠️ What’s next?
The move is aggressive and volatile. If the price holds above $0.0104 (the current 24h high), the way is open to sweep liquidity up to $0.0117. In the event of a pullback, watch how buyers react when the $0.0080–$0.0085 zone is retested.
Not financial advice; manage your risk!
👇 What do you think—will it push above $0.011, or is a correction due?
#HUMA
{future}(HUMAUSDT)
🔥 $HUMA (Huma Finance) is waking up: +50% momentum in 24 hours!
After a long sell-off from around $0.03 and a bottom at $0.00622, the coin made a sharp reversal and is already trading around $0.0098.
📊 A look at the current chart situation:
Volume marker: Significant volume came in — daily turnover exceeded 123.35M USDT (14.05B HUMA). A powerful green buyback candle is visible, indicating clear interest from a major player or speculators.
Liquidation heatmap marker: Dense liquidity has accumulated above, in the $0.010–$0.011+ zone. The market maker could easily push the price higher to sweep short sellers’ stop-losses.
Technical marker: The price has confidently broken above the local moving averages (MA7 and MA25) on the 4-hour timeframe and is now testing the psychological $0.01 level.
⚠️ What’s next?
The move is aggressive and volatile. If the price holds above $0.0104 (the current 24h high), the way is open to sweep liquidity up to $0.0117. In the event of a pullback, watch how buyers react when the $0.0080–$0.0085 zone is retested.
Not financial advice; manage your risk!
👇 What do you think—will it push above $0.011, or is a correction due?
#HUMA
After a long sell-off from around $0.03 and a bottom at $0.00622, the coin made a sharp reversal and is already trading around $0.0098.
📊 A look at the current chart situation:
Volume marker: Significant volume came in — daily turnover exceeded 123.35M USDT (14.05B HUMA). A powerful green buyback candle is visible, indicating clear interest from a major player or speculators.
Liquidation heatmap marker: Dense liquidity has accumulated above, in the $0.010–$0.011+ zone. The market maker could easily push the price higher to sweep short sellers’ stop-losses.
Technical marker: The price has confidently broken above the local moving averages (MA7 and MA25) on the 4-hour timeframe and is now testing the psychological $0.01 level.
⚠️ What’s next?
The move is aggressive and volatile. If the price holds above $0.0104 (the current 24h high), the way is open to sweep liquidity up to $0.0117. In the event of a pullback, watch how buyers react when the $0.0080–$0.0085 zone is retested.
Not financial advice; manage your risk!
👇 What do you think—will it push above $0.011, or is a correction due?
#HUMA
1
227
·
--
Bearish
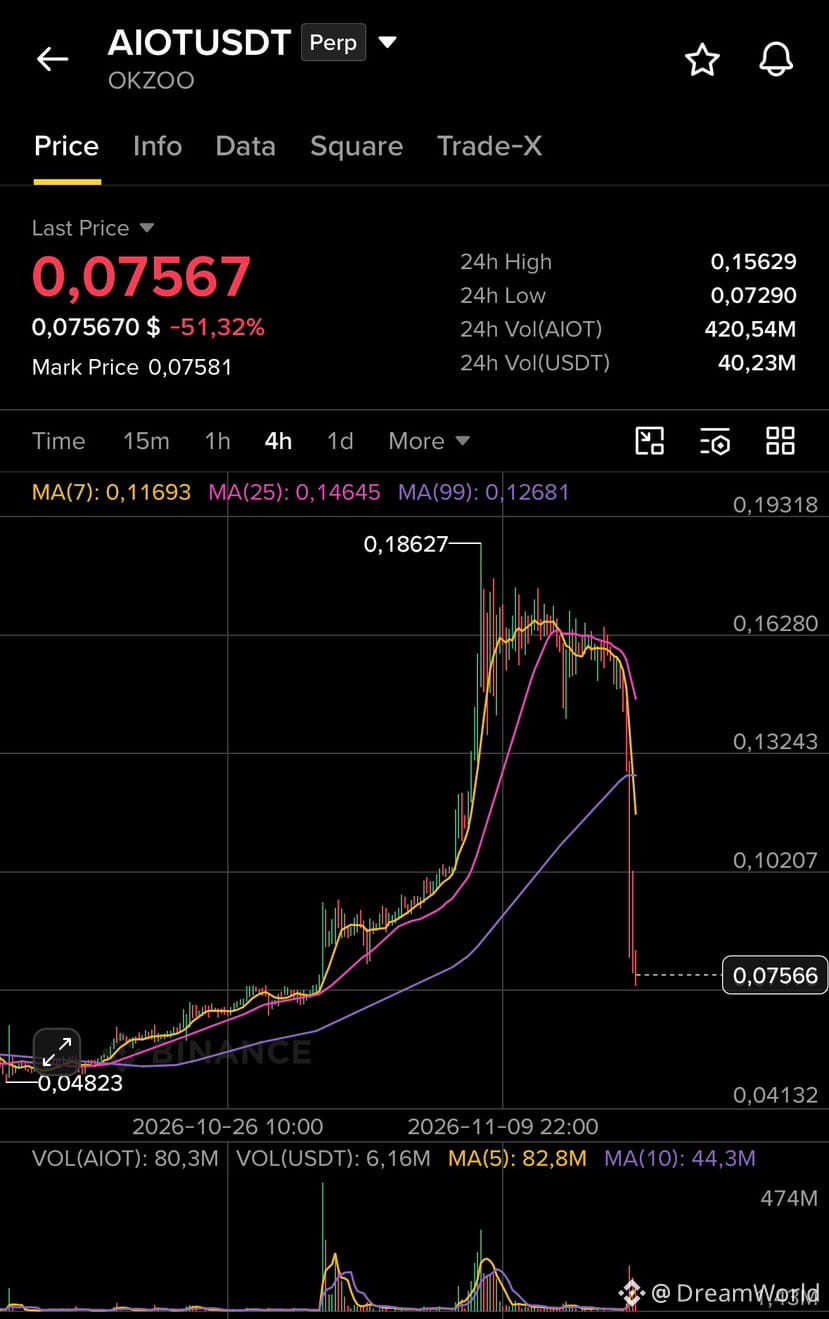
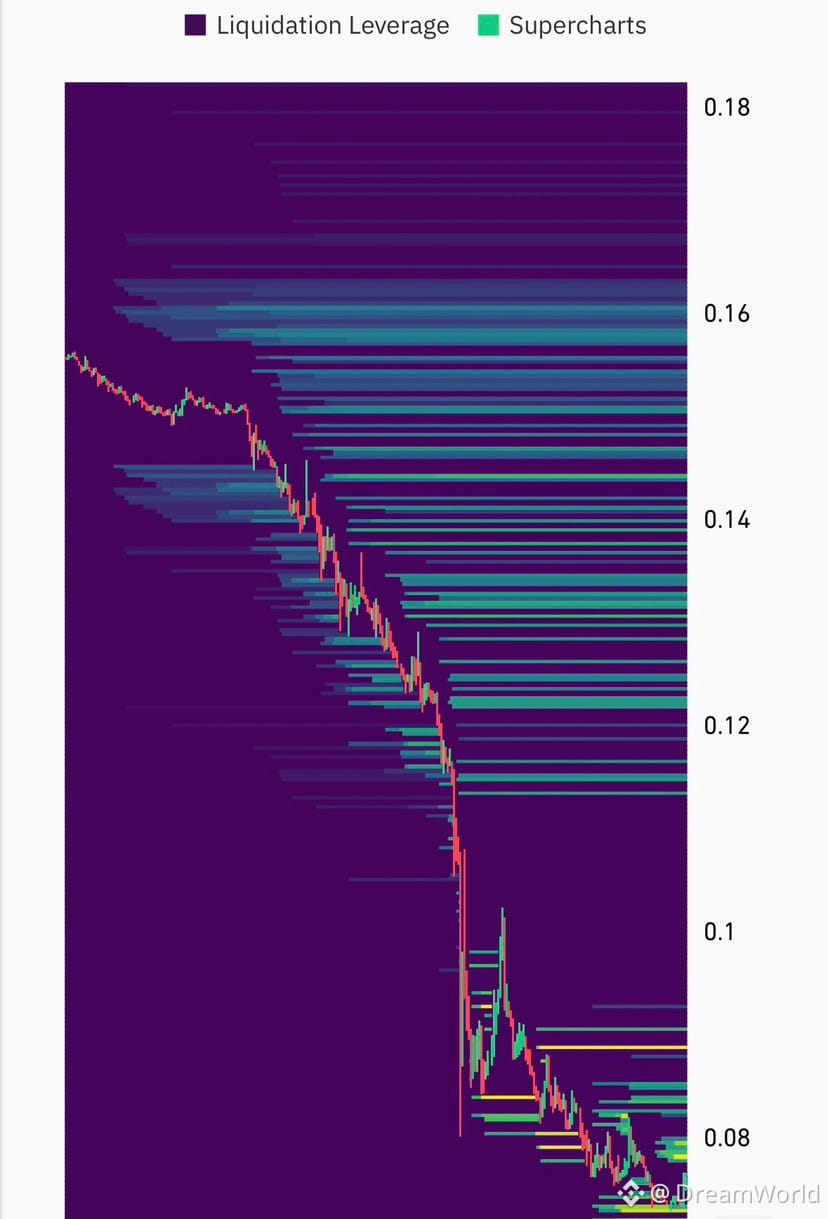
🚨 AIOT JUST GOT WIPED OUT — IS THERE MORE PAIN AHEAD?
$AIOT / USDT — 🔴 SHORT
AIOT has suffered a brutal 51% correction in 24 hours, completely destroying its previous bullish structure.
The 4H chart shows a massive breakdown, with price trading below all three major moving averages:
* MA(7): 0.11693
* MA(25): 0.14645
* MA(99): 0.12681
Selling pressure is aggressive, and volume is picking up as sellers take control.
📉 SHORT SETUP
Entry: 0.0800 – 0.0850 (retest zone)
🎯 Take Profit:
* TP1: 0.0730
* TP2: 0.0680
* TP3: 0.0620
🛑 Stop Loss: 0.0910
Invalidation: A sustained 4H recovery above 0.0910 would weaken the bearish scenario.
⚠️ After such an extreme drop, a sharp relief bounce is possible. No need to chase the move — let price come to the entry zone.
The first rule is survival. The market doesn’t reward those who rush into falling knives.
{future}(AIOTUSDT)
#aiot
🚨 AIOT JUST GOT WIPED OUT — IS THERE MORE PAIN AHEAD?
$AIOT / USDT — 🔴 SHORT
AIOT has suffered a brutal 51% correction in 24 hours, completely destroying its previous bullish structure.
The 4H chart shows a massive breakdown, with price trading below all three major moving averages:
* MA(7): 0.11693
* MA(25): 0.14645
* MA(99): 0.12681
Selling pressure is aggressive, and volume is picking up as sellers take control.
📉 SHORT SETUP
Entry: 0.0800 – 0.0850 (retest zone)
🎯 Take Profit:
* TP1: 0.0730
* TP2: 0.0680
* TP3: 0.0620
🛑 Stop Loss: 0.0910
Invalidation: A sustained 4H recovery above 0.0910 would weaken the bearish scenario.
⚠️ After such an extreme drop, a sharp relief bounce is possible. No need to chase the move — let price come to the entry zone.
The first rule is survival. The market doesn’t reward those who rush into falling knives.
#aiot
$AIOT / USDT — 🔴 SHORT
AIOT has suffered a brutal 51% correction in 24 hours, completely destroying its previous bullish structure.
The 4H chart shows a massive breakdown, with price trading below all three major moving averages:
* MA(7): 0.11693
* MA(25): 0.14645
* MA(99): 0.12681
Selling pressure is aggressive, and volume is picking up as sellers take control.
📉 SHORT SETUP
Entry: 0.0800 – 0.0850 (retest zone)
🎯 Take Profit:
* TP1: 0.0730
* TP2: 0.0680
* TP3: 0.0620
🛑 Stop Loss: 0.0910
Invalidation: A sustained 4H recovery above 0.0910 would weaken the bearish scenario.
⚠️ After such an extreme drop, a sharp relief bounce is possible. No need to chase the move — let price come to the entry zone.
The first rule is survival. The market doesn’t reward those who rush into falling knives.
#aiot
1
542
·
--
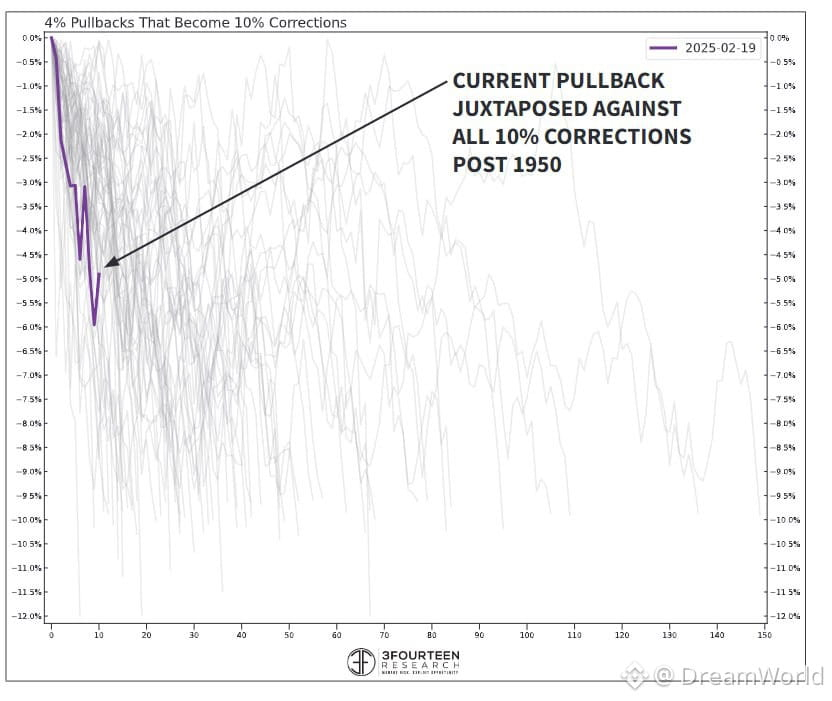
📊 What it takes for the S&P 500 decline not to turn into a major correction
A comparison by 3Fourteen Research
Gray shows every instance since 1950 when a 4% pullback in the S&P 500 became a correction, meaning a decline of 10% or more.
Three-quarters of them happened within 60 days of the peak, and half within 40 days. In other words, the longer the index stays above -10%, the lower the odds of a correction.
Since its October 6 peak, the S&P 500 has fallen 6%, with its biggest drop on November 5. A total of 35 days have passed, so the “window” will close in early December.
Again, the index is holding up, but 62% of its stocks are already 10% or more below their yearly highs (CNBC data).
The -10% level from the October record is around 7,040 points. If the index doesn’t reach it by early December, statistically, the pullback will most likely remain just a pullback.
📊 What it takes for the S&P 500 decline not to turn into a major correction
A comparison by 3Fourteen Research
Gray shows every instance since 1950 when a 4% pullback in the S&P 500 became a correction, meaning a decline of 10% or more.
Three-quarters of them happened within 60 days of the peak, and half within 40 days. In other words, the longer the index stays above -10%, the lower the odds of a correction.
Since its October 6 peak, the S&P 500 has fallen 6%, with its biggest drop on November 5. A total of 35 days have passed, so the “window” will close in early December.
Again, the index is holding up, but 62% of its stocks are already 10% or more below their yearly highs (CNBC data).
The -10% level from the October record is around 7,040 points. If the index doesn’t reach it by early December, statistically, the pullback will most likely remain just a pullback.
A comparison by 3Fourteen Research
Gray shows every instance since 1950 when a 4% pullback in the S&P 500 became a correction, meaning a decline of 10% or more.
Three-quarters of them happened within 60 days of the peak, and half within 40 days. In other words, the longer the index stays above -10%, the lower the odds of a correction.
Since its October 6 peak, the S&P 500 has fallen 6%, with its biggest drop on November 5. A total of 35 days have passed, so the “window” will close in early December.
Again, the index is holding up, but 62% of its stocks are already 10% or more below their yearly highs (CNBC data).
The -10% level from the October record is around 7,040 points. If the index doesn’t reach it by early December, statistically, the pullback will most likely remain just a pullback.
1
216
·
--
📉 Futures decline: Nasdaq-100 -1.4%, S&P 500 -0.6%, Dow -0.2%.
▪️The tech sector is under pressure from the Nvidia crisis, with shares near $159, a third below their October peak. Allies want Huang back, while Treasury Secretary Scott Bessent is calling for an outsider. Acting CEO Colette Kress will present the report on Tuesday.
▪️AI chips are falling in their wake. TSMC (TSM) -6%, AMD (AMD), Micron (MU), Marvell (MRVL) -5%, with Broadcom (AVGO) and SK Hynix also down. Intel (INTC) is under pressure from an investor lawsuit over concealing the decline in PC sales.
▪️Bitcoin at 65k, down 26% from its peak. Coinbase (COIN) and Robinhood (HOOD) -5%, Circle (CRCL) and Strategy (MSTR) -8%.
Blackstone Digital Infrastructure Trust +9% after buying a 75% stake in AWS data centers for $5 billion; Amazon (AMZN) is down.
Take-Two (TTWO) rises ahead of GTA VI's release on November 19.
Novo Nordisk (NVO) rises on EU approval of a hemophilia drug and data on its weight-loss pill.
L3Harris (LHX) falls amid air travel disruption.
SpaceX (SPCX) is unchanged after Starship's first interception.
Baidu (BIDU) is down amid declining advertising revenue.
🧐 Barclays recommends buying stocks because the CoreWeave (CRWV) report eased concerns about AI demand. But that's only one part of the equation…
Tomorrow, after NVDA's report, we'll see many more different recommendations
📉 Futures decline: Nasdaq-100 -1.4%, S&P 500 -0.6%, Dow -0.2%.
▪️The tech sector is under pressure from the Nvidia crisis, with shares near $159, a third below their October peak. Allies want Huang back, while Treasury Secretary Scott Bessent is calling for an outsider. Acting CEO Colette Kress will present the report on Tuesday.
▪️AI chips are falling in their wake. TSMC (TSM) -6%, AMD (AMD), Micron (MU), Marvell (MRVL) -5%, with Broadcom (AVGO) and SK Hynix also down. Intel (INTC) is under pressure from an investor lawsuit over concealing the decline in PC sales.
▪️Bitcoin at 65k, down 26% from its peak. Coinbase (COIN) and Robinhood (HOOD) -5%, Circle (CRCL) and Strategy (MSTR) -8%.
Blackstone Digital Infrastructure Trust +9% after buying a 75% stake in AWS data centers for $5 billion; Amazon (AMZN) is down.
Take-Two (TTWO) rises ahead of GTA VI's release on November 19.
Novo Nordisk (NVO) rises on EU approval of a hemophilia drug and data on its weight-loss pill.
L3Harris (LHX) falls amid air travel disruption.
SpaceX (SPCX) is unchanged after Starship's first interception.
Baidu (BIDU) is down amid declining advertising revenue.
🧐 Barclays recommends buying stocks because the CoreWeave (CRWV) report eased concerns about AI demand. But that's only one part of the equation…
Tomorrow, after NVDA's report, we'll see many more different recommendations
▪️The tech sector is under pressure from the Nvidia crisis, with shares near $159, a third below their October peak. Allies want Huang back, while Treasury Secretary Scott Bessent is calling for an outsider. Acting CEO Colette Kress will present the report on Tuesday.
▪️AI chips are falling in their wake. TSMC (TSM) -6%, AMD (AMD), Micron (MU), Marvell (MRVL) -5%, with Broadcom (AVGO) and SK Hynix also down. Intel (INTC) is under pressure from an investor lawsuit over concealing the decline in PC sales.
▪️Bitcoin at 65k, down 26% from its peak. Coinbase (COIN) and Robinhood (HOOD) -5%, Circle (CRCL) and Strategy (MSTR) -8%.
Blackstone Digital Infrastructure Trust +9% after buying a 75% stake in AWS data centers for $5 billion; Amazon (AMZN) is down.
Take-Two (TTWO) rises ahead of GTA VI's release on November 19.
Novo Nordisk (NVO) rises on EU approval of a hemophilia drug and data on its weight-loss pill.
L3Harris (LHX) falls amid air travel disruption.
SpaceX (SPCX) is unchanged after Starship's first interception.
Baidu (BIDU) is down amid declining advertising revenue.
🧐 Barclays recommends buying stocks because the CoreWeave (CRWV) report eased concerns about AI demand. But that's only one part of the equation…
Tomorrow, after NVDA's report, we'll see many more different recommendations

1
89
·
--
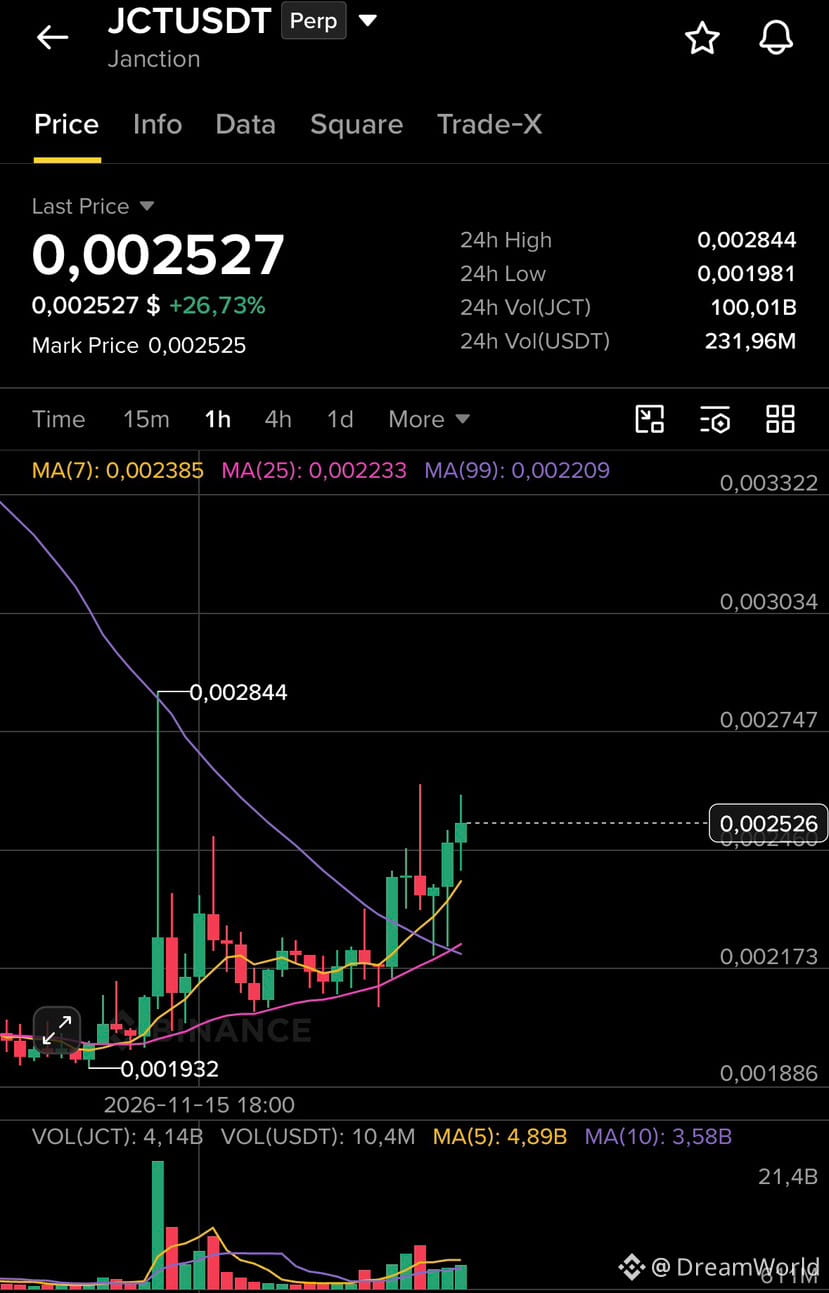
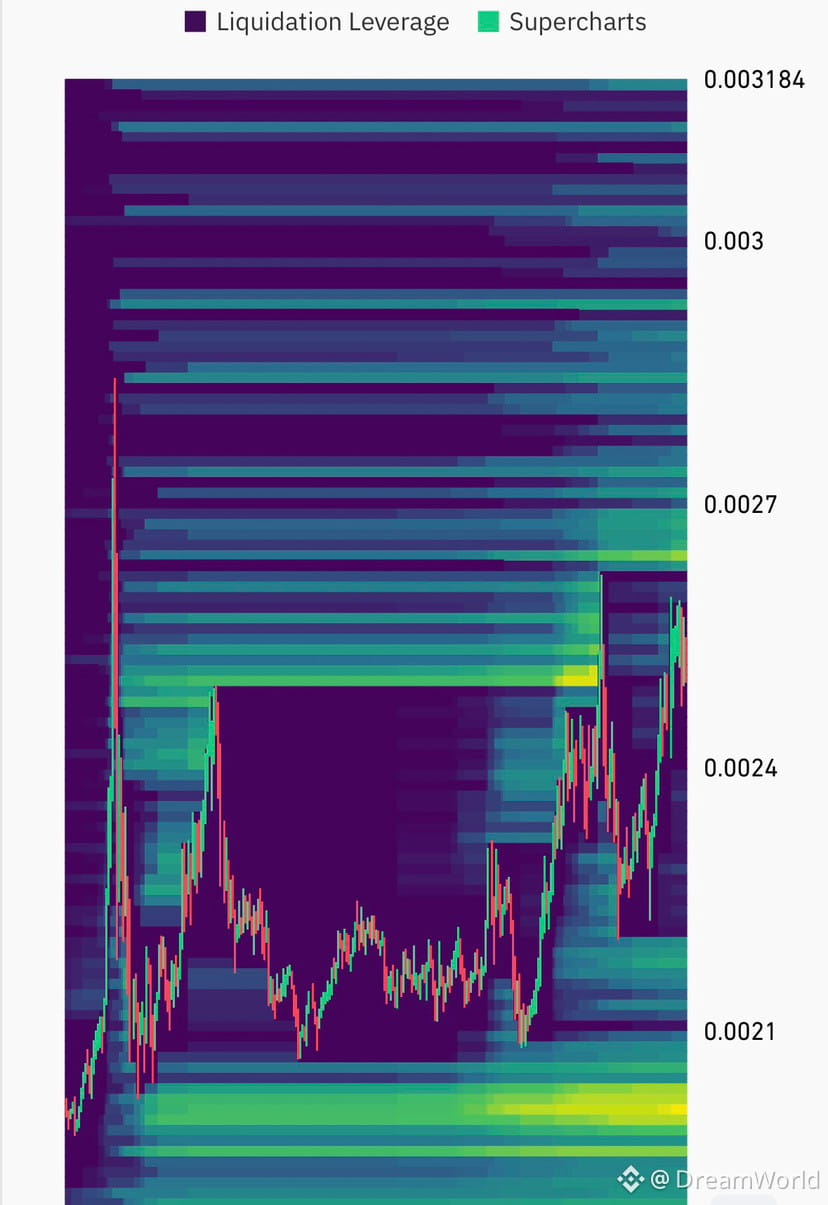
$JCT is holding above 0.0025 after rising +26%. The price is above MA(7), MA(25), and MA(99) on the 1H chart, and volume confirms the move. The nearest liquidation magnet is around 0.00264, followed by the high at 0.002844. Support: 0.00238 and 0.00223. Not financial advice.
{future}(JCTUSDT)
$JCT is holding above 0.0025 after rising +26%. The price is above MA(7), MA(25), and MA(99) on the 1H chart, and volume confirms the move. The nearest liquidation magnet is around 0.00264, followed by the high at 0.002844. Support: 0.00238 and 0.00223. Not financial advice.
2
490
Log in to explore more content
Join global crypto users on Binance Square
⚡️ Get latest and useful information about crypto.
💬 Trusted by the world’s largest crypto exchange.
👍 Discover real insights from verified creators.
Email / Phone number
Trending Topics
AnthropicToDebutAfter$83IPOPricing
15,333 views
124 Discussing
Stock Futures Hold Near Flat as Anthropic Prices IPO at $83 Ahead of Debut
Binance News
·8 Likes
·7.3k views
BTCRemainsUnderPressureAfterHawkishFOMCMinutes
57,463 views
1,069 Discussing
NvidiaBoardReportedlySplitOverHuang’sReturn
19,065 views
510 Discussing