
DopamineGLOBAL
2k Posts

DopamineGLOBAL
Report
Block User
hi im dopamine
x.com/dopamine_crypto
nanotradingclub.xyz
10 Following
66 Followers
439 Liked
Posts
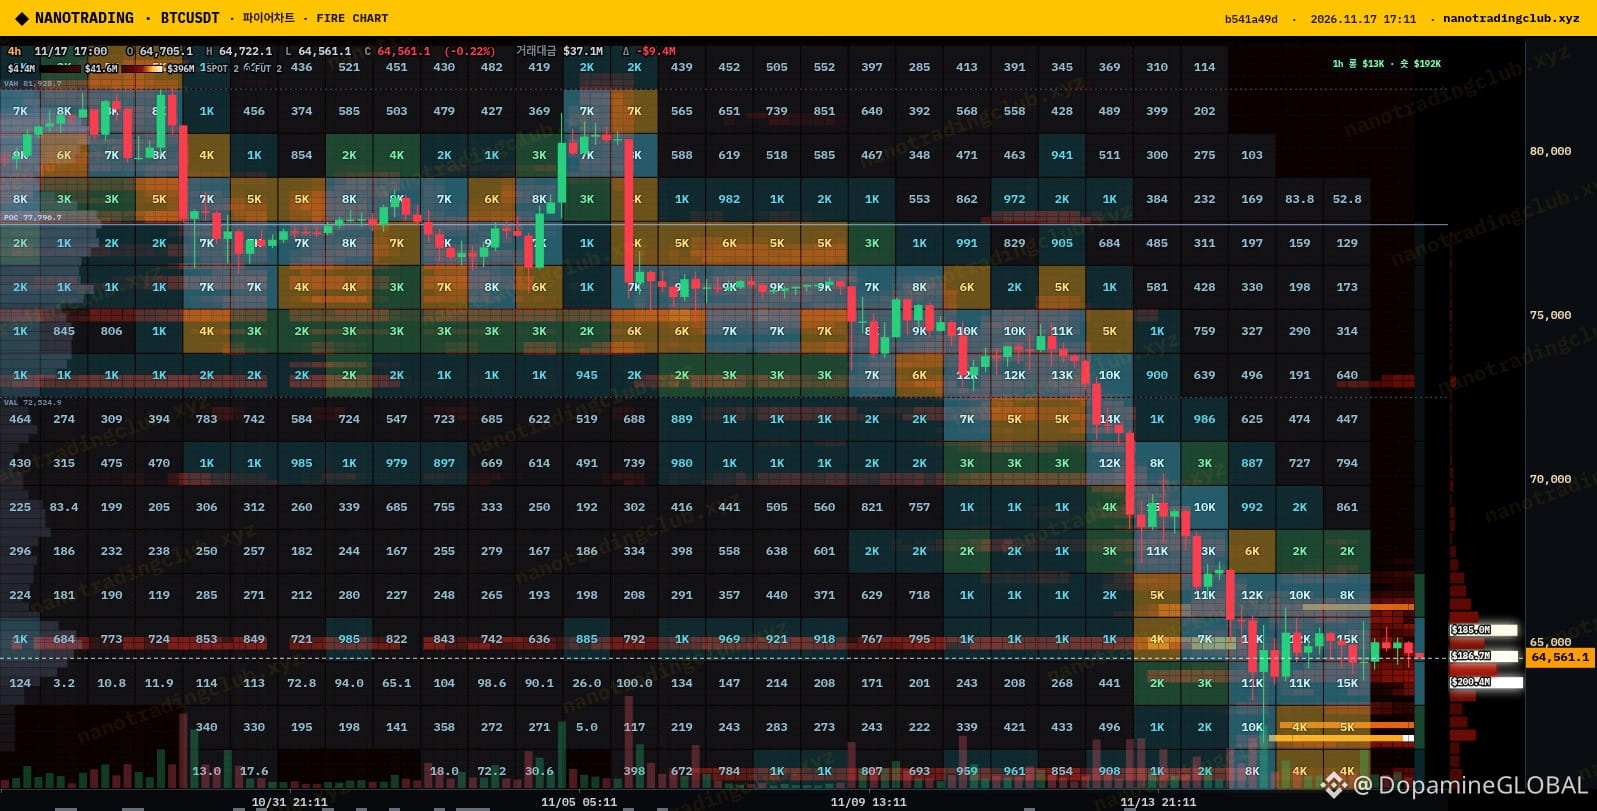
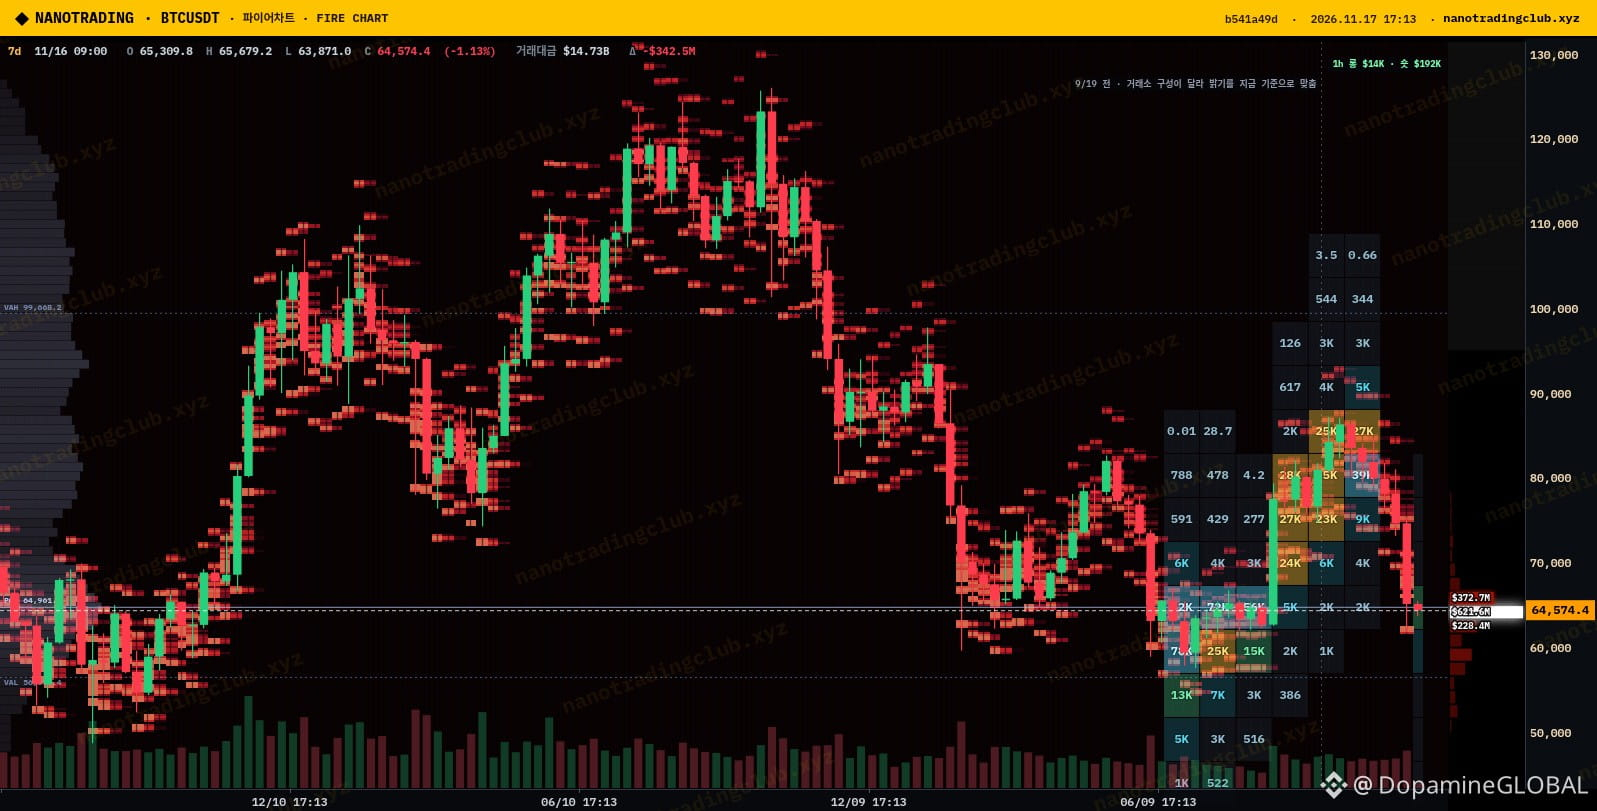
$BTC is stuck around 64.5K again, barely moving on the day while the 7d chart shows how far we've come off the 120K+ top. Zooming out like that makes this range feel a lot less random.
The thing I'm watching most is the bid. NanoTrading's wall scanner has a BTC buy wall at 64,021 worth about $37.6M, less than 1% below price. Its history isn't super clean though: out of 11 past reactions, price broke upward 2 times and got defended then reversed 2 times, and the earlier big walls from the last few days all vanished. So I'm not treating it as a floor, just as the first real test.
Liquidation radar is lopsided. Biggest short cluster I could find sits up at 67,777 (about $71M), while the big long cluster is way down near 51,927 (about $27M). The options panel on the same page shows max pain at 75,000 for the 27 Nov expiry, with most put OI at 63,000 and net gamma negative. Market mood is still awful, Fear & Greed 12 and 138 coins red vs 112 green.
My plan: hold 64K and I think $BTC can grind toward that 67.7K short pocket. Lose the wall and 63K puts come into play fast. Patience over prediction here 🧊
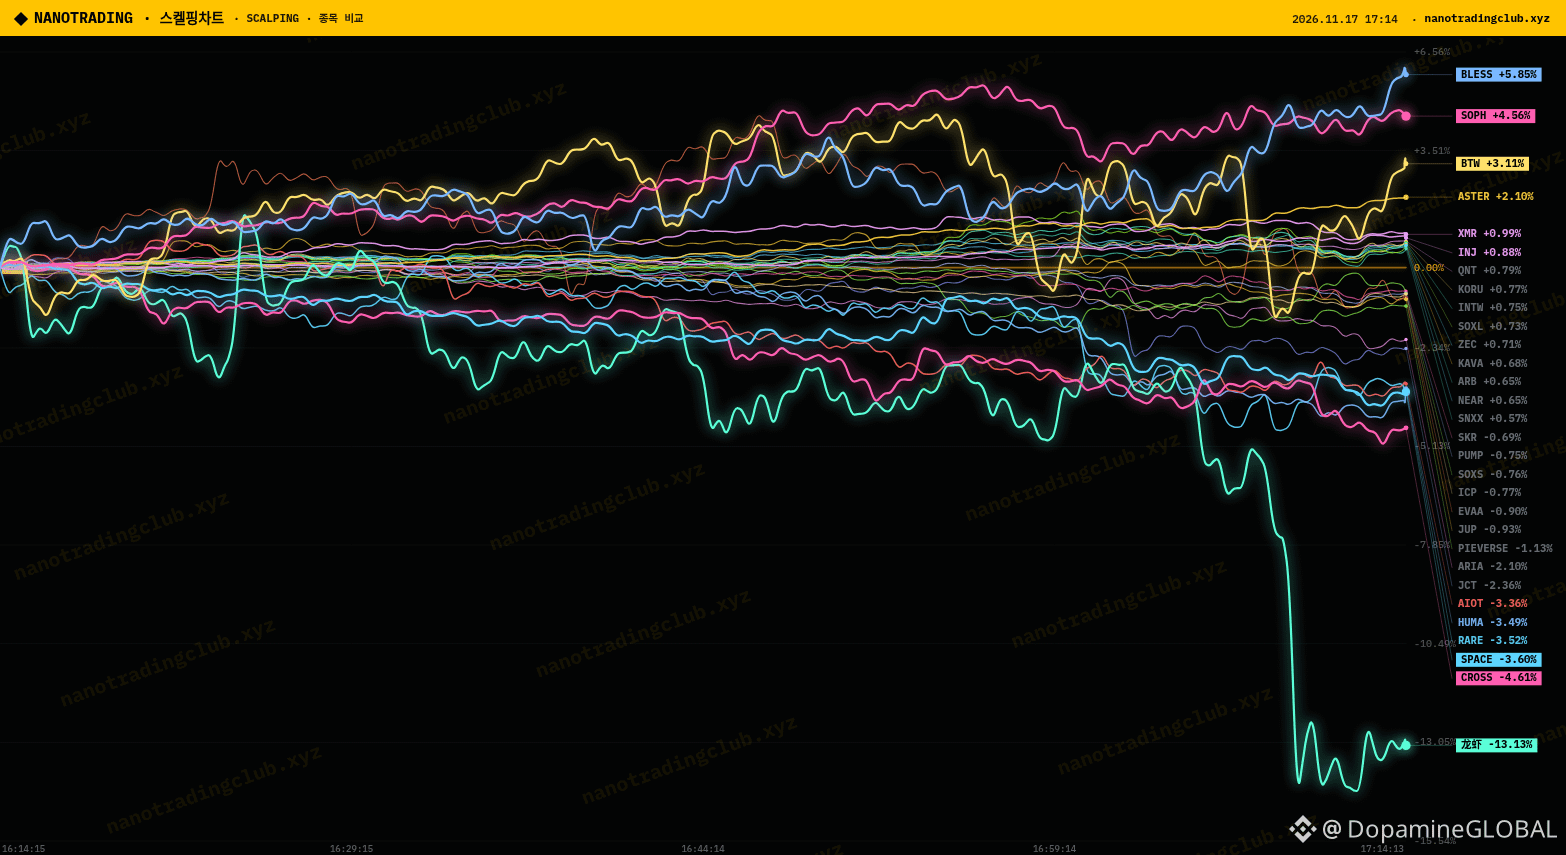
Source: NanoTrading Fire chart (4h liquidity heatmap, 7d view), wall scanner, liquidation radar + scalping chart (nanotradingclub.xyz).
Does that 64K wall actually hold this time, or does it vanish like the last ones?
NFA, just my read.
#BTC #Bitcoin #NanoTrading #CryptoMarket
$BTC is stuck around 64.5K again, barely moving on the day while the 7d chart shows how far we've come off the 120K+ top. Zooming out like that makes this range feel a lot less random.
The thing I'm watching most is the bid. NanoTrading's wall scanner has a BTC buy wall at 64,021 worth about $37.6M, less than 1% below price. Its history isn't super clean though: out of 11 past reactions, price broke upward 2 times and got defended then reversed 2 times, and the earlier big walls from the last few days all vanished. So I'm not treating it as a floor, just as the first real test.
Liquidation radar is lopsided. Biggest short cluster I could find sits up at 67,777 (about $71M), while the big long cluster is way down near 51,927 (about $27M). The options panel on the same page shows max pain at 75,000 for the 27 Nov expiry, with most put OI at 63,000 and net gamma negative. Market mood is still awful, Fear & Greed 12 and 138 coins red vs 112 green.
My plan: hold 64K and I think $BTC can grind toward that 67.7K short pocket. Lose the wall and 63K puts come into play fast. Patience over prediction here 🧊
Source: NanoTrading Fire chart (4h liquidity heatmap, 7d view), wall scanner, liquidation radar + scalping chart (nanotradingclub.xyz).
Does that 64K wall actually hold this time, or does it vanish like the last ones?
NFA, just my read.
#BTC #Bitcoin #NanoTrading #CryptoMarket
The thing I'm watching most is the bid. NanoTrading's wall scanner has a BTC buy wall at 64,021 worth about $37.6M, less than 1% below price. Its history isn't super clean though: out of 11 past reactions, price broke upward 2 times and got defended then reversed 2 times, and the earlier big walls from the last few days all vanished. So I'm not treating it as a floor, just as the first real test.
Liquidation radar is lopsided. Biggest short cluster I could find sits up at 67,777 (about $71M), while the big long cluster is way down near 51,927 (about $27M). The options panel on the same page shows max pain at 75,000 for the 27 Nov expiry, with most put OI at 63,000 and net gamma negative. Market mood is still awful, Fear & Greed 12 and 138 coins red vs 112 green.
My plan: hold 64K and I think $BTC can grind toward that 67.7K short pocket. Lose the wall and 63K puts come into play fast. Patience over prediction here 🧊
Source: NanoTrading Fire chart (4h liquidity heatmap, 7d view), wall scanner, liquidation radar + scalping chart (nanotradingclub.xyz).
Does that 64K wall actually hold this time, or does it vanish like the last ones?
NFA, just my read.
#BTC #Bitcoin #NanoTrading #CryptoMarket
16
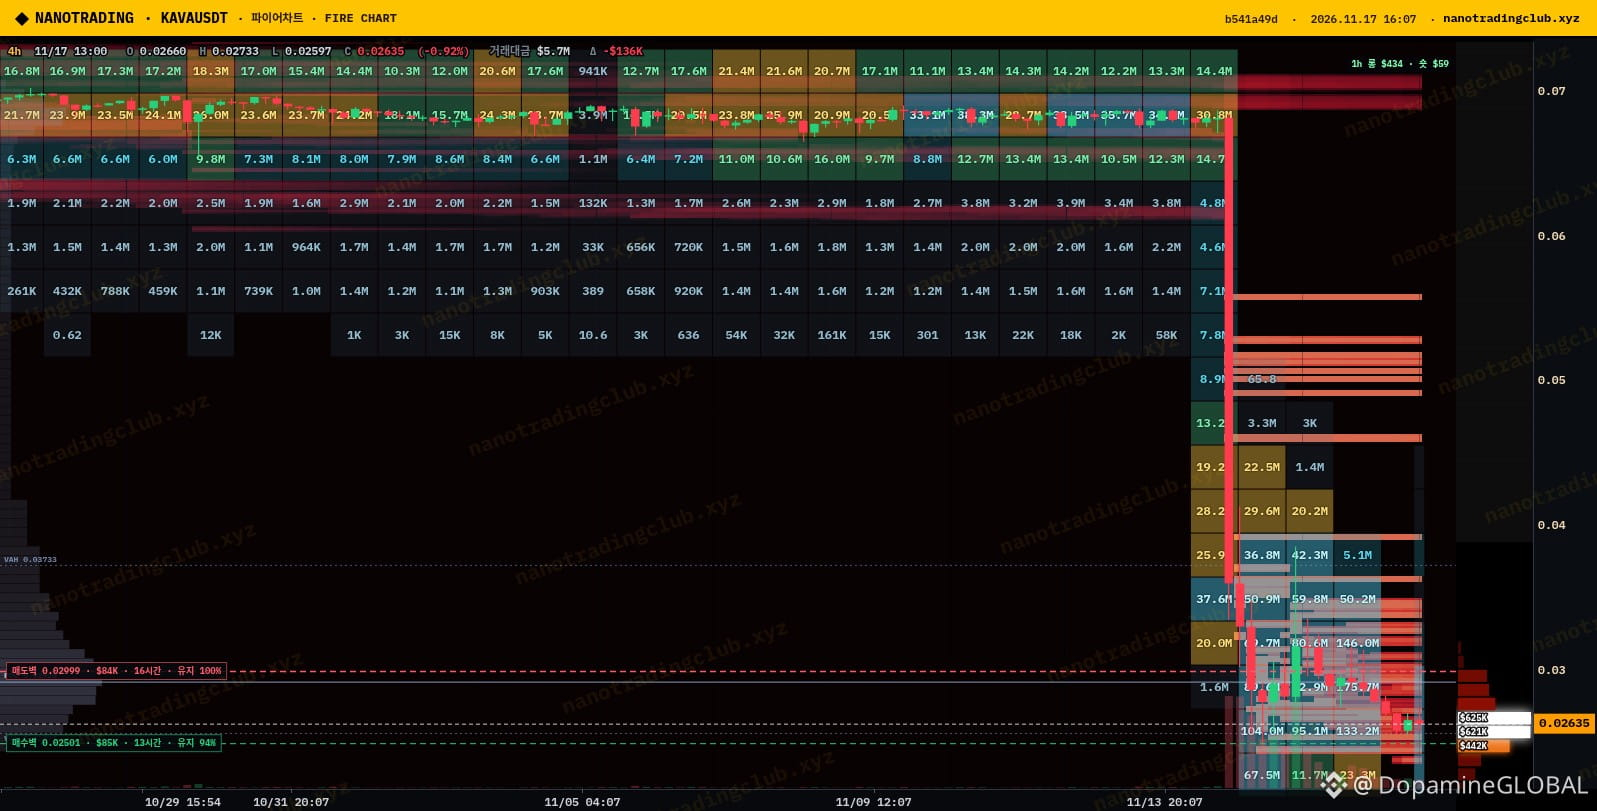
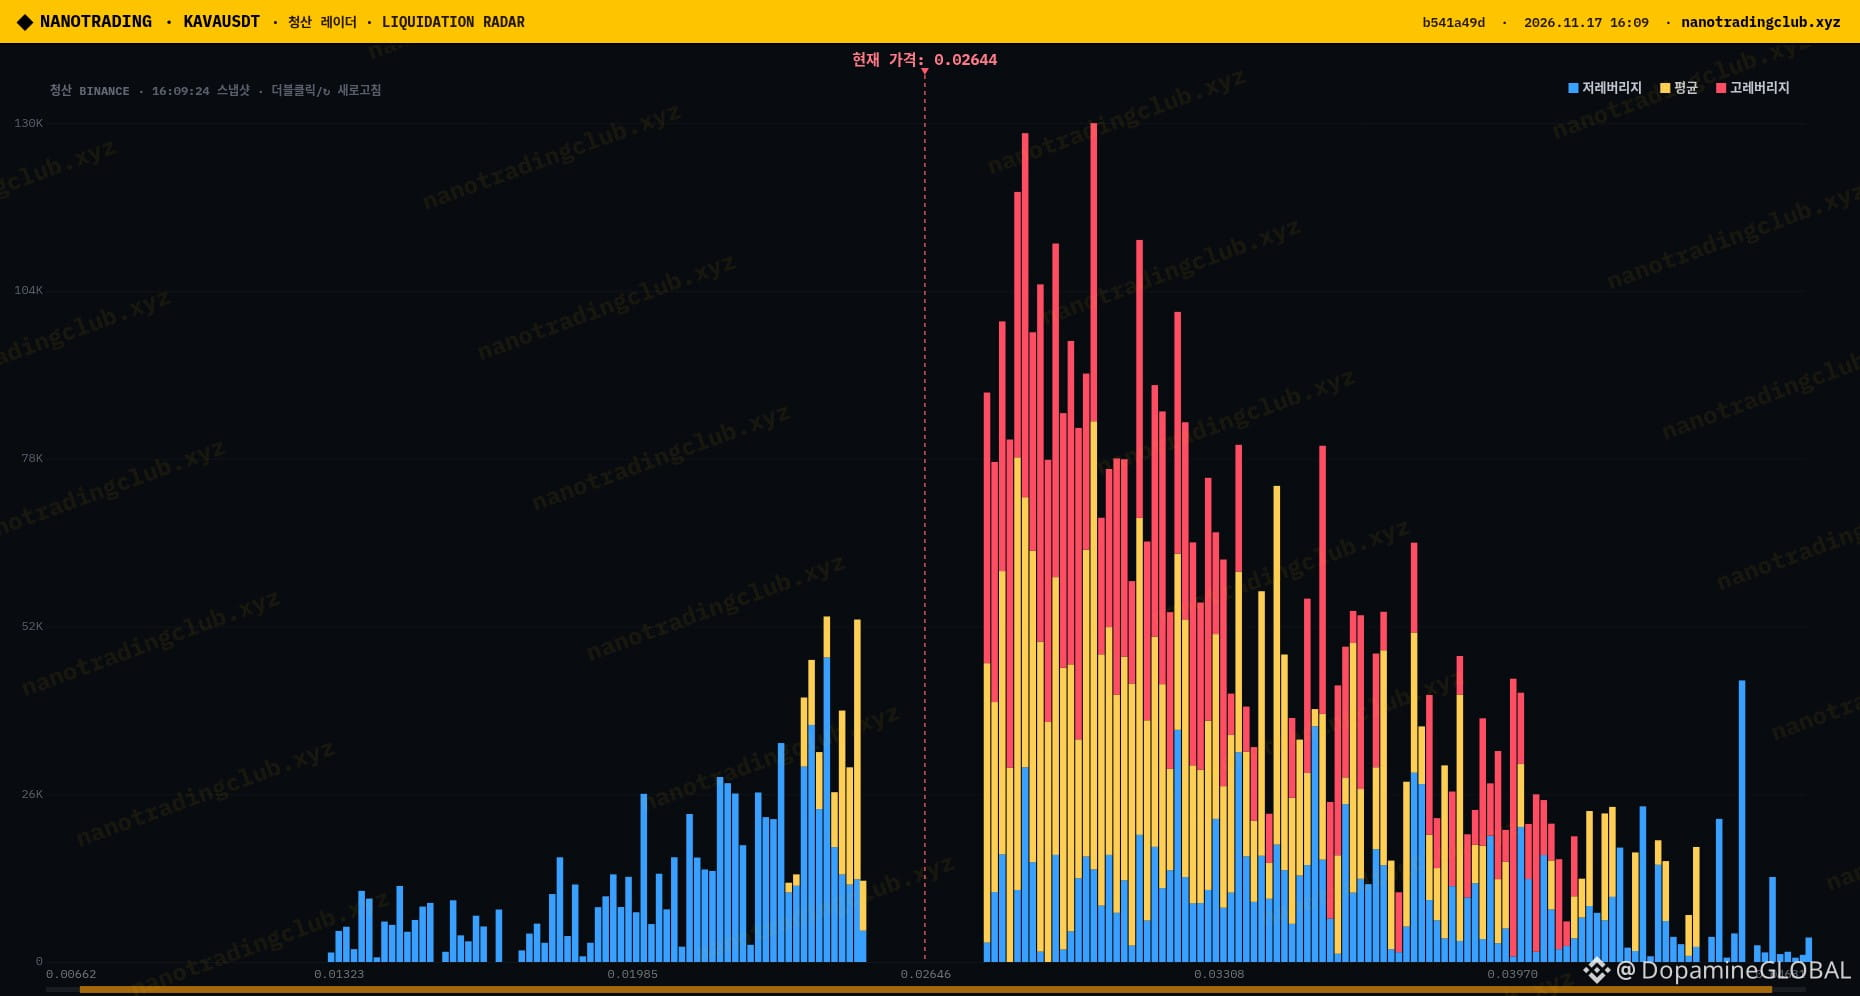
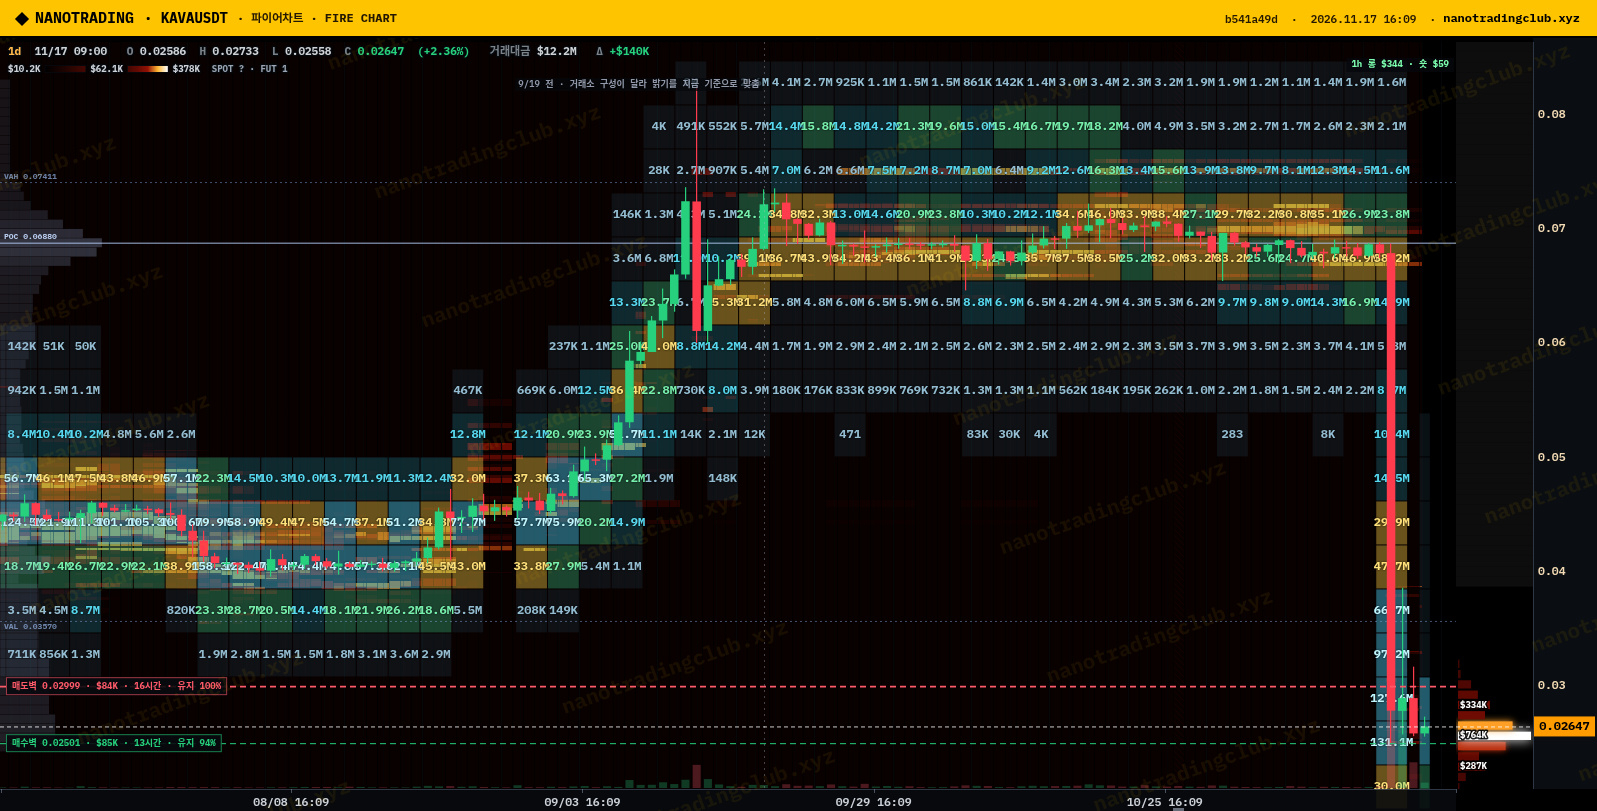
$KAVA popped up on NanoTrading's news scanner with a sharp drop flag this afternoon, and after the crazy wick toward 0.07 a few days ago I wanted to see where it actually settled. Answer: around 0.0263-0.0265, boxed between two walls that have been sitting there for half a day.
The 4h Fire chart shows them clearly. A sell wall at 0.02999 (about $84K, held for 14h) and a buy wall at 0.02501 (about $85K, held for 13h). Price is basically in the middle of that range, while the 1d integrated orderbook view shows how thin things get above once you leave it.
The liquidation radar leans short above: roughly $41K of short liquidations near 0.02882 and $47K near 0.02972, right under that sell wall. Below, the visible long stack is smaller, about $14K at 0.02521, just above the buy wall. Whole market is still heavy, 136 coins down vs 114 up and Fear & Greed at 12.
My read: $KAVA is a range trade until one of those walls goes. A push into 0.0288-0.0297 could squeeze those shorts into the 0.030 wall, while losing 0.0250 opens it up below. Small size only, this thing moves fast ⚡
Source: NanoTrading Fire chart (4h liquidation heatmap, 1d integrated orderbook) + liquidation radar (nanotradingclub.xyz).
Do you think that 0.030 wall gets tested first, or the 0.025 one?
NFA, just my read.
#KAVA #Altcoins #NanoTrading #CryptoTrading
$KAVA popped up on NanoTrading's news scanner with a sharp drop flag this afternoon, and after the crazy wick toward 0.07 a few days ago I wanted to see where it actually settled. Answer: around 0.0263-0.0265, boxed between two walls that have been sitting there for half a day.
The 4h Fire chart shows them clearly. A sell wall at 0.02999 (about $84K, held for 14h) and a buy wall at 0.02501 (about $85K, held for 13h). Price is basically in the middle of that range, while the 1d integrated orderbook view shows how thin things get above once you leave it.
The liquidation radar leans short above: roughly $41K of short liquidations near 0.02882 and $47K near 0.02972, right under that sell wall. Below, the visible long stack is smaller, about $14K at 0.02521, just above the buy wall. Whole market is still heavy, 136 coins down vs 114 up and Fear & Greed at 12.
My read: $KAVA is a range trade until one of those walls goes. A push into 0.0288-0.0297 could squeeze those shorts into the 0.030 wall, while losing 0.0250 opens it up below. Small size only, this thing moves fast ⚡
Source: NanoTrading Fire chart (4h liquidation heatmap, 1d integrated orderbook) + liquidation radar (nanotradingclub.xyz).
Do you think that 0.030 wall gets tested first, or the 0.025 one?
NFA, just my read.
#KAVA #Altcoins #NanoTrading #CryptoTrading
The 4h Fire chart shows them clearly. A sell wall at 0.02999 (about $84K, held for 14h) and a buy wall at 0.02501 (about $85K, held for 13h). Price is basically in the middle of that range, while the 1d integrated orderbook view shows how thin things get above once you leave it.
The liquidation radar leans short above: roughly $41K of short liquidations near 0.02882 and $47K near 0.02972, right under that sell wall. Below, the visible long stack is smaller, about $14K at 0.02521, just above the buy wall. Whole market is still heavy, 136 coins down vs 114 up and Fear & Greed at 12.
My read: $KAVA is a range trade until one of those walls goes. A push into 0.0288-0.0297 could squeeze those shorts into the 0.030 wall, while losing 0.0250 opens it up below. Small size only, this thing moves fast ⚡
Source: NanoTrading Fire chart (4h liquidation heatmap, 1d integrated orderbook) + liquidation radar (nanotradingclub.xyz).
Do you think that 0.030 wall gets tested first, or the 0.025 one?
NFA, just my read.
#KAVA #Altcoins #NanoTrading #CryptoTrading
379
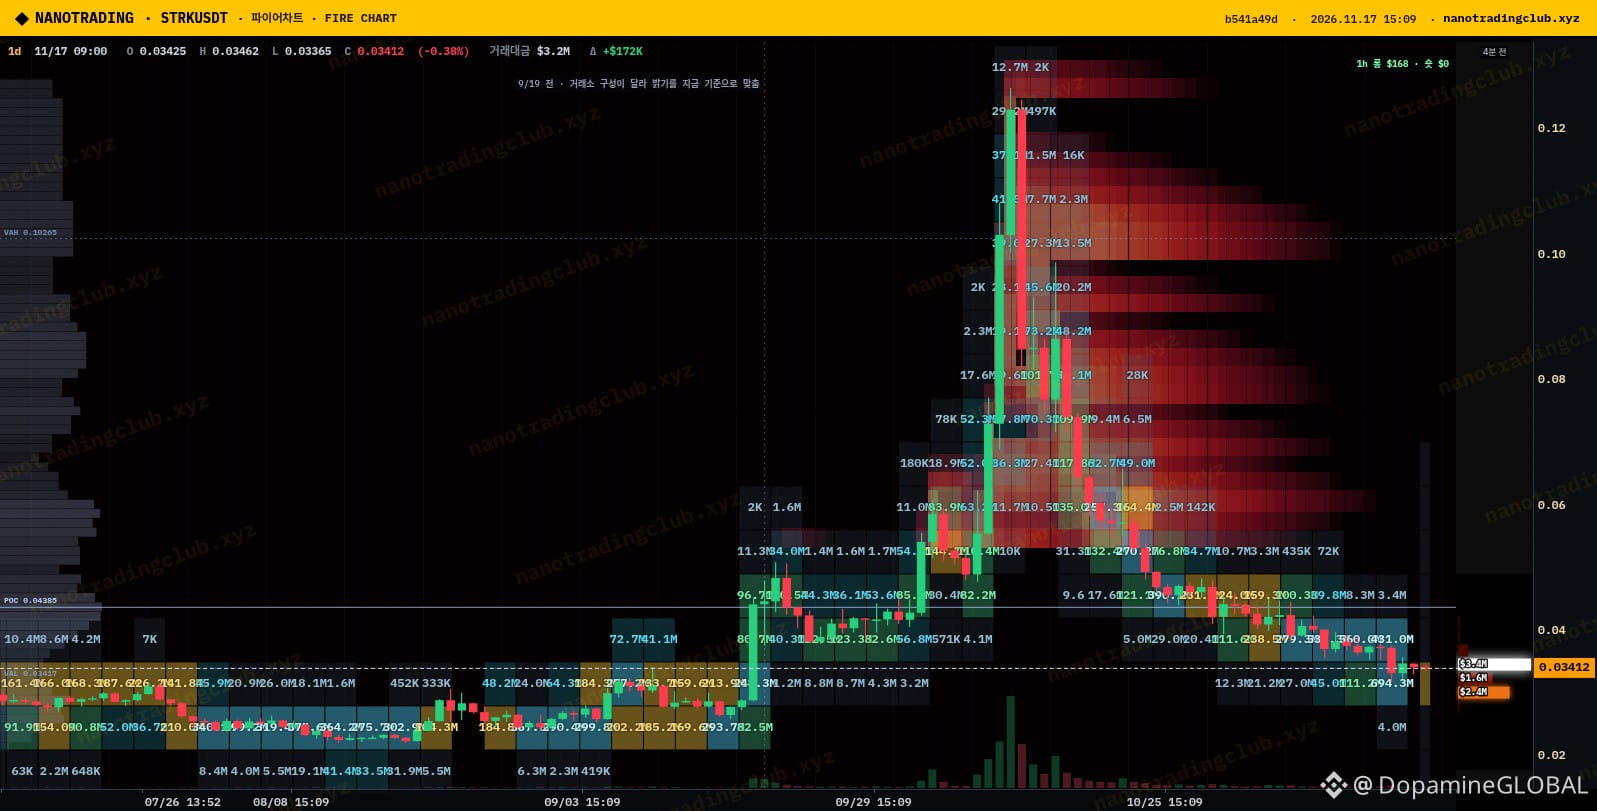
$STRK has quietly bled almost all the way back to where it was before the October spike, sitting around 0.0341 on NanoTrading, and the one thing that jumped out at me today is the bid underneath it.
NanoTrading's Fire wall scanner has STRK ranked first for buy walls: about $2.28M resting at 0.0310 (confidence 75), roughly 9% below price, against around $15M in 24h volume. There's no matching sell wall flagged above. The 1d liquidity heatmap shows why that zone matters, since 0.03-0.034 is the same area it based in for months before the run toward 0.12.
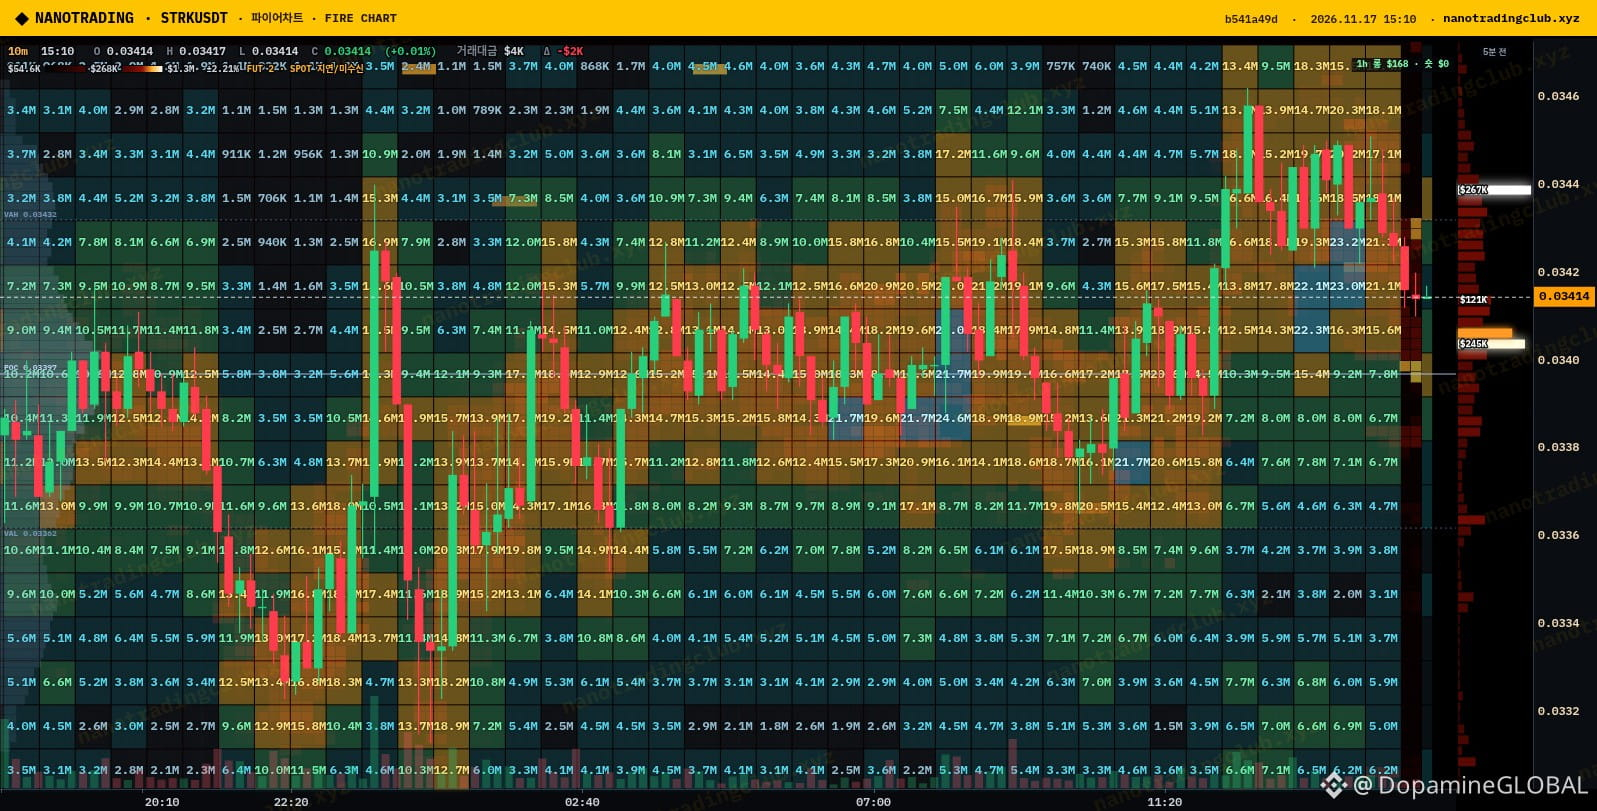
On the 10m liquidation heatmap and radar, the high-leverage stacks sit just above price, with lighter clusters below. Market overall is flat, 123 up vs 126 down on the scanner, Fear & Greed still 12, so nobody is chasing anything right now.
My plan: I'm not buying here, I'd rather see if $STRK wicks into the 0.031 area and that wall actually holds. If it gets pulled or price slices through it, I'm out of the idea. A squeeze into the shorts above is the bonus scenario 🧱
Source: NanoTrading Fire chart (1d liquidity heatmap, 10m liquidation heatmap), wall scanner + scalping chart (nanotradingclub.xyz).
Would you trust a $2M bid wall in this kind of market, or do you assume it gets pulled?
NFA, just my read.
#STRK #Starknet #NanoTrading #Altcoins
$STRK has quietly bled almost all the way back to where it was before the October spike, sitting around 0.0341 on NanoTrading, and the one thing that jumped out at me today is the bid underneath it.
NanoTrading's Fire wall scanner has STRK ranked first for buy walls: about $2.28M resting at 0.0310 (confidence 75), roughly 9% below price, against around $15M in 24h volume. There's no matching sell wall flagged above. The 1d liquidity heatmap shows why that zone matters, since 0.03-0.034 is the same area it based in for months before the run toward 0.12.
On the 10m liquidation heatmap and radar, the high-leverage stacks sit just above price, with lighter clusters below. Market overall is flat, 123 up vs 126 down on the scanner, Fear & Greed still 12, so nobody is chasing anything right now.
My plan: I'm not buying here, I'd rather see if $STRK wicks into the 0.031 area and that wall actually holds. If it gets pulled or price slices through it, I'm out of the idea. A squeeze into the shorts above is the bonus scenario 🧱
Source: NanoTrading Fire chart (1d liquidity heatmap, 10m liquidation heatmap), wall scanner + scalping chart (nanotradingclub.xyz).
Would you trust a $2M bid wall in this kind of market, or do you assume it gets pulled?
NFA, just my read.
#STRK #Starknet #NanoTrading #Altcoins
NanoTrading's Fire wall scanner has STRK ranked first for buy walls: about $2.28M resting at 0.0310 (confidence 75), roughly 9% below price, against around $15M in 24h volume. There's no matching sell wall flagged above. The 1d liquidity heatmap shows why that zone matters, since 0.03-0.034 is the same area it based in for months before the run toward 0.12.
On the 10m liquidation heatmap and radar, the high-leverage stacks sit just above price, with lighter clusters below. Market overall is flat, 123 up vs 126 down on the scanner, Fear & Greed still 12, so nobody is chasing anything right now.
My plan: I'm not buying here, I'd rather see if $STRK wicks into the 0.031 area and that wall actually holds. If it gets pulled or price slices through it, I'm out of the idea. A squeeze into the shorts above is the bonus scenario 🧱
Source: NanoTrading Fire chart (1d liquidity heatmap, 10m liquidation heatmap), wall scanner + scalping chart (nanotradingclub.xyz).
Would you trust a $2M bid wall in this kind of market, or do you assume it gets pulled?
NFA, just my read.
#STRK #Starknet #NanoTrading #Altcoins
2
134
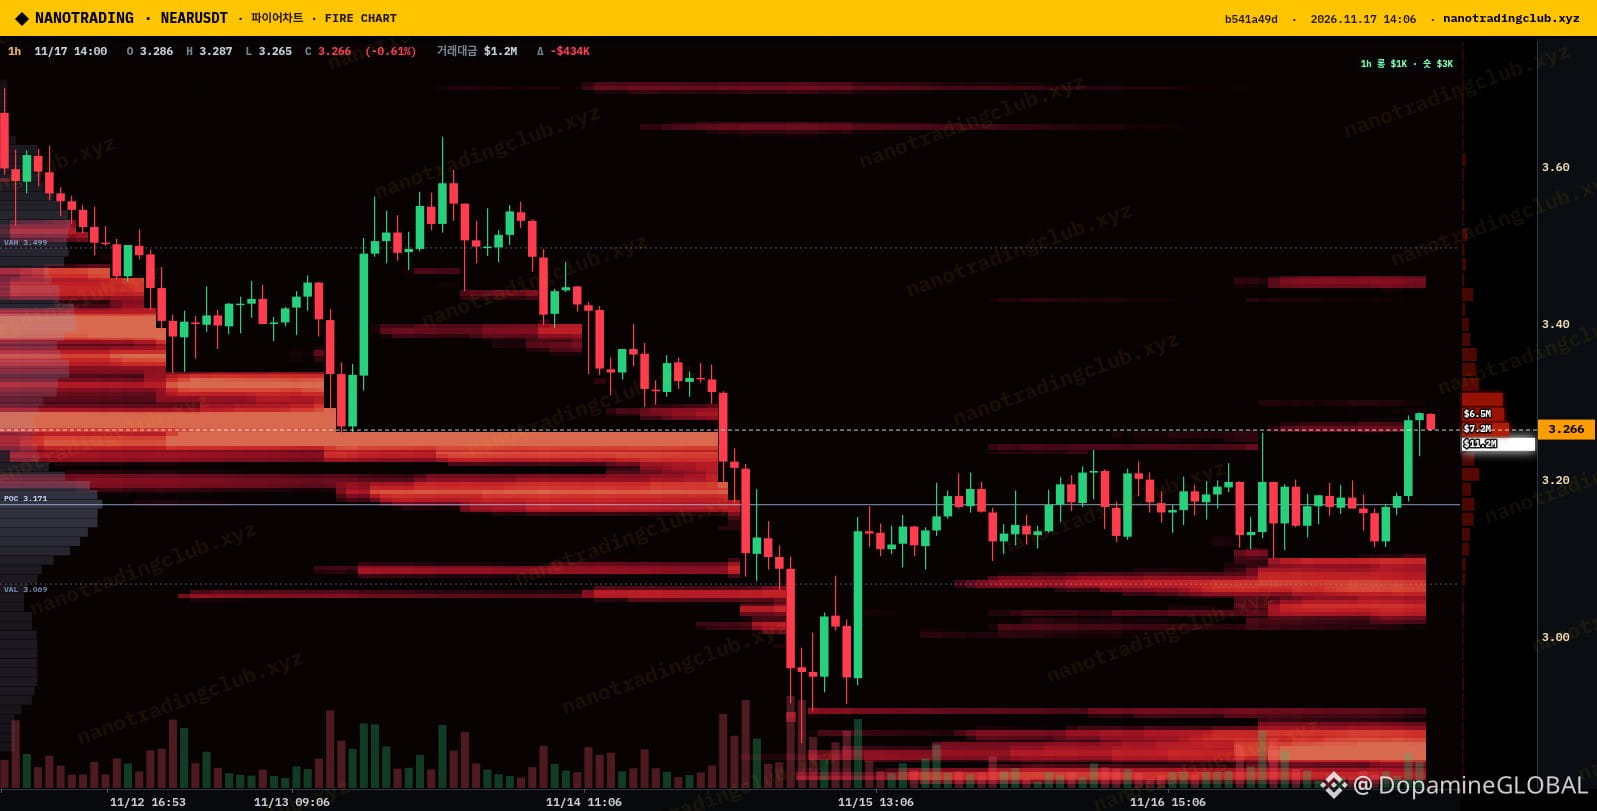
$NEAR finally popped out of the range it chopped in for most of the last two days, up about 3.4% near 3.27 on NanoTrading, while the scanner still shows more coins down than up (135 vs 115) and Fear & Greed sitting at 12.
The 1h liquidation heatmap tells the story. Price sat on a dense band around 3.17-3.20 (POC 3.171) and has now pushed into the 3.27 area. The heaviest liquidation bands are below, around 3.05-3.10 and again near 2.80-2.90, while above price it thins out, with lighter bands around 3.45 and 3.60.
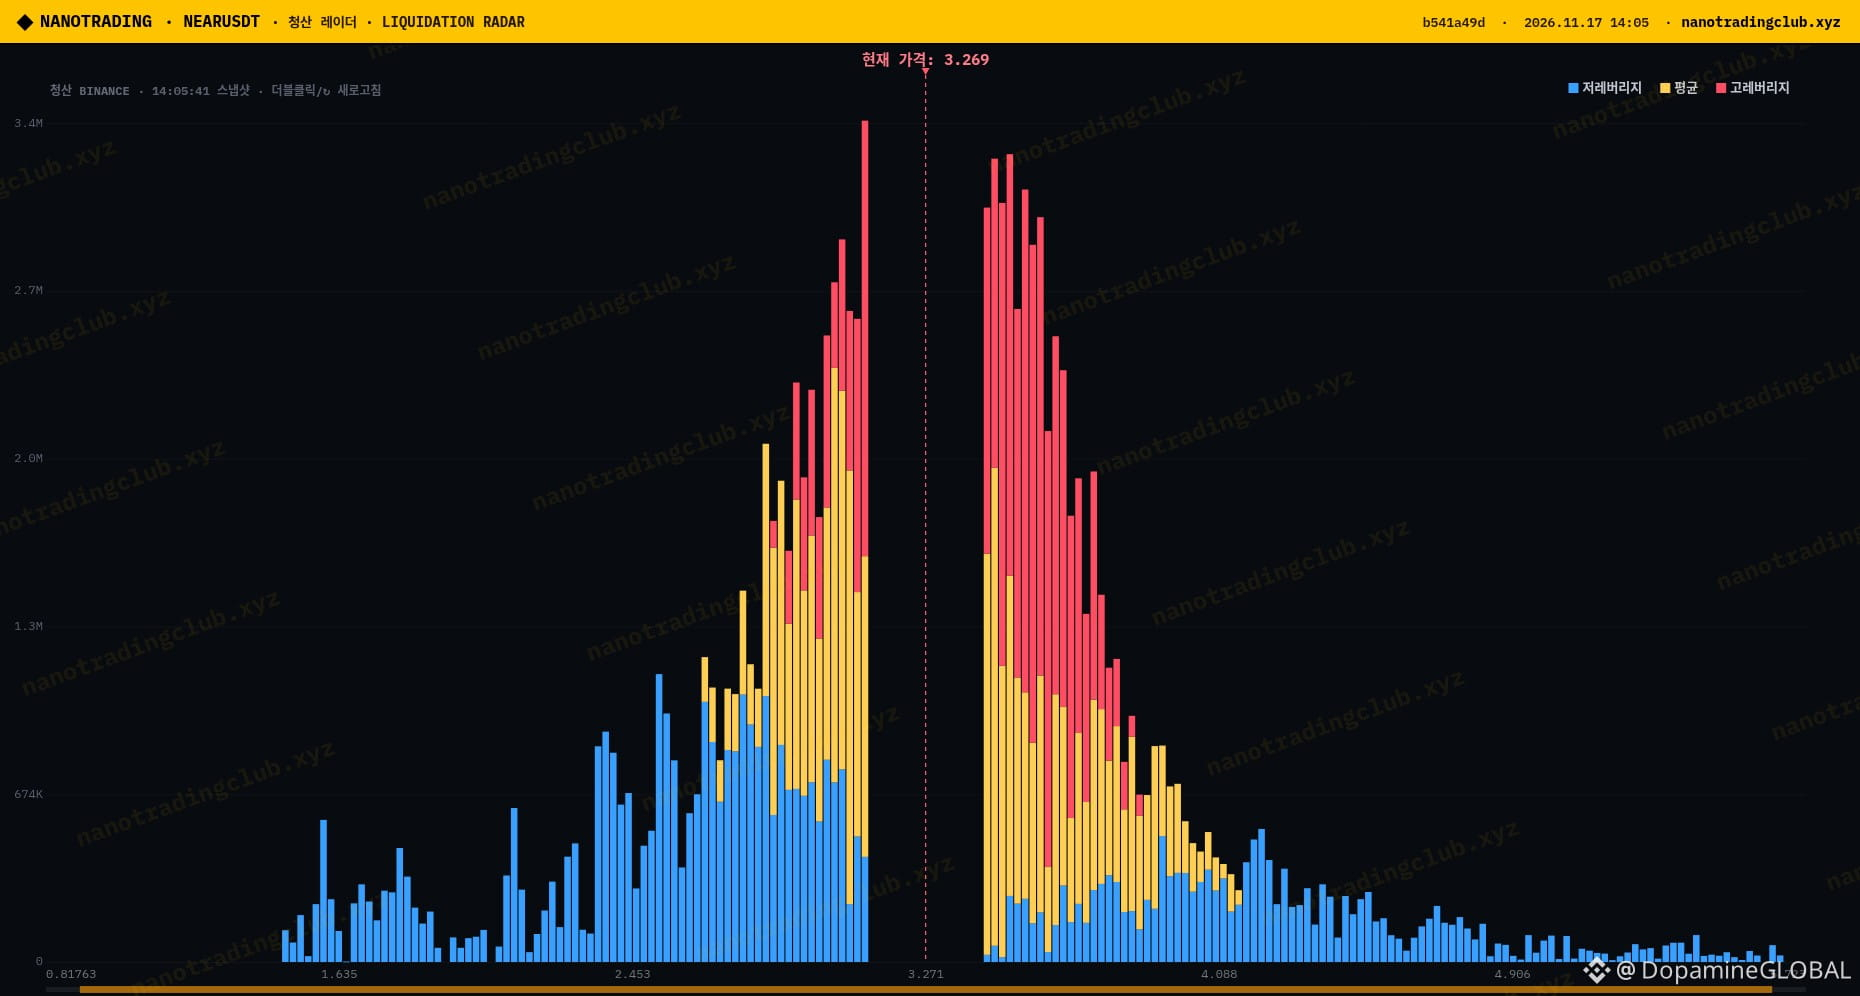
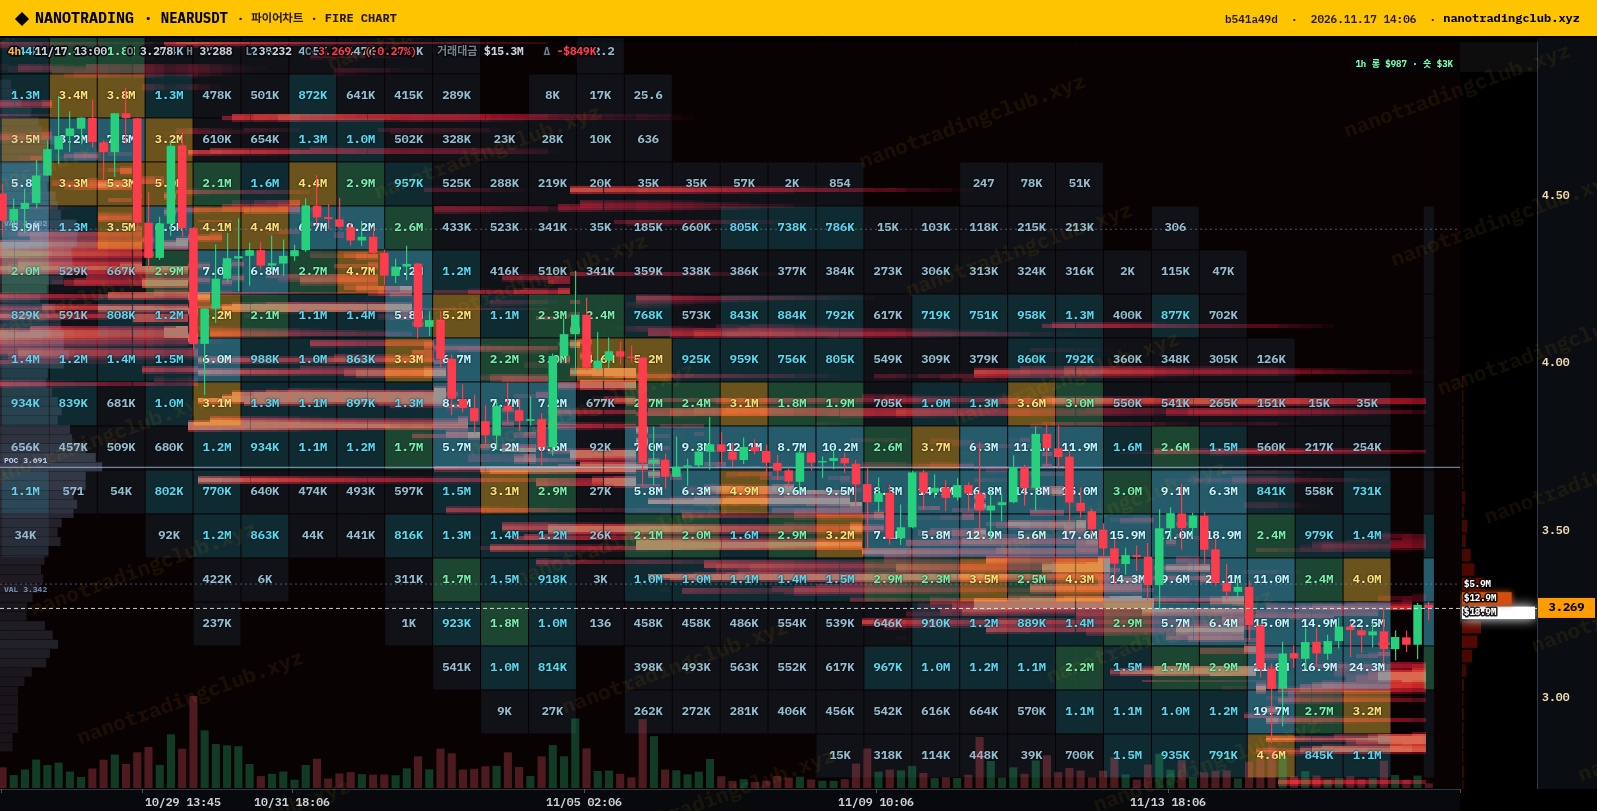
The liquidation radar lines up with that: the tallest stacks sit right around price on both sides, mostly high leverage, so this zone can get messy fast. The 4h integrated orderbook view shows the bigger picture, with older resting liquidity much higher up toward 4.0+.
My plan: if $NEAR holds above 3.20 on pullbacks, I like a drift toward 3.45 and maybe 3.60 where the next bands are. Lose 3.17 and I think it gets dragged back to the 3.05-3.10 longs. Not chasing the green candle here 👀
Source: NanoTrading Fire chart (1h liquidation heatmap, 4h integrated orderbook) + liquidation radar (nanotradingclub.xyz).
Is this a real breakout for $NEAR or just an extreme-fear bounce?
NFA, just my read.
#NEAR #Altcoins #NanoTrading #CryptoTrading
$NEAR finally popped out of the range it chopped in for most of the last two days, up about 3.4% near 3.27 on NanoTrading, while the scanner still shows more coins down than up (135 vs 115) and Fear & Greed sitting at 12.
The 1h liquidation heatmap tells the story. Price sat on a dense band around 3.17-3.20 (POC 3.171) and has now pushed into the 3.27 area. The heaviest liquidation bands are below, around 3.05-3.10 and again near 2.80-2.90, while above price it thins out, with lighter bands around 3.45 and 3.60.
The liquidation radar lines up with that: the tallest stacks sit right around price on both sides, mostly high leverage, so this zone can get messy fast. The 4h integrated orderbook view shows the bigger picture, with older resting liquidity much higher up toward 4.0+.
My plan: if $NEAR holds above 3.20 on pullbacks, I like a drift toward 3.45 and maybe 3.60 where the next bands are. Lose 3.17 and I think it gets dragged back to the 3.05-3.10 longs. Not chasing the green candle here 👀
Source: NanoTrading Fire chart (1h liquidation heatmap, 4h integrated orderbook) + liquidation radar (nanotradingclub.xyz).
Is this a real breakout for $NEAR or just an extreme-fear bounce?
NFA, just my read.
#NEAR #Altcoins #NanoTrading #CryptoTrading
The 1h liquidation heatmap tells the story. Price sat on a dense band around 3.17-3.20 (POC 3.171) and has now pushed into the 3.27 area. The heaviest liquidation bands are below, around 3.05-3.10 and again near 2.80-2.90, while above price it thins out, with lighter bands around 3.45 and 3.60.
The liquidation radar lines up with that: the tallest stacks sit right around price on both sides, mostly high leverage, so this zone can get messy fast. The 4h integrated orderbook view shows the bigger picture, with older resting liquidity much higher up toward 4.0+.
My plan: if $NEAR holds above 3.20 on pullbacks, I like a drift toward 3.45 and maybe 3.60 where the next bands are. Lose 3.17 and I think it gets dragged back to the 3.05-3.10 longs. Not chasing the green candle here 👀
Source: NanoTrading Fire chart (1h liquidation heatmap, 4h integrated orderbook) + liquidation radar (nanotradingclub.xyz).
Is this a real breakout for $NEAR or just an extreme-fear bounce?
NFA, just my read.
#NEAR #Altcoins #NanoTrading #CryptoTrading
49
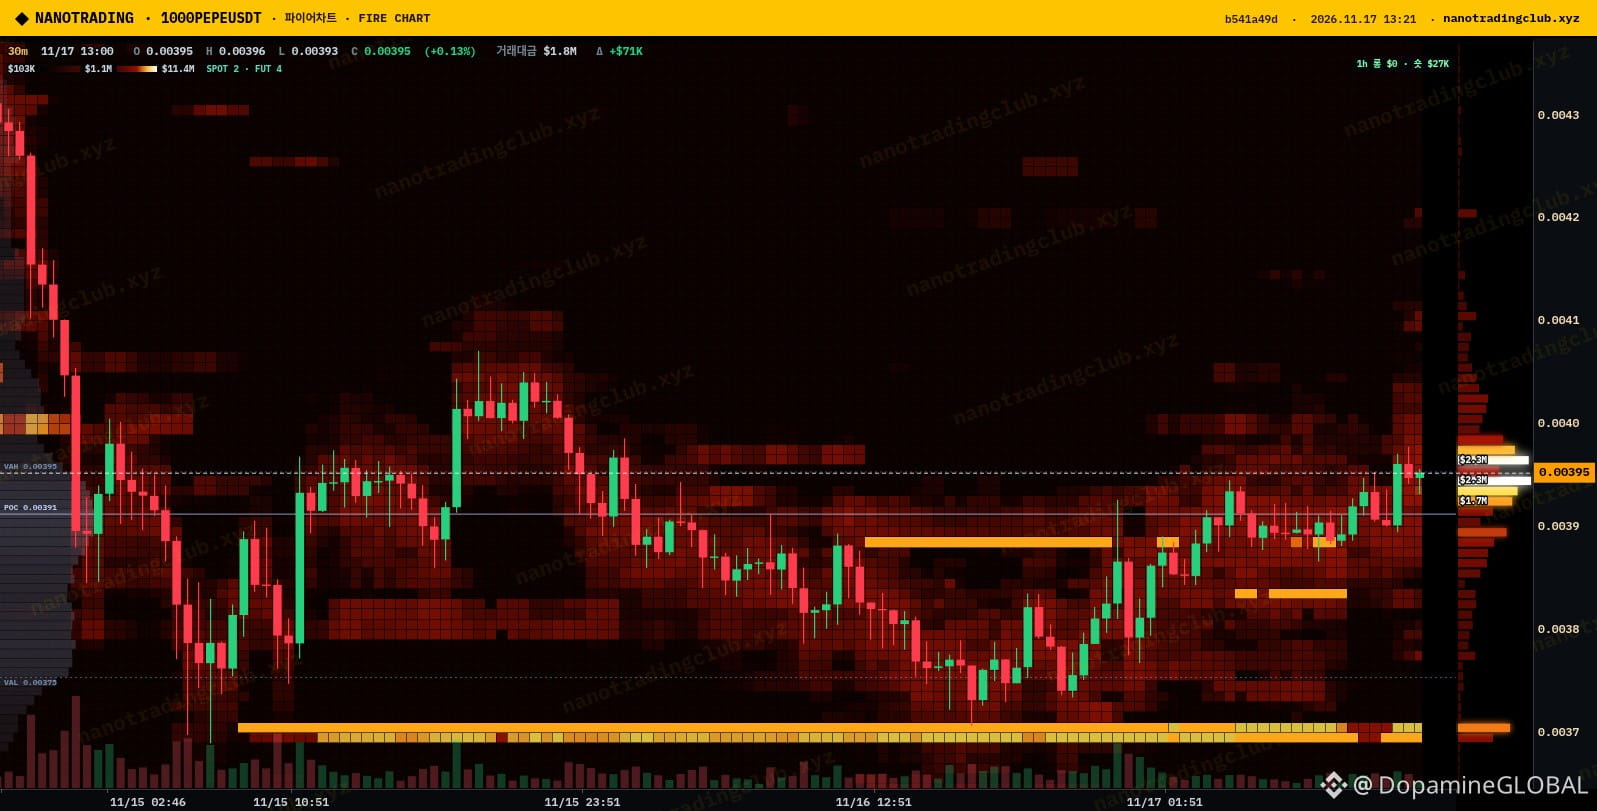
$PEPE is one of the few memes actually green today, with the 1000PEPE perp up around 3.5% near 0.00395 on NanoTrading, while the scanner still shows 154 coins down vs 96 up and Fear & Greed at 12.
The 30m liquidity heatmap is where it gets interesting. There's a wall around 0.00401 (about $116K) right above price, and the move has been stalling just under it. Below, the visible support wall sits much lower at about 0.00370.
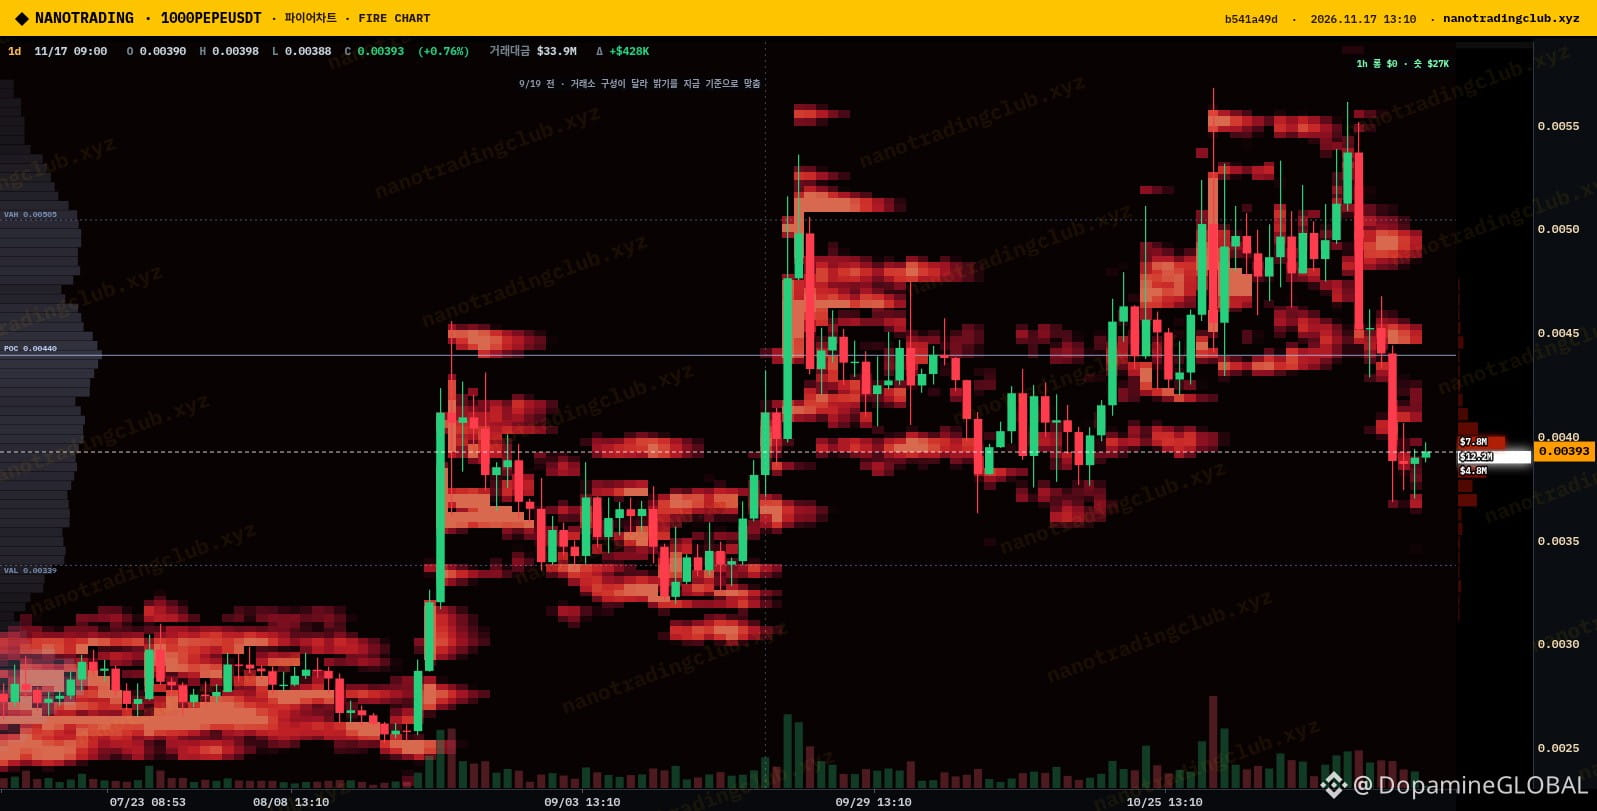
The liquidation radar is pretty balanced up close. Long stacks at 0.00389, 0.00384 and 0.00377 (each about $540-550K) sit right under price. On the short side, the bigger stacks start at 0.00426 (about $648K), then 0.00449 and 0.00458. The 1d liquidation heatmap shows this whole area as the middle of a much wider 0.0025-0.0055 range, so there's room both ways.
My plan: clean break and hold above 0.00401 and I'm looking at the 0.00426 shorts. Fail there and lose 0.00389, and those longs are probably next, so I'd wait for 0.00377. Meme strength in an extreme-fear market can flip fast 🐸
Source: NanoTrading Fire chart 1d liquidation heatmap + 30m liquidity heatmap, and liquidation radar (nanotradingclub.xyz).
Is $PEPE leading a meme bounce here, or is this just a one-day pop?
NFA, just my read.
#PEPE #Memecoins #NanoTrading #Altcoins
$PEPE is one of the few memes actually green today, with the 1000PEPE perp up around 3.5% near 0.00395 on NanoTrading, while the scanner still shows 154 coins down vs 96 up and Fear & Greed at 12.
The 30m liquidity heatmap is where it gets interesting. There's a wall around 0.00401 (about $116K) right above price, and the move has been stalling just under it. Below, the visible support wall sits much lower at about 0.00370.
The liquidation radar is pretty balanced up close. Long stacks at 0.00389, 0.00384 and 0.00377 (each about $540-550K) sit right under price. On the short side, the bigger stacks start at 0.00426 (about $648K), then 0.00449 and 0.00458. The 1d liquidation heatmap shows this whole area as the middle of a much wider 0.0025-0.0055 range, so there's room both ways.
My plan: clean break and hold above 0.00401 and I'm looking at the 0.00426 shorts. Fail there and lose 0.00389, and those longs are probably next, so I'd wait for 0.00377. Meme strength in an extreme-fear market can flip fast 🐸
Source: NanoTrading Fire chart 1d liquidation heatmap + 30m liquidity heatmap, and liquidation radar (nanotradingclub.xyz).
Is $PEPE leading a meme bounce here, or is this just a one-day pop?
NFA, just my read.
#PEPE #Memecoins #NanoTrading #Altcoins
The 30m liquidity heatmap is where it gets interesting. There's a wall around 0.00401 (about $116K) right above price, and the move has been stalling just under it. Below, the visible support wall sits much lower at about 0.00370.
The liquidation radar is pretty balanced up close. Long stacks at 0.00389, 0.00384 and 0.00377 (each about $540-550K) sit right under price. On the short side, the bigger stacks start at 0.00426 (about $648K), then 0.00449 and 0.00458. The 1d liquidation heatmap shows this whole area as the middle of a much wider 0.0025-0.0055 range, so there's room both ways.
My plan: clean break and hold above 0.00401 and I'm looking at the 0.00426 shorts. Fail there and lose 0.00389, and those longs are probably next, so I'd wait for 0.00377. Meme strength in an extreme-fear market can flip fast 🐸
Source: NanoTrading Fire chart 1d liquidation heatmap + 30m liquidity heatmap, and liquidation radar (nanotradingclub.xyz).
Is $PEPE leading a meme bounce here, or is this just a one-day pop?
NFA, just my read.
#PEPE #Memecoins #NanoTrading #Altcoins
360
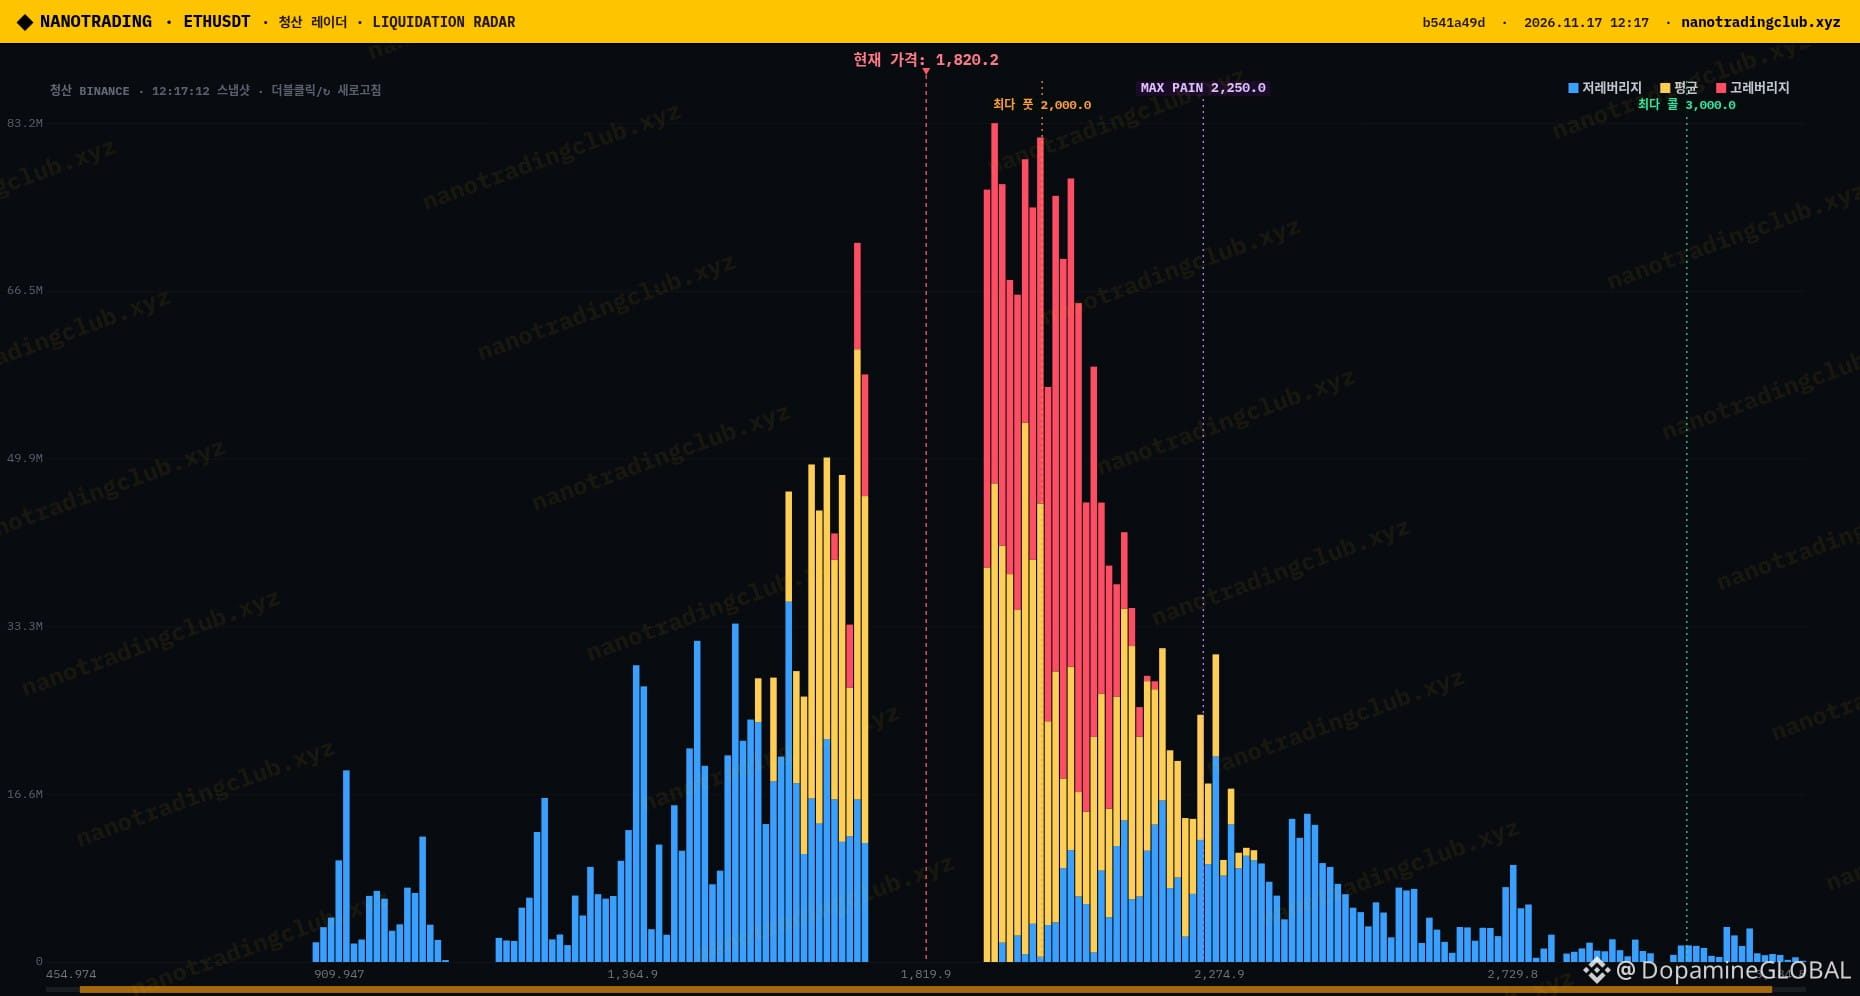
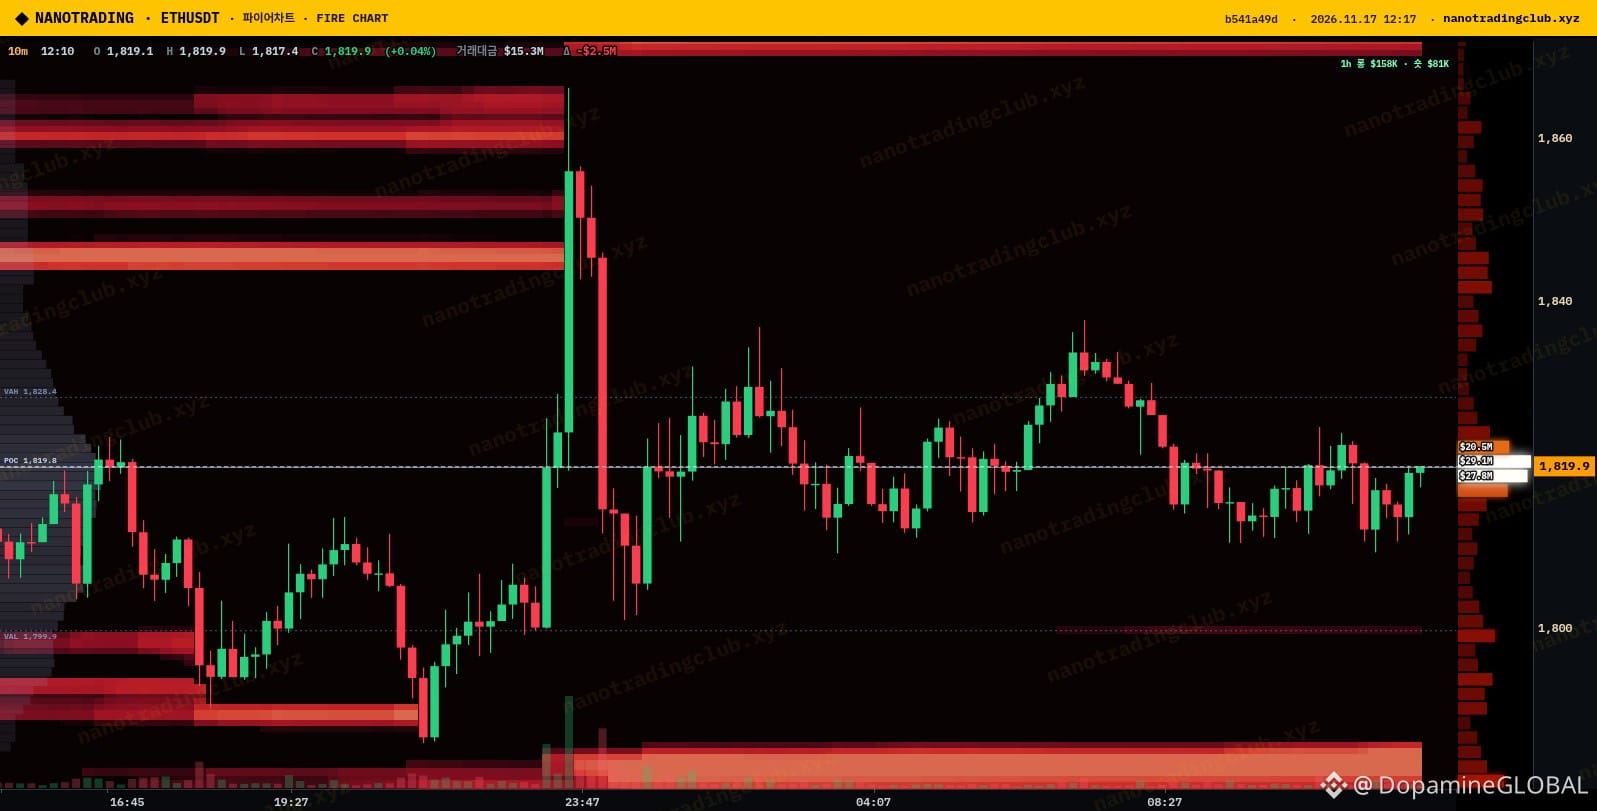
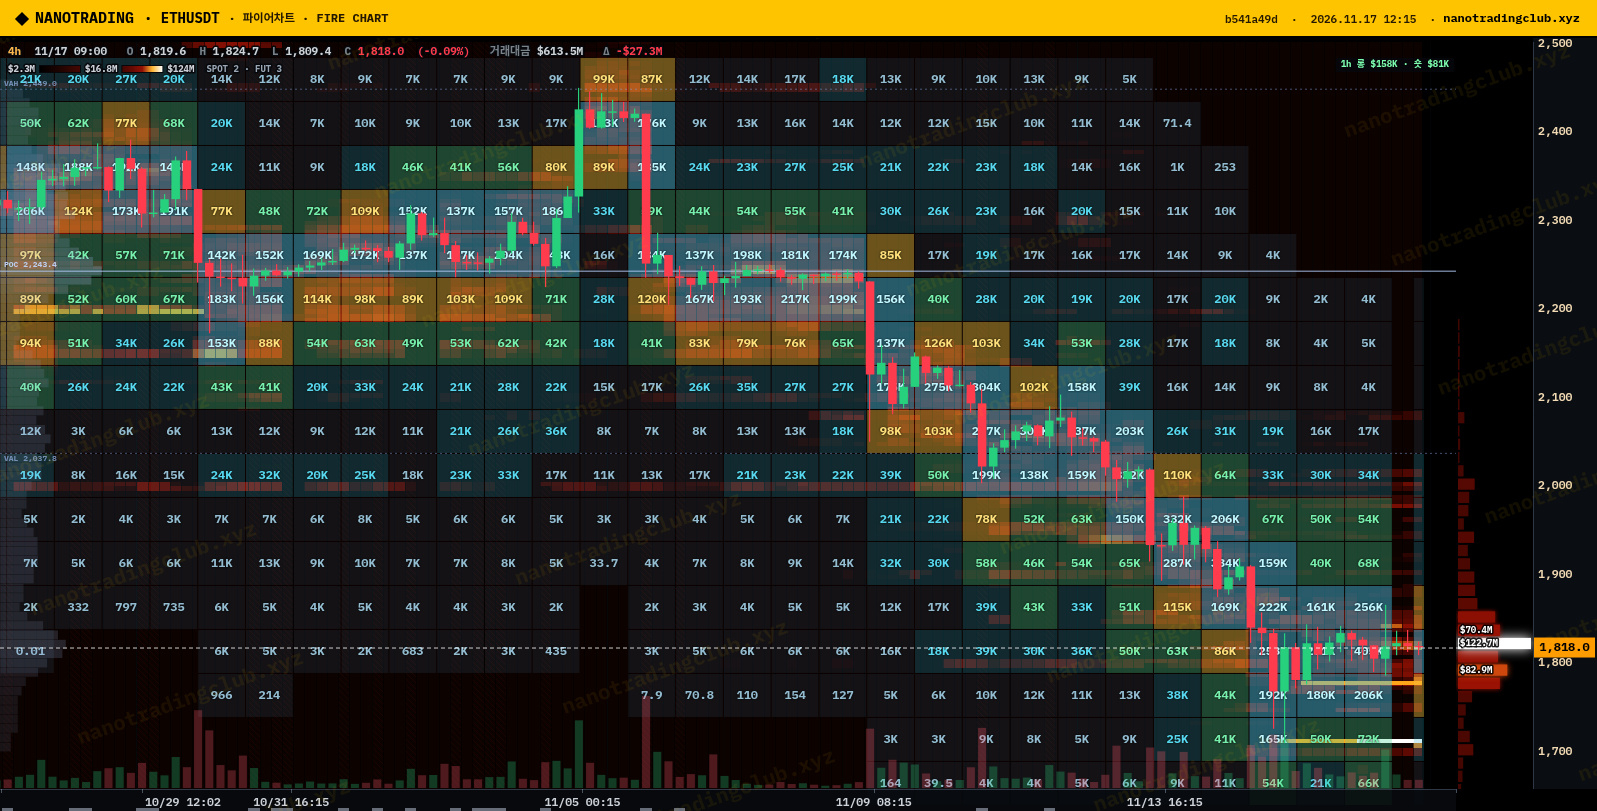
$ETH has been stuck around 1,820 all morning, and after that drop from about 2,400 the 4h chart is just a tight box at 1,800-1,830. Boring candles, but the liquidation radar says it won't stay boring for long.
On NanoTrading's radar the big long stacks sit around 1,715-1,725 (one bucket at 1,714.7 showed about $36.5M, another at 1,724 about $28.6M). Above, the shorts are even fatter around 1,920-1,930, with one bucket at 1,922.6 showing about $46.6M. That's roughly 5% either way from here, a pretty clean magnet setup.
The 10m liquidation heatmap shows the overnight spike to about 1,860 got sold, and since then it's ranged 1,805-1,845 with the POC near 1,820. The radar's options box also has max pain at 2,250 for the 27 Nov expiry, with the biggest put OI at 2,000, which is interesting with price this far below.
My plan: I'm not touching $ETH inside 1,800-1,845. A break above 1,860 and I'm looking at the 1,920s shorts; a daily close under 1,800 and the 1,715-1,725 longs are the likely target. Fear & Greed at 12 says the crowd is leaning bearish, so I'd keep the squeeze in mind 👀
Source: NanoTrading Fire chart 4h integrated orderbook + 10m liquidation heatmap, and NanoTrading liquidation radar (nanotradingclub.xyz).
Which side do you think gets swept first, 1,720 or 1,925?
NFA, just my read.
#ETH #Ethereum #NanoTrading #CryptoMarket
$ETH has been stuck around 1,820 all morning, and after that drop from about 2,400 the 4h chart is just a tight box at 1,800-1,830. Boring candles, but the liquidation radar says it won't stay boring for long.
On NanoTrading's radar the big long stacks sit around 1,715-1,725 (one bucket at 1,714.7 showed about $36.5M, another at 1,724 about $28.6M). Above, the shorts are even fatter around 1,920-1,930, with one bucket at 1,922.6 showing about $46.6M. That's roughly 5% either way from here, a pretty clean magnet setup.
The 10m liquidation heatmap shows the overnight spike to about 1,860 got sold, and since then it's ranged 1,805-1,845 with the POC near 1,820. The radar's options box also has max pain at 2,250 for the 27 Nov expiry, with the biggest put OI at 2,000, which is interesting with price this far below.
My plan: I'm not touching $ETH inside 1,800-1,845. A break above 1,860 and I'm looking at the 1,920s shorts; a daily close under 1,800 and the 1,715-1,725 longs are the likely target. Fear & Greed at 12 says the crowd is leaning bearish, so I'd keep the squeeze in mind 👀
Source: NanoTrading Fire chart 4h integrated orderbook + 10m liquidation heatmap, and NanoTrading liquidation radar (nanotradingclub.xyz).
Which side do you think gets swept first, 1,720 or 1,925?
NFA, just my read.
#ETH #Ethereum #NanoTrading #CryptoMarket
On NanoTrading's radar the big long stacks sit around 1,715-1,725 (one bucket at 1,714.7 showed about $36.5M, another at 1,724 about $28.6M). Above, the shorts are even fatter around 1,920-1,930, with one bucket at 1,922.6 showing about $46.6M. That's roughly 5% either way from here, a pretty clean magnet setup.
The 10m liquidation heatmap shows the overnight spike to about 1,860 got sold, and since then it's ranged 1,805-1,845 with the POC near 1,820. The radar's options box also has max pain at 2,250 for the 27 Nov expiry, with the biggest put OI at 2,000, which is interesting with price this far below.
My plan: I'm not touching $ETH inside 1,800-1,845. A break above 1,860 and I'm looking at the 1,920s shorts; a daily close under 1,800 and the 1,715-1,725 longs are the likely target. Fear & Greed at 12 says the crowd is leaning bearish, so I'd keep the squeeze in mind 👀
Source: NanoTrading Fire chart 4h integrated orderbook + 10m liquidation heatmap, and NanoTrading liquidation radar (nanotradingclub.xyz).
Which side do you think gets swept first, 1,720 or 1,925?
NFA, just my read.
#ETH #Ethereum #NanoTrading #CryptoMarket
123
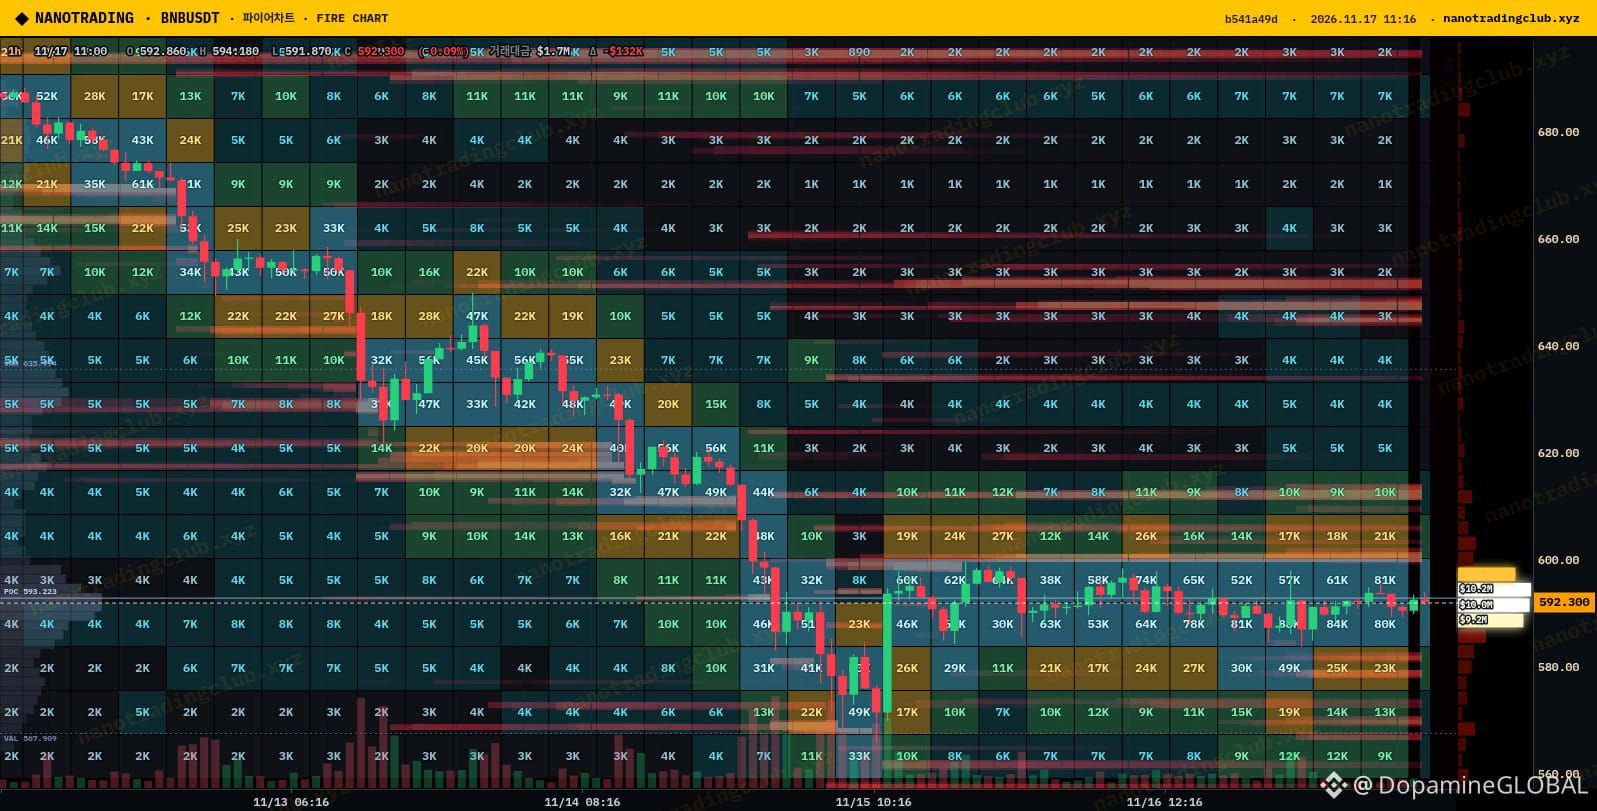
$BNB is grinding sideways around 592 after a steep slide from roughly 680, and on NanoTrading's 1h liquidation heatmap that 590 area looks like the line everyone is watching.
The liquidation radar explains why. There's a long liquidation stack sitting right at about 592 (around $3.3M) and another near 570 (also about $3.3M). Above, the short side builds through 633-638 and peaks near 650 at about $3.5M. So we're basically parked on top of the first long cluster.
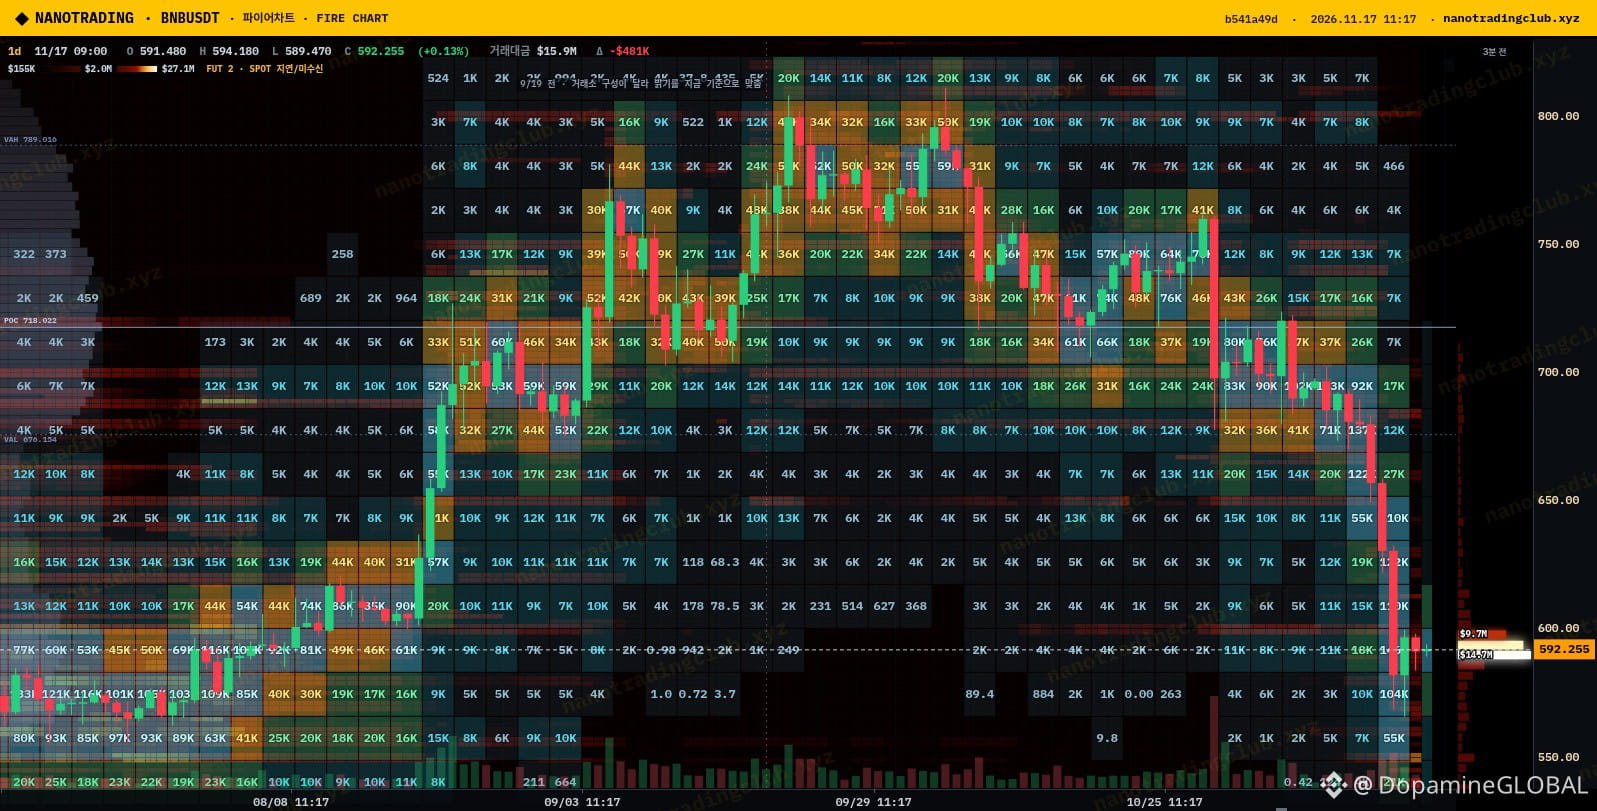
Zooming out on the 1d liquidity heatmap, the move from the high 700s down to 590 has been one-way, with a sharp drop at the end. The wall scanner also flagged a $1.6M bid down at about 500, way below price, so that's the deep "if everything breaks" level, not a near-term target.
My plan: if $BNB holds 590 and gets back above 600, a squeeze toward the 630-650 shorts is the trade I want. Lose 590 cleanly and I expect the 570 longs to get swept first. The market is still heavy (184 down vs 66 up, Fear & Greed 12), so I'm staying patient 🧐
Source: NanoTrading Fire chart 1h liquidation heatmap + 1d liquidity heatmap, liquidation radar and wall scanner (nanotradingclub.xyz).
Is 590 your line for $BNB too, or are you waiting lower?
NFA, just my read.
#BNB #NanoTrading #Altcoins #CryptoMarket
$BNB is grinding sideways around 592 after a steep slide from roughly 680, and on NanoTrading's 1h liquidation heatmap that 590 area looks like the line everyone is watching.
The liquidation radar explains why. There's a long liquidation stack sitting right at about 592 (around $3.3M) and another near 570 (also about $3.3M). Above, the short side builds through 633-638 and peaks near 650 at about $3.5M. So we're basically parked on top of the first long cluster.
Zooming out on the 1d liquidity heatmap, the move from the high 700s down to 590 has been one-way, with a sharp drop at the end. The wall scanner also flagged a $1.6M bid down at about 500, way below price, so that's the deep "if everything breaks" level, not a near-term target.
My plan: if $BNB holds 590 and gets back above 600, a squeeze toward the 630-650 shorts is the trade I want. Lose 590 cleanly and I expect the 570 longs to get swept first. The market is still heavy (184 down vs 66 up, Fear & Greed 12), so I'm staying patient 🧐
Source: NanoTrading Fire chart 1h liquidation heatmap + 1d liquidity heatmap, liquidation radar and wall scanner (nanotradingclub.xyz).
Is 590 your line for $BNB too, or are you waiting lower?
NFA, just my read.
#BNB #NanoTrading #Altcoins #CryptoMarket
The liquidation radar explains why. There's a long liquidation stack sitting right at about 592 (around $3.3M) and another near 570 (also about $3.3M). Above, the short side builds through 633-638 and peaks near 650 at about $3.5M. So we're basically parked on top of the first long cluster.
Zooming out on the 1d liquidity heatmap, the move from the high 700s down to 590 has been one-way, with a sharp drop at the end. The wall scanner also flagged a $1.6M bid down at about 500, way below price, so that's the deep "if everything breaks" level, not a near-term target.
My plan: if $BNB holds 590 and gets back above 600, a squeeze toward the 630-650 shorts is the trade I want. Lose 590 cleanly and I expect the 570 longs to get swept first. The market is still heavy (184 down vs 66 up, Fear & Greed 12), so I'm staying patient 🧐
Source: NanoTrading Fire chart 1h liquidation heatmap + 1d liquidity heatmap, liquidation radar and wall scanner (nanotradingclub.xyz).
Is 590 your line for $BNB too, or are you waiting lower?
NFA, just my read.
#BNB #NanoTrading #Altcoins #CryptoMarket
35
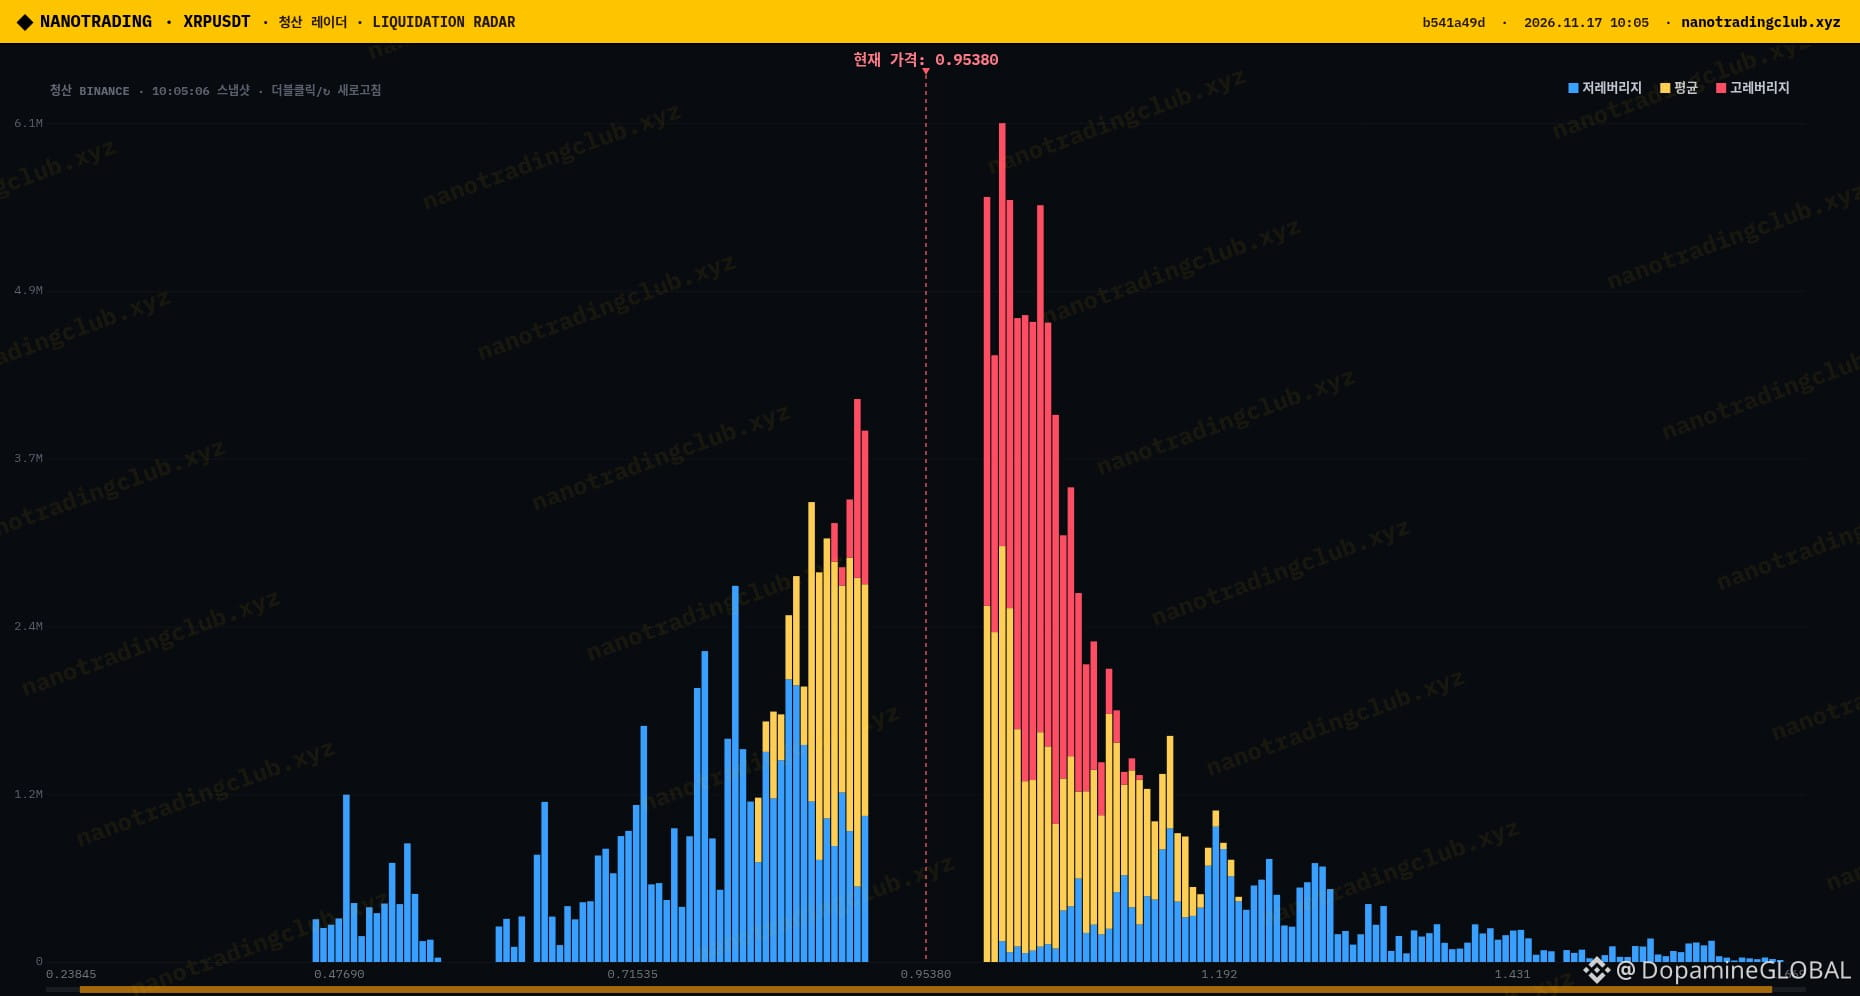
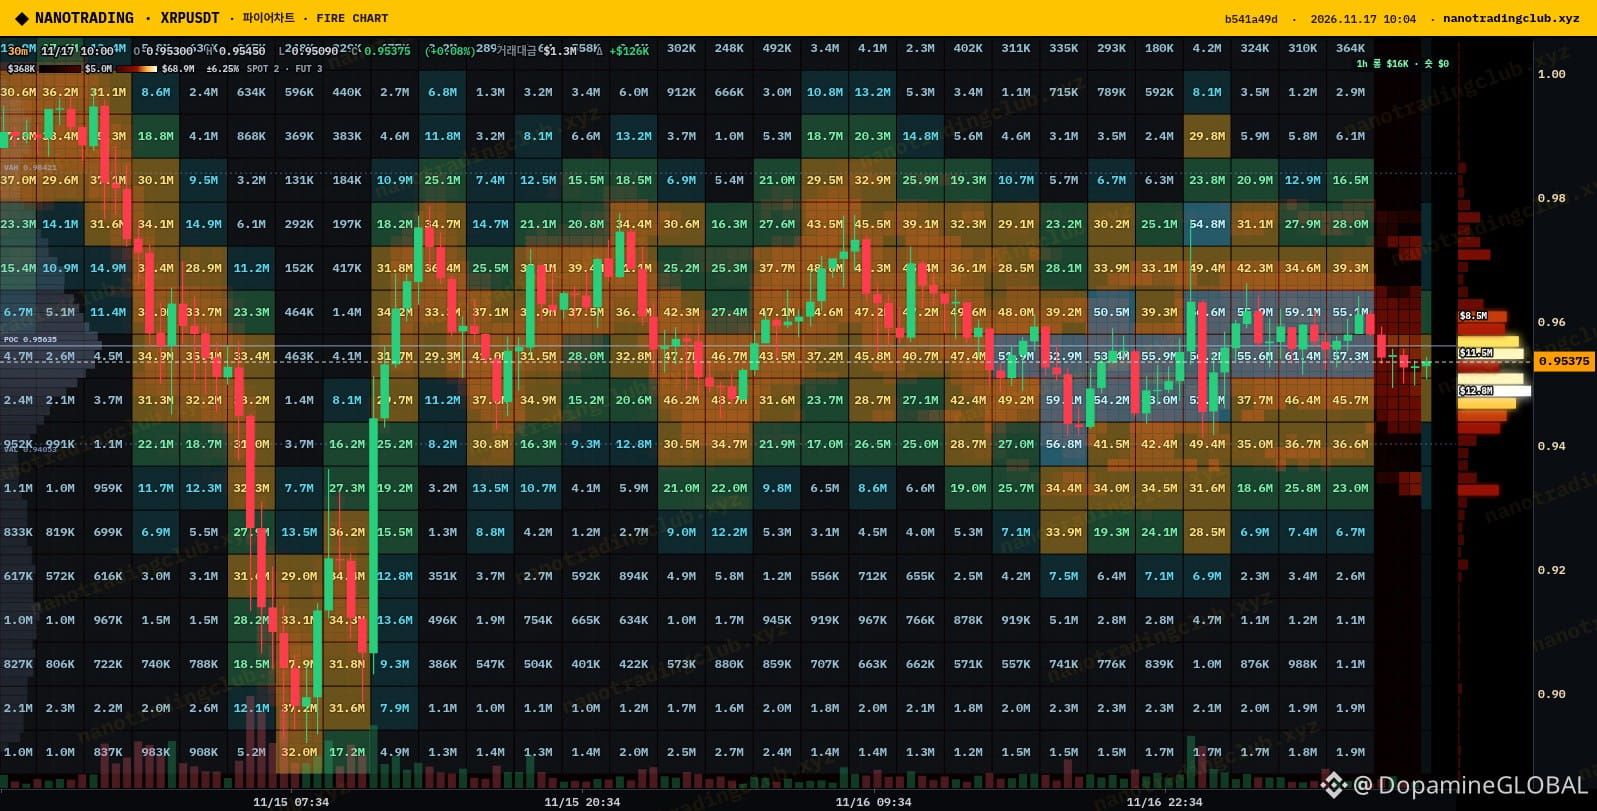
$XRP is hanging around 0.953 after that drop from roughly 0.99 to the 0.93-0.94 area over the weekend, and the liquidation radar is the chart I keep coming back to this morning.
On NanoTrading's radar the short liquidation stack above price is clearly heavier than the long side. It starts right at current price, builds through 0.96-0.98 and peaks near 1.00 at about 6.1M, mostly high leverage. Below, the bigger long stacks are around 0.92-0.93 (about 3.7M) and 0.78-0.80. So the fuel for a squeeze is sitting overhead.
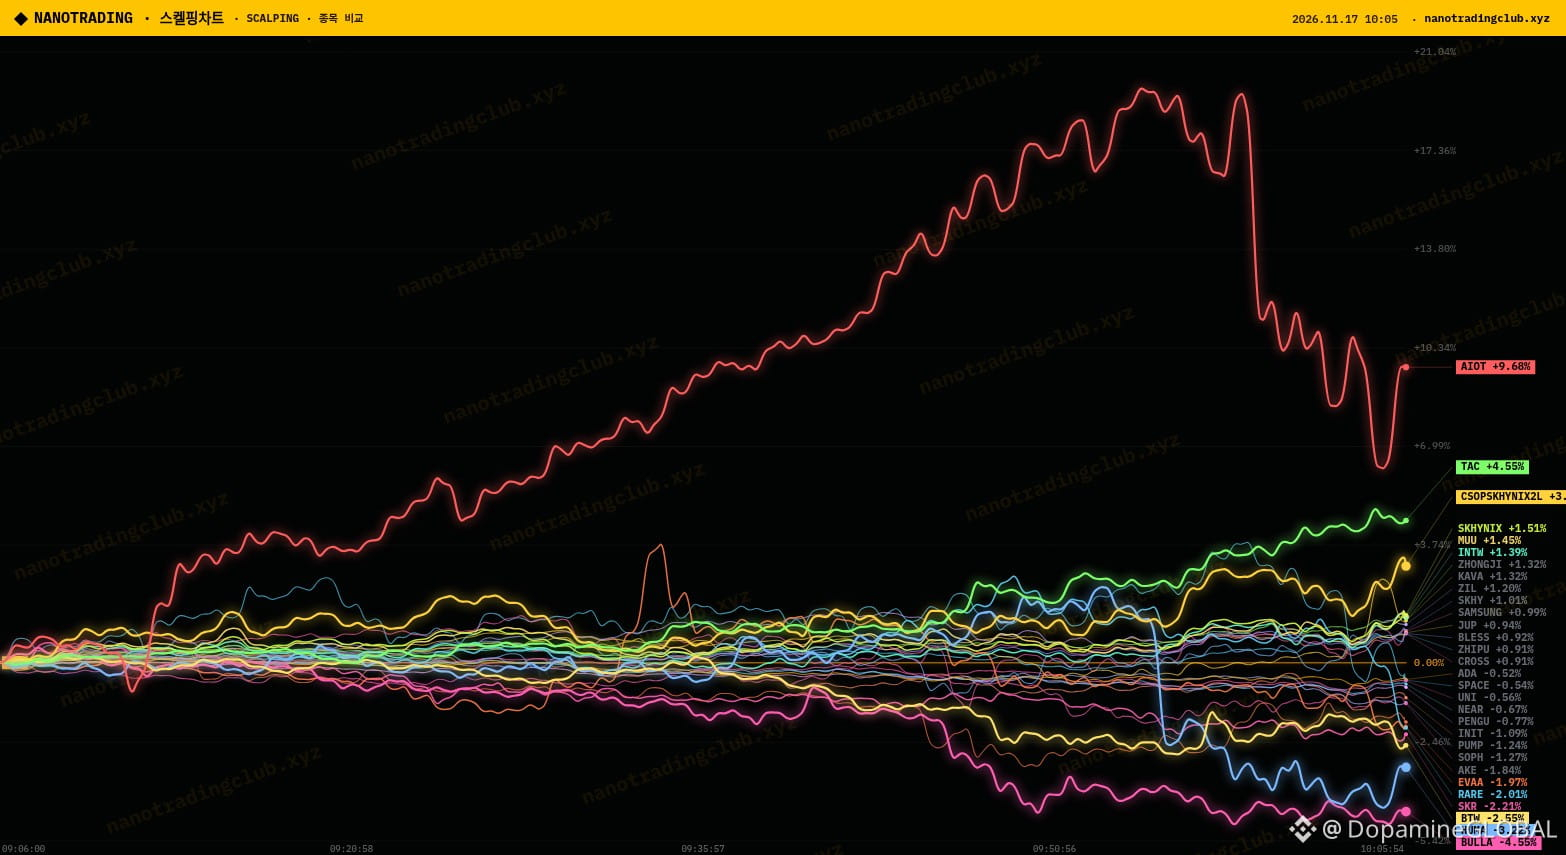
The 30m Fire chart with the integrated orderbook is less exciting. Price has been going sideways at 0.95-0.96 since the bounce, and the live book was leaning slightly to sellers (about 57/43) when I checked. The scalp market view still shows 184 coins red vs 66 green, with Fear & Greed at 12, so nobody is rushing in.
My plan: a clean push through 0.96 could pull $XRP toward the 0.98-1.00 short cluster fast. If 0.93 gives way, I'd expect it to drift toward the long liquidations lower down instead. I'm waiting for one side to break 👀
Source: NanoTrading liquidation radar, Fire chart 30m integrated orderbook, and scalping market view (nanotradingclub.xyz).
Do you think that 1.00 short stack gets hunted this week?
NFA, just my read.
#XRP #NanoTrading #Altcoins #CryptoMarket
$XRP is hanging around 0.953 after that drop from roughly 0.99 to the 0.93-0.94 area over the weekend, and the liquidation radar is the chart I keep coming back to this morning.
On NanoTrading's radar the short liquidation stack above price is clearly heavier than the long side. It starts right at current price, builds through 0.96-0.98 and peaks near 1.00 at about 6.1M, mostly high leverage. Below, the bigger long stacks are around 0.92-0.93 (about 3.7M) and 0.78-0.80. So the fuel for a squeeze is sitting overhead.
The 30m Fire chart with the integrated orderbook is less exciting. Price has been going sideways at 0.95-0.96 since the bounce, and the live book was leaning slightly to sellers (about 57/43) when I checked. The scalp market view still shows 184 coins red vs 66 green, with Fear & Greed at 12, so nobody is rushing in.
My plan: a clean push through 0.96 could pull $XRP toward the 0.98-1.00 short cluster fast. If 0.93 gives way, I'd expect it to drift toward the long liquidations lower down instead. I'm waiting for one side to break 👀
Source: NanoTrading liquidation radar, Fire chart 30m integrated orderbook, and scalping market view (nanotradingclub.xyz).
Do you think that 1.00 short stack gets hunted this week?
NFA, just my read.
#XRP #NanoTrading #Altcoins #CryptoMarket
On NanoTrading's radar the short liquidation stack above price is clearly heavier than the long side. It starts right at current price, builds through 0.96-0.98 and peaks near 1.00 at about 6.1M, mostly high leverage. Below, the bigger long stacks are around 0.92-0.93 (about 3.7M) and 0.78-0.80. So the fuel for a squeeze is sitting overhead.
The 30m Fire chart with the integrated orderbook is less exciting. Price has been going sideways at 0.95-0.96 since the bounce, and the live book was leaning slightly to sellers (about 57/43) when I checked. The scalp market view still shows 184 coins red vs 66 green, with Fear & Greed at 12, so nobody is rushing in.
My plan: a clean push through 0.96 could pull $XRP toward the 0.98-1.00 short cluster fast. If 0.93 gives way, I'd expect it to drift toward the long liquidations lower down instead. I'm waiting for one side to break 👀
Source: NanoTrading liquidation radar, Fire chart 30m integrated orderbook, and scalping market view (nanotradingclub.xyz).
Do you think that 1.00 short stack gets hunted this week?
NFA, just my read.
#XRP #NanoTrading #Altcoins #CryptoMarket
63
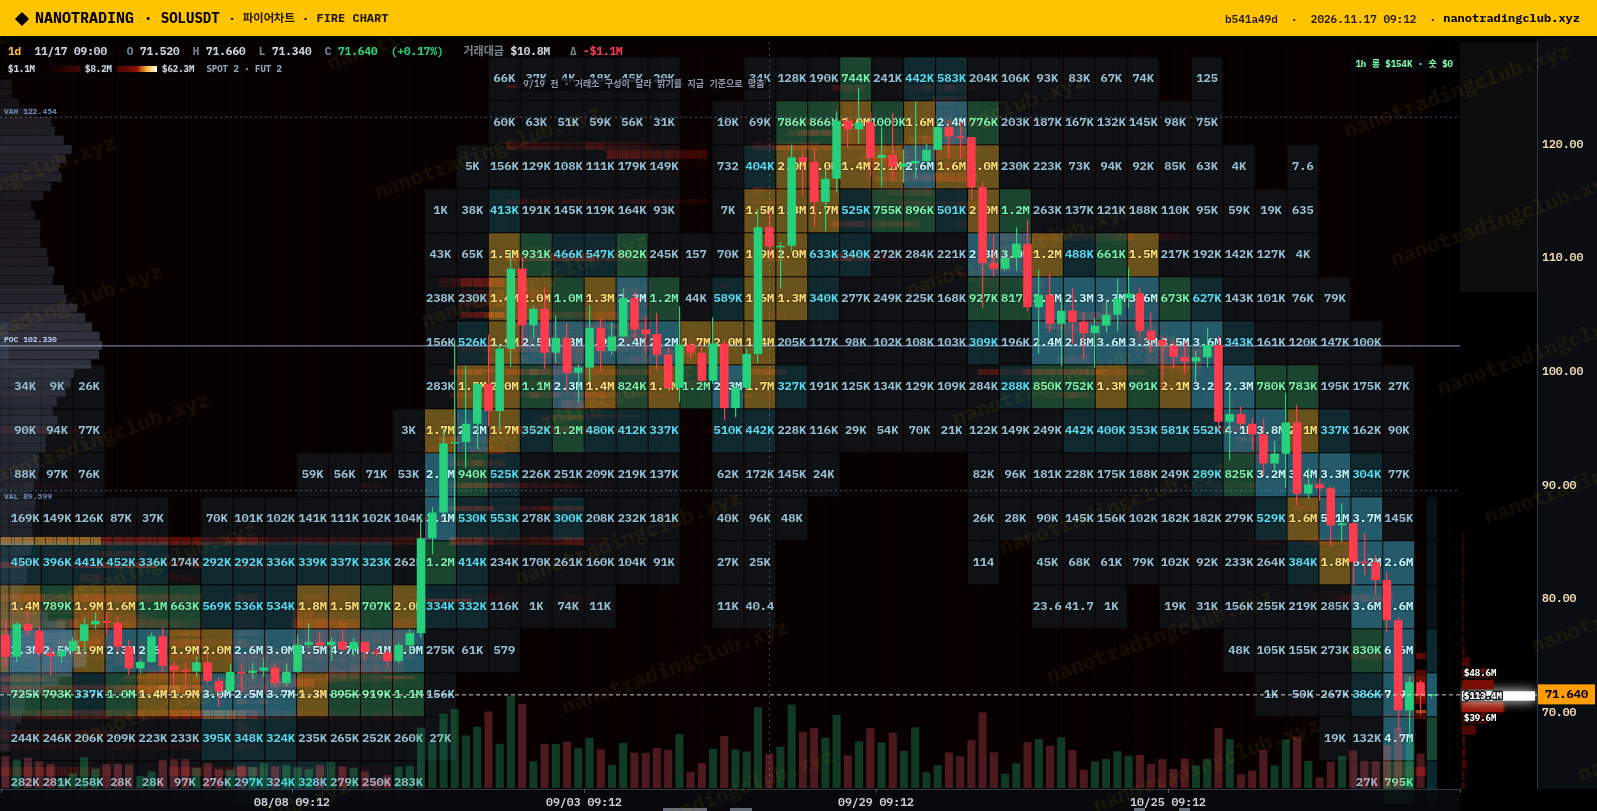
$SOL is sitting around 71.5 this morning and the daily chart is honestly ugly: a straight bleed from the 120s in October back into the same 70-80 zone it was ranging in back in early August.
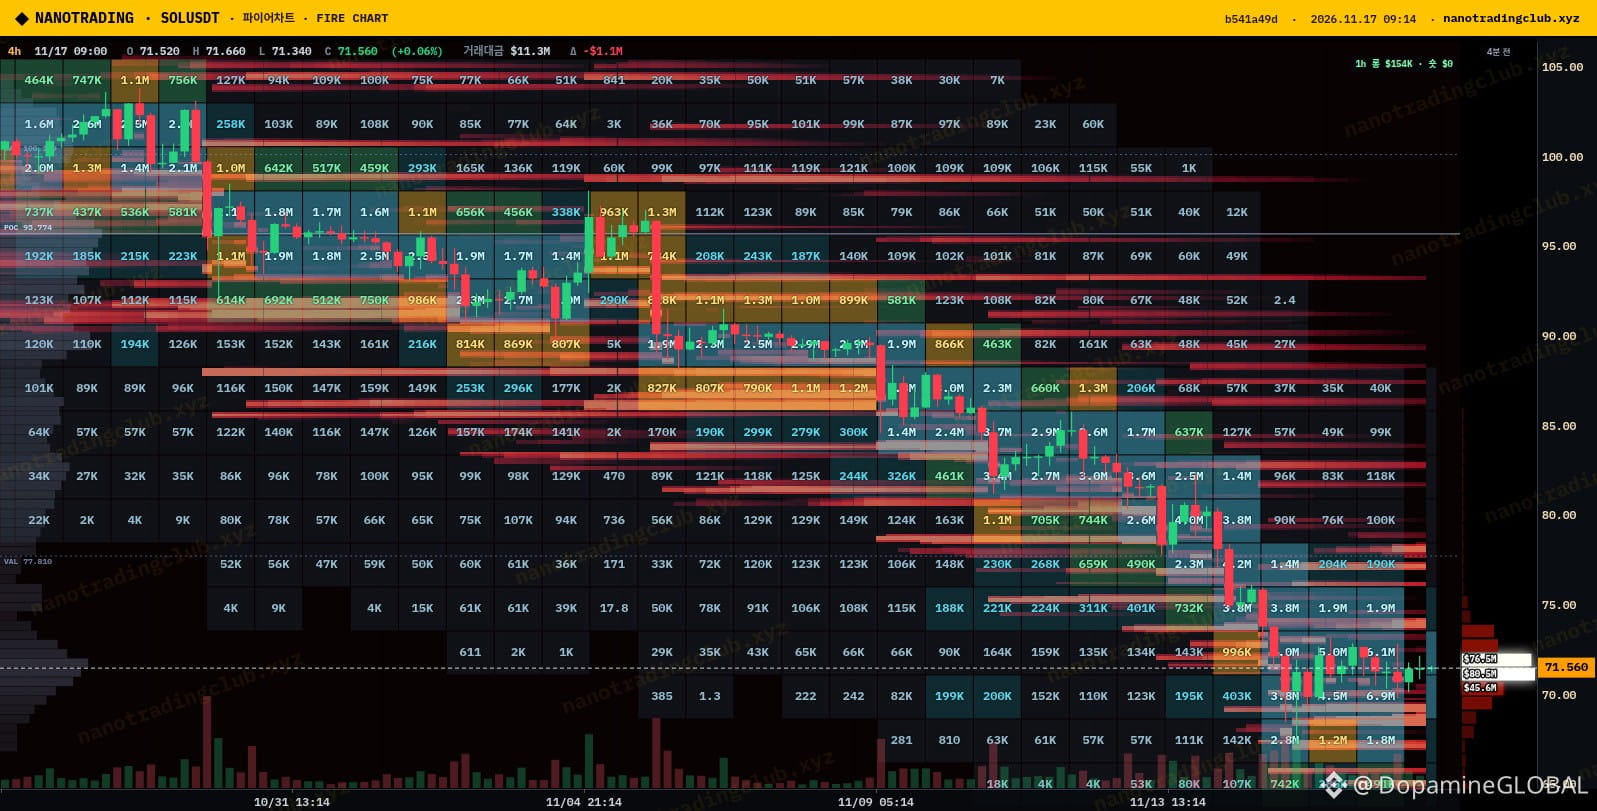
The 4h liquidity heatmap is the interesting part. The heaviest cells are now stacked right on top of price, roughly 71-75, a few of them in the 3.8M-5.8M range, while the bands that used to matter at 90-95 are far above. So the fight is happening right here, not somewhere below.
The orderbook isn't screaming panic either. NanoTrading's live book had a 358K bid at 71.40 against a 264K ask at 71.51, around 53% on the buy side, while the scanner shows 55 coins up vs 195 down and Fear & Greed at 12. $BTC is still down around half a percent, so $SOL is just moving with a weak market.
My plan: I want a reclaim and hold above 75 before I take any long seriously. Lose the 70 handle on a daily close and I step aside, since the old August range below is thin on this map. Until then, it's a chop zone for me 🤔
Source: NanoTrading Fire chart (nanotradingclub.xyz), 1d liquidation heatmap + 4h liquidity heatmap.
Are you buying $SOL in the 70s or waiting for a lower flush?
NFA, just my read.
#SOL #Solana #NanoTrading #Altcoins
$SOL is sitting around 71.5 this morning and the daily chart is honestly ugly: a straight bleed from the 120s in October back into the same 70-80 zone it was ranging in back in early August.
The 4h liquidity heatmap is the interesting part. The heaviest cells are now stacked right on top of price, roughly 71-75, a few of them in the 3.8M-5.8M range, while the bands that used to matter at 90-95 are far above. So the fight is happening right here, not somewhere below.
The orderbook isn't screaming panic either. NanoTrading's live book had a 358K bid at 71.40 against a 264K ask at 71.51, around 53% on the buy side, while the scanner shows 55 coins up vs 195 down and Fear & Greed at 12. $BTC is still down around half a percent, so $SOL is just moving with a weak market.
My plan: I want a reclaim and hold above 75 before I take any long seriously. Lose the 70 handle on a daily close and I step aside, since the old August range below is thin on this map. Until then, it's a chop zone for me 🤔
Source: NanoTrading Fire chart (nanotradingclub.xyz), 1d liquidation heatmap + 4h liquidity heatmap.
Are you buying $SOL in the 70s or waiting for a lower flush?
NFA, just my read.
#SOL #Solana #NanoTrading #Altcoins
The 4h liquidity heatmap is the interesting part. The heaviest cells are now stacked right on top of price, roughly 71-75, a few of them in the 3.8M-5.8M range, while the bands that used to matter at 90-95 are far above. So the fight is happening right here, not somewhere below.
The orderbook isn't screaming panic either. NanoTrading's live book had a 358K bid at 71.40 against a 264K ask at 71.51, around 53% on the buy side, while the scanner shows 55 coins up vs 195 down and Fear & Greed at 12. $BTC is still down around half a percent, so $SOL is just moving with a weak market.
My plan: I want a reclaim and hold above 75 before I take any long seriously. Lose the 70 handle on a daily close and I step aside, since the old August range below is thin on this map. Until then, it's a chop zone for me 🤔
Source: NanoTrading Fire chart (nanotradingclub.xyz), 1d liquidation heatmap + 4h liquidity heatmap.
Are you buying $SOL in the 70s or waiting for a lower flush?
NFA, just my read.
#SOL #Solana #NanoTrading #Altcoins
44
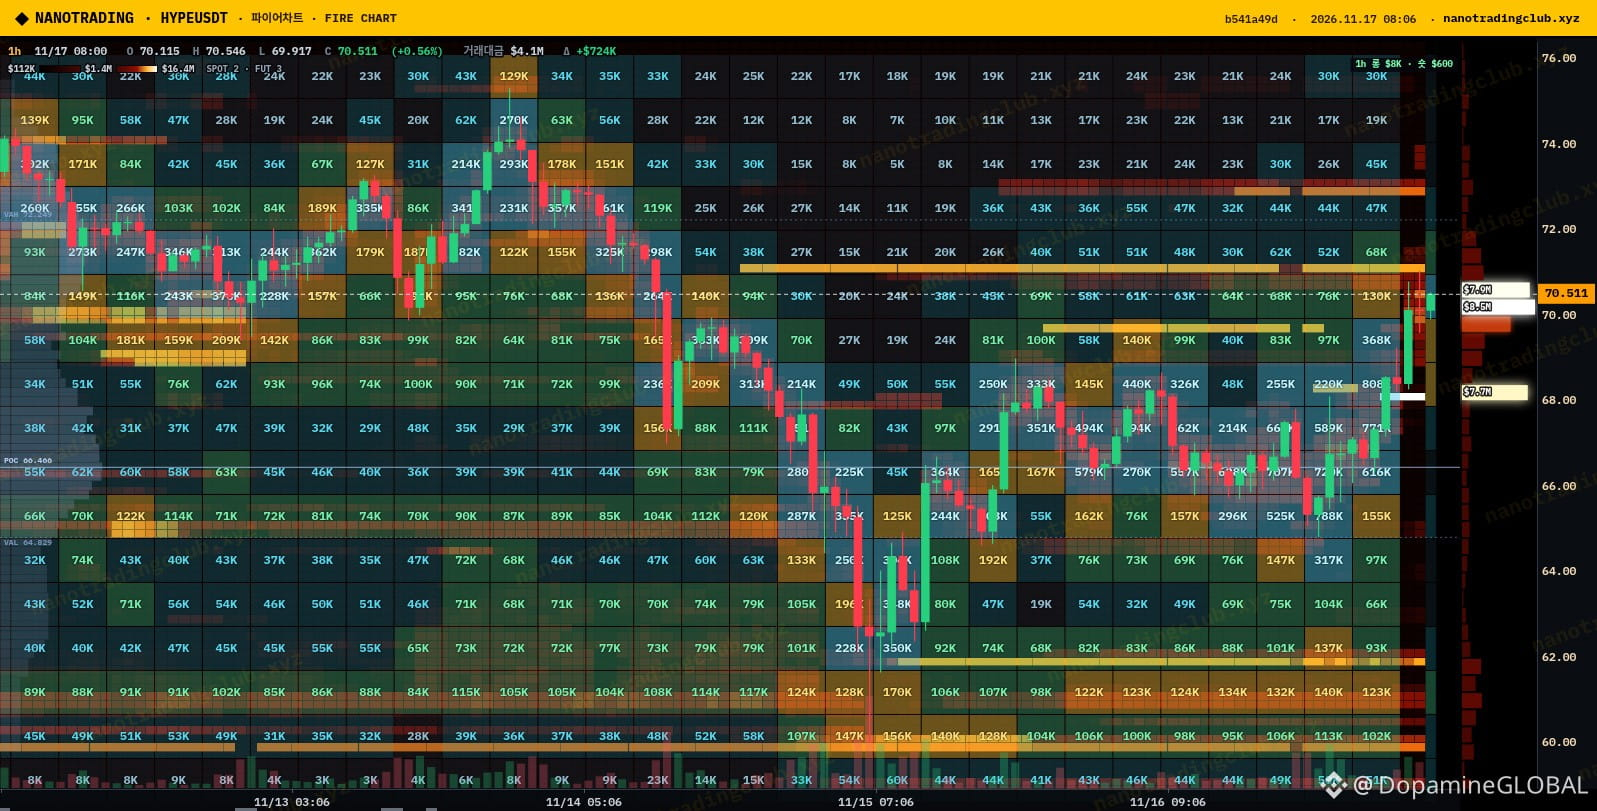
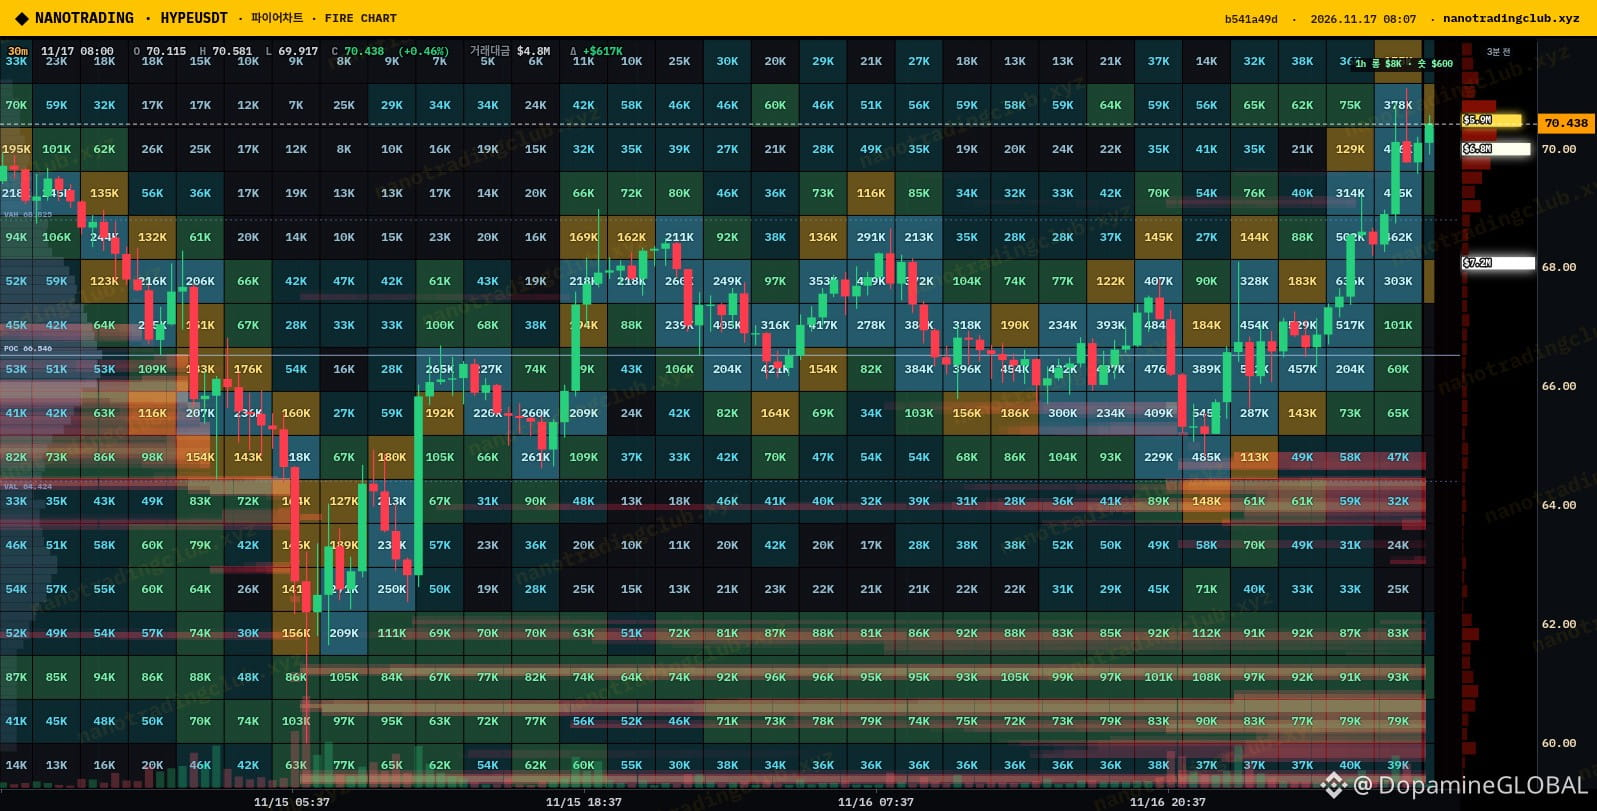
$HYPE is one of the few things green on my screen this morning, up around 3-4% near 70.4 while NanoTrading's board shows 53 coins up vs 196 down and Fear & Greed still stuck at 10.
The 1h Fire chart with the integrated orderbook explains the move. For days $HYPE chopped in a 66-68 box, and that's where the biggest cells sit, several in the 400K-600K range. Price finally pushed out of the top of that range and is now sitting right on 70 with much thinner liquidity above it, apart from older stacks around 72-74 from last week's drop.
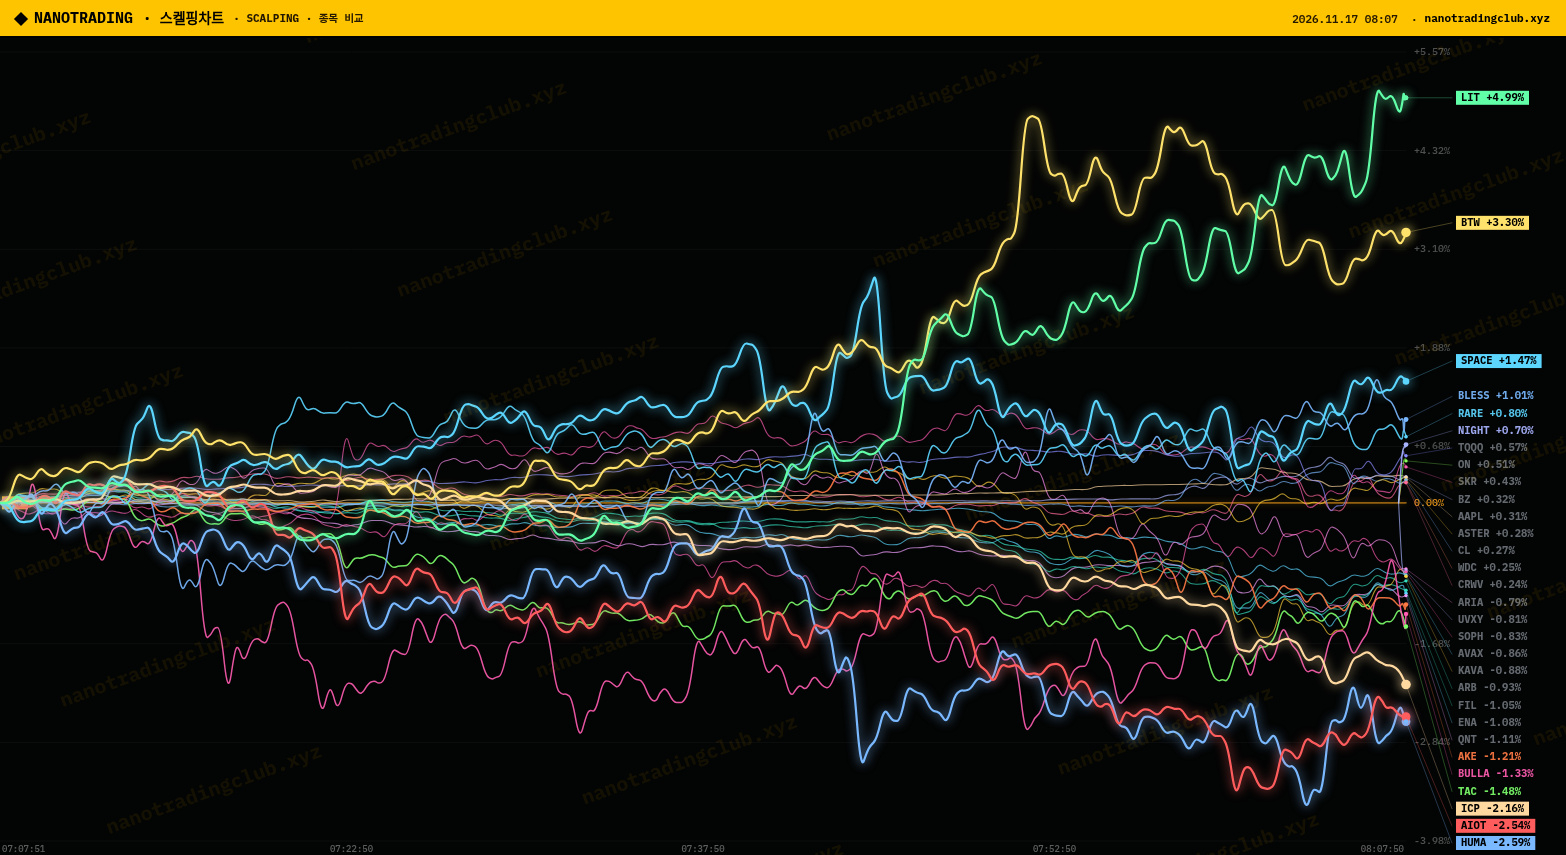
The 30m liquidation heatmap shows the same thing on a smaller scale. The squeeze off the 66s was clean, and the next real test is whether 68-70 flips into support on a retest. The whole-market scalp chart is mostly bleeding at the same time, so this is relative strength, not a rising tide.
My plan: hold 68 on a pullback and I want a run at 72-74. Back below 66 and the breakout failed, so I'm out.
Source: NanoTrading Fire chart (nanotradingclub.xyz), 1h integrated orderbook + 30m liquidation heatmap, plus the scalping market view.
Are you rotating into strength like $HYPE here, or waiting for $BTC to calm down first?
NFA, just my read 🔥
#HYPE #Hyperliquid #NanoTrading #Altcoins
$HYPE is one of the few things green on my screen this morning, up around 3-4% near 70.4 while NanoTrading's board shows 53 coins up vs 196 down and Fear & Greed still stuck at 10.
The 1h Fire chart with the integrated orderbook explains the move. For days $HYPE chopped in a 66-68 box, and that's where the biggest cells sit, several in the 400K-600K range. Price finally pushed out of the top of that range and is now sitting right on 70 with much thinner liquidity above it, apart from older stacks around 72-74 from last week's drop.
The 30m liquidation heatmap shows the same thing on a smaller scale. The squeeze off the 66s was clean, and the next real test is whether 68-70 flips into support on a retest. The whole-market scalp chart is mostly bleeding at the same time, so this is relative strength, not a rising tide.
My plan: hold 68 on a pullback and I want a run at 72-74. Back below 66 and the breakout failed, so I'm out.
Source: NanoTrading Fire chart (nanotradingclub.xyz), 1h integrated orderbook + 30m liquidation heatmap, plus the scalping market view.
Are you rotating into strength like $HYPE here, or waiting for $BTC to calm down first?
NFA, just my read 🔥
#HYPE #Hyperliquid #NanoTrading #Altcoins
The 1h Fire chart with the integrated orderbook explains the move. For days $HYPE chopped in a 66-68 box, and that's where the biggest cells sit, several in the 400K-600K range. Price finally pushed out of the top of that range and is now sitting right on 70 with much thinner liquidity above it, apart from older stacks around 72-74 from last week's drop.
The 30m liquidation heatmap shows the same thing on a smaller scale. The squeeze off the 66s was clean, and the next real test is whether 68-70 flips into support on a retest. The whole-market scalp chart is mostly bleeding at the same time, so this is relative strength, not a rising tide.
My plan: hold 68 on a pullback and I want a run at 72-74. Back below 66 and the breakout failed, so I'm out.
Source: NanoTrading Fire chart (nanotradingclub.xyz), 1h integrated orderbook + 30m liquidation heatmap, plus the scalping market view.
Are you rotating into strength like $HYPE here, or waiting for $BTC to calm down first?
NFA, just my read 🔥
#HYPE #Hyperliquid #NanoTrading #Altcoins
248
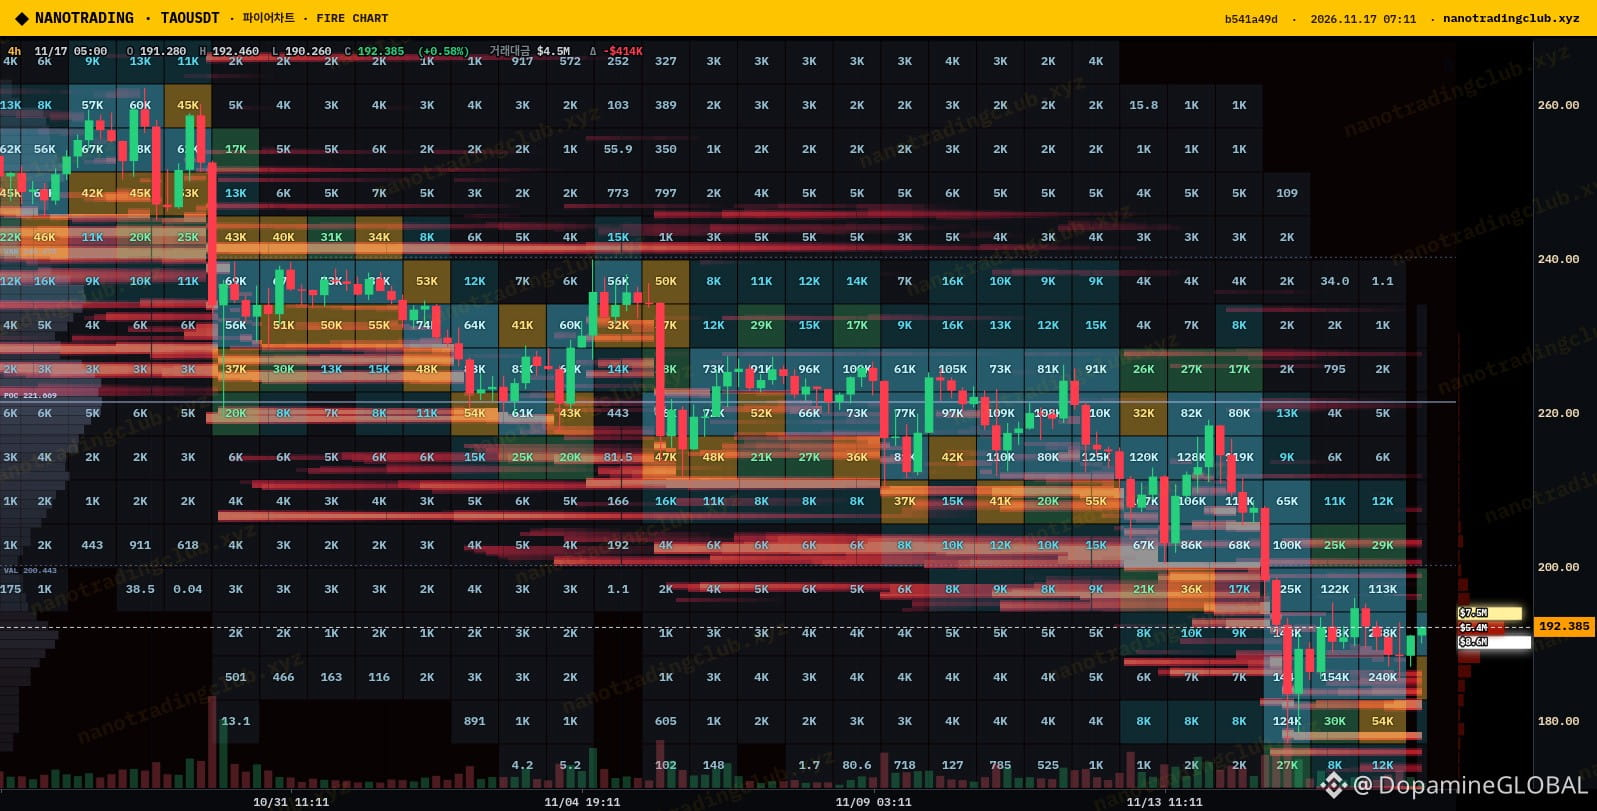
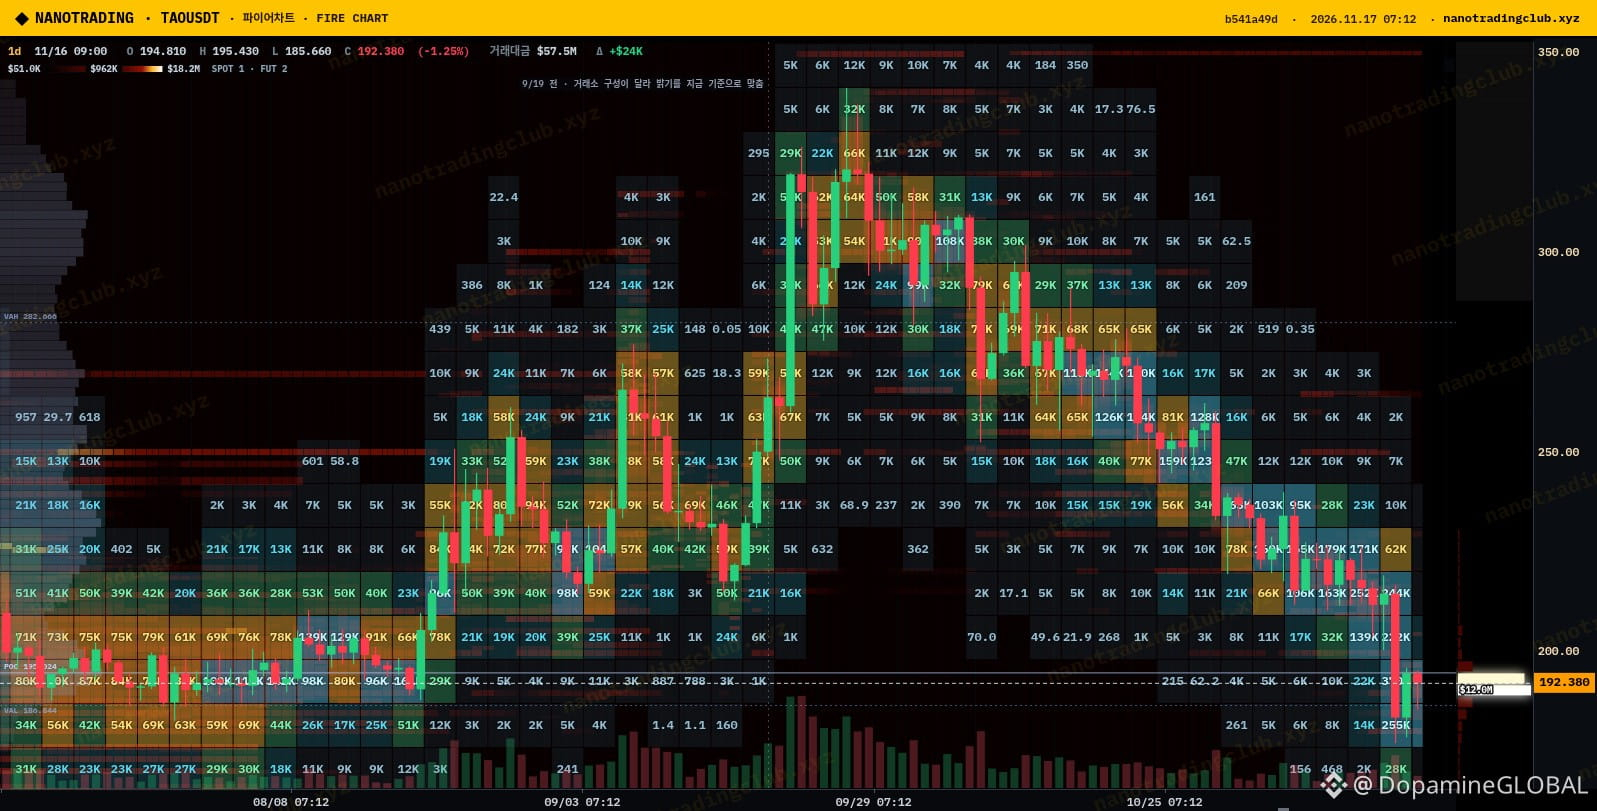
$TAO is holding around 192 this morning after a rough two weeks, and NanoTrading's board is still deep red: 85 coins up vs 165 down, Fear & Greed sitting at 10.
The 4h Fire liquidation map tells the story. Price bled from the 240s down into the 180s in mid-November, and the bright bands it left behind are now stacked overhead, roughly 200-215. That's where a lot of trapped longs sit, so I expect any bounce to get sold there first rather than rip straight through.
What keeps me from being outright bearish is the wall scanner: a $540K buy wall at about 180, 4 days old, scored 72/100 for reliability, with low spoofing risk. Funding is basically flat (+0.0049%) and long/short is 1.26, so nobody's crowded here. On the 1d heatmap the thick liquidity is way up in the 250-300 zone, which is the bigger magnet if $TAO ever actually turns.
My plan: buyers defend 180 and I'm looking for a push back toward 200. Lose that wall and I step aside. I won't chase anything under the 200-215 supply.
Source: NanoTrading Fire chart (nanotradingclub.xyz), 4h liquidation map + 1d liquidity heatmap, plus the wall scanner.
Is $TAO on your watchlist at these levels, or are you waiting for AI coins to bottom first?
NFA, just my read 🧠
#TAO #Bittensor #NanoTrading #AIcrypto
$TAO is holding around 192 this morning after a rough two weeks, and NanoTrading's board is still deep red: 85 coins up vs 165 down, Fear & Greed sitting at 10.
The 4h Fire liquidation map tells the story. Price bled from the 240s down into the 180s in mid-November, and the bright bands it left behind are now stacked overhead, roughly 200-215. That's where a lot of trapped longs sit, so I expect any bounce to get sold there first rather than rip straight through.
What keeps me from being outright bearish is the wall scanner: a $540K buy wall at about 180, 4 days old, scored 72/100 for reliability, with low spoofing risk. Funding is basically flat (+0.0049%) and long/short is 1.26, so nobody's crowded here. On the 1d heatmap the thick liquidity is way up in the 250-300 zone, which is the bigger magnet if $TAO ever actually turns.
My plan: buyers defend 180 and I'm looking for a push back toward 200. Lose that wall and I step aside. I won't chase anything under the 200-215 supply.
Source: NanoTrading Fire chart (nanotradingclub.xyz), 4h liquidation map + 1d liquidity heatmap, plus the wall scanner.
Is $TAO on your watchlist at these levels, or are you waiting for AI coins to bottom first?
NFA, just my read 🧠
#TAO #Bittensor #NanoTrading #AIcrypto
The 4h Fire liquidation map tells the story. Price bled from the 240s down into the 180s in mid-November, and the bright bands it left behind are now stacked overhead, roughly 200-215. That's where a lot of trapped longs sit, so I expect any bounce to get sold there first rather than rip straight through.
What keeps me from being outright bearish is the wall scanner: a $540K buy wall at about 180, 4 days old, scored 72/100 for reliability, with low spoofing risk. Funding is basically flat (+0.0049%) and long/short is 1.26, so nobody's crowded here. On the 1d heatmap the thick liquidity is way up in the 250-300 zone, which is the bigger magnet if $TAO ever actually turns.
My plan: buyers defend 180 and I'm looking for a push back toward 200. Lose that wall and I step aside. I won't chase anything under the 200-215 supply.
Source: NanoTrading Fire chart (nanotradingclub.xyz), 4h liquidation map + 1d liquidity heatmap, plus the wall scanner.
Is $TAO on your watchlist at these levels, or are you waiting for AI coins to bottom first?
NFA, just my read 🧠
#TAO #Bittensor #NanoTrading #AIcrypto
1
118
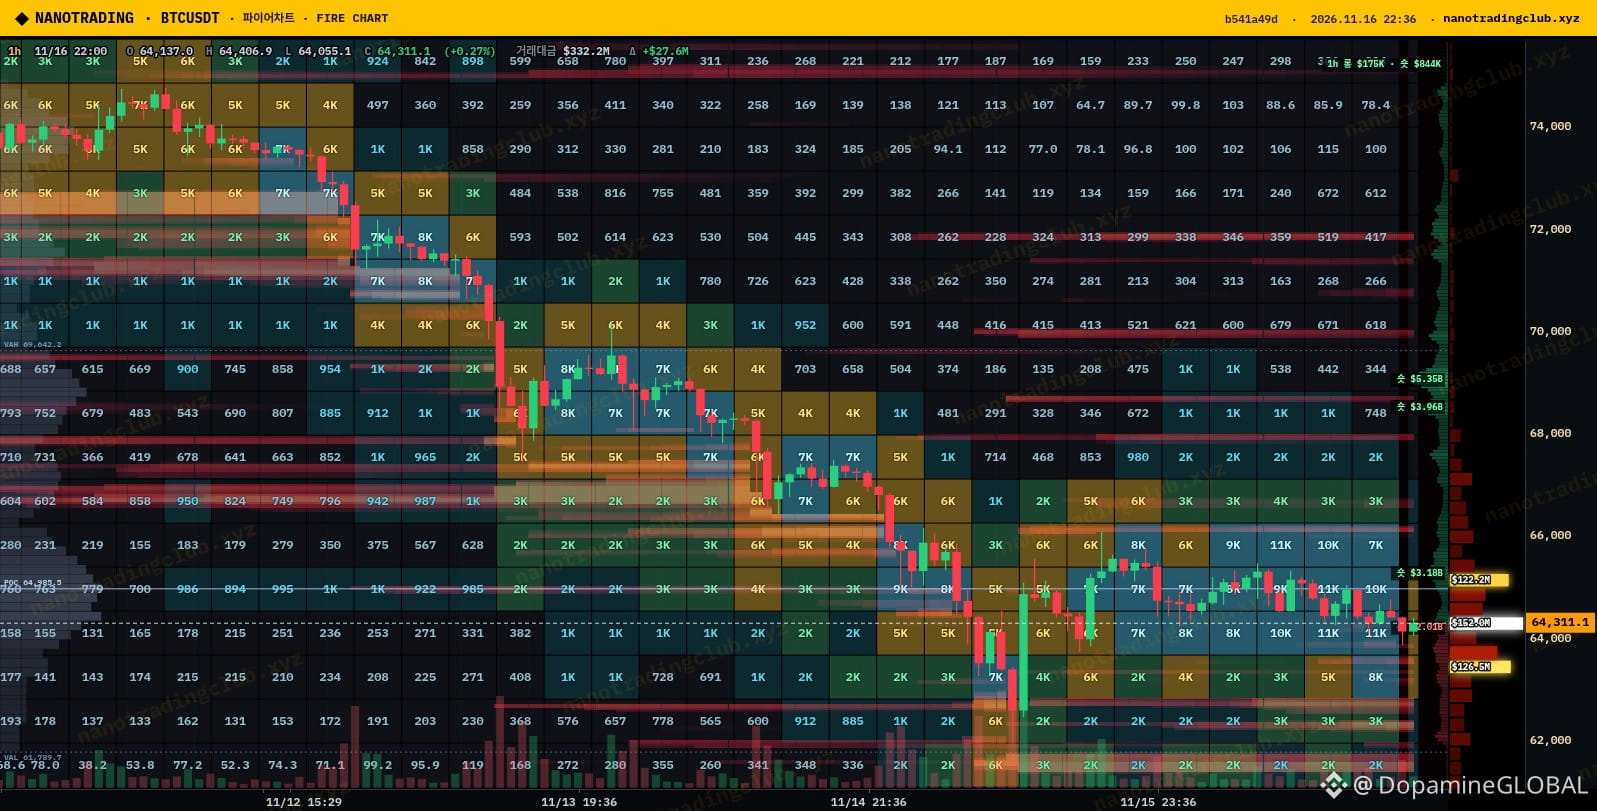
$BTC is sitting around 64.3k tonight, down about 1.7% on the day, and the mood on NanoTrading's board is ugly: 56 coins up vs 194 down and Fear & Greed stuck at 10.
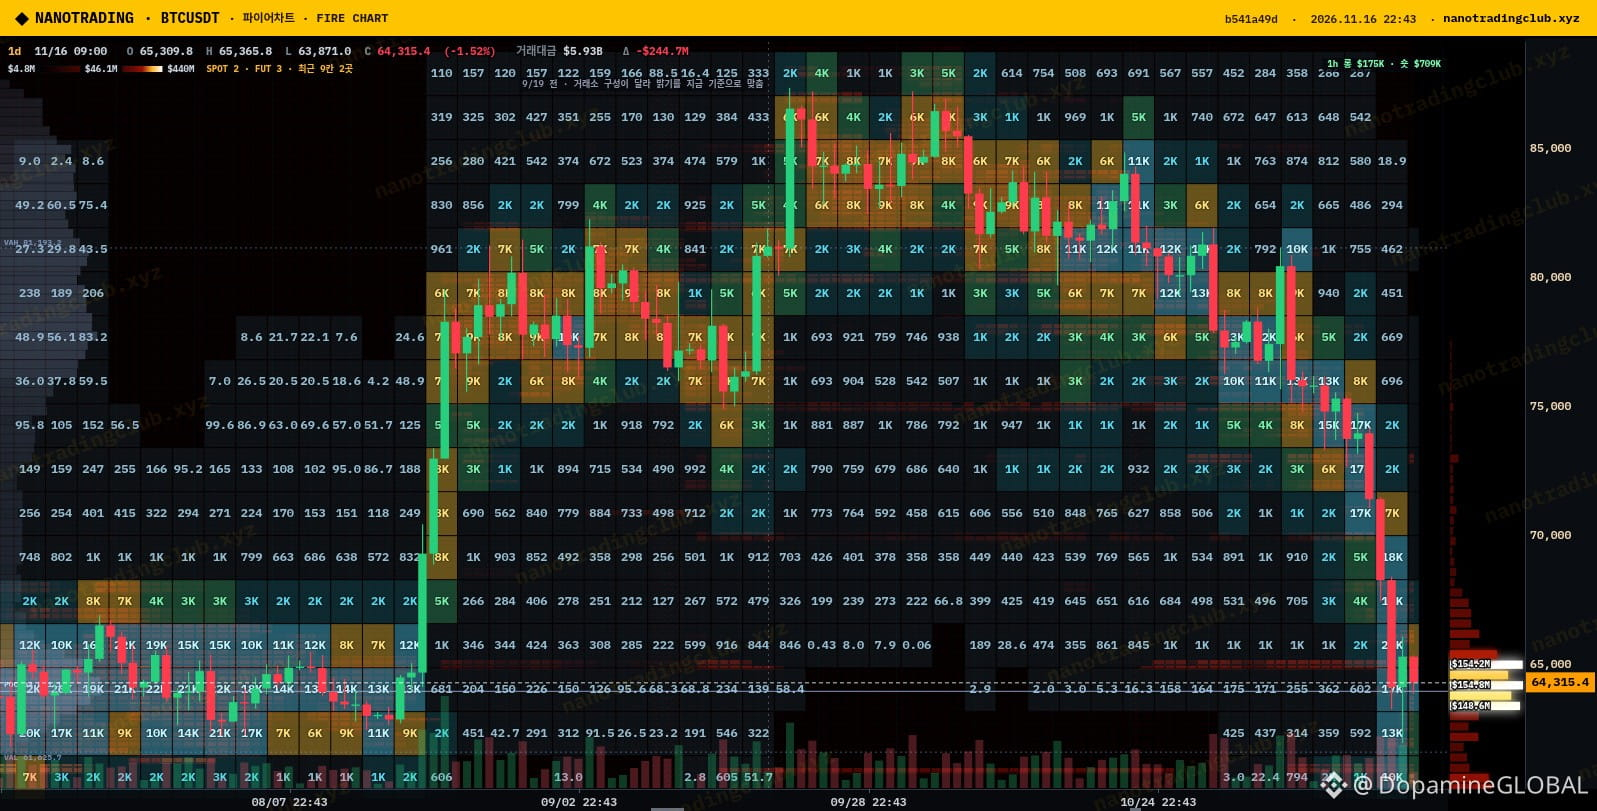
The 1h Fire liquidation map shows why price feels pinned. Since the flush toward 63k on 11/15 we've been chopping in a tight 64-65k box, with roughly $122M of liquidations tagged around 65.1k, about $152M right at spot and about $127M near 63.6k. Both sides are loaded close to price, so I expect a fast wick before any real direction.
The wall scanner also has a buy wall at 64,021, around $21.5M and 3 days old, sitting just 0.4% under price. On the 1d orderbook view the heavier shelves are way higher, around 69-70k and 77-80k, so a lot of the overhead supply is far away if $BTC can actually get going. My plan: hold 64k and I want a squeeze through 65.1k first, lose 63.6k and I step aside and let it find buyers lower.
Source: NanoTrading Fire chart (nanotradingclub.xyz), 1h liquidation heatmap + 1d orderbook heatmap, plus the wall scanner.
Extreme fear at 10 has been a decent spot to buy in the past. Are you adding here or waiting for 63k to break first?
NFA, just my read 🧊
#BTC #Bitcoin #NanoTrading #CryptoMarket
$BTC is sitting around 64.3k tonight, down about 1.7% on the day, and the mood on NanoTrading's board is ugly: 56 coins up vs 194 down and Fear & Greed stuck at 10.
The 1h Fire liquidation map shows why price feels pinned. Since the flush toward 63k on 11/15 we've been chopping in a tight 64-65k box, with roughly $122M of liquidations tagged around 65.1k, about $152M right at spot and about $127M near 63.6k. Both sides are loaded close to price, so I expect a fast wick before any real direction.
The wall scanner also has a buy wall at 64,021, around $21.5M and 3 days old, sitting just 0.4% under price. On the 1d orderbook view the heavier shelves are way higher, around 69-70k and 77-80k, so a lot of the overhead supply is far away if $BTC can actually get going. My plan: hold 64k and I want a squeeze through 65.1k first, lose 63.6k and I step aside and let it find buyers lower.
Source: NanoTrading Fire chart (nanotradingclub.xyz), 1h liquidation heatmap + 1d orderbook heatmap, plus the wall scanner.
Extreme fear at 10 has been a decent spot to buy in the past. Are you adding here or waiting for 63k to break first?
NFA, just my read 🧊
#BTC #Bitcoin #NanoTrading #CryptoMarket
The 1h Fire liquidation map shows why price feels pinned. Since the flush toward 63k on 11/15 we've been chopping in a tight 64-65k box, with roughly $122M of liquidations tagged around 65.1k, about $152M right at spot and about $127M near 63.6k. Both sides are loaded close to price, so I expect a fast wick before any real direction.
The wall scanner also has a buy wall at 64,021, around $21.5M and 3 days old, sitting just 0.4% under price. On the 1d orderbook view the heavier shelves are way higher, around 69-70k and 77-80k, so a lot of the overhead supply is far away if $BTC can actually get going. My plan: hold 64k and I want a squeeze through 65.1k first, lose 63.6k and I step aside and let it find buyers lower.
Source: NanoTrading Fire chart (nanotradingclub.xyz), 1h liquidation heatmap + 1d orderbook heatmap, plus the wall scanner.
Extreme fear at 10 has been a decent spot to buy in the past. Are you adding here or waiting for 63k to break first?
NFA, just my read 🧊
#BTC #Bitcoin #NanoTrading #CryptoMarket
2
47
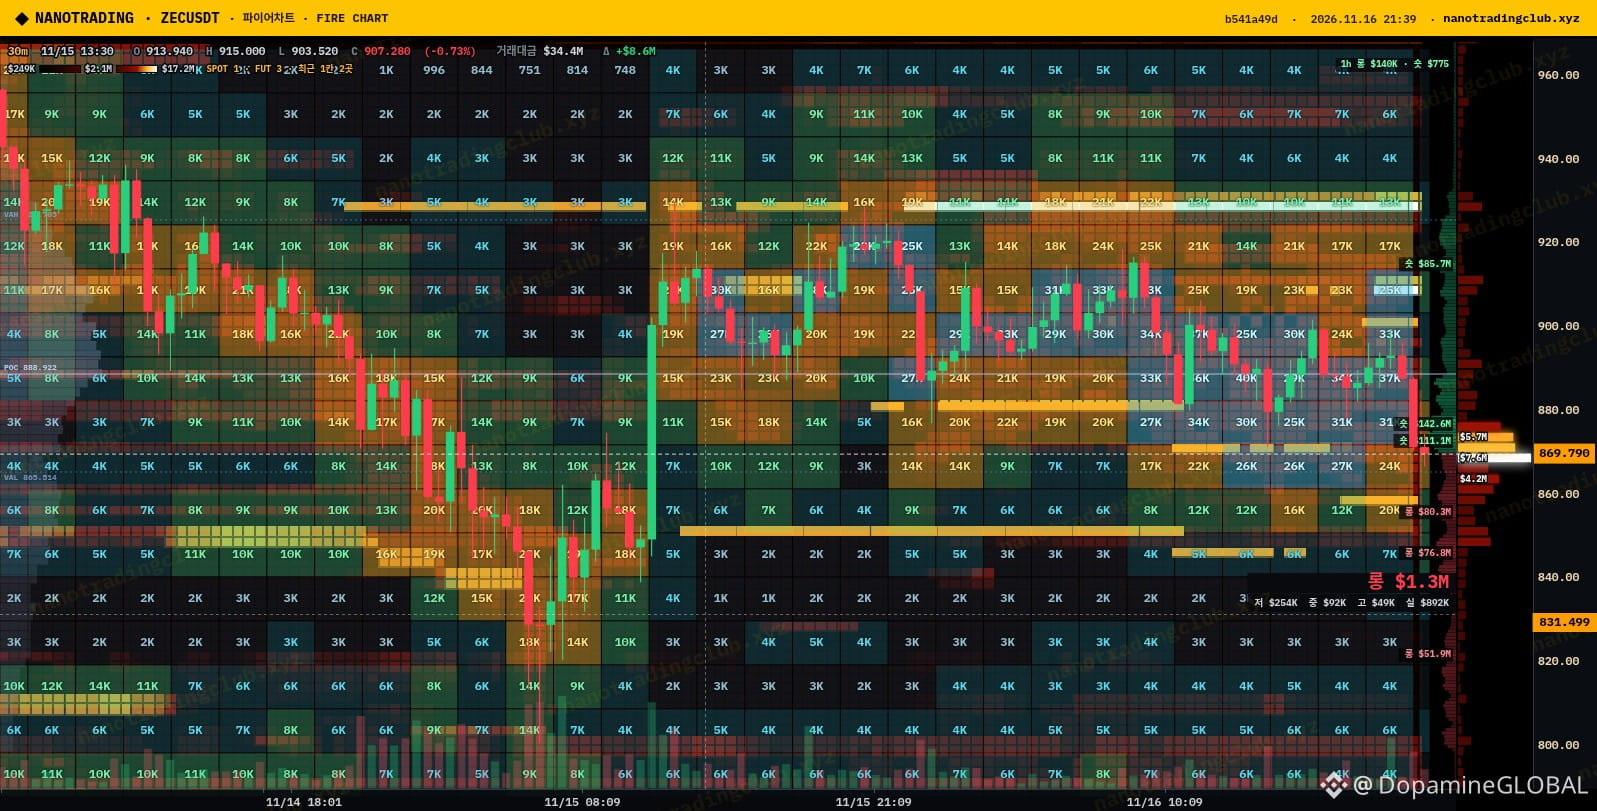
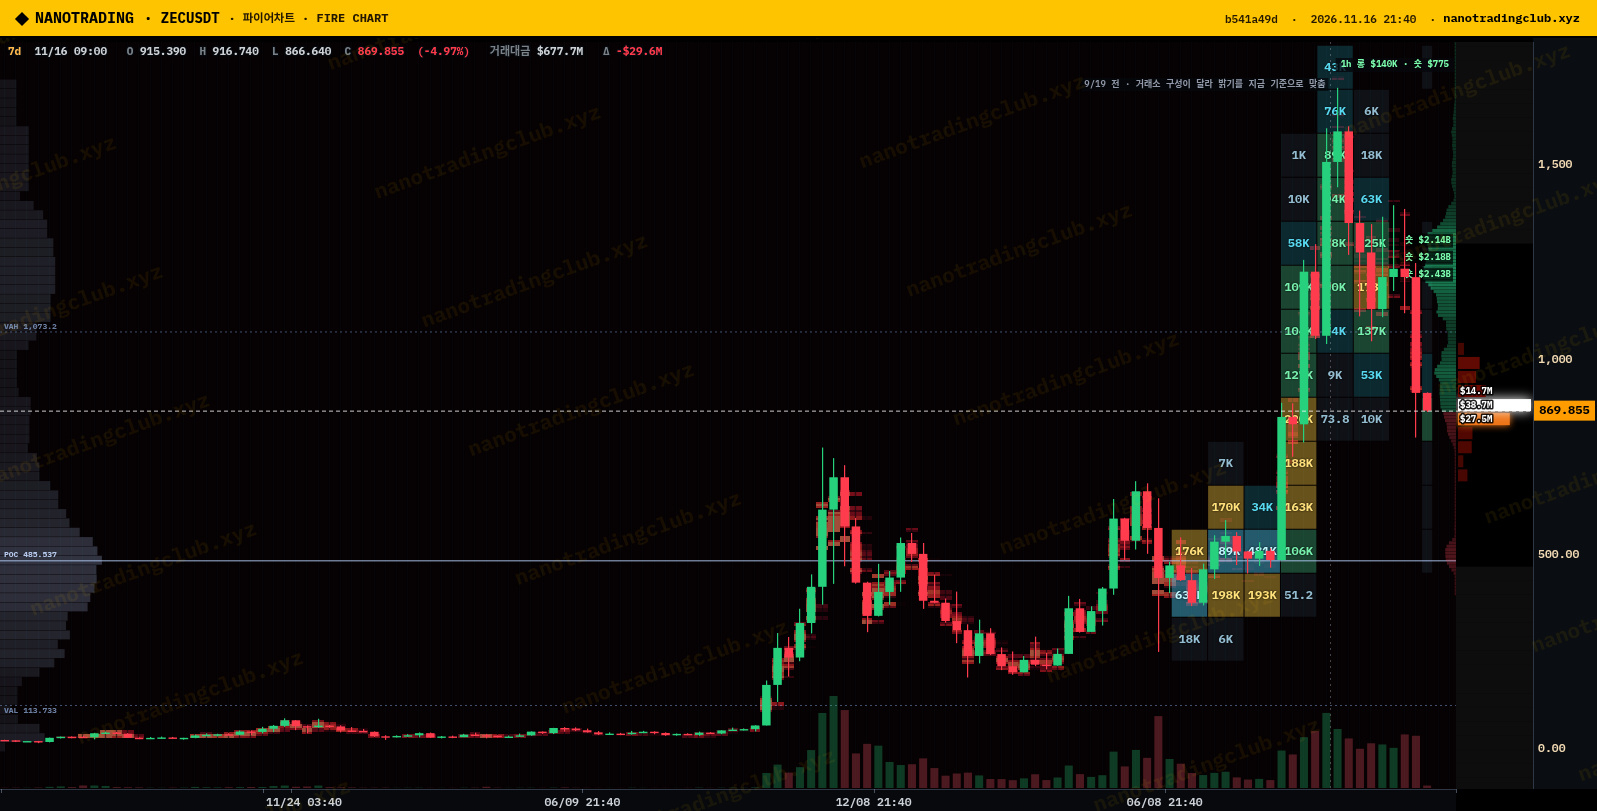
$ZEC is bleeding again tonight, down about 5.7% near 868 on the NanoTrading ticker, and the whole board is red with it: their scanner shows 49 coins up vs 201 down and Fear & Greed at 10.
What I'm watching is the 30m Fire liquidation map. Short liquidation tags are stacked right above us, roughly $111M near 873 and $143M near 877, with another $86M around 915. Under price the long tags sit around 856 ($80M), 846 ($77M) and 822 ($52M). So $ZEC is basically squeezed between two big pools, and whichever side gets tagged first probably decides the next few hours.
The 7d view is the reality check. Even after this dump ZEC is still way above the volume POC near 465, so the bigger trend isn't broken. But the scanner's sell wall at about 997 (roughly $3.1M, +14.6% from price) tells me the upside is capped for now. My plan: a reclaim of 877 opens a squeeze toward 915, while losing 846 means I wait for the 820s.
Source: NanoTrading Fire chart (nanotradingclub.xyz), 30m liquidation map + 7d heatmap, plus the wall scanner.
Short squeeze into 915 first, or do the longs at 846 get flushed before any bounce?
NFA, just my read 🔥
#ZEC #Zcash #NanoTrading #Privacy
$ZEC is bleeding again tonight, down about 5.7% near 868 on the NanoTrading ticker, and the whole board is red with it: their scanner shows 49 coins up vs 201 down and Fear & Greed at 10.
What I'm watching is the 30m Fire liquidation map. Short liquidation tags are stacked right above us, roughly $111M near 873 and $143M near 877, with another $86M around 915. Under price the long tags sit around 856 ($80M), 846 ($77M) and 822 ($52M). So $ZEC is basically squeezed between two big pools, and whichever side gets tagged first probably decides the next few hours.
The 7d view is the reality check. Even after this dump ZEC is still way above the volume POC near 465, so the bigger trend isn't broken. But the scanner's sell wall at about 997 (roughly $3.1M, +14.6% from price) tells me the upside is capped for now. My plan: a reclaim of 877 opens a squeeze toward 915, while losing 846 means I wait for the 820s.
Source: NanoTrading Fire chart (nanotradingclub.xyz), 30m liquidation map + 7d heatmap, plus the wall scanner.
Short squeeze into 915 first, or do the longs at 846 get flushed before any bounce?
NFA, just my read 🔥
#ZEC #Zcash #NanoTrading #Privacy
What I'm watching is the 30m Fire liquidation map. Short liquidation tags are stacked right above us, roughly $111M near 873 and $143M near 877, with another $86M around 915. Under price the long tags sit around 856 ($80M), 846 ($77M) and 822 ($52M). So $ZEC is basically squeezed between two big pools, and whichever side gets tagged first probably decides the next few hours.
The 7d view is the reality check. Even after this dump ZEC is still way above the volume POC near 465, so the bigger trend isn't broken. But the scanner's sell wall at about 997 (roughly $3.1M, +14.6% from price) tells me the upside is capped for now. My plan: a reclaim of 877 opens a squeeze toward 915, while losing 846 means I wait for the 820s.
Source: NanoTrading Fire chart (nanotradingclub.xyz), 30m liquidation map + 7d heatmap, plus the wall scanner.
Short squeeze into 915 first, or do the longs at 846 get flushed before any bounce?
NFA, just my read 🔥
#ZEC #Zcash #NanoTrading #Privacy
1
271
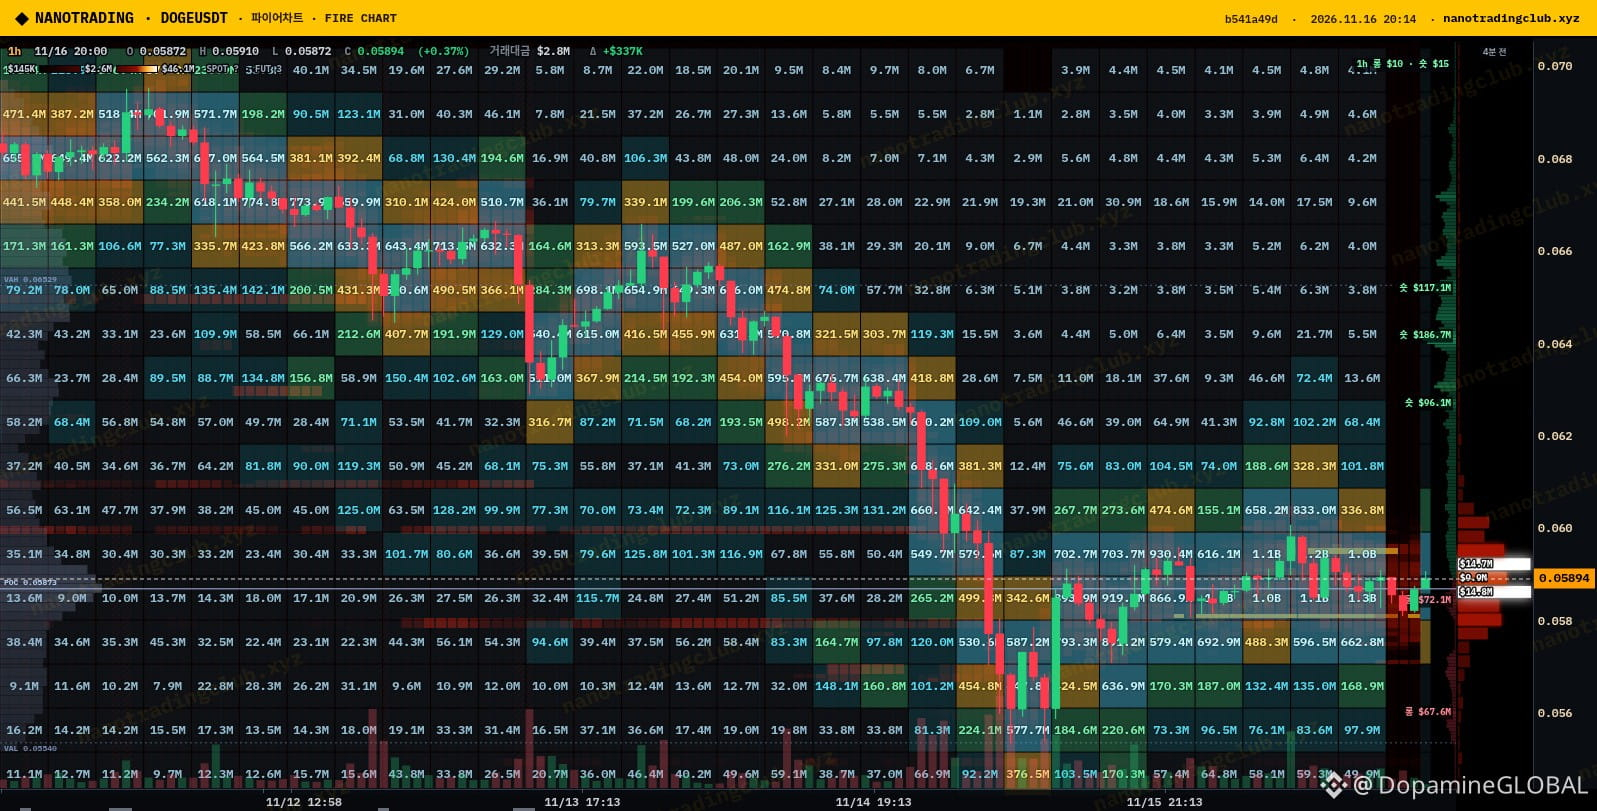
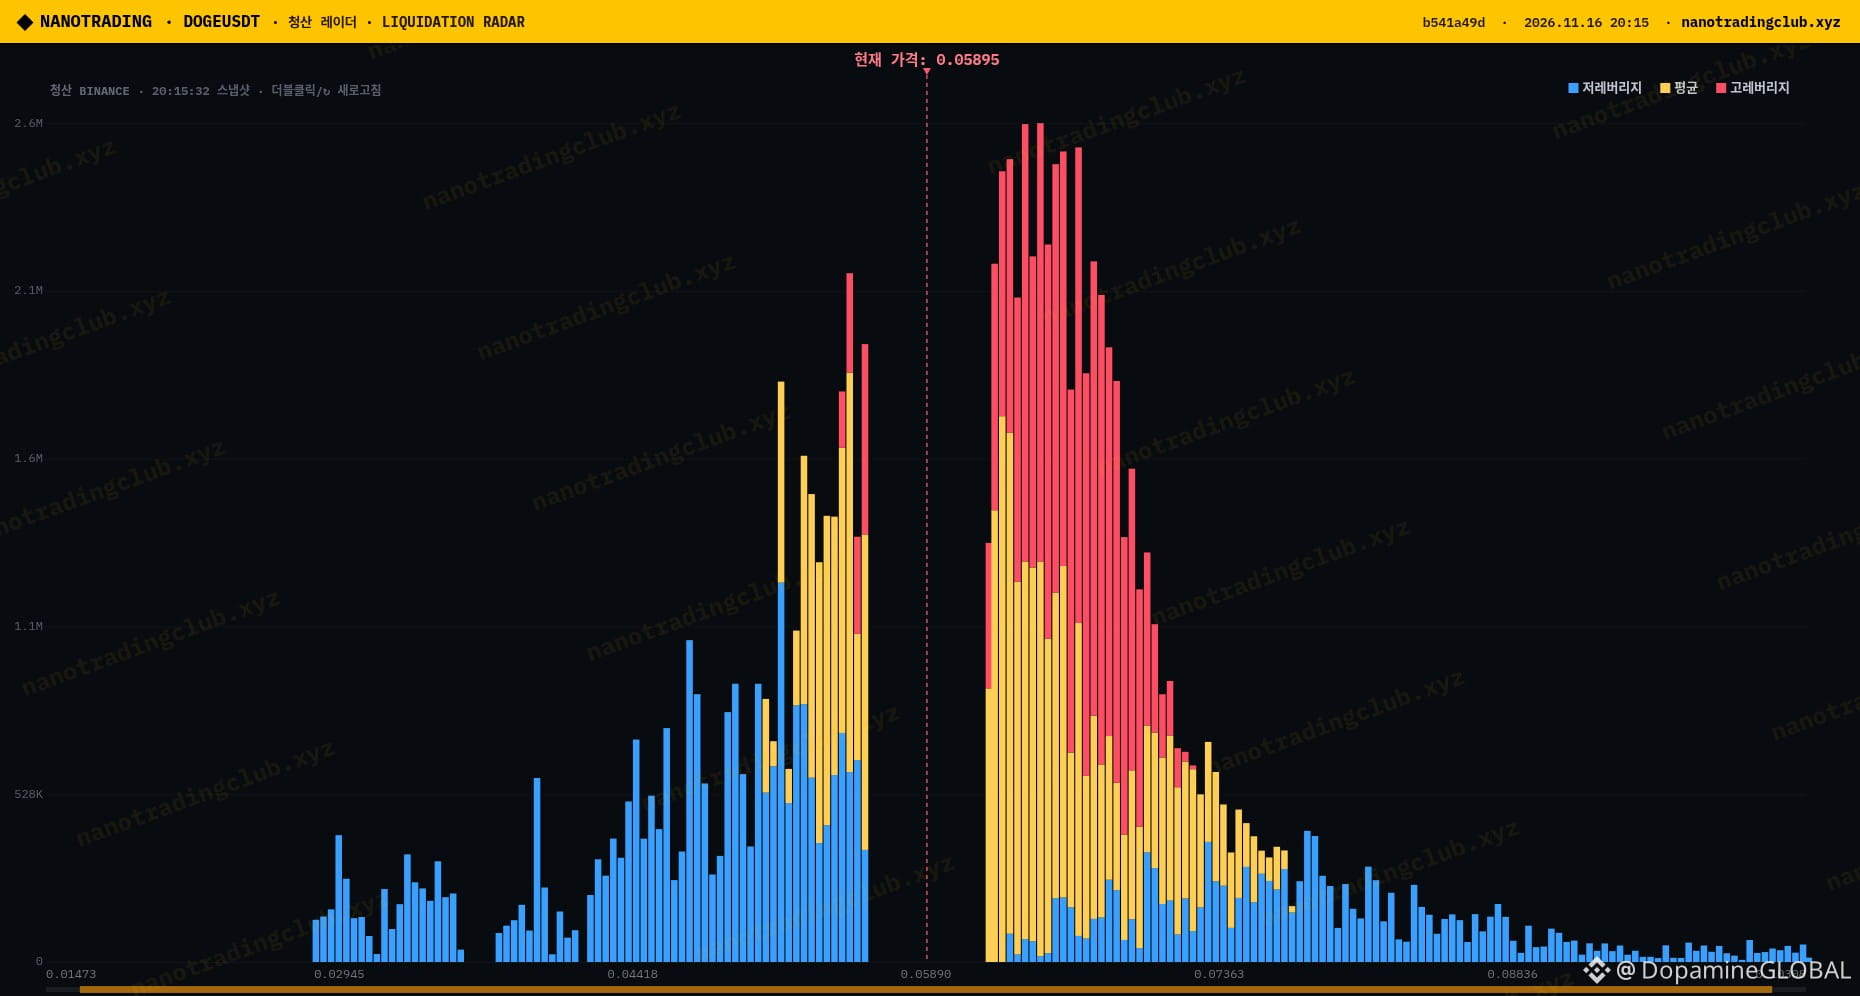
$DOGE has gone very quiet around 0.059, and honestly that's what caught my eye tonight. The NanoTrading wall scanner is flagging a buy wall at 0.0580, about 1.5% under price, roughly $1.68M in size and sitting there for 4 days now.
The 1h Fire chart with the integrated orderbook tells the bigger story: steady bleed from the 0.068 area since 11/12, then two days of tight chop between 0.058 and 0.0595. Close to price the book is basically 50/50, around $470-480K stacked on each side, so nobody is pushing yet. The heavier short-side liquidation tags sit higher up around 0.063-0.065, with a long-side tag down near 0.0565.
My read: as long as that 0.058 wall keeps absorbing, I like $DOGE for a slow grind back toward 0.0615-0.063. If 0.058 gets pulled or eaten, the next real magnet looks like 0.0565 and I'd step aside until then.
Source: NanoTrading Fire chart 1h orderbook view, liquidation radar and wall scanner (nanotradingclub.xyz).
Do you trust a 4-day-old wall, or do you think it gets pulled the moment price touches it?
NFA, just how I'm watching it 🐕
#DOGE #Dogecoin #NanoTrading #Memecoins
$DOGE has gone very quiet around 0.059, and honestly that's what caught my eye tonight. The NanoTrading wall scanner is flagging a buy wall at 0.0580, about 1.5% under price, roughly $1.68M in size and sitting there for 4 days now.
The 1h Fire chart with the integrated orderbook tells the bigger story: steady bleed from the 0.068 area since 11/12, then two days of tight chop between 0.058 and 0.0595. Close to price the book is basically 50/50, around $470-480K stacked on each side, so nobody is pushing yet. The heavier short-side liquidation tags sit higher up around 0.063-0.065, with a long-side tag down near 0.0565.
My read: as long as that 0.058 wall keeps absorbing, I like $DOGE for a slow grind back toward 0.0615-0.063. If 0.058 gets pulled or eaten, the next real magnet looks like 0.0565 and I'd step aside until then.
Source: NanoTrading Fire chart 1h orderbook view, liquidation radar and wall scanner (nanotradingclub.xyz).
Do you trust a 4-day-old wall, or do you think it gets pulled the moment price touches it?
NFA, just how I'm watching it 🐕
#DOGE #Dogecoin #NanoTrading #Memecoins
The 1h Fire chart with the integrated orderbook tells the bigger story: steady bleed from the 0.068 area since 11/12, then two days of tight chop between 0.058 and 0.0595. Close to price the book is basically 50/50, around $470-480K stacked on each side, so nobody is pushing yet. The heavier short-side liquidation tags sit higher up around 0.063-0.065, with a long-side tag down near 0.0565.
My read: as long as that 0.058 wall keeps absorbing, I like $DOGE for a slow grind back toward 0.0615-0.063. If 0.058 gets pulled or eaten, the next real magnet looks like 0.0565 and I'd step aside until then.
Source: NanoTrading Fire chart 1h orderbook view, liquidation radar and wall scanner (nanotradingclub.xyz).
Do you trust a 4-day-old wall, or do you think it gets pulled the moment price touches it?
NFA, just how I'm watching it 🐕
#DOGE #Dogecoin #NanoTrading #Memecoins
1
38
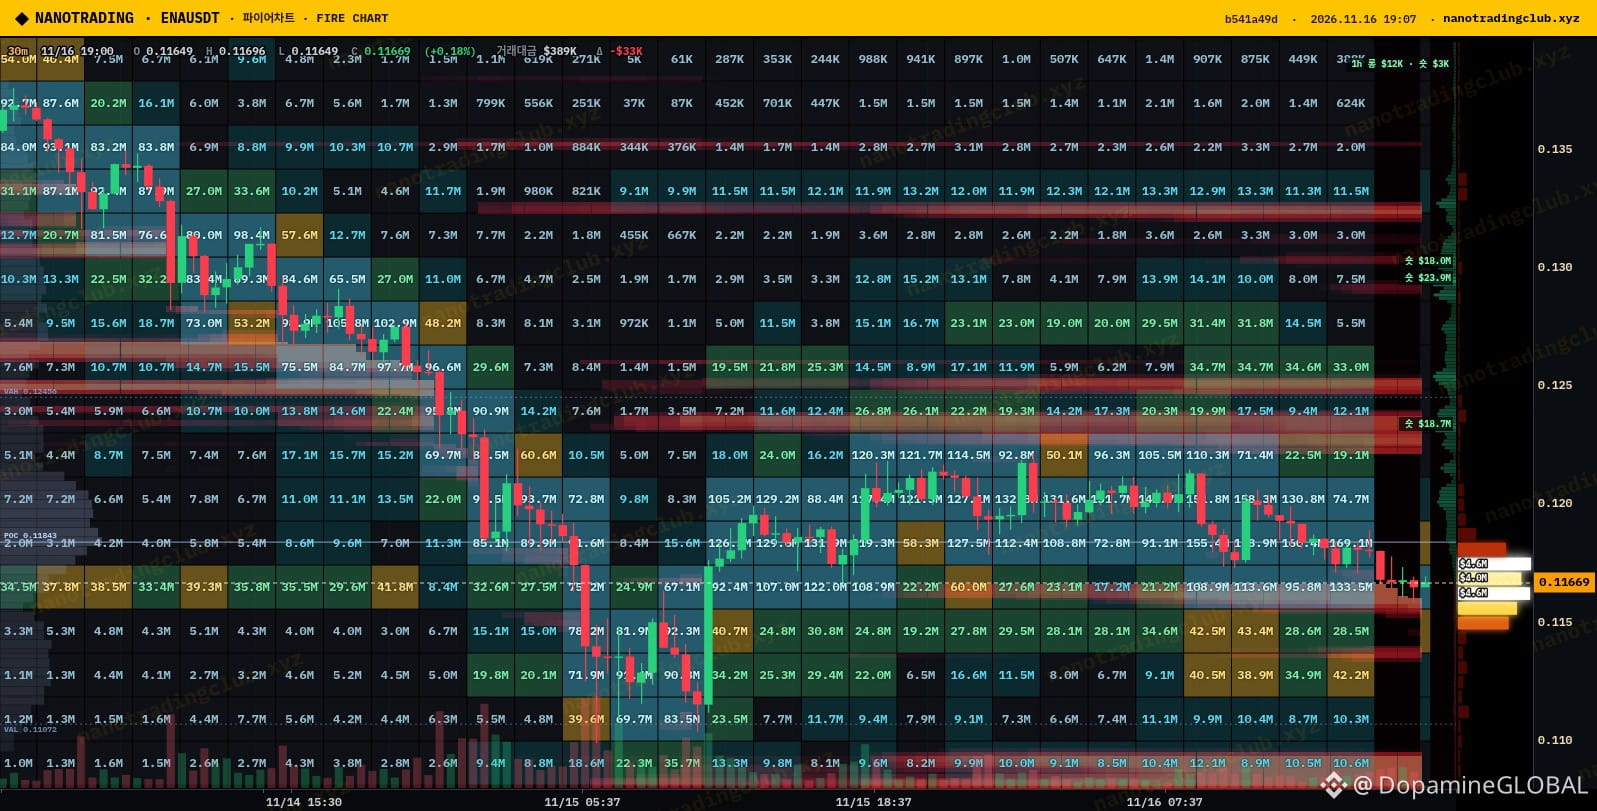
$ENA is one of the weaker majors today, down around 3.6% and sitting near 0.1167 on Binance futures. I don't see panic in the data though, more like people quietly stepping away.
Open interest slipped from about 516M to 512M contracts over the last ~24h (roughly $62M down to $60M), funding is flat at basically 0%, and positioning is mild: top traders 1.42 long, all accounts about 1.13. Nobody is crowded, nobody is getting squeezed yet.
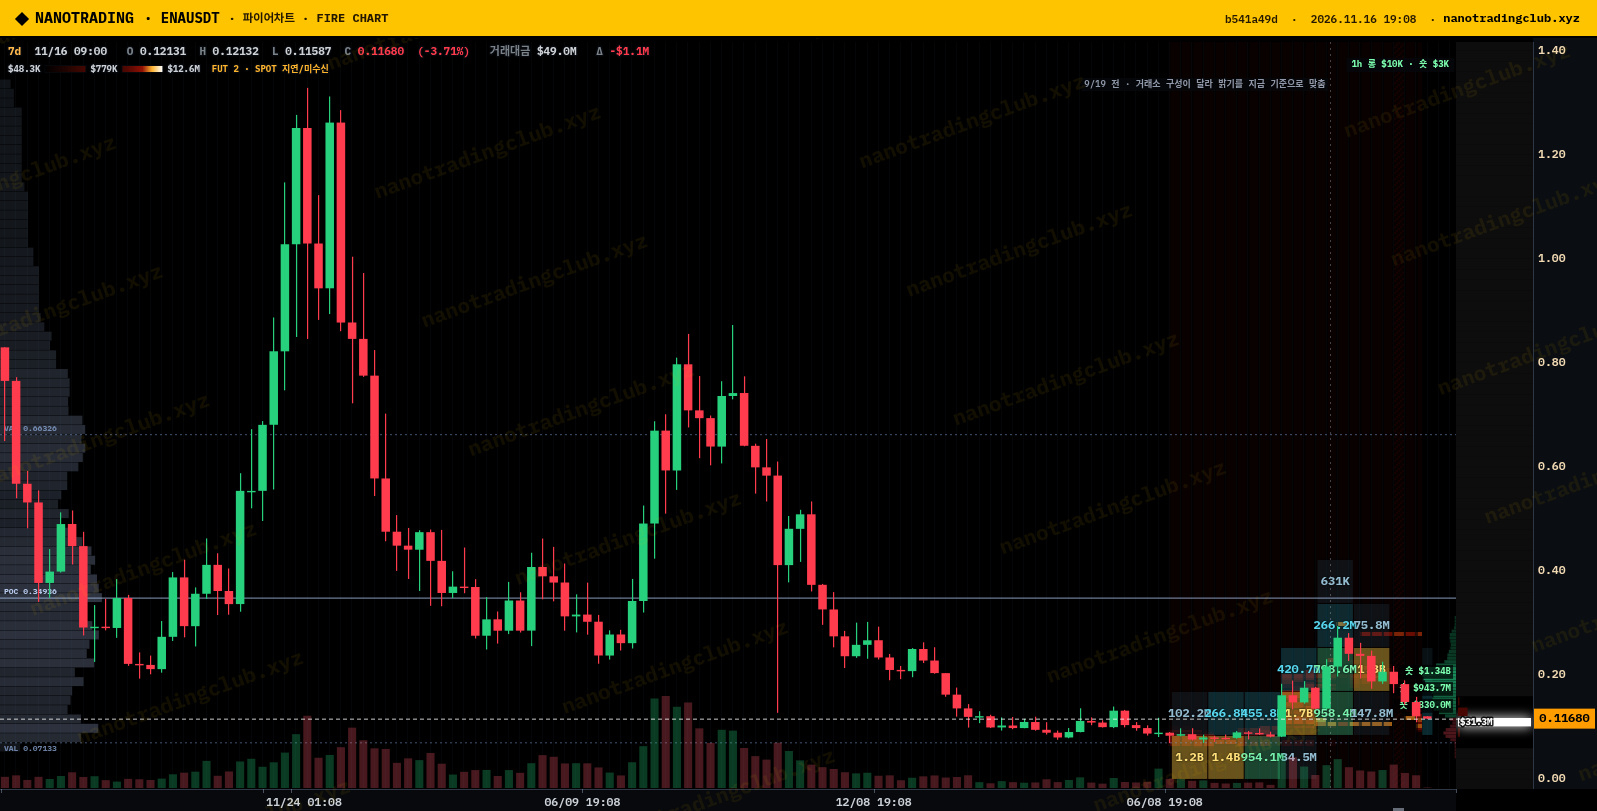
On the NanoTrading Fire 30m liquidation heatmap, the thick liquidity band sits right around 0.117-0.121 where $ENA has been chopping for two days, with dense cells just under price near 0.116. The short-side liquidation tags are further up: about $18.7M near 0.1255 and roughly $18-24M stacked around 0.130. The 7d heatmap mostly shows how far we are from the old range. My plan: as long as 0.115-0.116 holds I treat this as a base and 0.125 is the first magnet. A clean break under 0.115 and I'd rather wait lower.
Source: NanoTrading Fire chart (nanotradingclub.xyz), 30m liquidation heatmap + 7d heatmap. Data: Binance futures.
Base building here, or just a pause before another leg down?
NFA, just my take 📉
#ENA #Ethena #NanoTrading #Altcoins
$ENA is one of the weaker majors today, down around 3.6% and sitting near 0.1167 on Binance futures. I don't see panic in the data though, more like people quietly stepping away.
Open interest slipped from about 516M to 512M contracts over the last ~24h (roughly $62M down to $60M), funding is flat at basically 0%, and positioning is mild: top traders 1.42 long, all accounts about 1.13. Nobody is crowded, nobody is getting squeezed yet.
On the NanoTrading Fire 30m liquidation heatmap, the thick liquidity band sits right around 0.117-0.121 where $ENA has been chopping for two days, with dense cells just under price near 0.116. The short-side liquidation tags are further up: about $18.7M near 0.1255 and roughly $18-24M stacked around 0.130. The 7d heatmap mostly shows how far we are from the old range. My plan: as long as 0.115-0.116 holds I treat this as a base and 0.125 is the first magnet. A clean break under 0.115 and I'd rather wait lower.
Source: NanoTrading Fire chart (nanotradingclub.xyz), 30m liquidation heatmap + 7d heatmap. Data: Binance futures.
Base building here, or just a pause before another leg down?
NFA, just my take 📉
#ENA #Ethena #NanoTrading #Altcoins
Open interest slipped from about 516M to 512M contracts over the last ~24h (roughly $62M down to $60M), funding is flat at basically 0%, and positioning is mild: top traders 1.42 long, all accounts about 1.13. Nobody is crowded, nobody is getting squeezed yet.
On the NanoTrading Fire 30m liquidation heatmap, the thick liquidity band sits right around 0.117-0.121 where $ENA has been chopping for two days, with dense cells just under price near 0.116. The short-side liquidation tags are further up: about $18.7M near 0.1255 and roughly $18-24M stacked around 0.130. The 7d heatmap mostly shows how far we are from the old range. My plan: as long as 0.115-0.116 holds I treat this as a base and 0.125 is the first magnet. A clean break under 0.115 and I'd rather wait lower.
Source: NanoTrading Fire chart (nanotradingclub.xyz), 30m liquidation heatmap + 7d heatmap. Data: Binance futures.
Base building here, or just a pause before another leg down?
NFA, just my take 📉
#ENA #Ethena #NanoTrading #Altcoins
1
324
$SUI is grinding lower with the market, down about 1.6% on Binance futures and sitting at 0.7157, basically on its 24h low of 0.7138 after topping at 0.7398. Nothing dramatic on price, but the positioning bugs me.
Open interest barely moved over the last ~24h (around 94.6M to 95.9M contracts, ~$69M), funding is slightly negative at -0.0035%, yet the crowd is leaning hard long: about 2.0 longs per short by accounts, and top traders sit at 1.82. That's a lot of people buying a slow bleed.
I checked the NanoTrading liquidation radar and it makes the setup pretty clear. The tall high-leverage stack starts right above price and runs up to roughly 0.80, while below it's mostly lower-leverage stuff spread across 0.50-0.70. On the 1d liquidation heatmap the bigger short-side tags sit up around 0.83 (~$212M) and 0.89 (~$164M), with a long-side tag near 0.70 (~$126M). So my read: 0.70 is the line. Lose it and those crowded longs get flushed first; hold it and $SUI has a lot of fuel overhead if it squeezes back toward 0.80.
Source: NanoTrading liquidation radar + Fire chart 1d liquidation heatmap (nanotradingclub.xyz). Data: Binance futures.
Are you buying 0.70 or waiting for the flush?
NFA, just my read 🧐
#SUI #NanoTrading #Altcoins #CryptoMarket
$SUI is grinding lower with the market, down about 1.6% on Binance futures and sitting at 0.7157, basically on its 24h low of 0.7138 after topping at 0.7398. Nothing dramatic on price, but the positioning bugs me.
Open interest barely moved over the last ~24h (around 94.6M to 95.9M contracts, ~$69M), funding is slightly negative at -0.0035%, yet the crowd is leaning hard long: about 2.0 longs per short by accounts, and top traders sit at 1.82. That's a lot of people buying a slow bleed.
I checked the NanoTrading liquidation radar and it makes the setup pretty clear. The tall high-leverage stack starts right above price and runs up to roughly 0.80, while below it's mostly lower-leverage stuff spread across 0.50-0.70. On the 1d liquidation heatmap the bigger short-side tags sit up around 0.83 (~$212M) and 0.89 (~$164M), with a long-side tag near 0.70 (~$126M). So my read: 0.70 is the line. Lose it and those crowded longs get flushed first; hold it and $SUI has a lot of fuel overhead if it squeezes back toward 0.80.
Source: NanoTrading liquidation radar + Fire chart 1d liquidation heatmap (nanotradingclub.xyz). Data: Binance futures.
Are you buying 0.70 or waiting for the flush?
NFA, just my read 🧐
#SUI #NanoTrading #Altcoins #CryptoMarket
Open interest barely moved over the last ~24h (around 94.6M to 95.9M contracts, ~$69M), funding is slightly negative at -0.0035%, yet the crowd is leaning hard long: about 2.0 longs per short by accounts, and top traders sit at 1.82. That's a lot of people buying a slow bleed.
I checked the NanoTrading liquidation radar and it makes the setup pretty clear. The tall high-leverage stack starts right above price and runs up to roughly 0.80, while below it's mostly lower-leverage stuff spread across 0.50-0.70. On the 1d liquidation heatmap the bigger short-side tags sit up around 0.83 (~$212M) and 0.89 (~$164M), with a long-side tag near 0.70 (~$126M). So my read: 0.70 is the line. Lose it and those crowded longs get flushed first; hold it and $SUI has a lot of fuel overhead if it squeezes back toward 0.80.
Source: NanoTrading liquidation radar + Fire chart 1d liquidation heatmap (nanotradingclub.xyz). Data: Binance futures.
Are you buying 0.70 or waiting for the flush?
NFA, just my read 🧐
#SUI #NanoTrading #Altcoins #CryptoMarket
1
127
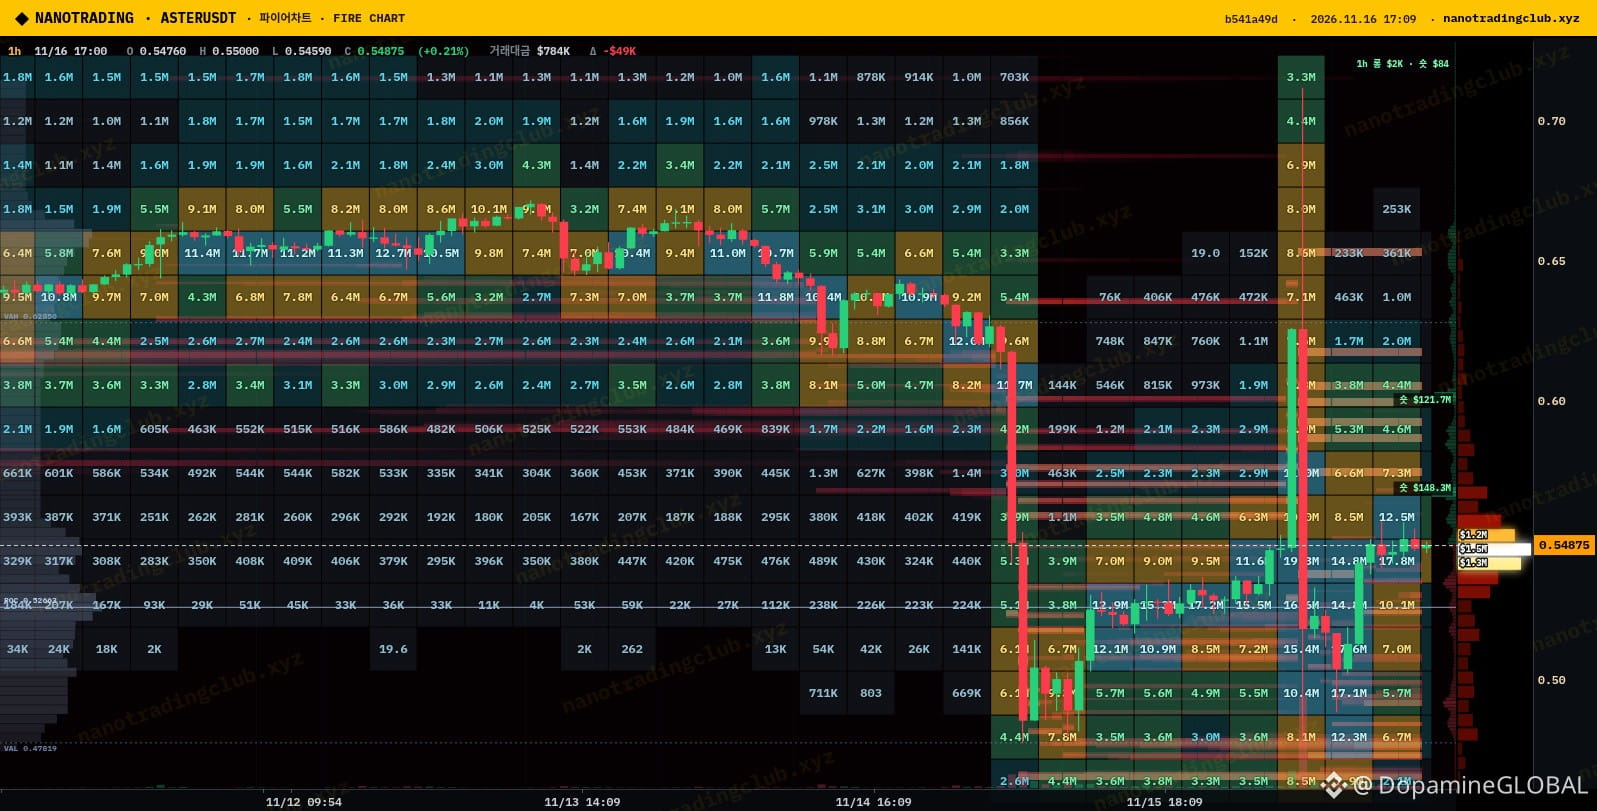
$ASTER had a wild 24h on Binance futures: it ripped to 0.7123, dumped all the way to 0.4805, and now sits around 0.548, still +3.8% on the day with about $453M in volume. That kind of range usually leaves a lot of trapped positions behind.
Open interest climbed from roughly 131.9M to 139.2M contracts over the last ~24h (about $70M to $76M), so people didn't leave after the wick, they reloaded. Funding is basically flat at +0.005%. Top traders lean long at about 2.26 by position, while all accounts are close to even at 1.06.
On the NanoTrading Fire 1h heatmap the thick liquidity cells (12-17M) are packed right around and just under price, roughly 0.52-0.55, which is where this keeps getting bid. Above, the short-side liquidation tags sit near 0.58-0.59 (~$148M) and around 0.60 (~$122M). My read: as long as $ASTER holds that 0.52-0.54 shelf, a push into 0.58-0.60 to flush those shorts is the path I'm watching. Losing 0.52 and I'm out of that idea.
Source: NanoTrading Fire chart (nanotradingclub.xyz), 1h heatmap. Data: Binance futures.
Do you think that 0.71 wick was the top, or just a preview?
NFA, just how I'm reading it 👀
#ASTER #NanoTrading #Altcoins #CryptoMarket
$ASTER had a wild 24h on Binance futures: it ripped to 0.7123, dumped all the way to 0.4805, and now sits around 0.548, still +3.8% on the day with about $453M in volume. That kind of range usually leaves a lot of trapped positions behind.
Open interest climbed from roughly 131.9M to 139.2M contracts over the last ~24h (about $70M to $76M), so people didn't leave after the wick, they reloaded. Funding is basically flat at +0.005%. Top traders lean long at about 2.26 by position, while all accounts are close to even at 1.06.
On the NanoTrading Fire 1h heatmap the thick liquidity cells (12-17M) are packed right around and just under price, roughly 0.52-0.55, which is where this keeps getting bid. Above, the short-side liquidation tags sit near 0.58-0.59 (~$148M) and around 0.60 (~$122M). My read: as long as $ASTER holds that 0.52-0.54 shelf, a push into 0.58-0.60 to flush those shorts is the path I'm watching. Losing 0.52 and I'm out of that idea.
Source: NanoTrading Fire chart (nanotradingclub.xyz), 1h heatmap. Data: Binance futures.
Do you think that 0.71 wick was the top, or just a preview?
NFA, just how I'm reading it 👀
#ASTER #NanoTrading #Altcoins #CryptoMarket
Open interest climbed from roughly 131.9M to 139.2M contracts over the last ~24h (about $70M to $76M), so people didn't leave after the wick, they reloaded. Funding is basically flat at +0.005%. Top traders lean long at about 2.26 by position, while all accounts are close to even at 1.06.
On the NanoTrading Fire 1h heatmap the thick liquidity cells (12-17M) are packed right around and just under price, roughly 0.52-0.55, which is where this keeps getting bid. Above, the short-side liquidation tags sit near 0.58-0.59 (~$148M) and around 0.60 (~$122M). My read: as long as $ASTER holds that 0.52-0.54 shelf, a push into 0.58-0.60 to flush those shorts is the path I'm watching. Losing 0.52 and I'm out of that idea.
Source: NanoTrading Fire chart (nanotradingclub.xyz), 1h heatmap. Data: Binance futures.
Do you think that 0.71 wick was the top, or just a preview?
NFA, just how I'm reading it 👀
#ASTER #NanoTrading #Altcoins #CryptoMarket
1
119
$PEPE is one of the weaker large caps today, 1000PEPE down about 4.3% on Binance futures and sitting right on its 24h low near 0.003747. What caught my eye is who's piling in.
Open interest went up while price went down: roughly 18.8B to 20.3B contracts over the last ~23h (+8%), and funding is pretty negative at -0.029%. That's fresh shorts pressing, not longs puking. Top traders are only 1.22 long, so the smart side isn't exactly loaded up either.
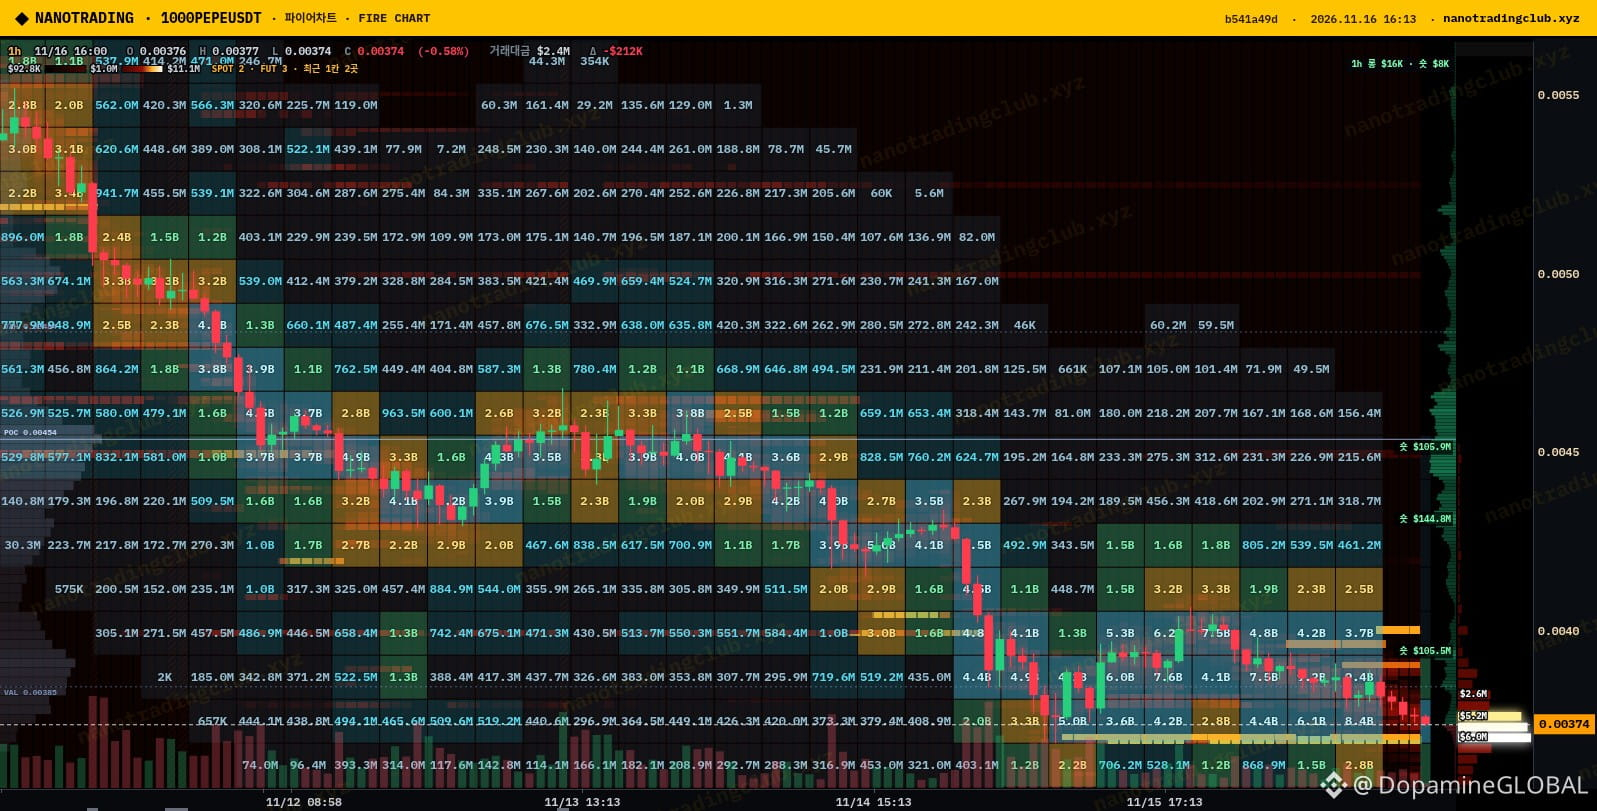
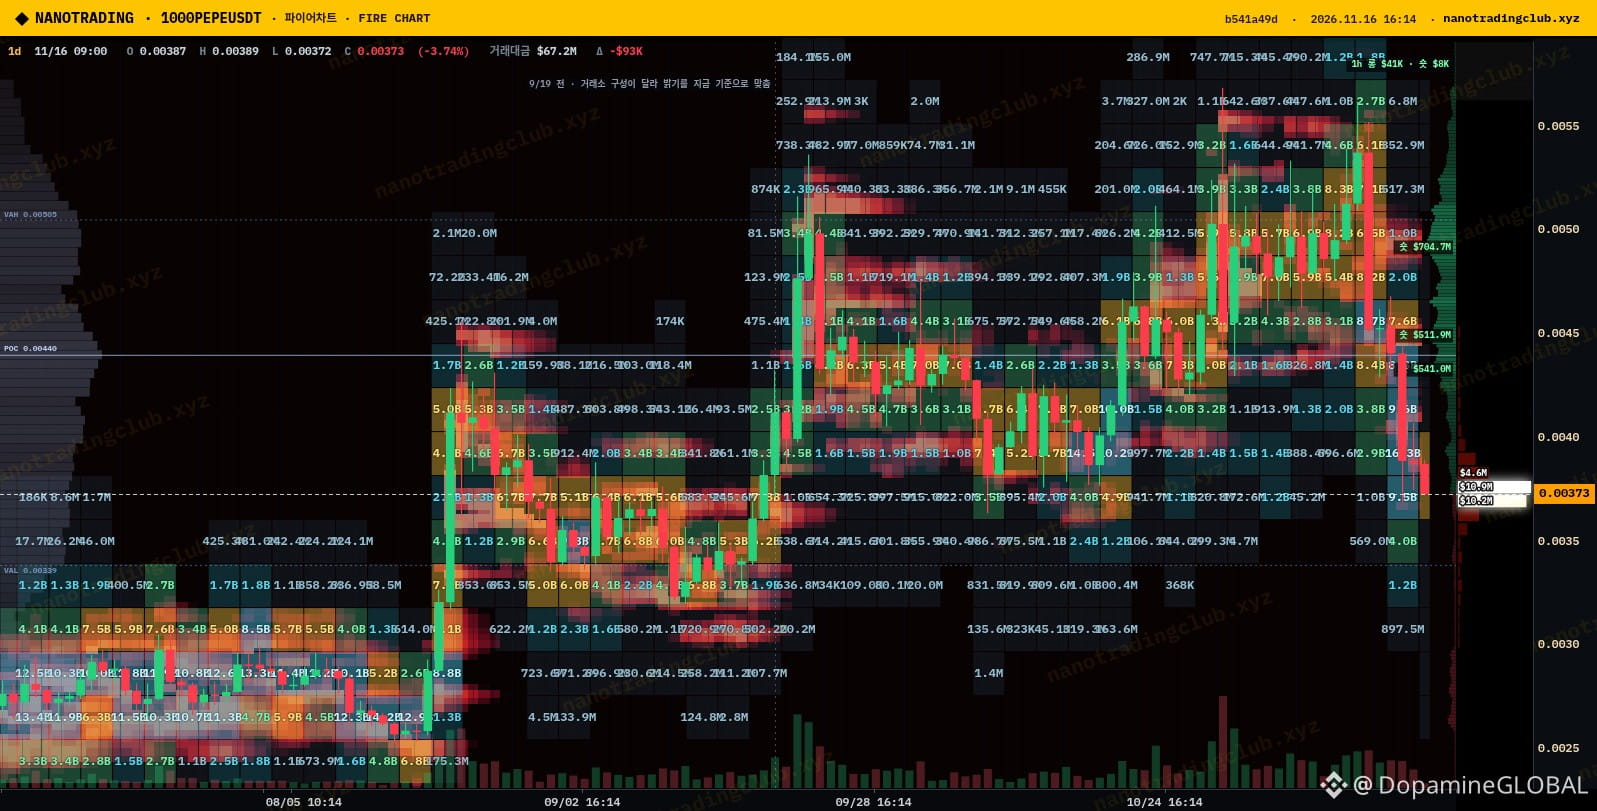
The NanoTrading Fire charts show where those shorts are exposed. On the 1h heatmap the short-side markers are stacked at about 0.0041 (~$105M), 0.0043-0.0044 (~$145M) and 0.00455. Zoom out to the 1d liquidation heatmap and it gets bigger: ~$511-563M around 0.0044-0.0045 and ~$705M near 0.0049, with the 1d POC at 0.0044. So the downside momentum is real, but crowded shorts plus negative funding is exactly how $PEPE squeezes. I'm not shorting the low here; a reclaim of 0.0039-0.0040 would have me watching for a run at that 0.0041-0.0044 pocket.
Charts (Fire heatmap 1h + liquidation heatmap 1d): NanoTrading (nanotradingclub.xyz). Data: Binance futures.
Short squeeze loading or just a slow bleed for memes? 🐸
NFA, just my read.
#PEPE #Memecoins #NanoTrading #CryptoMarket
$PEPE is one of the weaker large caps today, 1000PEPE down about 4.3% on Binance futures and sitting right on its 24h low near 0.003747. What caught my eye is who's piling in.
Open interest went up while price went down: roughly 18.8B to 20.3B contracts over the last ~23h (+8%), and funding is pretty negative at -0.029%. That's fresh shorts pressing, not longs puking. Top traders are only 1.22 long, so the smart side isn't exactly loaded up either.
The NanoTrading Fire charts show where those shorts are exposed. On the 1h heatmap the short-side markers are stacked at about 0.0041 (~$105M), 0.0043-0.0044 (~$145M) and 0.00455. Zoom out to the 1d liquidation heatmap and it gets bigger: ~$511-563M around 0.0044-0.0045 and ~$705M near 0.0049, with the 1d POC at 0.0044. So the downside momentum is real, but crowded shorts plus negative funding is exactly how $PEPE squeezes. I'm not shorting the low here; a reclaim of 0.0039-0.0040 would have me watching for a run at that 0.0041-0.0044 pocket.
Charts (Fire heatmap 1h + liquidation heatmap 1d): NanoTrading (nanotradingclub.xyz). Data: Binance futures.
Short squeeze loading or just a slow bleed for memes? 🐸
NFA, just my read.
#PEPE #Memecoins #NanoTrading #CryptoMarket
Open interest went up while price went down: roughly 18.8B to 20.3B contracts over the last ~23h (+8%), and funding is pretty negative at -0.029%. That's fresh shorts pressing, not longs puking. Top traders are only 1.22 long, so the smart side isn't exactly loaded up either.
The NanoTrading Fire charts show where those shorts are exposed. On the 1h heatmap the short-side markers are stacked at about 0.0041 (~$105M), 0.0043-0.0044 (~$145M) and 0.00455. Zoom out to the 1d liquidation heatmap and it gets bigger: ~$511-563M around 0.0044-0.0045 and ~$705M near 0.0049, with the 1d POC at 0.0044. So the downside momentum is real, but crowded shorts plus negative funding is exactly how $PEPE squeezes. I'm not shorting the low here; a reclaim of 0.0039-0.0040 would have me watching for a run at that 0.0041-0.0044 pocket.
Charts (Fire heatmap 1h + liquidation heatmap 1d): NanoTrading (nanotradingclub.xyz). Data: Binance futures.
Short squeeze loading or just a slow bleed for memes? 🐸
NFA, just my read.
#PEPE #Memecoins #NanoTrading #CryptoMarket
91
$ADA is quietly one of the better majors today, up about 2.1% on Binance futures to 0.1526 while most of the board is flat. I pulled the NanoTrading Fire heatmap to see if this has room or is just a relief pop.
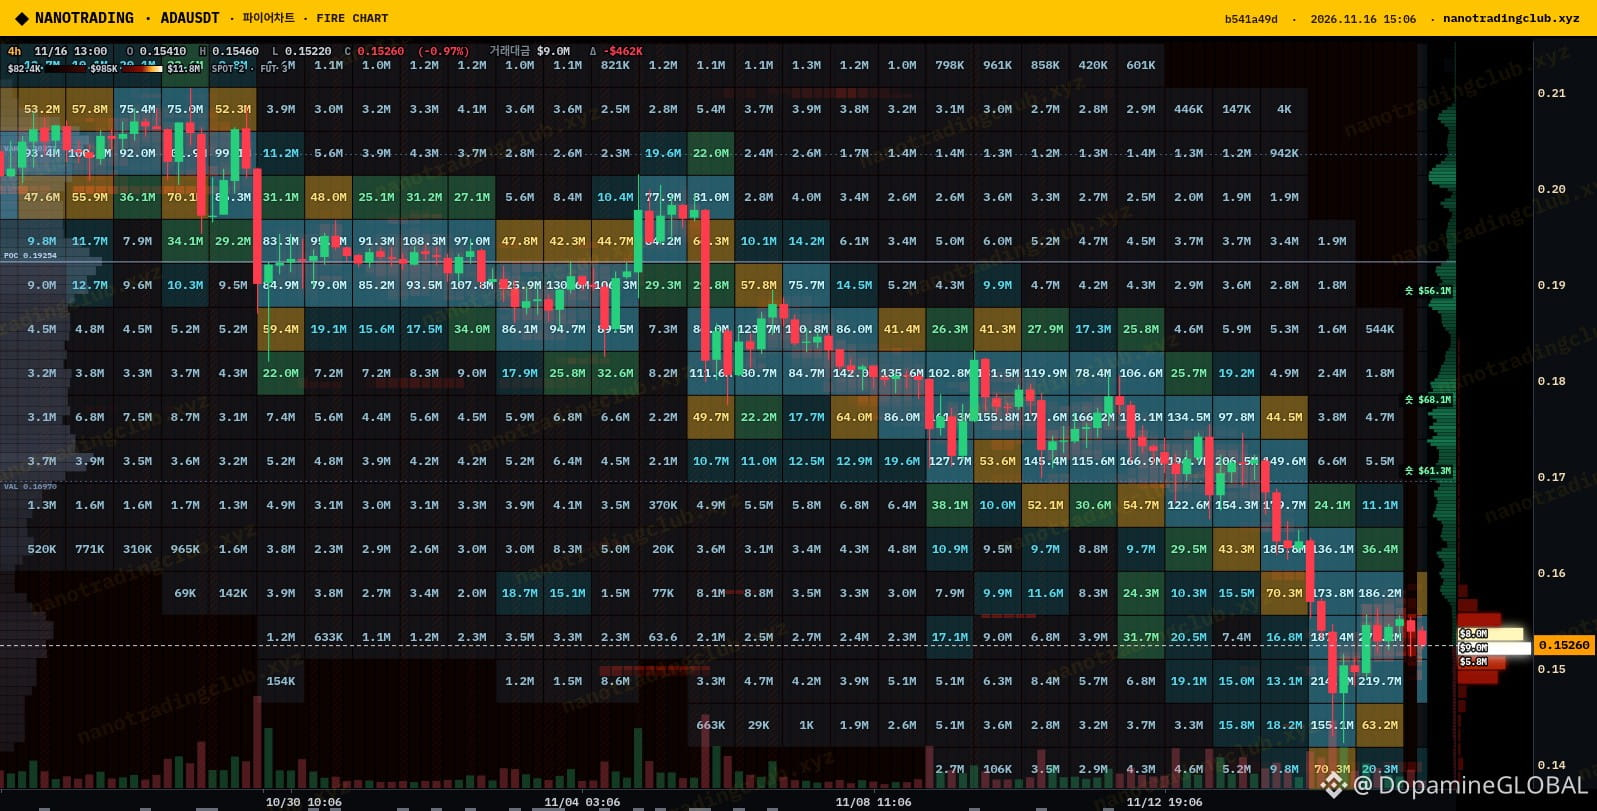
On the 4h heatmap the answer is a lot of overhead. The value area low sits near 0.1697 and the POC up at 0.1925, with thick liquidity stacked from roughly 0.16 through 0.17-0.18. So 0.16 is the first real test, and above that it's layer after layer of old supply from the late October range.
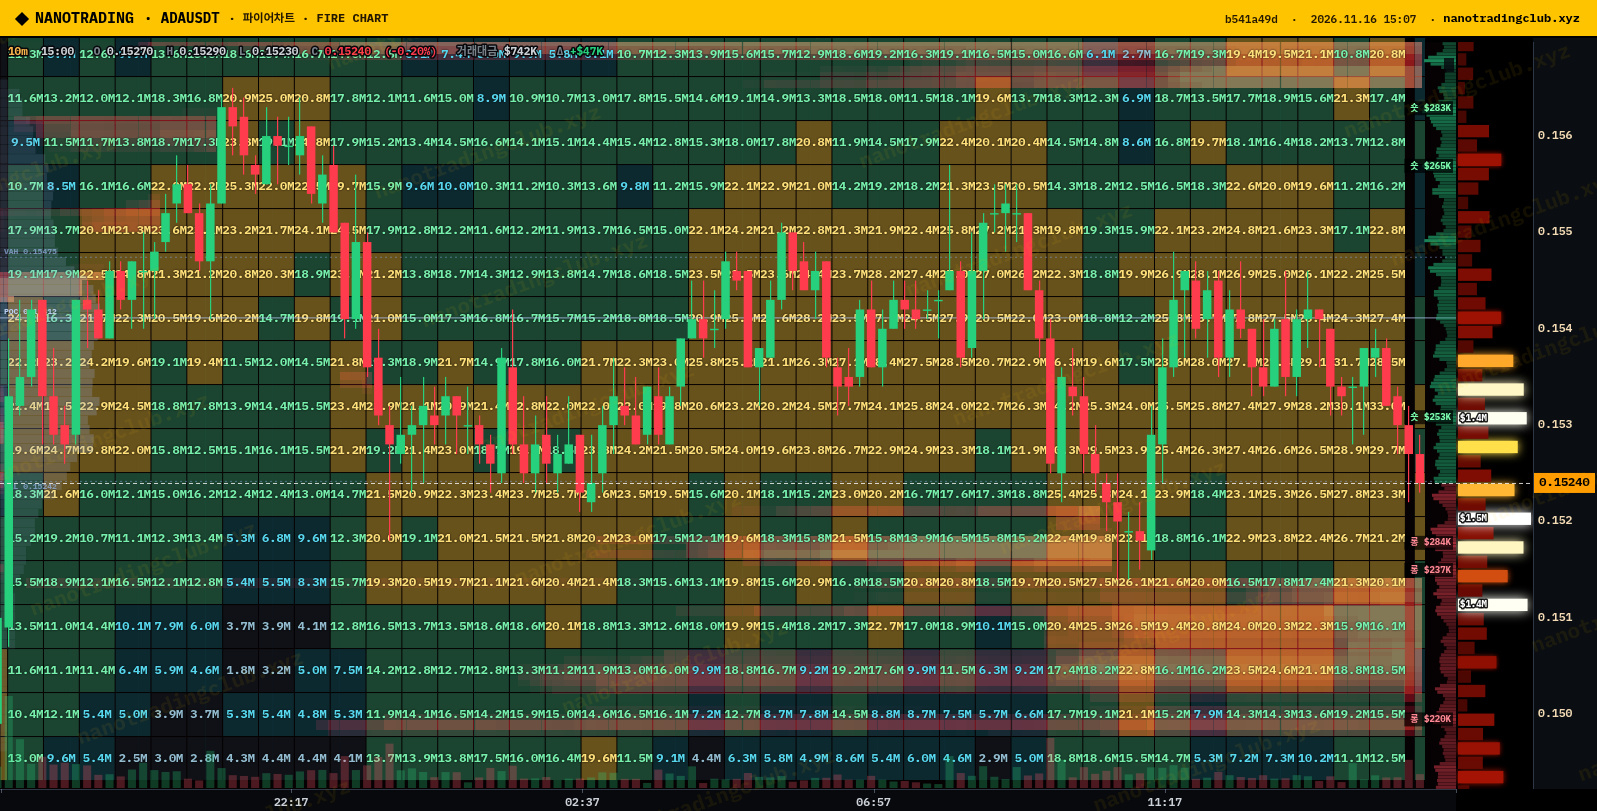
The 10m liquidation view is tighter: small clusters (~$250-280K each) packed right around 0.153-0.156 above and 0.150-0.152 below. Fine for scalps, but nothing big enough to force a squeeze. Futures side: funding is negative (-0.0134%), OI actually slipped from ~343.0M to ~338.0M ADA over the last ~23h, and accounts are still 2.16 long. A pump with OI dropping and negative funding looks like shorts covering to me, not fresh conviction. I'd want $ADA to hold 0.150 on dips before I believe a run at 0.16.
Charts (Fire heatmap 4h + liquidation heatmap 10m): NanoTrading (nanotradingclub.xyz). Data: Binance futures.
Is $ADA finally waking up, or is this just short covering? 📈
NFA, just how I see it.
#ADA #Cardano #NanoTrading #Altcoins
$ADA is quietly one of the better majors today, up about 2.1% on Binance futures to 0.1526 while most of the board is flat. I pulled the NanoTrading Fire heatmap to see if this has room or is just a relief pop.
On the 4h heatmap the answer is a lot of overhead. The value area low sits near 0.1697 and the POC up at 0.1925, with thick liquidity stacked from roughly 0.16 through 0.17-0.18. So 0.16 is the first real test, and above that it's layer after layer of old supply from the late October range.
The 10m liquidation view is tighter: small clusters (~$250-280K each) packed right around 0.153-0.156 above and 0.150-0.152 below. Fine for scalps, but nothing big enough to force a squeeze. Futures side: funding is negative (-0.0134%), OI actually slipped from ~343.0M to ~338.0M ADA over the last ~23h, and accounts are still 2.16 long. A pump with OI dropping and negative funding looks like shorts covering to me, not fresh conviction. I'd want $ADA to hold 0.150 on dips before I believe a run at 0.16.
Charts (Fire heatmap 4h + liquidation heatmap 10m): NanoTrading (nanotradingclub.xyz). Data: Binance futures.
Is $ADA finally waking up, or is this just short covering? 📈
NFA, just how I see it.
#ADA #Cardano #NanoTrading #Altcoins
On the 4h heatmap the answer is a lot of overhead. The value area low sits near 0.1697 and the POC up at 0.1925, with thick liquidity stacked from roughly 0.16 through 0.17-0.18. So 0.16 is the first real test, and above that it's layer after layer of old supply from the late October range.
The 10m liquidation view is tighter: small clusters (~$250-280K each) packed right around 0.153-0.156 above and 0.150-0.152 below. Fine for scalps, but nothing big enough to force a squeeze. Futures side: funding is negative (-0.0134%), OI actually slipped from ~343.0M to ~338.0M ADA over the last ~23h, and accounts are still 2.16 long. A pump with OI dropping and negative funding looks like shorts covering to me, not fresh conviction. I'd want $ADA to hold 0.150 on dips before I believe a run at 0.16.
Charts (Fire heatmap 4h + liquidation heatmap 10m): NanoTrading (nanotradingclub.xyz). Data: Binance futures.
Is $ADA finally waking up, or is this just short covering? 📈
NFA, just how I see it.
#ADA #Cardano #NanoTrading #Altcoins
105
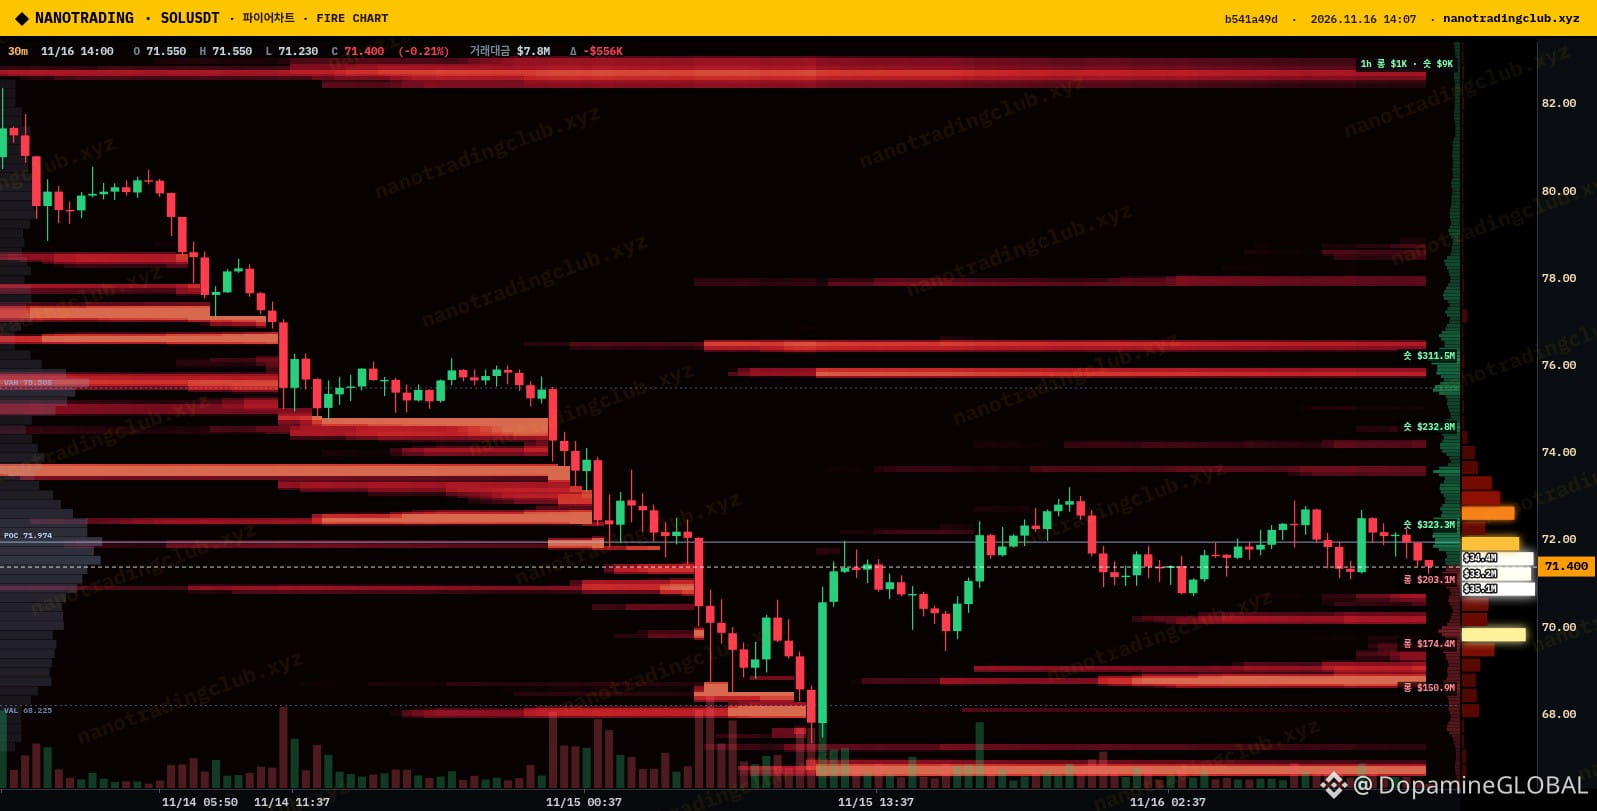
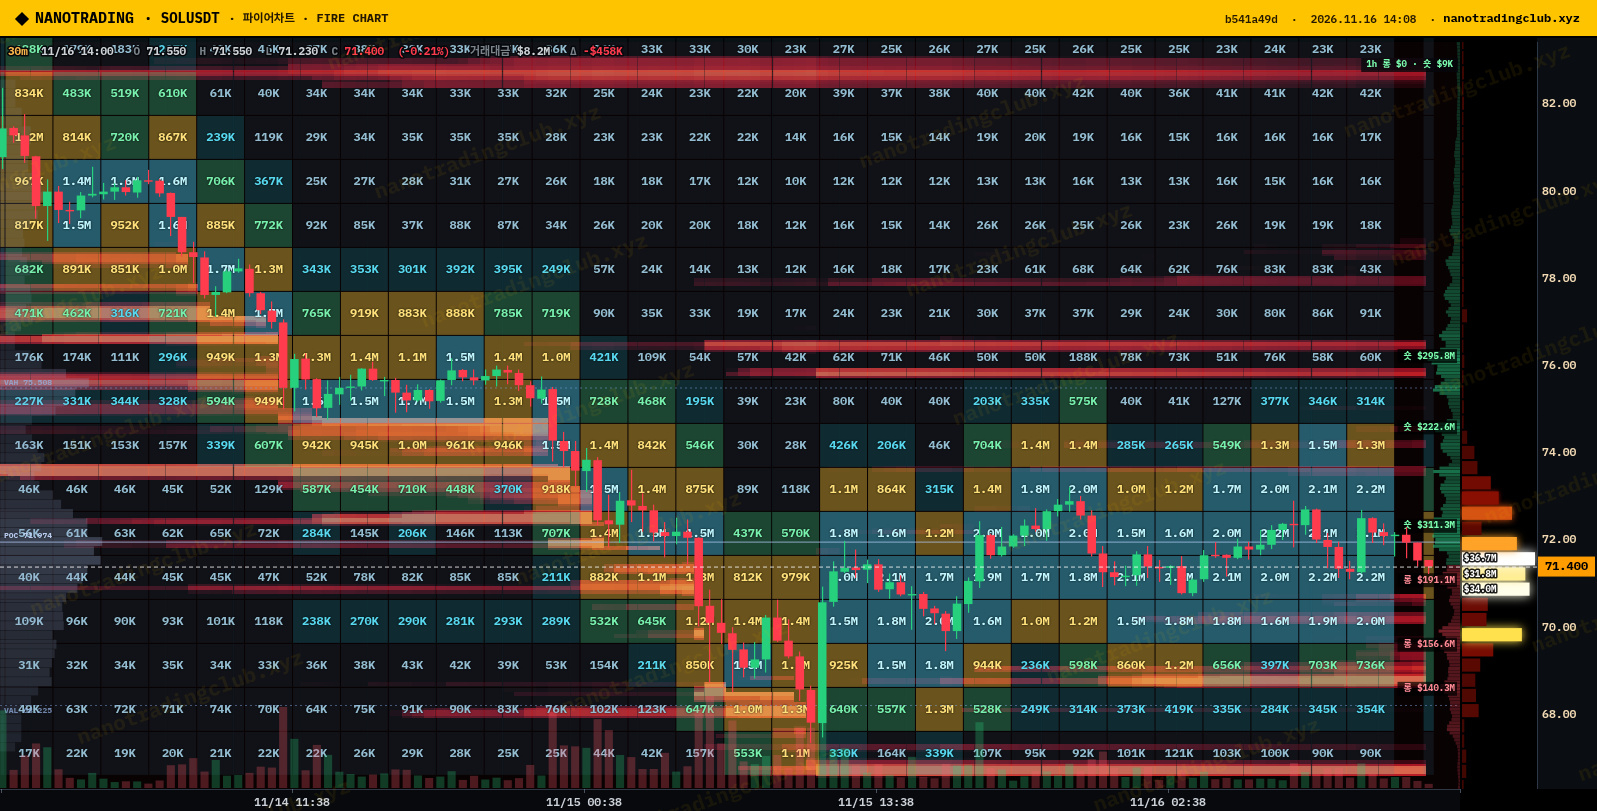
$SOL is sitting at 71.4 and the 30m liquidation heatmap on NanoTrading looks like a coiled spring to me. Right above price there's a short cluster marked around 72.2 (~$323M), then more stacked near 74.3 and 76. Right below, the long side is heavier: ~$263M near 71.2 and the big one, ~$574M, around 70.2.
The integrated orderbook view tells the same story. The fattest cells sit in the 70-72 rows, so this tight 70-72 box is where the real liquidity lives. Whichever side of it breaks first probably gets dragged to the next band fast.
Binance futures data has me leaning cautious on longs. SOLUSDT funding is negative (-0.0125%), OI slipped from about 9.19M to 8.93M SOL over the last ~23h, but the account long/short ratio is still 3.59 and top traders are ~1.93 long. That many longs with a $574M pocket under 70.2 looks like an easy target to me. I'd want a clean 30m close above 72.2 before trusting upside; lose 70 and I expect a quick sweep toward 69-68.
Charts (Fire liquidation heatmap + integrated orderbook, 30m): NanoTrading (nanotradingclub.xyz). Data: Binance futures.
Which side of 70-72 do you think gets hunted first? 🤔
NFA, just my read.
#SOL #Solana #NanoTrading #CryptoMarket
$SOL is sitting at 71.4 and the 30m liquidation heatmap on NanoTrading looks like a coiled spring to me. Right above price there's a short cluster marked around 72.2 (~$323M), then more stacked near 74.3 and 76. Right below, the long side is heavier: ~$263M near 71.2 and the big one, ~$574M, around 70.2.
The integrated orderbook view tells the same story. The fattest cells sit in the 70-72 rows, so this tight 70-72 box is where the real liquidity lives. Whichever side of it breaks first probably gets dragged to the next band fast.
Binance futures data has me leaning cautious on longs. SOLUSDT funding is negative (-0.0125%), OI slipped from about 9.19M to 8.93M SOL over the last ~23h, but the account long/short ratio is still 3.59 and top traders are ~1.93 long. That many longs with a $574M pocket under 70.2 looks like an easy target to me. I'd want a clean 30m close above 72.2 before trusting upside; lose 70 and I expect a quick sweep toward 69-68.
Charts (Fire liquidation heatmap + integrated orderbook, 30m): NanoTrading (nanotradingclub.xyz). Data: Binance futures.
Which side of 70-72 do you think gets hunted first? 🤔
NFA, just my read.
#SOL #Solana #NanoTrading #CryptoMarket
The integrated orderbook view tells the same story. The fattest cells sit in the 70-72 rows, so this tight 70-72 box is where the real liquidity lives. Whichever side of it breaks first probably gets dragged to the next band fast.
Binance futures data has me leaning cautious on longs. SOLUSDT funding is negative (-0.0125%), OI slipped from about 9.19M to 8.93M SOL over the last ~23h, but the account long/short ratio is still 3.59 and top traders are ~1.93 long. That many longs with a $574M pocket under 70.2 looks like an easy target to me. I'd want a clean 30m close above 72.2 before trusting upside; lose 70 and I expect a quick sweep toward 69-68.
Charts (Fire liquidation heatmap + integrated orderbook, 30m): NanoTrading (nanotradingclub.xyz). Data: Binance futures.
Which side of 70-72 do you think gets hunted first? 🤔
NFA, just my read.
#SOL #Solana #NanoTrading #CryptoMarket
58
Log in to explore more content
Join global crypto users on Binance Square
⚡️ Get latest and useful information about crypto.
💬 Trusted by the world’s largest crypto exchange.
👍 Discover real insights from verified creators.
Email / Phone number
Trending Topics
NvidiaEarningsTonight:AIStocks’NextMove?
12,559 views
231 Discussing
Nvidia Earnings Day: Interim CEO's First Appearance — Can the AI Story Hold?
Binance News
·8 Likes
·4.3k views
A Packed Week of Earnings and Data Tests Markets
99,175 views
534 Discussing
AnthropicIPOTestsInvestorAppetiteForAI
204,169 views
2,058 Discussing