
Tra100d
206 Posts

Tra100d
Report
Block User
3 Following
53 Followers
59 Liked
Posts
·
--
📊 Capitulation day in the crypto market: the Fear and Greed Index plunges from 20 to 13 (Extreme Fear), and among Binance pairs with more than $20M in volume, only one coin manages to trade in positive territory.
📌 3 key facts from the day:
• $SHELL stands out with a 50.5% gain to $0.0297 ($39.0M in volume, 56.2 times its daily average), after trading between a low of $0.01856 and a high of $0.05057; in futures, its open interest jumps 220.5% with negative funding (−0.0072%).
• Behind SHELL, even the rest of the 24-hour top 5 performers are in the red: INJ (−1.0% to $7.82), XRP (−2.8% to $0.9903), ETH (−3.4% to $1,891.08), and TAO (−3.6% to $205.30).
• The biggest declines by volume are led by $ZEC (−9.9% to $879.84 with $156.6M in volume), HYPE (−9.0% to $67.95), ENA (−8.9% to $0.126), UNI (−7.9% to $5.401), and $SOL (−6.8% to $75.35 with $267.9M traded).
🔍 Why it matters: seeing just one coin in the green within the liquidity filter (>$20M), alongside a Fear and Greed Index reading of 13, signals widespread risk aversion, with liquidity concentrated in isolated moves like SHELL's (+220.5% open interest).
What does a Fear and Greed Index reading of 13 tell you: excessive panic or necessary weekend caution? 👇
#MercadoCripto #Altcoins #Cripto #Binance #Tra100d
⚠️ For informational and educational purposes only; this is not financial advice. Cryptocurrencies are volatile: do your own research and trade with caution.
📊 Capitulation day in the crypto market: the Fear and Greed Index plunges from 20 to 13 (Extreme Fear), and among Binance pairs with more than $20M in volume, only one coin manages to trade in positive territory.
📌 3 key facts from the day:
• $SHELL stands out with a 50.5% gain to $0.0297 ($39.0M in volume, 56.2 times its daily average), after trading between a low of $0.01856 and a high of $0.05057; in futures, its open interest jumps 220.5% with negative funding (−0.0072%).
• Behind SHELL, even the rest of the 24-hour top 5 performers are in the red: INJ (−1.0% to $7.82), XRP (−2.8% to $0.9903), ETH (−3.4% to $1,891.08), and TAO (−3.6% to $205.30).
• The biggest declines by volume are led by $ZEC (−9.9% to $879.84 with $156.6M in volume), HYPE (−9.0% to $67.95), ENA (−8.9% to $0.126), UNI (−7.9% to $5.401), and $SOL (−6.8% to $75.35 with $267.9M traded).
🔍 Why it matters: seeing just one coin in the green within the liquidity filter (>$20M), alongside a Fear and Greed Index reading of 13, signals widespread risk aversion, with liquidity concentrated in isolated moves like SHELL's (+220.5% open interest).
What does a Fear and Greed Index reading of 13 tell you: excessive panic or necessary weekend caution? 👇
#MercadoCripto #Altcoins #Cripto #Binance #Tra100d
⚠️ For informational and educational purposes only; this is not financial advice. Cryptocurrencies are volatile: do your own research and trade with caution.
📌 3 key facts from the day:
• $SHELL stands out with a 50.5% gain to $0.0297 ($39.0M in volume, 56.2 times its daily average), after trading between a low of $0.01856 and a high of $0.05057; in futures, its open interest jumps 220.5% with negative funding (−0.0072%).
• Behind SHELL, even the rest of the 24-hour top 5 performers are in the red: INJ (−1.0% to $7.82), XRP (−2.8% to $0.9903), ETH (−3.4% to $1,891.08), and TAO (−3.6% to $205.30).
• The biggest declines by volume are led by $ZEC (−9.9% to $879.84 with $156.6M in volume), HYPE (−9.0% to $67.95), ENA (−8.9% to $0.126), UNI (−7.9% to $5.401), and $SOL (−6.8% to $75.35 with $267.9M traded).
🔍 Why it matters: seeing just one coin in the green within the liquidity filter (>$20M), alongside a Fear and Greed Index reading of 13, signals widespread risk aversion, with liquidity concentrated in isolated moves like SHELL's (+220.5% open interest).
What does a Fear and Greed Index reading of 13 tell you: excessive panic or necessary weekend caution? 👇
#MercadoCripto #Altcoins #Cripto #Binance #Tra100d
⚠️ For informational and educational purposes only; this is not financial advice. Cryptocurrencies are volatile: do your own research and trade with caution.
180
·
--
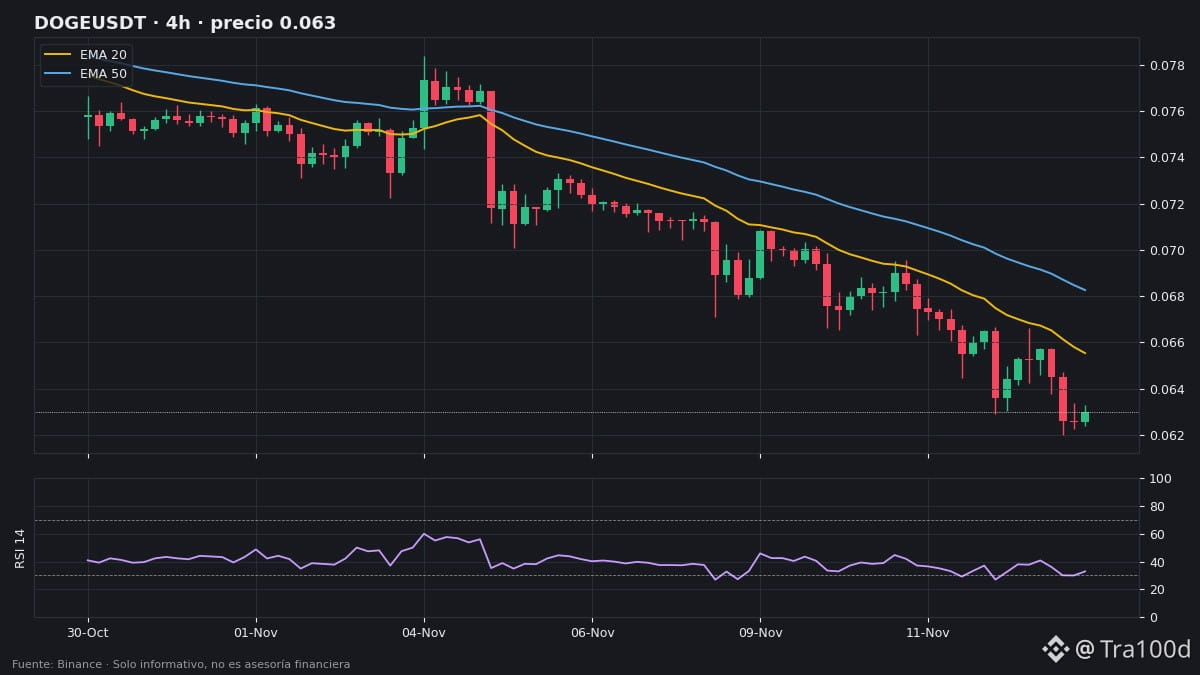
🐶 The broader pullback is dragging all memecoins into negative territory today: $DOGE is down −4.4% in 24 hours to $0.06255 ($31.7M in volume) after hitting a new 20-candle, 4-hour low of $0.06202.
📊 A snapshot of the meme sector on Binance today:
• $PEPE is down −5.3% to $0.00000431 but leads the group in volume at $38.7M; in perpetuals (1000PEPE at $0.00430), it fell below the daily 50 EMA ($0.004459) after touching $0.004155, while open interest is down −7.4% and funding remains negative (−0.0038%)
• DOGE is deepening its daily oversold reading (RSI 26.3 and 32.9 on the 4-hour chart), with daily relative volume at 1.46x, negative funding (−0.0051%) and nearly flat open interest (+0.45%)
• $SHIB is the least affected in the group, down −3.9% ($0.00000414 and $2.5M in volume), although 1000SHIB hit a 20-candle, 4-hour low of $0.004117
• The rest are also in the red: FLOKI −4.6% ($0.00001915), WIF −5.0% ($0.1426, daily RSI at 28.9) and BONK −5.5% ($0.00000256)
📏 DOGE levels on the 4-hour chart:
• Immediate support: $0.06202 (20-candle, 4-hour low)
• Resistance: $0.06554 (4-hour 20 EMA) and $0.06826 (4-hour 50 EMA)
⚡ Risk: daily volatility (ATR) remains elevated across the sector, at 10.5% for PEPE, 8.1% for BONK, 7.7% for WIF and 5.7% for DOGE, compared with 3.6% for BTC.
Which meme coin do you think has the strongest support for when the market rebounds: DOGE, PEPE or SHIB? 👇
#DOGE #PEPE #Memecoin #Cripto #Tra100d
⚠️ For informational and educational purposes only; this is not financial advice. Cryptocurrencies are volatile: do your own research and trade with caution.
🐶 The broader pullback is dragging all memecoins into negative territory today: $DOGE is down −4.4% in 24 hours to $0.06255 ($31.7M in volume) after hitting a new 20-candle, 4-hour low of $0.06202.
📊 A snapshot of the meme sector on Binance today:
• $PEPE is down −5.3% to $0.00000431 but leads the group in volume at $38.7M; in perpetuals (1000PEPE at $0.00430), it fell below the daily 50 EMA ($0.004459) after touching $0.004155, while open interest is down −7.4% and funding remains negative (−0.0038%)
• DOGE is deepening its daily oversold reading (RSI 26.3 and 32.9 on the 4-hour chart), with daily relative volume at 1.46x, negative funding (−0.0051%) and nearly flat open interest (+0.45%)
• $SHIB is the least affected in the group, down −3.9% ($0.00000414 and $2.5M in volume), although 1000SHIB hit a 20-candle, 4-hour low of $0.004117
• The rest are also in the red: FLOKI −4.6% ($0.00001915), WIF −5.0% ($0.1426, daily RSI at 28.9) and BONK −5.5% ($0.00000256)
📏 DOGE levels on the 4-hour chart:
• Immediate support: $0.06202 (20-candle, 4-hour low)
• Resistance: $0.06554 (4-hour 20 EMA) and $0.06826 (4-hour 50 EMA)
⚡ Risk: daily volatility (ATR) remains elevated across the sector, at 10.5% for PEPE, 8.1% for BONK, 7.7% for WIF and 5.7% for DOGE, compared with 3.6% for BTC.
Which meme coin do you think has the strongest support for when the market rebounds: DOGE, PEPE or SHIB? 👇
#DOGE #PEPE #Memecoin #Cripto #Tra100d
⚠️ For informational and educational purposes only; this is not financial advice. Cryptocurrencies are volatile: do your own research and trade with caution.
📊 A snapshot of the meme sector on Binance today:
• $PEPE is down −5.3% to $0.00000431 but leads the group in volume at $38.7M; in perpetuals (1000PEPE at $0.00430), it fell below the daily 50 EMA ($0.004459) after touching $0.004155, while open interest is down −7.4% and funding remains negative (−0.0038%)
• DOGE is deepening its daily oversold reading (RSI 26.3 and 32.9 on the 4-hour chart), with daily relative volume at 1.46x, negative funding (−0.0051%) and nearly flat open interest (+0.45%)
• $SHIB is the least affected in the group, down −3.9% ($0.00000414 and $2.5M in volume), although 1000SHIB hit a 20-candle, 4-hour low of $0.004117
• The rest are also in the red: FLOKI −4.6% ($0.00001915), WIF −5.0% ($0.1426, daily RSI at 28.9) and BONK −5.5% ($0.00000256)
📏 DOGE levels on the 4-hour chart:
• Immediate support: $0.06202 (20-candle, 4-hour low)
• Resistance: $0.06554 (4-hour 20 EMA) and $0.06826 (4-hour 50 EMA)
⚡ Risk: daily volatility (ATR) remains elevated across the sector, at 10.5% for PEPE, 8.1% for BONK, 7.7% for WIF and 5.7% for DOGE, compared with 3.6% for BTC.
Which meme coin do you think has the strongest support for when the market rebounds: DOGE, PEPE or SHIB? 👇
#DOGE #PEPE #Memecoin #Cripto #Tra100d
⚠️ For informational and educational purposes only; this is not financial advice. Cryptocurrencies are volatile: do your own research and trade with caution.
1
185
·
--
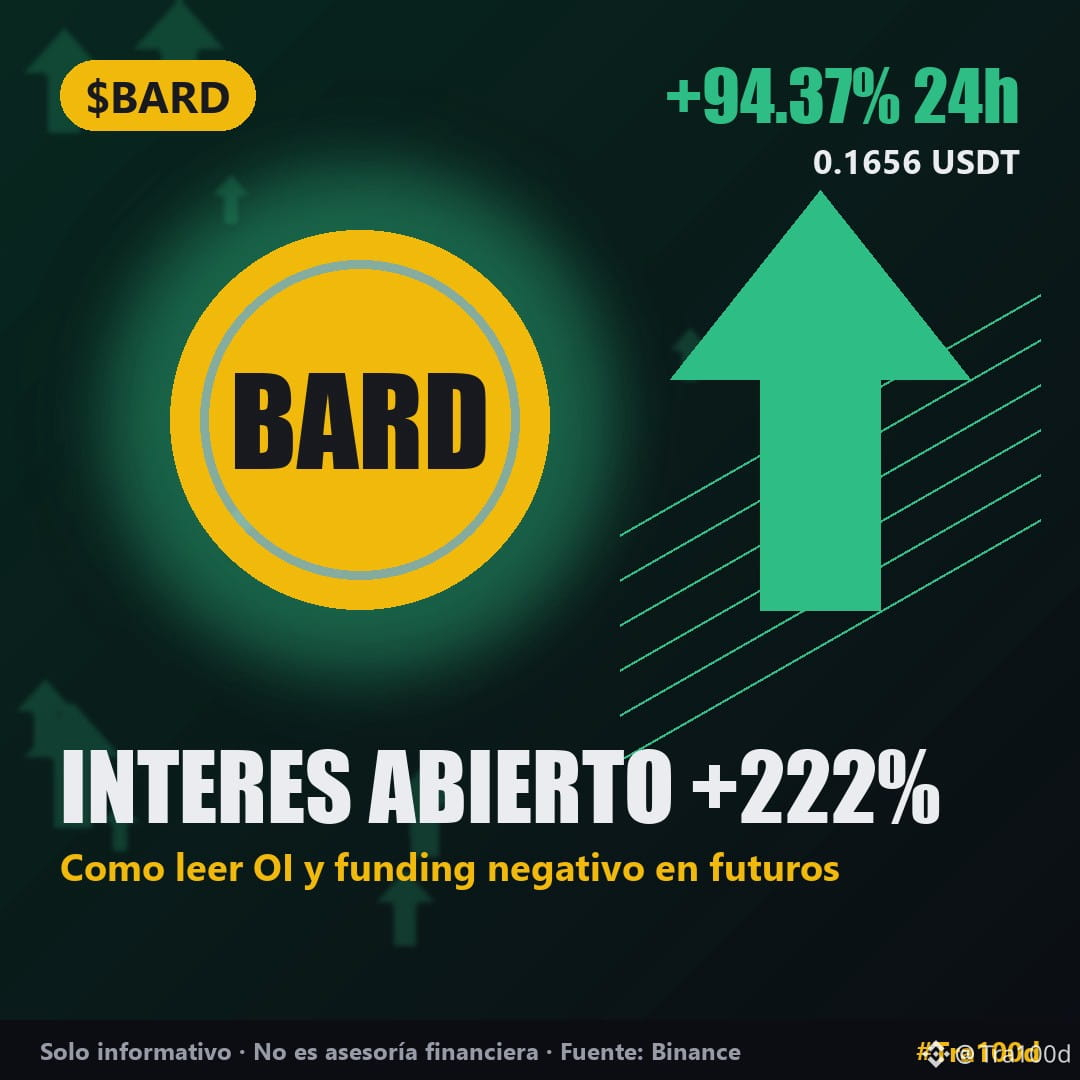
🧠 Why can a coin rise +94% while most futures traders are betting on a decline? The answer lies in combining two metrics: Open Interest (OI) and Funding Rate.
📘 The concept:
• Open Interest measures how many futures contracts remain open (whether leveraged money is flowing in or out).
• The Funding Rate shows which side is dominant: if it’s very negative, shorts are paying longs a fee to keep their positions open.
• When the price rises sharply, OI surges, and funding plunges into negative territory, many shorts get trapped. When they close their positions (by buying back), they push the price even higher: this is a short squeeze.
📊 Example using today’s Binance data:
• $BARD : up +94.4%, its open interest surges +222.1%, and its funding drops to −1.89% (with a 4-hour RSI of 82.4 and a daily ATR of 9.5%).
• $GRAM : down −7.4%, and its open interest falls −16.4% (positions closing after yesterday’s rise).
• $BTC : down −5.0%, with nearly flat open interest (+0.8%) and slightly negative funding (−0.0013%).
❌ Common mistake: opening a short just because a coin has “already risen too much,” without checking the funding rate. If funding is at −1.89%, you’re not only paying a very high fee every few hours, but also risking liquidation in another upward sweep.
📝 In one line: the price tells you what’s happening, but open interest and funding show you who’s trapped in the trade.
Do you check open interest and funding before trading futures? 👇
#EducacionCripto #Futuros #AnalisisTecnico #Cripto #Tra100d
⚠️ For informational and educational purposes only; this is not financial advice. Cryptocurrencies are volatile: do your own research and trade with caution.
🧠 Why can a coin rise +94% while most futures traders are betting on a decline? The answer lies in combining two metrics: Open Interest (OI) and Funding Rate.
📘 The concept:
• Open Interest measures how many futures contracts remain open (whether leveraged money is flowing in or out).
• The Funding Rate shows which side is dominant: if it’s very negative, shorts are paying longs a fee to keep their positions open.
• When the price rises sharply, OI surges, and funding plunges into negative territory, many shorts get trapped. When they close their positions (by buying back), they push the price even higher: this is a short squeeze.
📊 Example using today’s Binance data:
• $BARD : up +94.4%, its open interest surges +222.1%, and its funding drops to −1.89% (with a 4-hour RSI of 82.4 and a daily ATR of 9.5%).
• $GRAM : down −7.4%, and its open interest falls −16.4% (positions closing after yesterday’s rise).
• $BTC : down −5.0%, with nearly flat open interest (+0.8%) and slightly negative funding (−0.0013%).
❌ Common mistake: opening a short just because a coin has “already risen too much,” without checking the funding rate. If funding is at −1.89%, you’re not only paying a very high fee every few hours, but also risking liquidation in another upward sweep.
📝 In one line: the price tells you what’s happening, but open interest and funding show you who’s trapped in the trade.
Do you check open interest and funding before trading futures? 👇
#EducacionCripto #Futuros #AnalisisTecnico #Cripto #Tra100d
⚠️ For informational and educational purposes only; this is not financial advice. Cryptocurrencies are volatile: do your own research and trade with caution.
📘 The concept:
• Open Interest measures how many futures contracts remain open (whether leveraged money is flowing in or out).
• The Funding Rate shows which side is dominant: if it’s very negative, shorts are paying longs a fee to keep their positions open.
• When the price rises sharply, OI surges, and funding plunges into negative territory, many shorts get trapped. When they close their positions (by buying back), they push the price even higher: this is a short squeeze.
📊 Example using today’s Binance data:
• $BARD : up +94.4%, its open interest surges +222.1%, and its funding drops to −1.89% (with a 4-hour RSI of 82.4 and a daily ATR of 9.5%).
• $GRAM : down −7.4%, and its open interest falls −16.4% (positions closing after yesterday’s rise).
• $BTC : down −5.0%, with nearly flat open interest (+0.8%) and slightly negative funding (−0.0013%).
❌ Common mistake: opening a short just because a coin has “already risen too much,” without checking the funding rate. If funding is at −1.89%, you’re not only paying a very high fee every few hours, but also risking liquidation in another upward sweep.
📝 In one line: the price tells you what’s happening, but open interest and funding show you who’s trapped in the trade.
Do you check open interest and funding before trading futures? 👇
#EducacionCripto #Futuros #AnalisisTecnico #Cripto #Tra100d
⚠️ For informational and educational purposes only; this is not financial advice. Cryptocurrencies are volatile: do your own research and trade with caution.
233
·
--
🚀 On a day when the market is tumbling, $BARD is making an extreme move: up +94.4% in 24 hours to $0.1656, from a low of $0.0799.
📌 3 market stats for today (pairs with >$20M in volume on Binance):
• BARD trades $22.8M in 24 hours (96.2 times its usual daily volume), pushes its 4-hour RSI to 82.4, and sees its futures open interest jump +222.1% alongside deeply negative funding (−1.89%).
• Only two other coins in the filter are holding in positive territory: $HYPE (+4.4% to $74.03, with $39.7M in volume) and NEAR (+2.0% to $3.534, with $91.8M in volume).
• On the other end, $GRAM gives back yesterday’s gains and leads the declines at −7.4% ($1.154 and open interest down −16.4%), followed by BTC (−5.0%), UNI (−4.6% to $5.822), and BNB (−3.7% to $640.18). The Fear and Greed Index falls from 28 to 20 (Extreme Fear).
🔍 Why it matters: when a coin’s volume multiplies 96-fold and its open interest triples while funding is at −1.89%, it points to a sudden influx of leveraged shorts caught in the rally. There is no confirmed news to explain the move; these are pure market data.
What stands out to you most today: BARD’s jump or the broad market drop into extreme fear? 👇
#Altcoins #MercadoCripto #Cripto #Binance #Tra100d
⚠️ For informational and educational purposes only; this is not financial advice. Cryptocurrencies are volatile: do your own research and trade with caution.
🚀 On a day when the market is tumbling, $BARD is making an extreme move: up +94.4% in 24 hours to $0.1656, from a low of $0.0799.
📌 3 market stats for today (pairs with >$20M in volume on Binance):
• BARD trades $22.8M in 24 hours (96.2 times its usual daily volume), pushes its 4-hour RSI to 82.4, and sees its futures open interest jump +222.1% alongside deeply negative funding (−1.89%).
• Only two other coins in the filter are holding in positive territory: $HYPE (+4.4% to $74.03, with $39.7M in volume) and NEAR (+2.0% to $3.534, with $91.8M in volume).
• On the other end, $GRAM gives back yesterday’s gains and leads the declines at −7.4% ($1.154 and open interest down −16.4%), followed by BTC (−5.0%), UNI (−4.6% to $5.822), and BNB (−3.7% to $640.18). The Fear and Greed Index falls from 28 to 20 (Extreme Fear).
🔍 Why it matters: when a coin’s volume multiplies 96-fold and its open interest triples while funding is at −1.89%, it points to a sudden influx of leveraged shorts caught in the rally. There is no confirmed news to explain the move; these are pure market data.
What stands out to you most today: BARD’s jump or the broad market drop into extreme fear? 👇
#Altcoins #MercadoCripto #Cripto #Binance #Tra100d
⚠️ For informational and educational purposes only; this is not financial advice. Cryptocurrencies are volatile: do your own research and trade with caution.
📌 3 market stats for today (pairs with >$20M in volume on Binance):
• BARD trades $22.8M in 24 hours (96.2 times its usual daily volume), pushes its 4-hour RSI to 82.4, and sees its futures open interest jump +222.1% alongside deeply negative funding (−1.89%).
• Only two other coins in the filter are holding in positive territory: $HYPE (+4.4% to $74.03, with $39.7M in volume) and NEAR (+2.0% to $3.534, with $91.8M in volume).
• On the other end, $GRAM gives back yesterday’s gains and leads the declines at −7.4% ($1.154 and open interest down −16.4%), followed by BTC (−5.0%), UNI (−4.6% to $5.822), and BNB (−3.7% to $640.18). The Fear and Greed Index falls from 28 to 20 (Extreme Fear).
🔍 Why it matters: when a coin’s volume multiplies 96-fold and its open interest triples while funding is at −1.89%, it points to a sudden influx of leveraged shorts caught in the rally. There is no confirmed news to explain the move; these are pure market data.
What stands out to you most today: BARD’s jump or the broad market drop into extreme fear? 👇
#Altcoins #MercadoCripto #Cripto #Binance #Tra100d
⚠️ For informational and educational purposes only; this is not financial advice. Cryptocurrencies are volatile: do your own research and trade with caution.
110
·
--
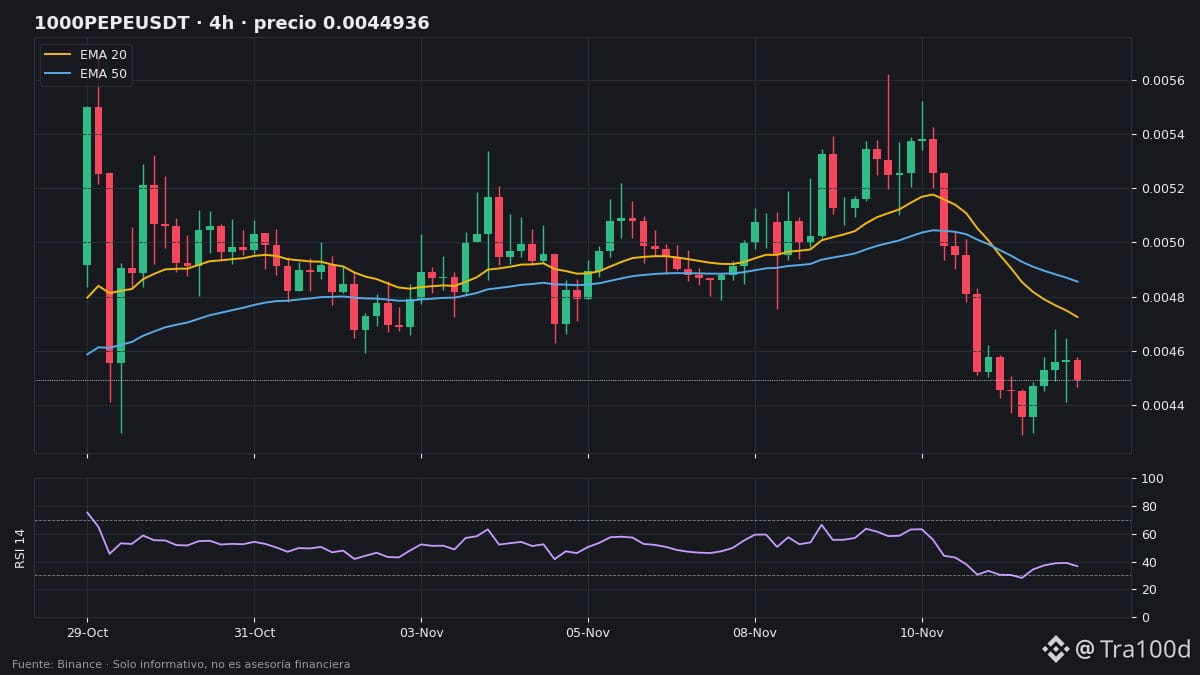
🐸 While Bitcoin loses $70,000, $PEPE is decoupling from the market: up +2.0% in 24 hours to $0.00000454, with $80.8M in volume on Binance.
📊 Here's how the meme sector is waking up today:
• PEPE is defending its daily 50 EMA ($0.004461 on 1000PEPE) and its daily 200 EMA ($0.003761); in futures, its funding rate is turning more negative (−0.032%) as open interest falls −2.5%
• $BONK is also in the green, up +0.4% ($0.00000267 and $2.2M in volume)
• $DOGE is down −1.8% to $0.06551 ($52.2M in volume), entering daily oversold territory (RSI 28.9) and setting a new 20-candle, 4-hour low at $0.06292
• The rest of the group is correcting: SHIB −0.2% ($0.00000430), WIF −1.2% ($0.1515), and FLOKI −2.0% ($0.00002006)
📏 1000PEPE levels on the 4-hour chart:
• Key support: $0.004461 (daily 50 EMA) and $0.004291 (20-candle, 4-hour low)
• Resistance: $0.004677 (4-hour 200 EMA) and $0.004725 (4-hour 20 EMA)
⚡ Risk: PEPE's daily ATR is 10.4% and BONK's is 8.2%—more than double and triple BTC's 3.3%, respectively.
Will PEPE sustain its rebound against the market, or will selling pressure continue? 👇
#PEPE #DOGE #Memecoin #Cripto #Tra100d
⚠️ For informational and educational purposes only; this is not financial advice. Cryptocurrencies are volatile: do your own research and trade with caution.
🐸 While Bitcoin loses $70,000, $PEPE is decoupling from the market: up +2.0% in 24 hours to $0.00000454, with $80.8M in volume on Binance.
📊 Here's how the meme sector is waking up today:
• PEPE is defending its daily 50 EMA ($0.004461 on 1000PEPE) and its daily 200 EMA ($0.003761); in futures, its funding rate is turning more negative (−0.032%) as open interest falls −2.5%
• $BONK is also in the green, up +0.4% ($0.00000267 and $2.2M in volume)
• $DOGE is down −1.8% to $0.06551 ($52.2M in volume), entering daily oversold territory (RSI 28.9) and setting a new 20-candle, 4-hour low at $0.06292
• The rest of the group is correcting: SHIB −0.2% ($0.00000430), WIF −1.2% ($0.1515), and FLOKI −2.0% ($0.00002006)
📏 1000PEPE levels on the 4-hour chart:
• Key support: $0.004461 (daily 50 EMA) and $0.004291 (20-candle, 4-hour low)
• Resistance: $0.004677 (4-hour 200 EMA) and $0.004725 (4-hour 20 EMA)
⚡ Risk: PEPE's daily ATR is 10.4% and BONK's is 8.2%—more than double and triple BTC's 3.3%, respectively.
Will PEPE sustain its rebound against the market, or will selling pressure continue? 👇
#PEPE #DOGE #Memecoin #Cripto #Tra100d
⚠️ For informational and educational purposes only; this is not financial advice. Cryptocurrencies are volatile: do your own research and trade with caution.
📊 Here's how the meme sector is waking up today:
• PEPE is defending its daily 50 EMA ($0.004461 on 1000PEPE) and its daily 200 EMA ($0.003761); in futures, its funding rate is turning more negative (−0.032%) as open interest falls −2.5%
• $BONK is also in the green, up +0.4% ($0.00000267 and $2.2M in volume)
• $DOGE is down −1.8% to $0.06551 ($52.2M in volume), entering daily oversold territory (RSI 28.9) and setting a new 20-candle, 4-hour low at $0.06292
• The rest of the group is correcting: SHIB −0.2% ($0.00000430), WIF −1.2% ($0.1515), and FLOKI −2.0% ($0.00002006)
📏 1000PEPE levels on the 4-hour chart:
• Key support: $0.004461 (daily 50 EMA) and $0.004291 (20-candle, 4-hour low)
• Resistance: $0.004677 (4-hour 200 EMA) and $0.004725 (4-hour 20 EMA)
⚡ Risk: PEPE's daily ATR is 10.4% and BONK's is 8.2%—more than double and triple BTC's 3.3%, respectively.
Will PEPE sustain its rebound against the market, or will selling pressure continue? 👇
#PEPE #DOGE #Memecoin #Cripto #Tra100d
⚠️ For informational and educational purposes only; this is not financial advice. Cryptocurrencies are volatile: do your own research and trade with caution.
174
·
--
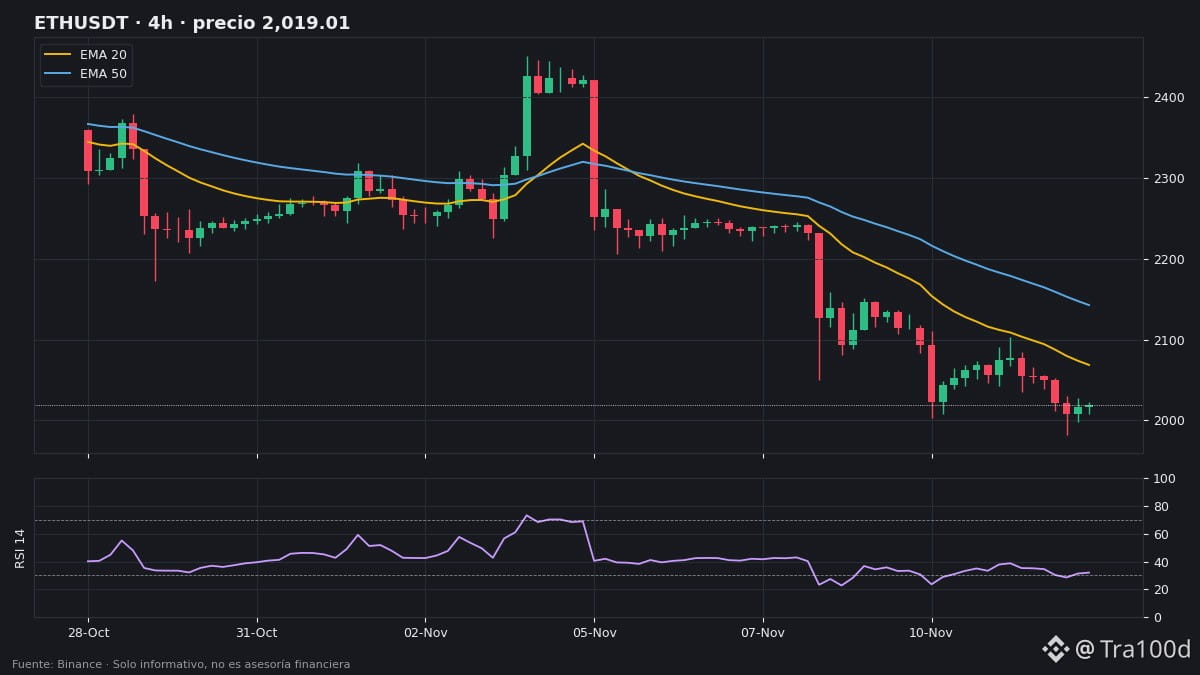
📉 Ethereum falls −1.9% in 24 h to $2,019.01: it briefly broke below $2,000 to a new 20-day low of $1,982.60, then bounced to defend the psychological $2,000 level.
📊 Context (Binance):
• On the daily chart, it is down −9.8% over 6 days, and its RSI is deep in oversold territory (28.1)
• On the 4 h chart, the trend remains strongly bearish (RSI 32.0), with price below the 20, 50, and 200 EMAs
• In futures: funding is at +0.01% and open interest is up +2.5%
📏 Key levels:
• Immediate support: $1,982.60 (new 20-day low and 20-candle low on the 4 h chart) and the psychological $2,000 level
• 4 h resistance levels: $2,069 (20 EMA) and $2,143 (50 EMA)
• Major daily resistance: $2,226 (20 EMA) and $2,227 (200 EMA)
• Daily ATR: $98.1 (4.9%)
🟢 Bullish scenario: if it holds $2,000–$1,982.60 and reclaims the 4 h 20 EMA ($2,069), it could ease oversold conditions toward $2,143.
🔴 Bearish scenario: a 4 h close below $1,982.60 would confirm the loss of $2,000 with a new monthly low.
👀 What to watch: whether the bounce from $1,982.60 holds at the 4 h candle close, and whether the RSI (32.0) manages to turn upward.
Can $ETH hold $2,000 after this sweep, or will we see a further drop? Reply "HOLD" or "BREAK" 👇
#ETH #Ethereum #AnalisisTecnico #Cripto #Tra100d
⚠️ For informational and educational purposes only; this is not financial advice. Cryptocurrencies are volatile: do your own research and trade with caution.
📉 Ethereum falls −1.9% in 24 h to $2,019.01: it briefly broke below $2,000 to a new 20-day low of $1,982.60, then bounced to defend the psychological $2,000 level.
📊 Context (Binance):
• On the daily chart, it is down −9.8% over 6 days, and its RSI is deep in oversold territory (28.1)
• On the 4 h chart, the trend remains strongly bearish (RSI 32.0), with price below the 20, 50, and 200 EMAs
• In futures: funding is at +0.01% and open interest is up +2.5%
📏 Key levels:
• Immediate support: $1,982.60 (new 20-day low and 20-candle low on the 4 h chart) and the psychological $2,000 level
• 4 h resistance levels: $2,069 (20 EMA) and $2,143 (50 EMA)
• Major daily resistance: $2,226 (20 EMA) and $2,227 (200 EMA)
• Daily ATR: $98.1 (4.9%)
🟢 Bullish scenario: if it holds $2,000–$1,982.60 and reclaims the 4 h 20 EMA ($2,069), it could ease oversold conditions toward $2,143.
🔴 Bearish scenario: a 4 h close below $1,982.60 would confirm the loss of $2,000 with a new monthly low.
👀 What to watch: whether the bounce from $1,982.60 holds at the 4 h candle close, and whether the RSI (32.0) manages to turn upward.
Can $ETH hold $2,000 after this sweep, or will we see a further drop? Reply "HOLD" or "BREAK" 👇
#ETH #Ethereum #AnalisisTecnico #Cripto #Tra100d
⚠️ For informational and educational purposes only; this is not financial advice. Cryptocurrencies are volatile: do your own research and trade with caution.
📊 Context (Binance):
• On the daily chart, it is down −9.8% over 6 days, and its RSI is deep in oversold territory (28.1)
• On the 4 h chart, the trend remains strongly bearish (RSI 32.0), with price below the 20, 50, and 200 EMAs
• In futures: funding is at +0.01% and open interest is up +2.5%
📏 Key levels:
• Immediate support: $1,982.60 (new 20-day low and 20-candle low on the 4 h chart) and the psychological $2,000 level
• 4 h resistance levels: $2,069 (20 EMA) and $2,143 (50 EMA)
• Major daily resistance: $2,226 (20 EMA) and $2,227 (200 EMA)
• Daily ATR: $98.1 (4.9%)
🟢 Bullish scenario: if it holds $2,000–$1,982.60 and reclaims the 4 h 20 EMA ($2,069), it could ease oversold conditions toward $2,143.
🔴 Bearish scenario: a 4 h close below $1,982.60 would confirm the loss of $2,000 with a new monthly low.
👀 What to watch: whether the bounce from $1,982.60 holds at the 4 h candle close, and whether the RSI (32.0) manages to turn upward.
Can $ETH hold $2,000 after this sweep, or will we see a further drop? Reply "HOLD" or "BREAK" 👇
#ETH #Ethereum #AnalisisTecnico #Cripto #Tra100d
⚠️ For informational and educational purposes only; this is not financial advice. Cryptocurrencies are volatile: do your own research and trade with caution.
94
·
--
🚨 $BTC falls −3.7% in 24 hours to $71,423 after breaking the previous support level of $72,691 and marking a new 20-day low at $71,082.
📉 The RSI falls into oversold territory on both the daily (29.5) and 4-hour (26.0) charts, below the daily 200 EMA ($74,650), while futures open interest rises +4.7% and the Fear and Greed Index drops to 20 (Extreme Fear).
👀 Key level: $71,082. If it holds, the first resistance levels are at $72,691 (former support) and $73,518 (4-hour 20 EMA); if it breaks, $70,000 could be tested.
#BTC #Bitcoin #Alerta #Cripto #Tra100d
⚠️ For informational and educational purposes only; this is not financial advice. Cryptocurrencies are volatile: do your own research and trade with caution.
🚨 $BTC falls −3.7% in 24 hours to $71,423 after breaking the previous support level of $72,691 and marking a new 20-day low at $71,082.
📉 The RSI falls into oversold territory on both the daily (29.5) and 4-hour (26.0) charts, below the daily 200 EMA ($74,650), while futures open interest rises +4.7% and the Fear and Greed Index drops to 20 (Extreme Fear).
👀 Key level: $71,082. If it holds, the first resistance levels are at $72,691 (former support) and $73,518 (4-hour 20 EMA); if it breaks, $70,000 could be tested.
#BTC #Bitcoin #Alerta #Cripto #Tra100d
⚠️ For informational and educational purposes only; this is not financial advice. Cryptocurrencies are volatile: do your own research and trade with caution.
📉 The RSI falls into oversold territory on both the daily (29.5) and 4-hour (26.0) charts, below the daily 200 EMA ($74,650), while futures open interest rises +4.7% and the Fear and Greed Index drops to 20 (Extreme Fear).
👀 Key level: $71,082. If it holds, the first resistance levels are at $72,691 (former support) and $73,518 (4-hour 20 EMA); if it breaks, $70,000 could be tested.
#BTC #Bitcoin #Alerta #Cripto #Tra100d
⚠️ For informational and educational purposes only; this is not financial advice. Cryptocurrencies are volatile: do your own research and trade with caution.
194
·
--
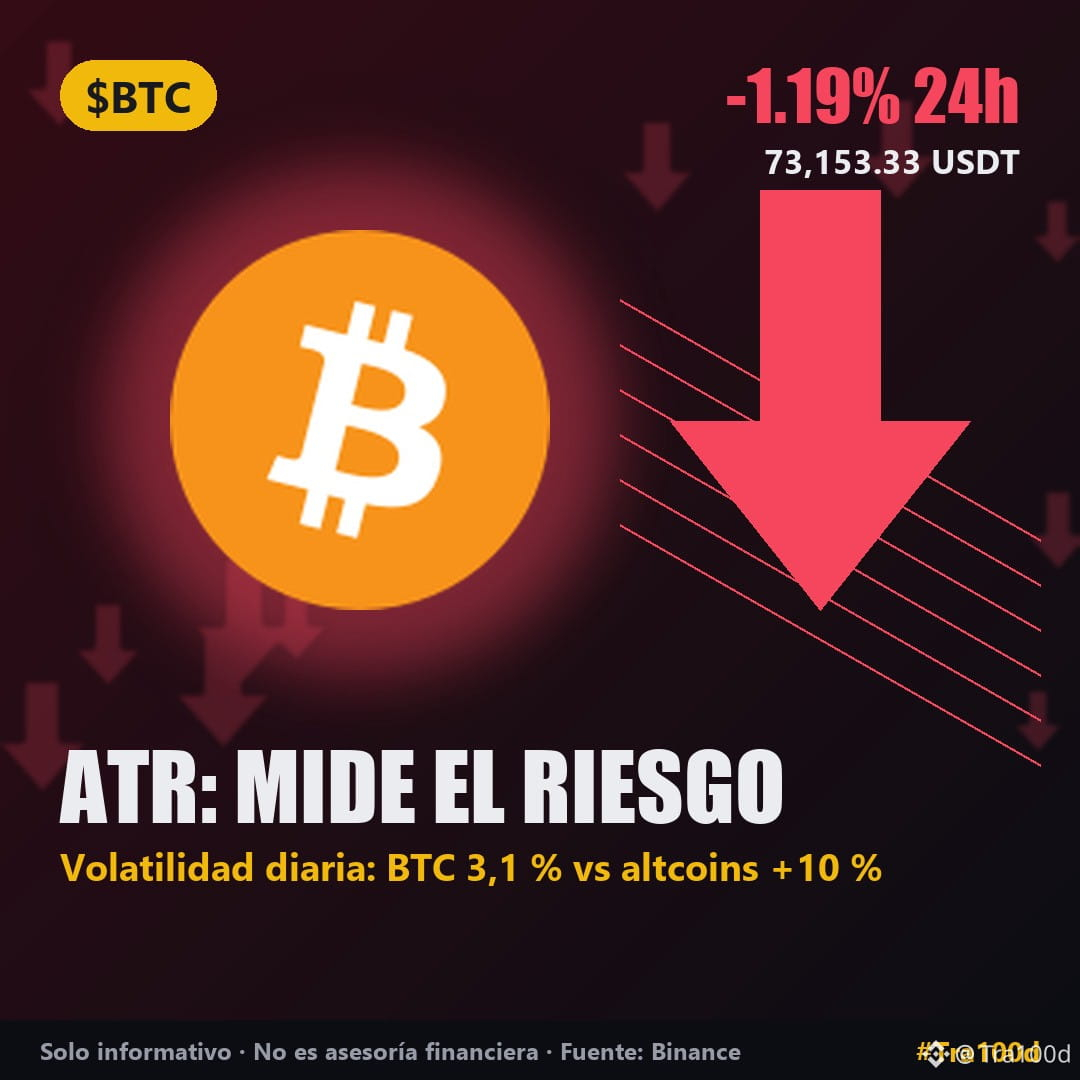
🧠 Do you use the same position size for $BTC as for an altcoin that moves 12% or 35% a day? That’s usually where the problem starts.
📘 The concept: ATR (Average True Range) measures how much an asset moves on average in each candle (for example, over 1 day). It doesn’t indicate which way the price will go, but how volatile it is.
📊 Example using today’s data (daily ATR on Binance):
• BTC: $2,270 → 3.1% daily
• $ETH: $99.3 → 4.8% daily
• PEPE: 10.7% daily (more than triple BTC’s)
• $ZEC: $122.6 → 12.7% daily
• INIT: 35.7% daily (more than 11 times BTC’s volatility)
❌ Common mistake: setting a 2% stop-loss on a coin with a daily ATR of 10% or 12%. The day’s normal noise can stop you out even if your idea was right.
✅ How to apply it: the higher the ATR %, the smaller your position size should be and the wider your safety margin.
📝 In one line: ATR tells you how much each coin “breathes,” so you can adjust your risk before entering.
Do you measure volatility before opening a trade? 👇
#EducacionCripto #AnalisisTecnico #GestionDeRiesgo #BTC #Tra100d
⚠️ For informational and educational purposes only; this is not financial advice. Cryptocurrencies are volatile: do your research and trade with caution.
🧠 Do you use the same position size for $BTC as for an altcoin that moves 12% or 35% a day? That’s usually where the problem starts.
📘 The concept: ATR (Average True Range) measures how much an asset moves on average in each candle (for example, over 1 day). It doesn’t indicate which way the price will go, but how volatile it is.
📊 Example using today’s data (daily ATR on Binance):
• BTC: $2,270 → 3.1% daily
• $ETH: $99.3 → 4.8% daily
• PEPE: 10.7% daily (more than triple BTC’s)
• $ZEC: $122.6 → 12.7% daily
• INIT: 35.7% daily (more than 11 times BTC’s volatility)
❌ Common mistake: setting a 2% stop-loss on a coin with a daily ATR of 10% or 12%. The day’s normal noise can stop you out even if your idea was right.
✅ How to apply it: the higher the ATR %, the smaller your position size should be and the wider your safety margin.
📝 In one line: ATR tells you how much each coin “breathes,” so you can adjust your risk before entering.
Do you measure volatility before opening a trade? 👇
#EducacionCripto #AnalisisTecnico #GestionDeRiesgo #BTC #Tra100d
⚠️ For informational and educational purposes only; this is not financial advice. Cryptocurrencies are volatile: do your research and trade with caution.
📘 The concept: ATR (Average True Range) measures how much an asset moves on average in each candle (for example, over 1 day). It doesn’t indicate which way the price will go, but how volatile it is.
📊 Example using today’s data (daily ATR on Binance):
• BTC: $2,270 → 3.1% daily
• $ETH: $99.3 → 4.8% daily
• PEPE: 10.7% daily (more than triple BTC’s)
• $ZEC: $122.6 → 12.7% daily
• INIT: 35.7% daily (more than 11 times BTC’s volatility)
❌ Common mistake: setting a 2% stop-loss on a coin with a daily ATR of 10% or 12%. The day’s normal noise can stop you out even if your idea was right.
✅ How to apply it: the higher the ATR %, the smaller your position size should be and the wider your safety margin.
📝 In one line: ATR tells you how much each coin “breathes,” so you can adjust your risk before entering.
Do you measure volatility before opening a trade? 👇
#EducacionCripto #AnalisisTecnico #GestionDeRiesgo #BTC #Tra100d
⚠️ For informational and educational purposes only; this is not financial advice. Cryptocurrencies are volatile: do your research and trade with caution.
100
·
--
📉 How quickly the landscape changes among the most volatile coins: after the rally at the start of the week, $INIT is down 33.4% today to $0.13065.
📌 3 market stats today (pairs with >$20M in volume on Binance):
• INIT has traded $25.2M in 24 hours (6.9 times its daily average), is down 38.6% over the last 6 4-hour candles from its peak of $0.30298, and has a very negative funding rate (−0.052%).
• Next in the declines are ENA (−7.2% to $0.1411), UNI (−5.2% to $6.122), and NEAR (−5.0% to $3.463), while $ZEC is down 0.9% ($978.73) but remains 3rd in volume across all of Binance ($169.6M).
• The only coin in the filter in the green is $GRAM (+4.1% to $1.244, with $24.7M in volume and 5.3 times its daily average). The Fear and Greed Index is down to 28 (Fear).
🔍 Why it matters: when a coin’s volume is nearly 7 times its usual level, with a daily ATR of 35.7% like INIT, moves in either direction can be extreme. There’s no confirmed news behind the reversal; these are purely market data.
Do you prefer trading coins that are trending, or sticking with the large caps when the index signals fear? 👇
#Altcoins #MercadoCripto #Cripto #Binance #Tra100d
⚠️ For informational and educational purposes only; this is not financial advice. Cryptocurrencies are volatile: do your research and trade with caution.
📉 How quickly the landscape changes among the most volatile coins: after the rally at the start of the week, $INIT is down 33.4% today to $0.13065.
📌 3 market stats today (pairs with >$20M in volume on Binance):
• INIT has traded $25.2M in 24 hours (6.9 times its daily average), is down 38.6% over the last 6 4-hour candles from its peak of $0.30298, and has a very negative funding rate (−0.052%).
• Next in the declines are ENA (−7.2% to $0.1411), UNI (−5.2% to $6.122), and NEAR (−5.0% to $3.463), while $ZEC is down 0.9% ($978.73) but remains 3rd in volume across all of Binance ($169.6M).
• The only coin in the filter in the green is $GRAM (+4.1% to $1.244, with $24.7M in volume and 5.3 times its daily average). The Fear and Greed Index is down to 28 (Fear).
🔍 Why it matters: when a coin’s volume is nearly 7 times its usual level, with a daily ATR of 35.7% like INIT, moves in either direction can be extreme. There’s no confirmed news behind the reversal; these are purely market data.
Do you prefer trading coins that are trending, or sticking with the large caps when the index signals fear? 👇
#Altcoins #MercadoCripto #Cripto #Binance #Tra100d
⚠️ For informational and educational purposes only; this is not financial advice. Cryptocurrencies are volatile: do your research and trade with caution.
📌 3 market stats today (pairs with >$20M in volume on Binance):
• INIT has traded $25.2M in 24 hours (6.9 times its daily average), is down 38.6% over the last 6 4-hour candles from its peak of $0.30298, and has a very negative funding rate (−0.052%).
• Next in the declines are ENA (−7.2% to $0.1411), UNI (−5.2% to $6.122), and NEAR (−5.0% to $3.463), while $ZEC is down 0.9% ($978.73) but remains 3rd in volume across all of Binance ($169.6M).
• The only coin in the filter in the green is $GRAM (+4.1% to $1.244, with $24.7M in volume and 5.3 times its daily average). The Fear and Greed Index is down to 28 (Fear).
🔍 Why it matters: when a coin’s volume is nearly 7 times its usual level, with a daily ATR of 35.7% like INIT, moves in either direction can be extreme. There’s no confirmed news behind the reversal; these are purely market data.
Do you prefer trading coins that are trending, or sticking with the large caps when the index signals fear? 👇
#Altcoins #MercadoCripto #Cripto #Binance #Tra100d
⚠️ For informational and educational purposes only; this is not financial advice. Cryptocurrencies are volatile: do your research and trade with caution.
248
·
--
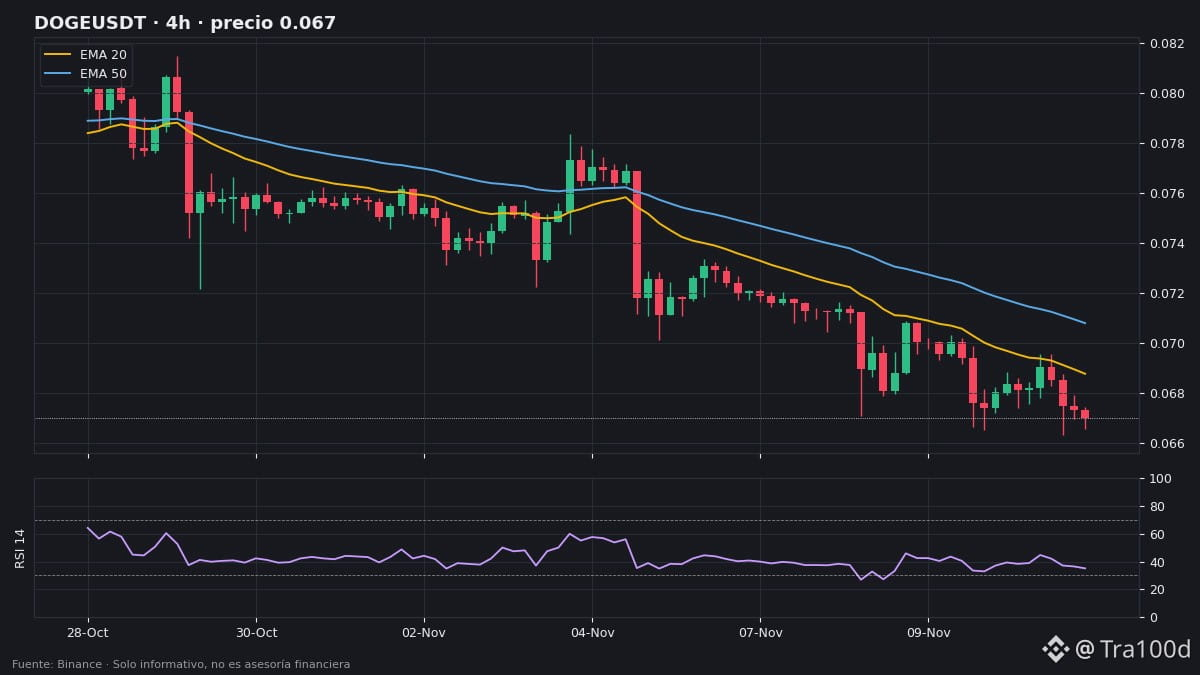
🐶 The entire meme coin sector is waking up in the red: $DOGE is trading at $0.0667 (−2.0% in 24 h) and is just 0.6% above its 20-day low ($0.06632).
📊 Today's data (Binance):
• DOGE: $29.5M in 24 h volume, daily RSI at 30.2 (on the verge of being oversold), and −5.1% in 6 days
• $PEPE leads the meme coin declines at −11.0% ($0.00000443) with $69.4M in volume; its futures funding rate remains negative (−0.006%) and open interest is down 3.3%
• The rest of the group is also falling: $BONK −6.0% ($0.00000266), SHIB −2.7%, FLOKI −2.2%, and WIF −2.2%
📏 DOGE levels on the 4 h chart:
• Key support: $0.06632 (the low of the last 20 candles on the 4 h and daily charts)
• Resistance: $0.06875 (20 EMA) and $0.07078 (50 EMA)
• DOGE futures funding is slightly positive (+0.002%) and open interest is up 2.3%
⚡ Risk: DOGE's daily ATR is 5.5%, while PEPE's has risen to 10.7%, compared with BTC at 3.1%.
Will DOGE defend $0.0663, or will we see a new monthly low? 👇
#DOGE #PEPE #Memecoin #Cripto #Tra100d
⚠️ For informational and educational purposes only; this is not financial advice. Cryptocurrencies are volatile: do your own research and trade with caution.
🐶 The entire meme coin sector is waking up in the red: $DOGE is trading at $0.0667 (−2.0% in 24 h) and is just 0.6% above its 20-day low ($0.06632).
📊 Today's data (Binance):
• DOGE: $29.5M in 24 h volume, daily RSI at 30.2 (on the verge of being oversold), and −5.1% in 6 days
• $PEPE leads the meme coin declines at −11.0% ($0.00000443) with $69.4M in volume; its futures funding rate remains negative (−0.006%) and open interest is down 3.3%
• The rest of the group is also falling: $BONK −6.0% ($0.00000266), SHIB −2.7%, FLOKI −2.2%, and WIF −2.2%
📏 DOGE levels on the 4 h chart:
• Key support: $0.06632 (the low of the last 20 candles on the 4 h and daily charts)
• Resistance: $0.06875 (20 EMA) and $0.07078 (50 EMA)
• DOGE futures funding is slightly positive (+0.002%) and open interest is up 2.3%
⚡ Risk: DOGE's daily ATR is 5.5%, while PEPE's has risen to 10.7%, compared with BTC at 3.1%.
Will DOGE defend $0.0663, or will we see a new monthly low? 👇
#DOGE #PEPE #Memecoin #Cripto #Tra100d
⚠️ For informational and educational purposes only; this is not financial advice. Cryptocurrencies are volatile: do your own research and trade with caution.
📊 Today's data (Binance):
• DOGE: $29.5M in 24 h volume, daily RSI at 30.2 (on the verge of being oversold), and −5.1% in 6 days
• $PEPE leads the meme coin declines at −11.0% ($0.00000443) with $69.4M in volume; its futures funding rate remains negative (−0.006%) and open interest is down 3.3%
• The rest of the group is also falling: $BONK −6.0% ($0.00000266), SHIB −2.7%, FLOKI −2.2%, and WIF −2.2%
📏 DOGE levels on the 4 h chart:
• Key support: $0.06632 (the low of the last 20 candles on the 4 h and daily charts)
• Resistance: $0.06875 (20 EMA) and $0.07078 (50 EMA)
• DOGE futures funding is slightly positive (+0.002%) and open interest is up 2.3%
⚡ Risk: DOGE's daily ATR is 5.5%, while PEPE's has risen to 10.7%, compared with BTC at 3.1%.
Will DOGE defend $0.0663, or will we see a new monthly low? 👇
#DOGE #PEPE #Memecoin #Cripto #Tra100d
⚠️ For informational and educational purposes only; this is not financial advice. Cryptocurrencies are volatile: do your own research and trade with caution.
147
·
--
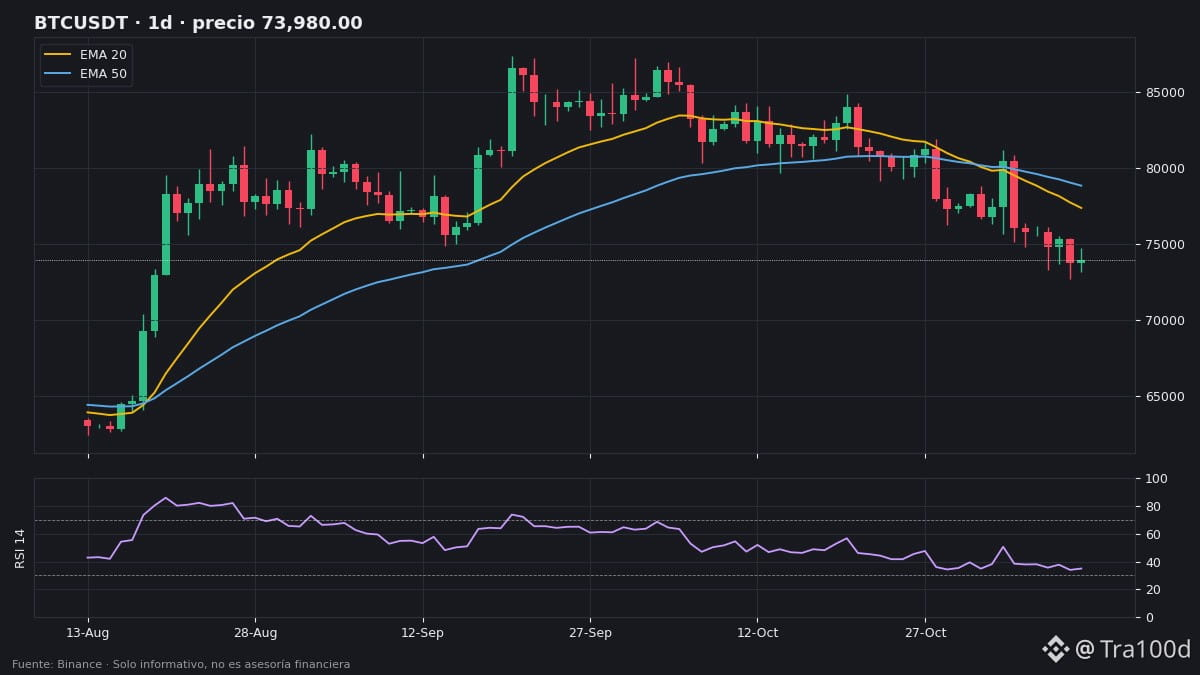
₿ Bitcoin is once again below its daily 200 EMA ($74,477), the average many use to distinguish a bull market from a bear market.
📊 Context (Binance, daily candle):
• Price: 73,980 $ (+0.2% in 24 hours; −2.7% in 6 days)
• RSI 34.9: weak, but not yet oversold
• Volume of the last candle: 0.9 times normal
• Funding +0.005% and open interest −2.9%: mild leverage flush
📏 Levels:
• Resistance: 74,477 $ (EMA 200), 77,400 $ (EMA 20), and 78,867 $ (EMA 50)
• Support: 72,691 $ (20-day low)
• Daily ATR: 2,270 $ (3.1%), which is how much BTC typically moves in a day
🟢 Bullish scenario: daily close above 74,477 $ → the next target is the EMA 20 at $77,400.
🔴 Bearish scenario: loses 72,691 $ → a new monthly low, with the range opening up to the downside.
👀 What to watch: the daily close relative to the EMA 200 and whether volume supports the move.
Will BTC reclaim the EMA 200 this week? Reply "YES" or "NO" 👇
#BTC #Bitcoin #AnalisisTecnico #Cripto #Tra100d
⚠️ For informational and educational purposes only; not financial advice. Cryptocurrencies are volatile: do your own research and trade with caution.
₿ Bitcoin is once again below its daily 200 EMA ($74,477), the average many use to distinguish a bull market from a bear market.
📊 Context (Binance, daily candle):
• Price: 73,980 $ (+0.2% in 24 hours; −2.7% in 6 days)
• RSI 34.9: weak, but not yet oversold
• Volume of the last candle: 0.9 times normal
• Funding +0.005% and open interest −2.9%: mild leverage flush
📏 Levels:
• Resistance: 74,477 $ (EMA 200), 77,400 $ (EMA 20), and 78,867 $ (EMA 50)
• Support: 72,691 $ (20-day low)
• Daily ATR: 2,270 $ (3.1%), which is how much BTC typically moves in a day
🟢 Bullish scenario: daily close above 74,477 $ → the next target is the EMA 20 at $77,400.
🔴 Bearish scenario: loses 72,691 $ → a new monthly low, with the range opening up to the downside.
👀 What to watch: the daily close relative to the EMA 200 and whether volume supports the move.
Will BTC reclaim the EMA 200 this week? Reply "YES" or "NO" 👇
#BTC #Bitcoin #AnalisisTecnico #Cripto #Tra100d
⚠️ For informational and educational purposes only; not financial advice. Cryptocurrencies are volatile: do your own research and trade with caution.
📊 Context (Binance, daily candle):
• Price: 73,980 $ (+0.2% in 24 hours; −2.7% in 6 days)
• RSI 34.9: weak, but not yet oversold
• Volume of the last candle: 0.9 times normal
• Funding +0.005% and open interest −2.9%: mild leverage flush
📏 Levels:
• Resistance: 74,477 $ (EMA 200), 77,400 $ (EMA 20), and 78,867 $ (EMA 50)
• Support: 72,691 $ (20-day low)
• Daily ATR: 2,270 $ (3.1%), which is how much BTC typically moves in a day
🟢 Bullish scenario: daily close above 74,477 $ → the next target is the EMA 20 at $77,400.
🔴 Bearish scenario: loses 72,691 $ → a new monthly low, with the range opening up to the downside.
👀 What to watch: the daily close relative to the EMA 200 and whether volume supports the move.
Will BTC reclaim the EMA 200 this week? Reply "YES" or "NO" 👇
#BTC #Bitcoin #AnalisisTecnico #Cripto #Tra100d
⚠️ For informational and educational purposes only; not financial advice. Cryptocurrencies are volatile: do your own research and trade with caution.
89
·
--
🚨 $XRP is trading at $1.0517 and is just 2.1% above its 20-day low of $1.0301.
📉 It’s down 12.8% in 6 days, with a daily RSI of 23.4 and futures open interest down 3.5%.
👀 Key level: $1.0301. If it breaks below, it will mark a new monthly low; if it bounces there, the first resistance is at $1.087 (4-hour EMA 20).
#XRP #Alerta #Cripto #Tra100d
⚠️ For informational and educational purposes only; this is not financial advice. Cryptocurrencies are volatile: do your own research and trade with caution.
🚨 $XRP is trading at $1.0517 and is just 2.1% above its 20-day low of $1.0301.
📉 It’s down 12.8% in 6 days, with a daily RSI of 23.4 and futures open interest down 3.5%.
👀 Key level: $1.0301. If it breaks below, it will mark a new monthly low; if it bounces there, the first resistance is at $1.087 (4-hour EMA 20).
#XRP #Alerta #Cripto #Tra100d
⚠️ For informational and educational purposes only; this is not financial advice. Cryptocurrencies are volatile: do your own research and trade with caution.
📉 It’s down 12.8% in 6 days, with a daily RSI of 23.4 and futures open interest down 3.5%.
👀 Key level: $1.0301. If it breaks below, it will mark a new monthly low; if it bounces there, the first resistance is at $1.087 (4-hour EMA 20).
#XRP #Alerta #Cripto #Tra100d
⚠️ For informational and educational purposes only; this is not financial advice. Cryptocurrencies are volatile: do your own research and trade with caution.
200
·
--
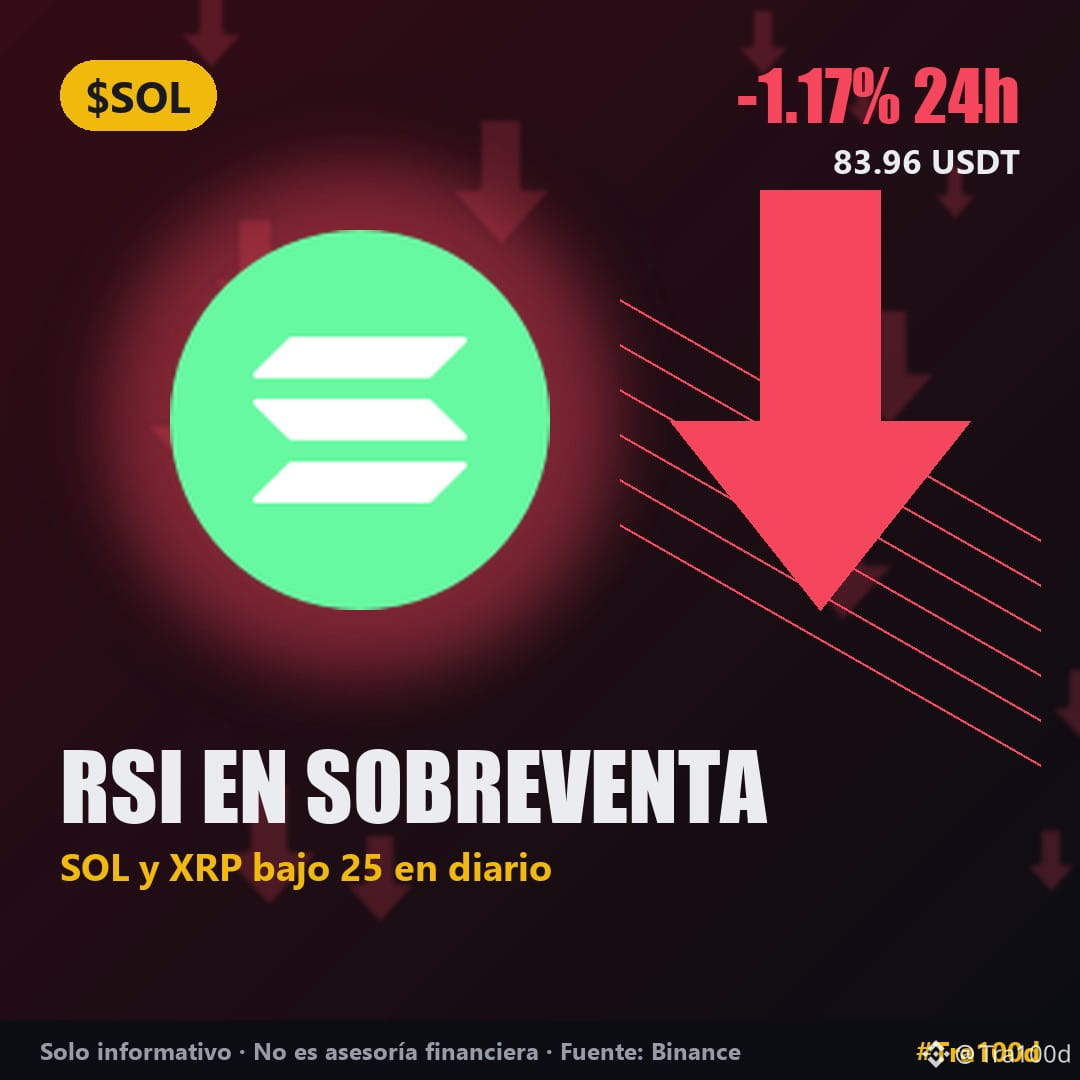
🧠 $SOL and $XRP have a daily RSI below 24 today. Does that mean they’ve “hit bottom”?
📘 The concept: RSI (Relative Strength Index) ranges from 0 to 100 and measures the strength of recent gains compared with losses. Below 30 is considered “oversold”; above 70, “overbought.”
📊 Example using today’s data (daily candles, Binance):
• SOL: RSI 23.8 after falling −12.8% in 6 days ($83.96)
• XRP: RSI 23.7 after falling −19.1% in 6 days ($1.058)
• ETH: RSI 29.5, also in oversold territory
❌ Common mistake: buying just because the RSI is low. In strong downtrends, the RSI can remain in oversold territory for days or weeks while the price keeps falling. Yesterday, SOL had already broken its 20-day low.
✅ It’s better to use it alongside other signals: support levels, volume, and whether the price recovers its moving averages.
📝 In one line: Low RSI = a very sharp decline, not a guarantee of a bounce.
Do you use RSI in your analyses? 👇
#RSI #AnalisisTecnico #AprendeCripto #SOL #Tra100d
⚠️ For informational and educational purposes only; this is not financial advice. Cryptocurrencies are volatile: do your research and trade with caution.
🧠 $SOL and $XRP have a daily RSI below 24 today. Does that mean they’ve “hit bottom”?
📘 The concept: RSI (Relative Strength Index) ranges from 0 to 100 and measures the strength of recent gains compared with losses. Below 30 is considered “oversold”; above 70, “overbought.”
📊 Example using today’s data (daily candles, Binance):
• SOL: RSI 23.8 after falling −12.8% in 6 days ($83.96)
• XRP: RSI 23.7 after falling −19.1% in 6 days ($1.058)
• ETH: RSI 29.5, also in oversold territory
❌ Common mistake: buying just because the RSI is low. In strong downtrends, the RSI can remain in oversold territory for days or weeks while the price keeps falling. Yesterday, SOL had already broken its 20-day low.
✅ It’s better to use it alongside other signals: support levels, volume, and whether the price recovers its moving averages.
📝 In one line: Low RSI = a very sharp decline, not a guarantee of a bounce.
Do you use RSI in your analyses? 👇
#RSI #AnalisisTecnico #AprendeCripto #SOL #Tra100d
⚠️ For informational and educational purposes only; this is not financial advice. Cryptocurrencies are volatile: do your research and trade with caution.
📘 The concept: RSI (Relative Strength Index) ranges from 0 to 100 and measures the strength of recent gains compared with losses. Below 30 is considered “oversold”; above 70, “overbought.”
📊 Example using today’s data (daily candles, Binance):
• SOL: RSI 23.8 after falling −12.8% in 6 days ($83.96)
• XRP: RSI 23.7 after falling −19.1% in 6 days ($1.058)
• ETH: RSI 29.5, also in oversold territory
❌ Common mistake: buying just because the RSI is low. In strong downtrends, the RSI can remain in oversold territory for days or weeks while the price keeps falling. Yesterday, SOL had already broken its 20-day low.
✅ It’s better to use it alongside other signals: support levels, volume, and whether the price recovers its moving averages.
📝 In one line: Low RSI = a very sharp decline, not a guarantee of a bounce.
Do you use RSI in your analyses? 👇
#RSI #AnalisisTecnico #AprendeCripto #SOL #Tra100d
⚠️ For informational and educational purposes only; this is not financial advice. Cryptocurrencies are volatile: do your research and trade with caution.
95
·
--
📉 What was rising yesterday is falling today: $ZEC is down −15.3% to $979.71, below $1,000.
📌 3 things to know today:
• ZEC is Binance’s 3rd highest-volume pair ($281.7M), behind only $BTC and ETH.
• INIT, which rose +65% yesterday to $0.2132, is down −19.5% today to $0.1708. UNI is also down (−7.5%, $6.455).
• In the green: GRAM +14.1% ($1.244) and NEAR +3.1% ($3.746), with $111.4M in volume. BTC −0.7% ($73,891) and ETH −2.2% ($2,053); the Fear and Greed Index remains in fear territory (29–32).
🔍 Why it matters: very rapid rises are often followed by equally sharp drops. I couldn’t find any confirmed news to explain these moves; these are just the data.
Do you take profits quickly or hold on when a coin takes off? 👇
#ZEC #Altcoins #MercadoCripto #Cripto #Tra100d
⚠️ For informational and educational purposes only; this is not financial advice. Cryptocurrencies are volatile: do your own research and trade with caution.
📉 What was rising yesterday is falling today: $ZEC is down −15.3% to $979.71, below $1,000.
📌 3 things to know today:
• ZEC is Binance’s 3rd highest-volume pair ($281.7M), behind only $BTC and ETH.
• INIT, which rose +65% yesterday to $0.2132, is down −19.5% today to $0.1708. UNI is also down (−7.5%, $6.455).
• In the green: GRAM +14.1% ($1.244) and NEAR +3.1% ($3.746), with $111.4M in volume. BTC −0.7% ($73,891) and ETH −2.2% ($2,053); the Fear and Greed Index remains in fear territory (29–32).
🔍 Why it matters: very rapid rises are often followed by equally sharp drops. I couldn’t find any confirmed news to explain these moves; these are just the data.
Do you take profits quickly or hold on when a coin takes off? 👇
#ZEC #Altcoins #MercadoCripto #Cripto #Tra100d
⚠️ For informational and educational purposes only; this is not financial advice. Cryptocurrencies are volatile: do your own research and trade with caution.
📌 3 things to know today:
• ZEC is Binance’s 3rd highest-volume pair ($281.7M), behind only $BTC and ETH.
• INIT, which rose +65% yesterday to $0.2132, is down −19.5% today to $0.1708. UNI is also down (−7.5%, $6.455).
• In the green: GRAM +14.1% ($1.244) and NEAR +3.1% ($3.746), with $111.4M in volume. BTC −0.7% ($73,891) and ETH −2.2% ($2,053); the Fear and Greed Index remains in fear territory (29–32).
🔍 Why it matters: very rapid rises are often followed by equally sharp drops. I couldn’t find any confirmed news to explain these moves; these are just the data.
Do you take profits quickly or hold on when a coin takes off? 👇
#ZEC #Altcoins #MercadoCripto #Cripto #Tra100d
⚠️ For informational and educational purposes only; this is not financial advice. Cryptocurrencies are volatile: do your own research and trade with caution.
118
·
--
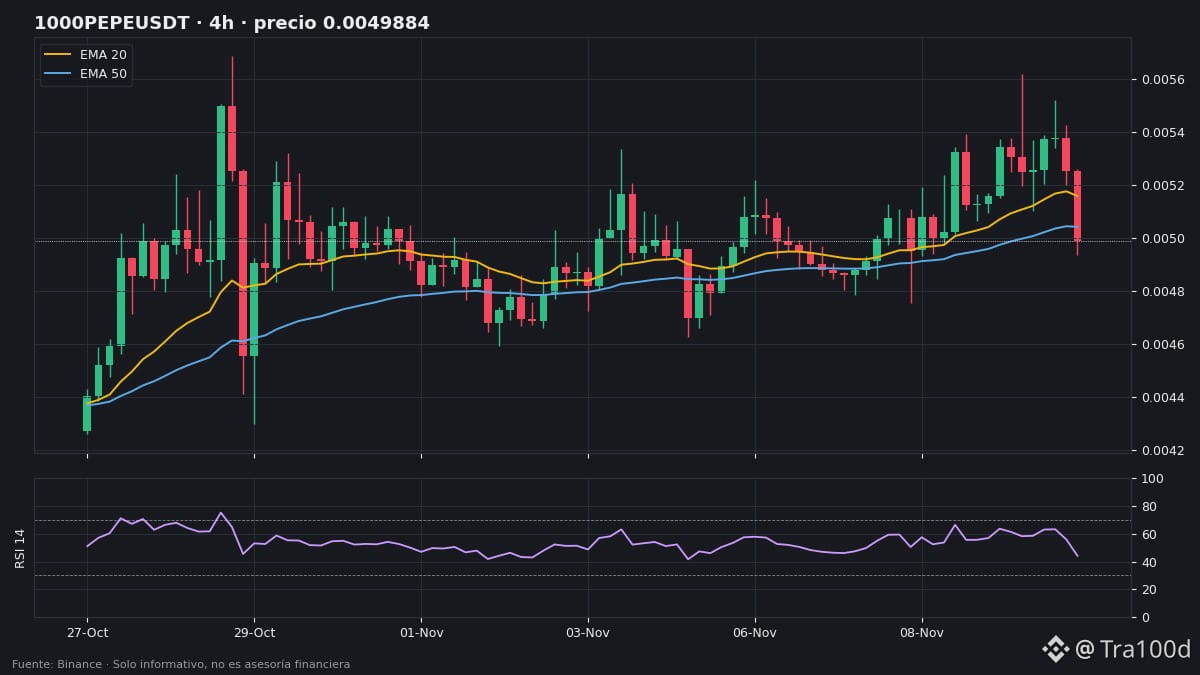
🐸 Two days at the top… and today PEPE hits the brakes: −6.0% in 24 hours, the biggest meme-coin drop.
📊 The data (Binance):
• Spot price: $0.00000497
• 24-hour volume: $109.2M, more than triple $DOGE ($34.5M, −1.9%)
• Over 4 hours: −6.0% over the last 6 candles, RSI 44.2, and the latest candle’s volume is nearly twice normal
• On the daily chart, it’s still in a strong uptrend (RSI 64.7)
🆚 The rest: BONK +1.4%, SHIB +0.5%, WIF +0.3%, and FLOKI −0.2%.
📏 4-hour levels (price per token):
• Resistance: $0.000005043 (EMA 50) and $0.000005159 (EMA 20)
• Support: $0.000004753 (20-candle low)
• The high we were watching yesterday came in at $0.00000562
👀 The reversal is clear in futures: funding −0.021% (shorts are paying now) and open interest −9.5% → many longs have closed.
⚡ Risk: daily ATR of 8.2%, more than double BTC’s (3.1%).
Healthy correction or the end of the run? Reply “HEALTHY” or “END” 👇
#PEPE #Memecoin #Cripto #Binance #Tra100d
⚠️ For informational and educational purposes only; this is not financial advice. Cryptocurrencies are volatile: do your own research and trade with caution.
🐸 Two days at the top… and today PEPE hits the brakes: −6.0% in 24 hours, the biggest meme-coin drop.
📊 The data (Binance):
• Spot price: $0.00000497
• 24-hour volume: $109.2M, more than triple $DOGE ($34.5M, −1.9%)
• Over 4 hours: −6.0% over the last 6 candles, RSI 44.2, and the latest candle’s volume is nearly twice normal
• On the daily chart, it’s still in a strong uptrend (RSI 64.7)
🆚 The rest: BONK +1.4%, SHIB +0.5%, WIF +0.3%, and FLOKI −0.2%.
📏 4-hour levels (price per token):
• Resistance: $0.000005043 (EMA 50) and $0.000005159 (EMA 20)
• Support: $0.000004753 (20-candle low)
• The high we were watching yesterday came in at $0.00000562
👀 The reversal is clear in futures: funding −0.021% (shorts are paying now) and open interest −9.5% → many longs have closed.
⚡ Risk: daily ATR of 8.2%, more than double BTC’s (3.1%).
Healthy correction or the end of the run? Reply “HEALTHY” or “END” 👇
#PEPE #Memecoin #Cripto #Binance #Tra100d
⚠️ For informational and educational purposes only; this is not financial advice. Cryptocurrencies are volatile: do your own research and trade with caution.
📊 The data (Binance):
• Spot price: $0.00000497
• 24-hour volume: $109.2M, more than triple $DOGE ($34.5M, −1.9%)
• Over 4 hours: −6.0% over the last 6 candles, RSI 44.2, and the latest candle’s volume is nearly twice normal
• On the daily chart, it’s still in a strong uptrend (RSI 64.7)
🆚 The rest: BONK +1.4%, SHIB +0.5%, WIF +0.3%, and FLOKI −0.2%.
📏 4-hour levels (price per token):
• Resistance: $0.000005043 (EMA 50) and $0.000005159 (EMA 20)
• Support: $0.000004753 (20-candle low)
• The high we were watching yesterday came in at $0.00000562
👀 The reversal is clear in futures: funding −0.021% (shorts are paying now) and open interest −9.5% → many longs have closed.
⚡ Risk: daily ATR of 8.2%, more than double BTC’s (3.1%).
Healthy correction or the end of the run? Reply “HEALTHY” or “END” 👇
#PEPE #Memecoin #Cripto #Binance #Tra100d
⚠️ For informational and educational purposes only; this is not financial advice. Cryptocurrencies are volatile: do your own research and trade with caution.
68
·
--
📉 $ETH is trading at $2,094 (−1.0% in 24h) and is down −6.2% over the last 6 daily candles. It is now below its daily 200 EMA ($2,231), the long-term trend line.
📊 Daily context:
• Below the 20 EMA ($2,291), the 50 EMA ($2,370), and the 200 EMA ($2,231)
• RSI 33.7: near oversold, but not quite there
• Volume is 1.3 times normal: the decline is happening with participation
• ATR is $99 (4.7%) per day
📏 Levels:
• Support: $2,050 (20-day low), just 2% below the price
• Resistances: $2,231 (daily 200 EMA) and $2,291 (20 EMA)
🟢 Bullish scenario: holding $2,050 and reclaiming the 200 EMA ($2,231) would bring ETH back into its range.
🔴 Bearish scenario: a daily close below $2,050 would leave ETH without its nearest support from the past few weeks.
👀 What to watch: open interest is down −1.9% and funding is almost neutral (+0.004%): people are closing positions, not making strong bets in either direction. The daily close relative to $2,050 will determine the next move.
Will ETH hold $2,050 or lose it? 👇
#ETH #Ethereum #AnalisisTecnico #Cripto #Tra100d
⚠️ For informational and educational purposes only; this is not financial advice. Cryptocurrencies are volatile: do your own research and trade with caution.
📉 $ETH is trading at $2,094 (−1.0% in 24h) and is down −6.2% over the last 6 daily candles. It is now below its daily 200 EMA ($2,231), the long-term trend line.
📊 Daily context:
• Below the 20 EMA ($2,291), the 50 EMA ($2,370), and the 200 EMA ($2,231)
• RSI 33.7: near oversold, but not quite there
• Volume is 1.3 times normal: the decline is happening with participation
• ATR is $99 (4.7%) per day
📏 Levels:
• Support: $2,050 (20-day low), just 2% below the price
• Resistances: $2,231 (daily 200 EMA) and $2,291 (20 EMA)
🟢 Bullish scenario: holding $2,050 and reclaiming the 200 EMA ($2,231) would bring ETH back into its range.
🔴 Bearish scenario: a daily close below $2,050 would leave ETH without its nearest support from the past few weeks.
👀 What to watch: open interest is down −1.9% and funding is almost neutral (+0.004%): people are closing positions, not making strong bets in either direction. The daily close relative to $2,050 will determine the next move.
Will ETH hold $2,050 or lose it? 👇
#ETH #Ethereum #AnalisisTecnico #Cripto #Tra100d
⚠️ For informational and educational purposes only; this is not financial advice. Cryptocurrencies are volatile: do your own research and trade with caution.
📊 Daily context:
• Below the 20 EMA ($2,291), the 50 EMA ($2,370), and the 200 EMA ($2,231)
• RSI 33.7: near oversold, but not quite there
• Volume is 1.3 times normal: the decline is happening with participation
• ATR is $99 (4.7%) per day
📏 Levels:
• Support: $2,050 (20-day low), just 2% below the price
• Resistances: $2,231 (daily 200 EMA) and $2,291 (20 EMA)
🟢 Bullish scenario: holding $2,050 and reclaiming the 200 EMA ($2,231) would bring ETH back into its range.
🔴 Bearish scenario: a daily close below $2,050 would leave ETH without its nearest support from the past few weeks.
👀 What to watch: open interest is down −1.9% and funding is almost neutral (+0.004%): people are closing positions, not making strong bets in either direction. The daily close relative to $2,050 will determine the next move.
Will ETH hold $2,050 or lose it? 👇
#ETH #Ethereum #AnalisisTecnico #Cripto #Tra100d
⚠️ For informational and educational purposes only; this is not financial advice. Cryptocurrencies are volatile: do your own research and trade with caution.
104
·
--
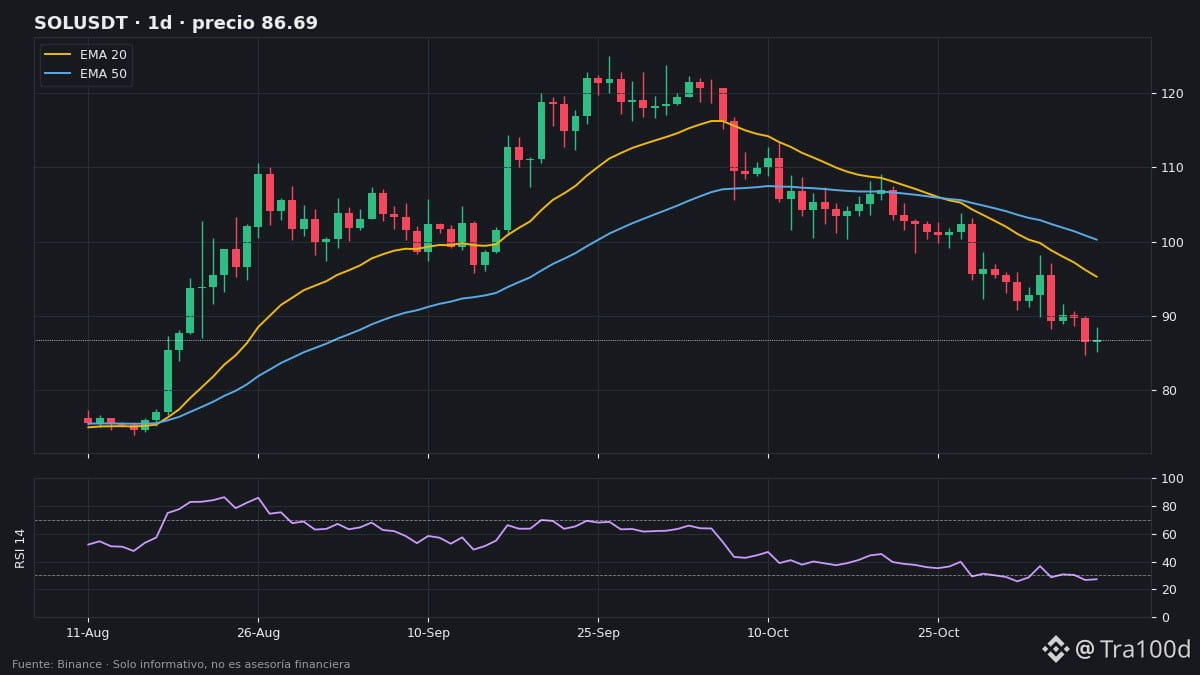
🚨 $SOL broke below its 20-day low ($84.66): it touched $84.12, the lowest level in the past month, and is now battling right around that zone at $84.68 (−1.7% in 24 hours).
📉 Daily RSI at 27.2 (oversold) and far from its daily 200 EMA ($93.33). Meanwhile, futures open interest is up +3.4%: new positions are entering despite the drop.
👀 Key levels: $84.66 (previous low) and $84.12 (new low). Closing the day above $84.66 would signal a rebound; falling below $84.12 would confirm the breakdown.
Rebound or breakdown? 👇
#SOL #Solana #Cripto #Tra100d
⚠️ For informational and educational purposes only; not financial advice. Cryptocurrencies are volatile: do your own research and trade with caution.
🚨 $SOL broke below its 20-day low ($84.66): it touched $84.12, the lowest level in the past month, and is now battling right around that zone at $84.68 (−1.7% in 24 hours).
📉 Daily RSI at 27.2 (oversold) and far from its daily 200 EMA ($93.33). Meanwhile, futures open interest is up +3.4%: new positions are entering despite the drop.
👀 Key levels: $84.66 (previous low) and $84.12 (new low). Closing the day above $84.66 would signal a rebound; falling below $84.12 would confirm the breakdown.
Rebound or breakdown? 👇
#SOL #Solana #Cripto #Tra100d
⚠️ For informational and educational purposes only; not financial advice. Cryptocurrencies are volatile: do your own research and trade with caution.
📉 Daily RSI at 27.2 (oversold) and far from its daily 200 EMA ($93.33). Meanwhile, futures open interest is up +3.4%: new positions are entering despite the drop.
👀 Key levels: $84.66 (previous low) and $84.12 (new low). Closing the day above $84.66 would signal a rebound; falling below $84.12 would confirm the breakdown.
Rebound or breakdown? 👇
#SOL #Solana #Cripto #Tra100d
⚠️ For informational and educational purposes only; not financial advice. Cryptocurrencies are volatile: do your own research and trade with caution.
565
·
--
🧠 Today on INIT, someone who opens a $1,000 short pays about $12.40 in a single funding payment. Why?
📘 What it is: perpetual futures have no expiry date. To keep their price from drifting away from the spot price, longs and shorts pay each other periodically. That payment is the funding rate.
• Positive funding → longs pay shorts (more people are betting on prices going up)
• Negative funding → shorts pay longs (more people are betting on prices going down)
📊 Example using today's data (Binance):
• $BTC : +0.0089% → a $1,000 long pays about $0.09 per payment. Normal and uneventful.
• $INIT : −1.24% → a $1,000 short pays $12.40 per payment, about 140 times what a long pays on BTC.
❌ Common mistake: thinking “negative funding = the price is going down.” If lots of shorts are paying a hefty amount and the price rises, they may be forced to close their positions, pushing the price even higher (a short squeeze). Funding measures how people are positioned, not where the price is headed.
✅ In a nutshell: funding tells you who is betting on what… and how much it costs them to keep that bet open.
Do you check funding before opening a futures position? YES or NO 👇
#FundingRate #Futuros #AprendeCripto #Cripto #Tra100d
⚠️ For informational and educational purposes only; this is not financial advice. Cryptocurrencies are volatile: do your own research and trade with caution.
🧠 Today on INIT, someone who opens a $1,000 short pays about $12.40 in a single funding payment. Why?
📘 What it is: perpetual futures have no expiry date. To keep their price from drifting away from the spot price, longs and shorts pay each other periodically. That payment is the funding rate.
• Positive funding → longs pay shorts (more people are betting on prices going up)
• Negative funding → shorts pay longs (more people are betting on prices going down)
📊 Example using today's data (Binance):
• $BTC : +0.0089% → a $1,000 long pays about $0.09 per payment. Normal and uneventful.
• $INIT : −1.24% → a $1,000 short pays $12.40 per payment, about 140 times what a long pays on BTC.
❌ Common mistake: thinking “negative funding = the price is going down.” If lots of shorts are paying a hefty amount and the price rises, they may be forced to close their positions, pushing the price even higher (a short squeeze). Funding measures how people are positioned, not where the price is headed.
✅ In a nutshell: funding tells you who is betting on what… and how much it costs them to keep that bet open.
Do you check funding before opening a futures position? YES or NO 👇
#FundingRate #Futuros #AprendeCripto #Cripto #Tra100d
⚠️ For informational and educational purposes only; this is not financial advice. Cryptocurrencies are volatile: do your own research and trade with caution.
📘 What it is: perpetual futures have no expiry date. To keep their price from drifting away from the spot price, longs and shorts pay each other periodically. That payment is the funding rate.
• Positive funding → longs pay shorts (more people are betting on prices going up)
• Negative funding → shorts pay longs (more people are betting on prices going down)
📊 Example using today's data (Binance):
• $BTC : +0.0089% → a $1,000 long pays about $0.09 per payment. Normal and uneventful.
• $INIT : −1.24% → a $1,000 short pays $12.40 per payment, about 140 times what a long pays on BTC.
❌ Common mistake: thinking “negative funding = the price is going down.” If lots of shorts are paying a hefty amount and the price rises, they may be forced to close their positions, pushing the price even higher (a short squeeze). Funding measures how people are positioned, not where the price is headed.
✅ In a nutshell: funding tells you who is betting on what… and how much it costs them to keep that bet open.
Do you check funding before opening a futures position? YES or NO 👇
#FundingRate #Futuros #AprendeCripto #Cripto #Tra100d
⚠️ For informational and educational purposes only; this is not financial advice. Cryptocurrencies are volatile: do your own research and trade with caution.
120
·
--
🚀 Today, one coin is taking over the Binance leaderboard: INIT is up +65.5% in 24 hours, reaching $0.2132.
📌 3 stats for today:
• INIT saw $20.2M in trading volume today, and its futures open interest grew +89%. Its funding rate is −1.24%: short sellers are paying a lot to bet on prices falling.
• In the red: ARB −9.0% ($0.1635) and $ZEC −6.1% ($1,147), which is also the 3rd highest-volume pair ($156.4M).
• The rest of the market is calming down: $BTC −0.7% ($74,216), ETH −1.8%, and the Fear and Greed Index rises from 29 to 32 (still in fear).
🔍 Why it matters: a 65% surge with short sellers paying such a high funding rate often brings a lot of volatility in both directions. I couldn’t find any confirmed news explaining the move; these are just the numbers.
Would you buy coins that are already up 65%, or wait? 👇
#INIT #Altcoins #MercadoCripto #Cripto #Tra100d
⚠️ For informational and educational purposes only; this is not financial advice. Cryptocurrencies are volatile: do your own research and trade with caution.
🚀 Today, one coin is taking over the Binance leaderboard: INIT is up +65.5% in 24 hours, reaching $0.2132.
📌 3 stats for today:
• INIT saw $20.2M in trading volume today, and its futures open interest grew +89%. Its funding rate is −1.24%: short sellers are paying a lot to bet on prices falling.
• In the red: ARB −9.0% ($0.1635) and $ZEC −6.1% ($1,147), which is also the 3rd highest-volume pair ($156.4M).
• The rest of the market is calming down: $BTC −0.7% ($74,216), ETH −1.8%, and the Fear and Greed Index rises from 29 to 32 (still in fear).
🔍 Why it matters: a 65% surge with short sellers paying such a high funding rate often brings a lot of volatility in both directions. I couldn’t find any confirmed news explaining the move; these are just the numbers.
Would you buy coins that are already up 65%, or wait? 👇
#INIT #Altcoins #MercadoCripto #Cripto #Tra100d
⚠️ For informational and educational purposes only; this is not financial advice. Cryptocurrencies are volatile: do your own research and trade with caution.
📌 3 stats for today:
• INIT saw $20.2M in trading volume today, and its futures open interest grew +89%. Its funding rate is −1.24%: short sellers are paying a lot to bet on prices falling.
• In the red: ARB −9.0% ($0.1635) and $ZEC −6.1% ($1,147), which is also the 3rd highest-volume pair ($156.4M).
• The rest of the market is calming down: $BTC −0.7% ($74,216), ETH −1.8%, and the Fear and Greed Index rises from 29 to 32 (still in fear).
🔍 Why it matters: a 65% surge with short sellers paying such a high funding rate often brings a lot of volatility in both directions. I couldn’t find any confirmed news explaining the move; these are just the numbers.
Would you buy coins that are already up 65%, or wait? 👇
#INIT #Altcoins #MercadoCripto #Cripto #Tra100d
⚠️ For informational and educational purposes only; this is not financial advice. Cryptocurrencies are volatile: do your own research and trade with caution.
1
269
·
--
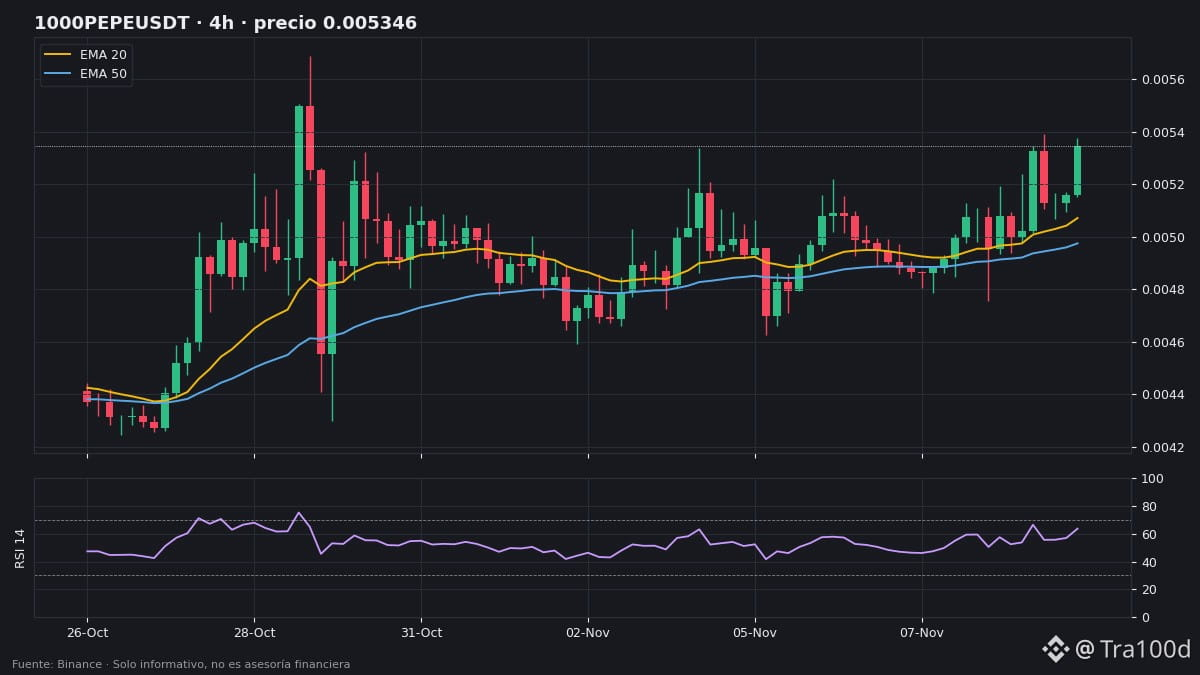
🐸 Two days in a row and PEPE is still leading: +3.7% in 24 hours, the top-gaining meme coin today.
📊 The data (Binance):
• Spot price: $0.00000528
• 24-hour volume: $68.4M, more than triple that of $DOGE ($22.0M), which is flat (−0.01%)
• On the 4-hour chart: strong uptrend, RSI at 63.7 and +6.9% over the last 6 candles
• Last candle’s volume: 1.3 times normal
🆚 The rest: BONK +2.2%, FLOKI +1.2%, SHIB +0.7% and WIF −0.1%.
📏 4-hour levels (price per token):
• Resistance: $0.000005393 (20-candle high), less than 1% above the price
• Support: $0.000005071 (EMA 20) and $0.000004975 (EMA 50)
👀 In futures: funding +0.01% and open interest +2.7% → positions keep piling in, mostly longs.
⚡ Risk: Daily ATR of 8.5%, nearly three times BTC’s (3.0%). A high this close could mean a breakout… or a ceiling.
Will it break the high or stall there? Reply "BREAK" or "STALL" 👇
#PEPE #Memecoin #Cripto #Binance #Tra100d
⚠️ For informational and educational purposes only; this is not financial advice. Cryptocurrencies are volatile: do your own research and trade with caution.
🐸 Two days in a row and PEPE is still leading: +3.7% in 24 hours, the top-gaining meme coin today.
📊 The data (Binance):
• Spot price: $0.00000528
• 24-hour volume: $68.4M, more than triple that of $DOGE ($22.0M), which is flat (−0.01%)
• On the 4-hour chart: strong uptrend, RSI at 63.7 and +6.9% over the last 6 candles
• Last candle’s volume: 1.3 times normal
🆚 The rest: BONK +2.2%, FLOKI +1.2%, SHIB +0.7% and WIF −0.1%.
📏 4-hour levels (price per token):
• Resistance: $0.000005393 (20-candle high), less than 1% above the price
• Support: $0.000005071 (EMA 20) and $0.000004975 (EMA 50)
👀 In futures: funding +0.01% and open interest +2.7% → positions keep piling in, mostly longs.
⚡ Risk: Daily ATR of 8.5%, nearly three times BTC’s (3.0%). A high this close could mean a breakout… or a ceiling.
Will it break the high or stall there? Reply "BREAK" or "STALL" 👇
#PEPE #Memecoin #Cripto #Binance #Tra100d
⚠️ For informational and educational purposes only; this is not financial advice. Cryptocurrencies are volatile: do your own research and trade with caution.
📊 The data (Binance):
• Spot price: $0.00000528
• 24-hour volume: $68.4M, more than triple that of $DOGE ($22.0M), which is flat (−0.01%)
• On the 4-hour chart: strong uptrend, RSI at 63.7 and +6.9% over the last 6 candles
• Last candle’s volume: 1.3 times normal
🆚 The rest: BONK +2.2%, FLOKI +1.2%, SHIB +0.7% and WIF −0.1%.
📏 4-hour levels (price per token):
• Resistance: $0.000005393 (20-candle high), less than 1% above the price
• Support: $0.000005071 (EMA 20) and $0.000004975 (EMA 50)
👀 In futures: funding +0.01% and open interest +2.7% → positions keep piling in, mostly longs.
⚡ Risk: Daily ATR of 8.5%, nearly three times BTC’s (3.0%). A high this close could mean a breakout… or a ceiling.
Will it break the high or stall there? Reply "BREAK" or "STALL" 👇
#PEPE #Memecoin #Cripto #Binance #Tra100d
⚠️ For informational and educational purposes only; this is not financial advice. Cryptocurrencies are volatile: do your own research and trade with caution.
65
Log in to explore more content
Join global crypto users on Binance Square
⚡️ Get latest and useful information about crypto.
💬 Trusted by the world’s largest crypto exchange.
👍 Discover real insights from verified creators.
Email / Phone number
Trending Topics
WhoWillSucceedJensenHuangatNvidia?
115,597 views
1,382 Discussing
Nvidia Says No CEO Talks Underway as "Stand With Jensen" Petition Tops 77,900 Signatures
Binance News
·30 Likes
·45.7k views
WhatWillDriveCryptoandStocks’NextRebound?
496,193 views
3,265 Discussing
BitcoinActiveSupplyInProfitDropsBelow45%
45,518 views
537 Discussing