
VICTORIA _777
13.4k Posts

VICTORIA _777
 Square Verified+
Report
Block User
Open Trade

NIL Holder
Occasional Trader
1.1 Years
117 Following
34.2K+ Followers
29.0K+ Liked
Posts
Portfolio
All
Quotes
Live
·
--
Bullish
🚨 $MAGMA
{future}(MAGMAUSDT)
IS EXPLODING 🚨
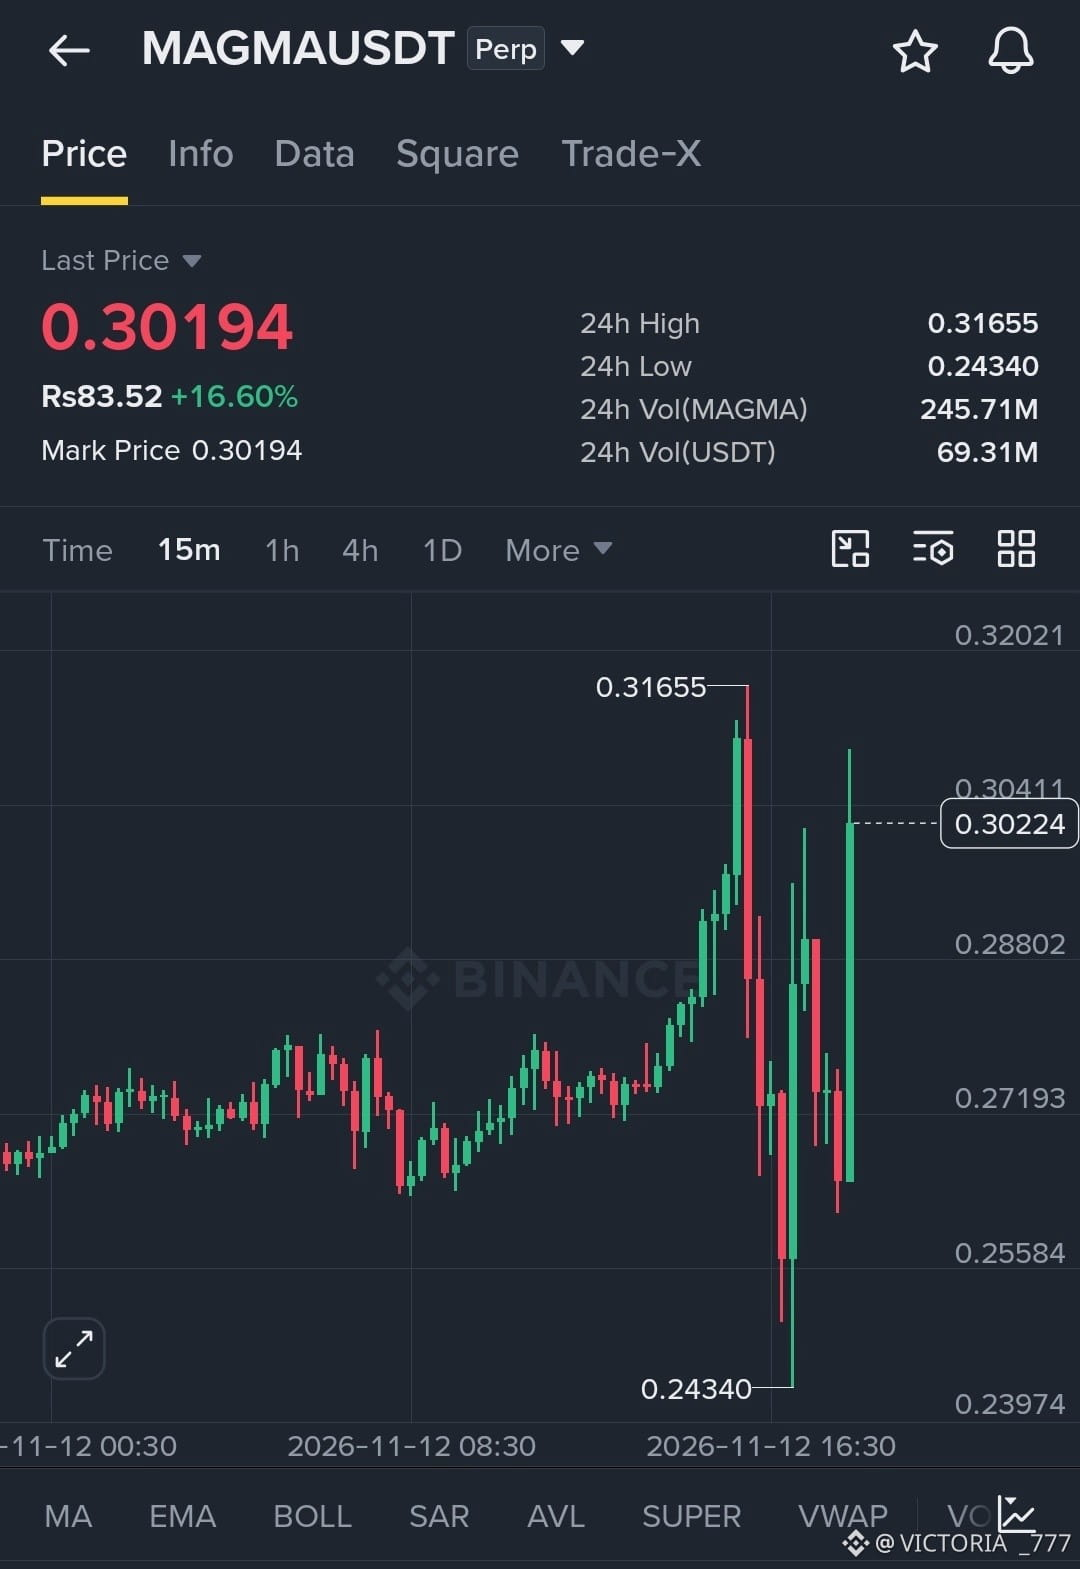
Look at this 15-minute chart. Absolute pure chaos and pure adrenaline. If you blinked, you missed the rollercoaster.
Here are the insane details:
🔥 Current Price: 0.30194 USDT (Up a massive +16.60%)
📈 24h High: 0.31655
📉 24h Low: 0.24340
💰 24h Volume: A staggering 245.71M MAGMA (Over 69.31M USDT traded!)
Did you see that violent wick down to 0.243? The market shook out the weak hands before violently ripping back up to test the highs. The volatility is off the charts right now. The 15m candles are massive!
Are you riding this wave, or are you watching from the sidelines? 🎢💥
Not financial advice. Trade at your own risk!
🚨 $MAGMA
IS EXPLODING 🚨
Look at this 15-minute chart. Absolute pure chaos and pure adrenaline. If you blinked, you missed the rollercoaster.
Here are the insane details:
🔥 Current Price: 0.30194 USDT (Up a massive +16.60%)
📈 24h High: 0.31655
📉 24h Low: 0.24340
💰 24h Volume: A staggering 245.71M MAGMA (Over 69.31M USDT traded!)
Did you see that violent wick down to 0.243? The market shook out the weak hands before violently ripping back up to test the highs. The volatility is off the charts right now. The 15m candles are massive!
Are you riding this wave, or are you watching from the sidelines? 🎢💥
Not financial advice. Trade at your own risk!
IS EXPLODING 🚨
Look at this 15-minute chart. Absolute pure chaos and pure adrenaline. If you blinked, you missed the rollercoaster.
Here are the insane details:
🔥 Current Price: 0.30194 USDT (Up a massive +16.60%)
📈 24h High: 0.31655
📉 24h Low: 0.24340
💰 24h Volume: A staggering 245.71M MAGMA (Over 69.31M USDT traded!)
Did you see that violent wick down to 0.243? The market shook out the weak hands before violently ripping back up to test the highs. The volatility is off the charts right now. The 15m candles are massive!
Are you riding this wave, or are you watching from the sidelines? 🎢💥
Not financial advice. Trade at your own risk!
3
278
🚀🔥 AGT IS ON FIRE! 200%+ EXPLOSION! 🔥🚀
💎 AGTUSDT – Alaya Governance Token (PERP)
📈 Current Price: $0.07526 (Rs. 20.88)
🟢 24H Change: +200.32%
📊 24H High: $0.08299
📉 24H Low: $0.02302
💥 24H Volume: 11.05 BILLION AGT
💰 USDT Volume: 637.64 MILLION
🔥 Performance Breakdown:
- Today: +1.72%
- 7 Days: +134.60%
- 30 Days: +358.57%
- 90 Days: +383.52%
- 180 Days: +549.80%
- 1 Year: +1,967.01%
⚡ From $0.03702 to a stunning $0.08299 high! AGT has delivered a massive rally and is now consolidating around $0.075.
👀 The big question: Is this the calm before another explosive move, or time for a correction?
🚀 WATCH AGT! VOLATILITY IS HIGH!
$AGT
{future}(AGTUSDT)
$KGEN
{future}(KGENUSDT)
$DJT
{future}(DJTUSDT)
🚀🔥 AGT IS ON FIRE! 200%+ EXPLOSION! 🔥🚀
💎 AGTUSDT – Alaya Governance Token (PERP)
📈 Current Price: $0.07526 (Rs. 20.88)
🟢 24H Change: +200.32%
📊 24H High: $0.08299
📉 24H Low: $0.02302
💥 24H Volume: 11.05 BILLION AGT
💰 USDT Volume: 637.64 MILLION
🔥 Performance Breakdown:
- Today: +1.72%
- 7 Days: +134.60%
- 30 Days: +358.57%
- 90 Days: +383.52%
- 180 Days: +549.80%
- 1 Year: +1,967.01%
⚡ From $0.03702 to a stunning $0.08299 high! AGT has delivered a massive rally and is now consolidating around $0.075.
👀 The big question: Is this the calm before another explosive move, or time for a correction?
🚀 WATCH AGT! VOLATILITY IS HIGH!
$AGT
$KGEN
$DJT
💎 AGTUSDT – Alaya Governance Token (PERP)
📈 Current Price: $0.07526 (Rs. 20.88)
🟢 24H Change: +200.32%
📊 24H High: $0.08299
📉 24H Low: $0.02302
💥 24H Volume: 11.05 BILLION AGT
💰 USDT Volume: 637.64 MILLION
🔥 Performance Breakdown:
- Today: +1.72%
- 7 Days: +134.60%
- 30 Days: +358.57%
- 90 Days: +383.52%
- 180 Days: +549.80%
- 1 Year: +1,967.01%
⚡ From $0.03702 to a stunning $0.08299 high! AGT has delivered a massive rally and is now consolidating around $0.075.
👀 The big question: Is this the calm before another explosive move, or time for a correction?
🚀 WATCH AGT! VOLATILITY IS HIGH!
$AGT
$KGEN
$DJT
$AGT
$KGEN
$DJT
4 hr(s) left
1
2
1.7k
·
--
Bullish
🚀 ALTCOIN MARKET IS ON FIRE! 🔥 THREE COINS, MASSIVE MOVES!
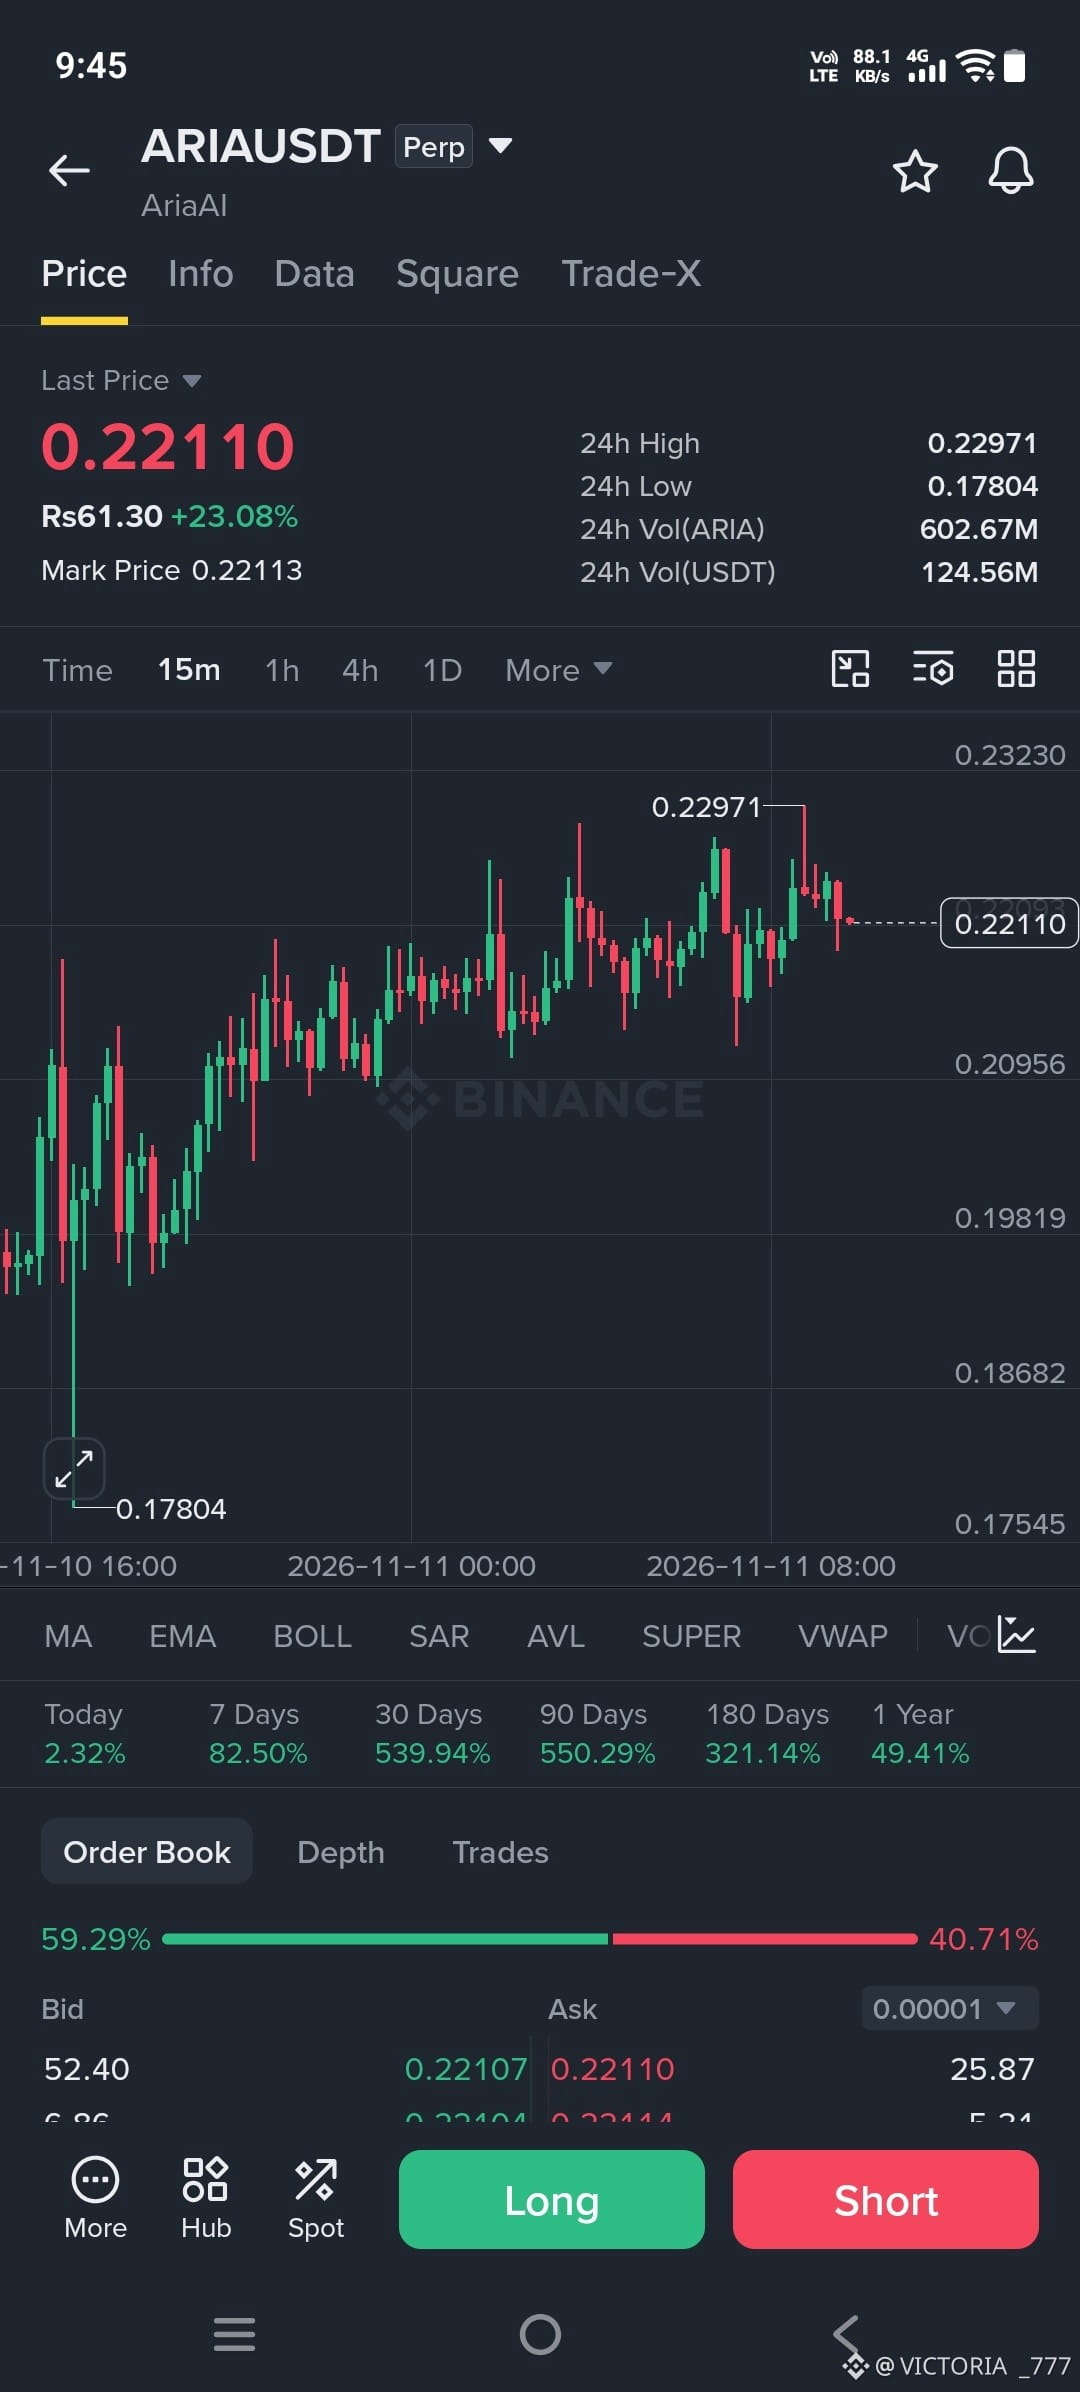
🟢 ARIAUSDT: $0.22110 (+23.08%)
📈 24H High: $0.22971 | Low: $0.17804
💰 24H Volume: $124.56M USDT
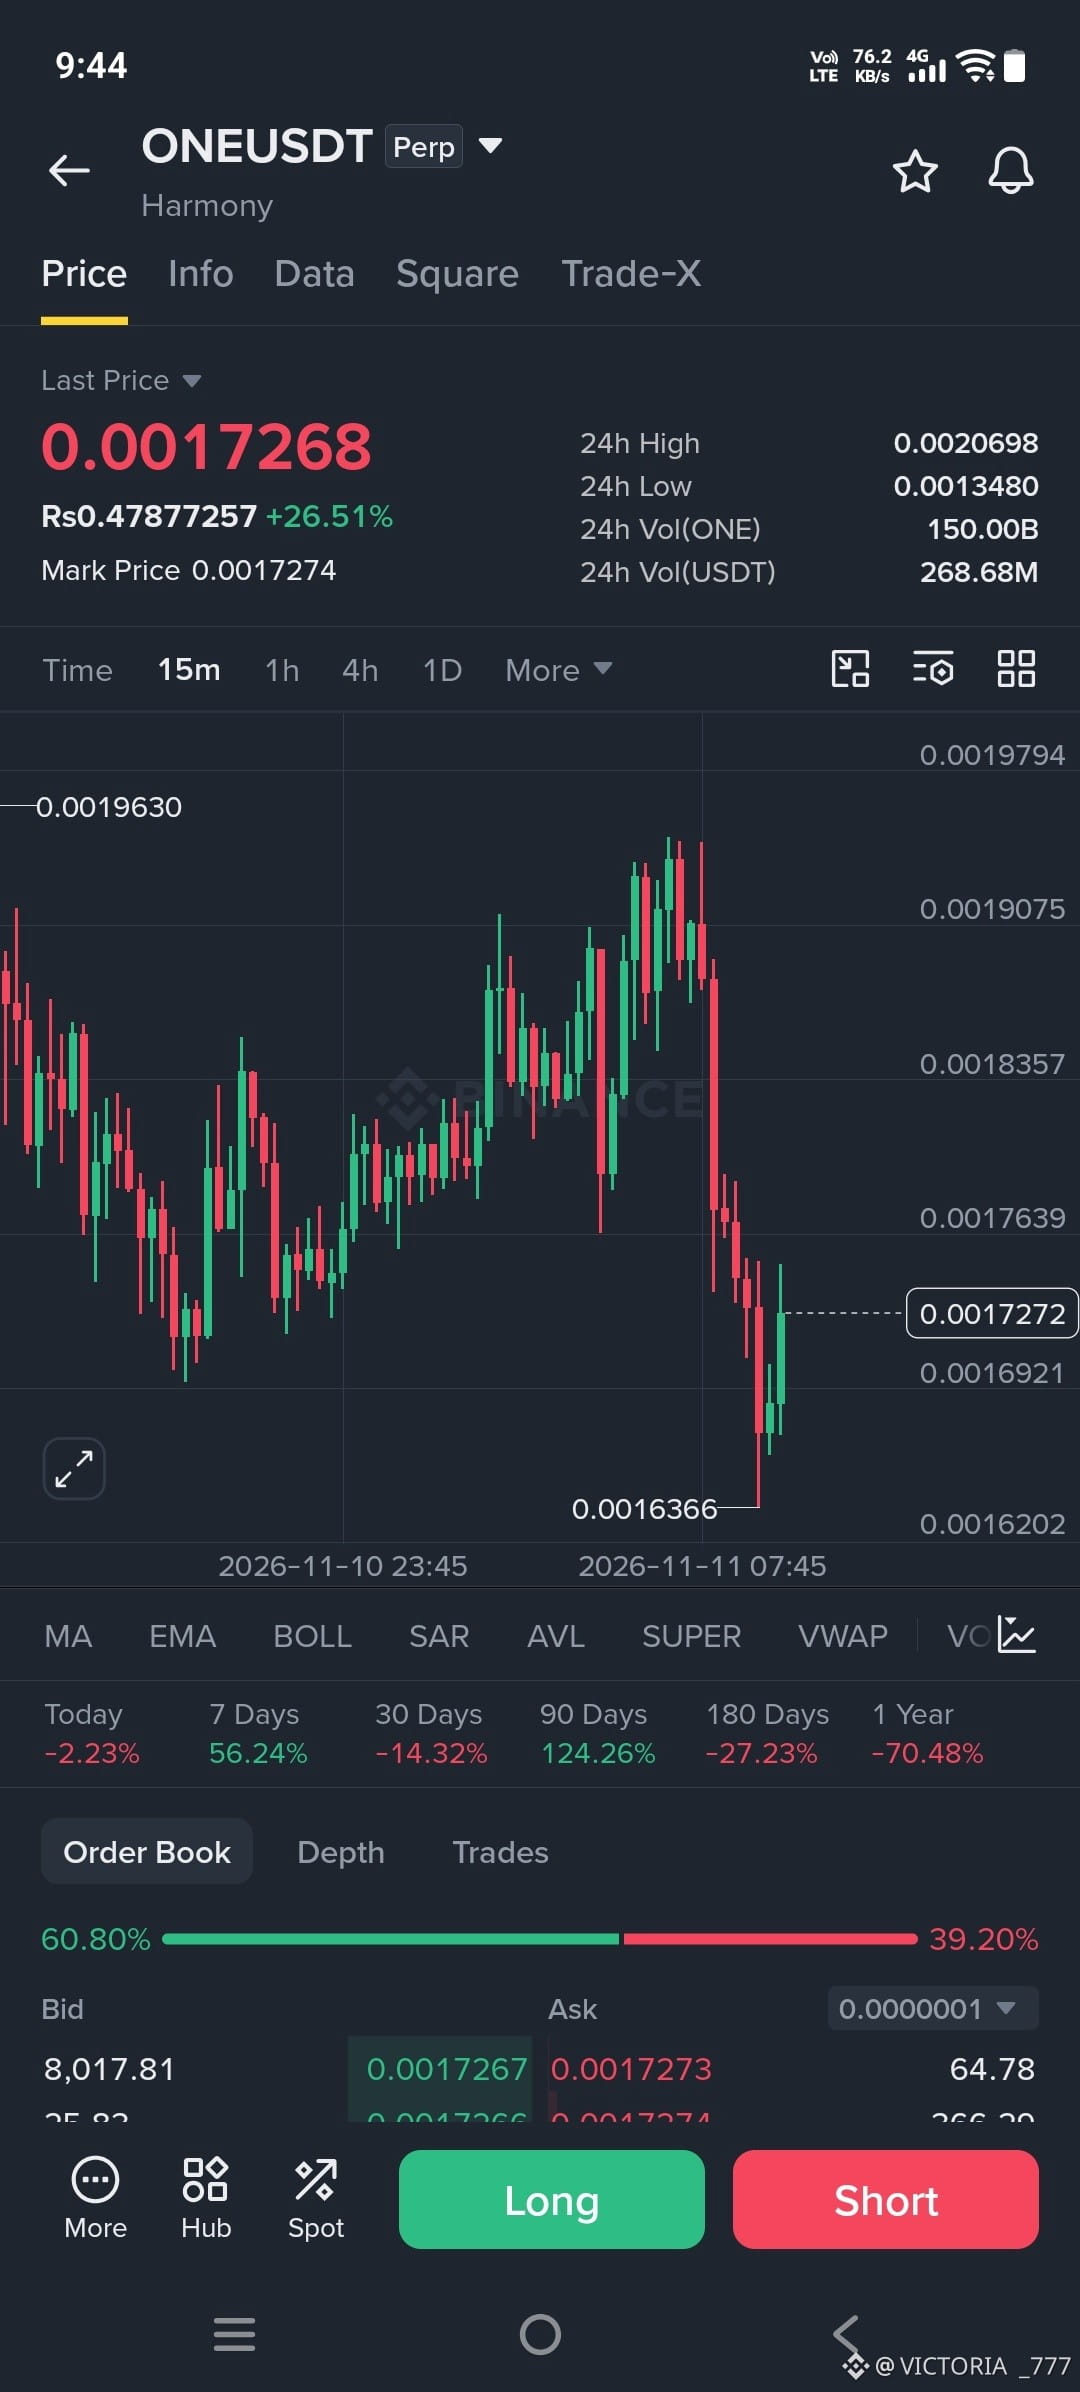
🟢 ONEUSDT: $0.0017268 (+26.51%)
📈 24H High: $0.0020698 | Low: $0.0013480
💰 24H Volume: $268.68M USDT
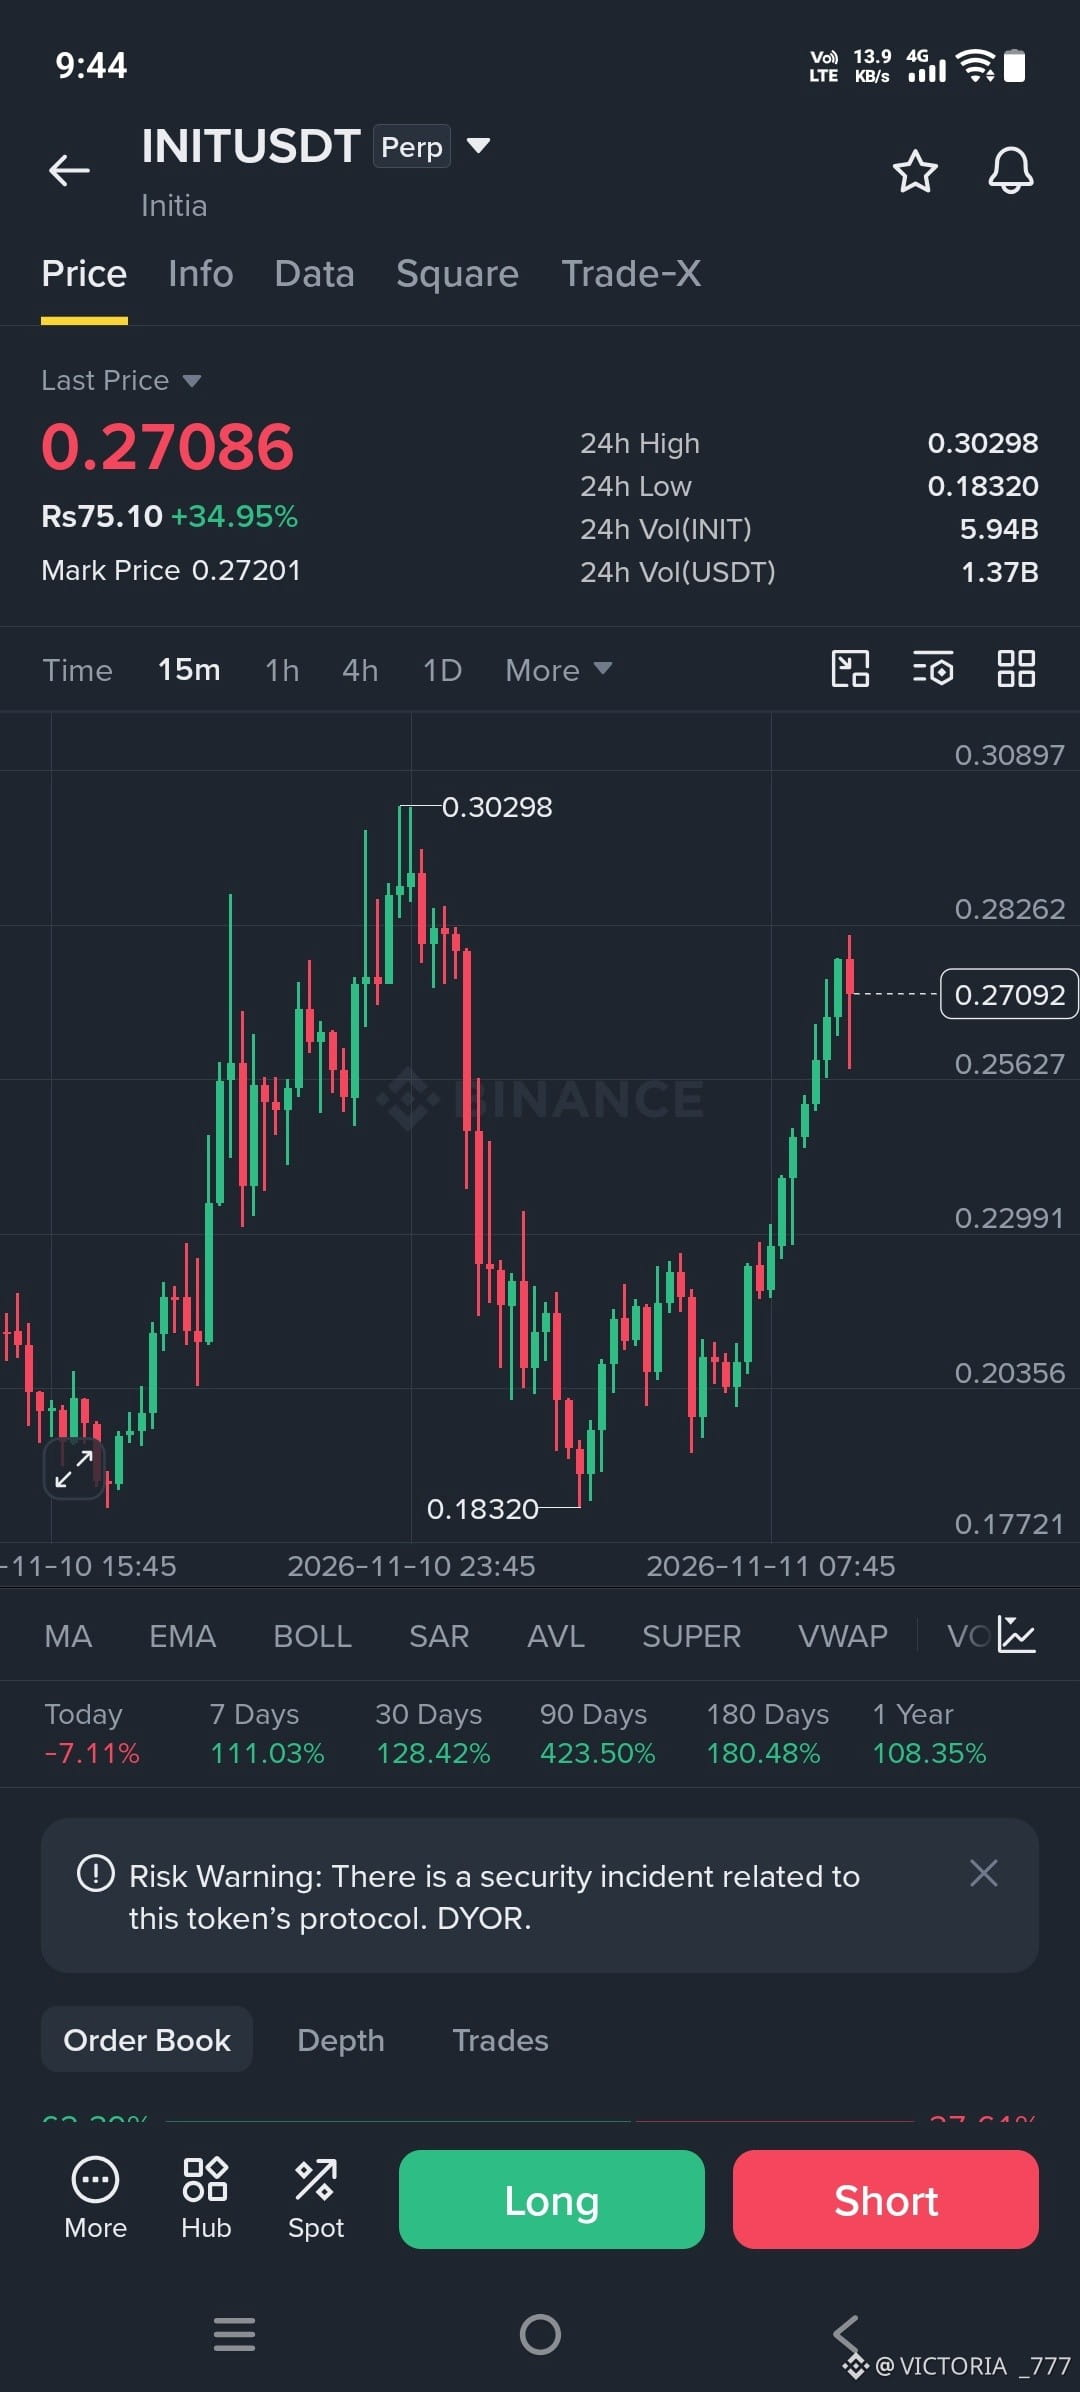
🟢 INITUSDT: $0.27086 (+34.95%)
📈 24H High: $0.30298 | Low: $0.18320
💰 24H Volume: $1.37B USDT
⚡ THE ACTION:
🔥 INIT leads with +34.95%!
🔥 ONE follows with +26.51%!
🔥 ARIA pushes higher with +23.08%!
📊 All three showing strong 24H momentum. But volatility is high!
⚠️ IMPORTANT: Binance displays a security incident warning for INIT's protocol. DYOR before trading.
🎯 WATCH THE LEVELS. MANAGE YOUR RISK. NEVER CHASE BLINDLY!
$ONE
{future}(ONEUSDT)
$INIT
{future}(INITUSDT)
$ARIA
{future}(ARIAUSDT)
🚀 ALTCOIN MARKET IS ON FIRE! 🔥 THREE COINS, MASSIVE MOVES!
🟢 ARIAUSDT: $0.22110 (+23.08%)
📈 24H High: $0.22971 | Low: $0.17804
💰 24H Volume: $124.56M USDT
🟢 ONEUSDT: $0.0017268 (+26.51%)
📈 24H High: $0.0020698 | Low: $0.0013480
💰 24H Volume: $268.68M USDT
🟢 INITUSDT: $0.27086 (+34.95%)
📈 24H High: $0.30298 | Low: $0.18320
💰 24H Volume: $1.37B USDT
⚡ THE ACTION:
🔥 INIT leads with +34.95%!
🔥 ONE follows with +26.51%!
🔥 ARIA pushes higher with +23.08%!
📊 All three showing strong 24H momentum. But volatility is high!
⚠️ IMPORTANT: Binance displays a security incident warning for INIT's protocol. DYOR before trading.
🎯 WATCH THE LEVELS. MANAGE YOUR RISK. NEVER CHASE BLINDLY!
$ONE
$INIT
$ARIA
🟢 ARIAUSDT: $0.22110 (+23.08%)
📈 24H High: $0.22971 | Low: $0.17804
💰 24H Volume: $124.56M USDT
🟢 ONEUSDT: $0.0017268 (+26.51%)
📈 24H High: $0.0020698 | Low: $0.0013480
💰 24H Volume: $268.68M USDT
🟢 INITUSDT: $0.27086 (+34.95%)
📈 24H High: $0.30298 | Low: $0.18320
💰 24H Volume: $1.37B USDT
⚡ THE ACTION:
🔥 INIT leads with +34.95%!
🔥 ONE follows with +26.51%!
🔥 ARIA pushes higher with +23.08%!
📊 All three showing strong 24H momentum. But volatility is high!
⚠️ IMPORTANT: Binance displays a security incident warning for INIT's protocol. DYOR before trading.
🎯 WATCH THE LEVELS. MANAGE YOUR RISK. NEVER CHASE BLINDLY!
$ONE
$INIT
$ARIA
1
789
·
--
Bullish
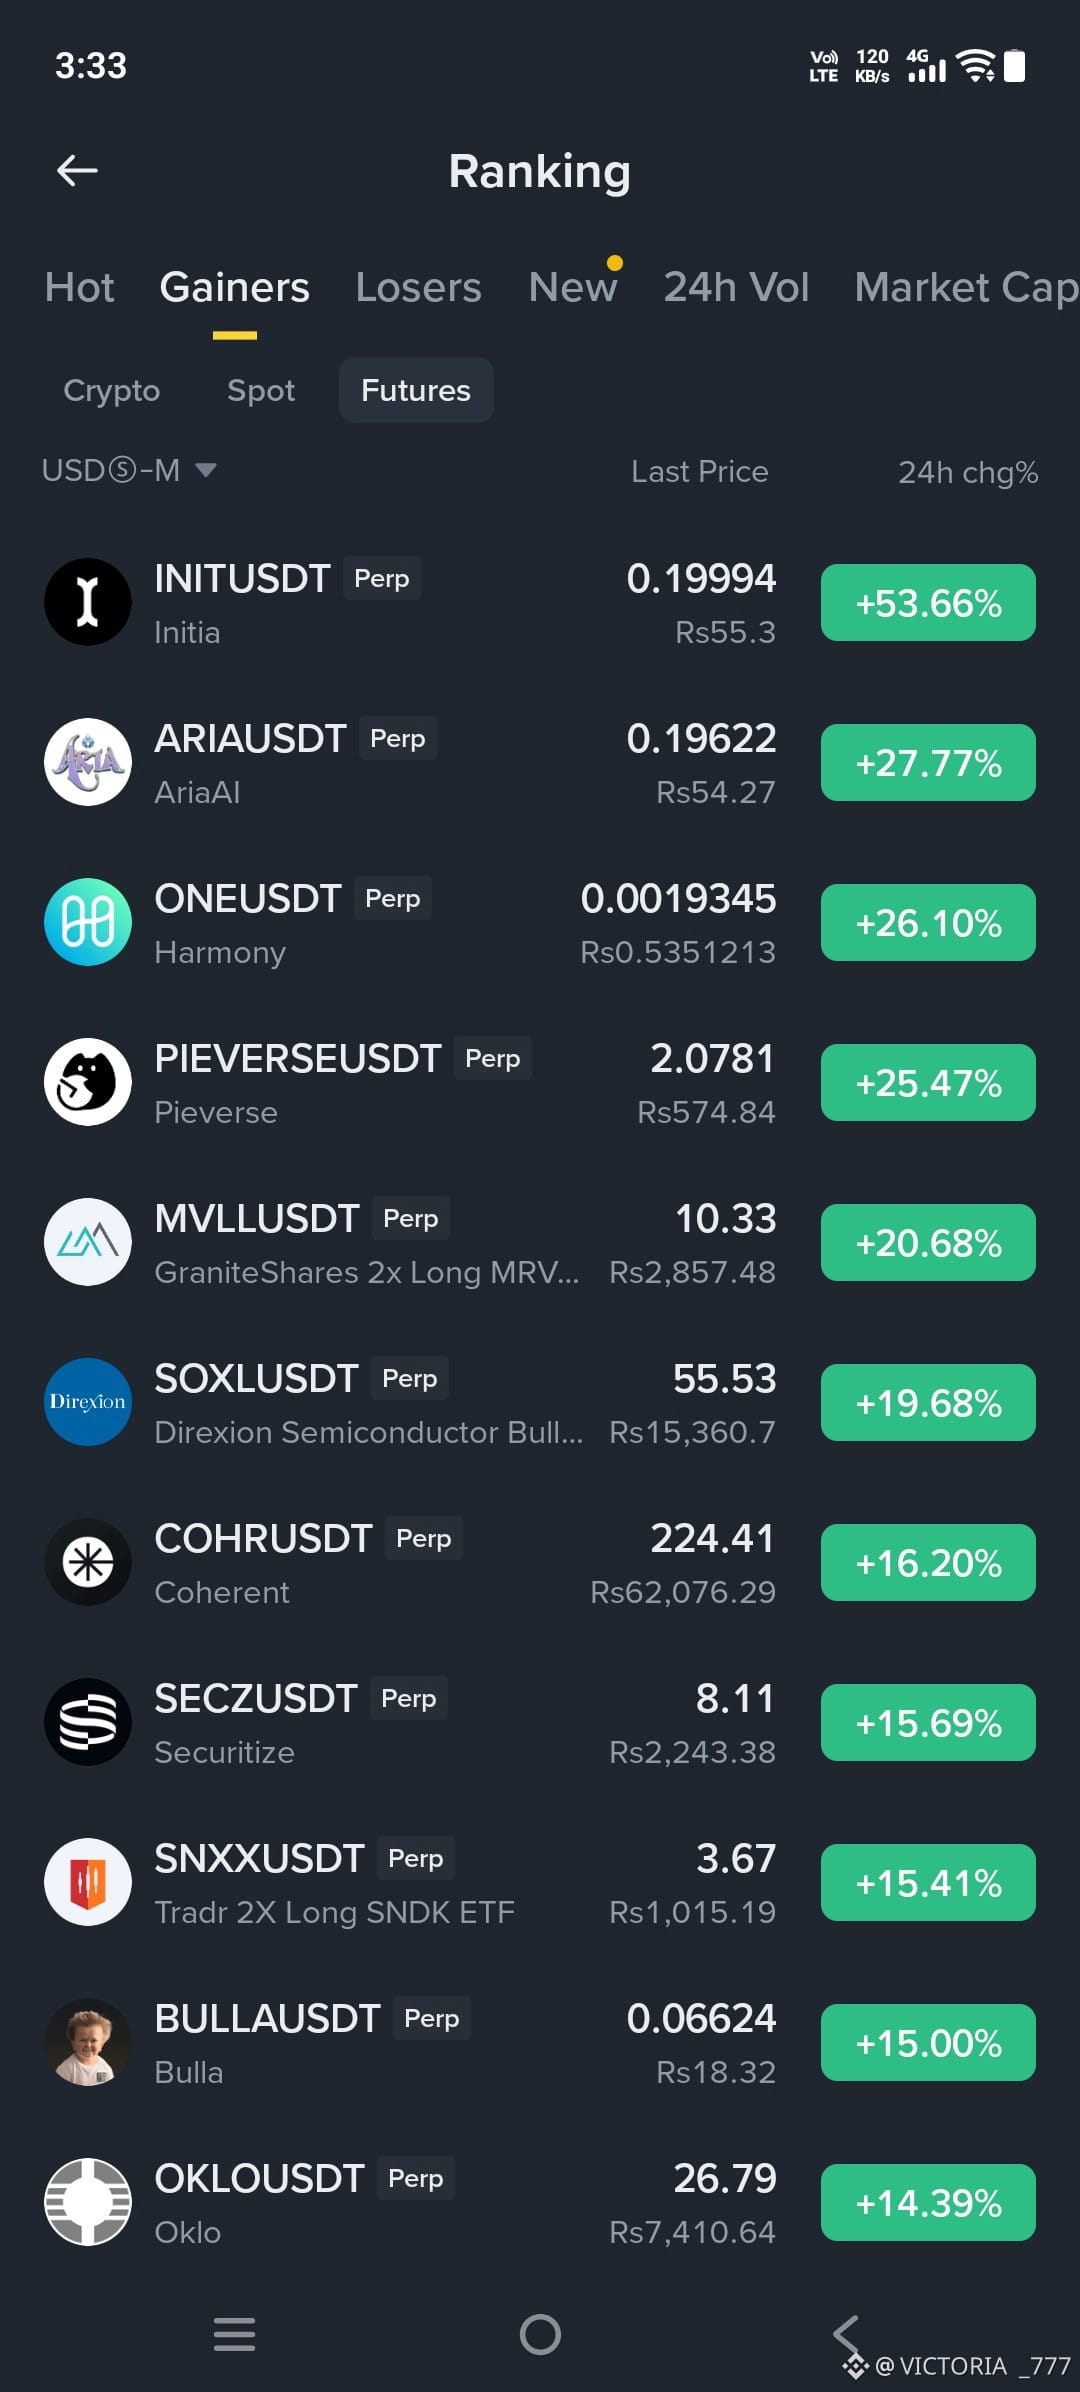
🚀🔥 **FUTURES MARKET IS ON FIRE! TOP GAINERS ALERT!** 🔥🚀
Bulls are taking control! 🐂💚 Check out today's hottest 24H futures performers:
📈 **TOP 11 GAINERS:**
🥇 INIUSDT — **+53.66%** | $0.19994
🥈 ARIAUSDT — **+27.77%** | $0.19622
🥉 ONEUSDT — **+26.10%** | $0.0019345
🔥 PIEVERSEUSDT — **+25.47%** | $2.0781
🔥 MVLLUSDT — **+20.68%** | $10.33
🔥 SOXLUSDT — **+19.68%** | $55.53
🔥 COHRUSDT — **+16.20%** | $224.41
🔥 SECZUSDT — **+15.69%** | $8.11
🔥 SNXXUSDT — **+15.41%** | $3.67
🔥 BULLAUSDT — **+15.00%** | $0.06624
🔥 OKLOUSDT — **+14.39%** | $26.79
💰 **BIGGEST MOVER:** INIUSDT with a massive +53.66% gain!
⚡ Futures | Perpetual Contracts | 24H Performance
🚨 Momentum is heating up, but remember: green candles can reverse fast. Manage risk and trade smart!
💎 **WATCH THE MARKET. CATCH THE MOMENTUM. STAY AHEAD!**
🚀🔥 **FUTURES MARKET IS ON FIRE! TOP GAINERS ALERT!** 🔥🚀
Bulls are taking control! 🐂💚 Check out today's hottest 24H futures performers:
📈 **TOP 11 GAINERS:**
🥇 INIUSDT — **+53.66%** | $0.19994
🥈 ARIAUSDT — **+27.77%** | $0.19622
🥉 ONEUSDT — **+26.10%** | $0.0019345
🔥 PIEVERSEUSDT — **+25.47%** | $2.0781
🔥 MVLLUSDT — **+20.68%** | $10.33
🔥 SOXLUSDT — **+19.68%** | $55.53
🔥 COHRUSDT — **+16.20%** | $224.41
🔥 SECZUSDT — **+15.69%** | $8.11
🔥 SNXXUSDT — **+15.41%** | $3.67
🔥 BULLAUSDT — **+15.00%** | $0.06624
🔥 OKLOUSDT — **+14.39%** | $26.79
💰 **BIGGEST MOVER:** INIUSDT with a massive +53.66% gain!
⚡ Futures | Perpetual Contracts | 24H Performance
🚨 Momentum is heating up, but remember: green candles can reverse fast. Manage risk and trade smart!
💎 **WATCH THE MARKET. CATCH THE MOMENTUM. STAY AHEAD!**
Bulls are taking control! 🐂💚 Check out today's hottest 24H futures performers:
📈 **TOP 11 GAINERS:**
🥇 INIUSDT — **+53.66%** | $0.19994
🥈 ARIAUSDT — **+27.77%** | $0.19622
🥉 ONEUSDT — **+26.10%** | $0.0019345
🔥 PIEVERSEUSDT — **+25.47%** | $2.0781
🔥 MVLLUSDT — **+20.68%** | $10.33
🔥 SOXLUSDT — **+19.68%** | $55.53
🔥 COHRUSDT — **+16.20%** | $224.41
🔥 SECZUSDT — **+15.69%** | $8.11
🔥 SNXXUSDT — **+15.41%** | $3.67
🔥 BULLAUSDT — **+15.00%** | $0.06624
🔥 OKLOUSDT — **+14.39%** | $26.79
💰 **BIGGEST MOVER:** INIUSDT with a massive +53.66% gain!
⚡ Futures | Perpetual Contracts | 24H Performance
🚨 Momentum is heating up, but remember: green candles can reverse fast. Manage risk and trade smart!
💎 **WATCH THE MARKET. CATCH THE MOMENTUM. STAY AHEAD!**
1
4
1.1k
·
--
Bullish
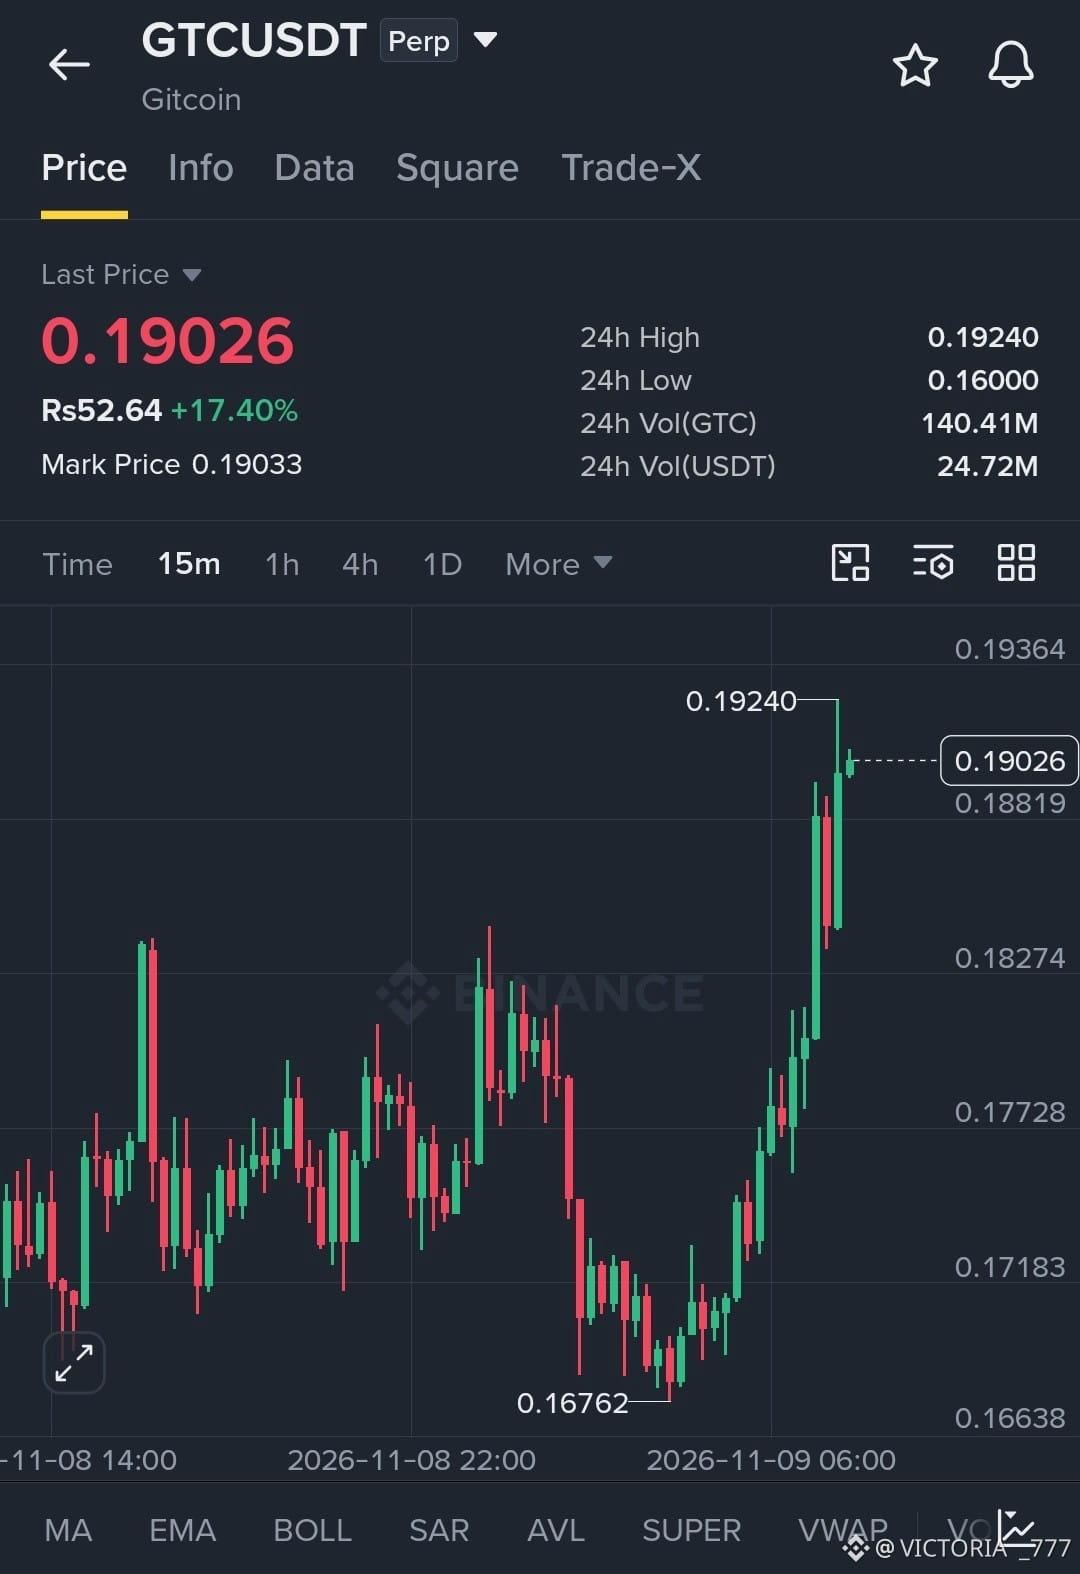
🚀 $GTC
{future}(GTCUSDT)
USDT IS ON FIRE! 🔥
💥 Price: 0.19026 USDT
📈 24H Change: +17.40%
🇵🇰 PKR Value: Rs 52.64
🔝 24H High: 0.19240
🔻 24H Low: 0.16000
📊 GTC Volume: 140.41M
💰 USDT Volume: 24.72M
🎯 Mark Price: 0.19033
🔥 Bulls are taking control! GTC has surged from 0.16762 and is approaching its 24H high. Momentum is heating up! Can the bulls break 0.19240 and fly even higher? 🚀
WATCH THE BREAKOUT! 👀
🚀 $GTC
USDT IS ON FIRE! 🔥
💥 Price: 0.19026 USDT
📈 24H Change: +17.40%
🇵🇰 PKR Value: Rs 52.64
🔝 24H High: 0.19240
🔻 24H Low: 0.16000
📊 GTC Volume: 140.41M
💰 USDT Volume: 24.72M
🎯 Mark Price: 0.19033
🔥 Bulls are taking control! GTC has surged from 0.16762 and is approaching its 24H high. Momentum is heating up! Can the bulls break 0.19240 and fly even higher? 🚀
WATCH THE BREAKOUT! 👀
USDT IS ON FIRE! 🔥
💥 Price: 0.19026 USDT
📈 24H Change: +17.40%
🇵🇰 PKR Value: Rs 52.64
🔝 24H High: 0.19240
🔻 24H Low: 0.16000
📊 GTC Volume: 140.41M
💰 USDT Volume: 24.72M
🎯 Mark Price: 0.19033
🔥 Bulls are taking control! GTC has surged from 0.16762 and is approaching its 24H high. Momentum is heating up! Can the bulls break 0.19240 and fly even higher? 🚀
WATCH THE BREAKOUT! 👀
2
249
·
--
Bullish
🚀 **ALTCOINS ARE EXPLODING! 🔥 TWO BIG MOVERS ON BINANCE!**
⚡ **
{future}(HOTUSDT)
(Holo)**
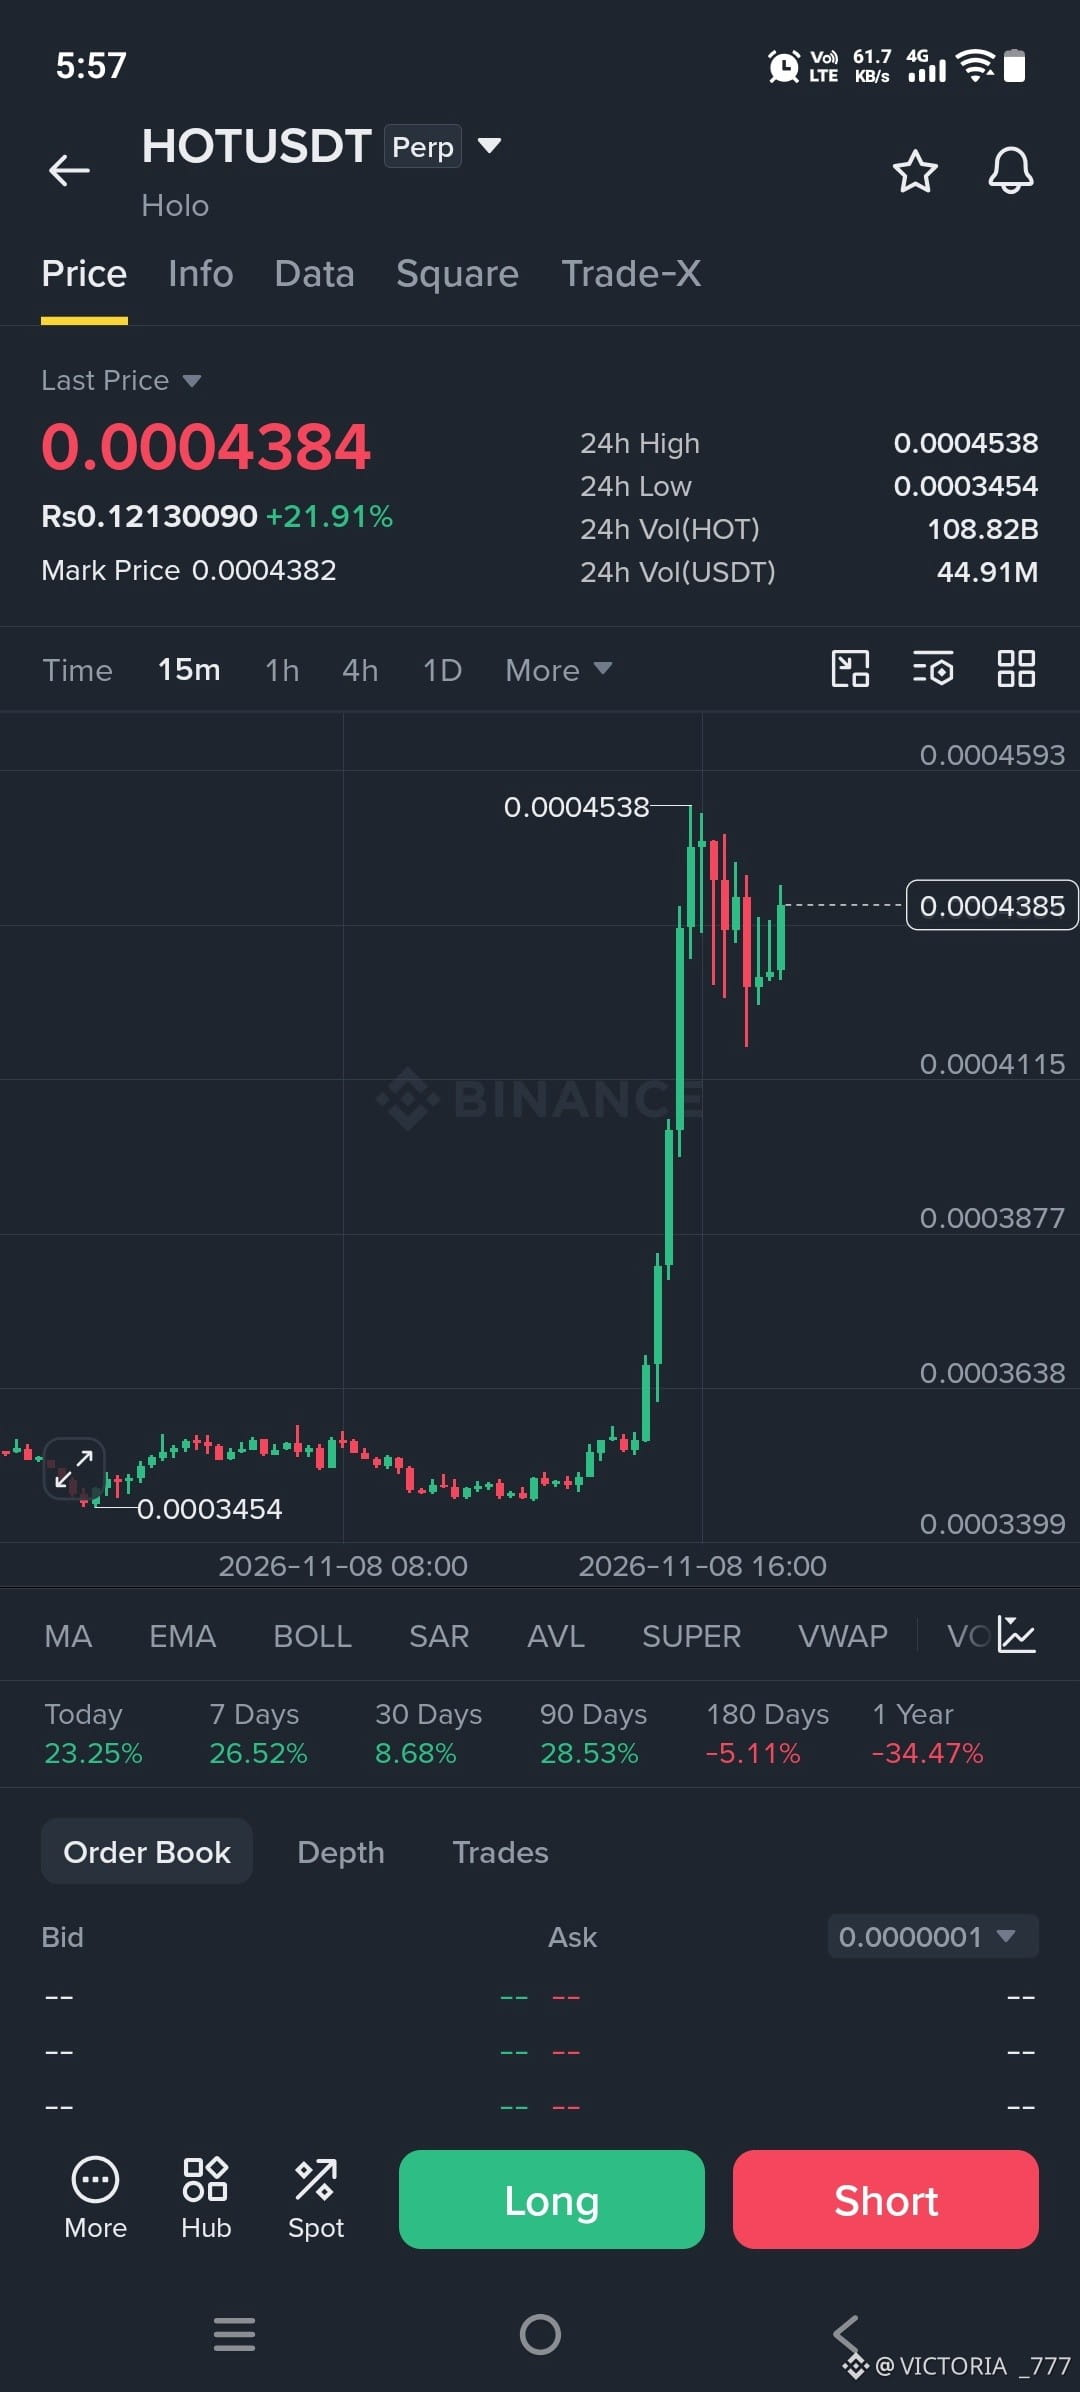
💰 Price: $0.0004384 (+21.91%)
📈 24H High: $0.0004538
📉 24H Low: $0.0003454
🔥 24H Volume: 108.82B HOT | $44.91M USDT
🚀 7D Performance: +26.52%
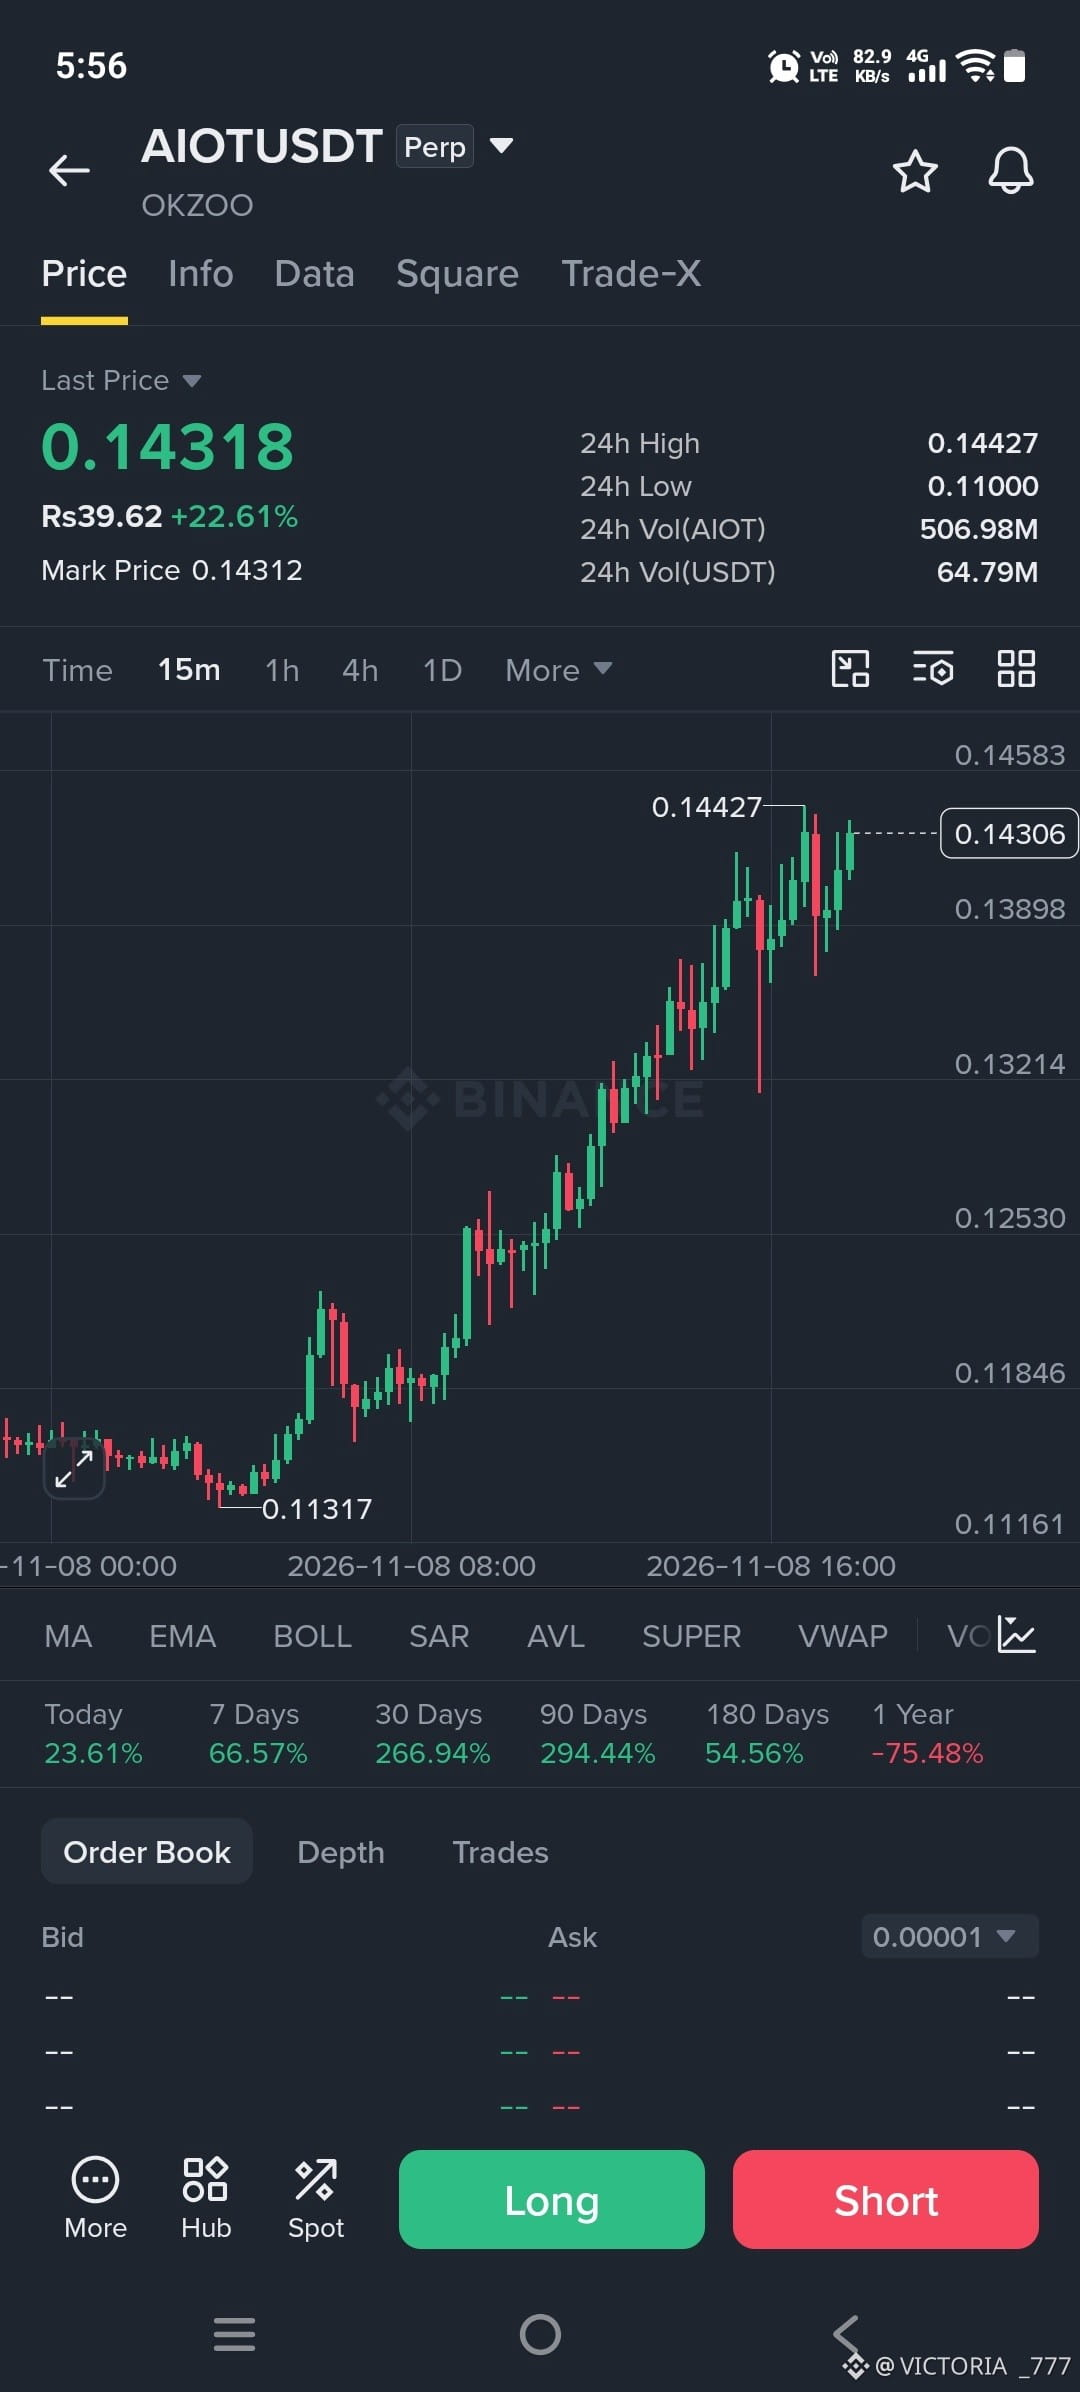
⚡ **$AIOT (OKZOO)**
💰 Price: $0.14318 (+22.61%)
📈 24H High: $0.14427
📉 24H Low: $0.11000
🔥 24H Volume: 506.98M AIOT | $64.79M USDT
🚀 7D Performance: +66.57%
💥 30D Performance: +266.94%
📊 **15M CHARTS:** Both showing powerful bullish momentum! Buyers are making moves, and volatility is heating up!
👀 Will $HOT break its resistance? Can push to new highs?
🔥 **KEEP YOUR EYES ON THESE TWO!**
$AIOT
{future}(AIOTUSDT)
#Crypto #Binance #Altcoins #CryptoBullRun #TradingSignals
Which style should I create next?
More aggressive & viral 🔥 Professional trader style 📊
🚀 **ALTCOINS ARE EXPLODING! 🔥 TWO BIG MOVERS ON BINANCE!**
⚡ **
(Holo)**
💰 Price: $0.0004384 (+21.91%)
📈 24H High: $0.0004538
📉 24H Low: $0.0003454
🔥 24H Volume: 108.82B HOT | $44.91M USDT
🚀 7D Performance: +26.52%
⚡ **$AIOT (OKZOO)**
💰 Price: $0.14318 (+22.61%)
📈 24H High: $0.14427
📉 24H Low: $0.11000
🔥 24H Volume: 506.98M AIOT | $64.79M USDT
🚀 7D Performance: +66.57%
💥 30D Performance: +266.94%
📊 **15M CHARTS:** Both showing powerful bullish momentum! Buyers are making moves, and volatility is heating up!
👀 Will $HOT break its resistance? Can push to new highs?
🔥 **KEEP YOUR EYES ON THESE TWO!**
$AIOT
#Crypto #Binance #Altcoins #CryptoBullRun #TradingSignals
Which style should I create next?
More aggressive & viral 🔥 Professional trader style 📊
⚡ **
(Holo)**
💰 Price: $0.0004384 (+21.91%)
📈 24H High: $0.0004538
📉 24H Low: $0.0003454
🔥 24H Volume: 108.82B HOT | $44.91M USDT
🚀 7D Performance: +26.52%
⚡ **$AIOT (OKZOO)**
💰 Price: $0.14318 (+22.61%)
📈 24H High: $0.14427
📉 24H Low: $0.11000
🔥 24H Volume: 506.98M AIOT | $64.79M USDT
🚀 7D Performance: +66.57%
💥 30D Performance: +266.94%
📊 **15M CHARTS:** Both showing powerful bullish momentum! Buyers are making moves, and volatility is heating up!
👀 Will $HOT break its resistance? Can push to new highs?
🔥 **KEEP YOUR EYES ON THESE TWO!**
$AIOT
#Crypto #Binance #Altcoins #CryptoBullRun #TradingSignals
Which style should I create next?
More aggressive & viral 🔥 Professional trader style 📊
3
467
🚀 **KOMA & AIN ARE EXPLODING! ALTCOIN BULLS ARE BACK IN ACTION!**
The market is heating up as KOMA and AIN deliver impressive moves, attracting serious trading attention!
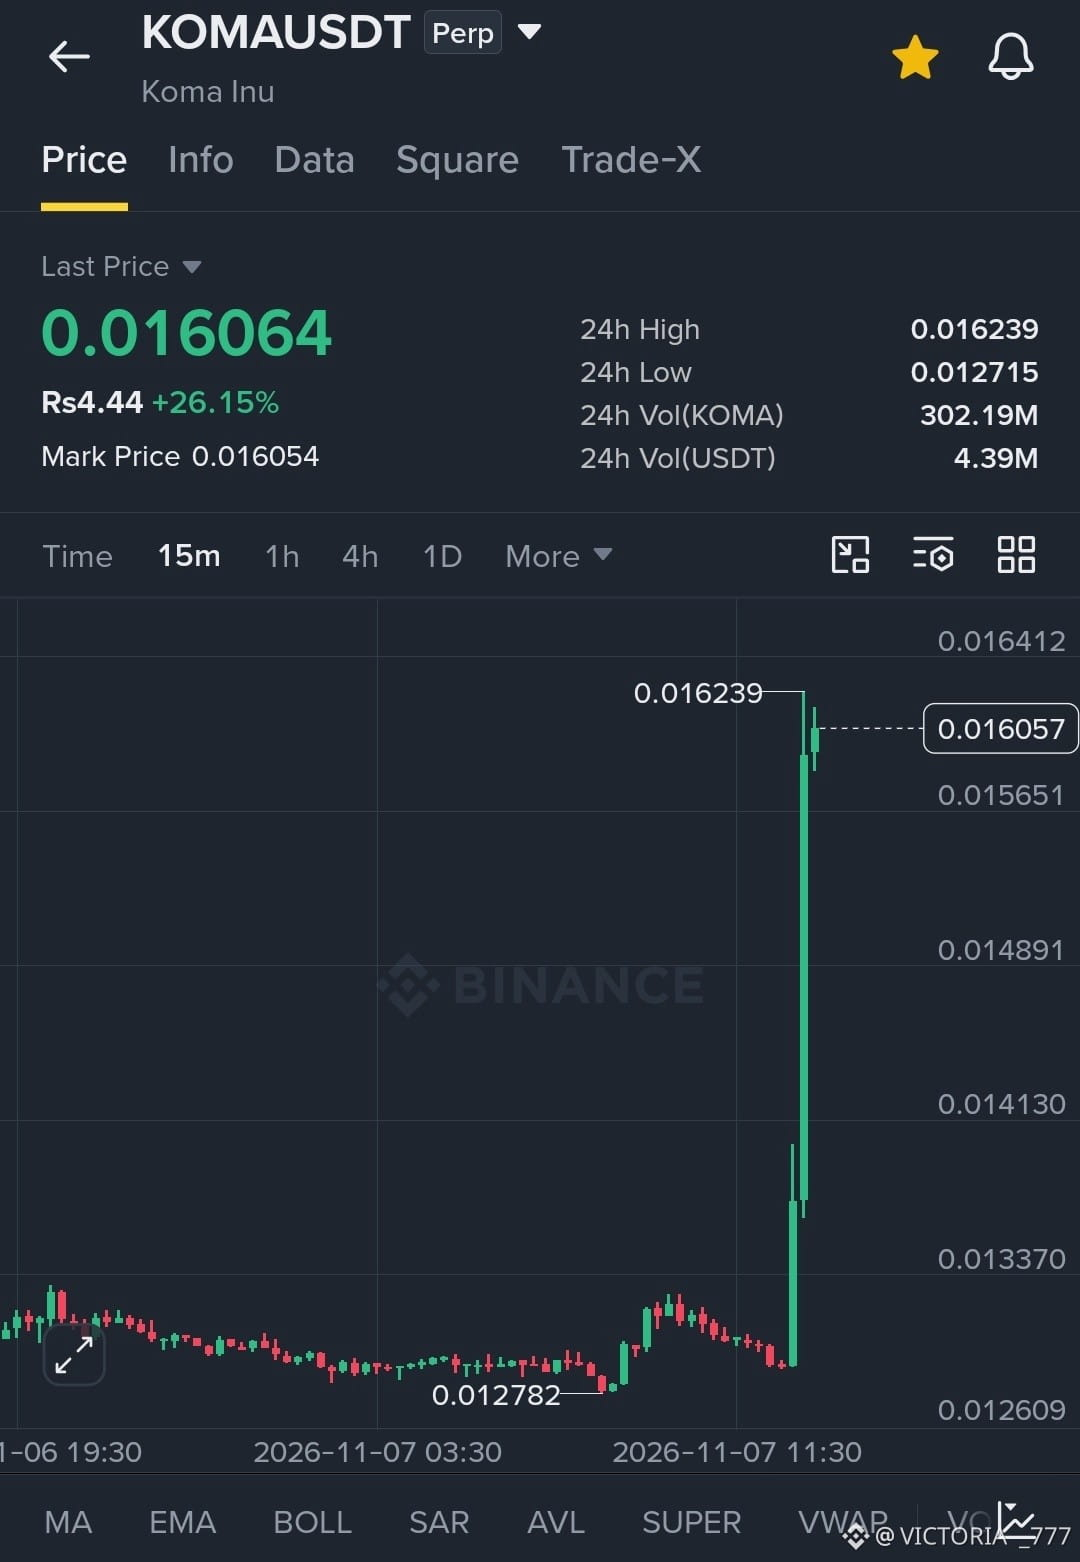
🔥 **KOMAUSDT:** Trading at **$0.016064, up 26.15%**. Price surged from the 24H low of $0.012715 toward $0.016239, with massive 24H volume of **302.19M KOMA ($4.39M USDT)**. The order book also shows buyers dominating with **65.01% bids versus 34.99% asks**.
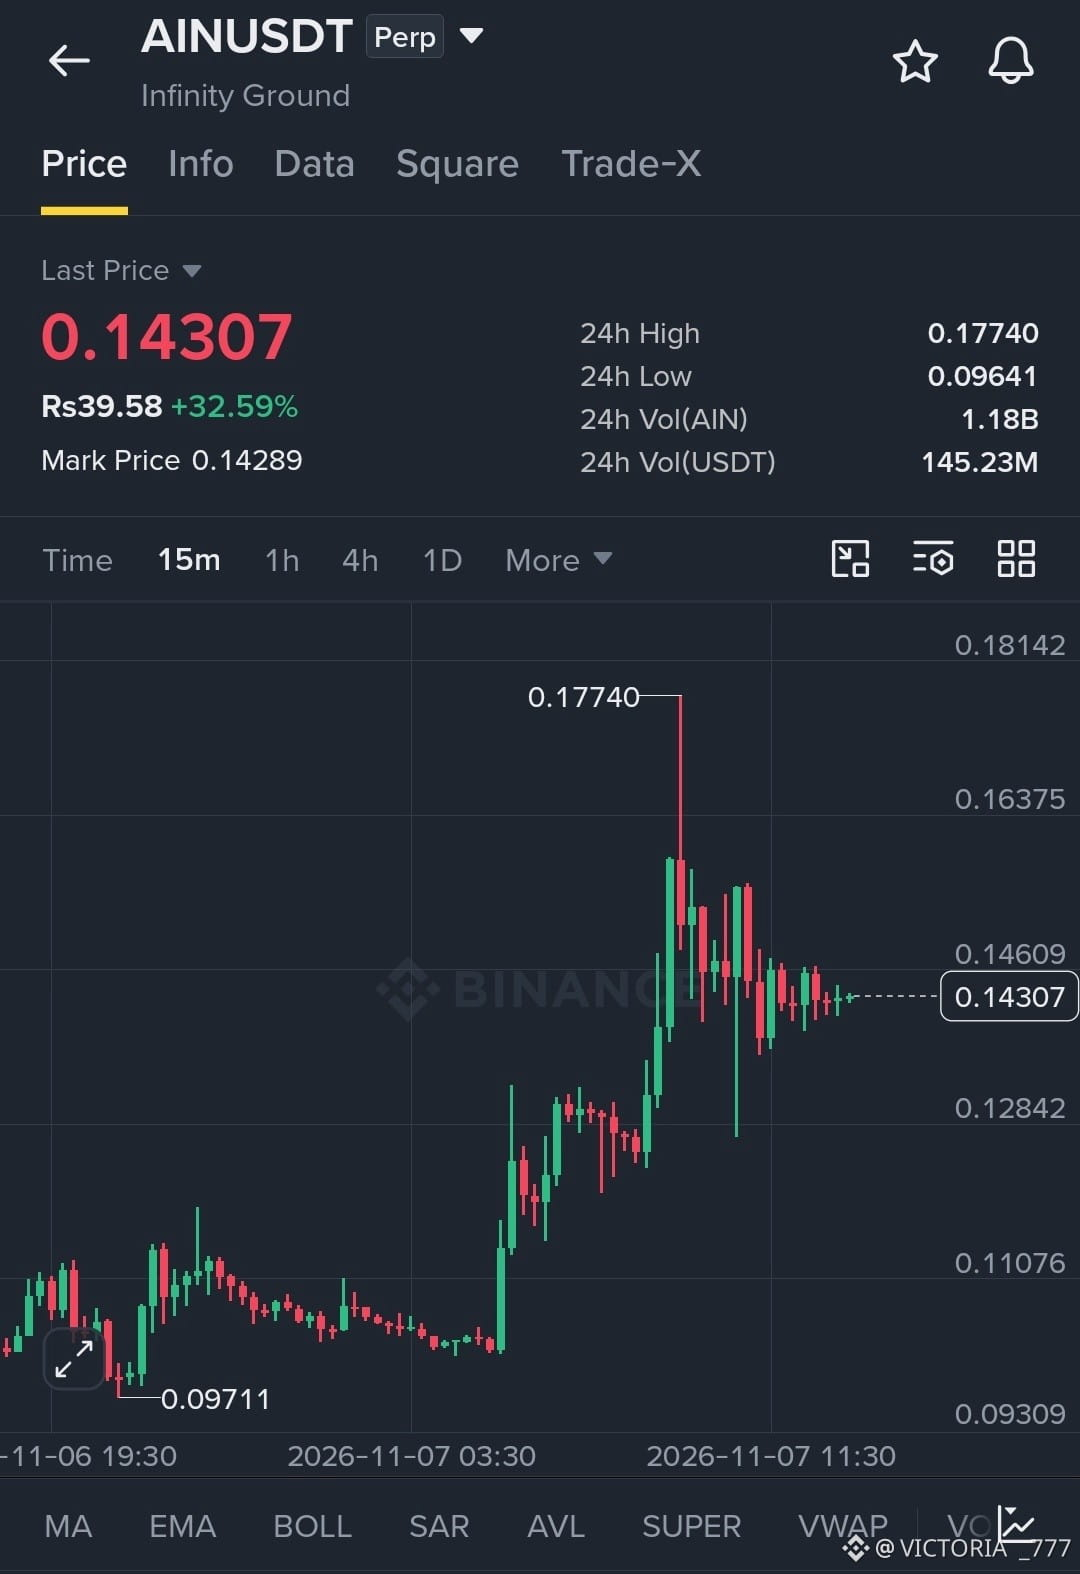
⚡ **AINUSDT:** Trading at **$0.14307, up 32.59%**. AIN climbed from $0.09641 to a 24H high of $0.17740, recording an impressive **1.18B AIN in volume ($145.23M USDT)**. After the sharp rally, price is consolidating around $0.143.
Both charts show explosive volatility and strong market activity. Can buyers push for another leg higher, or will profit-taking take control?
**Keep your eyes on these two movers! The next move could be decisive.** 🔥
$KOMA
{future}(KOMAUSDT)
$AIN
{future}(AINUSDT)
🚀 **KOMA & AIN ARE EXPLODING! ALTCOIN BULLS ARE BACK IN ACTION!**
The market is heating up as KOMA and AIN deliver impressive moves, attracting serious trading attention!
🔥 **KOMAUSDT:** Trading at **$0.016064, up 26.15%**. Price surged from the 24H low of $0.012715 toward $0.016239, with massive 24H volume of **302.19M KOMA ($4.39M USDT)**. The order book also shows buyers dominating with **65.01% bids versus 34.99% asks**.
⚡ **AINUSDT:** Trading at **$0.14307, up 32.59%**. AIN climbed from $0.09641 to a 24H high of $0.17740, recording an impressive **1.18B AIN in volume ($145.23M USDT)**. After the sharp rally, price is consolidating around $0.143.
Both charts show explosive volatility and strong market activity. Can buyers push for another leg higher, or will profit-taking take control?
**Keep your eyes on these two movers! The next move could be decisive.** 🔥
$KOMA
$AIN
The market is heating up as KOMA and AIN deliver impressive moves, attracting serious trading attention!
🔥 **KOMAUSDT:** Trading at **$0.016064, up 26.15%**. Price surged from the 24H low of $0.012715 toward $0.016239, with massive 24H volume of **302.19M KOMA ($4.39M USDT)**. The order book also shows buyers dominating with **65.01% bids versus 34.99% asks**.
⚡ **AINUSDT:** Trading at **$0.14307, up 32.59%**. AIN climbed from $0.09641 to a 24H high of $0.17740, recording an impressive **1.18B AIN in volume ($145.23M USDT)**. After the sharp rally, price is consolidating around $0.143.
Both charts show explosive volatility and strong market activity. Can buyers push for another leg higher, or will profit-taking take control?
**Keep your eyes on these two movers! The next move could be decisive.** 🔥
$KOMA
$AIN
2
333
·
--
Bullish
🚀 **$ESPORTS
{future}(ESPORTSUSDT)
(ESPORTSUSDT) EXPLODES 27% — BULLS ARE TAKING CONTROL! CAN $0.01268 BREAK NEXT?**
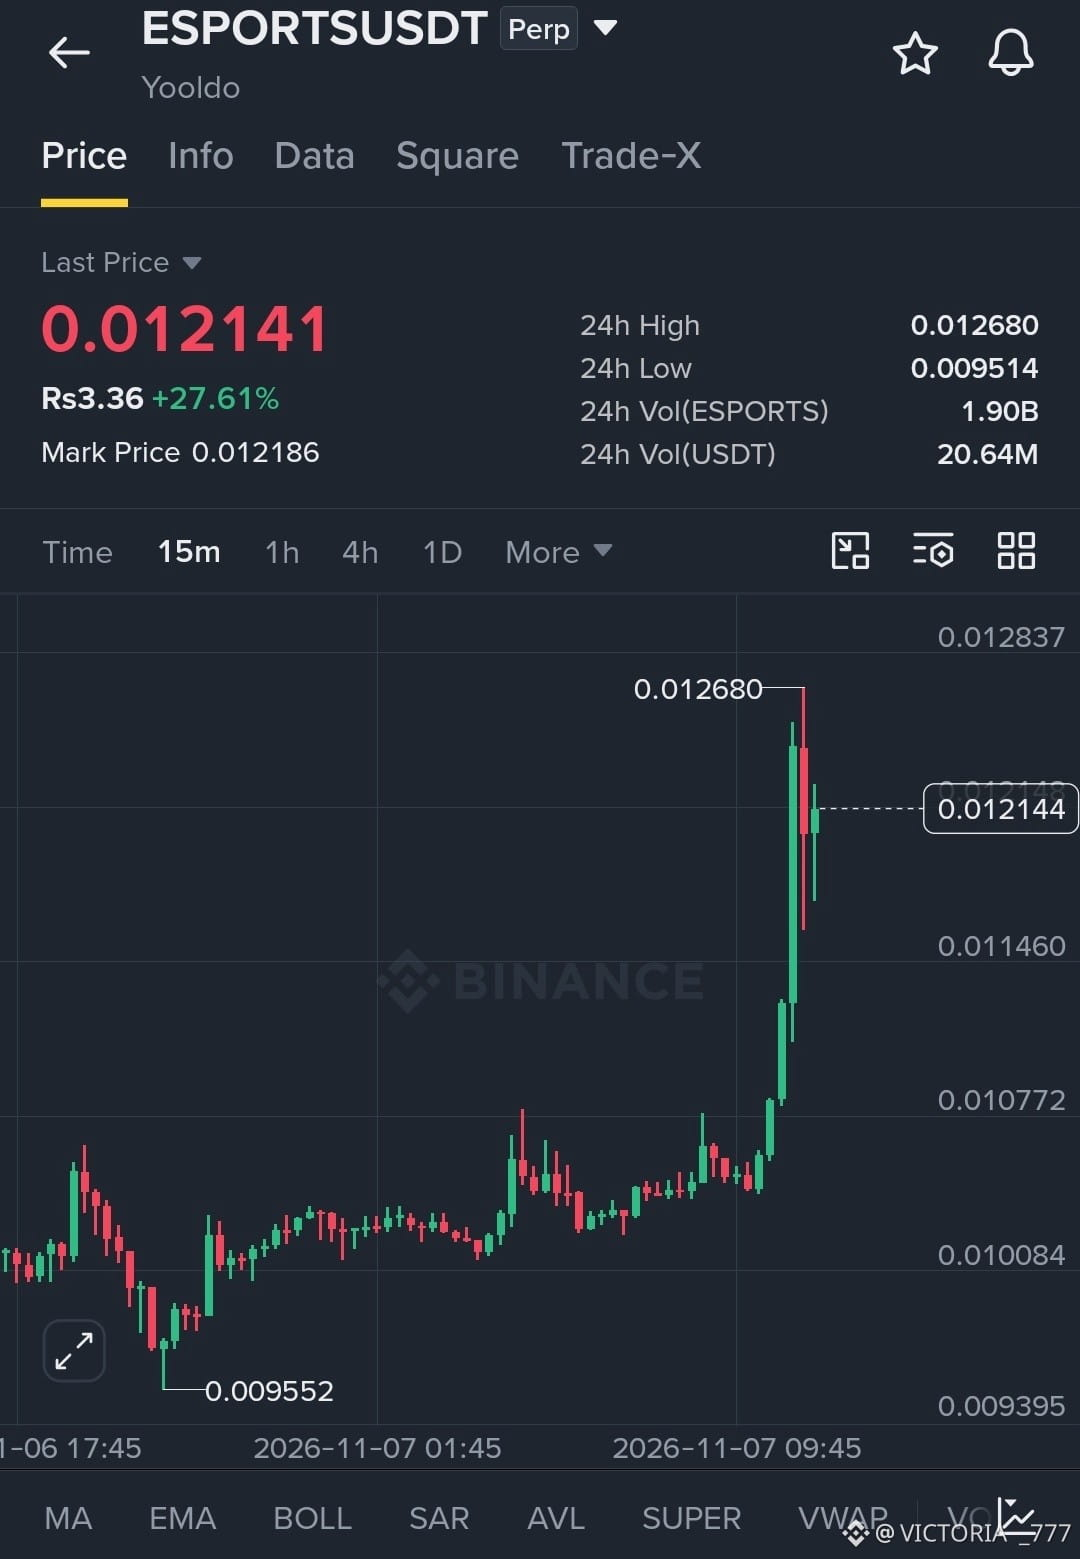
ESPORTS is making a powerful move, grabbing traders' attention after an impressive 27.61% surge! The token is currently trading around **$0.012141 (Rs 3.36)**, showing strong bullish momentum on the 15-minute chart.
The biggest highlight is the explosive rally from the $0.009552 chart low toward the $0.012680 high. Buyers stepped in aggressively, pushing price through previous trading levels and creating a sharp upward move.
📊 **Key Market Details:**
- Current Price: $0.012141
- 24H Change: +27.61%
- 24H High: $0.012680
- 24H Low: $0.009514
- Mark Price: $0.012186
- 24H Volume: 1.90B ESPORTS
- USDT Volume: $20.64M
- Timeframe: 15 Minutes
🔥 **What's Next?**
After touching $0.012680, price experienced a pullback but is attempting to stabilize around $0.01214. The $0.01200 area is an important near-term level to watch, while $0.01268 remains the immediate resistance.
A breakout above $0.01268 could open the door for another bullish move. However, losing nearby support may trigger further consolidation.
**Bulls have made their statement. Now the big question is: can ESPORTS deliver another breakout?** 👀
🚀 **$ESPORTS
(ESPORTSUSDT) EXPLODES 27% — BULLS ARE TAKING CONTROL! CAN $0.01268 BREAK NEXT?**
ESPORTS is making a powerful move, grabbing traders' attention after an impressive 27.61% surge! The token is currently trading around **$0.012141 (Rs 3.36)**, showing strong bullish momentum on the 15-minute chart.
The biggest highlight is the explosive rally from the $0.009552 chart low toward the $0.012680 high. Buyers stepped in aggressively, pushing price through previous trading levels and creating a sharp upward move.
📊 **Key Market Details:**
- Current Price: $0.012141
- 24H Change: +27.61%
- 24H High: $0.012680
- 24H Low: $0.009514
- Mark Price: $0.012186
- 24H Volume: 1.90B ESPORTS
- USDT Volume: $20.64M
- Timeframe: 15 Minutes
🔥 **What's Next?**
After touching $0.012680, price experienced a pullback but is attempting to stabilize around $0.01214. The $0.01200 area is an important near-term level to watch, while $0.01268 remains the immediate resistance.
A breakout above $0.01268 could open the door for another bullish move. However, losing nearby support may trigger further consolidation.
**Bulls have made their statement. Now the big question is: can ESPORTS deliver another breakout?** 👀
(ESPORTSUSDT) EXPLODES 27% — BULLS ARE TAKING CONTROL! CAN $0.01268 BREAK NEXT?**
ESPORTS is making a powerful move, grabbing traders' attention after an impressive 27.61% surge! The token is currently trading around **$0.012141 (Rs 3.36)**, showing strong bullish momentum on the 15-minute chart.
The biggest highlight is the explosive rally from the $0.009552 chart low toward the $0.012680 high. Buyers stepped in aggressively, pushing price through previous trading levels and creating a sharp upward move.
📊 **Key Market Details:**
- Current Price: $0.012141
- 24H Change: +27.61%
- 24H High: $0.012680
- 24H Low: $0.009514
- Mark Price: $0.012186
- 24H Volume: 1.90B ESPORTS
- USDT Volume: $20.64M
- Timeframe: 15 Minutes
🔥 **What's Next?**
After touching $0.012680, price experienced a pullback but is attempting to stabilize around $0.01214. The $0.01200 area is an important near-term level to watch, while $0.01268 remains the immediate resistance.
A breakout above $0.01268 could open the door for another bullish move. However, losing nearby support may trigger further consolidation.
**Bulls have made their statement. Now the big question is: can ESPORTS deliver another breakout?** 👀
2
336
·
--
Bullish
🚀 HARMONY ($ONE
{future}(ONEUSDT)
) EXPLODES 60% — CAN BULLS PUSH TOWARD $0.0020 NEXT?
Harmony (ONE) is showing massive bullish momentum, trading at $0.0018028, up 60.59% in 24 hours! 🔥
📊 Key Market Details:
* Current Price: $0.0018028
* 24H High: $0.0019850
* 24H Low: $0.0011212
* 24H Volume: 168.24B ONE
* Trading Volume: $281.80M USDT
* Timeframe: 15 Minutes
ONE surged from $0.0013337 to nearly $0.0019850 before facing profit-taking. Price is now pulling back toward $0.00180.
👀 Watch These Levels:
* Resistance: $0.0018743 – $0.0019850
* Support: $0.0017310
* Major Support: $0.0015877
A breakout above $0.0019850 could open the door to another bullish move, while losing $0.0017310 may invite deeper consolidation.
ONE is making noise! Can buyers reclaim $0.00190 and challenge $0.0020? 🚀
$LYN
{future}(LYNUSDT)
$IDOL
{future}(IDOLUSDT)
🚀 HARMONY ($ONE
) EXPLODES 60% — CAN BULLS PUSH TOWARD $0.0020 NEXT?
Harmony (ONE) is showing massive bullish momentum, trading at $0.0018028, up 60.59% in 24 hours! 🔥
📊 Key Market Details:
* Current Price: $0.0018028
* 24H High: $0.0019850
* 24H Low: $0.0011212
* 24H Volume: 168.24B ONE
* Trading Volume: $281.80M USDT
* Timeframe: 15 Minutes
ONE surged from $0.0013337 to nearly $0.0019850 before facing profit-taking. Price is now pulling back toward $0.00180.
👀 Watch These Levels:
* Resistance: $0.0018743 – $0.0019850
* Support: $0.0017310
* Major Support: $0.0015877
A breakout above $0.0019850 could open the door to another bullish move, while losing $0.0017310 may invite deeper consolidation.
ONE is making noise! Can buyers reclaim $0.00190 and challenge $0.0020? 🚀
$LYN
$IDOL
) EXPLODES 60% — CAN BULLS PUSH TOWARD $0.0020 NEXT?
Harmony (ONE) is showing massive bullish momentum, trading at $0.0018028, up 60.59% in 24 hours! 🔥
📊 Key Market Details:
* Current Price: $0.0018028
* 24H High: $0.0019850
* 24H Low: $0.0011212
* 24H Volume: 168.24B ONE
* Trading Volume: $281.80M USDT
* Timeframe: 15 Minutes
ONE surged from $0.0013337 to nearly $0.0019850 before facing profit-taking. Price is now pulling back toward $0.00180.
👀 Watch These Levels:
* Resistance: $0.0018743 – $0.0019850
* Support: $0.0017310
* Major Support: $0.0015877
A breakout above $0.0019850 could open the door to another bullish move, while losing $0.0017310 may invite deeper consolidation.
ONE is making noise! Can buyers reclaim $0.00190 and challenge $0.0020? 🚀
$LYN
$IDOL
$ONE
79%
$LYN
13%
$IDOL
8%
24 votes • Voting closed
3
1.3k
·
--
Bullish
🚀 **ALTCOIN PERPETUALS ARE EXPLODING! GREEN NUMBERS EVERYWHERE! 🔥**
The futures market is showing some serious momentum, with several altcoins posting impressive gains!
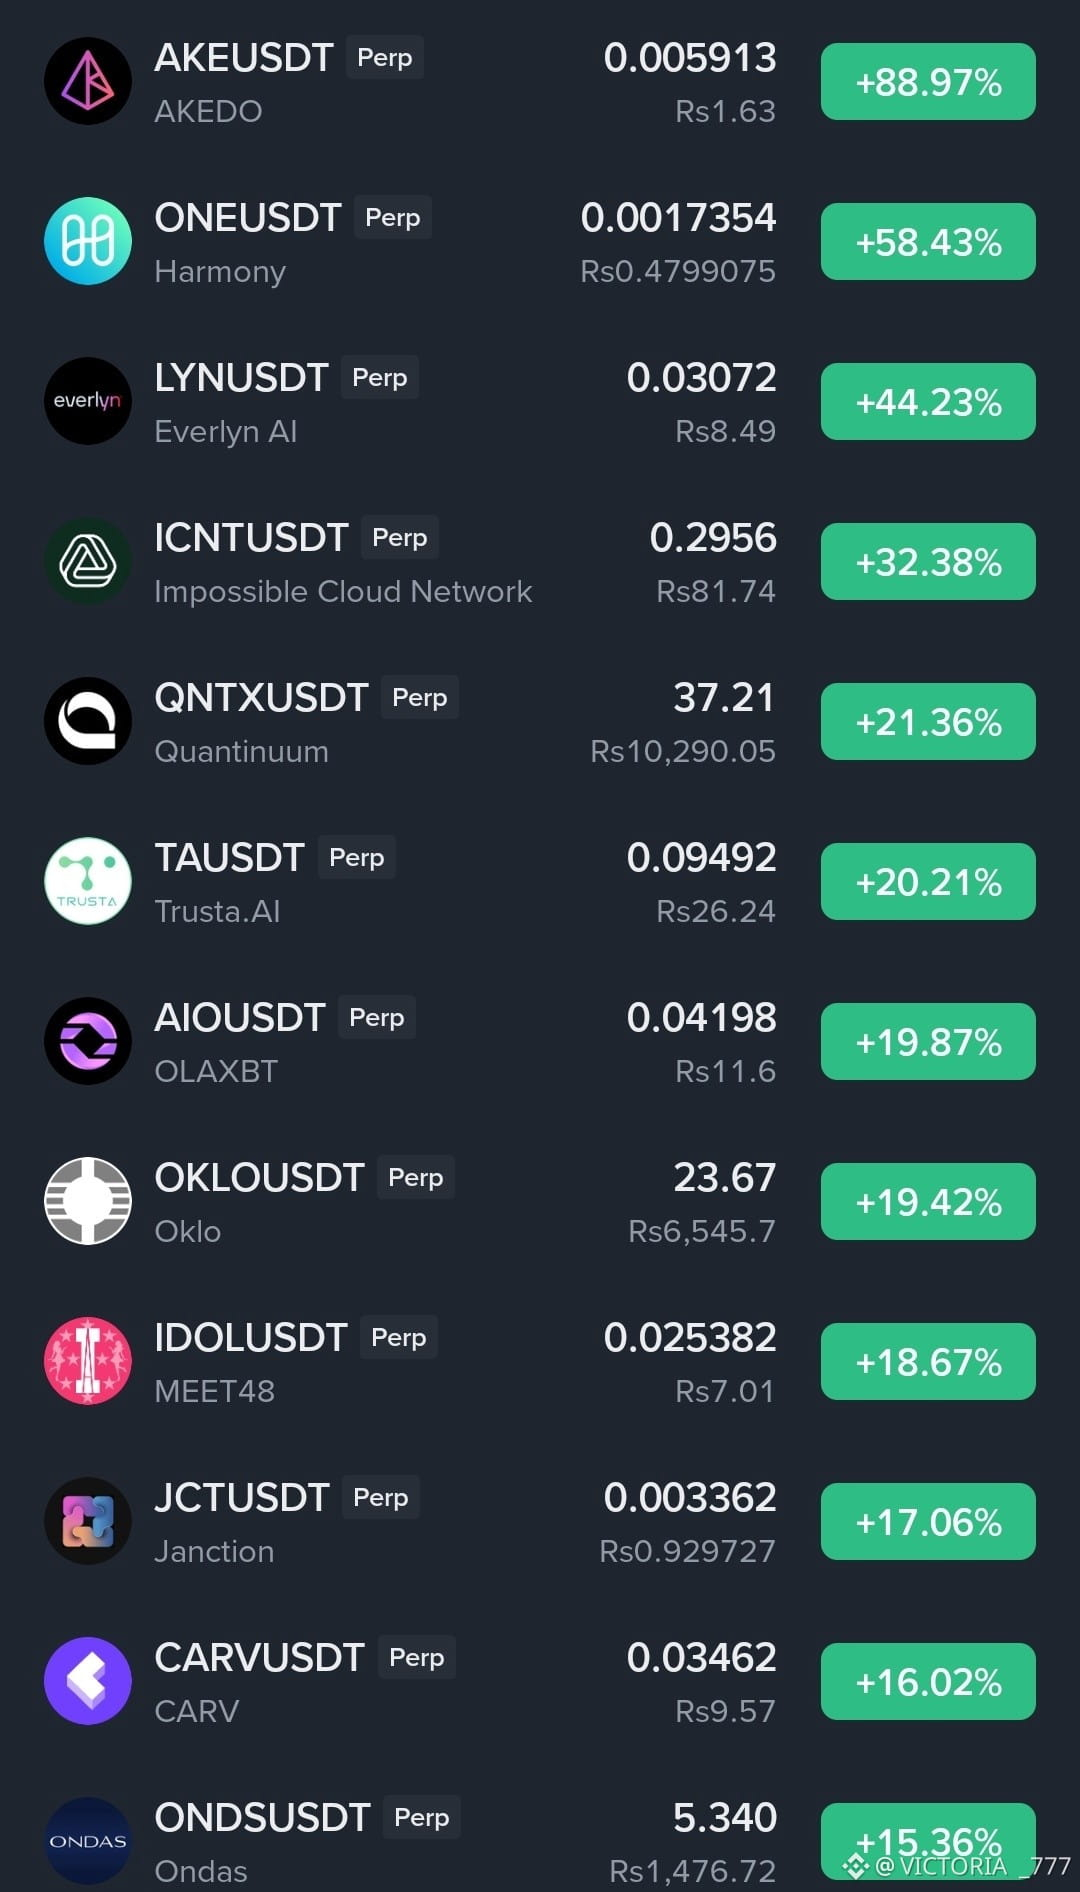
🔥 **Top Gainers:**
🥇 AKEUSDT: +88.97% — $0.005913
🥈 ONEUSDT: +58.43% — $0.0017354
🥉 LYNUSDT: +44.23% — $0.03072
🚀 ICNTUSDT: +32.38% — $0.2956
⚡ QNTXUSDT: +21.36% — $37.21
📈 TAUSDT: +20.21% — $0.09492
🔥 AIOUSDT: +19.87% — $0.04198
💥 OKLOUSDT: +19.42% — $23.67
🚀 IDOLUSDT: +18.67% — $0.025382
📊 JCTUSDT: +17.06% — $0.003362
⚡ CARVUSDT: +16.02% — $0.03462
🔥 ONDSUSDT: +15.36% — $5.340
AKEUSDT is stealing the spotlight with an incredible **88.97% gain**, while ONE and LYN are also delivering massive moves.
Altcoin volatility is heating up! But remember, sharp rallies can also bring sharp corrections. Don't chase green candles blindly.
**Which one are you watching for the next big move?
🚀 **ALTCOIN PERPETUALS ARE EXPLODING! GREEN NUMBERS EVERYWHERE! 🔥**
The futures market is showing some serious momentum, with several altcoins posting impressive gains!
🔥 **Top Gainers:**
🥇 AKEUSDT: +88.97% — $0.005913
🥈 ONEUSDT: +58.43% — $0.0017354
🥉 LYNUSDT: +44.23% — $0.03072
🚀 ICNTUSDT: +32.38% — $0.2956
⚡ QNTXUSDT: +21.36% — $37.21
📈 TAUSDT: +20.21% — $0.09492
🔥 AIOUSDT: +19.87% — $0.04198
💥 OKLOUSDT: +19.42% — $23.67
🚀 IDOLUSDT: +18.67% — $0.025382
📊 JCTUSDT: +17.06% — $0.003362
⚡ CARVUSDT: +16.02% — $0.03462
🔥 ONDSUSDT: +15.36% — $5.340
AKEUSDT is stealing the spotlight with an incredible **88.97% gain**, while ONE and LYN are also delivering massive moves.
Altcoin volatility is heating up! But remember, sharp rallies can also bring sharp corrections. Don't chase green candles blindly.
**Which one are you watching for the next big move?
The futures market is showing some serious momentum, with several altcoins posting impressive gains!
🔥 **Top Gainers:**
🥇 AKEUSDT: +88.97% — $0.005913
🥈 ONEUSDT: +58.43% — $0.0017354
🥉 LYNUSDT: +44.23% — $0.03072
🚀 ICNTUSDT: +32.38% — $0.2956
⚡ QNTXUSDT: +21.36% — $37.21
📈 TAUSDT: +20.21% — $0.09492
🔥 AIOUSDT: +19.87% — $0.04198
💥 OKLOUSDT: +19.42% — $23.67
🚀 IDOLUSDT: +18.67% — $0.025382
📊 JCTUSDT: +17.06% — $0.003362
⚡ CARVUSDT: +16.02% — $0.03462
🔥 ONDSUSDT: +15.36% — $5.340
AKEUSDT is stealing the spotlight with an incredible **88.97% gain**, while ONE and LYN are also delivering massive moves.
Altcoin volatility is heating up! But remember, sharp rallies can also bring sharp corrections. Don't chase green candles blindly.
**Which one are you watching for the next big move?
2
1.1k
·
--
Bullish
🚀 **$AKE
{future}(AKEUSDT)
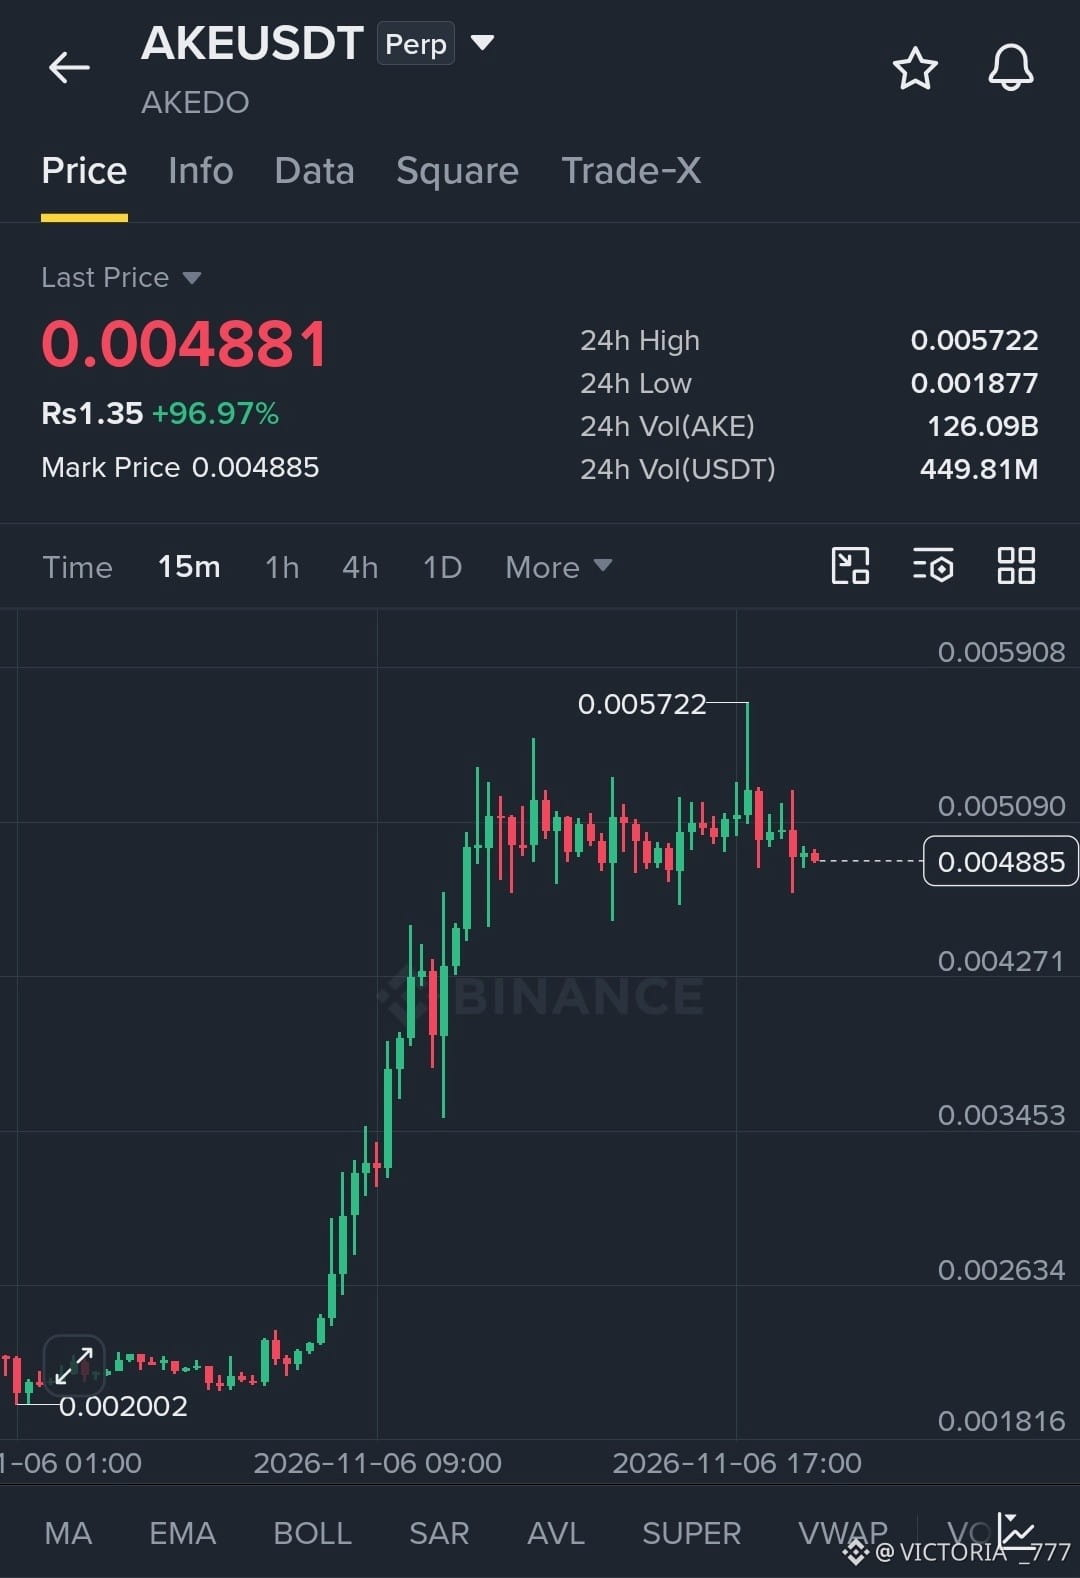
DO (AKE) IS EXPLODING! +96.97% IN 24 HOURS!**
AKEDO is making a massive move! 🔥
Currently trading at **$0.004881**, AKE has surged nearly 97% in 24 hours, climbing from a low of **$0.001877** to a high of **$0.005722**.
Trading volume is heating up with **126.09B AKE** and **449.81M USDT** in 24-hour volume.
On the 15-minute chart, buyers have pushed price aggressively upward, followed by consolidation around $0.00488.
**Key levels to watch:**
- Resistance: $0.005090 – $0.005722
- Current price: $0.004881
- Support: $0.004271
Can bulls break $0.00509 and challenge the daily high, or will sellers take control?
**AKE is one to watch!** 🚀
🚀 **$AKE
DO (AKE) IS EXPLODING! +96.97% IN 24 HOURS!**
AKEDO is making a massive move! 🔥
Currently trading at **$0.004881**, AKE has surged nearly 97% in 24 hours, climbing from a low of **$0.001877** to a high of **$0.005722**.
Trading volume is heating up with **126.09B AKE** and **449.81M USDT** in 24-hour volume.
On the 15-minute chart, buyers have pushed price aggressively upward, followed by consolidation around $0.00488.
**Key levels to watch:**
- Resistance: $0.005090 – $0.005722
- Current price: $0.004881
- Support: $0.004271
Can bulls break $0.00509 and challenge the daily high, or will sellers take control?
**AKE is one to watch!** 🚀
DO (AKE) IS EXPLODING! +96.97% IN 24 HOURS!**
AKEDO is making a massive move! 🔥
Currently trading at **$0.004881**, AKE has surged nearly 97% in 24 hours, climbing from a low of **$0.001877** to a high of **$0.005722**.
Trading volume is heating up with **126.09B AKE** and **449.81M USDT** in 24-hour volume.
On the 15-minute chart, buyers have pushed price aggressively upward, followed by consolidation around $0.00488.
**Key levels to watch:**
- Resistance: $0.005090 – $0.005722
- Current price: $0.004881
- Support: $0.004271
Can bulls break $0.00509 and challenge the daily high, or will sellers take control?
**AKE is one to watch!** 🚀
3
353
·
--
Bullish
🚀 **$JCT
{future}(JCTUSDT)
USDT IS EXPLODING!**
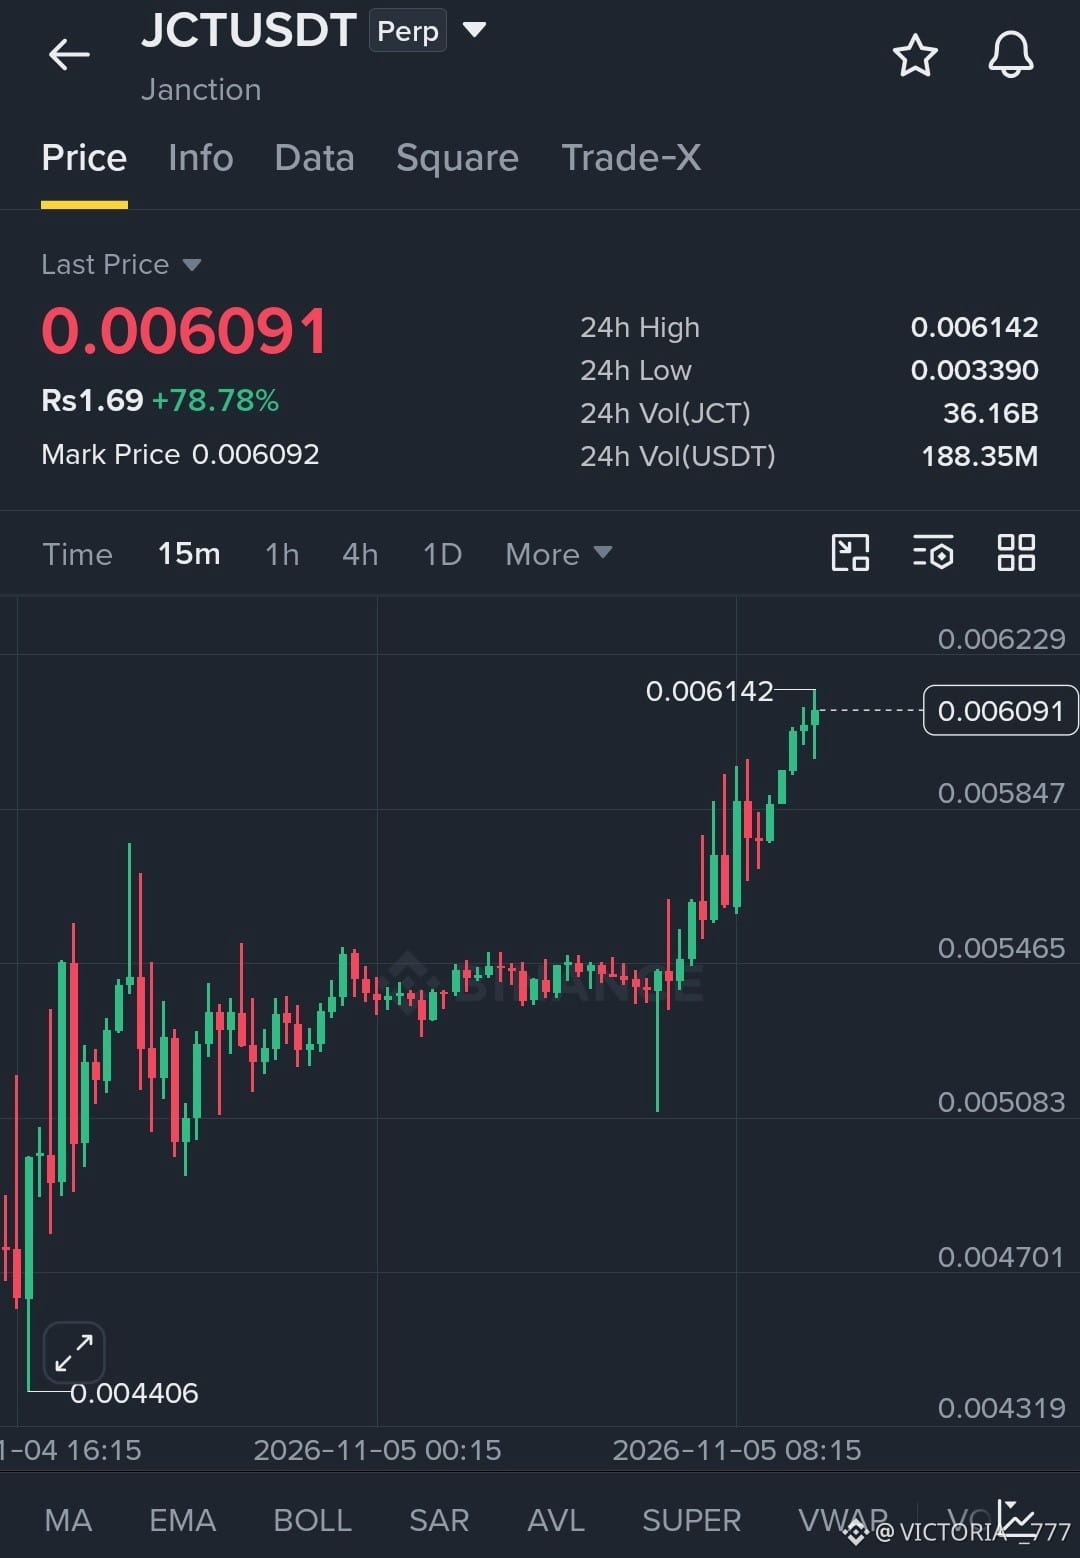
$JCT is making a serious move! 🔥 Trading at **$0.006091**, up a massive **78.78% in 24 hours**.
The 15M chart shows a strong breakout after consolidation, with bullish momentum pushing price toward the 24H high of **$0.006142**.
📊 **Market Snapshot:**
- Current Price: $0.006091
- Mark Price: $0.006092
- 24H Change: +78.78%
- 24H High: $0.006142
- 24H Low: $0.003390
- 24H Volume: 36.16B JCT
- USDT Volume: $188.35M
- PKR Price: Rs 1.69
**The momentum is heating up!** Can $JCT break above $0.006142 and push even higher? Eyes on the next move! ⚡
Let's go and trade smart! 🚀
🚀 **$JCT
USDT IS EXPLODING!**
$JCT is making a serious move! 🔥 Trading at **$0.006091**, up a massive **78.78% in 24 hours**.
The 15M chart shows a strong breakout after consolidation, with bullish momentum pushing price toward the 24H high of **$0.006142**.
📊 **Market Snapshot:**
- Current Price: $0.006091
- Mark Price: $0.006092
- 24H Change: +78.78%
- 24H High: $0.006142
- 24H Low: $0.003390
- 24H Volume: 36.16B JCT
- USDT Volume: $188.35M
- PKR Price: Rs 1.69
**The momentum is heating up!** Can $JCT break above $0.006142 and push even higher? Eyes on the next move! ⚡
Let's go and trade smart! 🚀
USDT IS EXPLODING!**
$JCT is making a serious move! 🔥 Trading at **$0.006091**, up a massive **78.78% in 24 hours**.
The 15M chart shows a strong breakout after consolidation, with bullish momentum pushing price toward the 24H high of **$0.006142**.
📊 **Market Snapshot:**
- Current Price: $0.006091
- Mark Price: $0.006092
- 24H Change: +78.78%
- 24H High: $0.006142
- 24H Low: $0.003390
- 24H Volume: 36.16B JCT
- USDT Volume: $188.35M
- PKR Price: Rs 1.69
**The momentum is heating up!** Can $JCT break above $0.006142 and push even higher? Eyes on the next move! ⚡
Let's go and trade smart! 🚀
2
107
·
--
Bullish
🚀 **FUTURES MARKET IS ON FIRE! GREEN EVERYWHERE!**
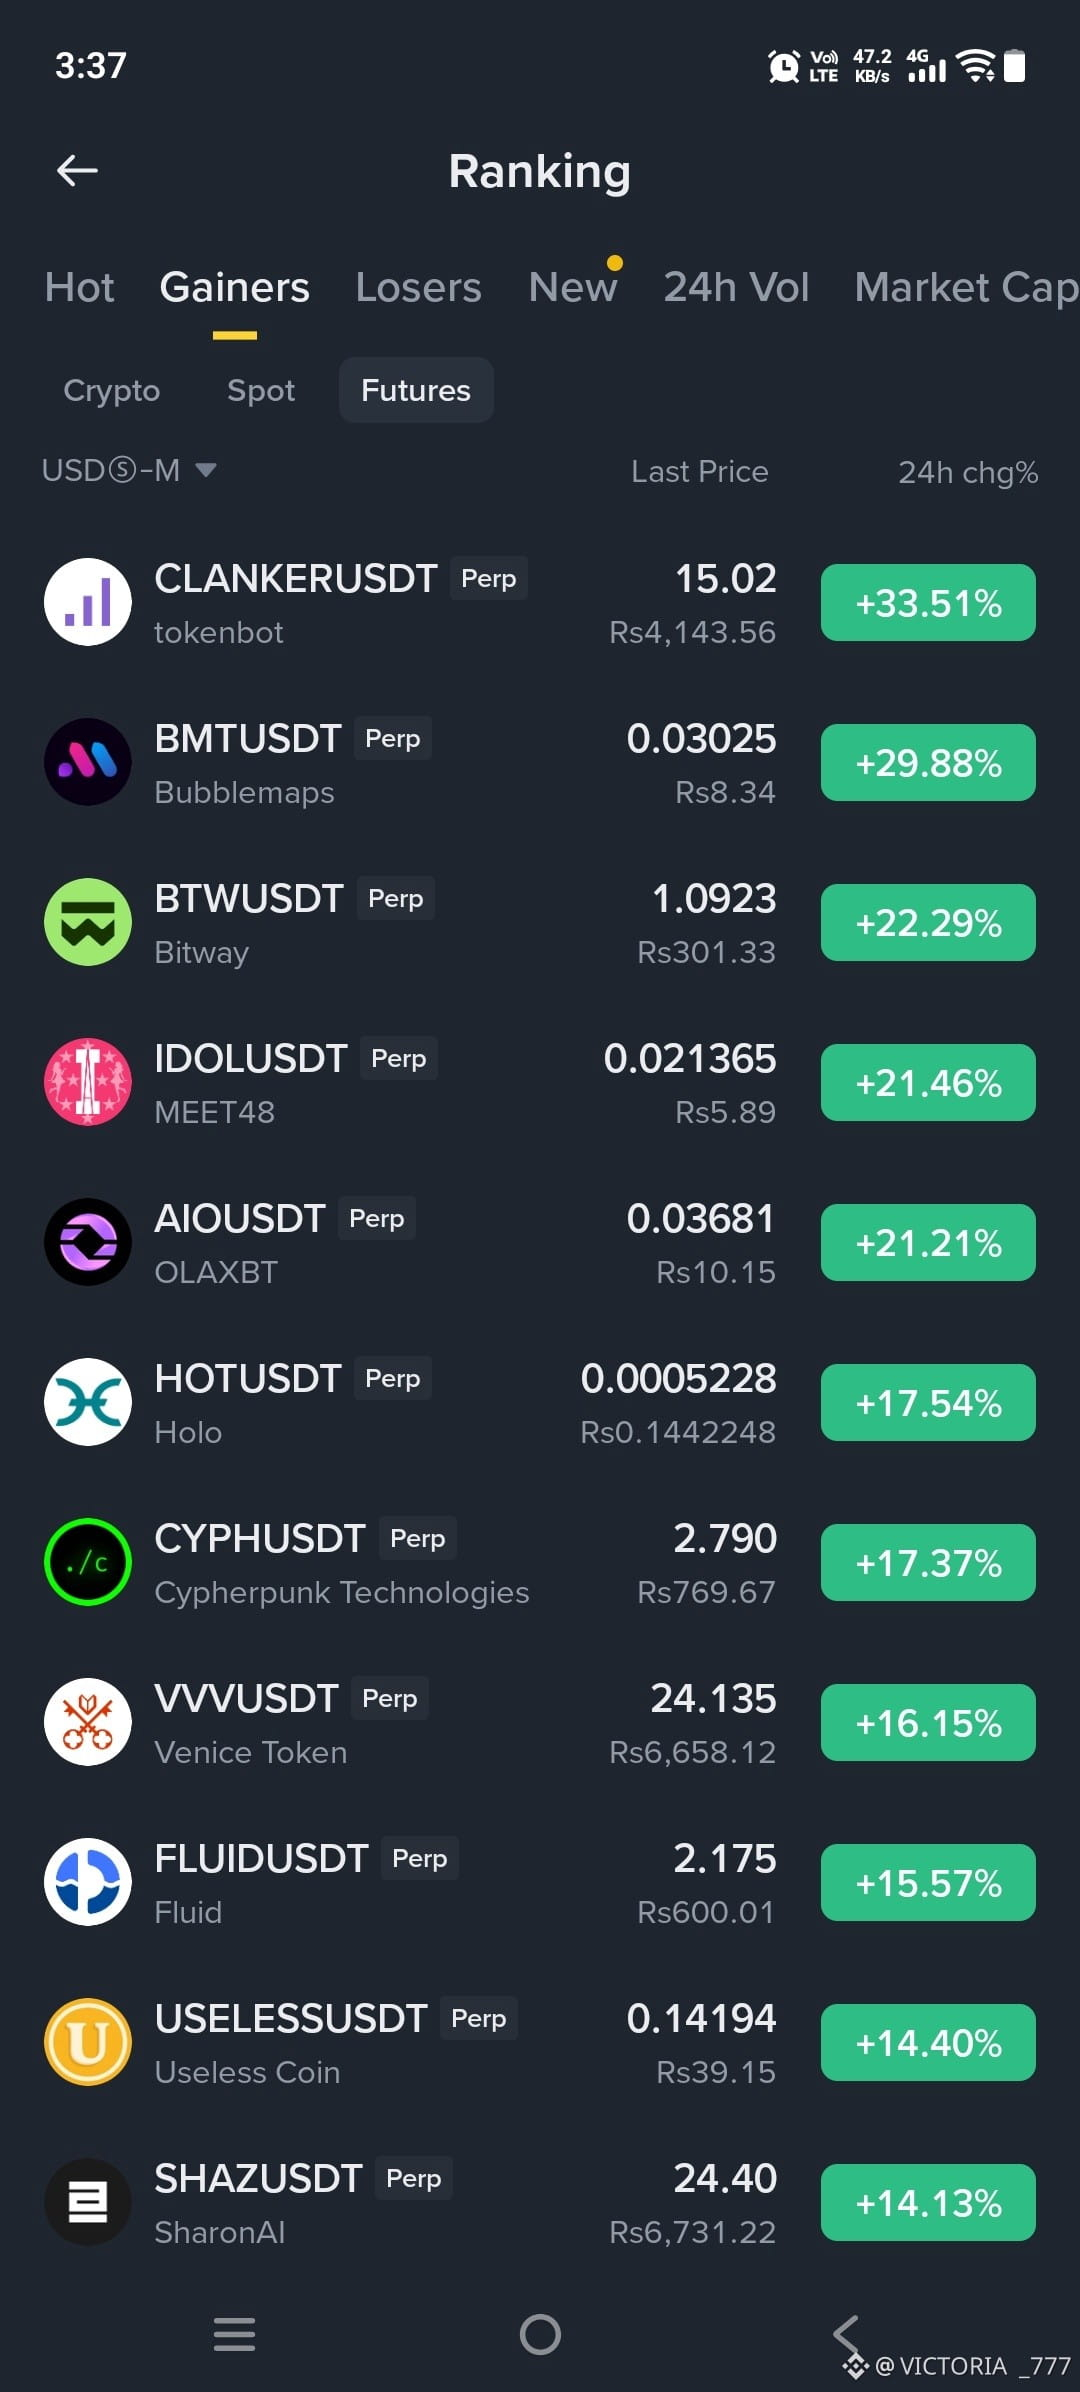
The Binance Futures Gainers leaderboard is showing some serious momentum! 🔥
Top 24H performers:
🥇 CLANKERUSDT: +33.51% | $15.02 (Rs4,143.56)
🥈 BMTUSDT: +29.88% | $0.03025 (Rs8.34)
🥉 BTWUSDT: +22.29% | $1.0923 (Rs301.33)
🔥 IDOLUSDT: +21.46% | $0.021365 (Rs5.89)
⚡ AIOUSDT: +21.21% | $0.03681 (Rs10.15)
📈 HOTUSDT: +17.54% | $0.0005228 (Rs0.1442248)
🚀 CYPHUSDT: +17.37% | $2.790 (Rs769.67)
💥 VWUSDT: +16.15% | $24.135 (Rs6,658.12)
🌊 FLUIDUSDT: +15.57% | $2.175 (Rs600.01)
🔥 USELESSUSDT: +14.40% | $0.14194 (Rs39.15)
⚡ SHAZUSDT: +14.13% | $24.40 (Rs6,731.22)
**CLANKER is leading with an impressive 33.51% gain!**
Momentum is building, but remember: green candles can turn red quickly in futures. Manage risk, watch your entries, and never chase blindly.
Which coin is your next watchlist target? 👀
**Let's go and trade smart!**
🚀 **FUTURES MARKET IS ON FIRE! GREEN EVERYWHERE!**
The Binance Futures Gainers leaderboard is showing some serious momentum! 🔥
Top 24H performers:
🥇 CLANKERUSDT: +33.51% | $15.02 (Rs4,143.56)
🥈 BMTUSDT: +29.88% | $0.03025 (Rs8.34)
🥉 BTWUSDT: +22.29% | $1.0923 (Rs301.33)
🔥 IDOLUSDT: +21.46% | $0.021365 (Rs5.89)
⚡ AIOUSDT: +21.21% | $0.03681 (Rs10.15)
📈 HOTUSDT: +17.54% | $0.0005228 (Rs0.1442248)
🚀 CYPHUSDT: +17.37% | $2.790 (Rs769.67)
💥 VWUSDT: +16.15% | $24.135 (Rs6,658.12)
🌊 FLUIDUSDT: +15.57% | $2.175 (Rs600.01)
🔥 USELESSUSDT: +14.40% | $0.14194 (Rs39.15)
⚡ SHAZUSDT: +14.13% | $24.40 (Rs6,731.22)
**CLANKER is leading with an impressive 33.51% gain!**
Momentum is building, but remember: green candles can turn red quickly in futures. Manage risk, watch your entries, and never chase blindly.
Which coin is your next watchlist target? 👀
**Let's go and trade smart!**
The Binance Futures Gainers leaderboard is showing some serious momentum! 🔥
Top 24H performers:
🥇 CLANKERUSDT: +33.51% | $15.02 (Rs4,143.56)
🥈 BMTUSDT: +29.88% | $0.03025 (Rs8.34)
🥉 BTWUSDT: +22.29% | $1.0923 (Rs301.33)
🔥 IDOLUSDT: +21.46% | $0.021365 (Rs5.89)
⚡ AIOUSDT: +21.21% | $0.03681 (Rs10.15)
📈 HOTUSDT: +17.54% | $0.0005228 (Rs0.1442248)
🚀 CYPHUSDT: +17.37% | $2.790 (Rs769.67)
💥 VWUSDT: +16.15% | $24.135 (Rs6,658.12)
🌊 FLUIDUSDT: +15.57% | $2.175 (Rs600.01)
🔥 USELESSUSDT: +14.40% | $0.14194 (Rs39.15)
⚡ SHAZUSDT: +14.13% | $24.40 (Rs6,731.22)
**CLANKER is leading with an impressive 33.51% gain!**
Momentum is building, but remember: green candles can turn red quickly in futures. Manage risk, watch your entries, and never chase blindly.
Which coin is your next watchlist target? 👀
**Let's go and trade smart!**
3
136
·
--
Bullish
$JCT / USDT Perp | Janction: Bulls Are Taking Control! 🚀
This is the kind of price action traders should keep on their radar!
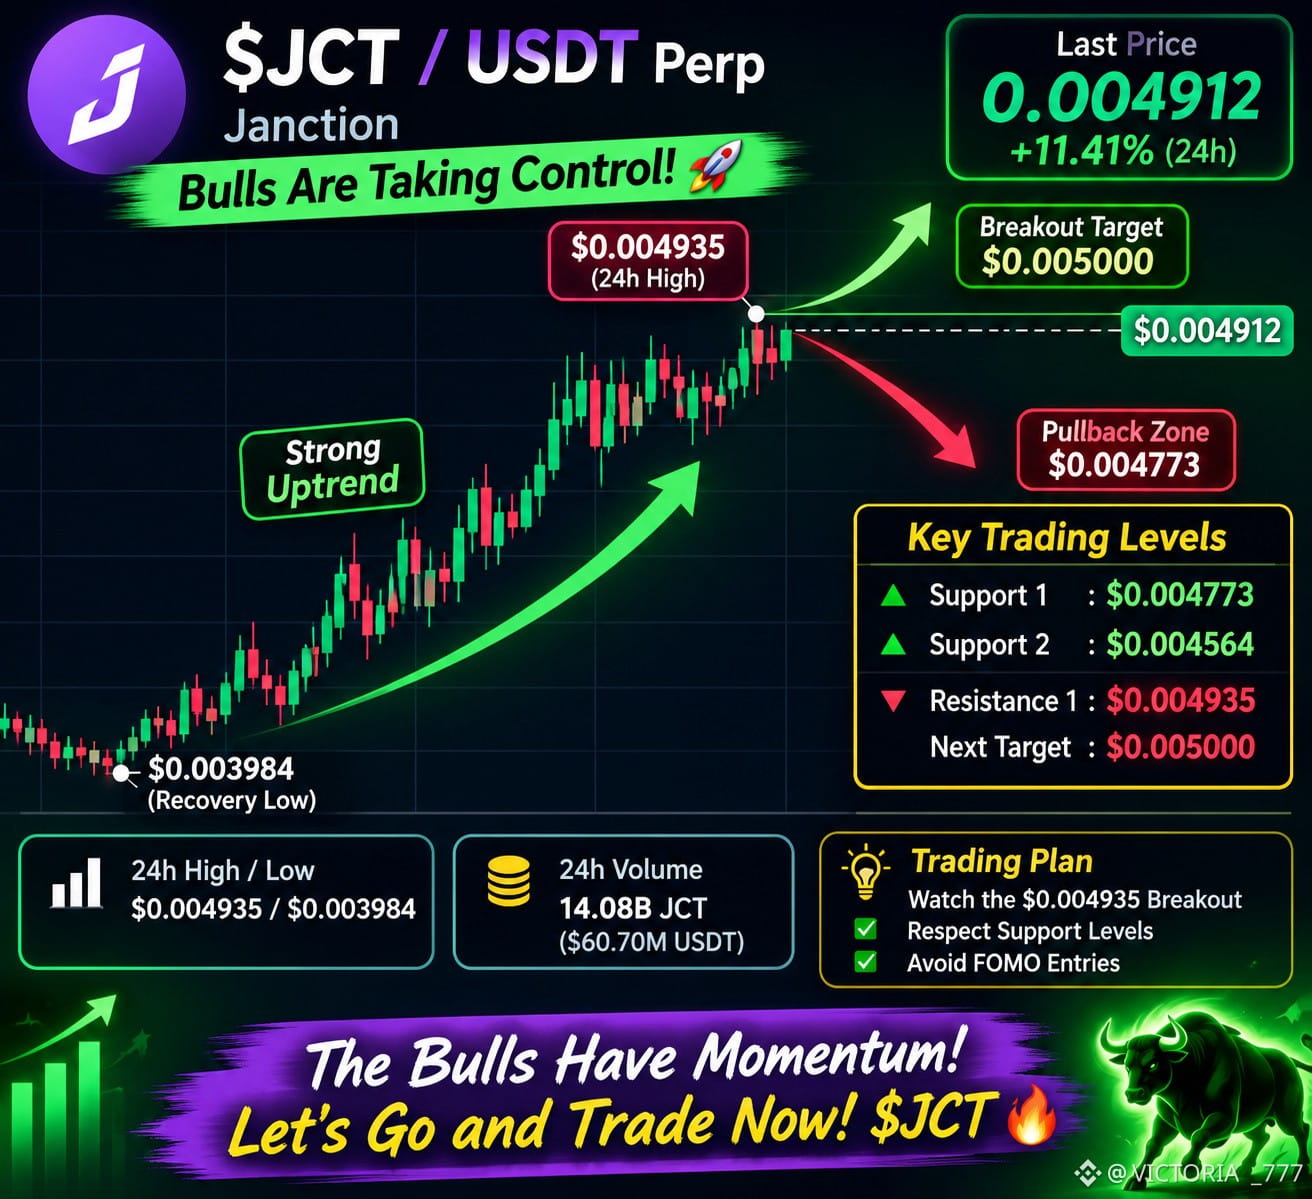
$JCT is showing impressive bullish strength, with buyers maintaining control throughout the 15-minute chart. The price is currently trading at $0.004912, up +11.41% in the last 24 hours.
But the interesting part is not just the percentage gain. It's how price is moving.
JCT started its recovery near $0.003984 and gradually built strong upward momentum. Buyers pushed through multiple resistance zones, creating a clear sequence of higher highs and higher lows.
Now price is approaching the important $0.004935 resistance, which also marks the current 24-hour high.
Key Trading Levels:
🟢 Support 1: $0.004773
🟢 Support 2: $0.004564
🔴 Resistance 1: $0.004935
🔴 Next psychological target: $0.005000
The 24-hour trading volume is impressive, reaching 14.08B JCT, equivalent to $60.70M in USDT.
A confirmed breakout above $0.004935 could open the door toward the $0.005000 psychological level and potentially higher.
However, rejection at resistance could trigger a healthy pullback toward nearby support.
My focus is simple: watch the breakout, respect the support levels, and never chase a pump without confirmation.
The bulls have momentum. Now the question is whether they can turn resistance into support.
Let's go and trade now! $JCT 🔥
$JCT / USDT Perp | Janction: Bulls Are Taking Control! 🚀
This is the kind of price action traders should keep on their radar!
$JCT is showing impressive bullish strength, with buyers maintaining control throughout the 15-minute chart. The price is currently trading at $0.004912, up +11.41% in the last 24 hours.
But the interesting part is not just the percentage gain. It's how price is moving.
JCT started its recovery near $0.003984 and gradually built strong upward momentum. Buyers pushed through multiple resistance zones, creating a clear sequence of higher highs and higher lows.
Now price is approaching the important $0.004935 resistance, which also marks the current 24-hour high.
Key Trading Levels:
🟢 Support 1: $0.004773
🟢 Support 2: $0.004564
🔴 Resistance 1: $0.004935
🔴 Next psychological target: $0.005000
The 24-hour trading volume is impressive, reaching 14.08B JCT, equivalent to $60.70M in USDT.
A confirmed breakout above $0.004935 could open the door toward the $0.005000 psychological level and potentially higher.
However, rejection at resistance could trigger a healthy pullback toward nearby support.
My focus is simple: watch the breakout, respect the support levels, and never chase a pump without confirmation.
The bulls have momentum. Now the question is whether they can turn resistance into support.
Let's go and trade now! $JCT 🔥
This is the kind of price action traders should keep on their radar!
$JCT is showing impressive bullish strength, with buyers maintaining control throughout the 15-minute chart. The price is currently trading at $0.004912, up +11.41% in the last 24 hours.
But the interesting part is not just the percentage gain. It's how price is moving.
JCT started its recovery near $0.003984 and gradually built strong upward momentum. Buyers pushed through multiple resistance zones, creating a clear sequence of higher highs and higher lows.
Now price is approaching the important $0.004935 resistance, which also marks the current 24-hour high.
Key Trading Levels:
🟢 Support 1: $0.004773
🟢 Support 2: $0.004564
🔴 Resistance 1: $0.004935
🔴 Next psychological target: $0.005000
The 24-hour trading volume is impressive, reaching 14.08B JCT, equivalent to $60.70M in USDT.
A confirmed breakout above $0.004935 could open the door toward the $0.005000 psychological level and potentially higher.
However, rejection at resistance could trigger a healthy pullback toward nearby support.
My focus is simple: watch the breakout, respect the support levels, and never chase a pump without confirmation.
The bulls have momentum. Now the question is whether they can turn resistance into support.
Let's go and trade now! $JCT 🔥
2
46
·
--
Bullish
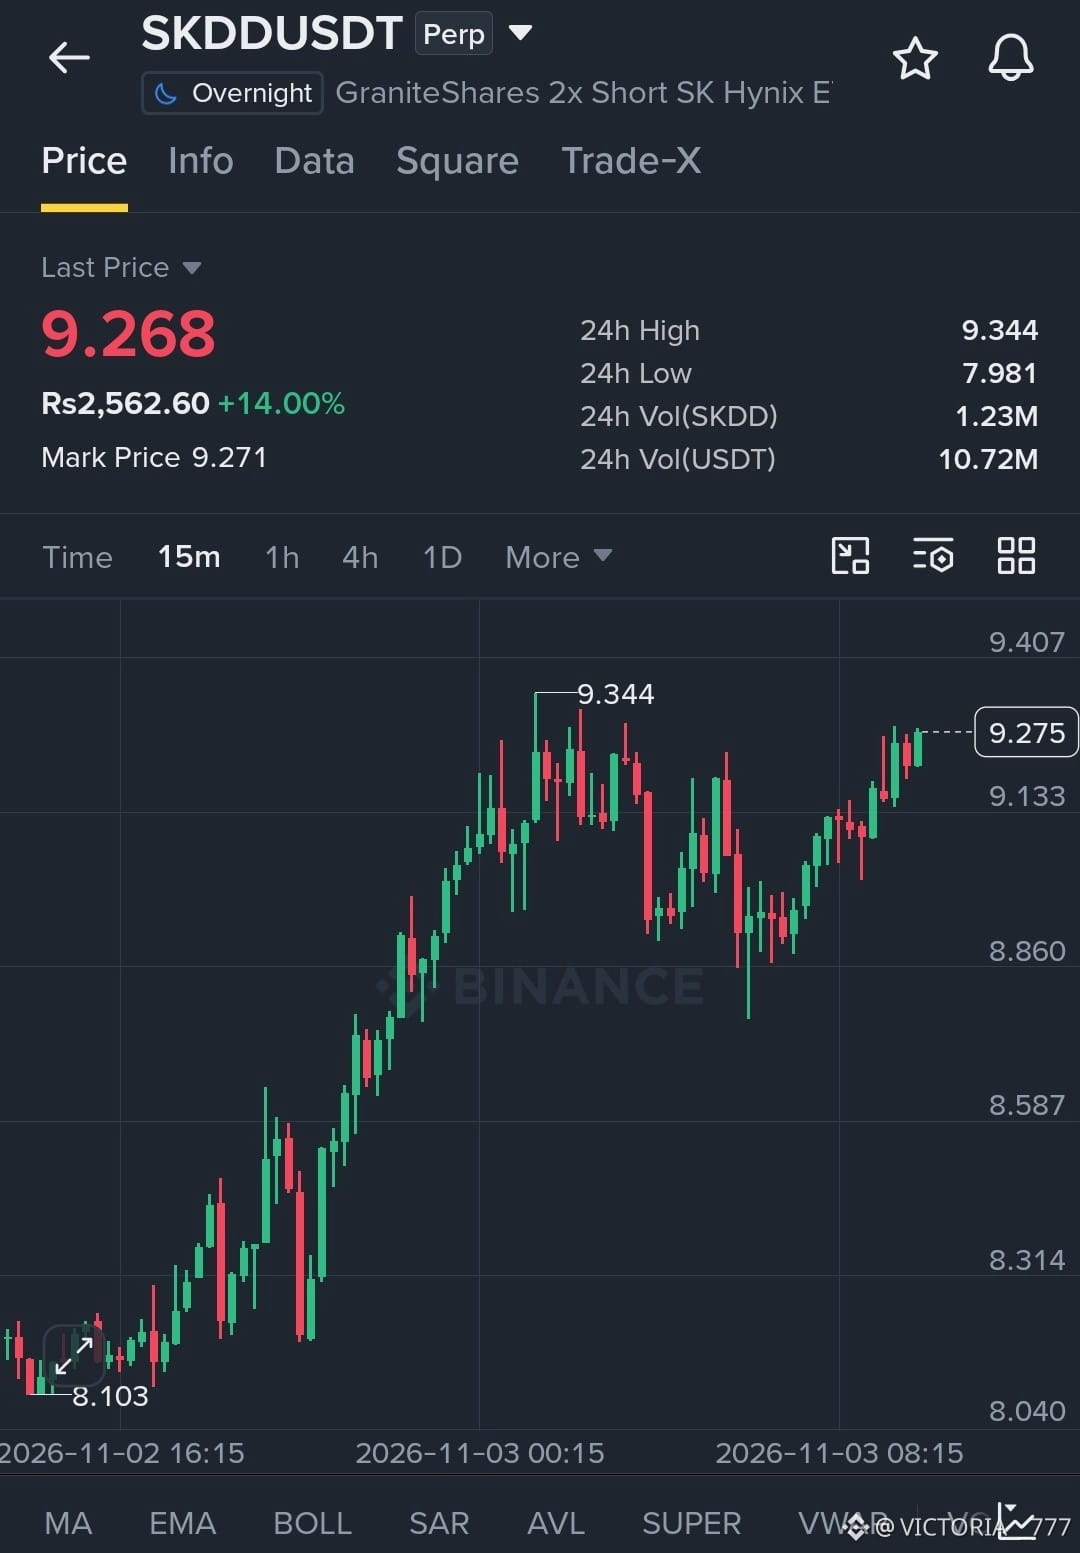
$SKDD
/ USDT Perp | Strong Bullish Momentum – Is Another Breakout Coming?
SKDD is showing impressive strength, and buyers are clearly making their presence felt on the 15-minute chart.
The current price is $9.268, up +14.00% over the last 24 hours, with the Mark Price at $9.271.
24h High: $9.344
24h Low: $7.981
24h Volume: 1.23M SKDD
USDT Volume: $10.72M
Looking at the price action, SKDD has climbed strongly from the $8.103 area, building a series of higher moves before reaching $9.344. After facing rejection near that high, the market entered a consolidation phase.
What stands out now is the recovery. Buyers have pushed price back toward $9.27, bringing it close to the recent resistance zone.
Key levels to watch:
Support: $9.133, followed by $8.860.
Resistance: $9.344, followed by $9.407.
A confirmed breakout above $9.344 could create room for another upward move. However, rejection from this zone may bring a short-term pullback toward support.
Momentum currently favors buyers, but the next candle closes will be important.
Don't confuse a strong rally with a guaranteed continuation. Watch volume, manage leverage, and always protect your capital.
Will SKDD break its $9.344 high or face another rejection?
Let's watch closely! $SKDD
$SKDD
/ USDT Perp | Strong Bullish Momentum – Is Another Breakout Coming?
SKDD is showing impressive strength, and buyers are clearly making their presence felt on the 15-minute chart.
The current price is $9.268, up +14.00% over the last 24 hours, with the Mark Price at $9.271.
24h High: $9.344
24h Low: $7.981
24h Volume: 1.23M SKDD
USDT Volume: $10.72M
Looking at the price action, SKDD has climbed strongly from the $8.103 area, building a series of higher moves before reaching $9.344. After facing rejection near that high, the market entered a consolidation phase.
What stands out now is the recovery. Buyers have pushed price back toward $9.27, bringing it close to the recent resistance zone.
Key levels to watch:
Support: $9.133, followed by $8.860.
Resistance: $9.344, followed by $9.407.
A confirmed breakout above $9.344 could create room for another upward move. However, rejection from this zone may bring a short-term pullback toward support.
Momentum currently favors buyers, but the next candle closes will be important.
Don't confuse a strong rally with a guaranteed continuation. Watch volume, manage leverage, and always protect your capital.
Will SKDD break its $9.344 high or face another rejection?
Let's watch closely! $SKDD
/ USDT Perp | Strong Bullish Momentum – Is Another Breakout Coming?
SKDD is showing impressive strength, and buyers are clearly making their presence felt on the 15-minute chart.
The current price is $9.268, up +14.00% over the last 24 hours, with the Mark Price at $9.271.
24h High: $9.344
24h Low: $7.981
24h Volume: 1.23M SKDD
USDT Volume: $10.72M
Looking at the price action, SKDD has climbed strongly from the $8.103 area, building a series of higher moves before reaching $9.344. After facing rejection near that high, the market entered a consolidation phase.
What stands out now is the recovery. Buyers have pushed price back toward $9.27, bringing it close to the recent resistance zone.
Key levels to watch:
Support: $9.133, followed by $8.860.
Resistance: $9.344, followed by $9.407.
A confirmed breakout above $9.344 could create room for another upward move. However, rejection from this zone may bring a short-term pullback toward support.
Momentum currently favors buyers, but the next candle closes will be important.
Don't confuse a strong rally with a guaranteed continuation. Watch volume, manage leverage, and always protect your capital.
Will SKDD break its $9.344 high or face another rejection?
Let's watch closely! $SKDD
2
84
·
--
Bullish
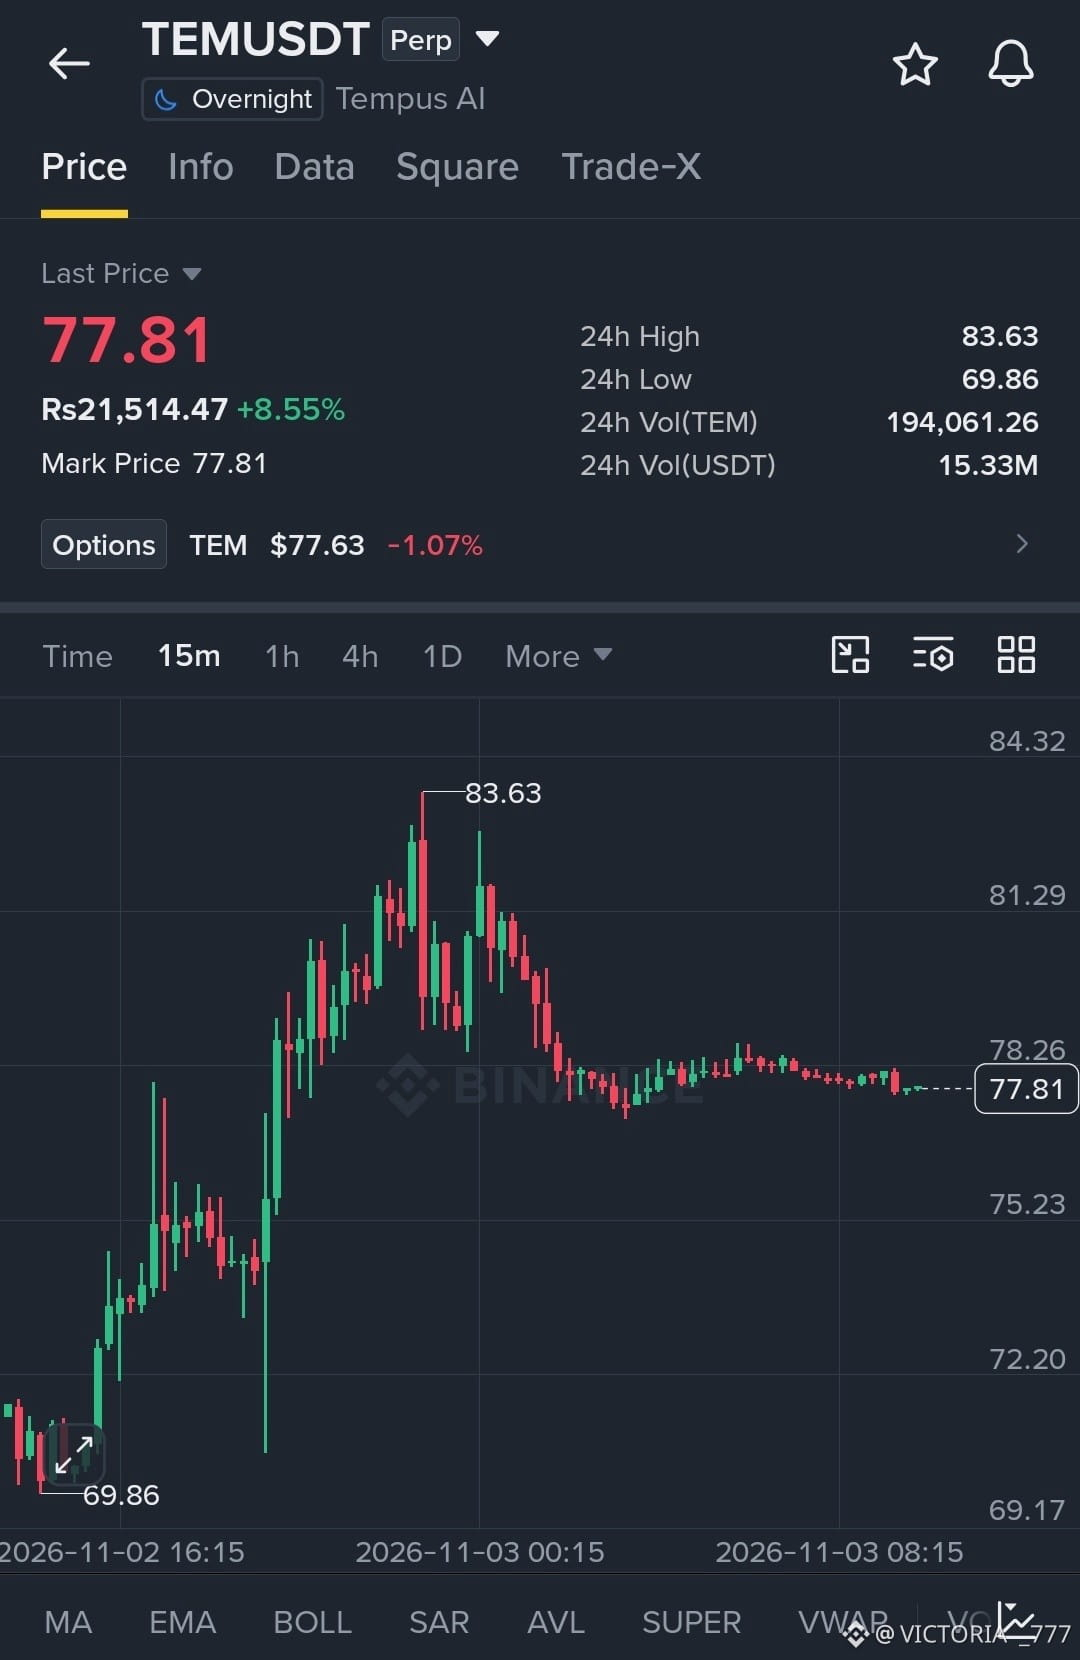
$TEM / USDT Perp | Tempus AI: Strong Rally, But What's Next?
$TEM has delivered an impressive move, but the market is now entering a consolidation phase after a sharp rally.
The current price is $77.81, up +8.55% over the last 24 hours. The Mark Price is also $77.81.
24h High: $83.63
24h Low: $69.86
24h Volume: 194,061.26 TEM
USDT Volume: $15.33M
Looking at the 15-minute chart, buyers initially took control and pushed TEM from the $69.86 low toward $83.63. The rally showed strong bullish momentum, but sellers stepped in near the highs and triggered a noticeable correction.
Since that pullback, price has been moving sideways around $77.81. This consolidation suggests that the market is waiting for its next catalyst, with neither side showing a decisive advantage.
Key levels to watch:
Support: $77.00, followed by $75.23.
Resistance: $78.26, followed by $81.29 and $83.63.
A breakout above $78.26 could bring fresh buying momentum, while a breakdown below $77 may expose lower support zones.
The bigger question is whether this consolidation becomes a launchpad for another bullish move or the beginning of a deeper correction.
Don't chase the move. Wait for confirmation, manage your risk, and trade with a clear plan.
Let's see what TEM does next! $TEM
$TEM / USDT Perp | Tempus AI: Strong Rally, But What's Next?
$TEM has delivered an impressive move, but the market is now entering a consolidation phase after a sharp rally.
The current price is $77.81, up +8.55% over the last 24 hours. The Mark Price is also $77.81.
24h High: $83.63
24h Low: $69.86
24h Volume: 194,061.26 TEM
USDT Volume: $15.33M
Looking at the 15-minute chart, buyers initially took control and pushed TEM from the $69.86 low toward $83.63. The rally showed strong bullish momentum, but sellers stepped in near the highs and triggered a noticeable correction.
Since that pullback, price has been moving sideways around $77.81. This consolidation suggests that the market is waiting for its next catalyst, with neither side showing a decisive advantage.
Key levels to watch:
Support: $77.00, followed by $75.23.
Resistance: $78.26, followed by $81.29 and $83.63.
A breakout above $78.26 could bring fresh buying momentum, while a breakdown below $77 may expose lower support zones.
The bigger question is whether this consolidation becomes a launchpad for another bullish move or the beginning of a deeper correction.
Don't chase the move. Wait for confirmation, manage your risk, and trade with a clear plan.
Let's see what TEM does next! $TEM
$TEM has delivered an impressive move, but the market is now entering a consolidation phase after a sharp rally.
The current price is $77.81, up +8.55% over the last 24 hours. The Mark Price is also $77.81.
24h High: $83.63
24h Low: $69.86
24h Volume: 194,061.26 TEM
USDT Volume: $15.33M
Looking at the 15-minute chart, buyers initially took control and pushed TEM from the $69.86 low toward $83.63. The rally showed strong bullish momentum, but sellers stepped in near the highs and triggered a noticeable correction.
Since that pullback, price has been moving sideways around $77.81. This consolidation suggests that the market is waiting for its next catalyst, with neither side showing a decisive advantage.
Key levels to watch:
Support: $77.00, followed by $75.23.
Resistance: $78.26, followed by $81.29 and $83.63.
A breakout above $78.26 could bring fresh buying momentum, while a breakdown below $77 may expose lower support zones.
The bigger question is whether this consolidation becomes a launchpad for another bullish move or the beginning of a deeper correction.
Don't chase the move. Wait for confirmation, manage your risk, and trade with a clear plan.
Let's see what TEM does next! $TEM
2
116
·
--
Bullish
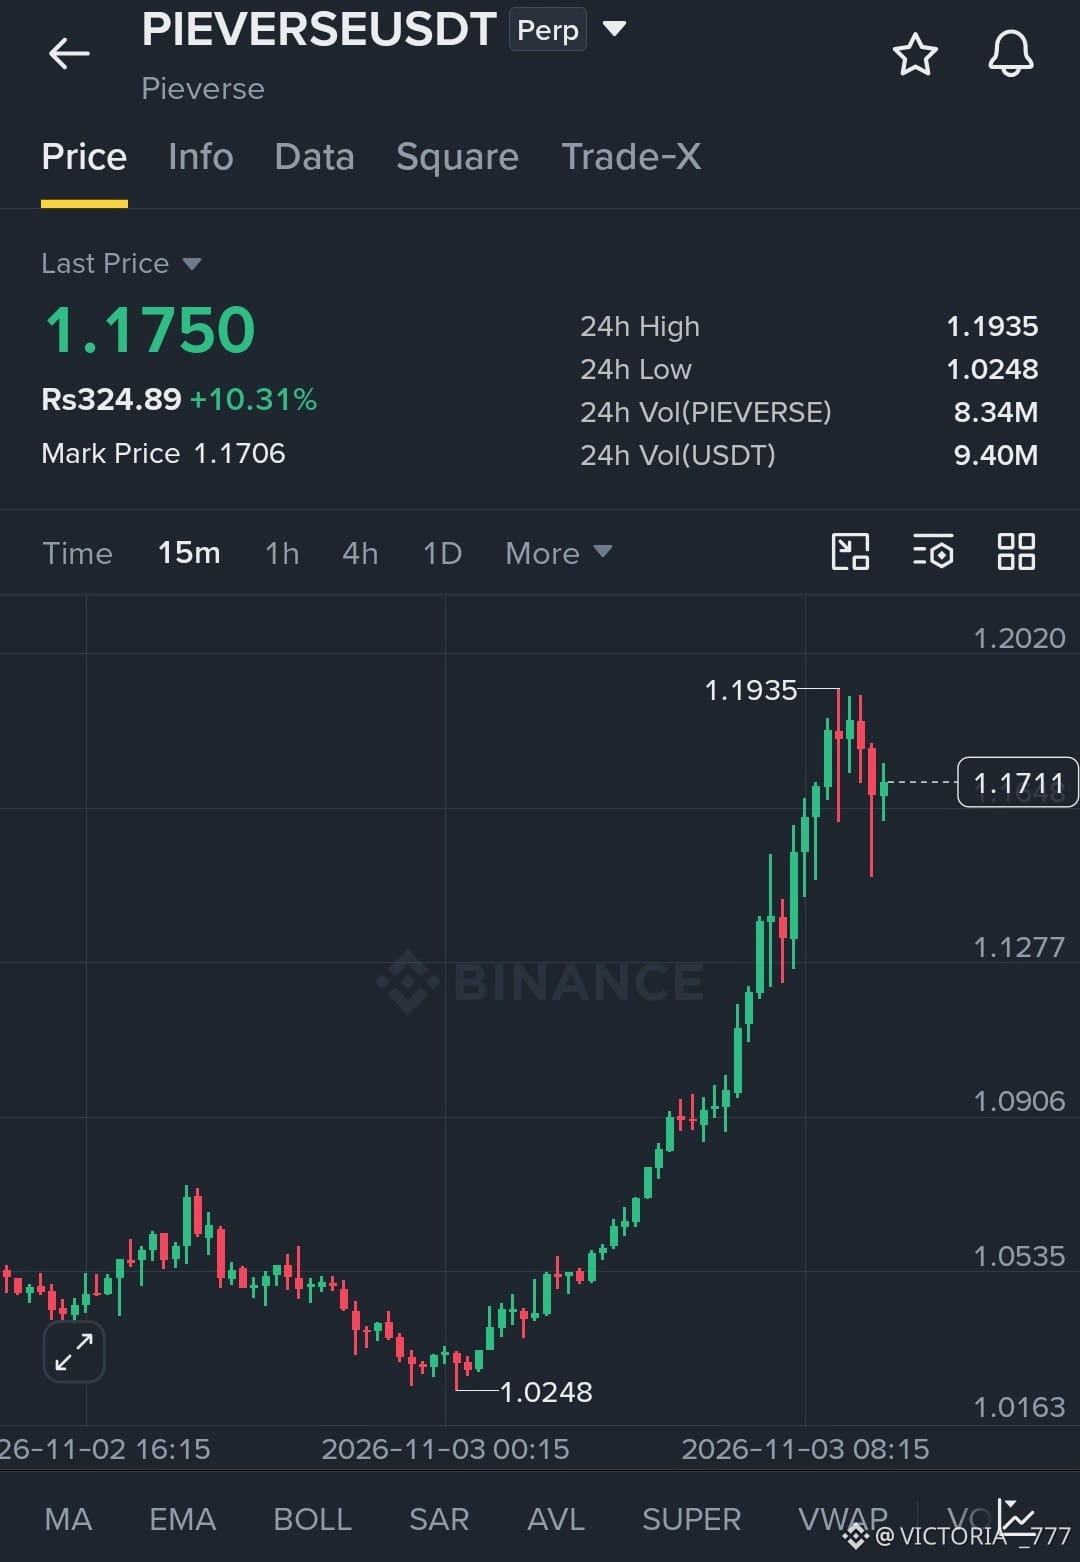
$PIEVERSE / USDT Perp | Pieverese: Bulls Are Taking Control!
PIEVERSE is showing impressive bullish momentum, and the 15-minute chart is getting hard to ignore.
The current price is $1.1750, up +10.31% over the last 24 hours, with a Mark Price of $1.1706.
24h High: $1.1935
24h Low: $1.0248
24h Volume: 8.34M PIEVERSE
USDT Volume: 9.40M
Looking at the chart, buyers have made a powerful comeback. After dropping toward $1.0248, PIEVERSE built a recovery and gradually pushed higher. The buying pressure accelerated around $1.09, leading to a strong rally toward $1.1935.
However, the recent rejection near the high shows that sellers are becoming active. Price is now consolidating around $1.1750, and the next move could be important.
Key levels to watch:
Support: $1.1277, followed by $1.0906.
Resistance: $1.1935, followed by $1.2020.
A convincing breakout above $1.1935 could bring fresh bullish momentum. However, losing $1.1277 may trigger a deeper pullback.
The trend looks bullish on this 15-minute chart, but chasing a sharp rally can be risky. Wait for confirmation, manage your leverage, and protect your capital.
Will PIEVERSE break above $1.20 next, or will sellers take control?
Let's watch the next move! $PIEVERSE
{future}(PIEVERSEUSDT)
$PIEVERSE / USDT Perp | Pieverese: Bulls Are Taking Control!
PIEVERSE is showing impressive bullish momentum, and the 15-minute chart is getting hard to ignore.
The current price is $1.1750, up +10.31% over the last 24 hours, with a Mark Price of $1.1706.
24h High: $1.1935
24h Low: $1.0248
24h Volume: 8.34M PIEVERSE
USDT Volume: 9.40M
Looking at the chart, buyers have made a powerful comeback. After dropping toward $1.0248, PIEVERSE built a recovery and gradually pushed higher. The buying pressure accelerated around $1.09, leading to a strong rally toward $1.1935.
However, the recent rejection near the high shows that sellers are becoming active. Price is now consolidating around $1.1750, and the next move could be important.
Key levels to watch:
Support: $1.1277, followed by $1.0906.
Resistance: $1.1935, followed by $1.2020.
A convincing breakout above $1.1935 could bring fresh bullish momentum. However, losing $1.1277 may trigger a deeper pullback.
The trend looks bullish on this 15-minute chart, but chasing a sharp rally can be risky. Wait for confirmation, manage your leverage, and protect your capital.
Will PIEVERSE break above $1.20 next, or will sellers take control?
Let's watch the next move! $PIEVERSE
PIEVERSE is showing impressive bullish momentum, and the 15-minute chart is getting hard to ignore.
The current price is $1.1750, up +10.31% over the last 24 hours, with a Mark Price of $1.1706.
24h High: $1.1935
24h Low: $1.0248
24h Volume: 8.34M PIEVERSE
USDT Volume: 9.40M
Looking at the chart, buyers have made a powerful comeback. After dropping toward $1.0248, PIEVERSE built a recovery and gradually pushed higher. The buying pressure accelerated around $1.09, leading to a strong rally toward $1.1935.
However, the recent rejection near the high shows that sellers are becoming active. Price is now consolidating around $1.1750, and the next move could be important.
Key levels to watch:
Support: $1.1277, followed by $1.0906.
Resistance: $1.1935, followed by $1.2020.
A convincing breakout above $1.1935 could bring fresh bullish momentum. However, losing $1.1277 may trigger a deeper pullback.
The trend looks bullish on this 15-minute chart, but chasing a sharp rally can be risky. Wait for confirmation, manage your leverage, and protect your capital.
Will PIEVERSE break above $1.20 next, or will sellers take control?
Let's watch the next move! $PIEVERSE
2
71
·
--
Bullish
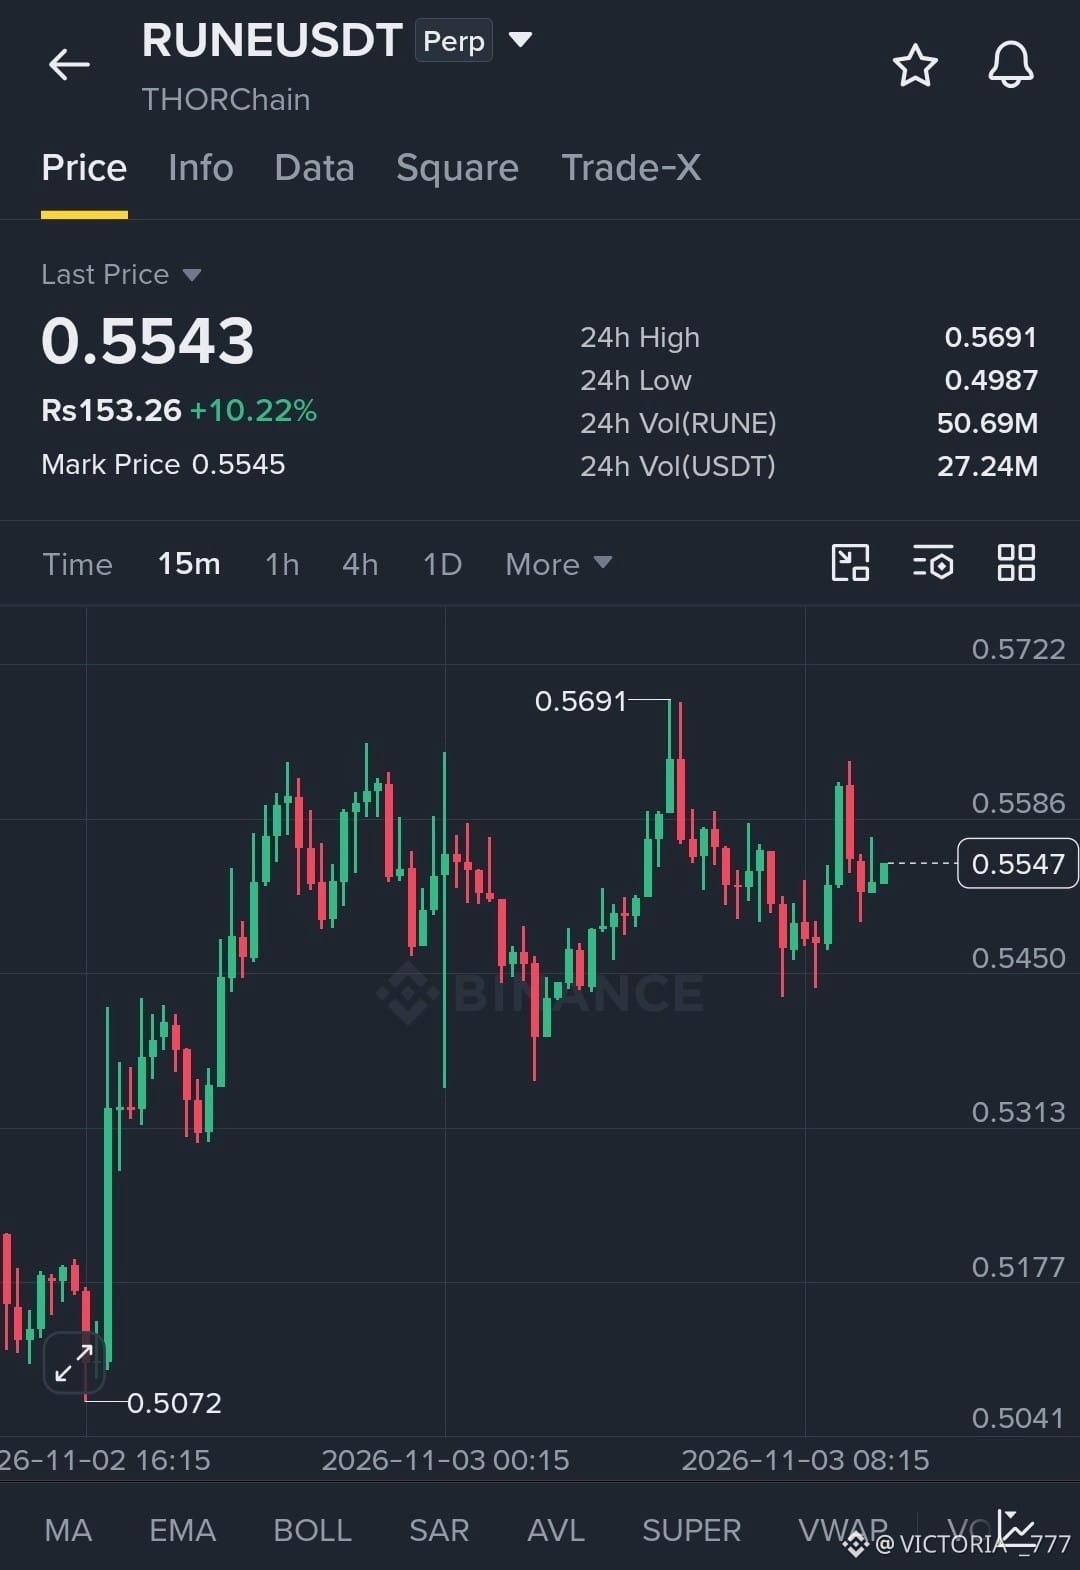
$RUNE / USDT Perp | THORChain: Bulls Are Back in Action!
RUNE is showing promising momentum, and the 15-minute chart is giving traders something interesting to watch.
The current price is $0.5543, up +10.22% in the last 24 hours. Mark Price stands at $0.5545, while 24h trading volume has reached 50.69M RUNE, equivalent to 27.24M USDT.
Price recently climbed from the $0.5072 low and pushed all the way toward $0.5691, showing strong buying interest. However, sellers stepped in near the local high, triggering a pullback.
Now RUNE is consolidating around $0.5543, with buyers attempting to regain control.
Key levels to watch:
Support: $0.5450, followed by $0.5313.
Resistance: $0.5586, followed by $0.5691.
A strong breakout above $0.5586 could open the door for another attempt at the recent high. On the other hand, losing $0.5450 could bring additional selling pressure.
The bullish structure is still worth watching, but confirmation through volume is important.
Volatility creates opportunities, but risk management separates smart traders from emotional traders.
Keep your levels clear, protect your capital, and let the market confirm the next move.
Let's go and trade now! $RUNE
{future}(RUNEUSDT)
$RUNE / USDT Perp | THORChain: Bulls Are Back in Action!
RUNE is showing promising momentum, and the 15-minute chart is giving traders something interesting to watch.
The current price is $0.5543, up +10.22% in the last 24 hours. Mark Price stands at $0.5545, while 24h trading volume has reached 50.69M RUNE, equivalent to 27.24M USDT.
Price recently climbed from the $0.5072 low and pushed all the way toward $0.5691, showing strong buying interest. However, sellers stepped in near the local high, triggering a pullback.
Now RUNE is consolidating around $0.5543, with buyers attempting to regain control.
Key levels to watch:
Support: $0.5450, followed by $0.5313.
Resistance: $0.5586, followed by $0.5691.
A strong breakout above $0.5586 could open the door for another attempt at the recent high. On the other hand, losing $0.5450 could bring additional selling pressure.
The bullish structure is still worth watching, but confirmation through volume is important.
Volatility creates opportunities, but risk management separates smart traders from emotional traders.
Keep your levels clear, protect your capital, and let the market confirm the next move.
Let's go and trade now! $RUNE
RUNE is showing promising momentum, and the 15-minute chart is giving traders something interesting to watch.
The current price is $0.5543, up +10.22% in the last 24 hours. Mark Price stands at $0.5545, while 24h trading volume has reached 50.69M RUNE, equivalent to 27.24M USDT.
Price recently climbed from the $0.5072 low and pushed all the way toward $0.5691, showing strong buying interest. However, sellers stepped in near the local high, triggering a pullback.
Now RUNE is consolidating around $0.5543, with buyers attempting to regain control.
Key levels to watch:
Support: $0.5450, followed by $0.5313.
Resistance: $0.5586, followed by $0.5691.
A strong breakout above $0.5586 could open the door for another attempt at the recent high. On the other hand, losing $0.5450 could bring additional selling pressure.
The bullish structure is still worth watching, but confirmation through volume is important.
Volatility creates opportunities, but risk management separates smart traders from emotional traders.
Keep your levels clear, protect your capital, and let the market confirm the next move.
Let's go and trade now! $RUNE
2
82
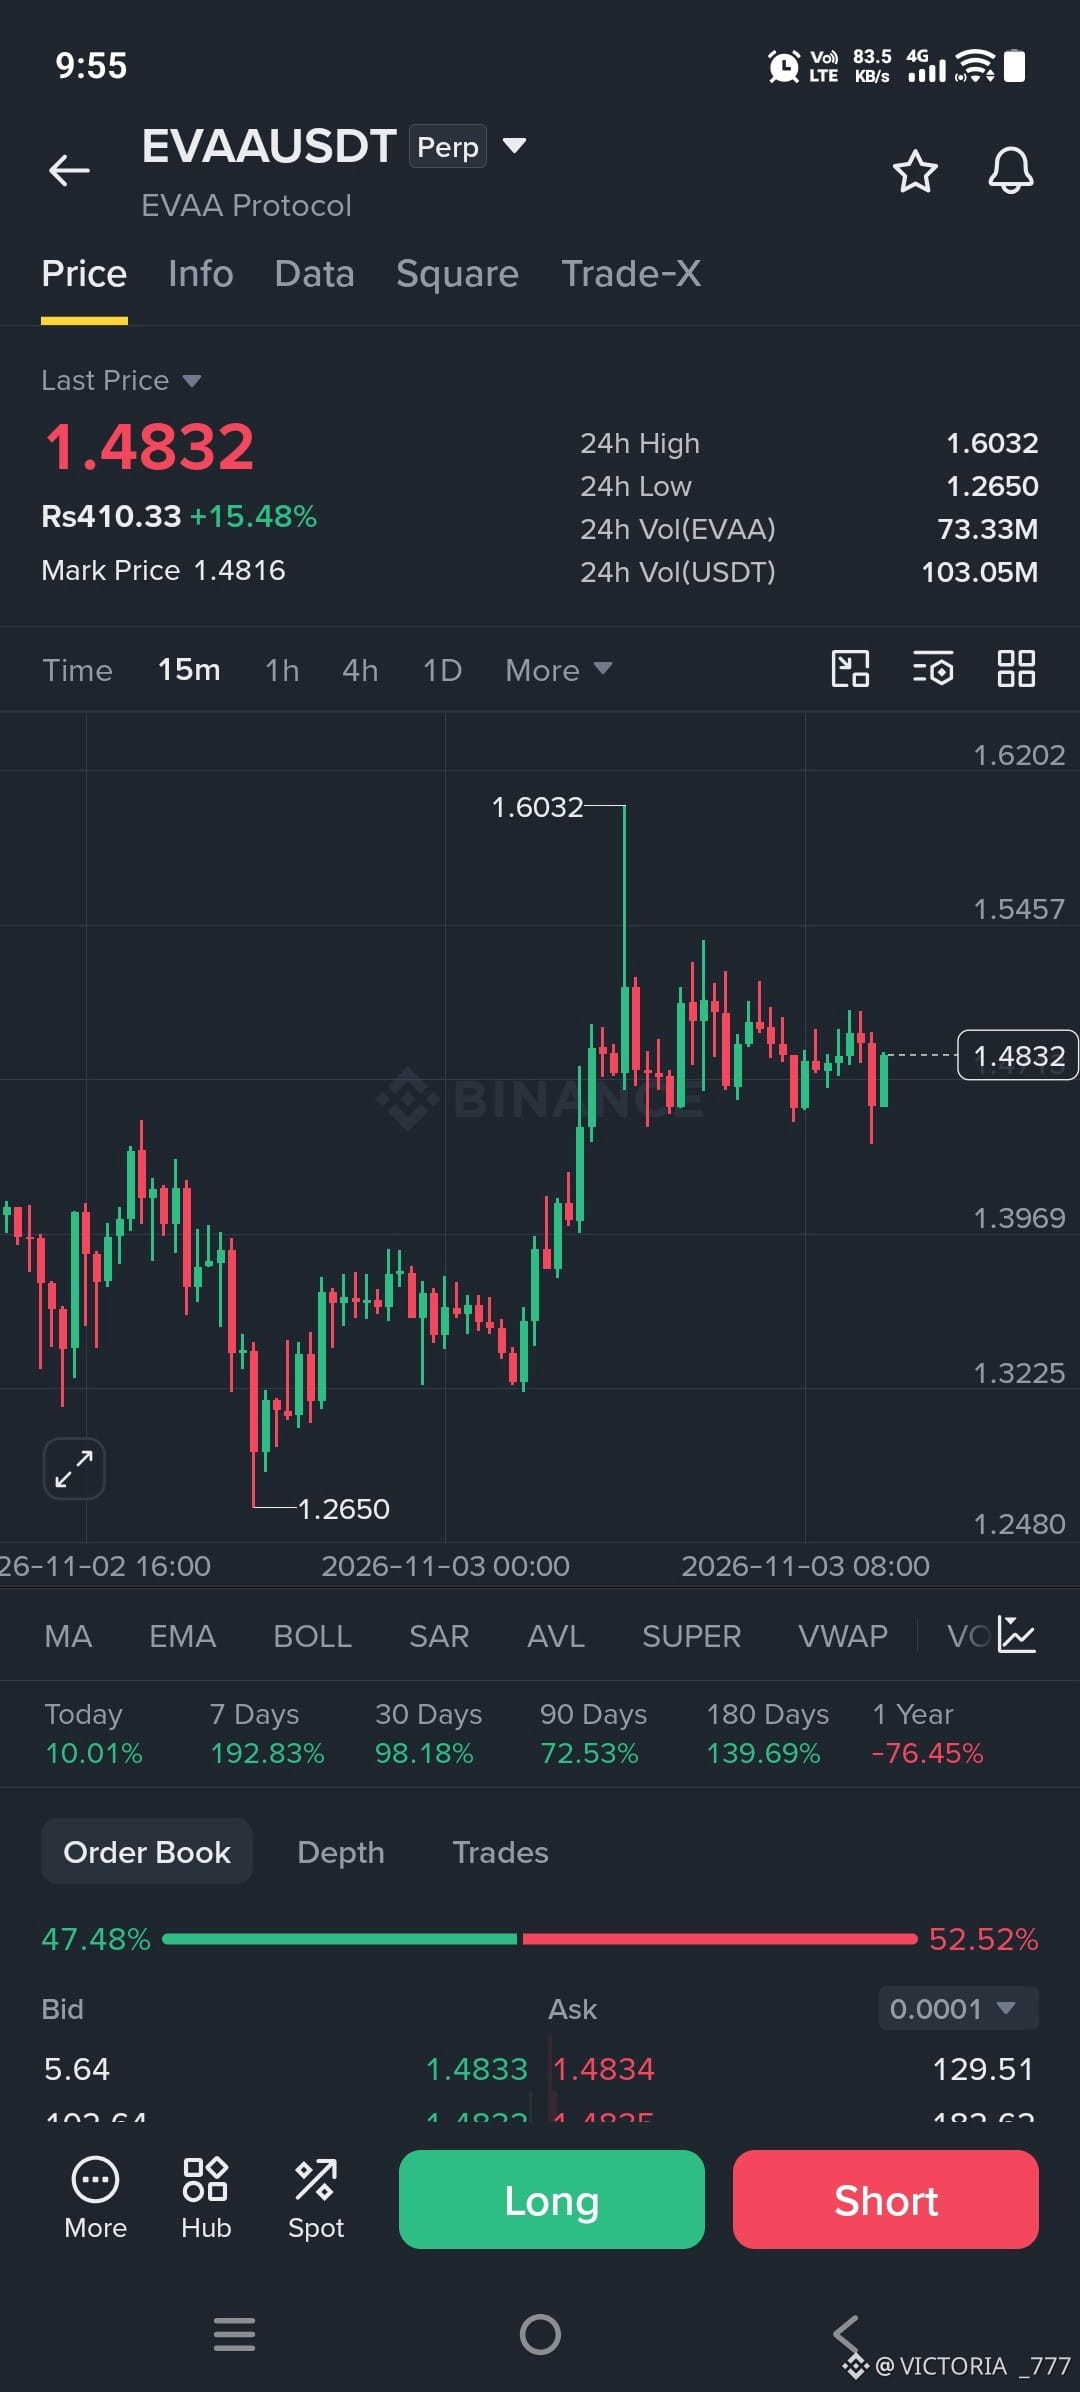
🚀 $EVAA
{future}(EVAAUSDT)
USDT — Bulls Are Holding Strong!
$AGT
{future}(AGTUSDT)
$ARIA
{future}(ARIAUSDT)
is trading at $1.4832, up 15.48% in 24 hours! After bouncing strongly from $1.2650, buyers pushed the price to a new visible high of $1.6032. Now the market is consolidating around $1.48 after the sharp rally. The next breakout could decide whether bulls continue the move or sellers take control!
📊 Trade Setup — LONG
- Entry Zone: $1.4650–$1.4850
- TP1: $1.5200
- TP2: $1.5450
- TP3: $1.6000
- SL: $1.4350
🔥 Key Resistance: $1.5450 / $1.6032
🛡️ Key Support: $1.4500 / $1.3969
📈 Market Watch: The order book shows 47.48% bids versus 52.52% asks, indicating slightly heavier sell-side liquidity at the time of the screenshot.
Don't chase the pump blindly. Wait for confirmation and manage leverage carefully.
Can break $1.60 and push toward another rally? Let's go and trade now! 🔥
🚀 $EVAA
USDT — Bulls Are Holding Strong!
$AGT
$ARIA
is trading at $1.4832, up 15.48% in 24 hours! After bouncing strongly from $1.2650, buyers pushed the price to a new visible high of $1.6032. Now the market is consolidating around $1.48 after the sharp rally. The next breakout could decide whether bulls continue the move or sellers take control!
📊 Trade Setup — LONG
- Entry Zone: $1.4650–$1.4850
- TP1: $1.5200
- TP2: $1.5450
- TP3: $1.6000
- SL: $1.4350
🔥 Key Resistance: $1.5450 / $1.6032
🛡️ Key Support: $1.4500 / $1.3969
📈 Market Watch: The order book shows 47.48% bids versus 52.52% asks, indicating slightly heavier sell-side liquidity at the time of the screenshot.
Don't chase the pump blindly. Wait for confirmation and manage leverage carefully.
Can break $1.60 and push toward another rally? Let's go and trade now! 🔥
USDT — Bulls Are Holding Strong!
$AGT
$ARIA
is trading at $1.4832, up 15.48% in 24 hours! After bouncing strongly from $1.2650, buyers pushed the price to a new visible high of $1.6032. Now the market is consolidating around $1.48 after the sharp rally. The next breakout could decide whether bulls continue the move or sellers take control!
📊 Trade Setup — LONG
- Entry Zone: $1.4650–$1.4850
- TP1: $1.5200
- TP2: $1.5450
- TP3: $1.6000
- SL: $1.4350
🔥 Key Resistance: $1.5450 / $1.6032
🛡️ Key Support: $1.4500 / $1.3969
📈 Market Watch: The order book shows 47.48% bids versus 52.52% asks, indicating slightly heavier sell-side liquidity at the time of the screenshot.
Don't chase the pump blindly. Wait for confirmation and manage leverage carefully.
Can break $1.60 and push toward another rally? Let's go and trade now! 🔥
2
102
·
--
Bullish
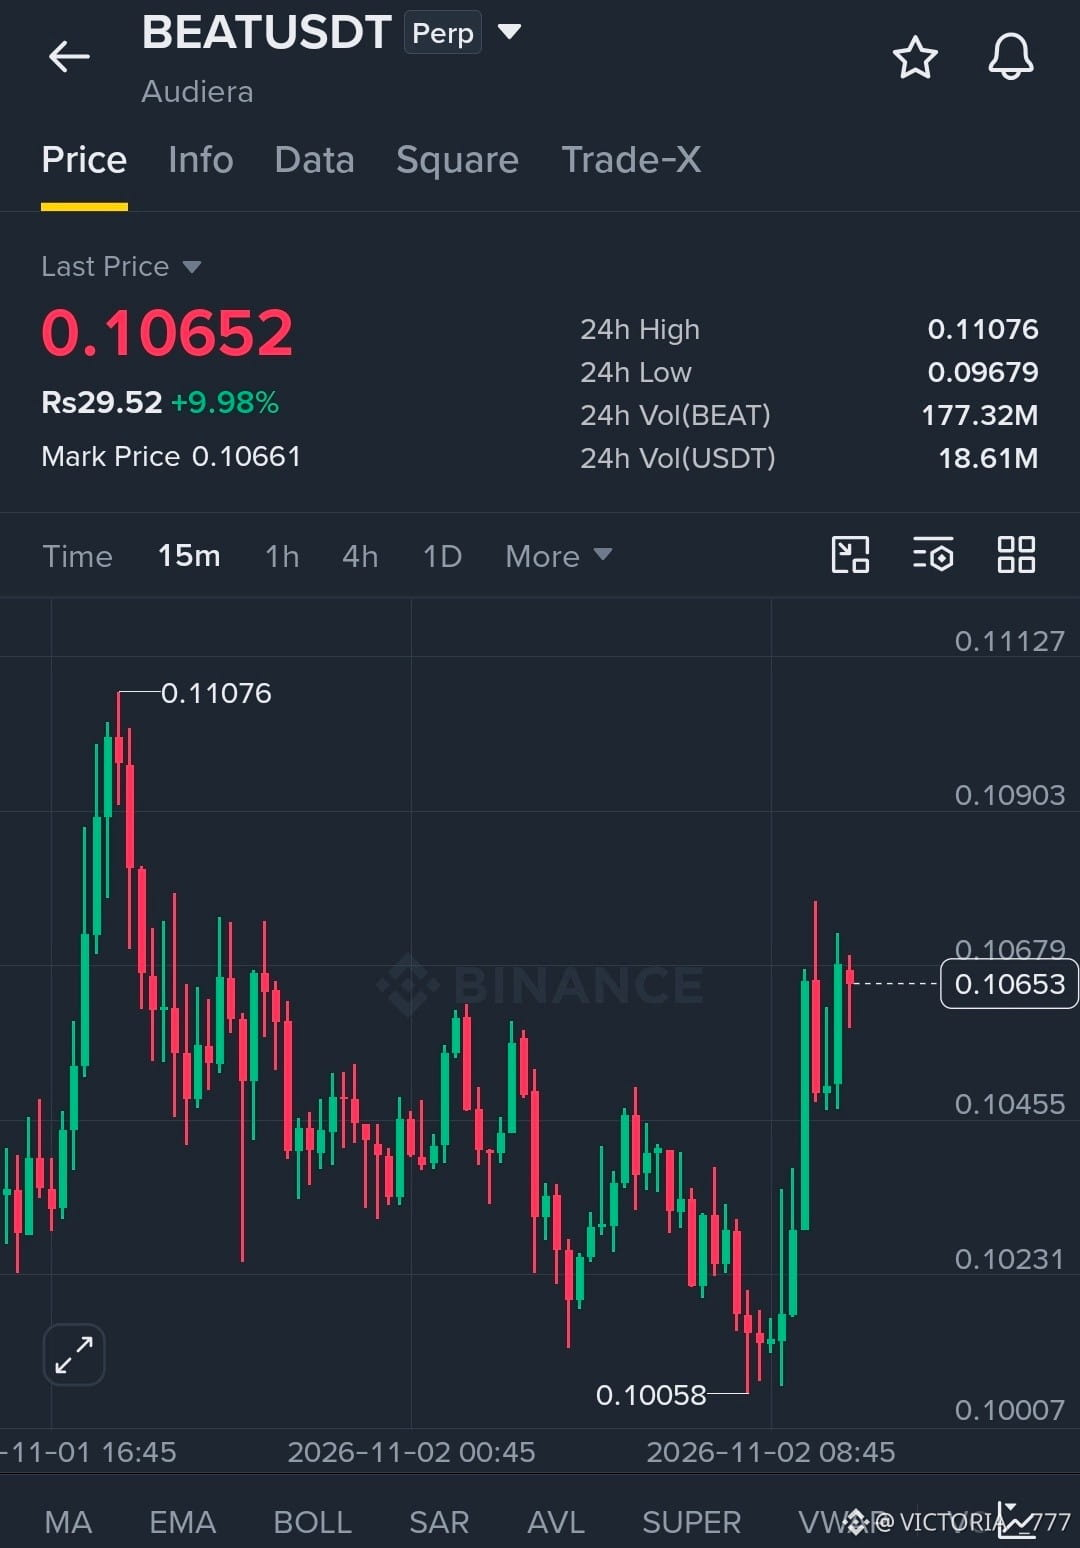
🚀 $BEAT
{future}(BEATUSDT)
USDT — Bulls Are Making a Comeback!
$BEAT is trading at $0.10652, up 9.98% in 24 hours! After dropping to $0.10058, buyers stepped in aggressively and pushed the price back toward $0.1065. Momentum has improved, but sellers are active near the $0.10679–$0.10700 resistance zone. Can bulls break through and target a fresh high?
📊 Trade Setup — LONG
- Entry Zone: $0.10580–$0.10650
- TP1: $0.10700
- TP2: $0.10900
- TP3: $0.11070
- SL: $0.10450
🔥 Support: $0.10455
🎯 Major Resistance: $0.11076
Wait for a confirmed breakout or a clean retest before entering. If support fails, the bullish setup may weaken. Use controlled leverage and strict risk management.
Can $BEAT break $0.107 and continue higher? Let's watch!
🚀 $BEAT
USDT — Bulls Are Making a Comeback!
$BEAT is trading at $0.10652, up 9.98% in 24 hours! After dropping to $0.10058, buyers stepped in aggressively and pushed the price back toward $0.1065. Momentum has improved, but sellers are active near the $0.10679–$0.10700 resistance zone. Can bulls break through and target a fresh high?
📊 Trade Setup — LONG
- Entry Zone: $0.10580–$0.10650
- TP1: $0.10700
- TP2: $0.10900
- TP3: $0.11070
- SL: $0.10450
🔥 Support: $0.10455
🎯 Major Resistance: $0.11076
Wait for a confirmed breakout or a clean retest before entering. If support fails, the bullish setup may weaken. Use controlled leverage and strict risk management.
Can $BEAT break $0.107 and continue higher? Let's watch!
USDT — Bulls Are Making a Comeback!
$BEAT is trading at $0.10652, up 9.98% in 24 hours! After dropping to $0.10058, buyers stepped in aggressively and pushed the price back toward $0.1065. Momentum has improved, but sellers are active near the $0.10679–$0.10700 resistance zone. Can bulls break through and target a fresh high?
📊 Trade Setup — LONG
- Entry Zone: $0.10580–$0.10650
- TP1: $0.10700
- TP2: $0.10900
- TP3: $0.11070
- SL: $0.10450
🔥 Support: $0.10455
🎯 Major Resistance: $0.11076
Wait for a confirmed breakout or a clean retest before entering. If support fails, the bullish setup may weaken. Use controlled leverage and strict risk management.
Can $BEAT break $0.107 and continue higher? Let's watch!
2
81
Log in to explore more content
Join global crypto users on Binance Square
⚡️ Get latest and useful information about crypto.
💬 Trusted by the world’s largest crypto exchange.
👍 Discover real insights from verified creators.
Email / Phone number
Trending Topics
HuangExitNvidiaStrategyInFocus
76,753 views
900 Discussing
STOCKS | Nvidia’s Jensen Huang Resigns, Colette Kress Named as Interim CEO
Binance News
·21 Likes
·32.9k views
AnthropicRejectsIPODelayValuationinQuestion
674,315 views
5,182 Discussing
BitMineReports$6.3BNetLossForFiscal2026
9,826 views
115 Discussing