
Cryptomaven01
1.2k Posts

Cryptomaven01
Report
Block User
Crypto enthusiast with expertise in blockchain, digital assets, and a passion for driving decentralized finance and Web3 adoption. KOL on CMC
16 Following
2.2K+ Followers
1.9K+ Liked
Posts
All
Quotes
PINNED
Article
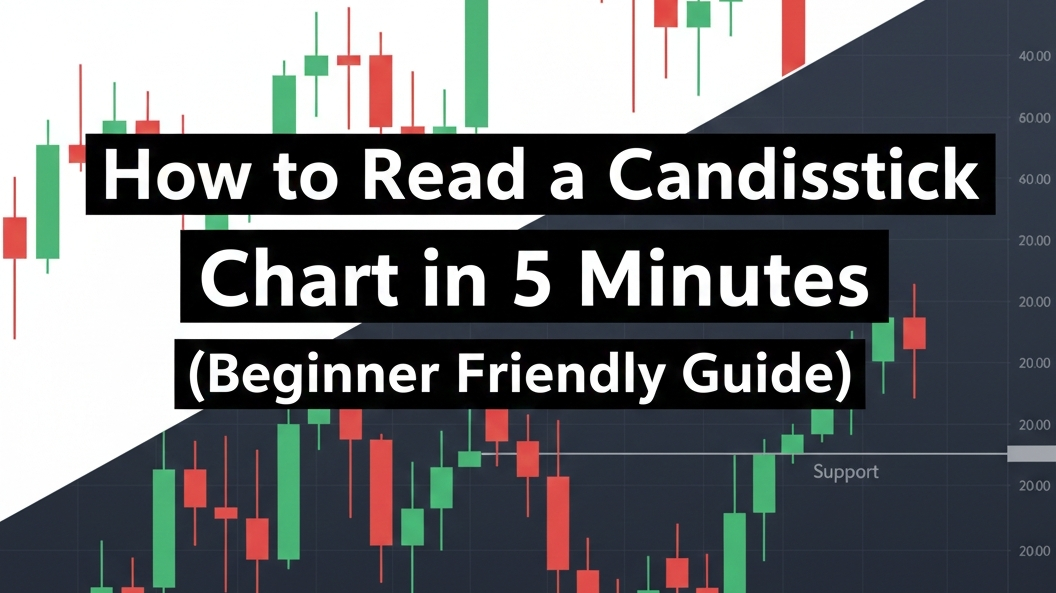
How to read a candlestick chart in 5 minutes (Beginner Friendly Guide)If you open a crypto or forex chart for the first time, it looks confusing.
Red and green candles everywhere. Wicks up and down. Price moving fast.
But the truth is simple: every candlestick is just a story of what price did during a period of time.
Once you understand one candle, the whole chart starts to make sense.
A candlestick shows four things:
Where price opened
Where price closed
The highest price it reached
The lowest price it reached
That’s it. Nothing complicated.
Each candle represents a timeframe. It could be 1 minute, 5 minutes, 1 hour, 1 day. The only difference is how long that candle took to form.
Now let’s break the candle into parts.
The thick part of the candle is called the body.
The thin lines above and below are called the wicks (or shadows).
The body shows the distance between the open and the close.
The wicks show how far price went before coming back.
If the candle is green (bullish), it means price closed higher than it opened. Buyers were in control.
If the candle is red (bearish), it means price closed lower than it opened. Sellers were in control.
This alone already tells you who won the battle during that timeframe.
But the real insight comes from the wicks.
A long upper wick means price tried to go up but was pushed back down. Sellers stepped in.
A long lower wick means price tried to go down but was pushed back up. Buyers stepped in.
This is how you start seeing rejection and pressure in the market.
For example, if you see a candle with a small body and a long lower wick at support, it often means buyers are defending that level.
If you see a candle with a long upper wick at resistance, it often means sellers are defending that area.
This is how candles help you read market behavior without any indicator.
Another important thing beginners miss is candle sequence.
One candle means little. Multiple candles together tell a story.
Many green candles in a row show strong momentum.
Many red candles in a row show strong selling pressure.
But if you start seeing small candles after a big move, it means momentum is slowing down. The market may be preparing to reverse or range.
This is why experienced traders don’t just look at one candle. They look at the pattern being formed.
Some common patterns beginners should know:
A bullish engulfing candle: a big green candle that covers the previous red candle. This shows buyers took control.
A bearish engulfing candle: a big red candle that covers the previous green candle. This shows sellers took control.
A doji: a candle with a very small body and long wicks. This shows indecision in the market.
These patterns are powerful when they appear at support or resistance.
Timeframe also matters.
A pattern on the 1-minute chart is weak.
The same pattern on the 1-hour or 4-hour chart is much stronger.
This is why higher timeframes are more reliable for beginners.
When you look at a chart after learning this, stop seeing candles as colors. Start seeing them as actions.
Ask yourself:
Who is in control here, buyers or sellers?
Is price being rejected from this level?
Is momentum increasing or slowing down?
These questions will teach you more than any indicator.
Candlesticks are the language of the market. Indicators only interpret what candles already show.
If you can read candles, you can read the chart.
And once you can read the chart, trading stops feeling like gambling and starts feeling like analysis.
If you learned something from this, follow me. I share beginner friendly crypto and forex lessons daily.
#Beginnersguide #CryptocurrencyWealth
How to read a candlestick chart in 5 minutes (Beginner Friendly Guide)
If you open a crypto or forex chart for the first time, it looks confusing.
Red and green candles everywhere. Wicks up and down. Price moving fast.
But the truth is simple: every candlestick is just a story of what price did during a period of time.
Once you understand one candle, the whole chart starts to make sense.
A candlestick shows four things:
Where price opened
Where price closed
The highest price it reached
The lowest price it reached
That’s it. Nothing complicated.
Each candle represents a timeframe. It could be 1 minute, 5 minutes, 1 hour, 1 day. The only difference is how long that candle took to form.
Now let’s break the candle into parts.
The thick part of the candle is called the body.
The thin lines above and below are called the wicks (or shadows).
The body shows the distance between the open and the close.
The wicks show how far price went before coming back.
If the candle is green (bullish), it means price closed higher than it opened. Buyers were in control.
If the candle is red (bearish), it means price closed lower than it opened. Sellers were in control.
This alone already tells you who won the battle during that timeframe.
But the real insight comes from the wicks.
A long upper wick means price tried to go up but was pushed back down. Sellers stepped in.
A long lower wick means price tried to go down but was pushed back up. Buyers stepped in.
This is how you start seeing rejection and pressure in the market.
For example, if you see a candle with a small body and a long lower wick at support, it often means buyers are defending that level.
If you see a candle with a long upper wick at resistance, it often means sellers are defending that area.
This is how candles help you read market behavior without any indicator.
Another important thing beginners miss is candle sequence.
One candle means little. Multiple candles together tell a story.
Many green candles in a row show strong momentum.
Many red candles in a row show strong selling pressure.
But if you start seeing small candles after a big move, it means momentum is slowing down. The market may be preparing to reverse or range.
This is why experienced traders don’t just look at one candle. They look at the pattern being formed.
Some common patterns beginners should know:
A bullish engulfing candle: a big green candle that covers the previous red candle. This shows buyers took control.
A bearish engulfing candle: a big red candle that covers the previous green candle. This shows sellers took control.
A doji: a candle with a very small body and long wicks. This shows indecision in the market.
These patterns are powerful when they appear at support or resistance.
Timeframe also matters.
A pattern on the 1-minute chart is weak.
The same pattern on the 1-hour or 4-hour chart is much stronger.
This is why higher timeframes are more reliable for beginners.
When you look at a chart after learning this, stop seeing candles as colors. Start seeing them as actions.
Ask yourself:
Who is in control here, buyers or sellers?
Is price being rejected from this level?
Is momentum increasing or slowing down?
These questions will teach you more than any indicator.
Candlesticks are the language of the market. Indicators only interpret what candles already show.
If you can read candles, you can read the chart.
And once you can read the chart, trading stops feeling like gambling and starts feeling like analysis.
If you learned something from this, follow me. I share beginner friendly crypto and forex lessons daily.
#Beginnersguide #CryptocurrencyWealth
Red and green candles everywhere. Wicks up and down. Price moving fast.
But the truth is simple: every candlestick is just a story of what price did during a period of time.
Once you understand one candle, the whole chart starts to make sense.
A candlestick shows four things:
Where price opened
Where price closed
The highest price it reached
The lowest price it reached
That’s it. Nothing complicated.
Each candle represents a timeframe. It could be 1 minute, 5 minutes, 1 hour, 1 day. The only difference is how long that candle took to form.
Now let’s break the candle into parts.
The thick part of the candle is called the body.
The thin lines above and below are called the wicks (or shadows).
The body shows the distance between the open and the close.
The wicks show how far price went before coming back.
If the candle is green (bullish), it means price closed higher than it opened. Buyers were in control.
If the candle is red (bearish), it means price closed lower than it opened. Sellers were in control.
This alone already tells you who won the battle during that timeframe.
But the real insight comes from the wicks.
A long upper wick means price tried to go up but was pushed back down. Sellers stepped in.
A long lower wick means price tried to go down but was pushed back up. Buyers stepped in.
This is how you start seeing rejection and pressure in the market.
For example, if you see a candle with a small body and a long lower wick at support, it often means buyers are defending that level.
If you see a candle with a long upper wick at resistance, it often means sellers are defending that area.
This is how candles help you read market behavior without any indicator.
Another important thing beginners miss is candle sequence.
One candle means little. Multiple candles together tell a story.
Many green candles in a row show strong momentum.
Many red candles in a row show strong selling pressure.
But if you start seeing small candles after a big move, it means momentum is slowing down. The market may be preparing to reverse or range.
This is why experienced traders don’t just look at one candle. They look at the pattern being formed.
Some common patterns beginners should know:
A bullish engulfing candle: a big green candle that covers the previous red candle. This shows buyers took control.
A bearish engulfing candle: a big red candle that covers the previous green candle. This shows sellers took control.
A doji: a candle with a very small body and long wicks. This shows indecision in the market.
These patterns are powerful when they appear at support or resistance.
Timeframe also matters.
A pattern on the 1-minute chart is weak.
The same pattern on the 1-hour or 4-hour chart is much stronger.
This is why higher timeframes are more reliable for beginners.
When you look at a chart after learning this, stop seeing candles as colors. Start seeing them as actions.
Ask yourself:
Who is in control here, buyers or sellers?
Is price being rejected from this level?
Is momentum increasing or slowing down?
These questions will teach you more than any indicator.
Candlesticks are the language of the market. Indicators only interpret what candles already show.
If you can read candles, you can read the chart.
And once you can read the chart, trading stops feeling like gambling and starts feeling like analysis.
If you learned something from this, follow me. I share beginner friendly crypto and forex lessons daily.
#Beginnersguide #CryptocurrencyWealth
40
32
189
147.1k
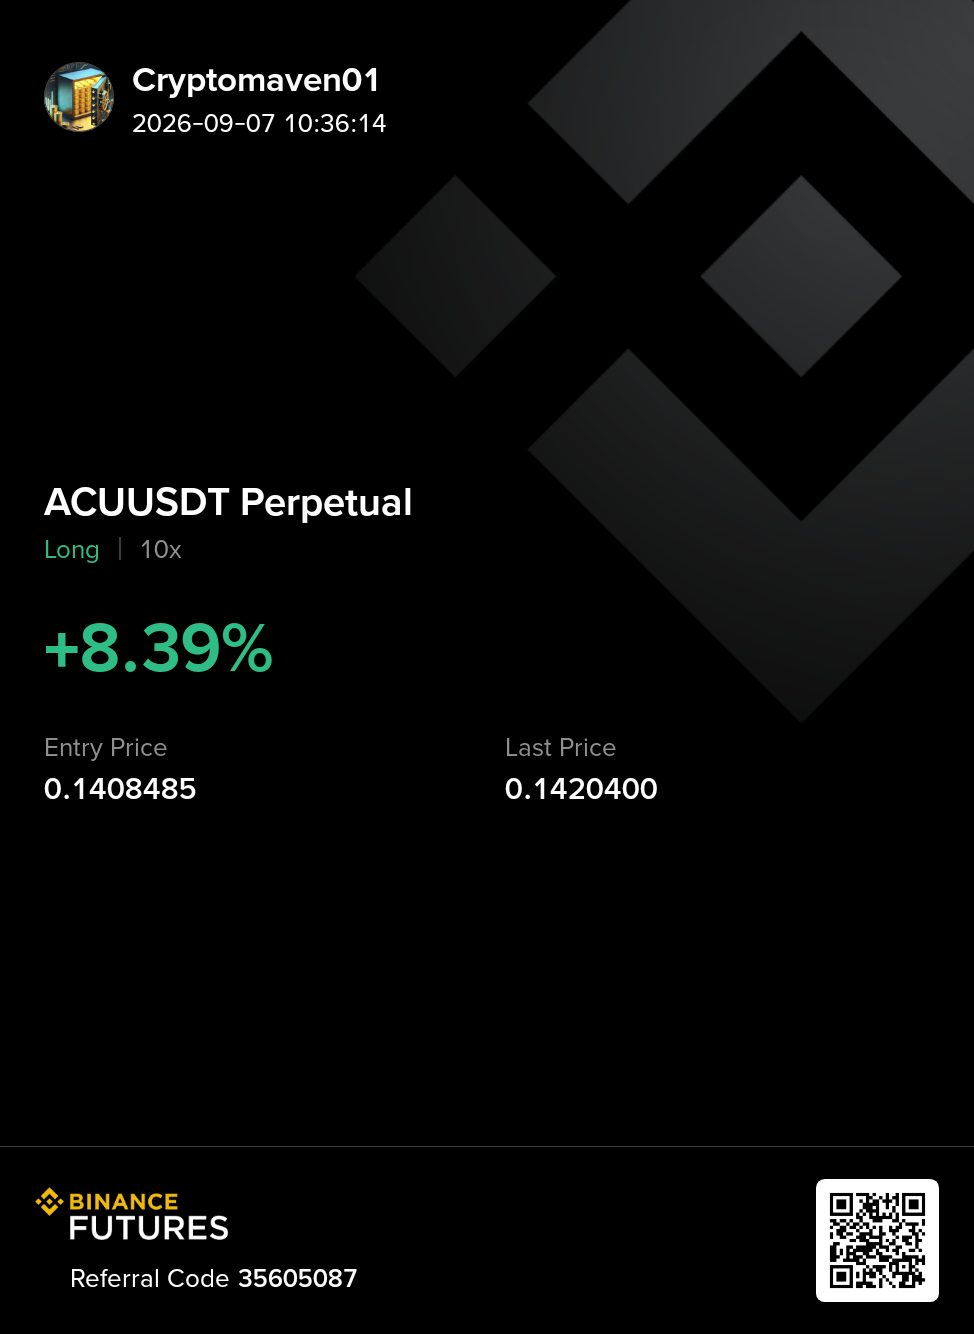
$ACU is starting to look strong as buyers continue to defend the current support zone. If this momentum keeps building, we could see a push toward the next resistance levels.
📈 Entry: 0.139 – 0.142
🎯 TP1: 0.145
🎯 TP2: 0.150
🎯 TP3: 0.152
🛑 SL: 0.135
As long as $ACU stays above the entry area, the bullish setup remains valid and could continue toward the targets above.
$ACU is starting to look strong as buyers continue to defend the current support zone. If this momentum keeps building, we could see a push toward the next resistance levels.
📈 Entry: 0.139 – 0.142
🎯 TP1: 0.145
🎯 TP2: 0.150
🎯 TP3: 0.152
🛑 SL: 0.135
As long as $ACU stays above the entry area, the bullish setup remains valid and could continue toward the targets above.
📈 Entry: 0.139 – 0.142
🎯 TP1: 0.145
🎯 TP2: 0.150
🎯 TP3: 0.152
🛑 SL: 0.135
As long as $ACU stays above the entry area, the bullish setup remains valid and could continue toward the targets above.
2
1.3k
Our $ETH long call TP just hit for those that traded it, don't be greedy, take profit and wait for another retrace before planning to enter again
Our $ETH long call TP just hit for those that traded it, don't be greedy, take profit and wait for another retrace before planning to enter again
Cryptomaven01
·
--
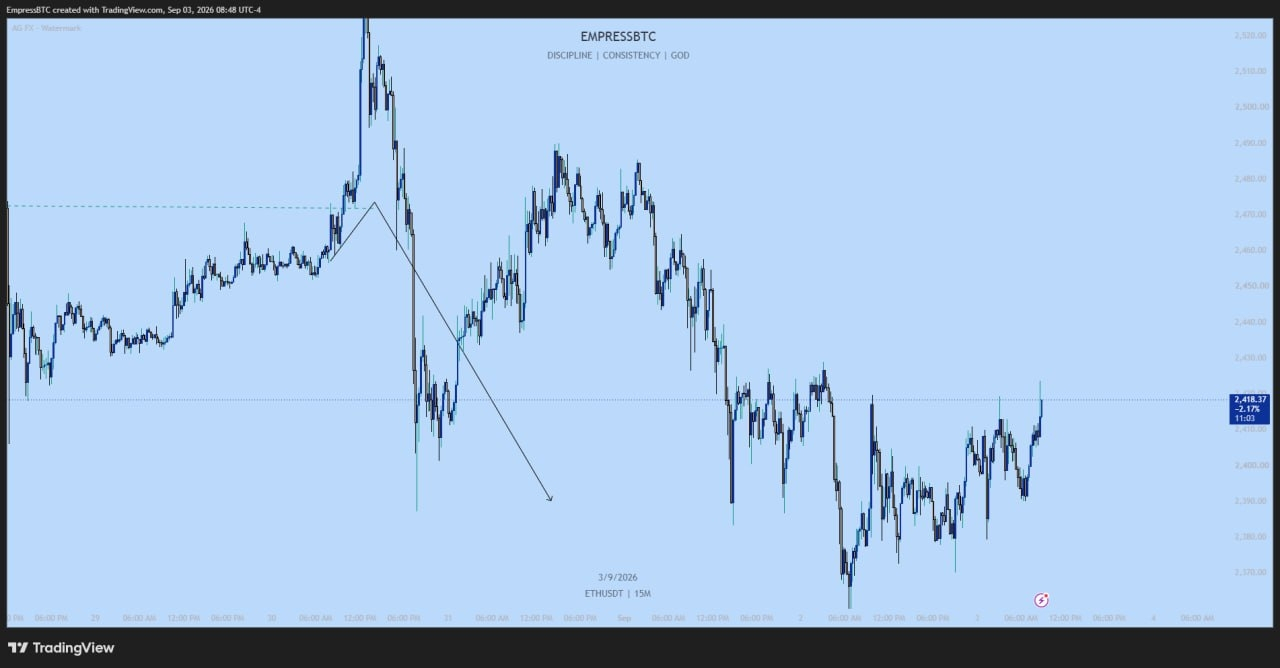
$ETH Bullish Setup
Entry: $2417
TP: $2,490
Price already got to the initial support target we aimied for last week, is another milestone for eth bullish continuation run
Set a minimal SL because this setup is Swing trading
Entry: $2417
TP: $2,490
Price already got to the initial support target we aimied for last week, is another milestone for eth bullish continuation run
Set a minimal SL because this setup is Swing trading
4
3.3k
$ETH Bullish Setup
Entry: $2417
TP: $2,490
Price already got to the initial support target we aimied for last week, is another milestone for eth bullish continuation run
Set a minimal SL because this setup is Swing trading
$ETH Bullish Setup
Entry: $2417
TP: $2,490
Price already got to the initial support target we aimied for last week, is another milestone for eth bullish continuation run
Set a minimal SL because this setup is Swing trading
Entry: $2417
TP: $2,490
Price already got to the initial support target we aimied for last week, is another milestone for eth bullish continuation run
Set a minimal SL because this setup is Swing trading
1
1
3
2.2k
🥵$STX IS UP 6%🥵
🚀 TOMORROW $STX WILL BE AT THE TOP 🚀
✅ENTRY : 0.2593 - 0.2606
🚨SL : 0.2571
😍TP1 : 0.262
😍TP2 : 0.264
😍TP3 : 0.269
$STX UP ⭐
🥵$STX IS UP 6%🥵
🚀 TOMORROW $STX WILL BE AT THE TOP 🚀
✅ENTRY : 0.2593 - 0.2606
🚨SL : 0.2571
😍TP1 : 0.262
😍TP2 : 0.264
😍TP3 : 0.269
$STX UP ⭐
🚀 TOMORROW $STX WILL BE AT THE TOP 🚀
✅ENTRY : 0.2593 - 0.2606
🚨SL : 0.2571
😍TP1 : 0.262
😍TP2 : 0.264
😍TP3 : 0.269
$STX UP ⭐
1
1.3k
🚨$USELESS TRADE SETUP — KEY LEVELS TO WATCH
$USELESS is holding near an important decision zone, with price action now testing a range where momentum could strengthen if buyers maintain control.
📍 Entry Zone: 0.09688 – 0.09819
🛑 Invalidation Level: 0.09069
🎯 Upside Levels:
• TP1: 0.10040
• TP2: 0.11200
🔥 Why traders are watching this:
Price is sitting near a defined support area
A move above the entry zone may bring short-term momentum
Are you watching $USELESS here, or waiting for more confirmation?
{future}(USELESSUSDT)
🚨$USELESS TRADE SETUP — KEY LEVELS TO WATCH
$USELESS is holding near an important decision zone, with price action now testing a range where momentum could strengthen if buyers maintain control.
📍 Entry Zone: 0.09688 – 0.09819
🛑 Invalidation Level: 0.09069
🎯 Upside Levels:
• TP1: 0.10040
• TP2: 0.11200
🔥 Why traders are watching this:
Price is sitting near a defined support area
A move above the entry zone may bring short-term momentum
Are you watching $USELESS here, or waiting for more confirmation?
$USELESS is holding near an important decision zone, with price action now testing a range where momentum could strengthen if buyers maintain control.
📍 Entry Zone: 0.09688 – 0.09819
🛑 Invalidation Level: 0.09069
🎯 Upside Levels:
• TP1: 0.10040
• TP2: 0.11200
🔥 Why traders are watching this:
Price is sitting near a defined support area
A move above the entry zone may bring short-term momentum
Are you watching $USELESS here, or waiting for more confirmation?
1.7k
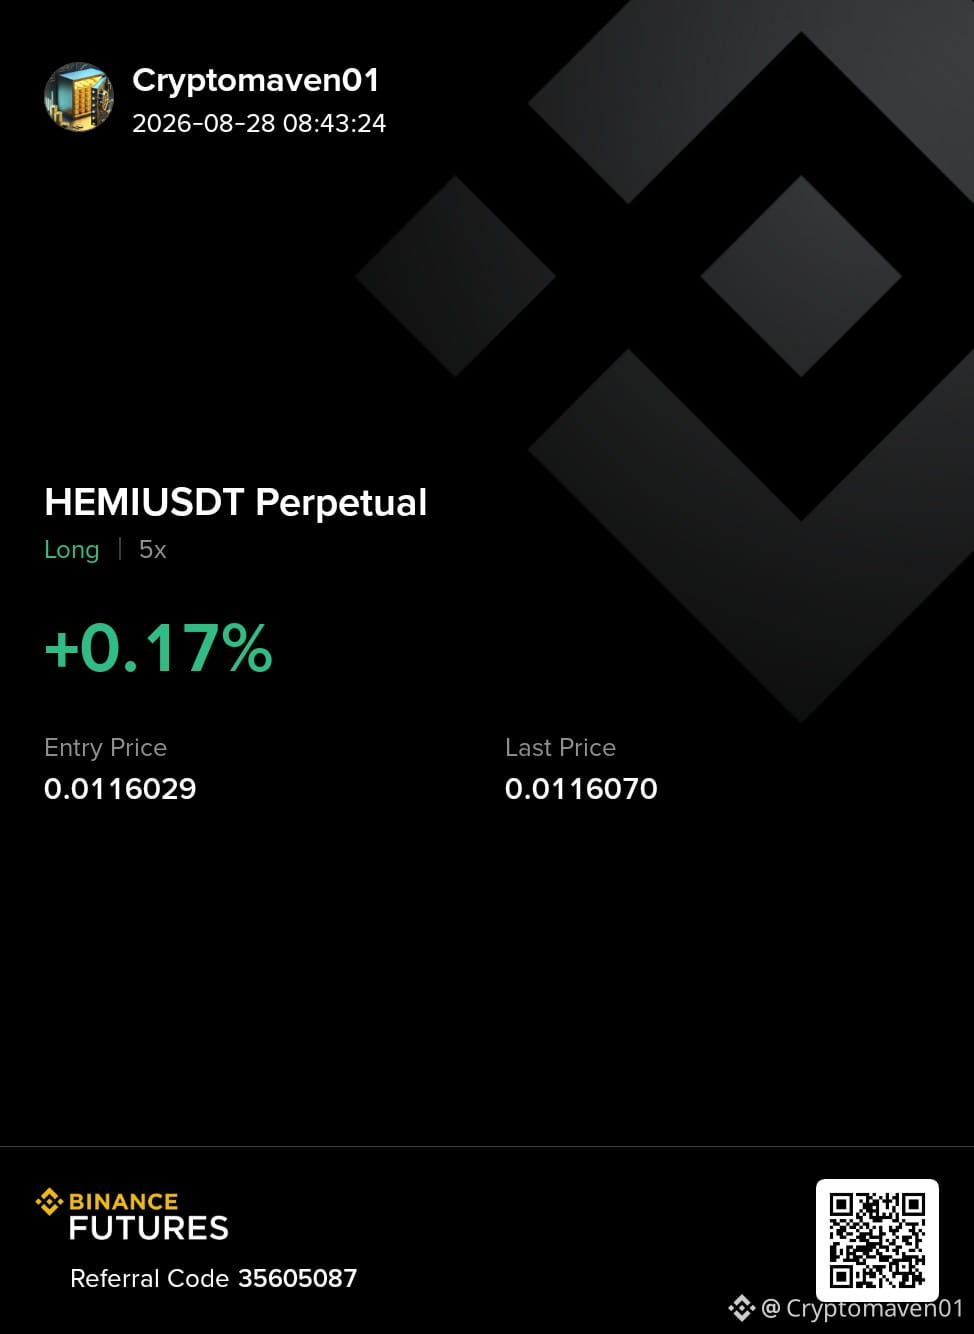
$HEMI LONG SETUP
$HEMI is showing a setup I am watching closely. The plan is to look for a controlled entry within the zone and let the trade develop from there.
🟢 Entry: 0.0116 – 0.01199
🛑 SL: 0.01015
🎯 TP1: 0.0123
🎯 TP2: 0.0154
Risk management comes first — don’t chase the move if price runs away from the entry zone. Wait for confirmation and manage your position accordingly.
Let’s see how $HEMI plays out.
{future}(HEMIUSDT)
$HEMI LONG SETUP
$HEMI is showing a setup I am watching closely. The plan is to look for a controlled entry within the zone and let the trade develop from there.
🟢 Entry: 0.0116 – 0.01199
🛑 SL: 0.01015
🎯 TP1: 0.0123
🎯 TP2: 0.0154
Risk management comes first — don’t chase the move if price runs away from the entry zone. Wait for confirmation and manage your position accordingly.
Let’s see how $HEMI plays out.
$HEMI is showing a setup I am watching closely. The plan is to look for a controlled entry within the zone and let the trade develop from there.
🟢 Entry: 0.0116 – 0.01199
🛑 SL: 0.01015
🎯 TP1: 0.0123
🎯 TP2: 0.0154
Risk management comes first — don’t chase the move if price runs away from the entry zone. Wait for confirmation and manage your position accordingly.
Let’s see how $HEMI plays out.
4
3.8k
·
--
Bullish
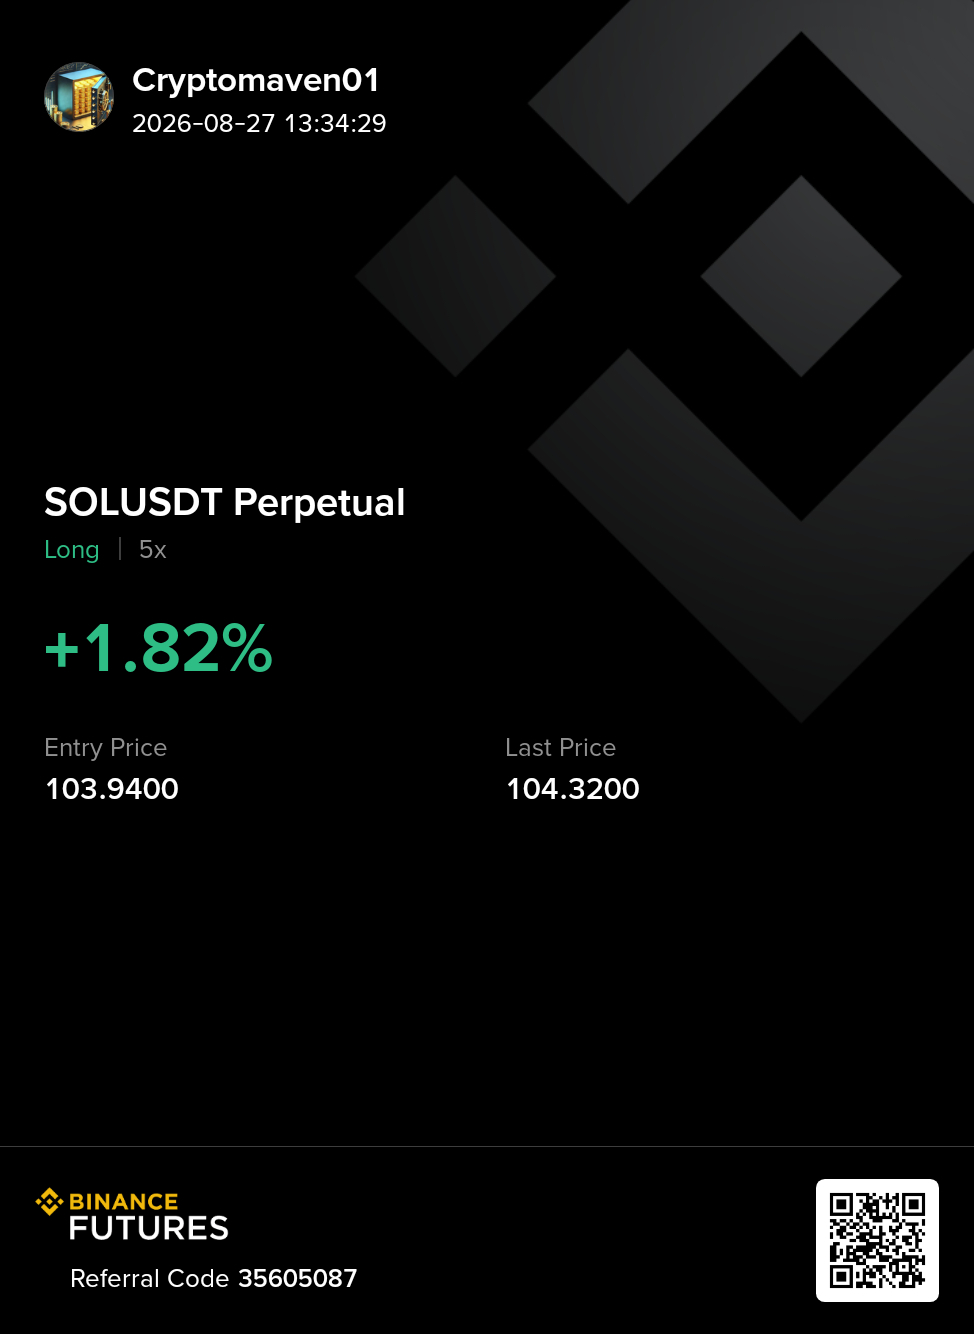
😂LONG on $SOL
😜Long Entry : 103.6 - 104.1
💪SL : 100.54
✅TP1 : 104.8
✅TP2 : 109.1
✅TP3 : 114.0
This is an early setup on $SOL this morning and here we go again
$TUT and more coming.
😂LONG on $SOL
😜Long Entry : 103.6 - 104.1
💪SL : 100.54
✅TP1 : 104.8
✅TP2 : 109.1
✅TP3 : 114.0
This is an early setup on $SOL this morning and here we go again
$TUT and more coming.
😜Long Entry : 103.6 - 104.1
💪SL : 100.54
✅TP1 : 104.8
✅TP2 : 109.1
✅TP3 : 114.0
This is an early setup on $SOL this morning and here we go again
$TUT and more coming.
7
6k
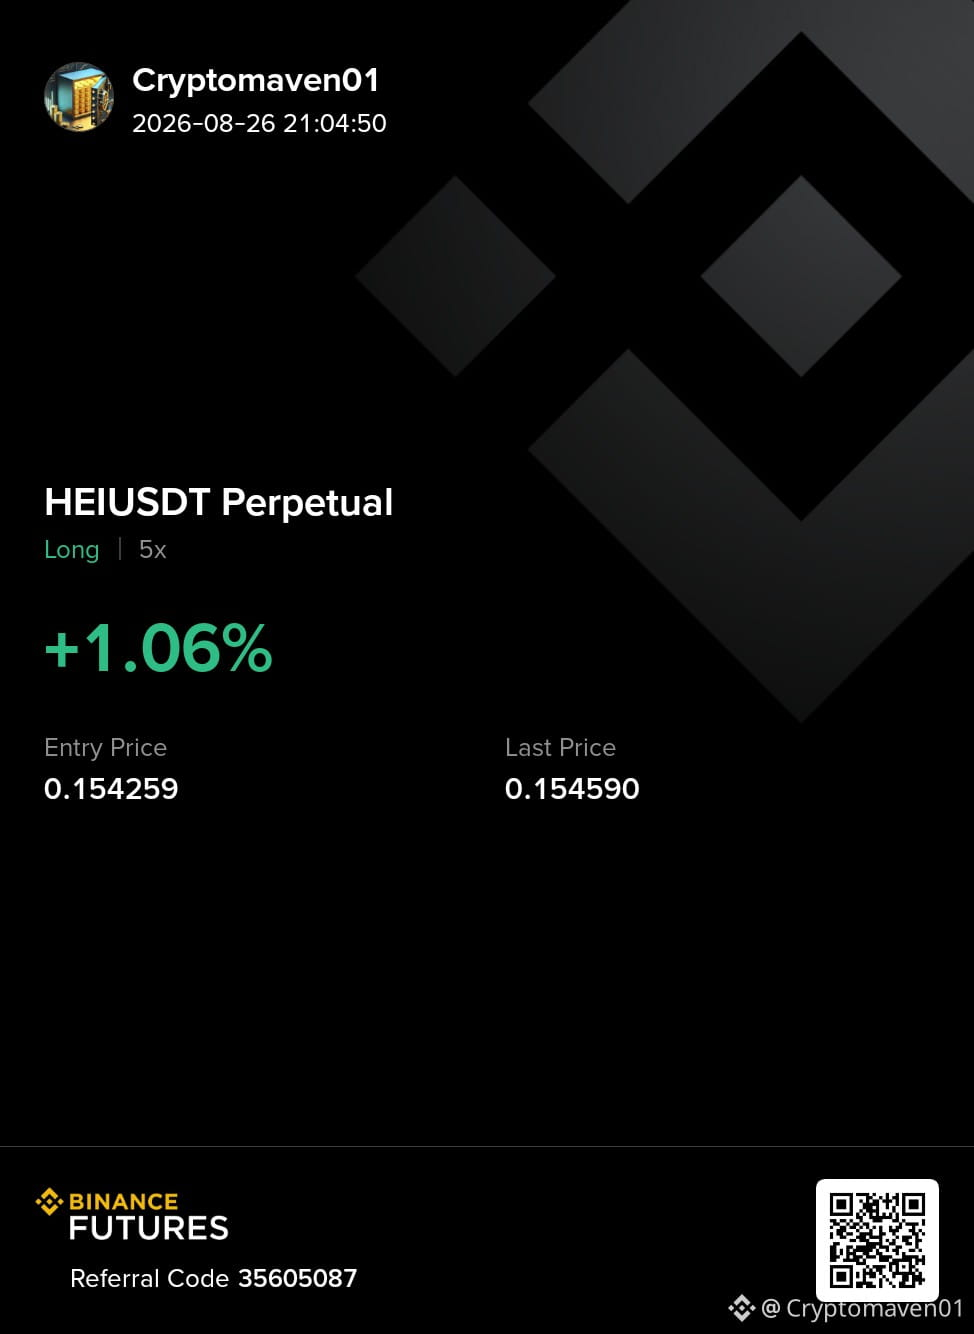
🌟 $HEI LONG SETUP 📈
$HEI/USDT is already up over +20%, showing strong momentum as buyers continue to step in. I’m watching for a continuation from the current levels.
🔥 Entry: 0.1540 – 0.1580
🎯 TP1: 0.1688
🎯 TP2: 0.1700
⚠️ SL: 0.1447
Momentum is strong, but risk management is key. Let’s see if $HEI can push higher. 🚀
🌟 $HEI LONG SETUP 📈
$HEI /USDT is already up over +20%, showing strong momentum as buyers continue to step in. I’m watching for a continuation from the current levels.
🔥 Entry: 0.1540 – 0.1580
🎯 TP1: 0.1688
🎯 TP2: 0.1700
⚠️ SL: 0.1447
Momentum is strong, but risk management is key. Let’s see if $HEI can push higher. 🚀
$HEI /USDT is already up over +20%, showing strong momentum as buyers continue to step in. I’m watching for a continuation from the current levels.
🔥 Entry: 0.1540 – 0.1580
🎯 TP1: 0.1688
🎯 TP2: 0.1700
⚠️ SL: 0.1447
Momentum is strong, but risk management is key. Let’s see if $HEI can push higher. 🚀
3
3.4k
🚨$GPS SHORT SETUP
🔴ENTRY : 0.00949 - 0.009582
❤️SL : 0.0096954
😍TP1 : 0.009348
😍TP2 : 0.009261
{future}(GPSUSDT)
🚨$GPS SHORT SETUP
🔴ENTRY : 0.00949 - 0.009582
❤️SL : 0.0096954
😍TP1 : 0.009348
😍TP2 : 0.009261
🔴ENTRY : 0.00949 - 0.009582
❤️SL : 0.0096954
😍TP1 : 0.009348
😍TP2 : 0.009261
787
🚨 TOP GAINERS ON FUTURES
Some serious moves happening today — but I’m more interested in what happens after the pump.
🔥 $BTR +315%
🚀 $TAC +77%
⚡ $ONG +76%
$BTR is obviously stealing the spotlight, but after a move this big, I wouldn’t blindly chase it.
If you had to watch ONE from here 👇
🟢 $BTR
🔥 $TAC
⚡ $ONG
🚨 TOP GAINERS ON FUTURES
Some serious moves happening today — but I’m more interested in what happens after the pump.
🔥 $BTR +315%
🚀 $TAC +77%
⚡ $ONG +76%
$BTR is obviously stealing the spotlight, but after a move this big, I wouldn’t blindly chase it.
If you had to watch ONE from here 👇
🟢 $BTR
🔥 $TAC
⚡ $ONG
Some serious moves happening today — but I’m more interested in what happens after the pump.
🔥 $BTR +315%
🚀 $TAC +77%
⚡ $ONG +76%
$BTR is obviously stealing the spotlight, but after a move this big, I wouldn’t blindly chase it.
If you had to watch ONE from here 👇
🟢 $BTR
🔥 $TAC
⚡ $ONG
298
🤑 $EDEN LONG SETUP
$EDEN is starting to show strong momentum, and the move is getting interesting. I am watching this setup closely for a potential continuation.
🔥 Entry: 0.0645 – 0.0654
🎯 TP1: 0.0669
🎯 TP2: 0.0837
🎯 TP3: 0.0930
⚠️ SL: 0.0559
The pump may just be getting started. Let’s see if $EDEN can deliver.
🤑 $EDEN LONG SETUP
$EDEN is starting to show strong momentum, and the move is getting interesting. I am watching this setup closely for a potential continuation.
🔥 Entry: 0.0645 – 0.0654
🎯 TP1: 0.0669
🎯 TP2: 0.0837
🎯 TP3: 0.0930
⚠️ SL: 0.0559
The pump may just be getting started. Let’s see if $EDEN can deliver.
$EDEN is starting to show strong momentum, and the move is getting interesting. I am watching this setup closely for a potential continuation.
🔥 Entry: 0.0645 – 0.0654
🎯 TP1: 0.0669
🎯 TP2: 0.0837
🎯 TP3: 0.0930
⚠️ SL: 0.0559
The pump may just be getting started. Let’s see if $EDEN can deliver.
1
2
3.7k
🌟 $STX LONG SETUP 🌟
Looking for a bullish move on $STX as momentum starts to build. I’m watching this entry zone closely rather than chasing the price.
📍 ENTRY: 0.2666 – 0.2688
🎯 TP1: 0.2726
🎯 TP2: 0.2748
🎯 TP3: 0.2814
⚠️ SL: 0.2637
The key is for buyers to defend the entry zone and keep the structure intact. If momentum continues, the higher targets could come into play.
Trade the setup, manage your risk and don't overleverage. 🚀
Who’s watching this one with me?
{future}(STXUSDT)
🌟 $STX LONG SETUP 🌟
Looking for a bullish move on $STX as momentum starts to build. I’m watching this entry zone closely rather than chasing the price.
📍 ENTRY: 0.2666 – 0.2688
🎯 TP1: 0.2726
🎯 TP2: 0.2748
🎯 TP3: 0.2814
⚠️ SL: 0.2637
The key is for buyers to defend the entry zone and keep the structure intact. If momentum continues, the higher targets could come into play.
Trade the setup, manage your risk and don't overleverage. 🚀
Who’s watching this one with me?
Looking for a bullish move on $STX as momentum starts to build. I’m watching this entry zone closely rather than chasing the price.
📍 ENTRY: 0.2666 – 0.2688
🎯 TP1: 0.2726
🎯 TP2: 0.2748
🎯 TP3: 0.2814
⚠️ SL: 0.2637
The key is for buyers to defend the entry zone and keep the structure intact. If momentum continues, the higher targets could come into play.
Trade the setup, manage your risk and don't overleverage. 🚀
Who’s watching this one with me?
1
1.8k
📈 $EUL LONG SETUP
I am watching $EUL for a potential move higher from the current zone. The setup gives me a favorable risk-to-reward structure if the bullish momentum continues.
🟢 Entry: 1.4018 – 1.4083
🛑 Stop Loss: 1.3641
🎯 Take Profits:
TP1 → 1.4493
TP2 → 1.4918
TP3 → 1.5344
The idea here is to catch the continuation rather than chase an extended move. I’ll be watching how price reacts around the entry zone before the setup plays out.
Let’s see if the bulls can deliver. 👀🔥
{future}(EULUSDT)
📈 $EUL LONG SETUP
I am watching $EUL for a potential move higher from the current zone. The setup gives me a favorable risk-to-reward structure if the bullish momentum continues.
🟢 Entry: 1.4018 – 1.4083
🛑 Stop Loss: 1.3641
🎯 Take Profits:
TP1 → 1.4493
TP2 → 1.4918
TP3 → 1.5344
The idea here is to catch the continuation rather than chase an extended move. I’ll be watching how price reacts around the entry zone before the setup plays out.
Let’s see if the bulls can deliver. 👀🔥
I am watching $EUL for a potential move higher from the current zone. The setup gives me a favorable risk-to-reward structure if the bullish momentum continues.
🟢 Entry: 1.4018 – 1.4083
🛑 Stop Loss: 1.3641
🎯 Take Profits:
TP1 → 1.4493
TP2 → 1.4918
TP3 → 1.5344
The idea here is to catch the continuation rather than chase an extended move. I’ll be watching how price reacts around the entry zone before the setup plays out.
Let’s see if the bulls can deliver. 👀🔥
865
🚨 Market movers worth watching 👀
A few names are standing out on the charts right now:
🔥 $PROM — +20%
⚡ $UAI — +4%
🚀 $PORTAL — +2%
Momentum is picking up, but if you could choose just ONE to watch from here…
Which one are you going with? 👇
🚨 Market movers worth watching 👀
A few names are standing out on the charts right now:
🔥 $PROM — +20%
⚡ $UAI — +4%
🚀 $PORTAL — +2%
Momentum is picking up, but if you could choose just ONE to watch from here…
Which one are you going with? 👇
A few names are standing out on the charts right now:
🔥 $PROM — +20%
⚡ $UAI — +4%
🚀 $PORTAL — +2%
Momentum is picking up, but if you could choose just ONE to watch from here…
Which one are you going with? 👇
1
6
16.4k
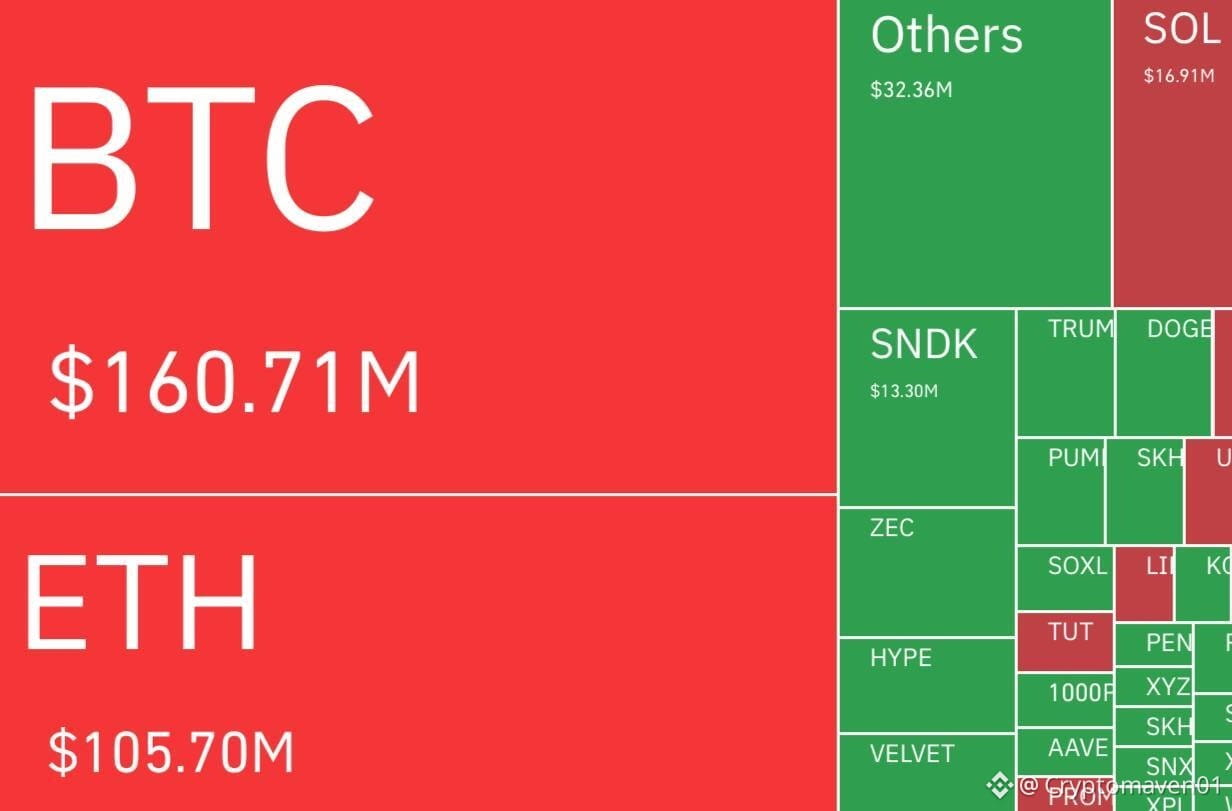
Crypto liquidations hit $439M in the past 24 hours, with longs and shorts nearly evenly split at $221M and $218M.
$BTC $ETH
Crypto liquidations hit $439M in the past 24 hours, with longs and shorts nearly evenly split at $221M and $218M.
$BTC $ETH
$BTC $ETH
153
For those following the setup , $VIRTUAL TP1 and TP2 already hit. Make sure to manage your trades.
For those following the setup , $VIRTUAL TP1 and TP2 already hit. Make sure to manage your trades.
Cryptomaven01
·
--
🟢 $VIRTUAL looking interesting for a long setup.
Entry zone: 0.7516 – 0.7578
Stop Loss: 0.7236
🎯 Targets:
TP1 → 0.7672
TP2 → 0.8045
TP3 → 0.8531
The setup is based on the bullish continuation structure, with multiple confluences currently favoring the upside.
Watching how price reacts around the entry zone before the next move.
Entry zone: 0.7516 – 0.7578
Stop Loss: 0.7236
🎯 Targets:
TP1 → 0.7672
TP2 → 0.8045
TP3 → 0.8531
The setup is based on the bullish continuation structure, with multiple confluences currently favoring the upside.
Watching how price reacts around the entry zone before the next move.
1
2.9k
🟢 $UAI LONG SETUP
Watching the 0.358 – 0.364 zone for entry.
Risk level: 0.3504
🎯 Take Profits:
• 0.3705
• 0.3802
• 0.3981
Keeping an eye on how UAI reacts around the entry area before the move unfolds.
{future}(UAIUSDT)
🟢 $UAI LONG SETUP
Watching the 0.358 – 0.364 zone for entry.
Risk level: 0.3504
🎯 Take Profits:
• 0.3705
• 0.3802
• 0.3981
Keeping an eye on how UAI reacts around the entry area before the move unfolds.
Watching the 0.358 – 0.364 zone for entry.
Risk level: 0.3504
🎯 Take Profits:
• 0.3705
• 0.3802
• 0.3981
Keeping an eye on how UAI reacts around the entry area before the move unfolds.
2
4
5.4k
🟢 $VIRTUAL looking interesting for a long setup.
Entry zone: 0.7516 – 0.7578
Stop Loss: 0.7236
🎯 Targets:
TP1 → 0.7672
TP2 → 0.8045
TP3 → 0.8531
The setup is based on the bullish continuation structure, with multiple confluences currently favoring the upside.
Watching how price reacts around the entry zone before the next move.
{future}(VIRTUALUSDT)
🟢 $VIRTUAL looking interesting for a long setup.
Entry zone: 0.7516 – 0.7578
Stop Loss: 0.7236
🎯 Targets:
TP1 → 0.7672
TP2 → 0.8045
TP3 → 0.8531
The setup is based on the bullish continuation structure, with multiple confluences currently favoring the upside.
Watching how price reacts around the entry zone before the next move.
Entry zone: 0.7516 – 0.7578
Stop Loss: 0.7236
🎯 Targets:
TP1 → 0.7672
TP2 → 0.8045
TP3 → 0.8531
The setup is based on the bullish continuation structure, with multiple confluences currently favoring the upside.
Watching how price reacts around the entry zone before the next move.
1
1
5
19.4k
Ethereum is showing serious strength, but this is also where traders need to stay disciplined.
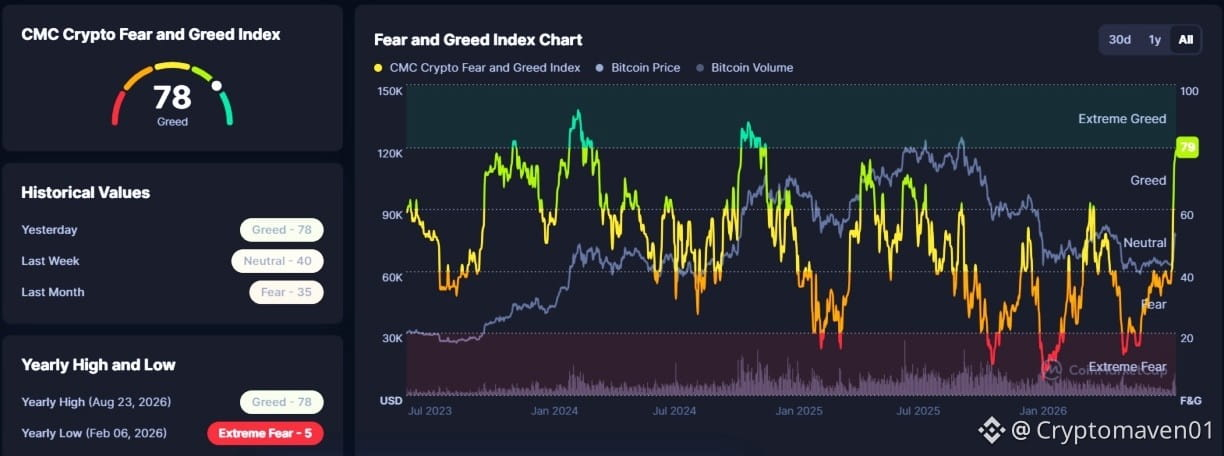
$ETH gained around 30% over the week, while crypto sentiment pushed into extreme greed at 79. That combination tells me the momentum is real, but the risk of a short-term pullback is rising too.
The interesting part is that spot Ethereum ETFs pulled in $697M last week, showing institutional demand is still supporting the move.
For me, $2,500 is the level to watch. A clean break and hold could open the door toward $2,700, while rejection could bring a retest of $2,350 or lower.
Bullish, but I wouldn't chase the candle here. Let the market confirm the next move.
Ethereum is showing serious strength, but this is also where traders need to stay disciplined.
$ETH gained around 30% over the week, while crypto sentiment pushed into extreme greed at 79. That combination tells me the momentum is real, but the risk of a short-term pullback is rising too.
The interesting part is that spot Ethereum ETFs pulled in $697M last week, showing institutional demand is still supporting the move.
For me, $2,500 is the level to watch. A clean break and hold could open the door toward $2,700, while rejection could bring a retest of $2,350 or lower.
Bullish, but I wouldn't chase the candle here. Let the market confirm the next move.
$ETH gained around 30% over the week, while crypto sentiment pushed into extreme greed at 79. That combination tells me the momentum is real, but the risk of a short-term pullback is rising too.
The interesting part is that spot Ethereum ETFs pulled in $697M last week, showing institutional demand is still supporting the move.
For me, $2,500 is the level to watch. A clean break and hold could open the door toward $2,700, while rejection could bring a retest of $2,350 or lower.
Bullish, but I wouldn't chase the candle here. Let the market confirm the next move.
2
4
17.5k
Log in to explore more content
Join global crypto users on Binance Square
⚡️ Get latest and useful information about crypto.
💬 Trusted by the world’s largest crypto exchange.
👍 Discover real insights from verified creators.
Email / Phone number
Trending Topics
SECApprovesNasdaqTexasCommodityTrustRule
11 views
40 Discussing
#secapprovesnasdaqtexascommoditytrustrule
The SEC Has Expanded Crypto Fund Listing Rules. The Details Matter.
A September 3 SEC order approved changes to Nasdaq Texas’s listing standards, adding a “digital commodity” definition and giving qualifying crypto investment products more flexibility.
Under the updated rules:
At least 85% of holdings must remain in eligible assets, cash or cash equivalents.
Up to 15%, in aggregate, may consist of digital commodities or securities that don’t satisfy the standard eligibility criteria.
Active management is now permitted, subject to disclosure and other safeguards.
What about Bitcoin, Ether, Solana and XRP?
The order names them in an example as assets already eligible under the exchange’s rules. That passage should not be presented as a new federal legal classification. The approval concerns listing standards and does not itself approve a particular fund. Similar changes were approved for Nasdaq, NYSE Arca and Cboe BZX in July.
My take: the practical opportunity is broader portfolio design. Issuers could use this flexibility to combine established crypto exposure with limited allocations to additional assets or introduce active strategies.
But product flexibility alone doesn’t tell us whether investors will commit capital. I’m watching which issuers launch products, what they actually hold, their fees, and whether they attract sustained net inflows.
Which product changes would make this rule meaningful for investors?
$VTHO $ZEST $ORDER
溪月 Xīyuè
·0 Likes
·276 views
ECBRaisesRatesSecondTimeTo2.5%
26 views
23 Discussing
USContinuingJoblessClaims1.774M
1,449 views
124 Discussing