
HMastercrypto
212 Posts

HMastercrypto
Report
Block User
لا تستثمر أبدا أكثر مما تستطيع تحمل خسارته.
Occasional Trader
2.4 Years
6 Following
367 Followers
448 Liked
Posts
All
Quotes
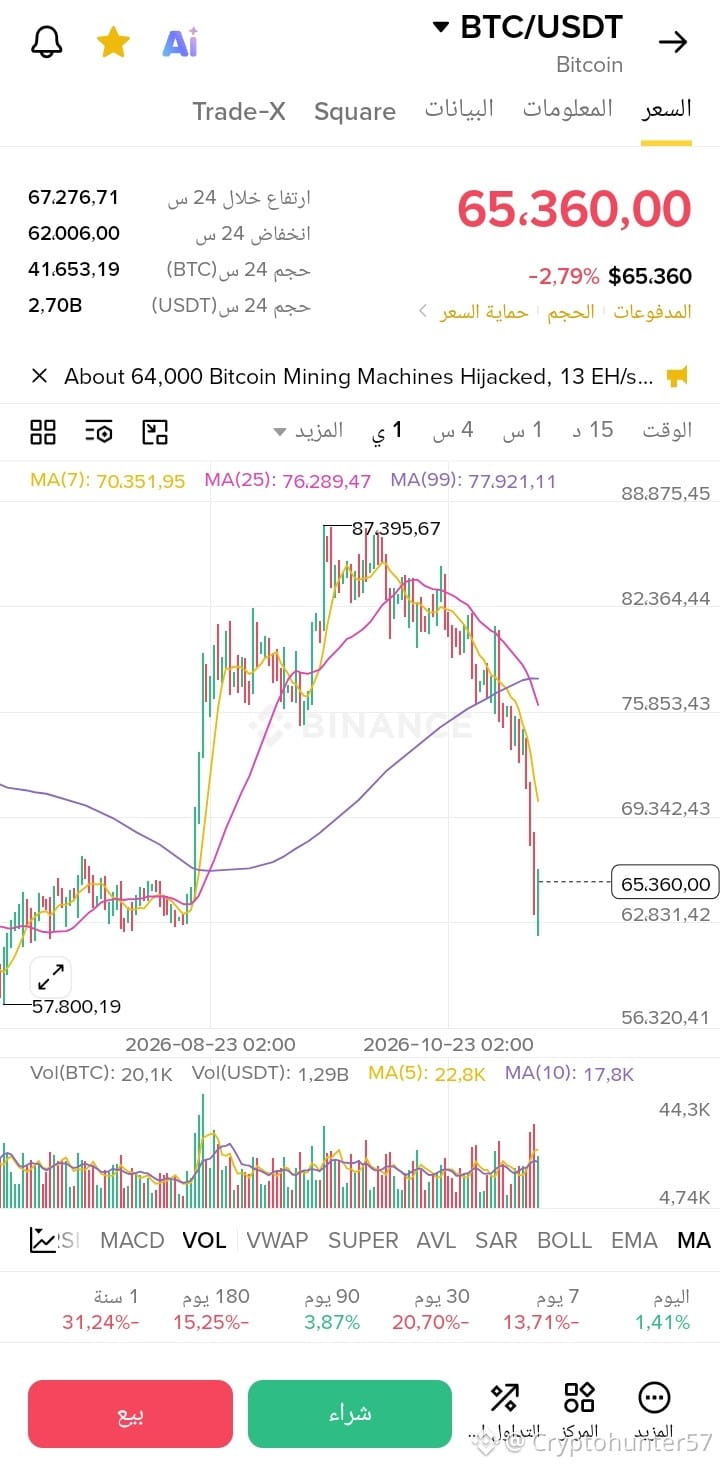
🚨 Bullseye! Bitcoin touches 62k and immediately rebounds! What’s next? 🎯🩸
$BTC $ETH $BNB
{spot}(BTCUSDT)
Everyone, in the previous update we identified the $62,000 area as a potential historic bottom. The market actually touched exactly $62,006 and has now rebounded strongly to $65,300! 🤯
What happened on the chart?
1️⃣ Long lower wick (Rejection): The daily candle shows that sellers tried to break the bottom, but buyers crushed them and pushed the price back up. This means the 62k area is currently “solid ground.”
2️⃣ Short squeeze: The rapid rebound forced those who sold at the bottom to buy back and cover their positions, giving the price this bullish momentum.
3️⃣ The squeeze: Price is now facing strong resistance. The overall trend is still bearish (since we’re below the daily moving averages), but short-term momentum is bullish.
🧱 What’s the plan from here?
· Upside target: For the rebound to continue, price needs to break through the $67,500–$68,500 area (strong resistance). If it succeeds, we could see 70k.
· Downside risk: If price fails to break through 68k and starts losing momentum, it’s expected to retest the $62,000 area. A break below 62k would open the door to further downside.
Do you expect this rebound to continue and break through 68k, or is this just an opportunity for sellers to enter again? 👇💬
#BinanceSquare #BTC #Bitcoin #Market_Update #Trading #Cryptocurrency #Liquidity #LearnToTrade
🚨 Bullseye! Bitcoin touches 62k and immediately rebounds! What’s next? 🎯🩸
$BTC $ETH $BNB
Everyone, in the previous update we identified the $62,000 area as a potential historic bottom. The market actually touched exactly $62,006 and has now rebounded strongly to $65,300! 🤯
What happened on the chart?
1️⃣ Long lower wick (Rejection): The daily candle shows that sellers tried to break the bottom, but buyers crushed them and pushed the price back up. This means the 62k area is currently “solid ground.”
2️⃣ Short squeeze: The rapid rebound forced those who sold at the bottom to buy back and cover their positions, giving the price this bullish momentum.
3️⃣ The squeeze: Price is now facing strong resistance. The overall trend is still bearish (since we’re below the daily moving averages), but short-term momentum is bullish.
🧱 What’s the plan from here?
· Upside target: For the rebound to continue, price needs to break through the $67,500–$68,500 area (strong resistance). If it succeeds, we could see 70k.
· Downside risk: If price fails to break through 68k and starts losing momentum, it’s expected to retest the $62,000 area. A break below 62k would open the door to further downside.
Do you expect this rebound to continue and break through 68k, or is this just an opportunity for sellers to enter again? 👇💬
#BinanceSquare #BTC #Bitcoin #Market_Update #Trading #Cryptocurrency #Liquidity #LearnToTrade
$BTC $ETH $BNB
Everyone, in the previous update we identified the $62,000 area as a potential historic bottom. The market actually touched exactly $62,006 and has now rebounded strongly to $65,300! 🤯
What happened on the chart?
1️⃣ Long lower wick (Rejection): The daily candle shows that sellers tried to break the bottom, but buyers crushed them and pushed the price back up. This means the 62k area is currently “solid ground.”
2️⃣ Short squeeze: The rapid rebound forced those who sold at the bottom to buy back and cover their positions, giving the price this bullish momentum.
3️⃣ The squeeze: Price is now facing strong resistance. The overall trend is still bearish (since we’re below the daily moving averages), but short-term momentum is bullish.
🧱 What’s the plan from here?
· Upside target: For the rebound to continue, price needs to break through the $67,500–$68,500 area (strong resistance). If it succeeds, we could see 70k.
· Downside risk: If price fails to break through 68k and starts losing momentum, it’s expected to retest the $62,000 area. A break below 62k would open the door to further downside.
Do you expect this rebound to continue and break through 68k, or is this just an opportunity for sellers to enter again? 👇💬
#BinanceSquare #BTC #Bitcoin #Market_Update #Trading #Cryptocurrency #Liquidity #LearnToTrade
50
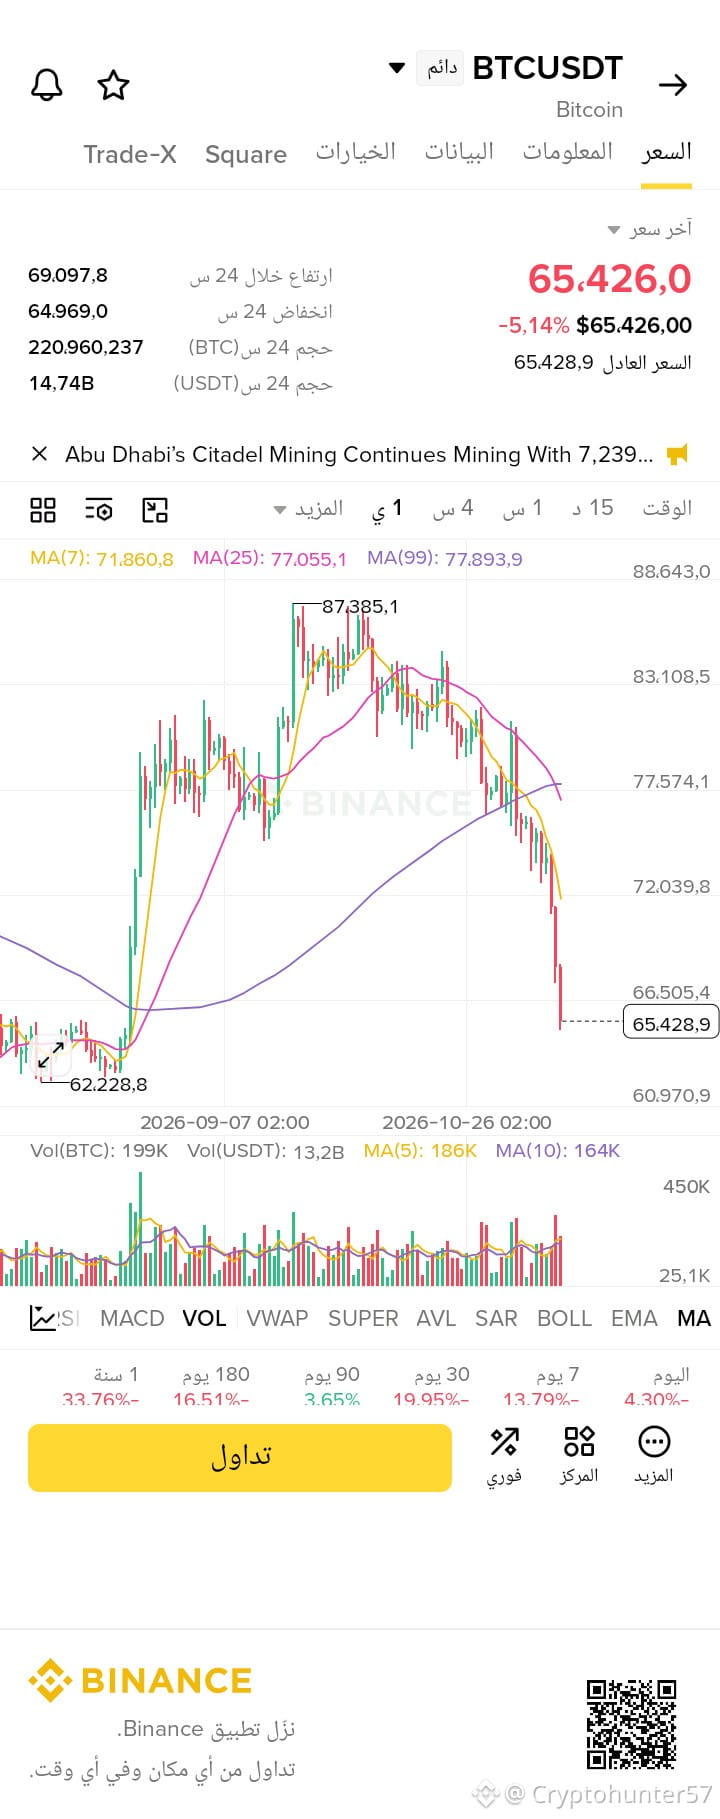
🚨 The biggest update: The scenario is unfolding exactly as predicted! Bitcoin hits 65k! What’s next? 🩸🎯
$BTC $ETH $BNB
{spot}(BTCUSDT)
Guys, in the previous post, we predicted a “liquidity hunt” and said the market would drop sharply (60k–67k) to liquidate buyers.
The result? The price plunged to $64,969! 🤯
The chart now shows a crash with huge red candles, and as you can see in the news (above the chart), whales opened massive short positions at $65,720. But always remember: when everyone agrees to sell, a reversal happens!
Here’s the plan for what comes next (the expected scenario):
1️⃣ Where’s the bottom?
The current price is at 65k. The previous historical low (in September) was at $62,200. If the price breaks below 65k, that’s our next target, and it would be an ideal bounce zone.
2️⃣ When do we go up? (Short liquidations)
The whales who opened short positions (selling) are now at risk if the price bounces. Any strong green candle will force them to buy back to cover their positions (a short squeeze), pushing the price soaring upward.
3️⃣ Forming the third peak:
We’ll use this upcoming bounce to form the “third peak” (the bullish trap) around 70k–72k, after which the market will return to its downward trend.
Liquidity is the game, and patience is the weapon. Do you expect a bounce from 65k, or will we see 62k first? 👇💬
#BinanceSquare #BTC #Bitcoin #MarketUpdate #Trading #Cryptocurrency #Liquidity #LearnToTrade
🚨 The biggest update: The scenario is unfolding exactly as predicted! Bitcoin hits 65k! What’s next? 🩸🎯
$BTC $ETH $BNB
Guys, in the previous post, we predicted a “liquidity hunt” and said the market would drop sharply (60k–67k) to liquidate buyers.
The result? The price plunged to $64,969! 🤯
The chart now shows a crash with huge red candles, and as you can see in the news (above the chart), whales opened massive short positions at $65,720. But always remember: when everyone agrees to sell, a reversal happens!
Here’s the plan for what comes next (the expected scenario):
1️⃣ Where’s the bottom?
The current price is at 65k. The previous historical low (in September) was at $62,200. If the price breaks below 65k, that’s our next target, and it would be an ideal bounce zone.
2️⃣ When do we go up? (Short liquidations)
The whales who opened short positions (selling) are now at risk if the price bounces. Any strong green candle will force them to buy back to cover their positions (a short squeeze), pushing the price soaring upward.
3️⃣ Forming the third peak:
We’ll use this upcoming bounce to form the “third peak” (the bullish trap) around 70k–72k, after which the market will return to its downward trend.
Liquidity is the game, and patience is the weapon. Do you expect a bounce from 65k, or will we see 62k first? 👇💬
#BinanceSquare #BTC #Bitcoin #MarketUpdate #Trading #Cryptocurrency #Liquidity #LearnToTrade
$BTC $ETH $BNB
Guys, in the previous post, we predicted a “liquidity hunt” and said the market would drop sharply (60k–67k) to liquidate buyers.
The result? The price plunged to $64,969! 🤯
The chart now shows a crash with huge red candles, and as you can see in the news (above the chart), whales opened massive short positions at $65,720. But always remember: when everyone agrees to sell, a reversal happens!
Here’s the plan for what comes next (the expected scenario):
1️⃣ Where’s the bottom?
The current price is at 65k. The previous historical low (in September) was at $62,200. If the price breaks below 65k, that’s our next target, and it would be an ideal bounce zone.
2️⃣ When do we go up? (Short liquidations)
The whales who opened short positions (selling) are now at risk if the price bounces. Any strong green candle will force them to buy back to cover their positions (a short squeeze), pushing the price soaring upward.
3️⃣ Forming the third peak:
We’ll use this upcoming bounce to form the “third peak” (the bullish trap) around 70k–72k, after which the market will return to its downward trend.
Liquidity is the game, and patience is the weapon. Do you expect a bounce from 65k, or will we see 62k first? 👇💬
#BinanceSquare #BTC #Bitcoin #MarketUpdate #Trading #Cryptocurrency #Liquidity #LearnToTrade
2
2
3.4k
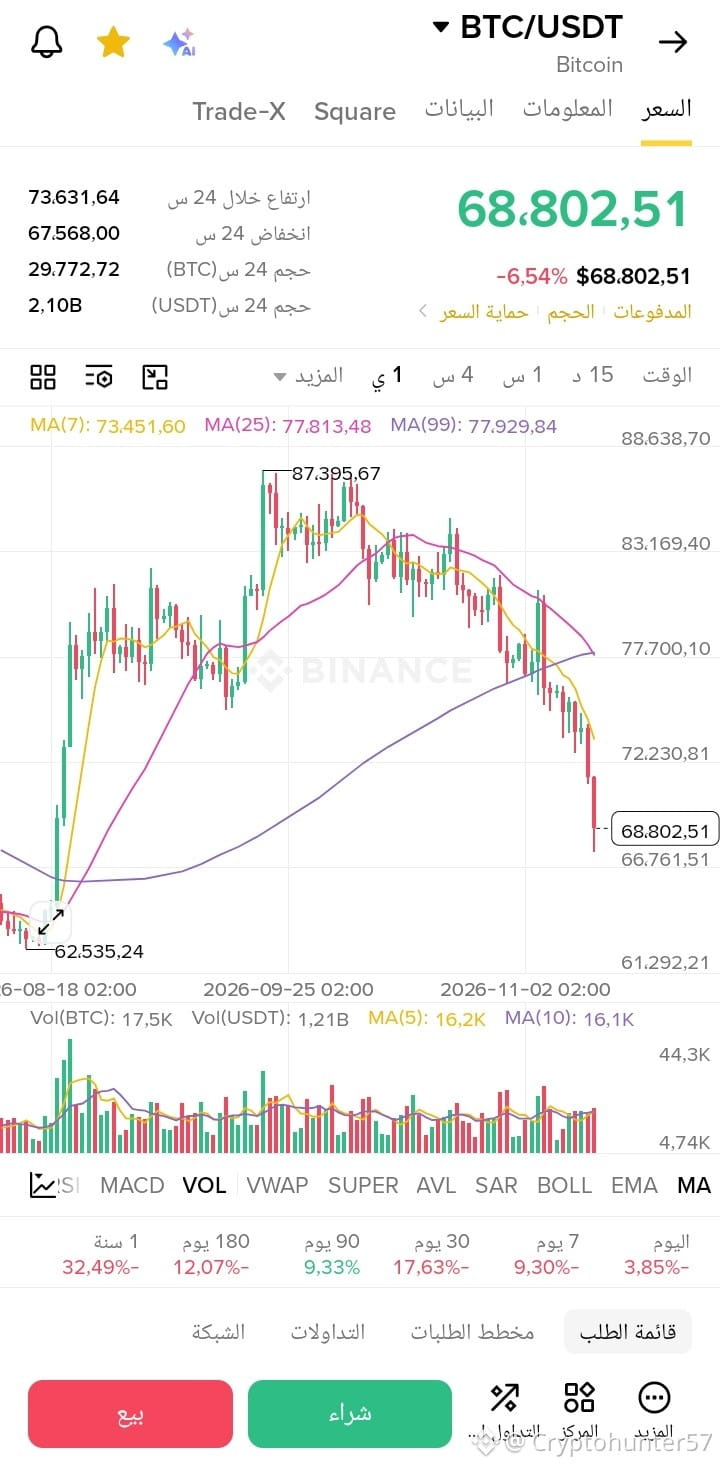
🔥 Mark the date: The “liquidity hunt” scenario played out 100%! What’s next? 🎯🩸 $BTC
{spot}(BTCUSDT)
Guys, in the previous update we discussed the “liquidity hunt” theory and said the market could drop sharply (a fast red candle) toward the 60k–67k zones to liquidate buyers before rebounding.
And the result? The market played out the scenario exactly! 🤯
Bitcoin crashed sharply and reached exactly $67,568, with enormous trading volume (more than $2 billion), meaning the market cleared out all the leveraged buy orders in that area.
Now, we’re experiencing the “reversal” moment:
The price rebounded quickly from 67.5k and is now at 68.8k. This is exactly what we expected: a “short squeeze” is beginning now.
🧱 What are the next steps toward the “third peak”?
Our goal now is to monitor the rebound. For the short-term bullish scenario (toward 76k–80k) to be confirmed, we need to see:
1. A 4-hour candle close above $69,500.
2. A breakout above the first resistance zone at $71,000.
3. If the price succeeds, we’ll see a modest rally to form the third peak (the trap) before returning to the downtrend.
#BearMarke #TradingCommunity
🔥 Mark the date: The “liquidity hunt” scenario played out 100%! What’s next? 🎯🩸 $BTC
Guys, in the previous update we discussed the “liquidity hunt” theory and said the market could drop sharply (a fast red candle) toward the 60k–67k zones to liquidate buyers before rebounding.
And the result? The market played out the scenario exactly! 🤯
Bitcoin crashed sharply and reached exactly $67,568, with enormous trading volume (more than $2 billion), meaning the market cleared out all the leveraged buy orders in that area.
Now, we’re experiencing the “reversal” moment:
The price rebounded quickly from 67.5k and is now at 68.8k. This is exactly what we expected: a “short squeeze” is beginning now.
🧱 What are the next steps toward the “third peak”?
Our goal now is to monitor the rebound. For the short-term bullish scenario (toward 76k–80k) to be confirmed, we need to see:
1. A 4-hour candle close above $69,500.
2. A breakout above the first resistance zone at $71,000.
3. If the price succeeds, we’ll see a modest rally to form the third peak (the trap) before returning to the downtrend.
#BearMarke #TradingCommunity
Guys, in the previous update we discussed the “liquidity hunt” theory and said the market could drop sharply (a fast red candle) toward the 60k–67k zones to liquidate buyers before rebounding.
And the result? The market played out the scenario exactly! 🤯
Bitcoin crashed sharply and reached exactly $67,568, with enormous trading volume (more than $2 billion), meaning the market cleared out all the leveraged buy orders in that area.
Now, we’re experiencing the “reversal” moment:
The price rebounded quickly from 67.5k and is now at 68.8k. This is exactly what we expected: a “short squeeze” is beginning now.
🧱 What are the next steps toward the “third peak”?
Our goal now is to monitor the rebound. For the short-term bullish scenario (toward 76k–80k) to be confirmed, we need to see:
1. A 4-hour candle close above $69,500.
2. A breakout above the first resistance zone at $71,000.
3. If the price succeeds, we’ll see a modest rally to form the third peak (the trap) before returning to the downtrend.
#BearMarke #TradingCommunity
HMastercrypto
·
--
🚨 The “Liquidity Hunt” Theory: Why Might We Drop Sharply Before We Rise?! 🩸🎯
Everyone, after discussing this with some sharp followers, we’ve come up with a very concerning scenario that explains what the market might do in the coming days. The market doesn’t move randomly—it’s looking for “liquidity”!
Here’s the expected scenario on the daily timeframe (based on the current price action at the peaks):
1️⃣ We already have two peaks: the market reached a peak at 87k and a lower high at 81k. For the bearish pattern to be complete, the market needs a “third peak.”
Here’s the expected scenario on the daily timeframe (based on the current price action at the peaks):
1️⃣ We already have two peaks: the market reached a peak at 87k and a lower high at 81k. For the bearish pattern to be complete, the market needs a “third peak.”
97
🚨 The “Liquidity Hunt” Theory: Why Might We Drop Sharply Before We Rise?! 🩸🎯Everyone, after discussing this with some sharp followers, we’ve come up with a very concerning scenario that explains what the market might do in the coming days. The market doesn’t move randomly—it’s looking for “liquidity”!
Here’s the expected scenario on the daily timeframe (based on the current price action at the peaks):
1️⃣ We already have two peaks: the market reached a peak at 87k and a lower high at 81k. For the bearish pattern to be complete, the market needs a “third peak.”
🚨 The “Liquidity Hunt” Theory: Why Might We Drop Sharply Before We Rise?! 🩸🎯
Everyone, after discussing this with some sharp followers, we’ve come up with a very concerning scenario that explains what the market might do in the coming days. The market doesn’t move randomly—it’s looking for “liquidity”!
Here’s the expected scenario on the daily timeframe (based on the current price action at the peaks):
1️⃣ We already have two peaks: the market reached a peak at 87k and a lower high at 81k. For the bearish pattern to be complete, the market needs a “third peak.”
Here’s the expected scenario on the daily timeframe (based on the current price action at the peaks):
1️⃣ We already have two peaks: the market reached a peak at 87k and a lower high at 81k. For the bearish pattern to be complete, the market needs a “third peak.”
1
1
81
🚨 Urgent update: Bitcoin breaks below 73,000! Are we heading to 70,000? 🩸📉Everyone, the market proves every day that technical analysis is the true compass. In the previous update, we said: "Breaking 75,500 means heading to 73,000." And now the price has broken that level and reached $72,727! 😱
The current picture on the charts is not good. To put it simply:
1️⃣ Freefall: The price dropped sharply and rapidly, with extremely large selling volume bars. This means there is panic and position liquidation.
🚨 Urgent update: Bitcoin breaks below 73,000! Are we heading to 70,000? 🩸📉
Everyone, the market proves every day that technical analysis is the true compass. In the previous update, we said: "Breaking 75,500 means heading to 73,000." And now the price has broken that level and reached $72,727! 😱
The current picture on the charts is not good. To put it simply:
1️⃣ Freefall: The price dropped sharply and rapidly, with extremely large selling volume bars. This means there is panic and position liquidation.
The current picture on the charts is not good. To put it simply:
1️⃣ Freefall: The price dropped sharply and rapidly, with extremely large selling volume bars. This means there is panic and position liquidation.
1
132
🚨 Urgent update: Bitcoin breaks support! Have we reached the bottom? 📉🧐Everyone, the market is proving once again today that technical analysis and chart study are more than just talk. In the previous post, we warned you and said exactly: "If the price breaks below $75,500, the next target is $73,000."
And that is exactly what happened! The price plunged today and already hit a low of $73,510. It is now trying to catch its breath and is trading around $74,600.
🚨 Urgent update: Bitcoin breaks support! Have we reached the bottom? 📉🧐
Everyone, the market is proving once again today that technical analysis and chart study are more than just talk. In the previous post, we warned you and said exactly: "If the price breaks below $75,500, the next target is $73,000."
And that is exactly what happened! The price plunged today and already hit a low of $73,510. It is now trying to catch its breath and is trading around $74,600.
And that is exactly what happened! The price plunged today and already hit a low of $73,510. It is now trying to catch its breath and is trading around $74,600.
160
🔄 Important Update: What Happened After Our Last Analysis, and What Should We Do Now? 🧐📉$BTC $BNB $ADA
Everyone, in the previous post we discussed two scenarios and specifically warned that Bitcoin (BTC) was weak, and that failing to hold above $80,000 would inevitably lead us to test the $75,700 area.
Today, the chart confirmed the accuracy of this forecast. The price plunged sharply and already touched $75,568. It is now trading around $76,500 (down nearly 5%).
🔄 Important Update: What Happened After Our Last Analysis, and What Should We Do Now? 🧐📉
$BTC $BNB $ADA
Everyone, in the previous post we discussed two scenarios and specifically warned that Bitcoin (BTC) was weak, and that failing to hold above $80,000 would inevitably lead us to test the $75,700 area.
Today, the chart confirmed the accuracy of this forecast. The price plunged sharply and already touched $75,568. It is now trading around $76,500 (down nearly 5%).
Everyone, in the previous post we discussed two scenarios and specifically warned that Bitcoin (BTC) was weak, and that failing to hold above $80,000 would inevitably lead us to test the $75,700 area.
Today, the chart confirmed the accuracy of this forecast. The price plunged sharply and already touched $75,568. It is now trading around $76,500 (down nearly 5%).
3
1.9k
Article
🚨 Bitcoin (BTC) is making a big move! Should we get ready for a breakout or is it just a trap? 🧐📉📈$BTC $ETH $BNB
---
Everyone, we saw some crazy action in the market today! The price suddenly plunged hard, then shot back up at rocket speed. So I wanted to break it all down for you simply and see what the chart is telling us in the long and short term. Follow along 👇
🔭 First: The long-term outlook (the big picture) 🐢
If we look at the weekly chart (which shows us the market’s movement over several months), we’ll see that Bitcoin is still trading below a very important average price line (the purple line).
🚨 Bitcoin (BTC) is making a big move! Should we get ready for a breakout or is it just a trap? 🧐📉📈
$BTC $ETH $BNB
---
Everyone, we saw some crazy action in the market today! The price suddenly plunged hard, then shot back up at rocket speed. So I wanted to break it all down for you simply and see what the chart is telling us in the long and short term. Follow along 👇
🔭 First: The long-term outlook (the big picture) 🐢
If we look at the weekly chart (which shows us the market’s movement over several months), we’ll see that Bitcoin is still trading below a very important average price line (the purple line).
---
Everyone, we saw some crazy action in the market today! The price suddenly plunged hard, then shot back up at rocket speed. So I wanted to break it all down for you simply and see what the chart is telling us in the long and short term. Follow along 👇
🔭 First: The long-term outlook (the big picture) 🐢
If we look at the weekly chart (which shows us the market’s movement over several months), we’ll see that Bitcoin is still trading below a very important average price line (the purple line).
109
Guys, this morning turned out a little better… or am I just being overly optimistic? ☕️
After two days of headaches and dizziness over the Binance news, today we got a little “oxygen”:
$BTC $ADA $PEPE
🔹 The platform resumed withdrawals (at least for coins like BTC, ETH, XRP, and DOGE), and said it had covered 95% of the stolen assets, worth $6.3 billion. The remaining 5% are less liquid assets and may take time.
🔹 In the first 3 hours after withdrawals reopened, nearly $2 billion flowed out of the platform — a big number, but understandable after withdrawals were frozen for two days.
🔹 Bitcoin caught its breath again above $78,000 (trading near $78,100), after falling to the $76,000 range last week.
🔹 A small surprise: Ethereum recovered better than Bitcoin over 24 hours, and the ETH/BTC pair rose by 0.79%.
But let’s be honest: the market is still nervous. One analyst had expected a big “pump” on Sunday to push prices up, and it didn’t happen the way they imagined. Some people are still scared, while others see an opportunity.
The important thing is, don’t trade based on news alone, and keep your stop-loss close. And of course, this isn’t investment advice.
#BinanceUpdatesProofofReservesAddresses #CryptoNews #أهم_ألاخبار #سوق_الكريبتو
Guys, this morning turned out a little better… or am I just being overly optimistic? ☕️
After two days of headaches and dizziness over the Binance news, today we got a little “oxygen”:
$BTC $ADA $PEPE
🔹 The platform resumed withdrawals (at least for coins like BTC, ETH, XRP, and DOGE), and said it had covered 95% of the stolen assets, worth $6.3 billion. The remaining 5% are less liquid assets and may take time.
🔹 In the first 3 hours after withdrawals reopened, nearly $2 billion flowed out of the platform — a big number, but understandable after withdrawals were frozen for two days.
🔹 Bitcoin caught its breath again above $78,000 (trading near $78,100), after falling to the $76,000 range last week.
🔹 A small surprise: Ethereum recovered better than Bitcoin over 24 hours, and the ETH/BTC pair rose by 0.79%.
But let’s be honest: the market is still nervous. One analyst had expected a big “pump” on Sunday to push prices up, and it didn’t happen the way they imagined. Some people are still scared, while others see an opportunity.
The important thing is, don’t trade based on news alone, and keep your stop-loss close. And of course, this isn’t investment advice.
#BinanceUpdatesProofofReservesAddresses #CryptoNews #أهم_ألاخبار #سوق_الكريبتو
After two days of headaches and dizziness over the Binance news, today we got a little “oxygen”:
$BTC $ADA $PEPE
🔹 The platform resumed withdrawals (at least for coins like BTC, ETH, XRP, and DOGE), and said it had covered 95% of the stolen assets, worth $6.3 billion. The remaining 5% are less liquid assets and may take time.
🔹 In the first 3 hours after withdrawals reopened, nearly $2 billion flowed out of the platform — a big number, but understandable after withdrawals were frozen for two days.
🔹 Bitcoin caught its breath again above $78,000 (trading near $78,100), after falling to the $76,000 range last week.
🔹 A small surprise: Ethereum recovered better than Bitcoin over 24 hours, and the ETH/BTC pair rose by 0.79%.
But let’s be honest: the market is still nervous. One analyst had expected a big “pump” on Sunday to push prices up, and it didn’t happen the way they imagined. Some people are still scared, while others see an opportunity.
The important thing is, don’t trade based on news alone, and keep your stop-loss close. And of course, this isn’t investment advice.
#BinanceUpdatesProofofReservesAddresses #CryptoNews #أهم_ألاخبار #سوق_الكريبتو
110
Guys, let’s talk a little about what’s happened over the past couple of days… Honestly, the market hasn’t given us a moment to breathe 🙃
$BTC $ZEC $BNB
From what’s been circulating, Binance was hit by a massive hack, with figures so huge they make you stop and ask: okay… what’s_next?
The important thing is, the market didn’t wait around: Bitcoin dropped below $77,000, BNB fell by around 5%, and a lot of people were liquidated within 24 hours — more than 82,000 traders, with liquidations nearing $1.35 billion, mostly long positions.
Binance, for its part, said it had frozen around $3 billion and pledged to cover the losses with its own funds, not customers’ money. CZ also said they have a stake in SpaceX worth over $1 billion as an additional reserve, and denied any talk of selling it or targeting Musk.
Honestly? The situation is a little scary, and the Fear and Greed Index has fallen into the fear zone. But at the same time, there are positive inflows into spot BTC ETFs, which means some people see the dip as an opportunity.
So here’s the question: Is trust in centralized exchanges returning, or are people starting to seriously consider self-custody? 🤔
Personally, I don’t like trading emotionally, especially on days like these. Stop-losses and position sizing matter more than any analysis.
And a quick reminder: this isn’t investment advice, and make sure to verify news through official sources before making any decisions.
#Binance #CryptoNewss #أخبار_الكريبتو
Guys, let’s talk a little about what’s happened over the past couple of days… Honestly, the market hasn’t given us a moment to breathe 🙃
$BTC $ZEC $BNB
From what’s been circulating, Binance was hit by a massive hack, with figures so huge they make you stop and ask: okay… what’s_next?
The important thing is, the market didn’t wait around: Bitcoin dropped below $77,000, BNB fell by around 5%, and a lot of people were liquidated within 24 hours — more than 82,000 traders, with liquidations nearing $1.35 billion, mostly long positions.
Binance, for its part, said it had frozen around $3 billion and pledged to cover the losses with its own funds, not customers’ money. CZ also said they have a stake in SpaceX worth over $1 billion as an additional reserve, and denied any talk of selling it or targeting Musk.
Honestly? The situation is a little scary, and the Fear and Greed Index has fallen into the fear zone. But at the same time, there are positive inflows into spot BTC ETFs, which means some people see the dip as an opportunity.
So here’s the question: Is trust in centralized exchanges returning, or are people starting to seriously consider self-custody? 🤔
Personally, I don’t like trading emotionally, especially on days like these. Stop-losses and position sizing matter more than any analysis.
And a quick reminder: this isn’t investment advice, and make sure to verify news through official sources before making any decisions.
#Binance #CryptoNewss #أخبار_الكريبتو
$BTC $ZEC $BNB
From what’s been circulating, Binance was hit by a massive hack, with figures so huge they make you stop and ask: okay… what’s_next?
The important thing is, the market didn’t wait around: Bitcoin dropped below $77,000, BNB fell by around 5%, and a lot of people were liquidated within 24 hours — more than 82,000 traders, with liquidations nearing $1.35 billion, mostly long positions.
Binance, for its part, said it had frozen around $3 billion and pledged to cover the losses with its own funds, not customers’ money. CZ also said they have a stake in SpaceX worth over $1 billion as an additional reserve, and denied any talk of selling it or targeting Musk.
Honestly? The situation is a little scary, and the Fear and Greed Index has fallen into the fear zone. But at the same time, there are positive inflows into spot BTC ETFs, which means some people see the dip as an opportunity.
So here’s the question: Is trust in centralized exchanges returning, or are people starting to seriously consider self-custody? 🤔
Personally, I don’t like trading emotionally, especially on days like these. Stop-losses and position sizing matter more than any analysis.
And a quick reminder: this isn’t investment advice, and make sure to verify news through official sources before making any decisions.
#Binance #CryptoNewss #أخبار_الكريبتو
77
·
--
Bearish
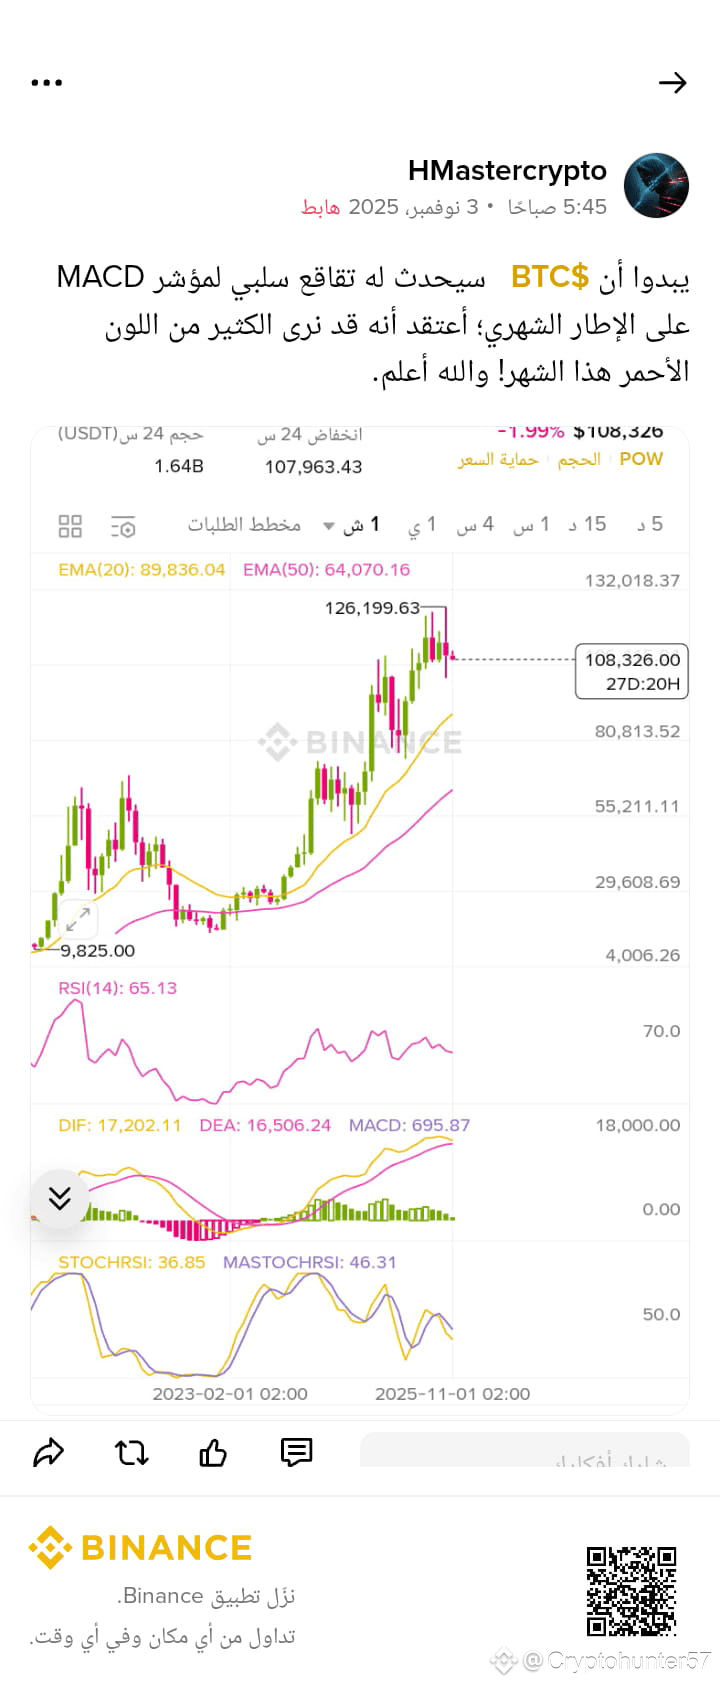
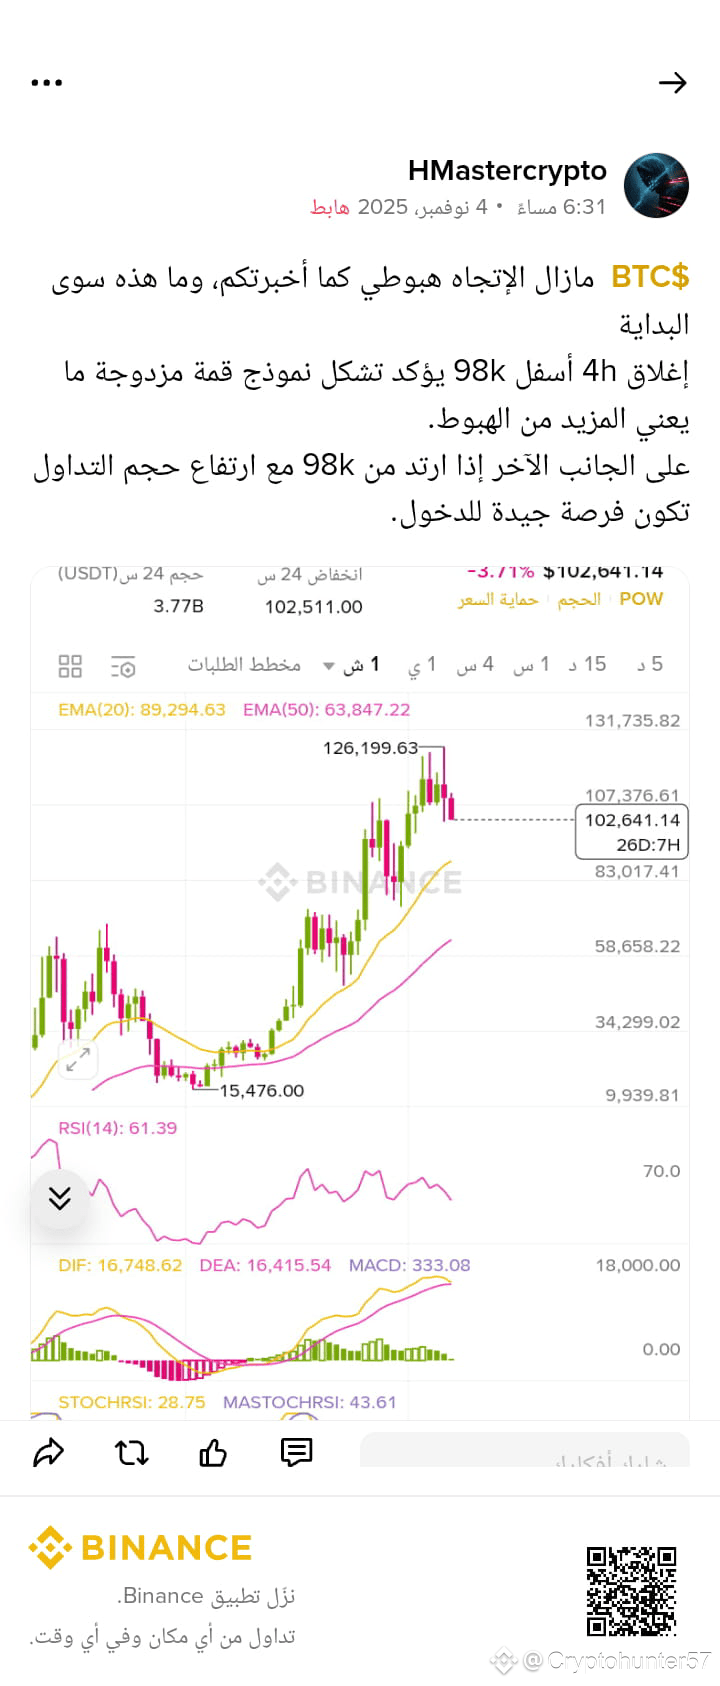
I warned about the drop twice
And look at the publication date to verify
$BTC
I warned about the drop twice
And look at the publication date to verify
$BTC
And look at the publication date to verify
$BTC
1
119
·
--
Bearish
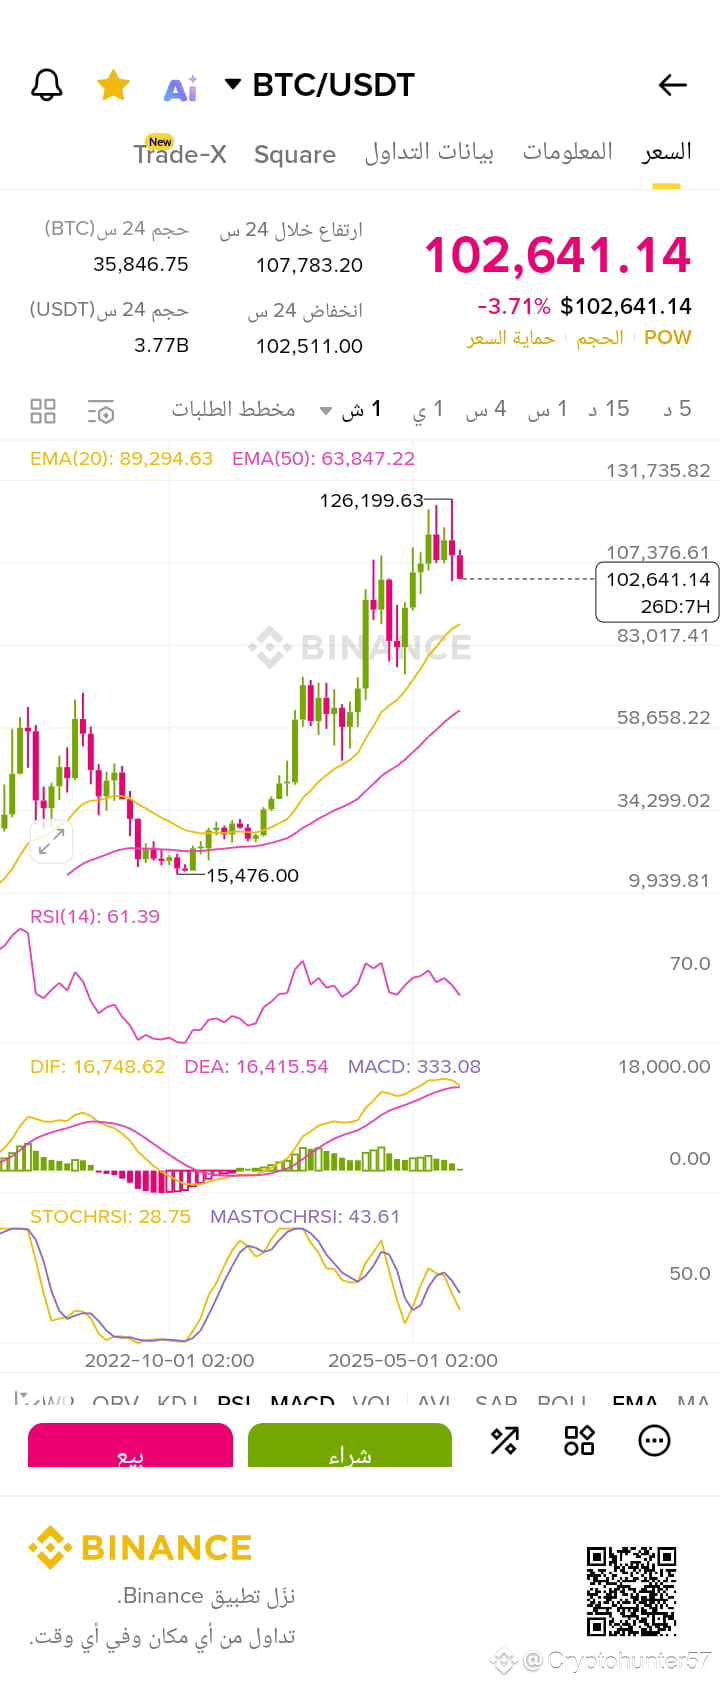
$BTC The trend is still bearish as I have informed you, and this is just the beginning.
A 4h close below 98k confirms the formation of a double top pattern which means more downward movement.
On the other hand, if it bounces from 98k with an increase in trading volume, it presents a good opportunity to enter.
$BTC The trend is still bearish as I have informed you, and this is just the beginning.
A 4h close below 98k confirms the formation of a double top pattern which means more downward movement.
On the other hand, if it bounces from 98k with an increase in trading volume, it presents a good opportunity to enter.
A 4h close below 98k confirms the formation of a double top pattern which means more downward movement.
On the other hand, if it bounces from 98k with an increase in trading volume, it presents a good opportunity to enter.
HMastercrypto
·
--
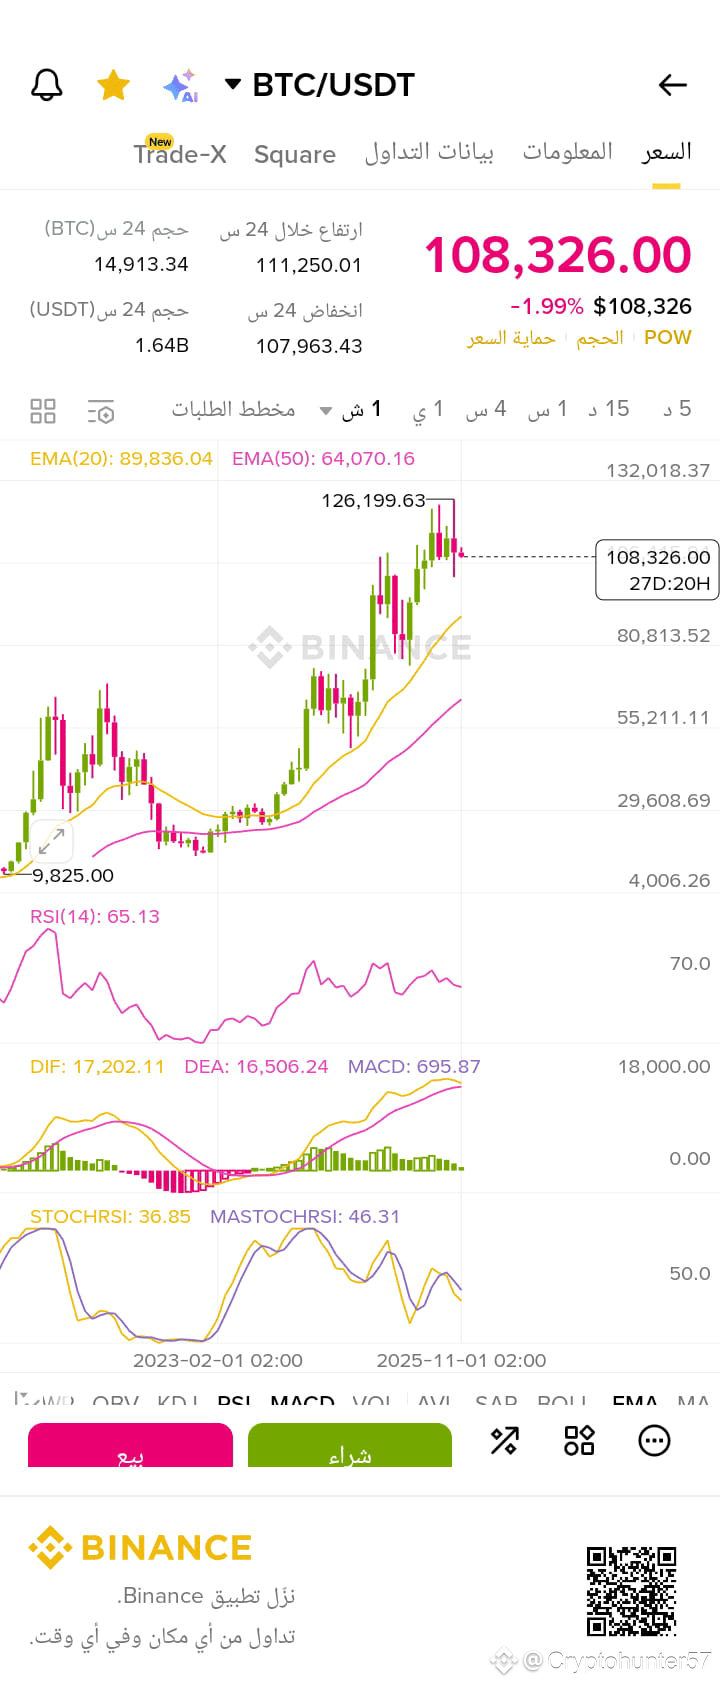
BearishIt seems that $BTC will experience a negative divergence of the MACD index on the monthly timeframe; I believe we may see a lot of red this month! And God knows best.
130
·
--
Bearish
It seems that $BTC will experience a negative divergence of the MACD index on the monthly timeframe; I believe we may see a lot of red this month! And God knows best.
It seems that $BTC will experience a negative divergence of the MACD index on the monthly timeframe; I believe we may see a lot of red this month! And God knows best.
1
2
1
882
[https://app.binance.com/uni-qr/4UYVcJD3?utm_medium=web_share_copy](https://app.binance.com/uni-qr/4UYVcJD3?utm_medium=web_share_copy)
$BNB
https://app.binance.com/uni-qr/4UYVcJD3?utm_medium=web_share_copy
$BNB
$BNB

6
$ZEN may drop to the level of 15-16 and then start accumulating before rising again.
There is a nearby negative crossover on the 1h MACD indicator warning of a correction, and there are many buy orders at the previously mentioned level that could push the price up, and God knows best.
$ZEN may drop to the level of 15-16 and then start accumulating before rising again.
There is a nearby negative crossover on the 1h MACD indicator warning of a correction, and there are many buy orders at the previously mentioned level that could push the price up, and God knows best.
There is a nearby negative crossover on the 1h MACD indicator warning of a correction, and there are many buy orders at the previously mentioned level that could push the price up, and God knows best.
1
354
$BTC You might sleep and wake up to find the house is 85k 💀😂
$BTC You might sleep and wake up to find the house is 85k 💀😂
28
·
--
Bearish
$BTC A strong collapse will occur, and he who warns is excused.
$BTC A strong collapse will occur, and he who warns is excused.
19
·
--
Bearish
$BTC MACD indicator shows bearish momentum on different time frames, this could push the price towards 103k or lower.
$BTC MACD indicator shows bearish momentum on different time frames, this could push the price towards 103k or lower.
15
·
--
Bearish
$EVAA Clear and strong fall down, can reach $10 or $9
$EVAA Clear and strong fall down, can reach $10 or $9
57
·
--
Bullish
$OL Attention, a positive crossover of the MACD indicator will occur on the 3D frame, pushing the price up.
$OL Attention, a positive crossover of the MACD indicator will occur on the 3D frame, pushing the price up.
64
Log in to explore more content
Join global crypto users on Binance Square
⚡️ Get latest and useful information about crypto.
💬 Trusted by the world’s largest crypto exchange.
👍 Discover real insights from verified creators.
Email / Phone number
Trending Topics
CryptoSelloffTriggersMultipleWhaleLiquidations
54,720 views
740 Discussing
Crypto Liquidations Top $2B in 24 Hours as 329,000 Traders Are Wiped Out
Binance News
·28 Likes
·25.6k views
USSpotXRPETFsSeeLargestWeeklyOutflowIn8Months
81,200 views
956 Discussing
WillFOMCMinutesReinforceRateHikeExpectations?
13,037 views
303 Discussing