
RCipheR
24 Posts

RCipheR
Report
Block User
加密貨幣及幣安市場分析 | 技術洞察與價格趨勢 | 僅供教 請注意:本帳號分享的所有內容僅供教育、資訊和分析之用。我並非財務顧問,此處發布的任何內容均不應被視為財務建議。在做出任何交易決策之前,請務必自行研究(DYOR)並妥善管理風險。歡迎加入我的行列,一同追蹤圖表形態、分析市場變化,探索不斷發展的 Web3 世界!
15 Following
5 Followers
30 Liked
Posts
·
--
Article
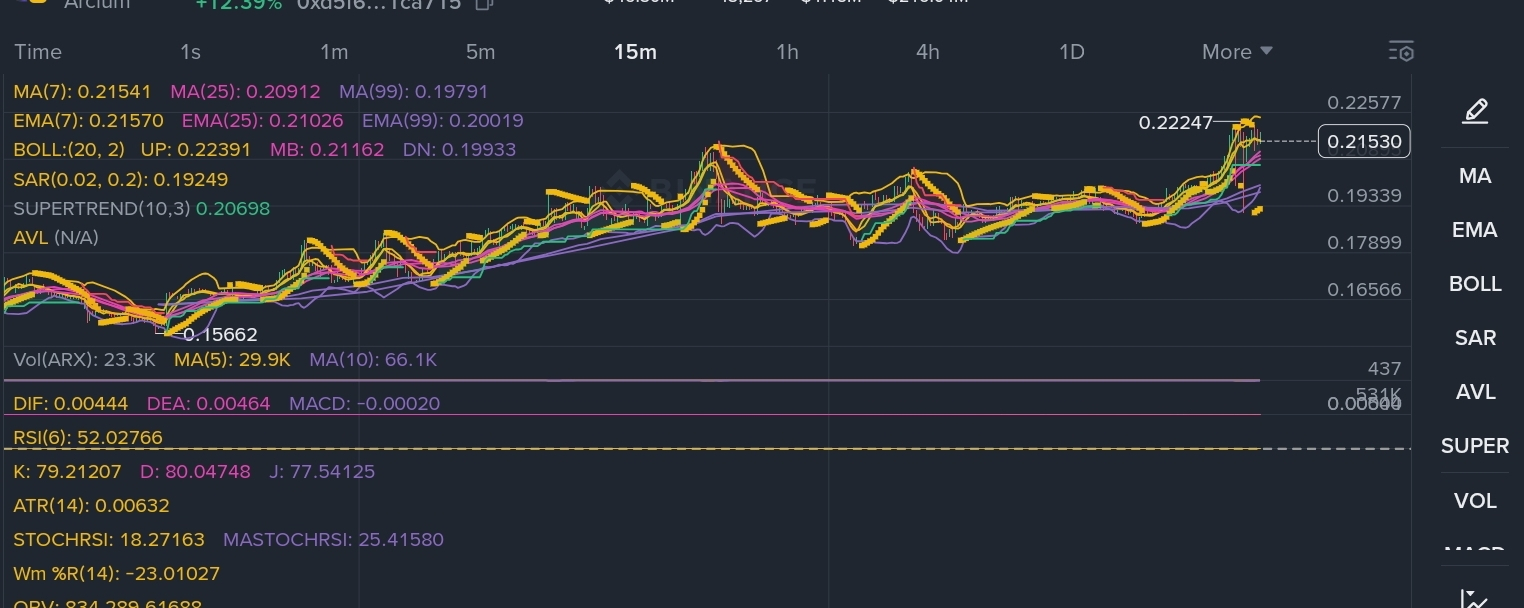
Deep Dive Market Analysis: Arcium ARX Parabolic Surge and Technical OutlookArcium has recently emerged as a standout performer in the digital asset market, blending a powerful narrative in confidential computing with exceptional price action. As a parallelized confidential computing network built on Solana, Arcium utilizes Multi-Party Computation to process encrypted data for Web3 and artificial intelligence applications. The native ARX token is clearly responding to this strong fundamental backdrop, recording double-digit daily percentage gains and pushing past key psychological barriers.
A careful examination of the recent market data reveals intense bullish momentum, alongside structural signals that demand strict risk management from active market participants.
Fundamentally, Arcium boasts a fixed total supply of one billion tokens with a current circulating market capitalization of approximately 46 million dollars. The position of the project at the intersection of Solana infrastructure, zero-knowledge privacy, and AI data processing makes it a highly attractive narrative play.
Technically, ARX is in a dominant uptrend but is flashing overheating signals on the highest timeframes. Traders should watch the 0.222 local high as the immediate breakout trigger. A decisive flip of this resistance into support opens the door for further price discovery. Alternatively, a breakdown below the 15-minute dynamic support could send the token to retest the 0.190 to 0.200 accumulation zones. Patience, proper position sizing, and waiting for confirmed support tests are the optimal strategies in this highly volatile environment.
$ARX #altcoins #Arcium
{alpha}(560xd5f6ef5deabe61e6d5cdb49bfb6f156f2c1ca715)
Deep Dive Market Analysis: Arcium ARX Parabolic Surge and Technical Outlook
Arcium has recently emerged as a standout performer in the digital asset market, blending a powerful narrative in confidential computing with exceptional price action. As a parallelized confidential computing network built on Solana, Arcium utilizes Multi-Party Computation to process encrypted data for Web3 and artificial intelligence applications. The native ARX token is clearly responding to this strong fundamental backdrop, recording double-digit daily percentage gains and pushing past key psychological barriers.
A careful examination of the recent market data reveals intense bullish momentum, alongside structural signals that demand strict risk management from active market participants.
Fundamentally, Arcium boasts a fixed total supply of one billion tokens with a current circulating market capitalization of approximately 46 million dollars. The position of the project at the intersection of Solana infrastructure, zero-knowledge privacy, and AI data processing makes it a highly attractive narrative play.
Technically, ARX is in a dominant uptrend but is flashing overheating signals on the highest timeframes. Traders should watch the 0.222 local high as the immediate breakout trigger. A decisive flip of this resistance into support opens the door for further price discovery. Alternatively, a breakdown below the 15-minute dynamic support could send the token to retest the 0.190 to 0.200 accumulation zones. Patience, proper position sizing, and waiting for confirmed support tests are the optimal strategies in this highly volatile environment.
$ARX #altcoins #Arcium
A careful examination of the recent market data reveals intense bullish momentum, alongside structural signals that demand strict risk management from active market participants.
Fundamentally, Arcium boasts a fixed total supply of one billion tokens with a current circulating market capitalization of approximately 46 million dollars. The position of the project at the intersection of Solana infrastructure, zero-knowledge privacy, and AI data processing makes it a highly attractive narrative play.
Technically, ARX is in a dominant uptrend but is flashing overheating signals on the highest timeframes. Traders should watch the 0.222 local high as the immediate breakout trigger. A decisive flip of this resistance into support opens the door for further price discovery. Alternatively, a breakdown below the 15-minute dynamic support could send the token to retest the 0.190 to 0.200 accumulation zones. Patience, proper position sizing, and waiting for confirmed support tests are the optimal strategies in this highly volatile environment.
$ARX #altcoins #Arcium
1
394
·
--
Article
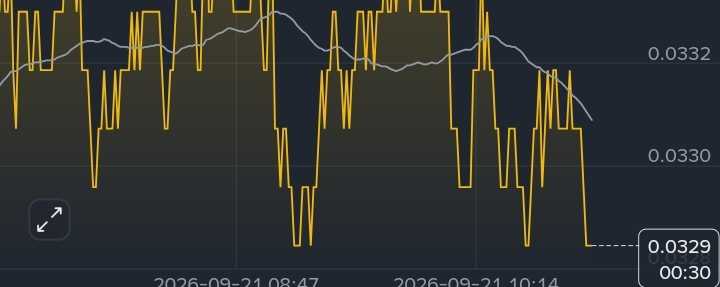
$BANK: Can It Build Momentum in the Next Market Cycle?$BANK is drawing attention as traders look for smaller-cap tokens with strong community engagement and room for volatility-driven moves. Like many emerging altcoins, its price action can shift quickly as liquidity, sentiment, and broader market conditions change.
What matters most for $BANK
Liquidity and trading volume
A growing volume trend can signal increasing market participation, while thin liquidity may amplify both rallies and sell-offs. Large price moves are not always a sign of sustainable demand.
Community narrative
For community-led tokens, visibility on social platforms, holder activity, and ecosystem updates can strongly influence sentiment. Momentum may strengthen when attention is backed by consistent engagement rather than short-lived hype.
Broader crypto market direction
$BANK is likely to remain sensitive to Bitcoin’s trend and overall altcoin risk appetite. When market conditions weaken, higher-volatility tokens can experience sharper pullbacks.
Key technical structure
Instead of focusing on a single price target, watch whether BANK can form higher lows, sustain volume during advances, and hold important support areas after any breakout. A move without follow-through volume can lose momentum quickly.
Balanced outlook
The bullish case depends on sustained community growth, improving liquidity, and a supportive altcoin market. On the other hand, rapid profit-taking, low liquidity, and changing sentiment could lead to sudden volatility.
BANK may offer an interesting narrative for traders watching emerging community tokens, but it remains a high-risk asset. Focus on verified information, token liquidity, supply dynamics, and your own risk tolerance before making any trading decision.
#Crypto #Altcoins #BinanceSquare #CryptoAnalysis
$BANK: Can It Build Momentum in the Next Market Cycle?
$BANK is drawing attention as traders look for smaller-cap tokens with strong community engagement and room for volatility-driven moves. Like many emerging altcoins, its price action can shift quickly as liquidity, sentiment, and broader market conditions change.
What matters most for $BANK
Liquidity and trading volume
A growing volume trend can signal increasing market participation, while thin liquidity may amplify both rallies and sell-offs. Large price moves are not always a sign of sustainable demand.
Community narrative
For community-led tokens, visibility on social platforms, holder activity, and ecosystem updates can strongly influence sentiment. Momentum may strengthen when attention is backed by consistent engagement rather than short-lived hype.
Broader crypto market direction
$BANK is likely to remain sensitive to Bitcoin’s trend and overall altcoin risk appetite. When market conditions weaken, higher-volatility tokens can experience sharper pullbacks.
Key technical structure
Instead of focusing on a single price target, watch whether BANK can form higher lows, sustain volume during advances, and hold important support areas after any breakout. A move without follow-through volume can lose momentum quickly.
Balanced outlook
The bullish case depends on sustained community growth, improving liquidity, and a supportive altcoin market. On the other hand, rapid profit-taking, low liquidity, and changing sentiment could lead to sudden volatility.
BANK may offer an interesting narrative for traders watching emerging community tokens, but it remains a high-risk asset. Focus on verified information, token liquidity, supply dynamics, and your own risk tolerance before making any trading decision.
#Crypto #Altcoins #BinanceSquare #CryptoAnalysis
What matters most for $BANK
Liquidity and trading volume
A growing volume trend can signal increasing market participation, while thin liquidity may amplify both rallies and sell-offs. Large price moves are not always a sign of sustainable demand.
Community narrative
For community-led tokens, visibility on social platforms, holder activity, and ecosystem updates can strongly influence sentiment. Momentum may strengthen when attention is backed by consistent engagement rather than short-lived hype.
Broader crypto market direction
$BANK is likely to remain sensitive to Bitcoin’s trend and overall altcoin risk appetite. When market conditions weaken, higher-volatility tokens can experience sharper pullbacks.
Key technical structure
Instead of focusing on a single price target, watch whether BANK can form higher lows, sustain volume during advances, and hold important support areas after any breakout. A move without follow-through volume can lose momentum quickly.
Balanced outlook
The bullish case depends on sustained community growth, improving liquidity, and a supportive altcoin market. On the other hand, rapid profit-taking, low liquidity, and changing sentiment could lead to sudden volatility.
BANK may offer an interesting narrative for traders watching emerging community tokens, but it remains a high-risk asset. Focus on verified information, token liquidity, supply dynamics, and your own risk tolerance before making any trading decision.
#Crypto #Altcoins #BinanceSquare #CryptoAnalysis
2
382
·
--
Article
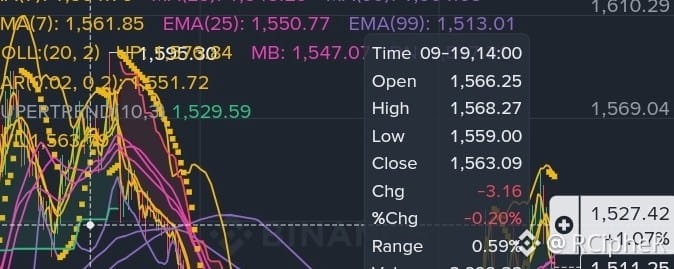
$ZEC Deep Dive: Why Zcash Is Surging +2,900% YTD & What the Order Book Dynamics RevealZcash ($ZEC) has emerged as one of the top trending assets across the cryptocurrency market, delivering a macro rally of over +2,913% over the past year and trading near $1,510 USDT.
Here is a comprehensive breakdown of why $ZEC is trending, an analysis of the multi-timeframe technical structure, derivatives data, and how to interpret its rapidly changing order book dynamics.
Why is $ZEC a Trending Coin?
Zcash's massive structural breakout and sustained momentum are driven by four core catalysts:
Compliant Spot ETF Momentum: Institutional access expanded dramatically following the conversion of the Grayscale Zcash Trust into a NYSE Arca-listed spot ETF ($ZCSH), triggering continuous net institutional inflows.
Resolution of Regulatory Uncertainty: The conclusion of long-standing regulatory inquiries without enforcement action removed a multi-year risk discount, enabling institutional treasuries and funds to allocate capital.
Protocol Upgrades & Privacy Tech Acceleration: The upcoming NU7 Network Upgrade (reducing block times from 75s to 25s) and the Zakura Common Toolkit (speeding up zero-knowledge proof generation on mobile by 14x) have vastly improved user experience and shielded transaction adoption.
Supply Scarcity & Short Squeeze Mechanics: With a hard supply cap of 21 million tokens (matching Bitcoin) and an increasing percentage locked in private z-addresses, high short interest in derivatives markets has repeatedly triggered violent short squeez
1. Daily (1D) Chart — Macro Bullish
Moving Averages: Price trades far above key exponential moving averages:
EMA(7): $1,245.98EMA(25): $1,038.79EMA(99): $595.30Bollinger Bands: Price is pushing above the Upper Band ($1,424.87), indicating extreme trend strength.
Indicators:
RSI(6): 76.55 (Strong momentum in overbought territory).MACD: DIF (147.58) > DEA (131.79) with a positive histogram (+15.78), showing expansion in buyer volume.
2. 4-Hour (4H) Chart — Healthy High-Level Consolidation
Structure: Price is holding above the Middle Bollinger Band ($1,493.54) and EMA(7) ($1,490.82) after touching a high of $1,595.30.
Indicators: RSI(6) at 62.31 shows healthy cooling off without breaking structure, maintaining Supertrend support at $1,364.49.
3. 1-Hour (1H) & 15-Min (15M) Charts — Local Range
Support / Resistance: Immediate support sits at $1,505 (EMA7) and $1,482 (Parabolic SAR). Local resistance stands at $1,535 - $1,548.
RSI(6): Resetting in the 41.31 - 58.52 range, allowing indicators to reset before the next potential move.
Derivatives Sentiment: Open Interest & Long/Short Ratios
Open Interest (OI): ~470K - 472K ZEC (Notional Value: ~$708M - $727M USDT), demonstrating huge liquidity participation.
Top Trader Long/Short Ratio (Accounts):
Long Accounts: 33.22% - 35.09%
Short Accounts: 64.91% - 66.78%
Analyst Insight: Over 64% of top trader accounts are currently holding short positions. In a strong uptrend, an imbalanced short account ratio often sets up a short squeeze, as rising prices force short sellers to buy back tokens to close their positions.
Order Book Dynamics: Why Is the Order Book Constantly Changing?
In high-volatility, high-volume contracts like $ZEC Perpetual, live order book depths shift second-by-second (e.g., Bid ratio fluctuating between 20% Bids / 80% Asks and 93% Bids / 7% Asks within seconds).
Algorithmic High-Frequency Trading (HFT): Market-making algorithms rapidly insert and cancel limit orders to capture bid-ask spreads.
Automated Stop-Loss Triggering: As price approaches micro-levels, liquidations and stop-market orders clear out entire depth tiers instantly.
Iceberg Orders & Hidden Liquidity: Institutional players break large orders into small fragments to avoid disclosing total size.
Trading Takeaway: Never trade solely based on a single snapshot of the order book. Focus on broader volume indicators like On-Balance Volume (OBV: ~93.29M) and major higher-timeframe support/resistance levels.
Key Trading Levels to Watch
Key Resistance Levels: $1,548 ➔ $1,595 ➔ $1,650 ➔ $1,800
Key Support Levels: $1,490 - $1,505 (1H/4H EMA Support) ➔ $1,428 (24h Low) ➔ $1,245 (Daily EMA7)
Disclaimer & Risk Warning
This article is for informational and educational purposes only and does not constitute financial advice, investment recommendations, or an endorsement to buy or sell any digital assets. Cryptocurrency and futures trading carry high market risk and price volatility. Leverage can amplify both profits and losses. Always conduct your own research (DYOR) and apply strict risk management before entering any trade.
#TrendingTopic #Binance
$ZEC Deep Dive: Why Zcash Is Surging +2,900% YTD & What the Order Book Dynamics Reveal
Zcash ($ZEC) has emerged as one of the top trending assets across the cryptocurrency market, delivering a macro rally of over +2,913% over the past year and trading near $1,510 USDT.
Here is a comprehensive breakdown of why $ZEC is trending, an analysis of the multi-timeframe technical structure, derivatives data, and how to interpret its rapidly changing order book dynamics.
Why is $ZEC a Trending Coin?
Zcash's massive structural breakout and sustained momentum are driven by four core catalysts:
Compliant Spot ETF Momentum: Institutional access expanded dramatically following the conversion of the Grayscale Zcash Trust into a NYSE Arca-listed spot ETF ($ZCSH), triggering continuous net institutional inflows.
Resolution of Regulatory Uncertainty: The conclusion of long-standing regulatory inquiries without enforcement action removed a multi-year risk discount, enabling institutional treasuries and funds to allocate capital.
Protocol Upgrades & Privacy Tech Acceleration: The upcoming NU7 Network Upgrade (reducing block times from 75s to 25s) and the Zakura Common Toolkit (speeding up zero-knowledge proof generation on mobile by 14x) have vastly improved user experience and shielded transaction adoption.
Supply Scarcity & Short Squeeze Mechanics: With a hard supply cap of 21 million tokens (matching Bitcoin) and an increasing percentage locked in private z-addresses, high short interest in derivatives markets has repeatedly triggered violent short squeez
1. Daily (1D) Chart — Macro Bullish
Moving Averages: Price trades far above key exponential moving averages:
EMA(7): $1,245.98EMA(25): $1,038.79EMA(99): $595.30Bollinger Bands: Price is pushing above the Upper Band ($1,424.87), indicating extreme trend strength.
Indicators:
RSI(6): 76.55 (Strong momentum in overbought territory).MACD: DIF (147.58) > DEA (131.79) with a positive histogram (+15.78), showing expansion in buyer volume.
2. 4-Hour (4H) Chart — Healthy High-Level Consolidation
Structure: Price is holding above the Middle Bollinger Band ($1,493.54) and EMA(7) ($1,490.82) after touching a high of $1,595.30.
Indicators: RSI(6) at 62.31 shows healthy cooling off without breaking structure, maintaining Supertrend support at $1,364.49.
3. 1-Hour (1H) & 15-Min (15M) Charts — Local Range
Support / Resistance: Immediate support sits at $1,505 (EMA7) and $1,482 (Parabolic SAR). Local resistance stands at $1,535 - $1,548.
RSI(6): Resetting in the 41.31 - 58.52 range, allowing indicators to reset before the next potential move.
Derivatives Sentiment: Open Interest & Long/Short Ratios
Open Interest (OI): ~470K - 472K ZEC (Notional Value: ~$708M - $727M USDT), demonstrating huge liquidity participation.
Top Trader Long/Short Ratio (Accounts):
Long Accounts: 33.22% - 35.09%
Short Accounts: 64.91% - 66.78%
Analyst Insight: Over 64% of top trader accounts are currently holding short positions. In a strong uptrend, an imbalanced short account ratio often sets up a short squeeze, as rising prices force short sellers to buy back tokens to close their positions.
Order Book Dynamics: Why Is the Order Book Constantly Changing?
In high-volatility, high-volume contracts like $ZEC Perpetual, live order book depths shift second-by-second (e.g., Bid ratio fluctuating between 20% Bids / 80% Asks and 93% Bids / 7% Asks within seconds).
Algorithmic High-Frequency Trading (HFT): Market-making algorithms rapidly insert and cancel limit orders to capture bid-ask spreads.
Automated Stop-Loss Triggering: As price approaches micro-levels, liquidations and stop-market orders clear out entire depth tiers instantly.
Iceberg Orders & Hidden Liquidity: Institutional players break large orders into small fragments to avoid disclosing total size.
Trading Takeaway: Never trade solely based on a single snapshot of the order book. Focus on broader volume indicators like On-Balance Volume (OBV: ~93.29M) and major higher-timeframe support/resistance levels.
Key Trading Levels to Watch
Key Resistance Levels: $1,548 ➔ $1,595 ➔ $1,650 ➔ $1,800
Key Support Levels: $1,490 - $1,505 (1H/4H EMA Support) ➔ $1,428 (24h Low) ➔ $1,245 (Daily EMA7)
Disclaimer & Risk Warning
This article is for informational and educational purposes only and does not constitute financial advice, investment recommendations, or an endorsement to buy or sell any digital assets. Cryptocurrency and futures trading carry high market risk and price volatility. Leverage can amplify both profits and losses. Always conduct your own research (DYOR) and apply strict risk management before entering any trade.
#TrendingTopic #Binance
Here is a comprehensive breakdown of why $ZEC is trending, an analysis of the multi-timeframe technical structure, derivatives data, and how to interpret its rapidly changing order book dynamics.
Why is $ZEC a Trending Coin?
Zcash's massive structural breakout and sustained momentum are driven by four core catalysts:
Compliant Spot ETF Momentum: Institutional access expanded dramatically following the conversion of the Grayscale Zcash Trust into a NYSE Arca-listed spot ETF ($ZCSH), triggering continuous net institutional inflows.
Resolution of Regulatory Uncertainty: The conclusion of long-standing regulatory inquiries without enforcement action removed a multi-year risk discount, enabling institutional treasuries and funds to allocate capital.
Protocol Upgrades & Privacy Tech Acceleration: The upcoming NU7 Network Upgrade (reducing block times from 75s to 25s) and the Zakura Common Toolkit (speeding up zero-knowledge proof generation on mobile by 14x) have vastly improved user experience and shielded transaction adoption.
Supply Scarcity & Short Squeeze Mechanics: With a hard supply cap of 21 million tokens (matching Bitcoin) and an increasing percentage locked in private z-addresses, high short interest in derivatives markets has repeatedly triggered violent short squeez
1. Daily (1D) Chart — Macro Bullish
Moving Averages: Price trades far above key exponential moving averages:
EMA(7): $1,245.98EMA(25): $1,038.79EMA(99): $595.30Bollinger Bands: Price is pushing above the Upper Band ($1,424.87), indicating extreme trend strength.
Indicators:
RSI(6): 76.55 (Strong momentum in overbought territory).MACD: DIF (147.58) > DEA (131.79) with a positive histogram (+15.78), showing expansion in buyer volume.
2. 4-Hour (4H) Chart — Healthy High-Level Consolidation
Structure: Price is holding above the Middle Bollinger Band ($1,493.54) and EMA(7) ($1,490.82) after touching a high of $1,595.30.
Indicators: RSI(6) at 62.31 shows healthy cooling off without breaking structure, maintaining Supertrend support at $1,364.49.
3. 1-Hour (1H) & 15-Min (15M) Charts — Local Range
Support / Resistance: Immediate support sits at $1,505 (EMA7) and $1,482 (Parabolic SAR). Local resistance stands at $1,535 - $1,548.
RSI(6): Resetting in the 41.31 - 58.52 range, allowing indicators to reset before the next potential move.
Derivatives Sentiment: Open Interest & Long/Short Ratios
Open Interest (OI): ~470K - 472K ZEC (Notional Value: ~$708M - $727M USDT), demonstrating huge liquidity participation.
Top Trader Long/Short Ratio (Accounts):
Long Accounts: 33.22% - 35.09%
Short Accounts: 64.91% - 66.78%
Analyst Insight: Over 64% of top trader accounts are currently holding short positions. In a strong uptrend, an imbalanced short account ratio often sets up a short squeeze, as rising prices force short sellers to buy back tokens to close their positions.
Order Book Dynamics: Why Is the Order Book Constantly Changing?
In high-volatility, high-volume contracts like $ZEC Perpetual, live order book depths shift second-by-second (e.g., Bid ratio fluctuating between 20% Bids / 80% Asks and 93% Bids / 7% Asks within seconds).
Algorithmic High-Frequency Trading (HFT): Market-making algorithms rapidly insert and cancel limit orders to capture bid-ask spreads.
Automated Stop-Loss Triggering: As price approaches micro-levels, liquidations and stop-market orders clear out entire depth tiers instantly.
Iceberg Orders & Hidden Liquidity: Institutional players break large orders into small fragments to avoid disclosing total size.
Trading Takeaway: Never trade solely based on a single snapshot of the order book. Focus on broader volume indicators like On-Balance Volume (OBV: ~93.29M) and major higher-timeframe support/resistance levels.
Key Trading Levels to Watch
Key Resistance Levels: $1,548 ➔ $1,595 ➔ $1,650 ➔ $1,800
Key Support Levels: $1,490 - $1,505 (1H/4H EMA Support) ➔ $1,428 (24h Low) ➔ $1,245 (Daily EMA7)
Disclaimer & Risk Warning
This article is for informational and educational purposes only and does not constitute financial advice, investment recommendations, or an endorsement to buy or sell any digital assets. Cryptocurrency and futures trading carry high market risk and price volatility. Leverage can amplify both profits and losses. Always conduct your own research (DYOR) and apply strict risk management before entering any trade.
#TrendingTopic #Binance
1
184
·
--
Article
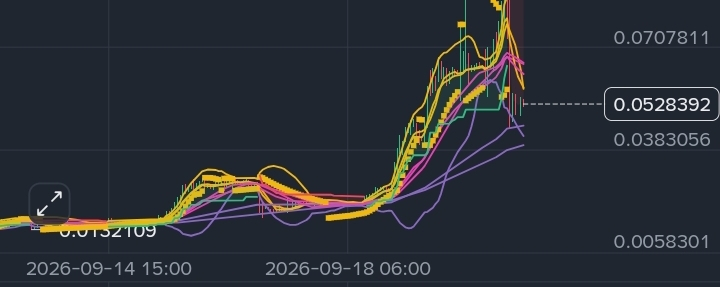
AKE Retracts 15%: Is This a Healthy Cool-off or the Start of a Deeper Correction?Akita Inu ($AKE) has experienced a sharp 15% intraday drop, pulling the price down to the $0.052 range. After a spectacular macro run-up from its summer accumulation phase, profit-taking has taken center stage.
The Technical Reality Check
Consolidation or Breakdown? On the 1-hour chart, AKE is fighting to establish a local floor. It is currently trading below its immediate exponential moving averages (EMA 7 & 25), pointing to strict overhead resistance near $0.057 - $0.062.RSI Divergence: While the 1-hour RSI is sitting heavily at 34.7 (flirting with oversold levels), the 15-minute timeframe is flattening out near 53. This indicates that the intense selling pressure seen earlier today is beginning to exhaust itself into sideways consolidation.Macro Perspective: Zooming out to the daily chart, this correction follows an aggressive macro move toward $0.160. A pullback of this scale is standard market behavior to flush out late leverage before establishing a healthy higher low.
Key Levels to Watch
Support Zone: $0.048 - $0.051. Bulls must hold this area on a 4-hour and daily closing basis to prevent a deeper slide down toward the $0.042 lower Bollinger Band support.Resistance Levels: $0.057 (MA7) and $0.065 (MA25). Reclaiming these zones is a prerequisite for any renewed bullish continuation.
Market Outlook
AKE is in a high-volatility compression zone. High-risk scalpers are eyeing the current range for bounce plays due to the near-oversold hourly conditions, while conservative swing traders may prefer to wait for a confirmed trend-reversal pattern or a clean breakout back above $0.065.
Disclaimer: This content is for educational and informational purposes only. Crypto trading carries high risk. Always do your own research (DYOR).
#AKE #AkitaInu #Altcoins #CryptoAnalysis #BinanceSquare
AKE Retracts 15%: Is This a Healthy Cool-off or the Start of a Deeper Correction?
Akita Inu ($AKE) has experienced a sharp 15% intraday drop, pulling the price down to the $0.052 range. After a spectacular macro run-up from its summer accumulation phase, profit-taking has taken center stage.
The Technical Reality Check
Consolidation or Breakdown? On the 1-hour chart, AKE is fighting to establish a local floor. It is currently trading below its immediate exponential moving averages (EMA 7 & 25), pointing to strict overhead resistance near $0.057 - $0.062.RSI Divergence: While the 1-hour RSI is sitting heavily at 34.7 (flirting with oversold levels), the 15-minute timeframe is flattening out near 53. This indicates that the intense selling pressure seen earlier today is beginning to exhaust itself into sideways consolidation.Macro Perspective: Zooming out to the daily chart, this correction follows an aggressive macro move toward $0.160. A pullback of this scale is standard market behavior to flush out late leverage before establishing a healthy higher low.
Key Levels to Watch
Support Zone: $0.048 - $0.051. Bulls must hold this area on a 4-hour and daily closing basis to prevent a deeper slide down toward the $0.042 lower Bollinger Band support.Resistance Levels: $0.057 (MA7) and $0.065 (MA25). Reclaiming these zones is a prerequisite for any renewed bullish continuation.
Market Outlook
AKE is in a high-volatility compression zone. High-risk scalpers are eyeing the current range for bounce plays due to the near-oversold hourly conditions, while conservative swing traders may prefer to wait for a confirmed trend-reversal pattern or a clean breakout back above $0.065.
Disclaimer: This content is for educational and informational purposes only. Crypto trading carries high risk. Always do your own research (DYOR).
#AKE #AkitaInu #Altcoins #CryptoAnalysis #BinanceSquare
The Technical Reality Check
Consolidation or Breakdown? On the 1-hour chart, AKE is fighting to establish a local floor. It is currently trading below its immediate exponential moving averages (EMA 7 & 25), pointing to strict overhead resistance near $0.057 - $0.062.RSI Divergence: While the 1-hour RSI is sitting heavily at 34.7 (flirting with oversold levels), the 15-minute timeframe is flattening out near 53. This indicates that the intense selling pressure seen earlier today is beginning to exhaust itself into sideways consolidation.Macro Perspective: Zooming out to the daily chart, this correction follows an aggressive macro move toward $0.160. A pullback of this scale is standard market behavior to flush out late leverage before establishing a healthy higher low.
Key Levels to Watch
Support Zone: $0.048 - $0.051. Bulls must hold this area on a 4-hour and daily closing basis to prevent a deeper slide down toward the $0.042 lower Bollinger Band support.Resistance Levels: $0.057 (MA7) and $0.065 (MA25). Reclaiming these zones is a prerequisite for any renewed bullish continuation.
Market Outlook
AKE is in a high-volatility compression zone. High-risk scalpers are eyeing the current range for bounce plays due to the near-oversold hourly conditions, while conservative swing traders may prefer to wait for a confirmed trend-reversal pattern or a clean breakout back above $0.065.
Disclaimer: This content is for educational and informational purposes only. Crypto trading carries high risk. Always do your own research (DYOR).
#AKE #AkitaInu #Altcoins #CryptoAnalysis #BinanceSquare
2
349
·
--
Article
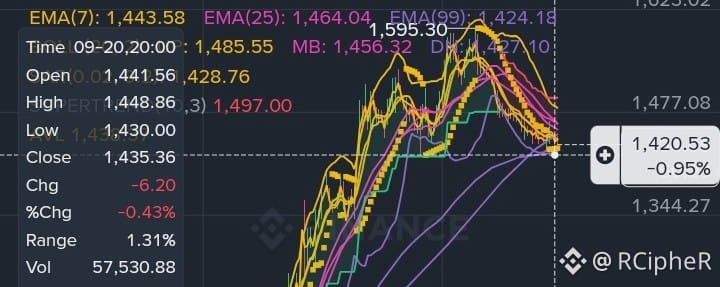
ZEC Alert: Oversold or Freefall? Zcash Tests Critical $1,428 SupportZcash ($ZEC) has faced a sharp correction today, shedding nearly 6% and sliding toward the $1,434 mark. As bears dominate the session, traders are watching closely to see if the 24-hour low can hold.
Technical Snapshot (1H & 15M Timeframes)
Bearish Grip: Price remains firmly below the MA7 and MA25, confirming the aggressive downtrend. The "waterfall" action along the lower Bollinger Band indicates strong selling volume.Oversold Signals: The RSI on the 1-hour chart is hovering near 31, dangerously close to oversold territory. This typically suggests selling exhaustion could be near, potentially triggering a relief bounce back toward $1,445 - $1,450.Momentum: MACD remains negative, though the 15-minute histogram shows slight deceleration in selling pressure.
Key Levels to Watch
Critical Support: $1,428 (24h Low). A breakdown below this level could open the door for further downside discovery.
Immediate Resistance: $1,442 (MA7) and $1,465 (MA25). Bulls need to reclaim these levels to invalidate the immediate bearish structure.
Trade Idea
Conservative traders may wait for a confirmed candle close above $1,445 before considering long positions. Aggressive traders might look for scalps off the $1,428 support, but be wary of "catching a falling knife."
Disclaimer: This content is for educational purposes only and does not constitute financial advice. Always do your own research (DYOR) before trading.
#ZEC #Zcash #CryptoTrading #TechnicalAnalysis #BinanceSquare
ZEC Alert: Oversold or Freefall? Zcash Tests Critical $1,428 Support
Zcash ($ZEC) has faced a sharp correction today, shedding nearly 6% and sliding toward the $1,434 mark. As bears dominate the session, traders are watching closely to see if the 24-hour low can hold.
Technical Snapshot (1H & 15M Timeframes)
Bearish Grip: Price remains firmly below the MA7 and MA25, confirming the aggressive downtrend. The "waterfall" action along the lower Bollinger Band indicates strong selling volume.Oversold Signals: The RSI on the 1-hour chart is hovering near 31, dangerously close to oversold territory. This typically suggests selling exhaustion could be near, potentially triggering a relief bounce back toward $1,445 - $1,450.Momentum: MACD remains negative, though the 15-minute histogram shows slight deceleration in selling pressure.
Key Levels to Watch
Critical Support: $1,428 (24h Low). A breakdown below this level could open the door for further downside discovery.
Immediate Resistance: $1,442 (MA7) and $1,465 (MA25). Bulls need to reclaim these levels to invalidate the immediate bearish structure.
Trade Idea
Conservative traders may wait for a confirmed candle close above $1,445 before considering long positions. Aggressive traders might look for scalps off the $1,428 support, but be wary of "catching a falling knife."
Disclaimer: This content is for educational purposes only and does not constitute financial advice. Always do your own research (DYOR) before trading.
#ZEC #Zcash #CryptoTrading #TechnicalAnalysis #BinanceSquare
Technical Snapshot (1H & 15M Timeframes)
Bearish Grip: Price remains firmly below the MA7 and MA25, confirming the aggressive downtrend. The "waterfall" action along the lower Bollinger Band indicates strong selling volume.Oversold Signals: The RSI on the 1-hour chart is hovering near 31, dangerously close to oversold territory. This typically suggests selling exhaustion could be near, potentially triggering a relief bounce back toward $1,445 - $1,450.Momentum: MACD remains negative, though the 15-minute histogram shows slight deceleration in selling pressure.
Key Levels to Watch
Critical Support: $1,428 (24h Low). A breakdown below this level could open the door for further downside discovery.
Immediate Resistance: $1,442 (MA7) and $1,465 (MA25). Bulls need to reclaim these levels to invalidate the immediate bearish structure.
Trade Idea
Conservative traders may wait for a confirmed candle close above $1,445 before considering long positions. Aggressive traders might look for scalps off the $1,428 support, but be wary of "catching a falling knife."
Disclaimer: This content is for educational purposes only and does not constitute financial advice. Always do your own research (DYOR) before trading.
#ZEC #Zcash #CryptoTrading #TechnicalAnalysis #BinanceSquare
1
289
·
--
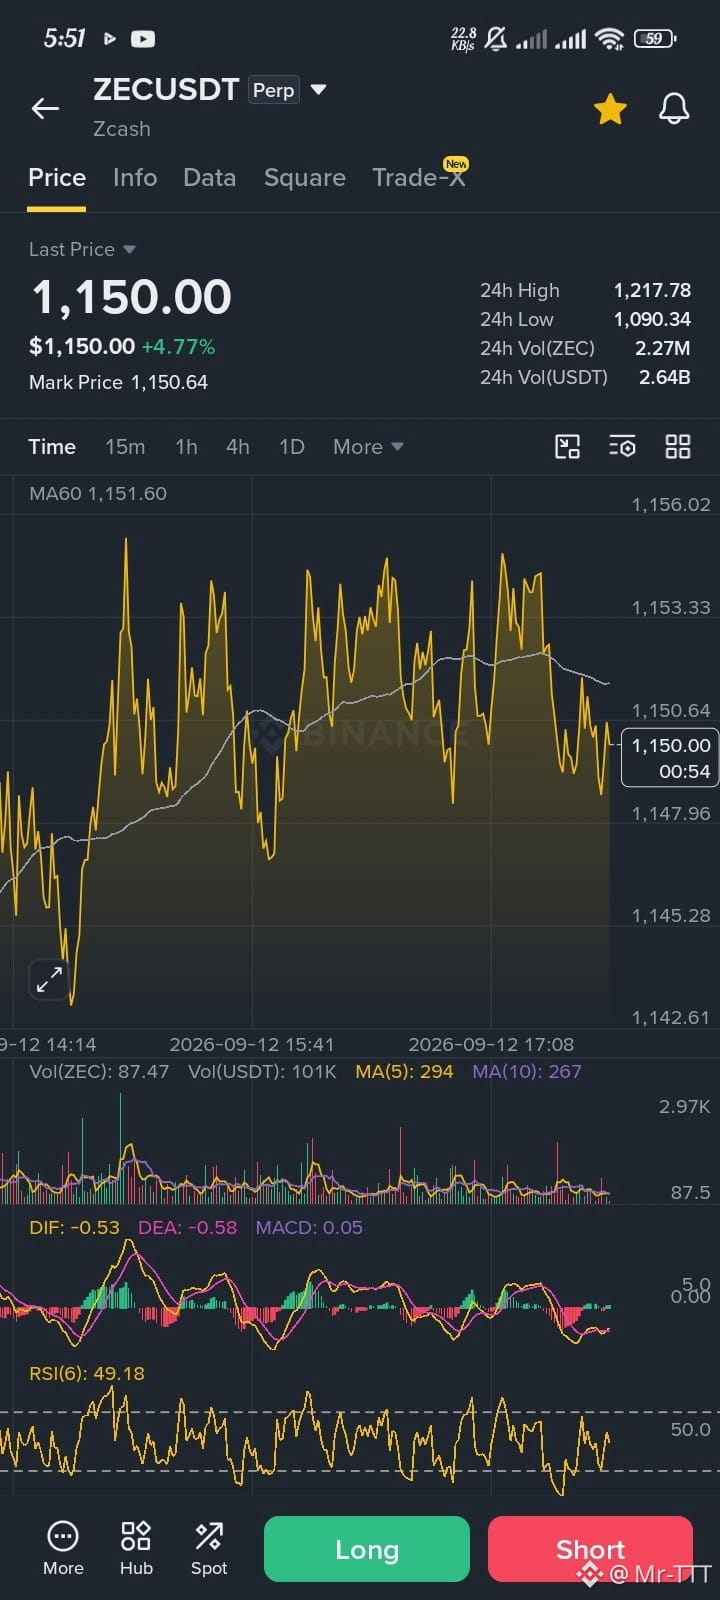
$ZEC you fuckin’ came up just to blow me up, huh?
{future}(ZECUSDT)
$ZEC you fuckin’ came up just to blow me up, huh?
2
109
·
--
Article
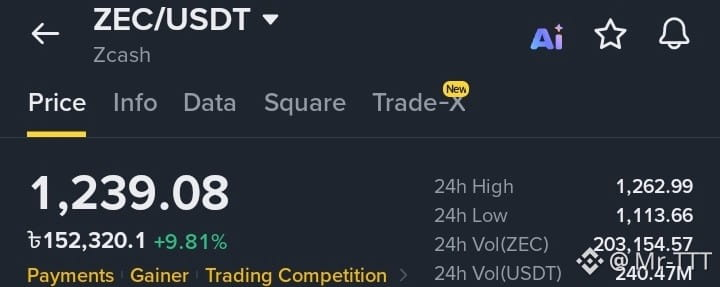
ZEC/USDT Multi-Timeframe Market Analysis$ZEC The ZEC/USDT trading pair is currently exhibiting a strong parabolic breakout and is trading at approximately $1,239.08, marking a rise of over 9.8% in the last 24 hours. Price action indicates a robust bullish trend; however, multi-timeframe analysis reveals that after touching a recent local peak of $1,262.99, the market is approaching a critical pivot point.
Market Depth and Order Book Imbalance
Dominance of the 'Buy Wall': The market depth chart reveals a significant bullish imbalance, with 'bids' (buy orders) accounting for 84.01% of the total order book volume, while 'asks' (sell orders) make up only 15.99%.
Liquidity Support: This high concentration of bids has established a strong structural price floor. A substantial volume of 'buy limit orders' is positioned to absorb potential selling pressure, effectively limiting the risk of an immediate price drop.
Technical Indicator Analysis
1-Day (Macro Trend): The daily chart shows a vertical price expansion. The RSI(6) indicator stands at 79.98, signaling an 'overbought' condition, while the MACD (DIF: 151.88, DEA: 120.61) displays a significant positive separation. While this confirms immense buying momentum, from a mathematical perspective, it also suggests the need for a 'cooling-off period' or a phase of temporary stabilization. 4-Hour (Medium-term): A market consolidation phase has begun. Although the RSI remains high at 73.52, the MACD histogram has turned slightly negative (MACD: -4.13); this indicates a slowdown in medium-term momentum as traders lock in profits just below the $1,260 resistance level.
1-Hour & 15-Minute (Micro-trend): Short-term momentum is attempting to stabilize. The 1-hour MACD is positive (6.75), and 15-minute price action is hugging the 'Upper Bollinger Band,' with the $1,230 zone acting as a new local support level. The 'SuperTrend' indicator is flashing a strong green (positive) signal.
Key Levels and Forecasts
Immediate Resistance: $1,262.99 (24-hour high). Breaking this ceiling requires a price increase of $23.91 (+1.93%).
Primary Support: $1,170.32 (Middle Bollinger Band on the 4-hour chart).
Macro Support Floor: $1,113.66 (24-hour low). A drop to this level would represent a 10.1% decline from the current trading price.
Driven by massive spot market demand and a robust order book, the current market trend is clearly bullish. However, the RSI indicator on both the 1-day and 4-hour charts signals 'overbought' conditions; consequently, opening new 'long positions' at the current $1,239 level carries a high risk of a price retracement. Before any further attempts at price discovery, the asset is most likely to maintain a stable or sideways consolidation pattern in the short term, trading between the $1,170 support and the $1,260 resistance levels.
#zec #Binance #TrendingTopic
ZEC/USDT Multi-Timeframe Market Analysis
$ZEC The ZEC/USDT trading pair is currently exhibiting a strong parabolic breakout and is trading at approximately $1,239.08, marking a rise of over 9.8% in the last 24 hours. Price action indicates a robust bullish trend; however, multi-timeframe analysis reveals that after touching a recent local peak of $1,262.99, the market is approaching a critical pivot point.
Market Depth and Order Book Imbalance
Dominance of the 'Buy Wall': The market depth chart reveals a significant bullish imbalance, with 'bids' (buy orders) accounting for 84.01% of the total order book volume, while 'asks' (sell orders) make up only 15.99%.
Liquidity Support: This high concentration of bids has established a strong structural price floor. A substantial volume of 'buy limit orders' is positioned to absorb potential selling pressure, effectively limiting the risk of an immediate price drop.
Technical Indicator Analysis
1-Day (Macro Trend): The daily chart shows a vertical price expansion. The RSI(6) indicator stands at 79.98, signaling an 'overbought' condition, while the MACD (DIF: 151.88, DEA: 120.61) displays a significant positive separation. While this confirms immense buying momentum, from a mathematical perspective, it also suggests the need for a 'cooling-off period' or a phase of temporary stabilization. 4-Hour (Medium-term): A market consolidation phase has begun. Although the RSI remains high at 73.52, the MACD histogram has turned slightly negative (MACD: -4.13); this indicates a slowdown in medium-term momentum as traders lock in profits just below the $1,260 resistance level.
1-Hour & 15-Minute (Micro-trend): Short-term momentum is attempting to stabilize. The 1-hour MACD is positive (6.75), and 15-minute price action is hugging the 'Upper Bollinger Band,' with the $1,230 zone acting as a new local support level. The 'SuperTrend' indicator is flashing a strong green (positive) signal.
Key Levels and Forecasts
Immediate Resistance: $1,262.99 (24-hour high). Breaking this ceiling requires a price increase of $23.91 (+1.93%).
Primary Support: $1,170.32 (Middle Bollinger Band on the 4-hour chart).
Macro Support Floor: $1,113.66 (24-hour low). A drop to this level would represent a 10.1% decline from the current trading price.
Driven by massive spot market demand and a robust order book, the current market trend is clearly bullish. However, the RSI indicator on both the 1-day and 4-hour charts signals 'overbought' conditions; consequently, opening new 'long positions' at the current $1,239 level carries a high risk of a price retracement. Before any further attempts at price discovery, the asset is most likely to maintain a stable or sideways consolidation pattern in the short term, trading between the $1,170 support and the $1,260 resistance levels.
#zec #Binance #TrendingTopic
Market Depth and Order Book Imbalance
Dominance of the 'Buy Wall': The market depth chart reveals a significant bullish imbalance, with 'bids' (buy orders) accounting for 84.01% of the total order book volume, while 'asks' (sell orders) make up only 15.99%.
Liquidity Support: This high concentration of bids has established a strong structural price floor. A substantial volume of 'buy limit orders' is positioned to absorb potential selling pressure, effectively limiting the risk of an immediate price drop.
Technical Indicator Analysis
1-Day (Macro Trend): The daily chart shows a vertical price expansion. The RSI(6) indicator stands at 79.98, signaling an 'overbought' condition, while the MACD (DIF: 151.88, DEA: 120.61) displays a significant positive separation. While this confirms immense buying momentum, from a mathematical perspective, it also suggests the need for a 'cooling-off period' or a phase of temporary stabilization. 4-Hour (Medium-term): A market consolidation phase has begun. Although the RSI remains high at 73.52, the MACD histogram has turned slightly negative (MACD: -4.13); this indicates a slowdown in medium-term momentum as traders lock in profits just below the $1,260 resistance level.
1-Hour & 15-Minute (Micro-trend): Short-term momentum is attempting to stabilize. The 1-hour MACD is positive (6.75), and 15-minute price action is hugging the 'Upper Bollinger Band,' with the $1,230 zone acting as a new local support level. The 'SuperTrend' indicator is flashing a strong green (positive) signal.
Key Levels and Forecasts
Immediate Resistance: $1,262.99 (24-hour high). Breaking this ceiling requires a price increase of $23.91 (+1.93%).
Primary Support: $1,170.32 (Middle Bollinger Band on the 4-hour chart).
Macro Support Floor: $1,113.66 (24-hour low). A drop to this level would represent a 10.1% decline from the current trading price.
Driven by massive spot market demand and a robust order book, the current market trend is clearly bullish. However, the RSI indicator on both the 1-day and 4-hour charts signals 'overbought' conditions; consequently, opening new 'long positions' at the current $1,239 level carries a high risk of a price retracement. Before any further attempts at price discovery, the asset is most likely to maintain a stable or sideways consolidation pattern in the short term, trading between the $1,170 support and the $1,260 resistance levels.
#zec #Binance #TrendingTopic
1
208
·
--
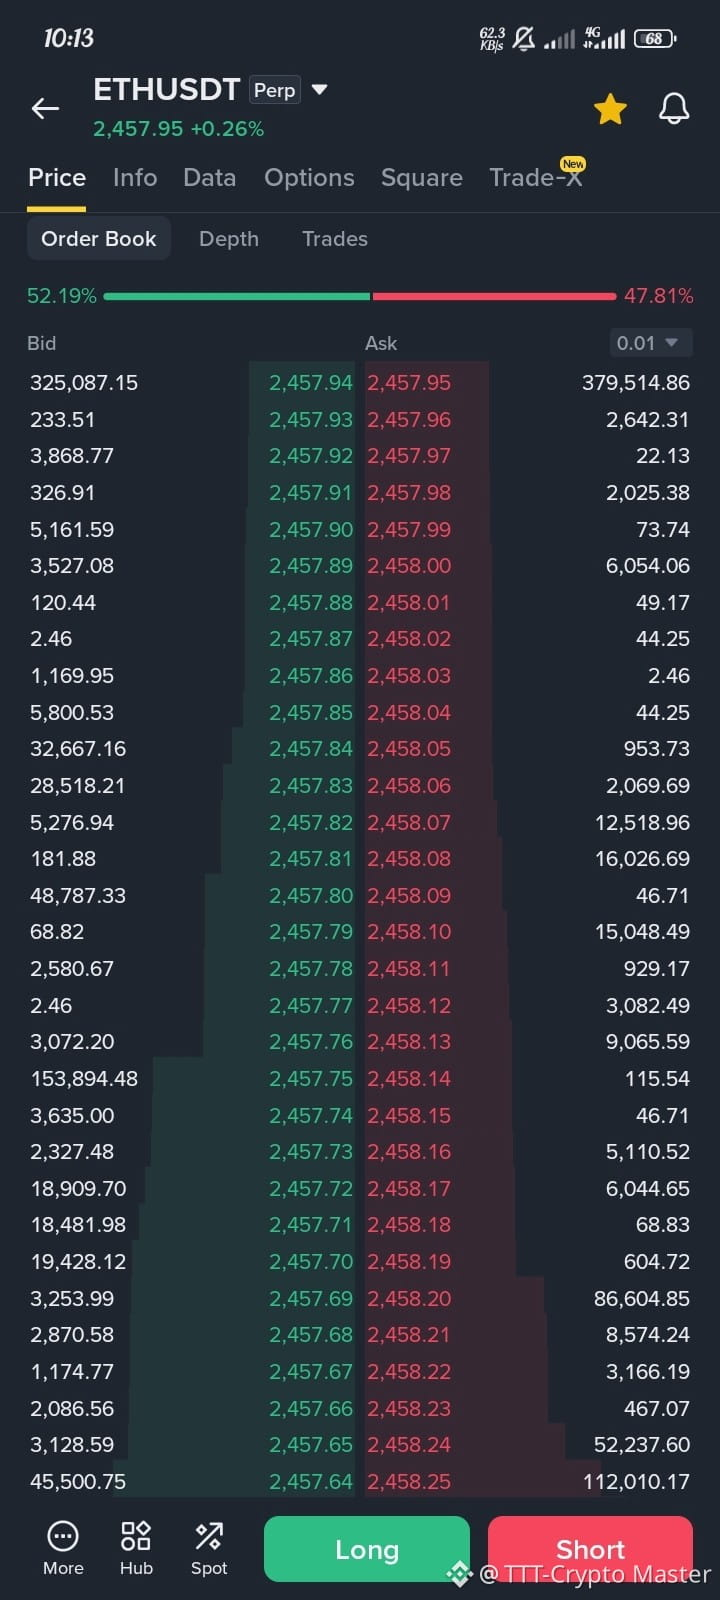
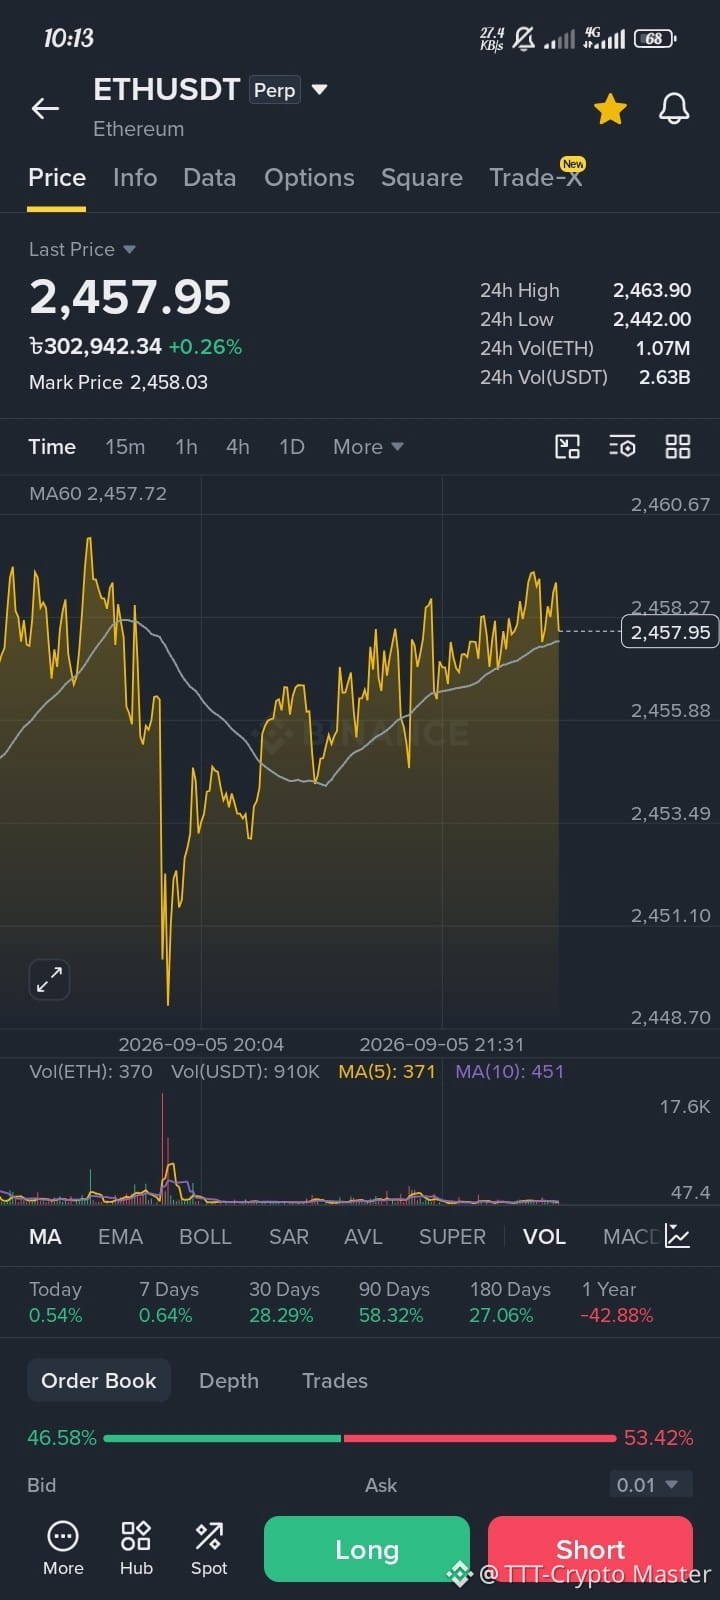
Dip Bought Instantly! ETH Targets $2,500 After Sweeping Short Liquidity
$ETH
{future}(ETHUSDT)
Dip Bought Instantly! ETH Targets $2,500 After Sweeping Short Liquidity
$ETH
$ETH
1
87
·
--
Article
TUT/USDT Market Analysis: Intense Volatility in Live Order Book and Role of Support LevelsA look at the recent trading activity and live order book of the TUT (Tutorial) token in the crypto market reveals a very dramatic and sensitive picture. After a huge correction in the last 24 hours, the price is currently in a consolidation phase at a certain support range.
Let's do a professional analysis of the current live market flow, liquidity shifts, and technical parameters.
1. Current Market Situation and Price Action
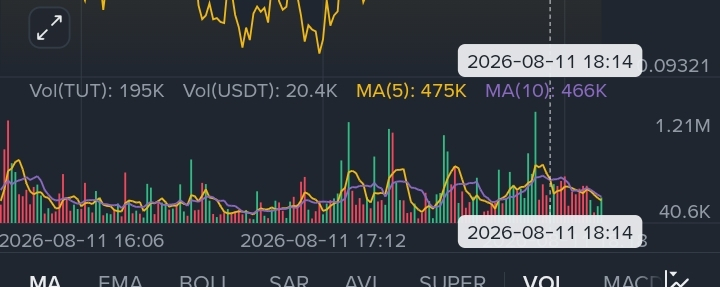
The TUT/USDT pair is currently trading in the $0.1000 to $0.1010 range, indicating a decline of about 13.3% to 14.0% in the last 24 hours.
High-Volatility Zone: The price is currently trying to find a bottom after a continuous decline from the 24-hour high of $0.13950. The 24-hour low was $0.08830.
Consolidation: The current price range is a make-or-break zone for short-term traders.
2. Order Book and Liquidity Analysis (Instant Momentum)
A deep analysis of the live trading flow and order book shows that there is a very intense battle going on between buyers and sellers:
Rapid changes in the ask and bid ratio: The order book is witnessing huge changes in just a few seconds. At one moment, where the selling pressure is increasing, the ask order is reaching 92.6%, the next moment, the bid is jumping to 89.3% due to aggressive buying pressure.
Spoofing and algorithmic trading: The rapid order book turnover is largely due to the active presence of high-frequency trading bots (BOTS) and institutional liquidity providers in the market. Big traders are trying to hunt for stop-losses and sweep liquidity in this price bracket.
3. Technical indicators and crucial levels
MA60 Moving Average: Currently, the 60-period moving average (MA60) on the chart is at $0.10013. The current market price is testing support right above this MA60 line.
Psychological support ($0.1000): $0.1000 is a very important psychological support level. If the price closes below this level, it could fall back to the $0.0930 - $0.0880 zone.
Resistance Zone: The first hurdle for any short-term pullback or recovery will be the $0.1060 - $0.1100 zone.
Strategy and Risk Management for Traders
For Spot Traders: You should not get emotional and take entries due to this intense volatility in the live order book. Keep an eye on how tightly the price holds the $0.1000 support level and whether the selling pressure subsides or not.
For Futures and Leverage Traders: Such sudden increases and decreases in bid and ask can be a trap for futures traders to liquidate. In today's high-volatility market, it is essential to use strict stop-losses.
(Warning: Crypto markets are extremely risky. Please do your own research or DYOR before making any trading decisions.)
#Write2Earn #Binance #TrendingTopic
$TUT
{spot}(TUTUSDT)
TUT/USDT Market Analysis: Intense Volatility in Live Order Book and Role of Support Levels
A look at the recent trading activity and live order book of the TUT (Tutorial) token in the crypto market reveals a very dramatic and sensitive picture. After a huge correction in the last 24 hours, the price is currently in a consolidation phase at a certain support range.
Let's do a professional analysis of the current live market flow, liquidity shifts, and technical parameters.
1. Current Market Situation and Price Action
The TUT/USDT pair is currently trading in the $0.1000 to $0.1010 range, indicating a decline of about 13.3% to 14.0% in the last 24 hours.
High-Volatility Zone: The price is currently trying to find a bottom after a continuous decline from the 24-hour high of $0.13950. The 24-hour low was $0.08830.
Consolidation: The current price range is a make-or-break zone for short-term traders.
2. Order Book and Liquidity Analysis (Instant Momentum)
A deep analysis of the live trading flow and order book shows that there is a very intense battle going on between buyers and sellers:
Rapid changes in the ask and bid ratio: The order book is witnessing huge changes in just a few seconds. At one moment, where the selling pressure is increasing, the ask order is reaching 92.6%, the next moment, the bid is jumping to 89.3% due to aggressive buying pressure.
Spoofing and algorithmic trading: The rapid order book turnover is largely due to the active presence of high-frequency trading bots (BOTS) and institutional liquidity providers in the market. Big traders are trying to hunt for stop-losses and sweep liquidity in this price bracket.
3. Technical indicators and crucial levels
MA60 Moving Average: Currently, the 60-period moving average (MA60) on the chart is at $0.10013. The current market price is testing support right above this MA60 line.
Psychological support ($0.1000): $0.1000 is a very important psychological support level. If the price closes below this level, it could fall back to the $0.0930 - $0.0880 zone.
Resistance Zone: The first hurdle for any short-term pullback or recovery will be the $0.1060 - $0.1100 zone.
Strategy and Risk Management for Traders
For Spot Traders: You should not get emotional and take entries due to this intense volatility in the live order book. Keep an eye on how tightly the price holds the $0.1000 support level and whether the selling pressure subsides or not.
For Futures and Leverage Traders: Such sudden increases and decreases in bid and ask can be a trap for futures traders to liquidate. In today's high-volatility market, it is essential to use strict stop-losses.
(Warning: Crypto markets are extremely risky. Please do your own research or DYOR before making any trading decisions.)
#Write2Earn #Binance #TrendingTopic
$TUT
Let's do a professional analysis of the current live market flow, liquidity shifts, and technical parameters.
1. Current Market Situation and Price Action
The TUT/USDT pair is currently trading in the $0.1000 to $0.1010 range, indicating a decline of about 13.3% to 14.0% in the last 24 hours.
High-Volatility Zone: The price is currently trying to find a bottom after a continuous decline from the 24-hour high of $0.13950. The 24-hour low was $0.08830.
Consolidation: The current price range is a make-or-break zone for short-term traders.
2. Order Book and Liquidity Analysis (Instant Momentum)
A deep analysis of the live trading flow and order book shows that there is a very intense battle going on between buyers and sellers:
Rapid changes in the ask and bid ratio: The order book is witnessing huge changes in just a few seconds. At one moment, where the selling pressure is increasing, the ask order is reaching 92.6%, the next moment, the bid is jumping to 89.3% due to aggressive buying pressure.
Spoofing and algorithmic trading: The rapid order book turnover is largely due to the active presence of high-frequency trading bots (BOTS) and institutional liquidity providers in the market. Big traders are trying to hunt for stop-losses and sweep liquidity in this price bracket.
3. Technical indicators and crucial levels
MA60 Moving Average: Currently, the 60-period moving average (MA60) on the chart is at $0.10013. The current market price is testing support right above this MA60 line.
Psychological support ($0.1000): $0.1000 is a very important psychological support level. If the price closes below this level, it could fall back to the $0.0930 - $0.0880 zone.
Resistance Zone: The first hurdle for any short-term pullback or recovery will be the $0.1060 - $0.1100 zone.
Strategy and Risk Management for Traders
For Spot Traders: You should not get emotional and take entries due to this intense volatility in the live order book. Keep an eye on how tightly the price holds the $0.1000 support level and whether the selling pressure subsides or not.
For Futures and Leverage Traders: Such sudden increases and decreases in bid and ask can be a trap for futures traders to liquidate. In today's high-volatility market, it is essential to use strict stop-losses.
(Warning: Crypto markets are extremely risky. Please do your own research or DYOR before making any trading decisions.)
#Write2Earn #Binance #TrendingTopic
$TUT
1
213
·
--
Article
Market Update: BANK Token Hemorrhage and Bitcoin (BTC) Mega Dump Warning!Friends! Today I will discuss two important topics with you. The first is the current status of Lorenzo Protocol’s BANK/USDT token and the second is an analyst’s scary but realistic roadmap for Bitcoin (BTC). Let’s see what the data says.
1. BANK/USDT - Dip Buy or Trap?
The BANK token chart is bound to raise anyone’s eyebrows. Let’s do its technical and money flow analysis:
A Severe Fall: The token is currently trading at $0.0439 and is down about 10.77% in the last 24 hours. But the scariest thing is that it has fallen about 89.06% in the last 7 days! Such a big drop in just a week indicates that there has been a huge sell-off.
Order Book Psychology: Interestingly, in the order book we see a bid volume of 62.90% and an ask volume of 37.10%. This means that ordinary retail traders think this is a huge discount and they are placing buy orders below (especially 0.0437 and below).
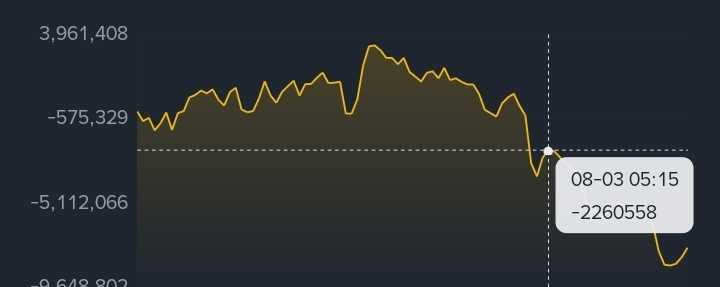
Money Flow - What are the whales doing? The money flow chart says otherwise. The net money inflow in the last 24 hours is negative (-15.11 million BANK). Out of this, large orders or whales have sold about 11.58 million tokens, while small retail traders have bought only 5.81 million tokens. Looking at the data for the last 5 days, we see a large outflow of about 78.66 million. That is, the whales are leaving the goods, and the common people are holding the bags.
Technical indicators: RSI(6) is currently around 67.82, which shows a slight recovery attempt in the short-term, but the overall OBV (On-Balance Volume) is in the -19 million range, which confirms strong selling pressure.
My opinion: Taking an entry in BANK token now may be like jumping in front of a moving train. It is wise to wait until the whales stop selling.
2. Bitcoin (BTC) Macro View: Are we heading towards $30,000?
A post by a crypto analyst named KLAI on social media has caused quite a stir, which we should all pay attention to.
Bitcoin recently dropped below $63,000. Most people think "the worst is over" when they see a small red candle, but according to the analyst, the market is making the same mistake over and over again.
His possible roadmap is:
There could be a fake breakout near $60,000, followed by a flush or crash to $30,000.
Timeline: Bitcoin could make a bottom at $30,000 to $40,000 in September or October this year.
Then a breakout to $80,000 in December and a peak of $145,000 by early 2027.
The biggest fear is not the market crash itself, but the overconfidence that people have right before it crashes. Just like it did at $83,000 and $65,000.
The market is extremely volatile right now. Altcoins like BANK are bleeding and BTC charts are also giving warning. Keep funds for DCA (Dollar Cost Averaging) in spot trading and definitely use strict stop-loss in futures trading.
(This is not financial advice. Be sure to do your own research (DYOR) before taking any trade.)
What do you think? Will Bitcoin really go to $30,000, or will it pump from here? Let me know in the comments!
#Write2Earn #Binance #TrendingTopic
$BANK
Market Update: BANK Token Hemorrhage and Bitcoin (BTC) Mega Dump Warning!
Friends! Today I will discuss two important topics with you. The first is the current status of Lorenzo Protocol’s BANK/USDT token and the second is an analyst’s scary but realistic roadmap for Bitcoin (BTC). Let’s see what the data says.
1. BANK/USDT - Dip Buy or Trap?
The BANK token chart is bound to raise anyone’s eyebrows. Let’s do its technical and money flow analysis:
A Severe Fall: The token is currently trading at $0.0439 and is down about 10.77% in the last 24 hours. But the scariest thing is that it has fallen about 89.06% in the last 7 days! Such a big drop in just a week indicates that there has been a huge sell-off.
Order Book Psychology: Interestingly, in the order book we see a bid volume of 62.90% and an ask volume of 37.10%. This means that ordinary retail traders think this is a huge discount and they are placing buy orders below (especially 0.0437 and below).
Money Flow - What are the whales doing? The money flow chart says otherwise. The net money inflow in the last 24 hours is negative (-15.11 million BANK). Out of this, large orders or whales have sold about 11.58 million tokens, while small retail traders have bought only 5.81 million tokens. Looking at the data for the last 5 days, we see a large outflow of about 78.66 million. That is, the whales are leaving the goods, and the common people are holding the bags.
Technical indicators: RSI(6) is currently around 67.82, which shows a slight recovery attempt in the short-term, but the overall OBV (On-Balance Volume) is in the -19 million range, which confirms strong selling pressure.
My opinion: Taking an entry in BANK token now may be like jumping in front of a moving train. It is wise to wait until the whales stop selling.
2. Bitcoin (BTC) Macro View: Are we heading towards $30,000?
A post by a crypto analyst named KLAI on social media has caused quite a stir, which we should all pay attention to.
Bitcoin recently dropped below $63,000. Most people think "the worst is over" when they see a small red candle, but according to the analyst, the market is making the same mistake over and over again.
His possible roadmap is:
There could be a fake breakout near $60,000, followed by a flush or crash to $30,000.
Timeline: Bitcoin could make a bottom at $30,000 to $40,000 in September or October this year.
Then a breakout to $80,000 in December and a peak of $145,000 by early 2027.
The biggest fear is not the market crash itself, but the overconfidence that people have right before it crashes. Just like it did at $83,000 and $65,000.
The market is extremely volatile right now. Altcoins like BANK are bleeding and BTC charts are also giving warning. Keep funds for DCA (Dollar Cost Averaging) in spot trading and definitely use strict stop-loss in futures trading.
(This is not financial advice. Be sure to do your own research (DYOR) before taking any trade.)
What do you think? Will Bitcoin really go to $30,000, or will it pump from here? Let me know in the comments!
#Write2Earn #Binance #TrendingTopic
$BANK
1. BANK/USDT - Dip Buy or Trap?
The BANK token chart is bound to raise anyone’s eyebrows. Let’s do its technical and money flow analysis:
A Severe Fall: The token is currently trading at $0.0439 and is down about 10.77% in the last 24 hours. But the scariest thing is that it has fallen about 89.06% in the last 7 days! Such a big drop in just a week indicates that there has been a huge sell-off.
Order Book Psychology: Interestingly, in the order book we see a bid volume of 62.90% and an ask volume of 37.10%. This means that ordinary retail traders think this is a huge discount and they are placing buy orders below (especially 0.0437 and below).
Money Flow - What are the whales doing? The money flow chart says otherwise. The net money inflow in the last 24 hours is negative (-15.11 million BANK). Out of this, large orders or whales have sold about 11.58 million tokens, while small retail traders have bought only 5.81 million tokens. Looking at the data for the last 5 days, we see a large outflow of about 78.66 million. That is, the whales are leaving the goods, and the common people are holding the bags.
Technical indicators: RSI(6) is currently around 67.82, which shows a slight recovery attempt in the short-term, but the overall OBV (On-Balance Volume) is in the -19 million range, which confirms strong selling pressure.
My opinion: Taking an entry in BANK token now may be like jumping in front of a moving train. It is wise to wait until the whales stop selling.
2. Bitcoin (BTC) Macro View: Are we heading towards $30,000?
A post by a crypto analyst named KLAI on social media has caused quite a stir, which we should all pay attention to.
Bitcoin recently dropped below $63,000. Most people think "the worst is over" when they see a small red candle, but according to the analyst, the market is making the same mistake over and over again.
His possible roadmap is:
There could be a fake breakout near $60,000, followed by a flush or crash to $30,000.
Timeline: Bitcoin could make a bottom at $30,000 to $40,000 in September or October this year.
Then a breakout to $80,000 in December and a peak of $145,000 by early 2027.
The biggest fear is not the market crash itself, but the overconfidence that people have right before it crashes. Just like it did at $83,000 and $65,000.
The market is extremely volatile right now. Altcoins like BANK are bleeding and BTC charts are also giving warning. Keep funds for DCA (Dollar Cost Averaging) in spot trading and definitely use strict stop-loss in futures trading.
(This is not financial advice. Be sure to do your own research (DYOR) before taking any trade.)
What do you think? Will Bitcoin really go to $30,000, or will it pump from here? Let me know in the comments!
#Write2Earn #Binance #TrendingTopic
$BANK
1
224
·
--
Article
ARX (Arcium) Technical Analysis: Is a Bullish Relief Rally Incoming?Technical Indicator Breakdown
1. Price Action & Bollinger Bands
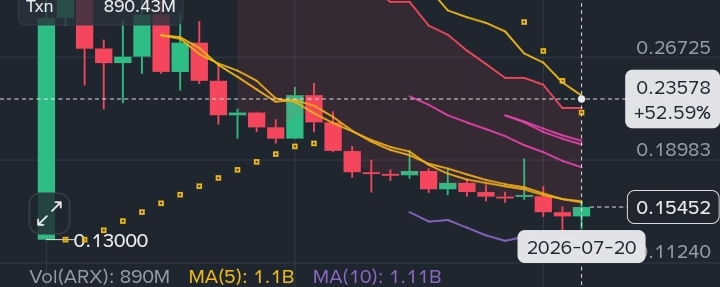
Support Bounce: ARX price found strong support at its recent bottom at $0.13000. As per the chart, the price successfully bounced back by touching the lower band of the Bollinger Band ($0.13057).
Moving Averages: The price is currently trading just below the MA(7) - $0.15793. If this level is broken, the next target will be the MA(25) - $0.20161.
2. Momentum Indicators (Oversold Recovery)
RSI (6): The RSI is currently at 31.93. This indicates that the market was in a severely oversold zone and now buyers are returning to the market from there.
Stochastic RSI: Stochastic RSI is reversing from the oversold zone (17.35), which is a clear signal of bullish momentum.
KDJ Indicator: KDJ is showing a positive crossover (J line has risen to 39.22), which increases the possibility of a price pump in the short-term.
Trading Strategy & Targets
Quick Note: The market is trying to create a bottom, so proper stop-loss must be used before taking any trade.
Immediate Resistance (Target 1): $0.15793 (MA 7 Breakout Confirmation)
Major Resistance (Target 2): $0.18448 (Bollinger Middle Band)
Bullish Target (Target 3): $0.20161 (MA 25)
Stop Loss (Invalidation Zone): If the daily candle closes below $0.13000, this bullish theory will be invalidated.
Conclusion
According to the overall indicator analysis, ARX is currently showing Seller Exhaustion. If the market remains stable with Bitcoin (BTC) movement, we can see a good Bullish Relief Rally or bounce back from ARX very soon.
Disclaimer: This analysis is for educational and informational purposes only and should not be considered as financial, investment, or trading advice. Cryptocurrency markets are highly volatile and carry a significant level of risk. Always DYOR (Do Your Own Research) and consult with a professional financial advisor before making any investment decisions. The author is not responsible for any financial losses incurred from trading based on this information.
#Write2Earn #WIF #Binance #TrendingTopic $BNB $ETH
{spot}(BNBUSDT)
ARX (Arcium) Technical Analysis: Is a Bullish Relief Rally Incoming?
Technical Indicator Breakdown
1. Price Action & Bollinger Bands
Support Bounce: ARX price found strong support at its recent bottom at $0.13000. As per the chart, the price successfully bounced back by touching the lower band of the Bollinger Band ($0.13057).
Moving Averages: The price is currently trading just below the MA(7) - $0.15793. If this level is broken, the next target will be the MA(25) - $0.20161.
2. Momentum Indicators (Oversold Recovery)
RSI (6): The RSI is currently at 31.93. This indicates that the market was in a severely oversold zone and now buyers are returning to the market from there.
Stochastic RSI: Stochastic RSI is reversing from the oversold zone (17.35), which is a clear signal of bullish momentum.
KDJ Indicator: KDJ is showing a positive crossover (J line has risen to 39.22), which increases the possibility of a price pump in the short-term.
Trading Strategy & Targets
Quick Note: The market is trying to create a bottom, so proper stop-loss must be used before taking any trade.
Immediate Resistance (Target 1): $0.15793 (MA 7 Breakout Confirmation)
Major Resistance (Target 2): $0.18448 (Bollinger Middle Band)
Bullish Target (Target 3): $0.20161 (MA 25)
Stop Loss (Invalidation Zone): If the daily candle closes below $0.13000, this bullish theory will be invalidated.
Conclusion
According to the overall indicator analysis, ARX is currently showing Seller Exhaustion. If the market remains stable with Bitcoin (BTC) movement, we can see a good Bullish Relief Rally or bounce back from ARX very soon.
Disclaimer: This analysis is for educational and informational purposes only and should not be considered as financial, investment, or trading advice. Cryptocurrency markets are highly volatile and carry a significant level of risk. Always DYOR (Do Your Own Research) and consult with a professional financial advisor before making any investment decisions. The author is not responsible for any financial losses incurred from trading based on this information.
#Write2Earn #WIF #Binance #TrendingTopic $BNB $ETH
1. Price Action & Bollinger Bands
Support Bounce: ARX price found strong support at its recent bottom at $0.13000. As per the chart, the price successfully bounced back by touching the lower band of the Bollinger Band ($0.13057).
Moving Averages: The price is currently trading just below the MA(7) - $0.15793. If this level is broken, the next target will be the MA(25) - $0.20161.
2. Momentum Indicators (Oversold Recovery)
RSI (6): The RSI is currently at 31.93. This indicates that the market was in a severely oversold zone and now buyers are returning to the market from there.
Stochastic RSI: Stochastic RSI is reversing from the oversold zone (17.35), which is a clear signal of bullish momentum.
KDJ Indicator: KDJ is showing a positive crossover (J line has risen to 39.22), which increases the possibility of a price pump in the short-term.
Trading Strategy & Targets
Quick Note: The market is trying to create a bottom, so proper stop-loss must be used before taking any trade.
Immediate Resistance (Target 1): $0.15793 (MA 7 Breakout Confirmation)
Major Resistance (Target 2): $0.18448 (Bollinger Middle Band)
Bullish Target (Target 3): $0.20161 (MA 25)
Stop Loss (Invalidation Zone): If the daily candle closes below $0.13000, this bullish theory will be invalidated.
Conclusion
According to the overall indicator analysis, ARX is currently showing Seller Exhaustion. If the market remains stable with Bitcoin (BTC) movement, we can see a good Bullish Relief Rally or bounce back from ARX very soon.
Disclaimer: This analysis is for educational and informational purposes only and should not be considered as financial, investment, or trading advice. Cryptocurrency markets are highly volatile and carry a significant level of risk. Always DYOR (Do Your Own Research) and consult with a professional financial advisor before making any investment decisions. The author is not responsible for any financial losses incurred from trading based on this information.
#Write2Earn #WIF #Binance #TrendingTopic $BNB $ETH
1
438
·
--
Article
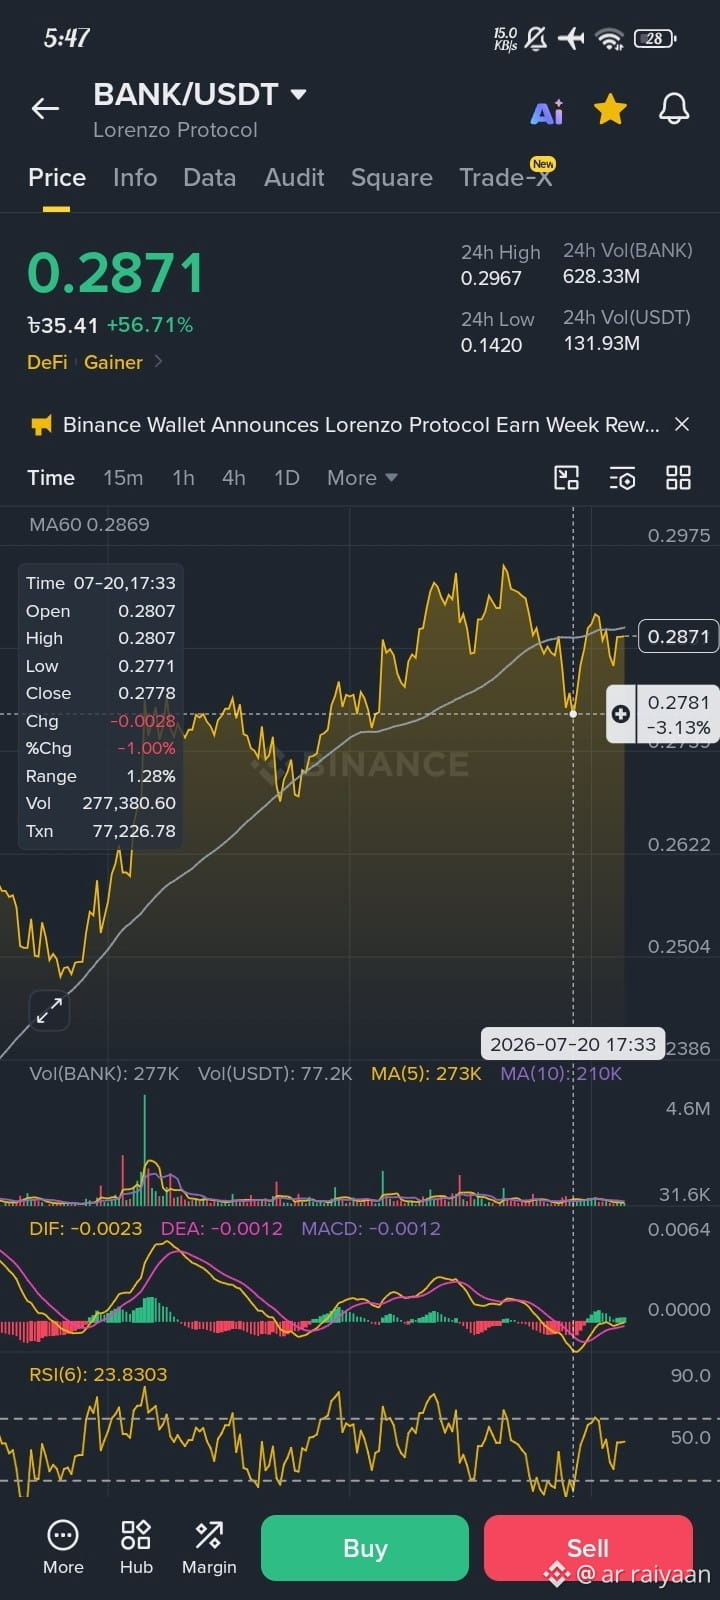
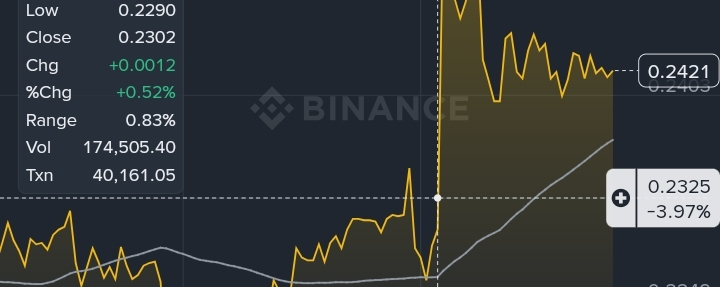
$BANK/USDT Breakout: What are technical indicators and on-chain data signaling?The way the BANK/USDT pair is performing right now is simply amazing! It has gained about 129% in the last 24 hours and has firmly established itself as one of the top gainers in the market. After such a big movement, it is natural for traders to book some profits. And that is why the price is now recovering a little, approaching $0.24.
However, the most positive thing for me is that the price has not crashed. On the contrary, it has held its ground just above the MA60 (Moving Average 60). This clearly shows that the buyers are still in complete control of the market.
What are the indicators actually indicating?
If I look at the indicators on the shorter timeframe, I see several interesting things:
RSI and Stochastic RSI: Both indicators are now in the extremely 'oversold' zone. In particular, StochRSI has hit a low (10.03). In my experience, historically, there is a great chance for the price to bounce back very quickly from this position.
KDJ and MACD: The J-line of the KDJ indicator is currently down to 17.43, which is an early signal of a bullish reversal. On the other hand, the MACD histogram is showing a slight reddish momentum or a slight fading of the green line. However, there is nothing to panic about; the market is just catching its breath after a huge marathon.
Order Book and Money Flow: The Real Game Inside
What makes me more optimistic than technical analysis is its order book and whale activity.
If you look at the order book data, you will see that it is heavily tilted to one side. Where 78.43% of bids are placed to buy, only 21.57% of ask for sell. Most importantly, a huge 'Buy Wall' has been formed between $0.2399 and $0.2400. This means that buyers are waiting to take advantage of any slight drop in price.
Looking at the money flow, it's a sight to behold! There has been a net positive inflow of about $66.91M in the last 24 hours. Most importantly, large institutional investors and whales have injected about $18.00M into the market in a single day. This means that big players are getting quite a lot of confidence in this project.
Movements in the next few hours and my trading strategy
Considering the current data, I think the market can turn in two possible directions in the next few hours:
Bullish scenario (highly likely): A strong buy wall, whale backup and bottomed-out RSI make the $0.24 level a perfect launchpad. If the price turns around from here, our first target will be $0.255. And if this barrier is broken, the price will go on to retest its recent high of $0.27.
Warning zone: If the selling pressure in the market suddenly increases a lot and for some reason the support at $0.232 breaks, the next line of defense will be $0.225. However, given the depth of the order book, I don't think the bears (sellers) will be able to break this level easily.
My personal tip: Never rush into the crypto market and pour all your capital in at once. The smartest thing to do is to do DCA (Dollar-Cost Averaging) with small entries around $0.24. And to protect your funds, I would definitely recommend using a tight stop-loss just below $0.225.
Disclaimer: The information and analysis shared in this article/post is for general information and educational purposes only. It is not financial advice of any kind. The cryptocurrency market is highly volatile and risky; major market changes or financial losses can occur at any time. Before investing or trading in any token, you must conduct your own due diligence and research (DYOR - Do Your Own Research). Neither the author nor this platform will be responsible for any profit or loss you may incur.
#Write2Earn #WIF #Binance #TrendingTopic #Write2Earn!
$BANK $BTC $BNB
$BANK/USDT Breakout: What are technical indicators and on-chain data signaling?
The way the BANK/USDT pair is performing right now is simply amazing! It has gained about 129% in the last 24 hours and has firmly established itself as one of the top gainers in the market. After such a big movement, it is natural for traders to book some profits. And that is why the price is now recovering a little, approaching $0.24.
However, the most positive thing for me is that the price has not crashed. On the contrary, it has held its ground just above the MA60 (Moving Average 60). This clearly shows that the buyers are still in complete control of the market.
What are the indicators actually indicating?
If I look at the indicators on the shorter timeframe, I see several interesting things:
RSI and Stochastic RSI: Both indicators are now in the extremely 'oversold' zone. In particular, StochRSI has hit a low (10.03). In my experience, historically, there is a great chance for the price to bounce back very quickly from this position.
KDJ and MACD: The J-line of the KDJ indicator is currently down to 17.43, which is an early signal of a bullish reversal. On the other hand, the MACD histogram is showing a slight reddish momentum or a slight fading of the green line. However, there is nothing to panic about; the market is just catching its breath after a huge marathon.
Order Book and Money Flow: The Real Game Inside
What makes me more optimistic than technical analysis is its order book and whale activity.
If you look at the order book data, you will see that it is heavily tilted to one side. Where 78.43% of bids are placed to buy, only 21.57% of ask for sell. Most importantly, a huge 'Buy Wall' has been formed between $0.2399 and $0.2400. This means that buyers are waiting to take advantage of any slight drop in price.
Looking at the money flow, it's a sight to behold! There has been a net positive inflow of about $66.91M in the last 24 hours. Most importantly, large institutional investors and whales have injected about $18.00M into the market in a single day. This means that big players are getting quite a lot of confidence in this project.
Movements in the next few hours and my trading strategy
Considering the current data, I think the market can turn in two possible directions in the next few hours:
Bullish scenario (highly likely): A strong buy wall, whale backup and bottomed-out RSI make the $0.24 level a perfect launchpad. If the price turns around from here, our first target will be $0.255. And if this barrier is broken, the price will go on to retest its recent high of $0.27.
Warning zone: If the selling pressure in the market suddenly increases a lot and for some reason the support at $0.232 breaks, the next line of defense will be $0.225. However, given the depth of the order book, I don't think the bears (sellers) will be able to break this level easily.
My personal tip: Never rush into the crypto market and pour all your capital in at once. The smartest thing to do is to do DCA (Dollar-Cost Averaging) with small entries around $0.24. And to protect your funds, I would definitely recommend using a tight stop-loss just below $0.225.
Disclaimer: The information and analysis shared in this article/post is for general information and educational purposes only. It is not financial advice of any kind. The cryptocurrency market is highly volatile and risky; major market changes or financial losses can occur at any time. Before investing or trading in any token, you must conduct your own due diligence and research (DYOR - Do Your Own Research). Neither the author nor this platform will be responsible for any profit or loss you may incur.
#Write2Earn #WIF #Binance #TrendingTopic #Write2Earn!
$BANK $BTC $BNB
However, the most positive thing for me is that the price has not crashed. On the contrary, it has held its ground just above the MA60 (Moving Average 60). This clearly shows that the buyers are still in complete control of the market.
What are the indicators actually indicating?
If I look at the indicators on the shorter timeframe, I see several interesting things:
RSI and Stochastic RSI: Both indicators are now in the extremely 'oversold' zone. In particular, StochRSI has hit a low (10.03). In my experience, historically, there is a great chance for the price to bounce back very quickly from this position.
KDJ and MACD: The J-line of the KDJ indicator is currently down to 17.43, which is an early signal of a bullish reversal. On the other hand, the MACD histogram is showing a slight reddish momentum or a slight fading of the green line. However, there is nothing to panic about; the market is just catching its breath after a huge marathon.
Order Book and Money Flow: The Real Game Inside
What makes me more optimistic than technical analysis is its order book and whale activity.
If you look at the order book data, you will see that it is heavily tilted to one side. Where 78.43% of bids are placed to buy, only 21.57% of ask for sell. Most importantly, a huge 'Buy Wall' has been formed between $0.2399 and $0.2400. This means that buyers are waiting to take advantage of any slight drop in price.
Looking at the money flow, it's a sight to behold! There has been a net positive inflow of about $66.91M in the last 24 hours. Most importantly, large institutional investors and whales have injected about $18.00M into the market in a single day. This means that big players are getting quite a lot of confidence in this project.
Movements in the next few hours and my trading strategy
Considering the current data, I think the market can turn in two possible directions in the next few hours:
Bullish scenario (highly likely): A strong buy wall, whale backup and bottomed-out RSI make the $0.24 level a perfect launchpad. If the price turns around from here, our first target will be $0.255. And if this barrier is broken, the price will go on to retest its recent high of $0.27.
Warning zone: If the selling pressure in the market suddenly increases a lot and for some reason the support at $0.232 breaks, the next line of defense will be $0.225. However, given the depth of the order book, I don't think the bears (sellers) will be able to break this level easily.
My personal tip: Never rush into the crypto market and pour all your capital in at once. The smartest thing to do is to do DCA (Dollar-Cost Averaging) with small entries around $0.24. And to protect your funds, I would definitely recommend using a tight stop-loss just below $0.225.
Disclaimer: The information and analysis shared in this article/post is for general information and educational purposes only. It is not financial advice of any kind. The cryptocurrency market is highly volatile and risky; major market changes or financial losses can occur at any time. Before investing or trading in any token, you must conduct your own due diligence and research (DYOR - Do Your Own Research). Neither the author nor this platform will be responsible for any profit or loss you may incur.
#Write2Earn #WIF #Binance #TrendingTopic #Write2Earn!
$BANK $BTC $BNB
1
290
·
--
Article
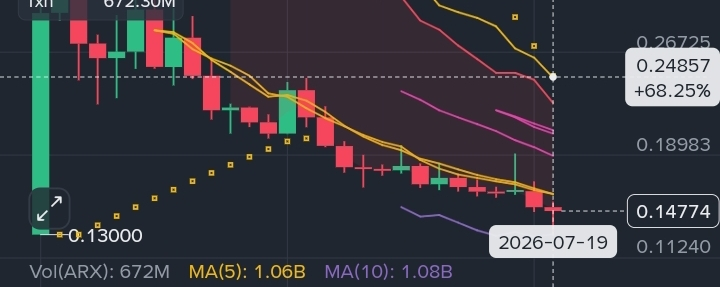
ARX (Arcium) Technical Analysis: Is the Oversold RSI Signaling a Short-Term Bounce?Today, we will do an in-depth analysis of the ARX (Arcium) token based on on-chain data and daily (1D) charts from Binance Web3 Wallet.
The token is currently in an important price zone, which may attract the attention of short-term traders.
🔍 ARX On-Chain Metrics at a Glance
Before moving on to the trading charts, let’s take a look at the fundamentals and on-chain status of the token:
Current Price: $0.14774 (down about 1.11% to 1.35% in the last 24 hours)
Market Cap: $30.83M (A micro-cap gem, so expect some wild price actions!)
Fully Diluted Valuation (FDV): (Huge gap here, meaning massive token unlocks could dilute the supply later. Keep an eye on it!)
Chain Liquidity: $1.24M (Liquidity is a bit tight, so expect higher slippage if you are throwing in big orders.)
Total Chain Holders: 47,107 (Its holder base is quite strong as a low-cap token)
📉 Technical Analysis (1D Chart Analysis)
1. Trend and Moving Average (MA)
According to the daily chart (1D), ARX has been bleeding heavily in a strong bearish trend over the past few days.
MA(7) indicator is currently at $0.16056 and MA(25) is currently at $0.20595.
Since the current price ($0.14774) is below these two moving averages, bears are clearly dominating the short to medium-term action.
2. Deeply Oversold RSI
The most important and interesting part of this chart is its RSI (6) indicator. Currently, the RSI has dropped to the 18.10 level.
💡 Note: As a general rule, when the RSI falls below 30, it is considered 'oversold'. An RSI falling to 18.10 means that the selling pressure has reached its peak and the market may show a relief rally or price rebound at any time.
3. Important Support and Resistance Levels
Main Support: According to the chart, $0.13000 is a very important psychological and technical support level just below the current level.
Nearby Resistance: If the price bounces from here, the first hurdle will be $0.16056 (MA 7). If it can be overcome, the next target could be $0.20595 (MA 25).
🎯 Conclusion & Strategy
Technically, ARX is currently at the bottom or oversold zone, which can be a good entry zone for risk-takers or short-term bounce traders. However, keep in mind that such coins are very risky due to low liquidity and high FDV.
Bullish Scenario: If the price can hold the $0.13000 support, a quick bounce to $0.160 - $0.200 can be seen due to the oversold RSI.
Bearish Scenario: If the price closes the daily candle below $0.13000, the downtrend may be prolonged.
⚠️ Disclaimer: This is not financial advice. Crypto markets are extremely risky, so please do your own research (DYOR) before taking any trades.
#TrendingTopic #Write2Earn #WIF #Binance #altcoins
ARX (Arcium) Technical Analysis: Is the Oversold RSI Signaling a Short-Term Bounce?
Today, we will do an in-depth analysis of the ARX (Arcium) token based on on-chain data and daily (1D) charts from Binance Web3 Wallet.
The token is currently in an important price zone, which may attract the attention of short-term traders.
🔍 ARX On-Chain Metrics at a Glance
Before moving on to the trading charts, let’s take a look at the fundamentals and on-chain status of the token:
Current Price: $0.14774 (down about 1.11% to 1.35% in the last 24 hours)
Market Cap: $30.83M (A micro-cap gem, so expect some wild price actions!)
Fully Diluted Valuation (FDV): (Huge gap here, meaning massive token unlocks could dilute the supply later. Keep an eye on it!)
Chain Liquidity: $1.24M (Liquidity is a bit tight, so expect higher slippage if you are throwing in big orders.)
Total Chain Holders: 47,107 (Its holder base is quite strong as a low-cap token)
📉 Technical Analysis (1D Chart Analysis)
1. Trend and Moving Average (MA)
According to the daily chart (1D), ARX has been bleeding heavily in a strong bearish trend over the past few days.
MA(7) indicator is currently at $0.16056 and MA(25) is currently at $0.20595.
Since the current price ($0.14774) is below these two moving averages, bears are clearly dominating the short to medium-term action.
2. Deeply Oversold RSI
The most important and interesting part of this chart is its RSI (6) indicator. Currently, the RSI has dropped to the 18.10 level.
💡 Note: As a general rule, when the RSI falls below 30, it is considered 'oversold'. An RSI falling to 18.10 means that the selling pressure has reached its peak and the market may show a relief rally or price rebound at any time.
3. Important Support and Resistance Levels
Main Support: According to the chart, $0.13000 is a very important psychological and technical support level just below the current level.
Nearby Resistance: If the price bounces from here, the first hurdle will be $0.16056 (MA 7). If it can be overcome, the next target could be $0.20595 (MA 25).
🎯 Conclusion & Strategy
Technically, ARX is currently at the bottom or oversold zone, which can be a good entry zone for risk-takers or short-term bounce traders. However, keep in mind that such coins are very risky due to low liquidity and high FDV.
Bullish Scenario: If the price can hold the $0.13000 support, a quick bounce to $0.160 - $0.200 can be seen due to the oversold RSI.
Bearish Scenario: If the price closes the daily candle below $0.13000, the downtrend may be prolonged.
⚠️ Disclaimer: This is not financial advice. Crypto markets are extremely risky, so please do your own research (DYOR) before taking any trades.
#TrendingTopic #Write2Earn #WIF #Binance #altcoins
The token is currently in an important price zone, which may attract the attention of short-term traders.
🔍 ARX On-Chain Metrics at a Glance
Before moving on to the trading charts, let’s take a look at the fundamentals and on-chain status of the token:
Current Price: $0.14774 (down about 1.11% to 1.35% in the last 24 hours)
Market Cap: $30.83M (A micro-cap gem, so expect some wild price actions!)
Fully Diluted Valuation (FDV): (Huge gap here, meaning massive token unlocks could dilute the supply later. Keep an eye on it!)
Chain Liquidity: $1.24M (Liquidity is a bit tight, so expect higher slippage if you are throwing in big orders.)
Total Chain Holders: 47,107 (Its holder base is quite strong as a low-cap token)
📉 Technical Analysis (1D Chart Analysis)
1. Trend and Moving Average (MA)
According to the daily chart (1D), ARX has been bleeding heavily in a strong bearish trend over the past few days.
MA(7) indicator is currently at $0.16056 and MA(25) is currently at $0.20595.
Since the current price ($0.14774) is below these two moving averages, bears are clearly dominating the short to medium-term action.
2. Deeply Oversold RSI
The most important and interesting part of this chart is its RSI (6) indicator. Currently, the RSI has dropped to the 18.10 level.
💡 Note: As a general rule, when the RSI falls below 30, it is considered 'oversold'. An RSI falling to 18.10 means that the selling pressure has reached its peak and the market may show a relief rally or price rebound at any time.
3. Important Support and Resistance Levels
Main Support: According to the chart, $0.13000 is a very important psychological and technical support level just below the current level.
Nearby Resistance: If the price bounces from here, the first hurdle will be $0.16056 (MA 7). If it can be overcome, the next target could be $0.20595 (MA 25).
🎯 Conclusion & Strategy
Technically, ARX is currently at the bottom or oversold zone, which can be a good entry zone for risk-takers or short-term bounce traders. However, keep in mind that such coins are very risky due to low liquidity and high FDV.
Bullish Scenario: If the price can hold the $0.13000 support, a quick bounce to $0.160 - $0.200 can be seen due to the oversold RSI.
Bearish Scenario: If the price closes the daily candle below $0.13000, the downtrend may be prolonged.
⚠️ Disclaimer: This is not financial advice. Crypto markets are extremely risky, so please do your own research (DYOR) before taking any trades.
#TrendingTopic #Write2Earn #WIF #Binance #altcoins
1
629
Log in to explore more content
Join global crypto users on Binance Square
⚡️ Get latest and useful information about crypto.
💬 Trusted by the world’s largest crypto exchange.
👍 Discover real insights from verified creators.
Email / Phone number
Trending Topics
AIStocksWhatNext
56,899 views
467 Discussing
Share & Win Traffic Reward in our Trending Hashtag Campaign
✨Topic: What Other Investment Opportunities Remain as AI Stocks Keep Rising?
👉How to Join:
Publish a short post or article with hashtag #AIStocksWhatNext
Share whether you’re bullish or bearish, and post your AI stock holdings or trade — using the trade widget may improve your eligibility.
You can also strengthen your post by sharing data or charts, and avoiding AI-generated images.
✍️Create content based on the below angles:
- Nvidia says chip sales will double next year, and top AI companies keep hitting record revenue, the compute spend behind it is just as staggering. Is AI demand really taking off? And how long can it last? AI stocks are up across the board. Is this a real breakout, or just a short-term bounce?
- Industry leaders are calling to slow down AI development, while Trump plans to build an “AI Force”, claiming AI could account for 25% of U.S. GDP in the future. Whose side are you on? Will state-level backing be a long-term win for AI stocks?
- Are you buying AI stocks? Share your AI-related trade/holdings with our trade sharing widget.
⏰Campaign Period:
- 2026-09-22 7:00 - 2026-09-24 4:00 UTC
🎁Reward:
- Qualified posts that comply with the above guidelines and contain more than 100 words will be reviewed and may receive a random traffic boost of 500 to 3,000 views. You will receive a notification from your feed secretary if your post is selected.
- Get a chance to have your article featured on Binance Square Official
Need ideas for your post? Visit the topic page #AIStocksWhatNext or the Square Guide on How to Post for Better Reach.
Binance Square Official
·164 Likes
·204.6k views
MuseOvertakesChatGPTAsTopFreeIOSApp
500 views
15 Discussing
TokenizedStockPlatformsCouldLaunchNextQuarter
1,557 views
30 Discussing