

比特大熊
598 Posts

比特大熊
Report
Block User
推特X:(xf199045)公众号:比特大熊X
Frequent Trader
3 Years
3 Following
303 Followers
484 Liked
Posts
All
Quotes
Videos
·
--
Bollinger Band Interpretation (1 Hour)
$BTC previously dipped to 82,501, touched the lower Bollinger Band, and then staged an oversold rebound. It has now returned to the area near the middle band, around 83,317.
Resistance above: 84,000–84,600; Support below: 82,600–82,500.
The Bollinger Bands are currently narrowing, signaling clear range-bound behavior. At this stage there is no confirmed breakout into a clear one-direction move—watch whether price can hold above the middle band.
After falling to 2,633 and touching the lower band, price rebounded. The current price is around 2,700, above the middle Bollinger Band.
Resistance above: 2,705–2,720; Support below: 2,640–2,630.
This is also a corrective rebound after the lower-band touch. Since the Bollinger Band width is contracting, the short-term view should be treated as a range-bound correction.
After a big drop, don’t assume it’s an outright reversal. This looks more like a rebound and repair following oversold conditions.
The lower-band support brings a bounce, but the Bollinger Bands have not yet reopened upward. Don’t rush to chase longs. If key support is retested and not broken, that’s when opportunities may appear. Even if the rebound moves into the resistance zone, be alert to the possibility of renewed pressure and rejection.
#This week brings key Non-Farm Payrolls (NFP) and PCE data
Bollinger Band Interpretation (1 Hour)
$BTC previously dipped to 82,501, touched the lower Bollinger Band, and then staged an oversold rebound. It has now returned to the area near the middle band, around 83,317.
Resistance above: 84,000–84,600; Support below: 82,600–82,500.
The Bollinger Bands are currently narrowing, signaling clear range-bound behavior. At this stage there is no confirmed breakout into a clear one-direction move—watch whether price can hold above the middle band.
After falling to 2,633 and touching the lower band, price rebounded. The current price is around 2,700, above the middle Bollinger Band.
Resistance above: 2,705–2,720; Support below: 2,640–2,630.
This is also a corrective rebound after the lower-band touch. Since the Bollinger Band width is contracting, the short-term view should be treated as a range-bound correction.
After a big drop, don’t assume it’s an outright reversal. This looks more like a rebound and repair following oversold conditions.
The lower-band support brings a bounce, but the Bollinger Bands have not yet reopened upward. Don’t rush to chase longs. If key support is retested and not broken, that’s when opportunities may appear. Even if the rebound moves into the resistance zone, be alert to the possibility of renewed pressure and rejection.
#This week brings key Non-Farm Payrolls (NFP) and PCE data
$BTC previously dipped to 82,501, touched the lower Bollinger Band, and then staged an oversold rebound. It has now returned to the area near the middle band, around 83,317.
Resistance above: 84,000–84,600; Support below: 82,600–82,500.
The Bollinger Bands are currently narrowing, signaling clear range-bound behavior. At this stage there is no confirmed breakout into a clear one-direction move—watch whether price can hold above the middle band.
After falling to 2,633 and touching the lower band, price rebounded. The current price is around 2,700, above the middle Bollinger Band.
Resistance above: 2,705–2,720; Support below: 2,640–2,630.
This is also a corrective rebound after the lower-band touch. Since the Bollinger Band width is contracting, the short-term view should be treated as a range-bound correction.
After a big drop, don’t assume it’s an outright reversal. This looks more like a rebound and repair following oversold conditions.
The lower-band support brings a bounce, but the Bollinger Bands have not yet reopened upward. Don’t rush to chase longs. If key support is retested and not broken, that’s when opportunities may appear. Even if the rebound moves into the resistance zone, be alert to the possibility of renewed pressure and rejection.
#This week brings key Non-Farm Payrolls (NFP) and PCE data
172
·
--
High-quality strategy deployed again ✅
Lie in wait in advance—never play catch-up after the fact
Get the direction right and nail the entry level—this round of profit will be safely pocketed
Opportunities always favor people who execute with a plan
It’s not luck—it’s having a solid understanding of the market structure
Stay in rhythm, and here comes another big bite
High-quality strategy deployed again ✅
Lie in wait in advance—never play catch-up after the fact
Get the direction right and nail the entry level—this round of profit will be safely pocketed
Opportunities always favor people who execute with a plan
It’s not luck—it’s having a solid understanding of the market structure
Stay in rhythm, and here comes another big bite
Lie in wait in advance—never play catch-up after the fact
Get the direction right and nail the entry level—this round of profit will be safely pocketed
Opportunities always favor people who execute with a plan
It’s not luck—it’s having a solid understanding of the market structure
Stay in rhythm, and here comes another big bite


1
16
·
--
📊 1-hour Bollinger Band chart interpretation:
$BTC: Previously, it tested the upper Bollinger Band and faced resistance before pulling back. It has now already fallen below the Bollinger middle band and is moving closer to the lower band; 84,400–84,600 has shifted from support to resistance. In the short term, support is seen at 83,500–83,200. If it continues to break down, it may test around 82,800.
$ETH: Similarly, it met resistance at the upper band and formed a downturn. After breaking below the middle band, it fell quickly; the current price is already near the lower band. 2,690–2,700 has turned into resistance. The first support below is 2,645–2,630. If the lower band cannot hold, downside room will open further.
In this up-move, price failed to hold above the upper band. Bullish momentum has weakened; after encountering pressure, it returned to a pullback rhythm—i.e., the high-to-short logic given yesterday is playing out. Now that price has fallen to the lower Bollinger Band, note that there may be a short-term oversold rebound and recovery. Don’t blindly chase shorts.
📊 1-hour Bollinger Band chart interpretation:
$BTC: Previously, it tested the upper Bollinger Band and faced resistance before pulling back. It has now already fallen below the Bollinger middle band and is moving closer to the lower band; 84,400–84,600 has shifted from support to resistance. In the short term, support is seen at 83,500–83,200. If it continues to break down, it may test around 82,800.
$ETH: Similarly, it met resistance at the upper band and formed a downturn. After breaking below the middle band, it fell quickly; the current price is already near the lower band. 2,690–2,700 has turned into resistance. The first support below is 2,645–2,630. If the lower band cannot hold, downside room will open further.
In this up-move, price failed to hold above the upper band. Bullish momentum has weakened; after encountering pressure, it returned to a pullback rhythm—i.e., the high-to-short logic given yesterday is playing out. Now that price has fallen to the lower Bollinger Band, note that there may be a short-term oversold rebound and recovery. Don’t blindly chase shorts.
$BTC: Previously, it tested the upper Bollinger Band and faced resistance before pulling back. It has now already fallen below the Bollinger middle band and is moving closer to the lower band; 84,400–84,600 has shifted from support to resistance. In the short term, support is seen at 83,500–83,200. If it continues to break down, it may test around 82,800.
$ETH: Similarly, it met resistance at the upper band and formed a downturn. After breaking below the middle band, it fell quickly; the current price is already near the lower band. 2,690–2,700 has turned into resistance. The first support below is 2,645–2,630. If the lower band cannot hold, downside room will open further.
In this up-move, price failed to hold above the upper band. Bullish momentum has weakened; after encountering pressure, it returned to a pullback rhythm—i.e., the high-to-short logic given yesterday is playing out. Now that price has fallen to the lower Bollinger Band, note that there may be a short-term oversold rebound and recovery. Don’t blindly chase shorts.
1
408
·
--
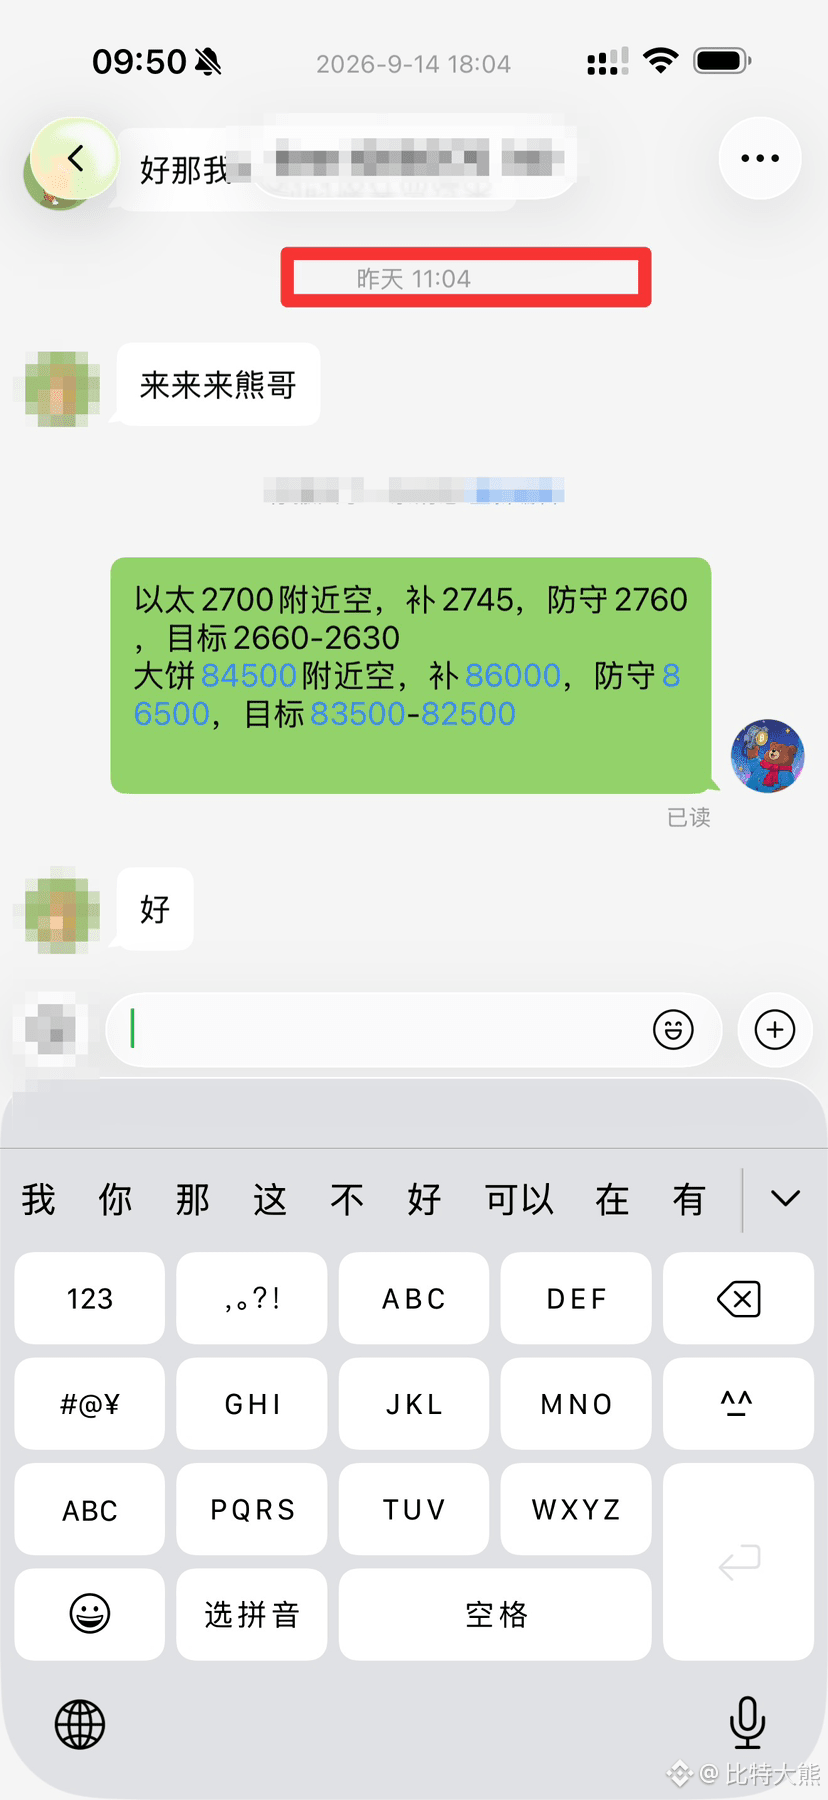
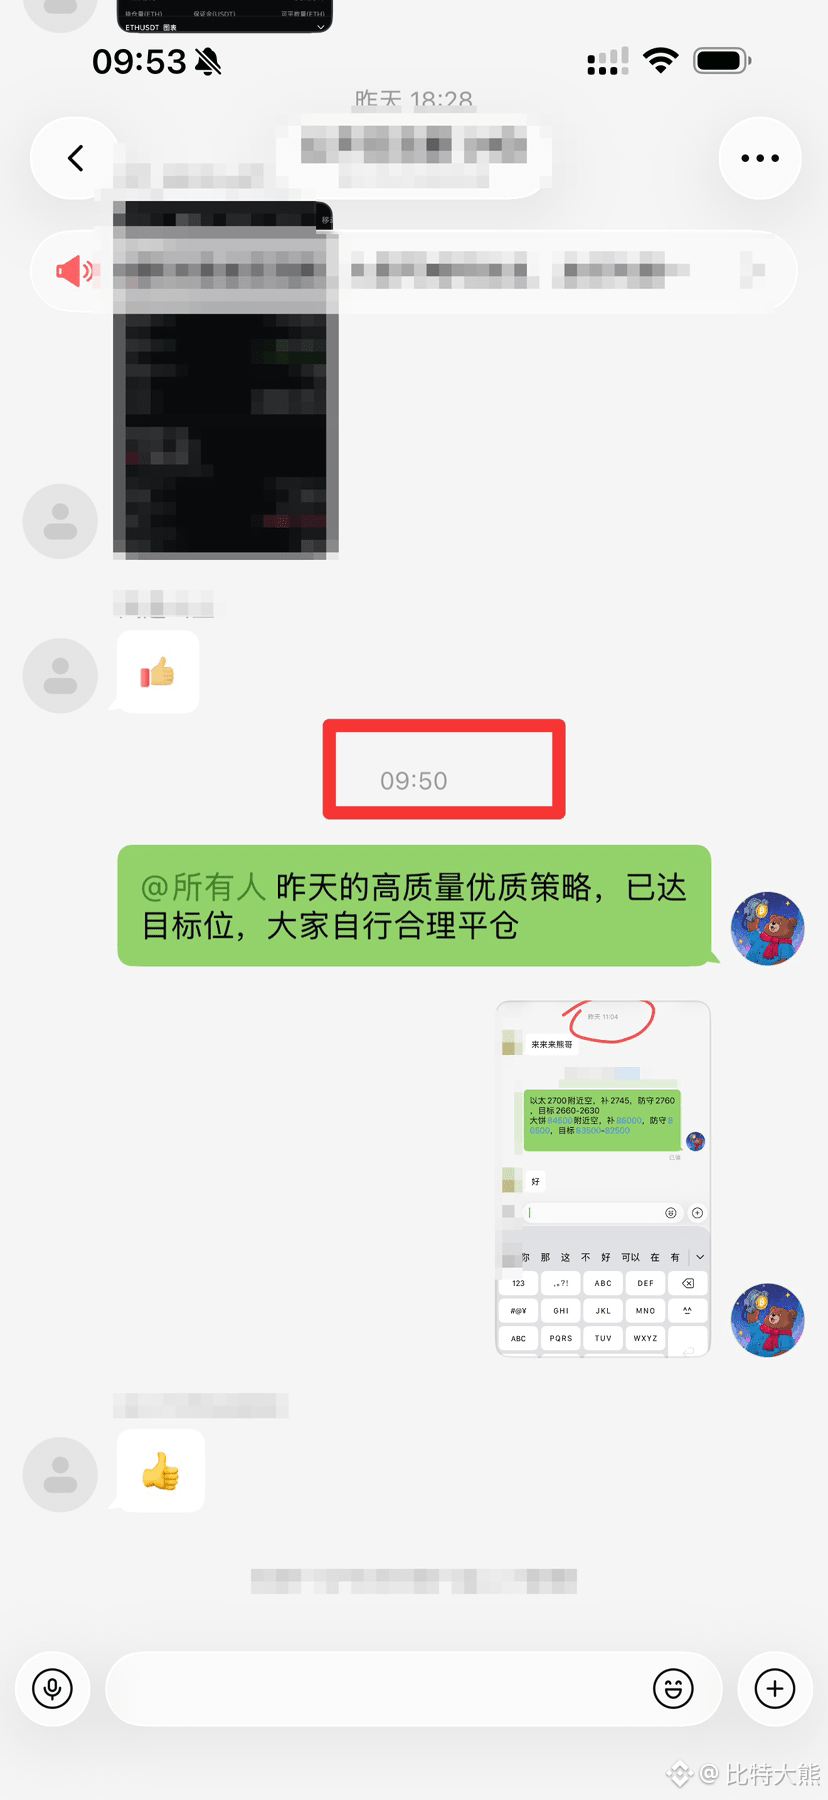
Let’s review it again—this wasn’t something we only noticed now that prices are falling.
Yesterday morning, I shared this high-altitude (short) strategy with everyone.
Shorts on $ETH 2700 and $BTC 84500—
this morning they already hit the target levels, and all profits are fully realized!
The market never lacks opportunities; what’s missing is seeing the structure in advance and being willing to execute according to the plan!
Let’s review it again—this wasn’t something we only noticed now that prices are falling.
Yesterday morning, I shared this high-altitude (short) strategy with everyone.
Shorts on $ETH 2700 and $BTC 84500—
this morning they already hit the target levels, and all profits are fully realized!
The market never lacks opportunities; what’s missing is seeing the structure in advance and being willing to execute according to the plan!
Yesterday morning, I shared this high-altitude (short) strategy with everyone.
Shorts on $ETH 2700 and $BTC 84500—
this morning they already hit the target levels, and all profits are fully realized!
The market never lacks opportunities; what’s missing is seeing the structure in advance and being willing to execute according to the plan!
1
372
·
--
In the morning, around Ether 2700, there’s a steady hold and take profit for 30 to 40 points.
In the evening, continue with high-altitude setups for Bitcoin 84700 and Ether 2720.
There’s no divine prediction in the market—only structures you can read. When price reaches the level, execute; the rest is up to the market.
What I fear most isn’t being wrong on direction, but being given a clear plan and still losing to frequent entries and one’s mindset.
In the morning, around Ether 2700, there’s a steady hold and take profit for 30 to 40 points.
In the evening, continue with high-altitude setups for Bitcoin 84700 and Ether 2720.
There’s no divine prediction in the market—only structures you can read. When price reaches the level, execute; the rest is up to the market.
What I fear most isn’t being wrong on direction, but being given a clear plan and still losing to frequent entries and one’s mindset.
In the evening, continue with high-altitude setups for Bitcoin 84700 and Ether 2720.
There’s no divine prediction in the market—only structures you can read. When price reaches the level, execute; the rest is up to the market.
What I fear most isn’t being wrong on direction, but being given a clear plan and still losing to frequent entries and one’s mindset.


436
·
--
Before #BTC , the price surged higher to touch 87374, then once it reached the upper band it started to fall back. Now it is retracing toward the middle band. The Bollinger Bands are still trending upward, but the upper band has slightly turned, and bullish momentum has eased. Right now, after a big rally, the market has entered a digestion-and-consolidation phase.
Key support: 83400‑83600; resistance: 86300‑87400
#ETH peaked at 2806, touched the upper band and then was rejected before falling back. It is now consolidating around the area below the middle band. The channel is still opening upward, but after the spike there are signs of exhaustion.
Key support: 2630‑2640; resistance: 2740‑2780
Market logic:
After a strong push higher, the price is moving back from the upper Bollinger band toward the middle band, which is a typical repair phase following an explosive surge. At the moment, it is not clearly trending one way—what matters is whether price can regain and hold above the middle band. If it holds, there is a chance to push higher again to test the top area. If the middle band is broken directly, it will likely continue down to retrace toward the lower band.
Before #BTC , the price surged higher to touch 87374, then once it reached the upper band it started to fall back. Now it is retracing toward the middle band. The Bollinger Bands are still trending upward, but the upper band has slightly turned, and bullish momentum has eased. Right now, after a big rally, the market has entered a digestion-and-consolidation phase.
Key support: 83400‑83600; resistance: 86300‑87400
#ETH peaked at 2806, touched the upper band and then was rejected before falling back. It is now consolidating around the area below the middle band. The channel is still opening upward, but after the spike there are signs of exhaustion.
Key support: 2630‑2640; resistance: 2740‑2780
Market logic:
After a strong push higher, the price is moving back from the upper Bollinger band toward the middle band, which is a typical repair phase following an explosive surge. At the moment, it is not clearly trending one way—what matters is whether price can regain and hold above the middle band. If it holds, there is a chance to push higher again to test the top area. If the middle band is broken directly, it will likely continue down to retrace toward the lower band.
Key support: 83400‑83600; resistance: 86300‑87400
#ETH peaked at 2806, touched the upper band and then was rejected before falling back. It is now consolidating around the area below the middle band. The channel is still opening upward, but after the spike there are signs of exhaustion.
Key support: 2630‑2640; resistance: 2740‑2780
Market logic:
After a strong push higher, the price is moving back from the upper Bollinger band toward the middle band, which is a typical repair phase following an explosive surge. At the moment, it is not clearly trending one way—what matters is whether price can regain and hold above the middle band. If it holds, there is a chance to push higher again to test the top area. If the middle band is broken directly, it will likely continue down to retrace toward the lower band.
368
·
--
I publicly stated my views at 12:20 noon yesterday. Repeated surges are just an emotion-driven “scam pump-and-dump” to lure people into positions.
A real bull market would not repeatedly offer retail investors a chance to board and “be picked up.”
The market price action won’t lie. It has consistently maintained bearish signals, and my conviction is that a large-scale decline will eventually be realized.
After I issued the viewpoint, the market delivered as expected:
Bitcoin (the big one) saw a maximum drop of over 4%, and Ethereum saw a maximum drop of over 6%.
Trading is all about reading the market structure in advance, not letting short-term bear traps and hype-driven pumps pull your emotions off course.
Follow the trend, stick to your judgment of the structure, and time will eventually provide the answer.#美联储加息是否已成定局
I publicly stated my views at 12:20 noon yesterday. Repeated surges are just an emotion-driven “scam pump-and-dump” to lure people into positions.
A real bull market would not repeatedly offer retail investors a chance to board and “be picked up.”
The market price action won’t lie. It has consistently maintained bearish signals, and my conviction is that a large-scale decline will eventually be realized.
After I issued the viewpoint, the market delivered as expected:
Bitcoin (the big one) saw a maximum drop of over 4%, and Ethereum saw a maximum drop of over 6%.
Trading is all about reading the market structure in advance, not letting short-term bear traps and hype-driven pumps pull your emotions off course.
Follow the trend, stick to your judgment of the structure, and time will eventually provide the answer.#美联储加息是否已成定局
A real bull market would not repeatedly offer retail investors a chance to board and “be picked up.”
The market price action won’t lie. It has consistently maintained bearish signals, and my conviction is that a large-scale decline will eventually be realized.
After I issued the viewpoint, the market delivered as expected:
Bitcoin (the big one) saw a maximum drop of over 4%, and Ethereum saw a maximum drop of over 6%.
Trading is all about reading the market structure in advance, not letting short-term bear traps and hype-driven pumps pull your emotions off course.
Follow the trend, stick to your judgment of the structure, and time will eventually provide the answer.#美联储加息是否已成定局
比特大熊
·
--
Always been playing around with short-term trades; every time it rises, it’s driven by emotion, but the market is still staying very real.
If it were truly bullish, it wouldn’t be like this—it wouldn’t give retail investors any chance to catch the downturn and get a run; it would go straight up for a while.
So I firmly believe a huge crash is about to come! $ETH
If it were truly bullish, it wouldn’t be like this—it wouldn’t give retail investors any chance to catch the downturn and get a run; it would go straight up for a while.
So I firmly believe a huge crash is about to come! $ETH
1
290
·
--
Always been playing around with short-term trades; every time it rises, it’s driven by emotion, but the market is still staying very real.
If it were truly bullish, it wouldn’t be like this—it wouldn’t give retail investors any chance to catch the downturn and get a run; it would go straight up for a while.
So I firmly believe a huge crash is about to come! $ETH
{future}(ETHUSDT)
Always been playing around with short-term trades; every time it rises, it’s driven by emotion, but the market is still staying very real.
If it were truly bullish, it wouldn’t be like this—it wouldn’t give retail investors any chance to catch the downturn and get a run; it would go straight up for a while.
So I firmly believe a huge crash is about to come! $ETH
If it were truly bullish, it wouldn’t be like this—it wouldn’t give retail investors any chance to catch the downturn and get a run; it would go straight up for a while.
So I firmly believe a huge crash is about to come! $ETH
1
1
245
·
--
$BTC (Bitcoin)4-hour chart
Current price: 76562. Bollinger Bands parameters: middle band 77096.3, upper band 77637.4, lower band 76555.1
1. Market structure: On the 4-hour timeframe, the overall structure is consolidating in a low range after a downward move. The price is right near the lower band; the lower band forms short-term support at 76555, which closely matches the current price.
2. Key levels
✅ Support: 76550 (lower Bollinger band). Strong support at 75866 (prior swing low). If the price breaks below the lower band, the market may continue to probe lower.
✅ Resistance: First resistance at 77096 (middle Bollinger band). Second resistance at 77637 (upper Bollinger band). Only if price stands above the middle band will the bearish pressure be temporarily eased.
3. Market interpretation
The Bollinger Bands are opening downward, indicating a weaker overall trend. The current price is at the edge of the lower band, so there is potential for a short-term pullback and rebound to repair the move. However, until the price holds above the middle band, the overall outlook remains bearish and range-bound—do not blindly chase longs.
$ETH (Ethereum)4-hour chart
Current price: 2472.34. Bollinger Bands parameters: middle band 2501.27, upper band 2566.61, lower band 2435.93
1. Market structure: A surge then rejection occurred on the 4-hour chart. The price fell all the way from the upper Bollinger band and is currently running below the middle band, entering a consolidation pullback phase.
2. Key levels
✅ Support: First support at 2436 (lower Bollinger band). The prior low around 2400 is strong support.
✅ Resistance: First resistance at 2501 (middle Bollinger band). Second resistance at 2566 (upper Bollinger band).
3. Market interpretation
After the previous wave of rapid upside, funds were realized and the price pulled back. You are currently in the pullback phase. 2436 is an important defensive level; if the lower band holds, the market will maintain a wide-range consolidation. If it breaks, further downside is likely. For a rebound to continue, price needs to hold above 2501 (the middle band) to gain the chance to challenge the prior high again.
Overall summary
For BTC, price is hugging the lower band, with an expectation of a short-term rebound; the larger structure remains weak. For ETH, the market surged then fell back, entering a pullback consolidation range. Use both coins’ Bollinger bands to reference range trading: until the price breaks out of the band, prioritize a range-based approach; once it breaks, follow the trend. Keep position sizing tightly controlled.
{future}(ETHUSDT)
{future}(BTCUSDT)
$BTC (Bitcoin)4-hour chart
Current price: 76562. Bollinger Bands parameters: middle band 77096.3, upper band 77637.4, lower band 76555.1
1. Market structure: On the 4-hour timeframe, the overall structure is consolidating in a low range after a downward move. The price is right near the lower band; the lower band forms short-term support at 76555, which closely matches the current price.
2. Key levels
✅ Support: 76550 (lower Bollinger band). Strong support at 75866 (prior swing low). If the price breaks below the lower band, the market may continue to probe lower.
✅ Resistance: First resistance at 77096 (middle Bollinger band). Second resistance at 77637 (upper Bollinger band). Only if price stands above the middle band will the bearish pressure be temporarily eased.
3. Market interpretation
The Bollinger Bands are opening downward, indicating a weaker overall trend. The current price is at the edge of the lower band, so there is potential for a short-term pullback and rebound to repair the move. However, until the price holds above the middle band, the overall outlook remains bearish and range-bound—do not blindly chase longs.
$ETH (Ethereum)4-hour chart
Current price: 2472.34. Bollinger Bands parameters: middle band 2501.27, upper band 2566.61, lower band 2435.93
1. Market structure: A surge then rejection occurred on the 4-hour chart. The price fell all the way from the upper Bollinger band and is currently running below the middle band, entering a consolidation pullback phase.
2. Key levels
✅ Support: First support at 2436 (lower Bollinger band). The prior low around 2400 is strong support.
✅ Resistance: First resistance at 2501 (middle Bollinger band). Second resistance at 2566 (upper Bollinger band).
3. Market interpretation
After the previous wave of rapid upside, funds were realized and the price pulled back. You are currently in the pullback phase. 2436 is an important defensive level; if the lower band holds, the market will maintain a wide-range consolidation. If it breaks, further downside is likely. For a rebound to continue, price needs to hold above 2501 (the middle band) to gain the chance to challenge the prior high again.
Overall summary
For BTC, price is hugging the lower band, with an expectation of a short-term rebound; the larger structure remains weak. For ETH, the market surged then fell back, entering a pullback consolidation range. Use both coins’ Bollinger bands to reference range trading: until the price breaks out of the band, prioritize a range-based approach; once it breaks, follow the trend. Keep position sizing tightly controlled.
Current price: 76562. Bollinger Bands parameters: middle band 77096.3, upper band 77637.4, lower band 76555.1
1. Market structure: On the 4-hour timeframe, the overall structure is consolidating in a low range after a downward move. The price is right near the lower band; the lower band forms short-term support at 76555, which closely matches the current price.
2. Key levels
✅ Support: 76550 (lower Bollinger band). Strong support at 75866 (prior swing low). If the price breaks below the lower band, the market may continue to probe lower.
✅ Resistance: First resistance at 77096 (middle Bollinger band). Second resistance at 77637 (upper Bollinger band). Only if price stands above the middle band will the bearish pressure be temporarily eased.
3. Market interpretation
The Bollinger Bands are opening downward, indicating a weaker overall trend. The current price is at the edge of the lower band, so there is potential for a short-term pullback and rebound to repair the move. However, until the price holds above the middle band, the overall outlook remains bearish and range-bound—do not blindly chase longs.
$ETH (Ethereum)4-hour chart
Current price: 2472.34. Bollinger Bands parameters: middle band 2501.27, upper band 2566.61, lower band 2435.93
1. Market structure: A surge then rejection occurred on the 4-hour chart. The price fell all the way from the upper Bollinger band and is currently running below the middle band, entering a consolidation pullback phase.
2. Key levels
✅ Support: First support at 2436 (lower Bollinger band). The prior low around 2400 is strong support.
✅ Resistance: First resistance at 2501 (middle Bollinger band). Second resistance at 2566 (upper Bollinger band).
3. Market interpretation
After the previous wave of rapid upside, funds were realized and the price pulled back. You are currently in the pullback phase. 2436 is an important defensive level; if the lower band holds, the market will maintain a wide-range consolidation. If it breaks, further downside is likely. For a rebound to continue, price needs to hold above 2501 (the middle band) to gain the chance to challenge the prior high again.
Overall summary
For BTC, price is hugging the lower band, with an expectation of a short-term rebound; the larger structure remains weak. For ETH, the market surged then fell back, entering a pullback consolidation range. Use both coins’ Bollinger bands to reference range trading: until the price breaks out of the band, prioritize a range-based approach; once it breaks, follow the trend. Keep position sizing tightly controlled.
190
·
--
Yesterday’s Ethereum 2420 rebound and accumulation play was very impressive. The market fulfilled expectations as planned—soaring to a high of 2475. If you followed and were on board with the setup, you can safely secure a profit of 50+ points from this move.
Yesterday’s Ethereum 2420 rebound and accumulation play was very impressive. The market fulfilled expectations as planned—soaring to a high of 2475. If you followed and were on board with the setup, you can safely secure a profit of 50+ points from this move.

1
174
·
--
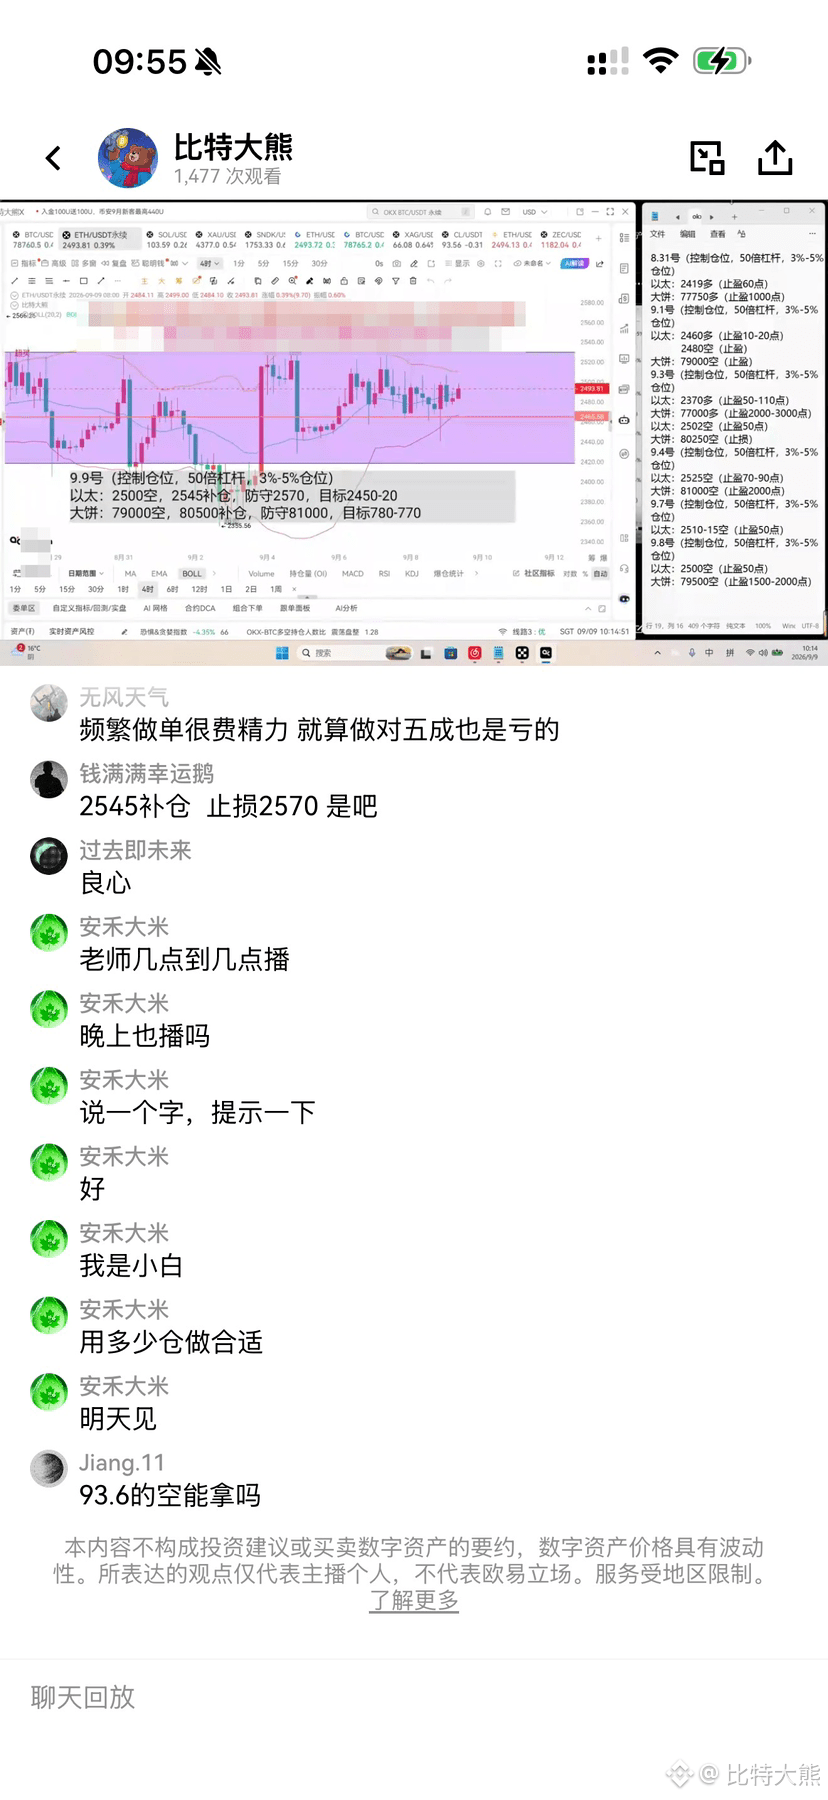
On September 10th, I’ll give everyone the layout strategy directly.
First, look at the chart: on the 4-hour timeframe, the Bollinger Bands are narrowing, and price action is moving within a range. This is range-bound consolidation, not a one-way trend. In this kind of market, don’t chase or cut losses blindly. The key is to place orders at key levels and wait for price to come to you.
As for Ethereum, it’s currently consolidating around 2460. We have two sets of plans:
1) Short from the 2500–2515 zone directly. Then we’ll add at 2560. Defense level: 2585. Targets: 2450–2420.
2) Go long at 2420. Add at 2376. Defense level: 2350. Targets: 2460–2480.
Both directions have profit space. In a range-bound market, you can repeatedly capture gains.
For Bitcoin, it’s currently around 78,000, with a similar two-sided setup:
- Long below 77,000. Add at 75,500. Defense level: 75,000. Targets: 78,500–79,500.
- Short above 79,000. Add at 81,000. Defense level: 81,500. Targets: 78,000–77,000.
This high-level shorting idea—we’ve already been eating it live on air for three straight days!
Let me emphasize once more: 50x leverage, position sizing at 3%-5%, and strictly use protective stops.
What range markets fear most is not being able to hold your positions and constantly flipping trades. Identify the range, then be patient and wait; act only when price reaches your levels.
On September 10th, I’ll give everyone the layout strategy directly.
First, look at the chart: on the 4-hour timeframe, the Bollinger Bands are narrowing, and price action is moving within a range. This is range-bound consolidation, not a one-way trend. In this kind of market, don’t chase or cut losses blindly. The key is to place orders at key levels and wait for price to come to you.
As for Ethereum, it’s currently consolidating around 2460. We have two sets of plans:
1) Short from the 2500–2515 zone directly. Then we’ll add at 2560. Defense level: 2585. Targets: 2450–2420.
2) Go long at 2420. Add at 2376. Defense level: 2350. Targets: 2460–2480.
Both directions have profit space. In a range-bound market, you can repeatedly capture gains.
For Bitcoin, it’s currently around 78,000, with a similar two-sided setup:
- Long below 77,000. Add at 75,500. Defense level: 75,000. Targets: 78,500–79,500.
- Short above 79,000. Add at 81,000. Defense level: 81,500. Targets: 78,000–77,000.
This high-level shorting idea—we’ve already been eating it live on air for three straight days!
Let me emphasize once more: 50x leverage, position sizing at 3%-5%, and strictly use protective stops.
What range markets fear most is not being able to hold your positions and constantly flipping trades. Identify the range, then be patient and wait; act only when price reaches your levels.
First, look at the chart: on the 4-hour timeframe, the Bollinger Bands are narrowing, and price action is moving within a range. This is range-bound consolidation, not a one-way trend. In this kind of market, don’t chase or cut losses blindly. The key is to place orders at key levels and wait for price to come to you.
As for Ethereum, it’s currently consolidating around 2460. We have two sets of plans:
1) Short from the 2500–2515 zone directly. Then we’ll add at 2560. Defense level: 2585. Targets: 2450–2420.
2) Go long at 2420. Add at 2376. Defense level: 2350. Targets: 2460–2480.
Both directions have profit space. In a range-bound market, you can repeatedly capture gains.
For Bitcoin, it’s currently around 78,000, with a similar two-sided setup:
- Long below 77,000. Add at 75,500. Defense level: 75,000. Targets: 78,500–79,500.
- Short above 79,000. Add at 81,000. Defense level: 81,500. Targets: 78,000–77,000.
This high-level shorting idea—we’ve already been eating it live on air for three straight days!
Let me emphasize once more: 50x leverage, position sizing at 3%-5%, and strictly use protective stops.
What range markets fear most is not being able to hold your positions and constantly flipping trades. Identify the range, then be patient and wait; act only when price reaches your levels.
1
203
·
--
In the same place, with the same goal—shorting with a high-level layout for three consecutive days, and each round grabs a decent profit.
Many people always think the market is hard to trade. Actually, it’s not that the market is complicated—it’s that people keep fantasizing about a one-way trend that runs all the way.
Most of the time, the market is just range-bound: sell at the high-resistance level, buy at the low-support level, trade the swings back and forth. Isn’t that great?
Slowly, steadily, put the USDT into your pocket—earning money like that, isn’t it comfortable?
For a range-bound market, you don’t need to bet on a sudden blowout move up or down. Identify the key resistance and support, stick to the structure when trading, and don’t chase breakouts or panic-sell. If you follow this, profits will keep coming to you.
But range-bound markets also aren’t for blindly placing trades. Position sizing and stop-losses are just as important. If you trade frequently and乱来, even with a 50% win rate, you’ll still end up losing.
Don’t be fixated on hoping for a big one-way move. If you can consistently and reliably capture money from a range-bound market, you’ve already outperformed most traders.
In the same place, with the same goal—shorting with a high-level layout for three consecutive days, and each round grabs a decent profit.
Many people always think the market is hard to trade. Actually, it’s not that the market is complicated—it’s that people keep fantasizing about a one-way trend that runs all the way.
Most of the time, the market is just range-bound: sell at the high-resistance level, buy at the low-support level, trade the swings back and forth. Isn’t that great?
Slowly, steadily, put the USDT into your pocket—earning money like that, isn’t it comfortable?
For a range-bound market, you don’t need to bet on a sudden blowout move up or down. Identify the key resistance and support, stick to the structure when trading, and don’t chase breakouts or panic-sell. If you follow this, profits will keep coming to you.
But range-bound markets also aren’t for blindly placing trades. Position sizing and stop-losses are just as important. If you trade frequently and乱来, even with a 50% win rate, you’ll still end up losing.
Don’t be fixated on hoping for a big one-way move. If you can consistently and reliably capture money from a range-bound market, you’ve already outperformed most traders.
Many people always think the market is hard to trade. Actually, it’s not that the market is complicated—it’s that people keep fantasizing about a one-way trend that runs all the way.
Most of the time, the market is just range-bound: sell at the high-resistance level, buy at the low-support level, trade the swings back and forth. Isn’t that great?
Slowly, steadily, put the USDT into your pocket—earning money like that, isn’t it comfortable?
For a range-bound market, you don’t need to bet on a sudden blowout move up or down. Identify the key resistance and support, stick to the structure when trading, and don’t chase breakouts or panic-sell. If you follow this, profits will keep coming to you.
But range-bound markets also aren’t for blindly placing trades. Position sizing and stop-losses are just as important. If you trade frequently and乱来, even with a 50% win rate, you’ll still end up losing.
Don’t be fixated on hoping for a big one-way move. If you can consistently and reliably capture money from a range-bound market, you’ve already outperformed most traders.
1
179
·
--
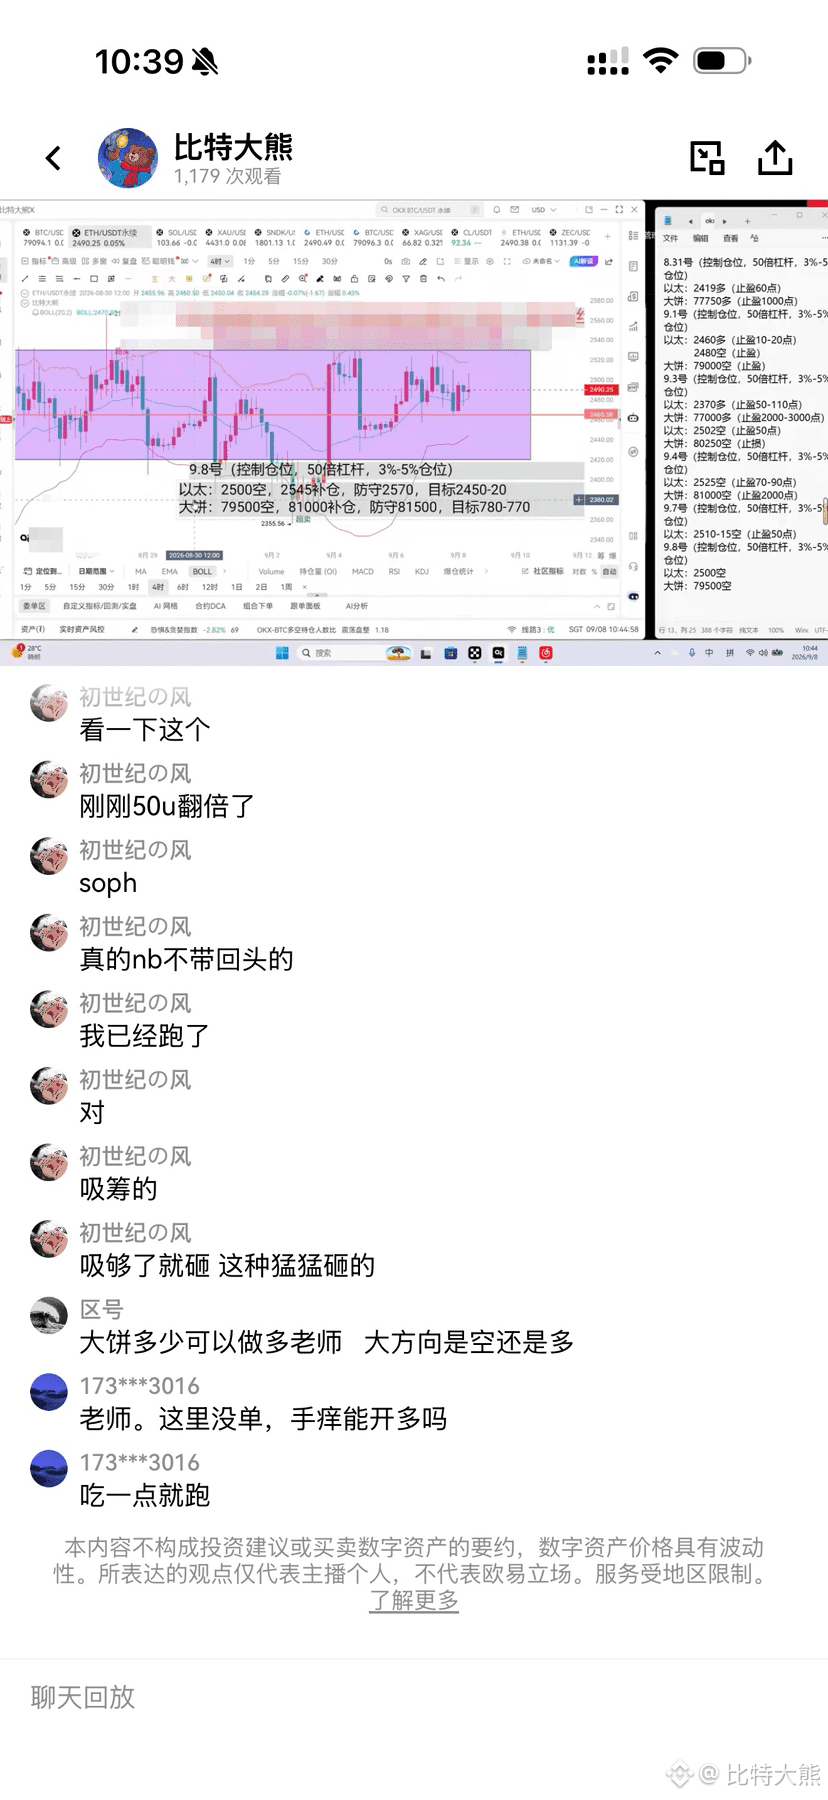
The other day in the livestream room we kept stressing the high-position short setup—giving the plan to short $ETH at 2500 and $BTC at 79500. After the US stock market opened, the price action broke out as expected, hitting the target levels precisely. The short positions were smoothly closed in profit.
This round wasn’t about luck or betting on direction. It was absolute certainty about the market trend and the timing of the main players’ accumulation and rinse-and-dump cycle. After the main players finished accumulating, they immediately slammed the price downward; the movement perfectly matched the structure we mapped out in advance.
Anyone who could keep up with the pace and strictly execute the plan made a huge profit in this round.
The other day in the livestream room we kept stressing the high-position short setup—giving the plan to short $ETH at 2500 and $BTC at 79500. After the US stock market opened, the price action broke out as expected, hitting the target levels precisely. The short positions were smoothly closed in profit.
This round wasn’t about luck or betting on direction. It was absolute certainty about the market trend and the timing of the main players’ accumulation and rinse-and-dump cycle. After the main players finished accumulating, they immediately slammed the price downward; the movement perfectly matched the structure we mapped out in advance.
Anyone who could keep up with the pace and strictly execute the plan made a huge profit in this round.
This round wasn’t about luck or betting on direction. It was absolute certainty about the market trend and the timing of the main players’ accumulation and rinse-and-dump cycle. After the main players finished accumulating, they immediately slammed the price downward; the movement perfectly matched the structure we mapped out in advance.
Anyone who could keep up with the pace and strictly execute the plan made a huge profit in this round.
1
131
·
--
SanDisk can’t hold it in anymore—about to have diarrhea? $SNDK
{future}(SNDKUSDT)
SanDisk can’t hold it in anymore—about to have diarrhea? $SNDK
1
144
·
--
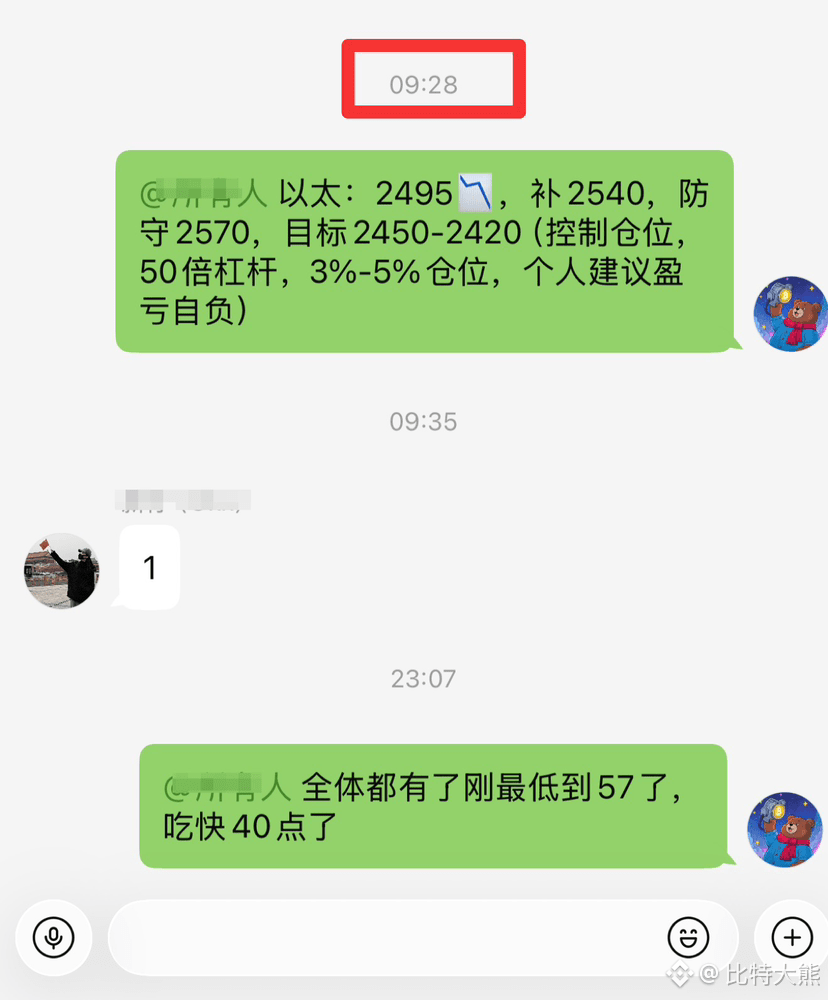
There's a chance to make a trade even on the weekend. This move is only seven points away from the target, and even the drop to 57 still captured nearly forty points.
There's a chance to make a trade even on the weekend. This move is only seven points away from the target, and even the drop to 57 still captured nearly forty points.
98
·
--
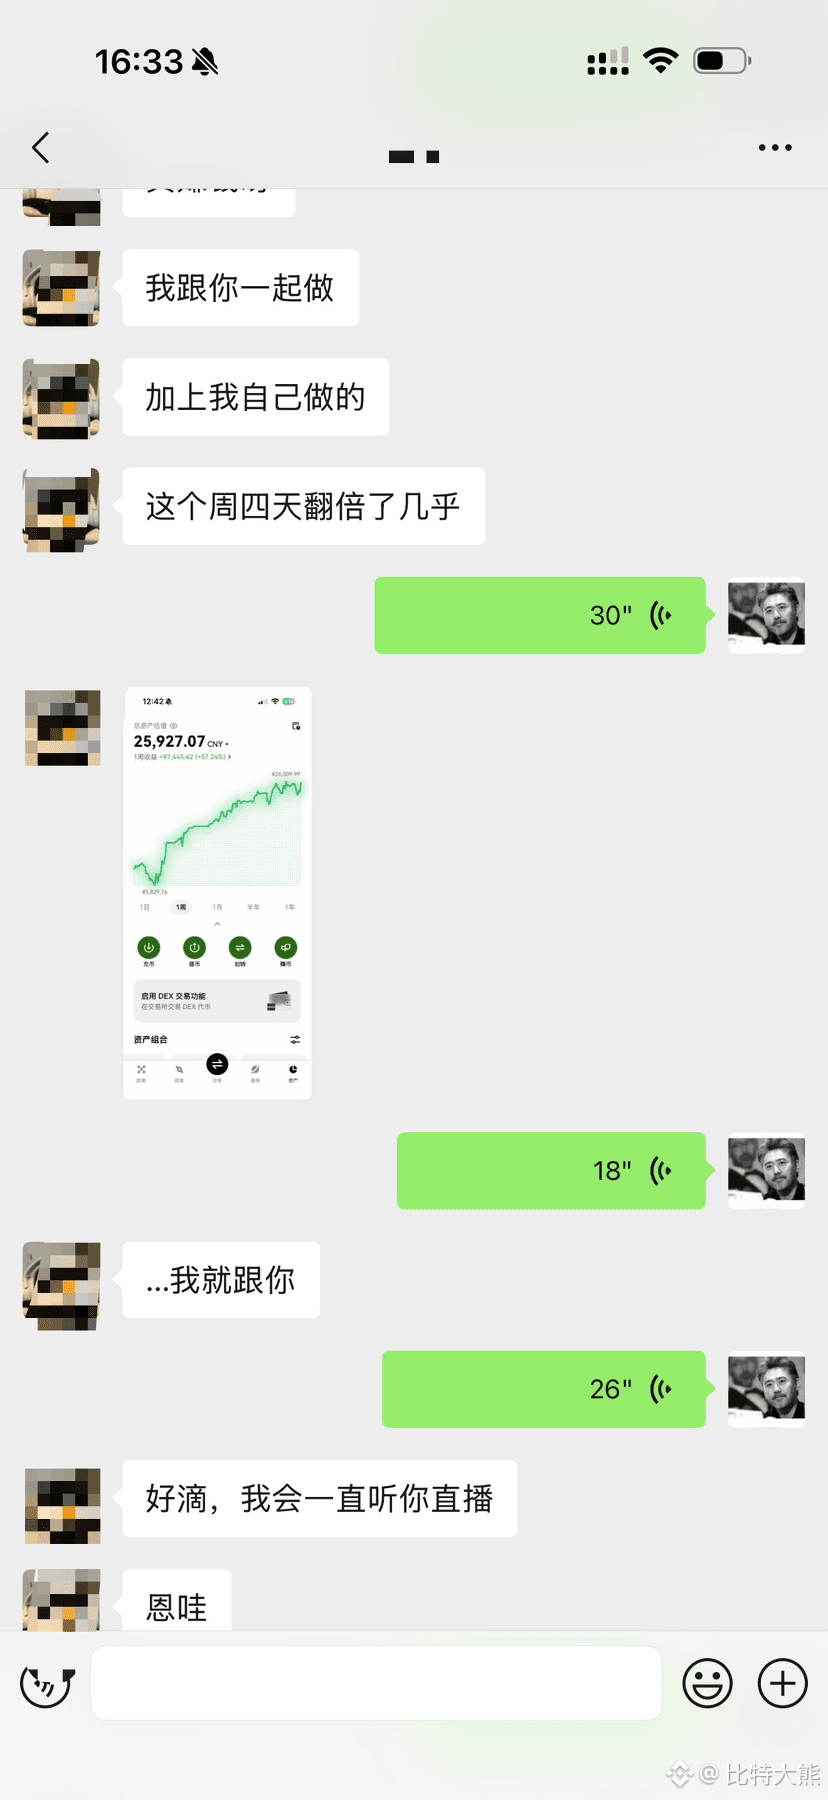
Why don’t I even dare to believe it myself? Isn’t that too exaggerated?
Why don’t I even dare to believe it myself? Isn’t that too exaggerated?
1
55
·
--
Live streaming permissions have been enabled, thank you to the Binance platform
Hope to share and exchange more interesting content here with everyone in the future #live streaming
Live streaming permissions have been enabled, thank you to the Binance platform
Hope to share and exchange more interesting content here with everyone in the future #live streaming
Hope to share and exchange more interesting content here with everyone in the future #live streaming


1
128
·
--
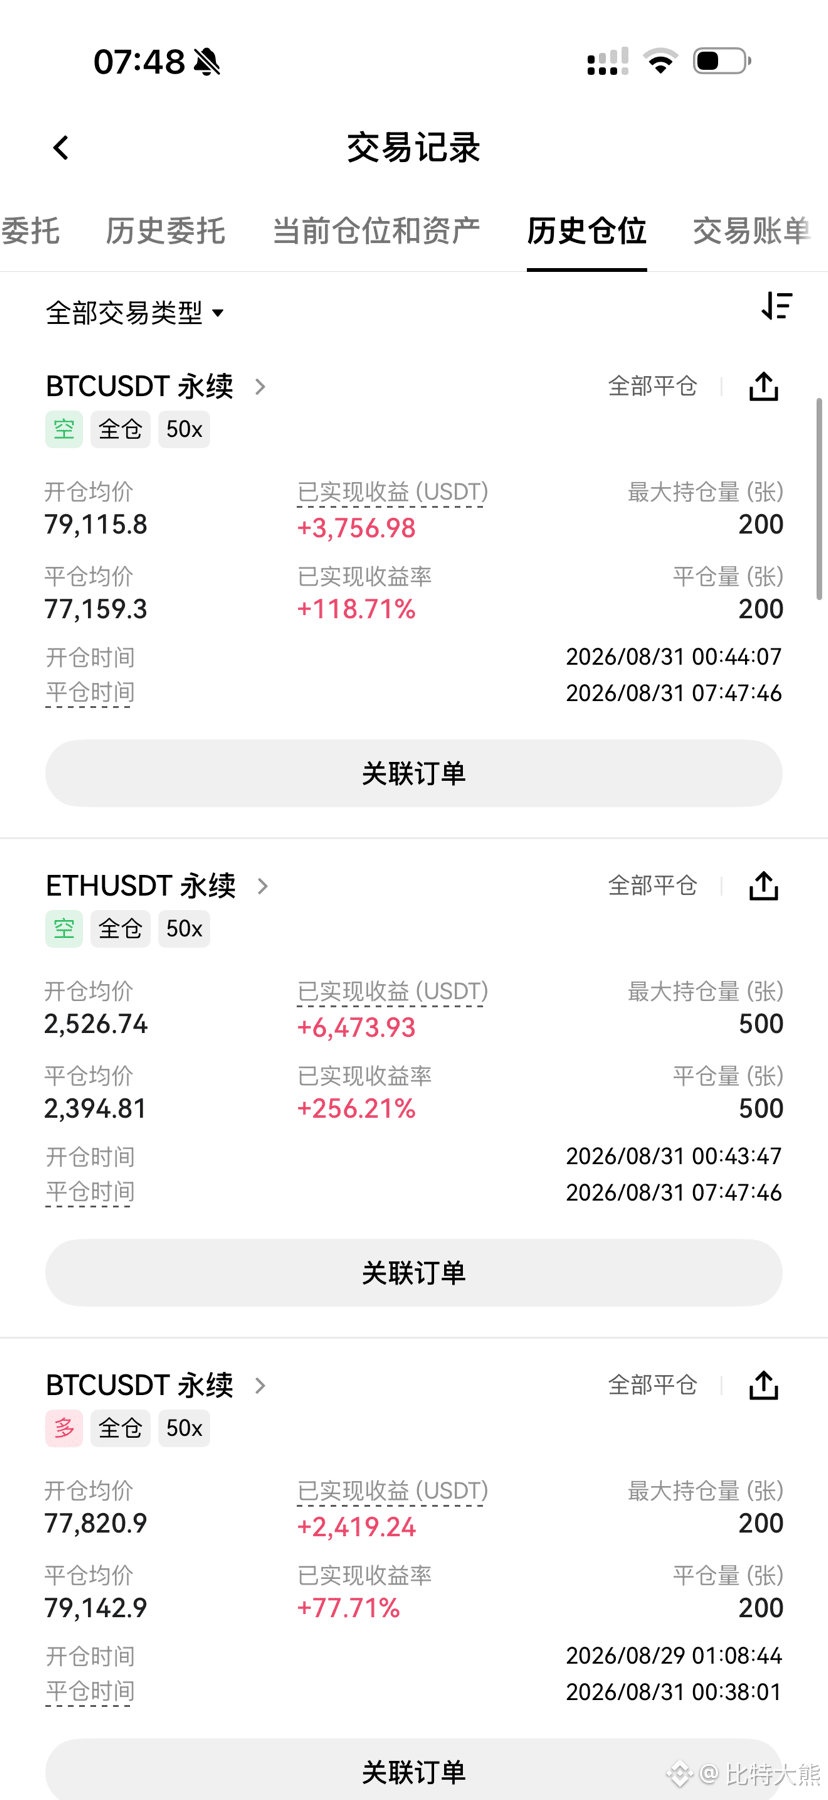
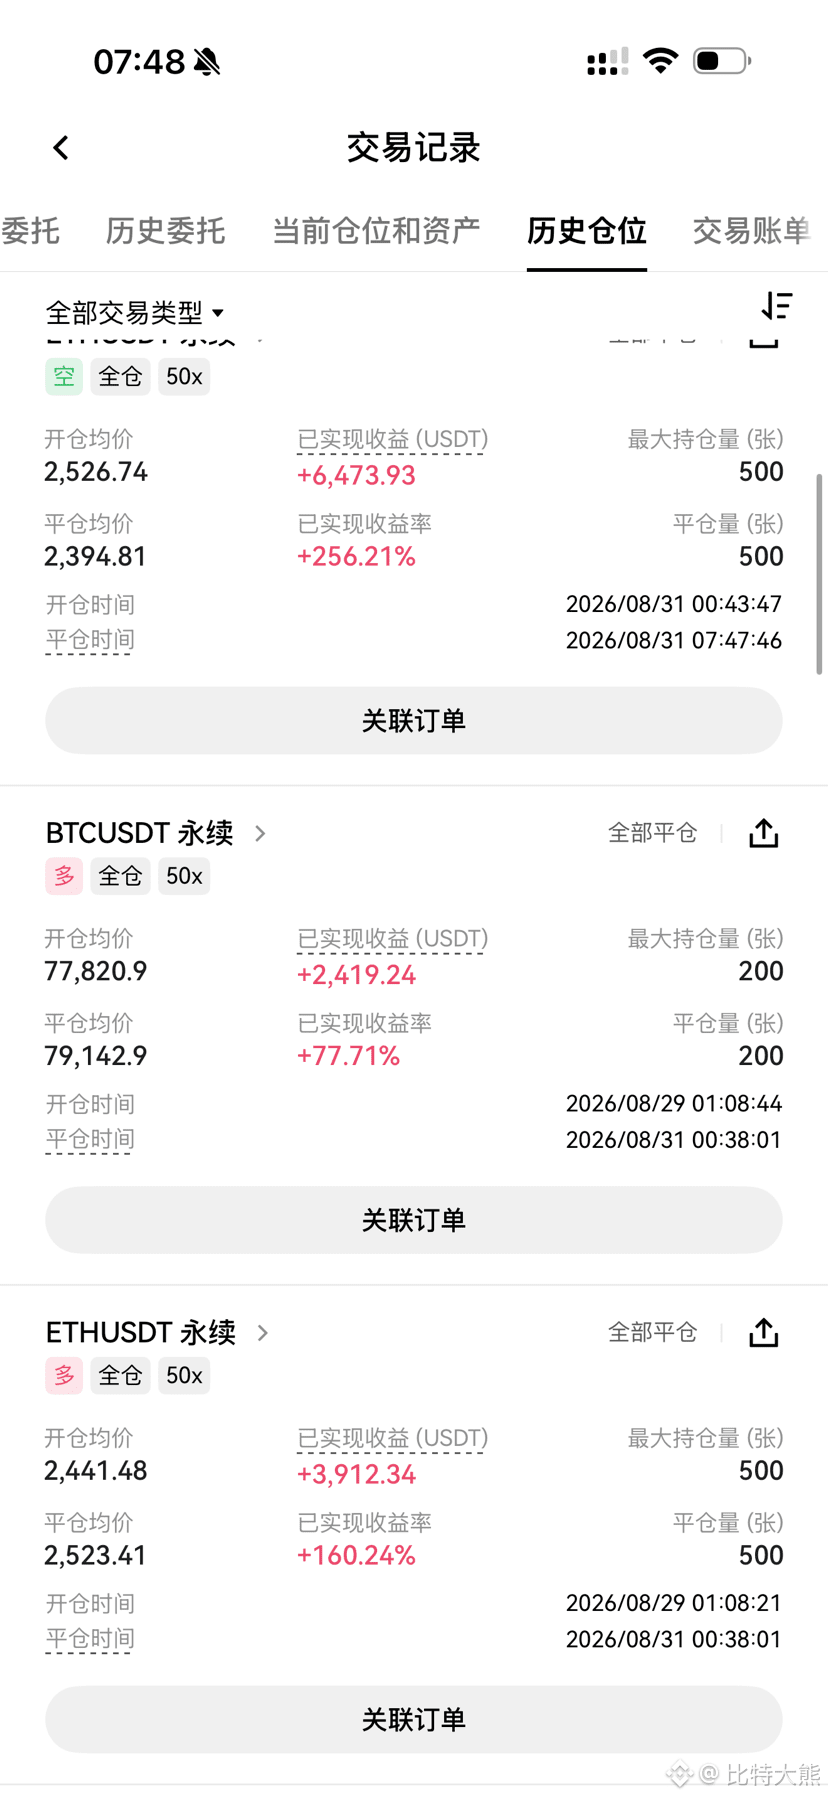
Buy and sell back and forth to feast on profits!
Buy and sell back and forth to feast on big gains!
Buy and sell back and forth and profit big!
During the live stream, the key points of both the long and short sides were emphasized repeatedly. Can you really get many people to remember them, let alone strictly follow through?
First, after setting up the long position at the bottom of the structure on Saturday, it was decisively followed by a reverse move to set a short at the top.
After waking up from a nap, the short position placed at the upper band had already flipped by several times.
In just one night, the entire last week’s chart structure was fully completed in a full round trip.
It confirms the logic that was stressed over and over before ✅: As long as the larger structure hasn’t changed, focus on executing longs at key support areas and taking entries at key pressure points—avoid chasing or panic selling. In a ranging market, you can repeatedly harvest profits.
Remember, 90% of the time the market is in consolidation and range-bound conditions; a strong one-way move is only brief.
Buy and sell back and forth to feast on profits!
Buy and sell back and forth to feast on big gains!
Buy and sell back and forth and profit big!
During the live stream, the key points of both the long and short sides were emphasized repeatedly. Can you really get many people to remember them, let alone strictly follow through?
First, after setting up the long position at the bottom of the structure on Saturday, it was decisively followed by a reverse move to set a short at the top.
After waking up from a nap, the short position placed at the upper band had already flipped by several times.
In just one night, the entire last week’s chart structure was fully completed in a full round trip.
It confirms the logic that was stressed over and over before ✅: As long as the larger structure hasn’t changed, focus on executing longs at key support areas and taking entries at key pressure points—avoid chasing or panic selling. In a ranging market, you can repeatedly harvest profits.
Remember, 90% of the time the market is in consolidation and range-bound conditions; a strong one-way move is only brief.
Buy and sell back and forth to feast on big gains!
Buy and sell back and forth and profit big!
During the live stream, the key points of both the long and short sides were emphasized repeatedly. Can you really get many people to remember them, let alone strictly follow through?
First, after setting up the long position at the bottom of the structure on Saturday, it was decisively followed by a reverse move to set a short at the top.
After waking up from a nap, the short position placed at the upper band had already flipped by several times.
In just one night, the entire last week’s chart structure was fully completed in a full round trip.
It confirms the logic that was stressed over and over before ✅: As long as the larger structure hasn’t changed, focus on executing longs at key support areas and taking entries at key pressure points—avoid chasing or panic selling. In a ranging market, you can repeatedly harvest profits.
Remember, 90% of the time the market is in consolidation and range-bound conditions; a strong one-way move is only brief.
297
·
--
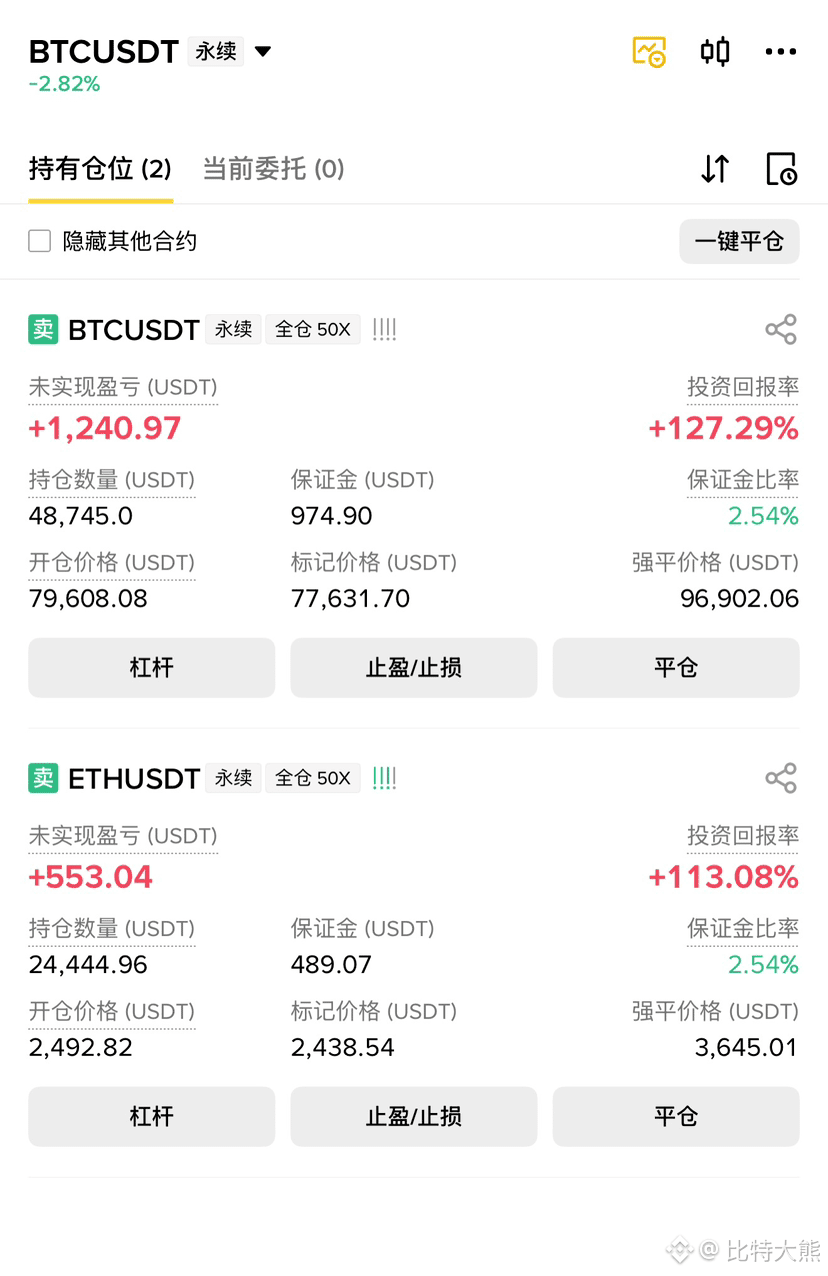
Black Friday—sure enough, a big drop
Everyone online should only have me going short at the top#Bitcoin falls 3.4% in 24 hours to $77.4k
Black Friday—sure enough, a big drop
Everyone online should only have me going short at the top#Bitcoin falls 3.4% in 24 hours to $77.4k
Everyone online should only have me going short at the top#Bitcoin falls 3.4% in 24 hours to $77.4k
188
·
--
Bearish
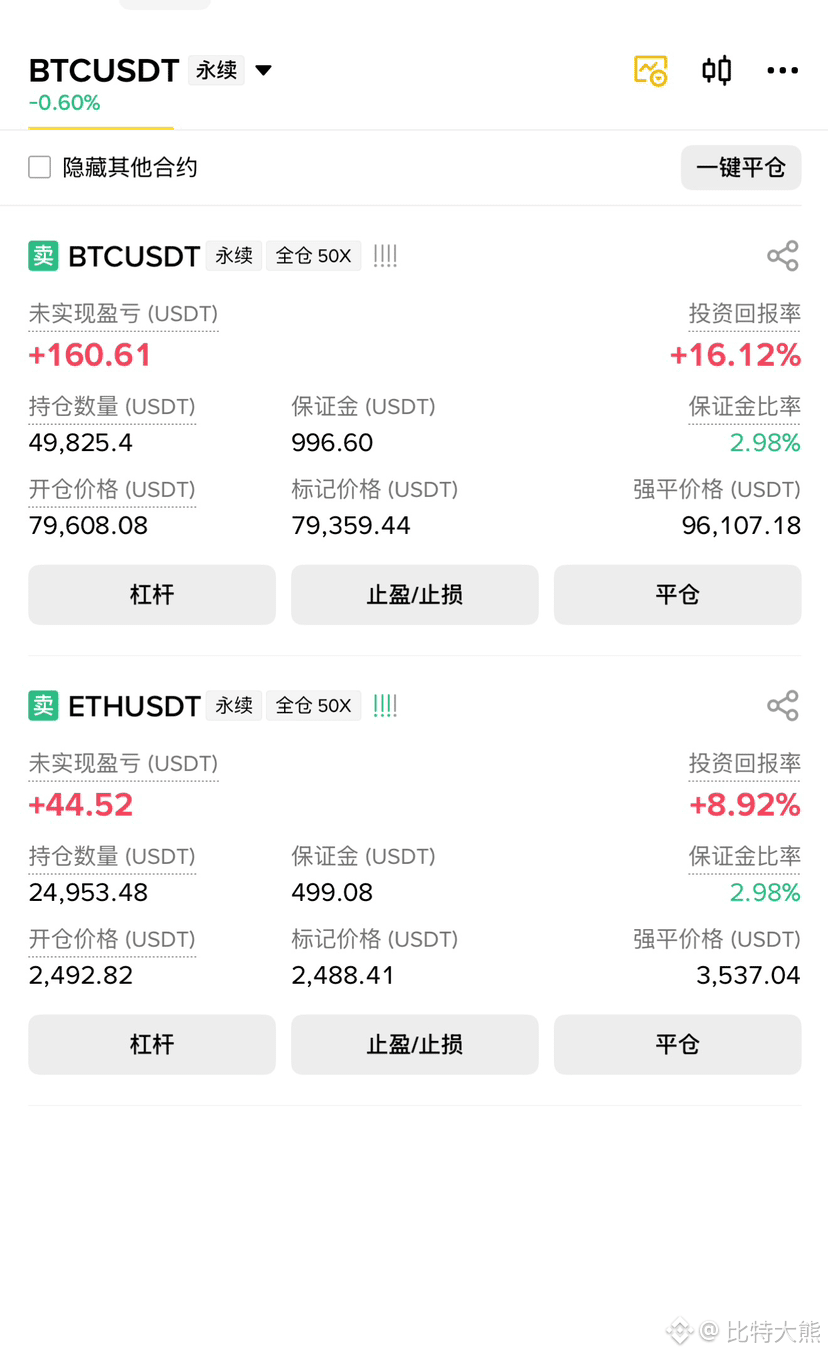
The genius trader finally made some profit—come on, hurry and congratulate me!
The genius trader finally made some profit—come on, hurry and congratulate me!
1
261
Log in to explore more content
Join global crypto users on Binance Square
⚡️ Get latest and useful information about crypto.
💬 Trusted by the world’s largest crypto exchange.
👍 Discover real insights from verified creators.
Email / Phone number
Trending Topics
BinanceLaunchesBinanceIntelligence
36,762 views
450 Discussing
🚨 BINANCE JUST PUT AI DIRECTLY INSIDE THE EXCHANGE — AND THIS COULD CHANGE HOW RETAIL TRADES.
Binance has officially launched Binance Intelligence, a new AI layer built into the Binance ecosystem. It combines three products:
Binance AI for everyday users,
Binance AI Pro for automated trading workflows,
and Agent OS for developers building financial agents.
The part traders should care about?
Binance AI can surface market briefs, smart alerts, PnL recaps and personalized information, while AI Pro is designed to turn a plain-English trading idea into a visual strategy workflow.
That means the next phase of exchange competition may not be:
lowest fees vs deepest liquidity.
It could be:
who gives traders the best AI execution layer.
If Binance Intelligence actually drives heavier user activity, automated strategies and higher trading frequency, watch $BNB first.
AI adoption ↑
→ Binance engagement ↑
→ trading activity ↑
→ ecosystem narrative strengthens.
The catalyst I’d watch now:
global rollout + AI Pro launch + measurable user adoption.
Because once AI stops just telling you what the market is doing…
…and starts helping build the trade itself?
That’s when this gets much bigger than another chatbot. 👀
#binancelaunchesbinanceintelligence #EvernorthXRPTreasuryCompletesSPACMerger #ADAGains10%Above$0.27 #ETHUp70%InQ3ButLiquidityFalls #EthStakingExitQueueHits2026High
KimHotbae
·20 Likes
·24.8k views
EvernorthXRPTreasuryCompletesSPACMerger
32,517 views
294 Discussing
ADAGains10%Above$0.27
31,065 views
206 Discussing