
Paul Xue BTC 链上数据研究
81 Posts
Paul Xue BTC 链上数据研究
Report
Block User
跌跌撞撞误入币圈,发现这里别有洞天,努力赚钱定投大饼,争取早日财富自由!
Open Trade

BTC Holder
Frequent Trader
3.6 Months
21 Following
21 Followers
64 Liked
Posts
Portfolio
All
Quotes
【Bitcoin Weekly “Four-Step Zoning” and Practical Trading Strategy for the Second Half of the Year】
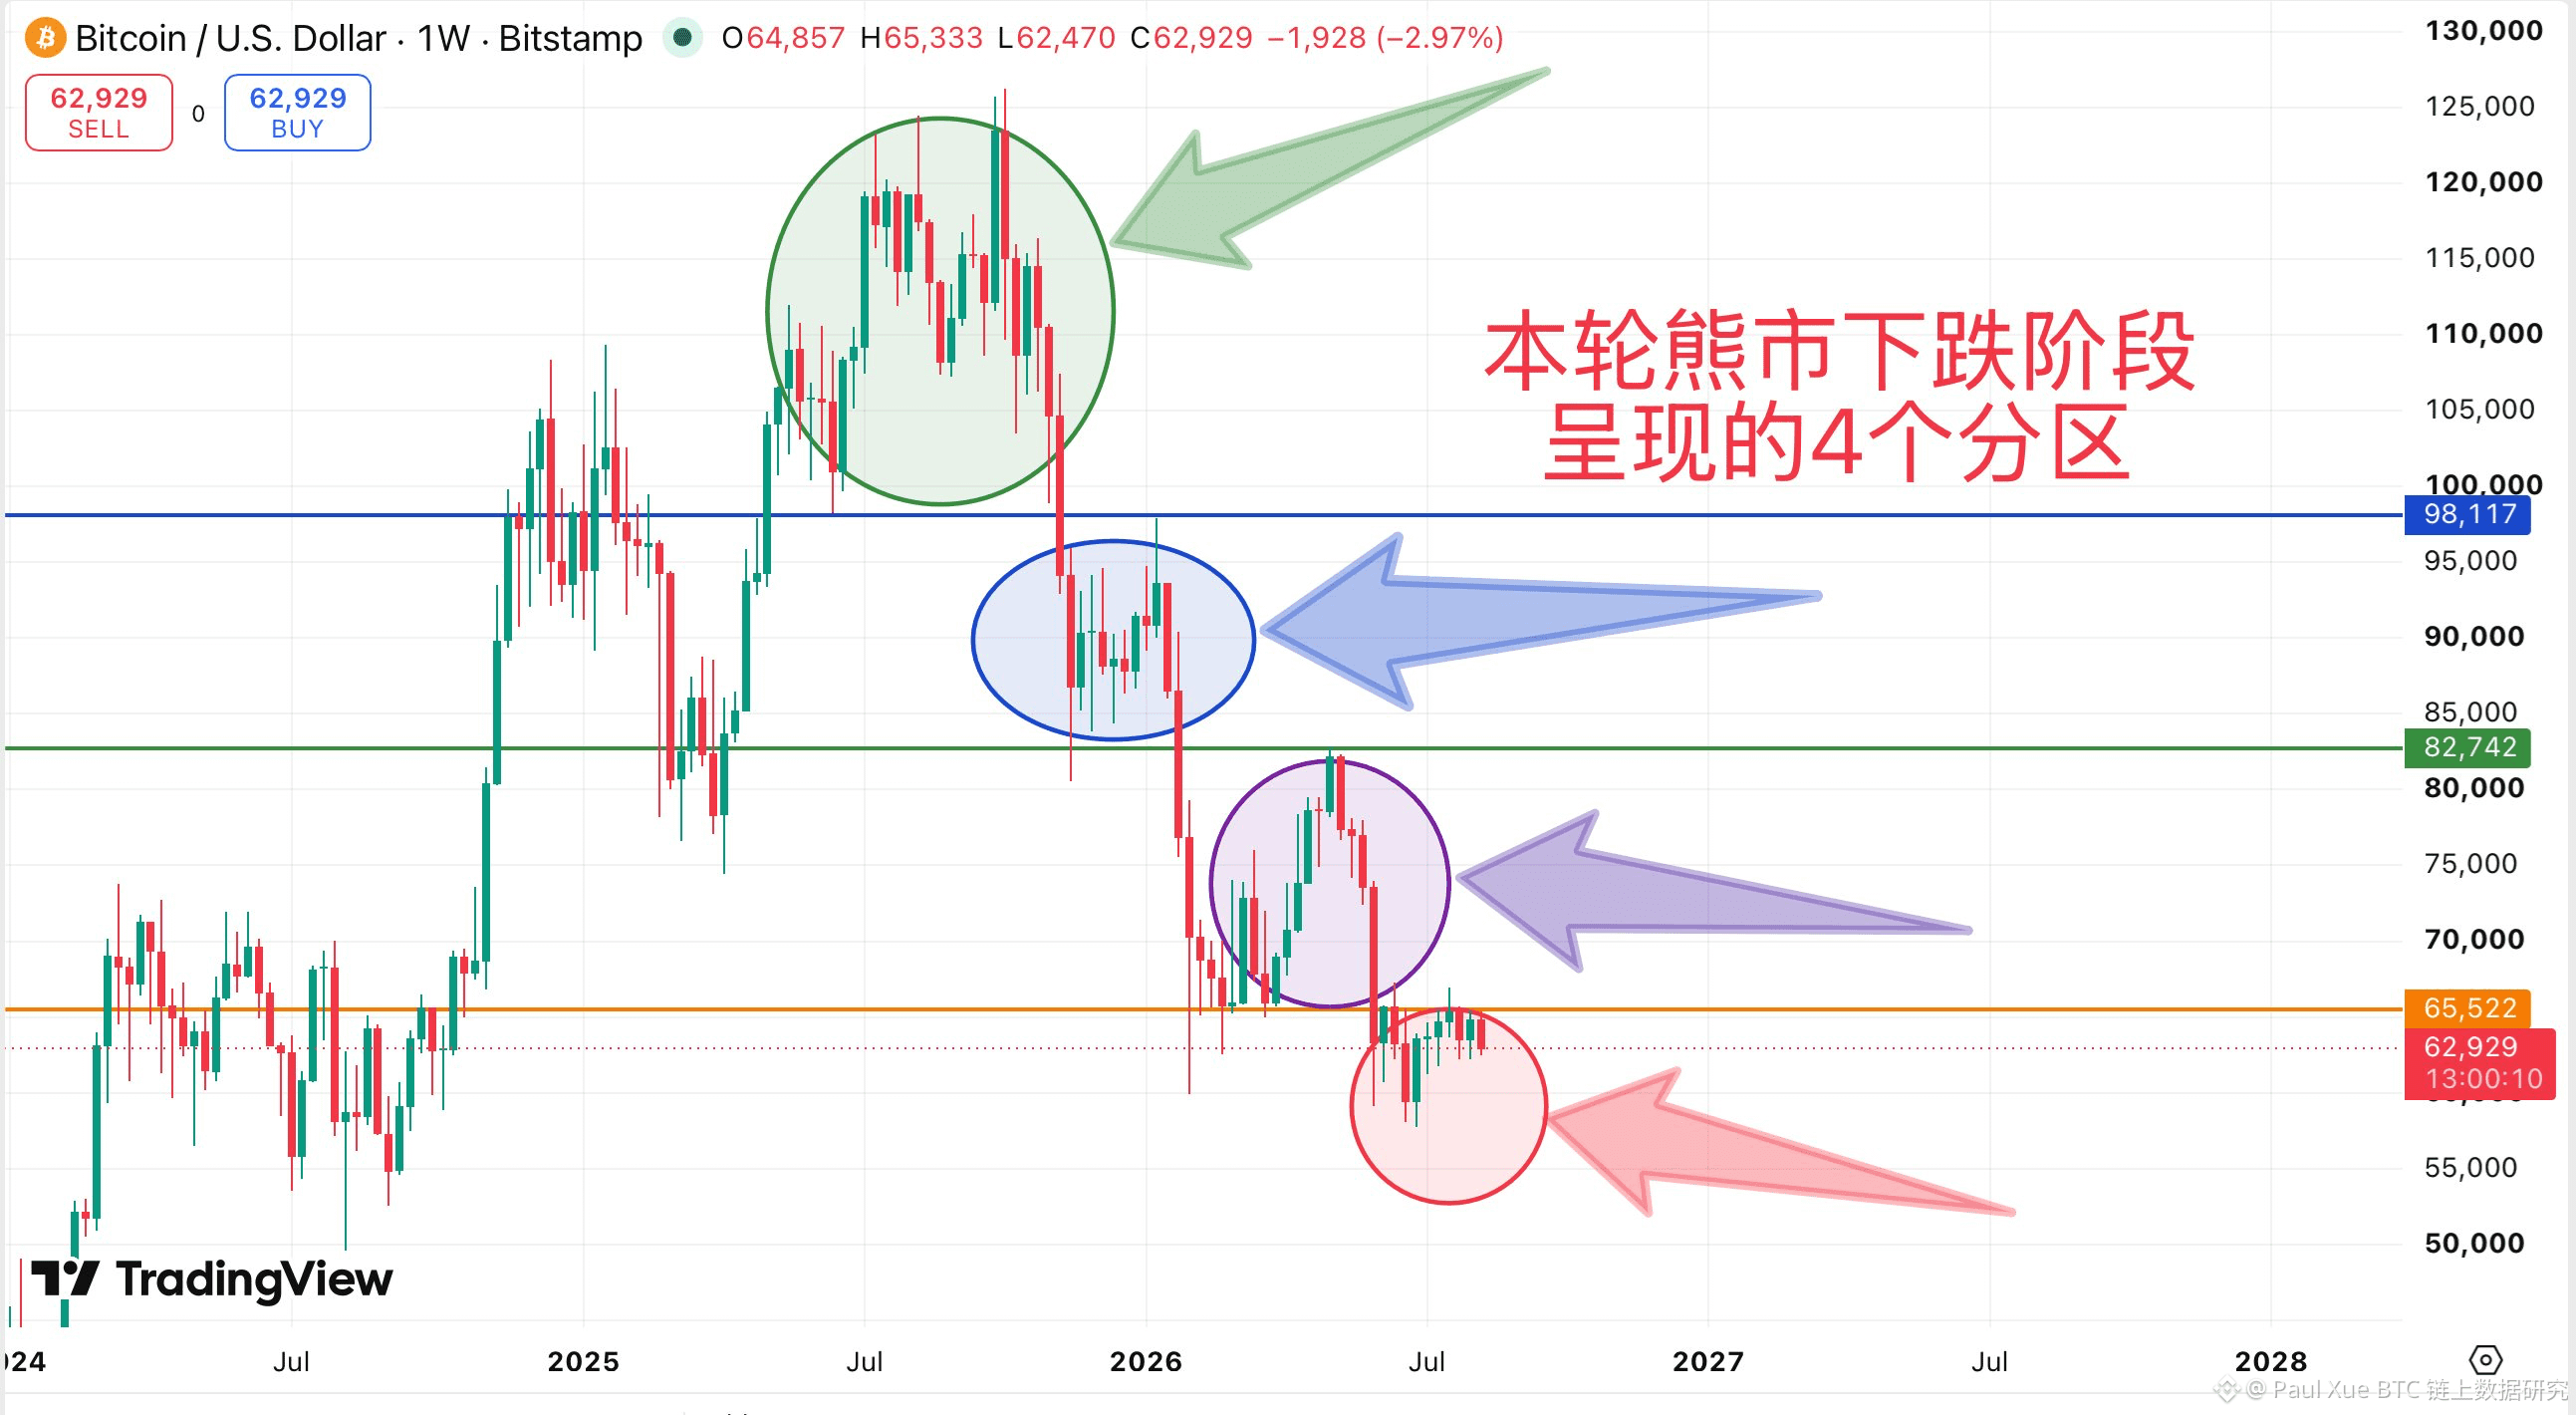
From the weekly chart’s走势 (price action), the current bear market decline shows an extremely strict “four-level step zoning” pattern, along with support/resistance flip characteristics:
Four clear zones:
Green zone (98.1k top distribution)
➡️ Blue zone (82.7k–98.1k interim resistance)
➡️ Purple zone (65.5k–82.7k breakdown and acceleration)
➡️
Red zone (below 65.5k · current bottom probing).
Structural rule: Each time the market breaks down through a prior support platform, that level immediately turns into a strong resistance that cannot be crossed, causing the weekly candlestick body’s weight to step down progressively, with the boundaries between each pair of zones remaining distinct.
Second-half price projection and practical strategy:
Currently, the weekly candlestick bodies remain suppressed below 65.5k. If they still fail to reclaim the level for a long time, after the sideways move exhausts long-side buying pressure, the second half is likely to break down and search for a bottom, carving out the true cycle-level bottom.
Left-side strategy (refuse to catch blindly): Below 65.5k, do not easily go all-in with heavy positions. Maintain a strategic wait-and-see stance; patiently wait for the market to break down through the current platform, trigger liquidity panic to “dig out the golden pit,” and then scale in to buy the dip in batches.
Right-side strategy (confirm bull/bear transition): Only when the weekly candlestick bodies break out with increased volume and hold above 65.5k, can it be interpreted as breaking the stepwise downtrend structure. At that point, it can serve as a decisive confirmation signal for “bear to bull,” and you can follow the right-side trade promptly.
In the second half, do you lean toward staying in cash and waiting for the deep pit to break down, or do you plan to DCA in batches at the current level? Feel free to discuss your positioning strategy in the comments.
【Bitcoin Weekly “Four-Step Zoning” and Practical Trading Strategy for the Second Half of the Year】
From the weekly chart’s走势 (price action), the current bear market decline shows an extremely strict “four-level step zoning” pattern, along with support/resistance flip characteristics:
Four clear zones:
Green zone (98.1k top distribution)
➡️ Blue zone (82.7k–98.1k interim resistance)
➡️ Purple zone (65.5k–82.7k breakdown and acceleration)
➡️
Red zone (below 65.5k · current bottom probing).
Structural rule: Each time the market breaks down through a prior support platform, that level immediately turns into a strong resistance that cannot be crossed, causing the weekly candlestick body’s weight to step down progressively, with the boundaries between each pair of zones remaining distinct.
Second-half price projection and practical strategy:
Currently, the weekly candlestick bodies remain suppressed below 65.5k. If they still fail to reclaim the level for a long time, after the sideways move exhausts long-side buying pressure, the second half is likely to break down and search for a bottom, carving out the true cycle-level bottom.
Left-side strategy (refuse to catch blindly): Below 65.5k, do not easily go all-in with heavy positions. Maintain a strategic wait-and-see stance; patiently wait for the market to break down through the current platform, trigger liquidity panic to “dig out the golden pit,” and then scale in to buy the dip in batches.
Right-side strategy (confirm bull/bear transition): Only when the weekly candlestick bodies break out with increased volume and hold above 65.5k, can it be interpreted as breaking the stepwise downtrend structure. At that point, it can serve as a decisive confirmation signal for “bear to bull,” and you can follow the right-side trade promptly.
In the second half, do you lean toward staying in cash and waiting for the deep pit to break down, or do you plan to DCA in batches at the current level? Feel free to discuss your positioning strategy in the comments.
From the weekly chart’s走势 (price action), the current bear market decline shows an extremely strict “four-level step zoning” pattern, along with support/resistance flip characteristics:
Four clear zones:
Green zone (98.1k top distribution)
➡️ Blue zone (82.7k–98.1k interim resistance)
➡️ Purple zone (65.5k–82.7k breakdown and acceleration)
➡️
Red zone (below 65.5k · current bottom probing).
Structural rule: Each time the market breaks down through a prior support platform, that level immediately turns into a strong resistance that cannot be crossed, causing the weekly candlestick body’s weight to step down progressively, with the boundaries between each pair of zones remaining distinct.
Second-half price projection and practical strategy:
Currently, the weekly candlestick bodies remain suppressed below 65.5k. If they still fail to reclaim the level for a long time, after the sideways move exhausts long-side buying pressure, the second half is likely to break down and search for a bottom, carving out the true cycle-level bottom.
Left-side strategy (refuse to catch blindly): Below 65.5k, do not easily go all-in with heavy positions. Maintain a strategic wait-and-see stance; patiently wait for the market to break down through the current platform, trigger liquidity panic to “dig out the golden pit,” and then scale in to buy the dip in batches.
Right-side strategy (confirm bull/bear transition): Only when the weekly candlestick bodies break out with increased volume and hold above 65.5k, can it be interpreted as breaking the stepwise downtrend structure. At that point, it can serve as a decisive confirmation signal for “bear to bull,” and you can follow the right-side trade promptly.
In the second half, do you lean toward staying in cash and waiting for the deep pit to break down, or do you plan to DCA in batches at the current level? Feel free to discuss your positioning strategy in the comments.
1
159
Prices may be somewhat aggressive, but the “time scale” is extremely valuable
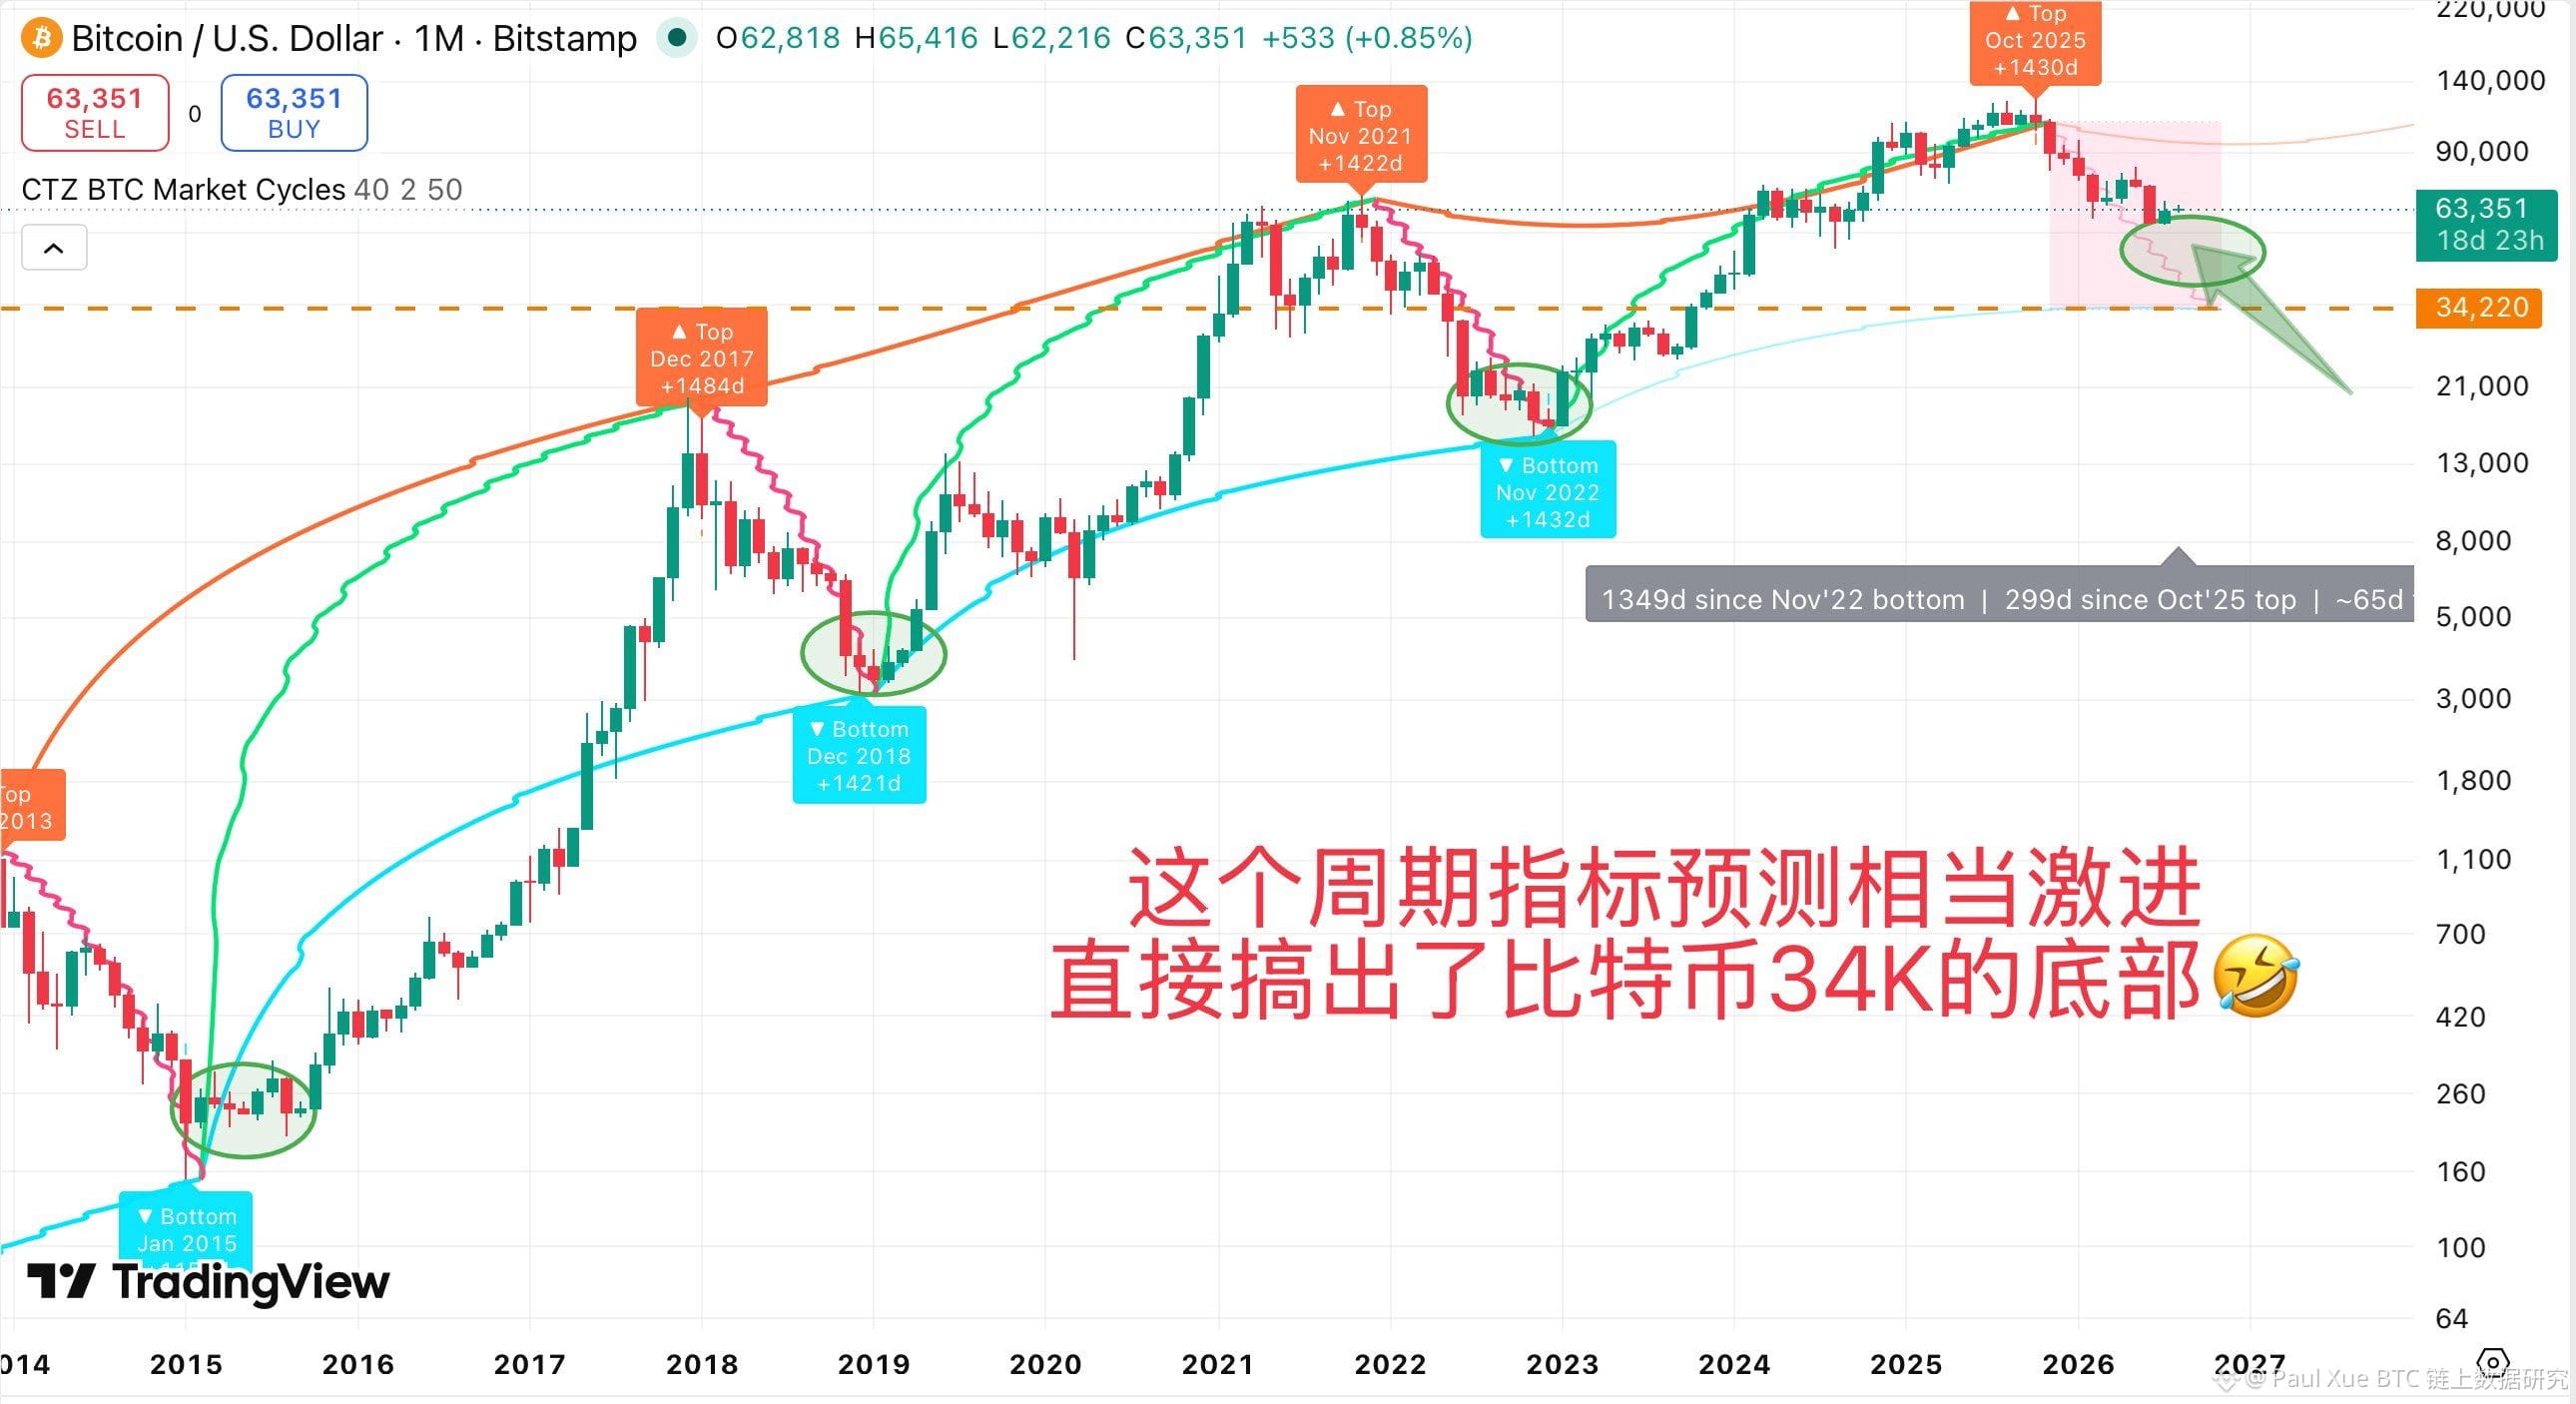
Let’s introduce a rather interesting metric: CTZ BTC Market Cycles.
This indicator offers a fairly aggressive projection—pinning the bottom of this cycle directly around the 34K area.
Given the current market size and institutional cost basis, this absolute price does indeed seem overly pessimistic.
However, setting aside price noise, the indicator’s logic for calibrating “time cycles” is very rigorous and worth learning. As can be seen from the markers in the chart,
whether at the tops of past bull markets (2017, 2021, 2025) or at the bottoms of bear markets (2018, 2022), their time intervals remain consistently around roughly 1,400+ days
—which perfectly matches Bitcoin’s four-year halving cycle.
Time-point projection:
According to the indicator, the next potential cycle bottom window falls around October 2026.
Quantitative models can become distorted in their “absolute price” assumptions due to changes in market structure, but Bitcoin’s “time cycles” driven by its code and halving mechanism have a very strong historical inertia.
Focus on time, not price—we don’t have to obsess over the 34K level, but we can place more emphasis on the time inflection point in the second half of 2026, using it as an excellent time reference for long-term capital planning and accumulation pacing.
Prices may be somewhat aggressive, but the “time scale” is extremely valuable
Let’s introduce a rather interesting metric: CTZ BTC Market Cycles.
This indicator offers a fairly aggressive projection—pinning the bottom of this cycle directly around the 34K area.
Given the current market size and institutional cost basis, this absolute price does indeed seem overly pessimistic.
However, setting aside price noise, the indicator’s logic for calibrating “time cycles” is very rigorous and worth learning. As can be seen from the markers in the chart,
whether at the tops of past bull markets (2017, 2021, 2025) or at the bottoms of bear markets (2018, 2022), their time intervals remain consistently around roughly 1,400+ days
—which perfectly matches Bitcoin’s four-year halving cycle.
Time-point projection:
According to the indicator, the next potential cycle bottom window falls around October 2026.
Quantitative models can become distorted in their “absolute price” assumptions due to changes in market structure, but Bitcoin’s “time cycles” driven by its code and halving mechanism have a very strong historical inertia.
Focus on time, not price—we don’t have to obsess over the 34K level, but we can place more emphasis on the time inflection point in the second half of 2026, using it as an excellent time reference for long-term capital planning and accumulation pacing.
Let’s introduce a rather interesting metric: CTZ BTC Market Cycles.
This indicator offers a fairly aggressive projection—pinning the bottom of this cycle directly around the 34K area.
Given the current market size and institutional cost basis, this absolute price does indeed seem overly pessimistic.
However, setting aside price noise, the indicator’s logic for calibrating “time cycles” is very rigorous and worth learning. As can be seen from the markers in the chart,
whether at the tops of past bull markets (2017, 2021, 2025) or at the bottoms of bear markets (2018, 2022), their time intervals remain consistently around roughly 1,400+ days
—which perfectly matches Bitcoin’s four-year halving cycle.
Time-point projection:
According to the indicator, the next potential cycle bottom window falls around October 2026.
Quantitative models can become distorted in their “absolute price” assumptions due to changes in market structure, but Bitcoin’s “time cycles” driven by its code and halving mechanism have a very strong historical inertia.
Focus on time, not price—we don’t have to obsess over the 34K level, but we can place more emphasis on the time inflection point in the second half of 2026, using it as an excellent time reference for long-term capital planning and accumulation pacing.
1
176
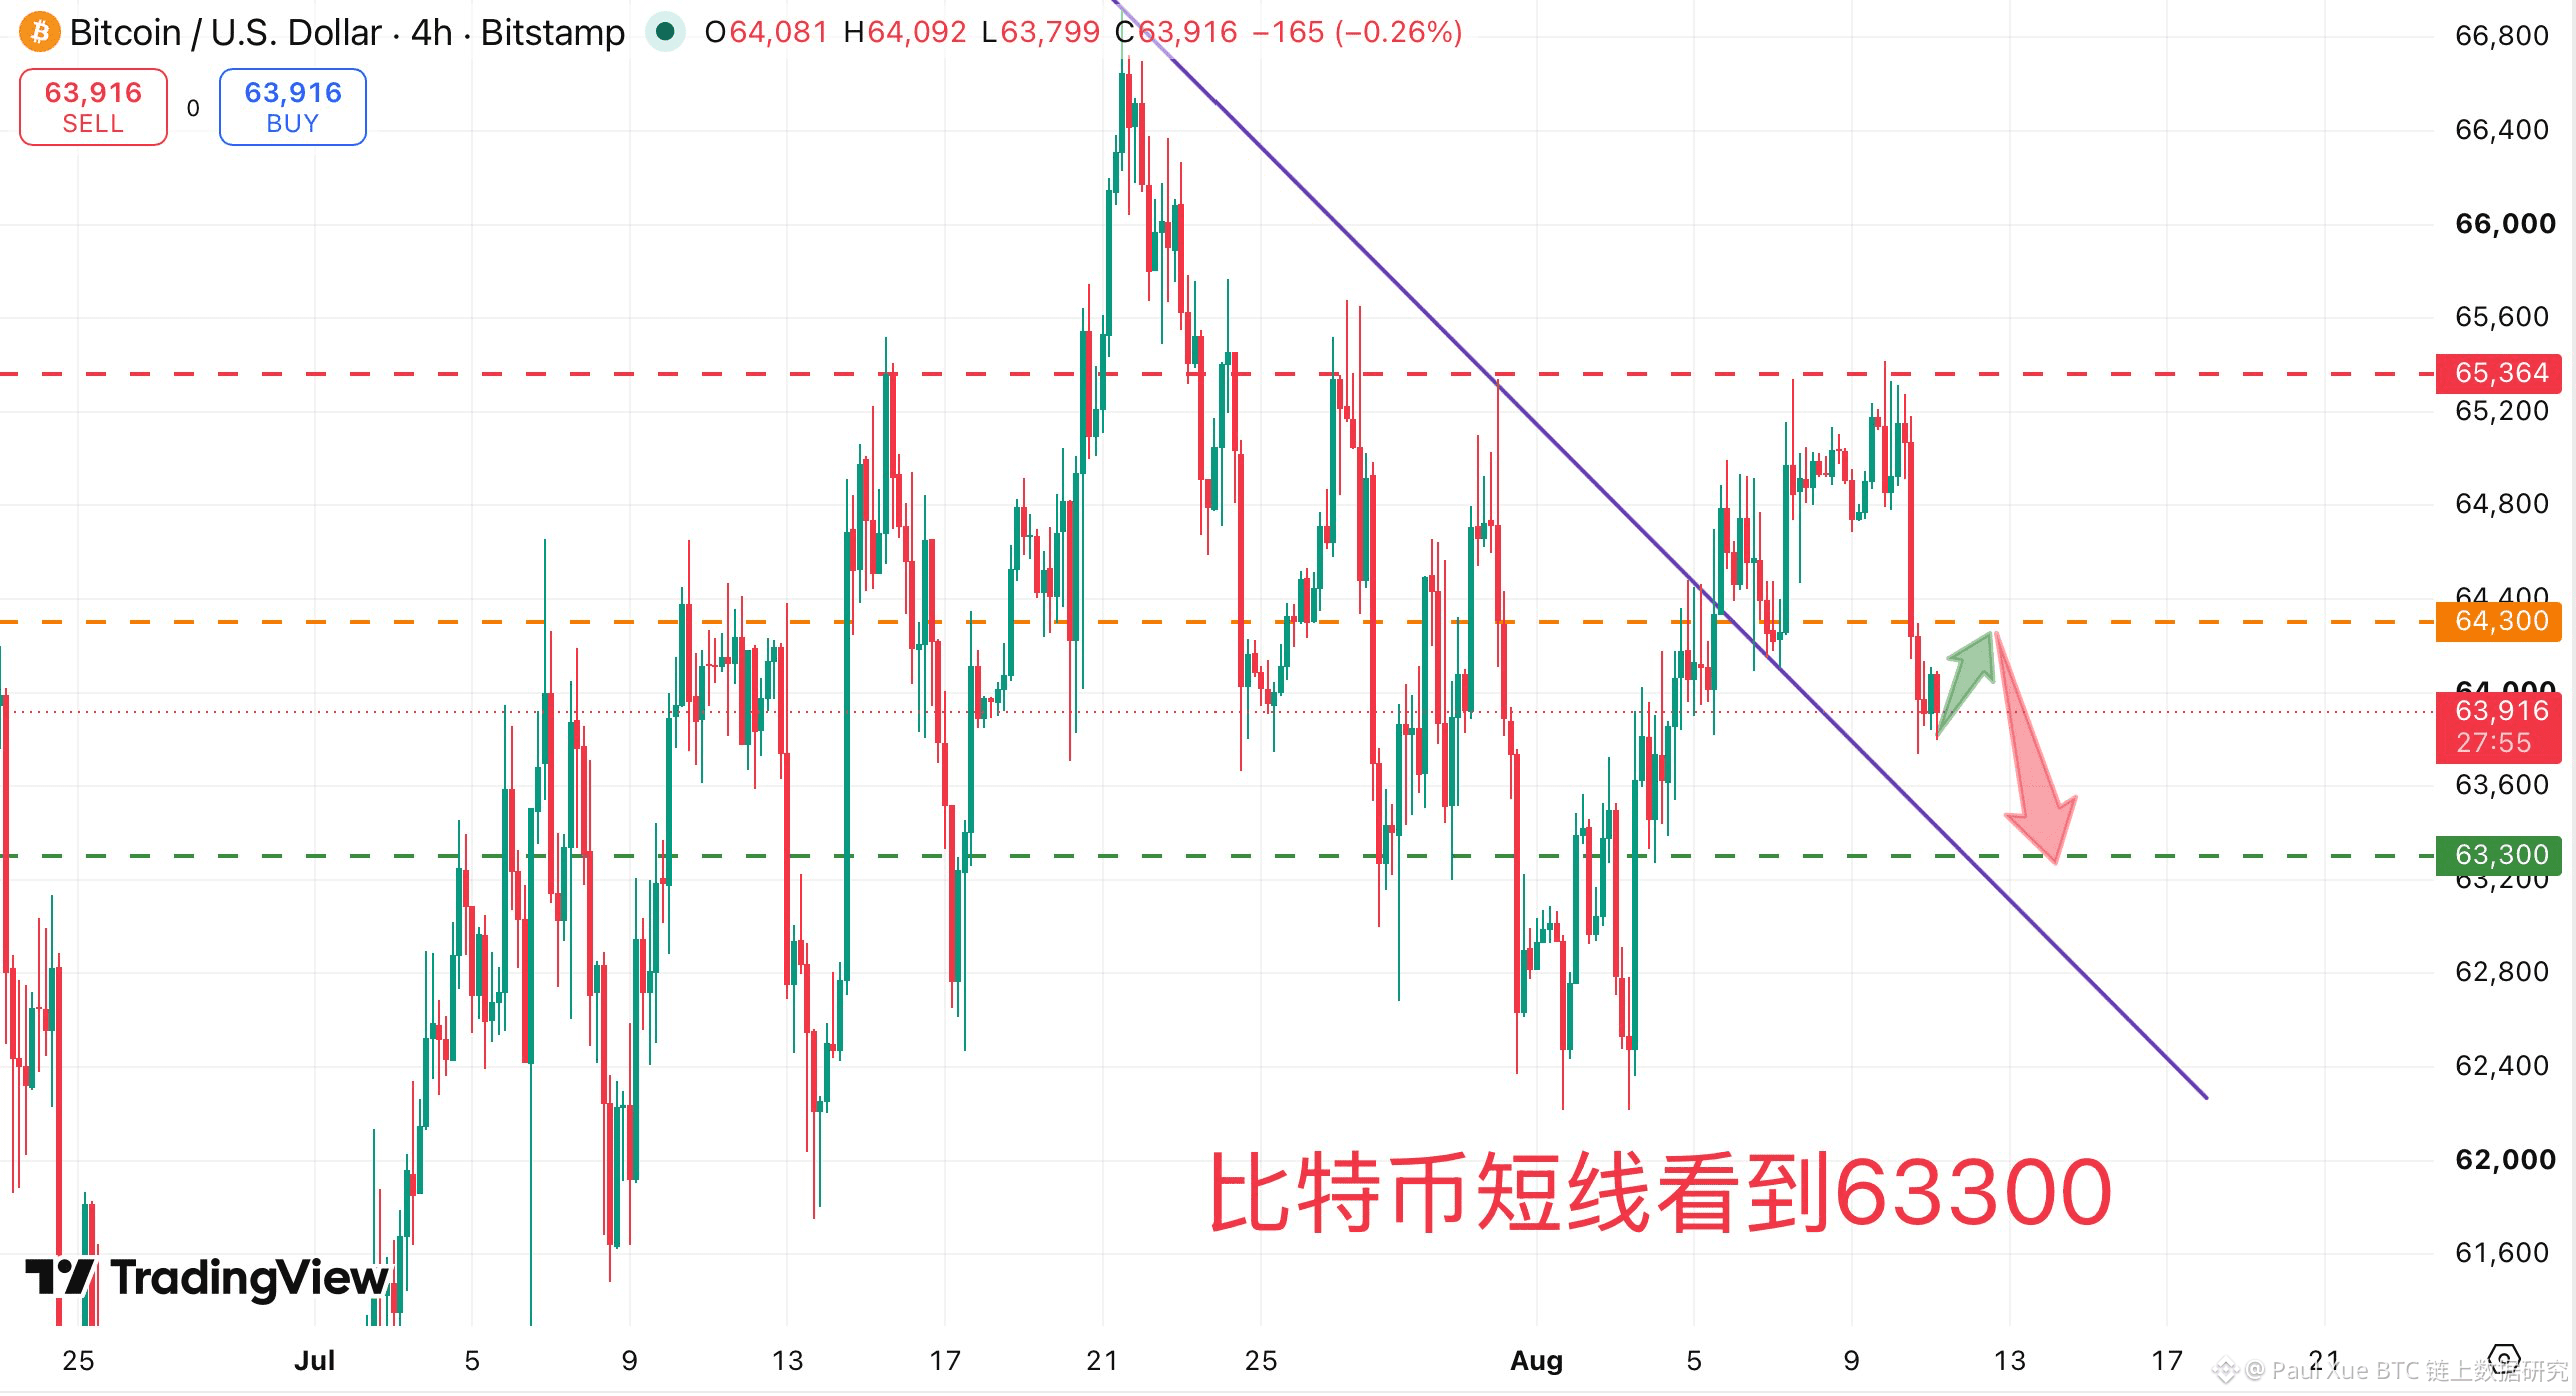
After Bitcoin fell yesterday, today it has again fallen into consolidation around the 64K level. Since it already broke down and fell yesterday, it may rebound to around 64,300 and then turn back downward. It may also drop straight down toward around 63,300. It’s hard to judge the short-term trend!
As I said before, August is likely to close with a bearish day (a red close)!
I went short with a small position around 64,800 yesterday, thinking that if Bitcoin rebounds upward, I could add to the short. But I never got the chance to add—this is also the short-term uncertainty of the market.
So when trading, you always need to leave yourself an escape route: how to respond if the market moves upward, and how to respond if it moves downward. Try not to expose your human weaknesses.
After Bitcoin fell yesterday, today it has again fallen into consolidation around the 64K level. Since it already broke down and fell yesterday, it may rebound to around 64,300 and then turn back downward. It may also drop straight down toward around 63,300. It’s hard to judge the short-term trend!
As I said before, August is likely to close with a bearish day (a red close)!
I went short with a small position around 64,800 yesterday, thinking that if Bitcoin rebounds upward, I could add to the short. But I never got the chance to add—this is also the short-term uncertainty of the market.
So when trading, you always need to leave yourself an escape route: how to respond if the market moves upward, and how to respond if it moves downward. Try not to expose your human weaknesses.
As I said before, August is likely to close with a bearish day (a red close)!
I went short with a small position around 64,800 yesterday, thinking that if Bitcoin rebounds upward, I could add to the short. But I never got the chance to add—this is also the short-term uncertainty of the market.
So when trading, you always need to leave yourself an escape route: how to respond if the market moves upward, and how to respond if it moves downward. Try not to expose your human weaknesses.
1
189
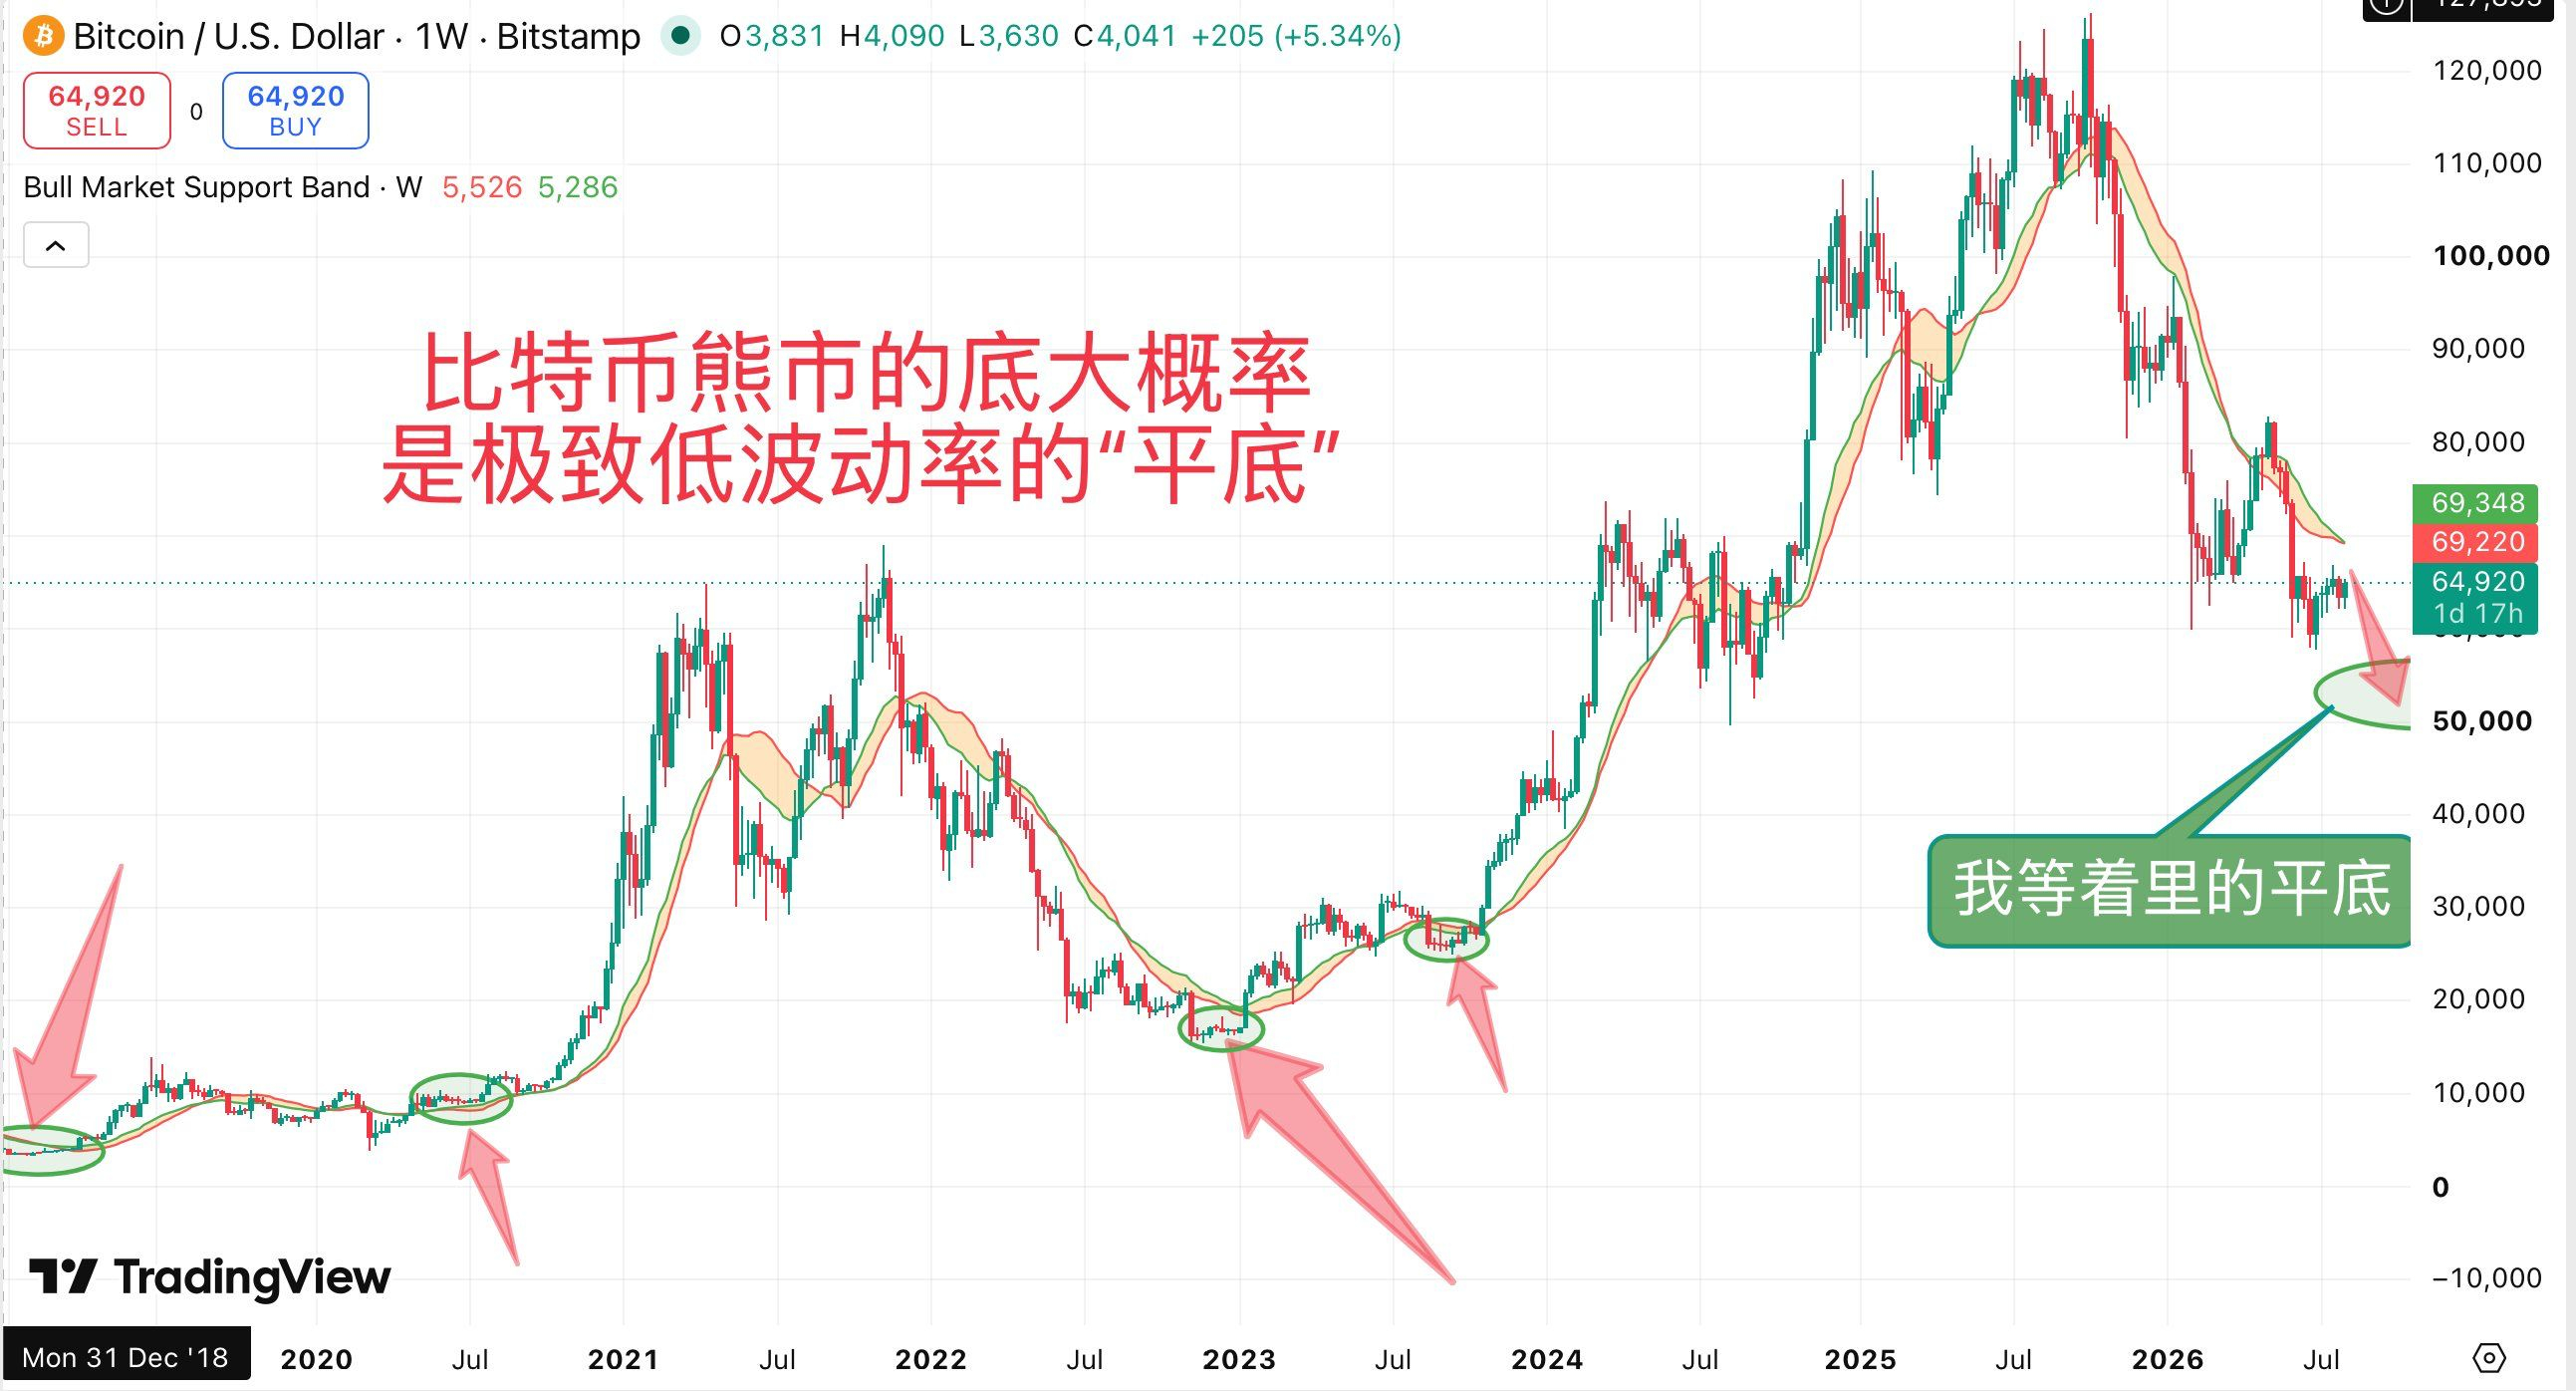
【Why Bitcoin’s Real Bear-Market Bottom Must Be a “Flat Bottom” of Ultra-Low Volatility】
Looking back at the bear-market bottoms of the past two cycles (2018–2019 and 2022–2023), Bitcoin’s true bottom has never been formed by a single, sudden spike downward. Instead, it consistently shows a “flat bottom” structure characterized by ultra-low volatility.
This phenomenon is strongly supported by on-chain metrics and game-theory logic:
The essence of clearing positions: A sharp sell-off (a dimensionality-reduction strike) can only liquidate high-leverage traders and panic-driven orders, but it cannot completely wash out committed long-term holders (LTHs). A real bottom requires time plus extremely narrow-range oscillation to grind down market sentiment. When turnover rate falls to a near-zero level, the SOPR stays below 1 for the long term and volatility converges; then positions shift decisively from short-term hands to long-term hands, and only then can a flat bottom be established.
Liquidity exhaustion and clearing: In a flat-bottom zone of ultra-low volatility, market liquidity becomes depleted. Selling pressure (as Unrealized Loss gradually gets fully realized) and buy pressure reach a very fragile balance—until volatility compresses to a historical extreme, at which point explosive buying power begins to rebuild.
Back to the current market perspective: At the moment, the price location and volatility have not shown “near-zero” characteristics. Considering the on-chain cost-basis structure and the distribution of holdings, the real cycle bottom is likely still at a lower level (e.g., below $50,000). Before the market forms a base, it will most likely need to experience one last, extremely violent final sell-off that fully breaks through the market’s final psychological defense and liquidates remaining dip-buy leverage.
Sell into panic to reveal the true bottom. Waiting patiently for this final washout and the subsequent construction of a flat bottom is the most reliable entry signal for long-term capital.
【Why Bitcoin’s Real Bear-Market Bottom Must Be a “Flat Bottom” of Ultra-Low Volatility】
Looking back at the bear-market bottoms of the past two cycles (2018–2019 and 2022–2023), Bitcoin’s true bottom has never been formed by a single, sudden spike downward. Instead, it consistently shows a “flat bottom” structure characterized by ultra-low volatility.
This phenomenon is strongly supported by on-chain metrics and game-theory logic:
The essence of clearing positions: A sharp sell-off (a dimensionality-reduction strike) can only liquidate high-leverage traders and panic-driven orders, but it cannot completely wash out committed long-term holders (LTHs). A real bottom requires time plus extremely narrow-range oscillation to grind down market sentiment. When turnover rate falls to a near-zero level, the SOPR stays below 1 for the long term and volatility converges; then positions shift decisively from short-term hands to long-term hands, and only then can a flat bottom be established.
Liquidity exhaustion and clearing: In a flat-bottom zone of ultra-low volatility, market liquidity becomes depleted. Selling pressure (as Unrealized Loss gradually gets fully realized) and buy pressure reach a very fragile balance—until volatility compresses to a historical extreme, at which point explosive buying power begins to rebuild.
Back to the current market perspective: At the moment, the price location and volatility have not shown “near-zero” characteristics. Considering the on-chain cost-basis structure and the distribution of holdings, the real cycle bottom is likely still at a lower level (e.g., below $50,000). Before the market forms a base, it will most likely need to experience one last, extremely violent final sell-off that fully breaks through the market’s final psychological defense and liquidates remaining dip-buy leverage.
Sell into panic to reveal the true bottom. Waiting patiently for this final washout and the subsequent construction of a flat bottom is the most reliable entry signal for long-term capital.
Looking back at the bear-market bottoms of the past two cycles (2018–2019 and 2022–2023), Bitcoin’s true bottom has never been formed by a single, sudden spike downward. Instead, it consistently shows a “flat bottom” structure characterized by ultra-low volatility.
This phenomenon is strongly supported by on-chain metrics and game-theory logic:
The essence of clearing positions: A sharp sell-off (a dimensionality-reduction strike) can only liquidate high-leverage traders and panic-driven orders, but it cannot completely wash out committed long-term holders (LTHs). A real bottom requires time plus extremely narrow-range oscillation to grind down market sentiment. When turnover rate falls to a near-zero level, the SOPR stays below 1 for the long term and volatility converges; then positions shift decisively from short-term hands to long-term hands, and only then can a flat bottom be established.
Liquidity exhaustion and clearing: In a flat-bottom zone of ultra-low volatility, market liquidity becomes depleted. Selling pressure (as Unrealized Loss gradually gets fully realized) and buy pressure reach a very fragile balance—until volatility compresses to a historical extreme, at which point explosive buying power begins to rebuild.
Back to the current market perspective: At the moment, the price location and volatility have not shown “near-zero” characteristics. Considering the on-chain cost-basis structure and the distribution of holdings, the real cycle bottom is likely still at a lower level (e.g., below $50,000). Before the market forms a base, it will most likely need to experience one last, extremely violent final sell-off that fully breaks through the market’s final psychological defense and liquidates remaining dip-buy leverage.
Sell into panic to reveal the true bottom. Waiting patiently for this final washout and the subsequent construction of a flat bottom is the most reliable entry signal for long-term capital.
1
187
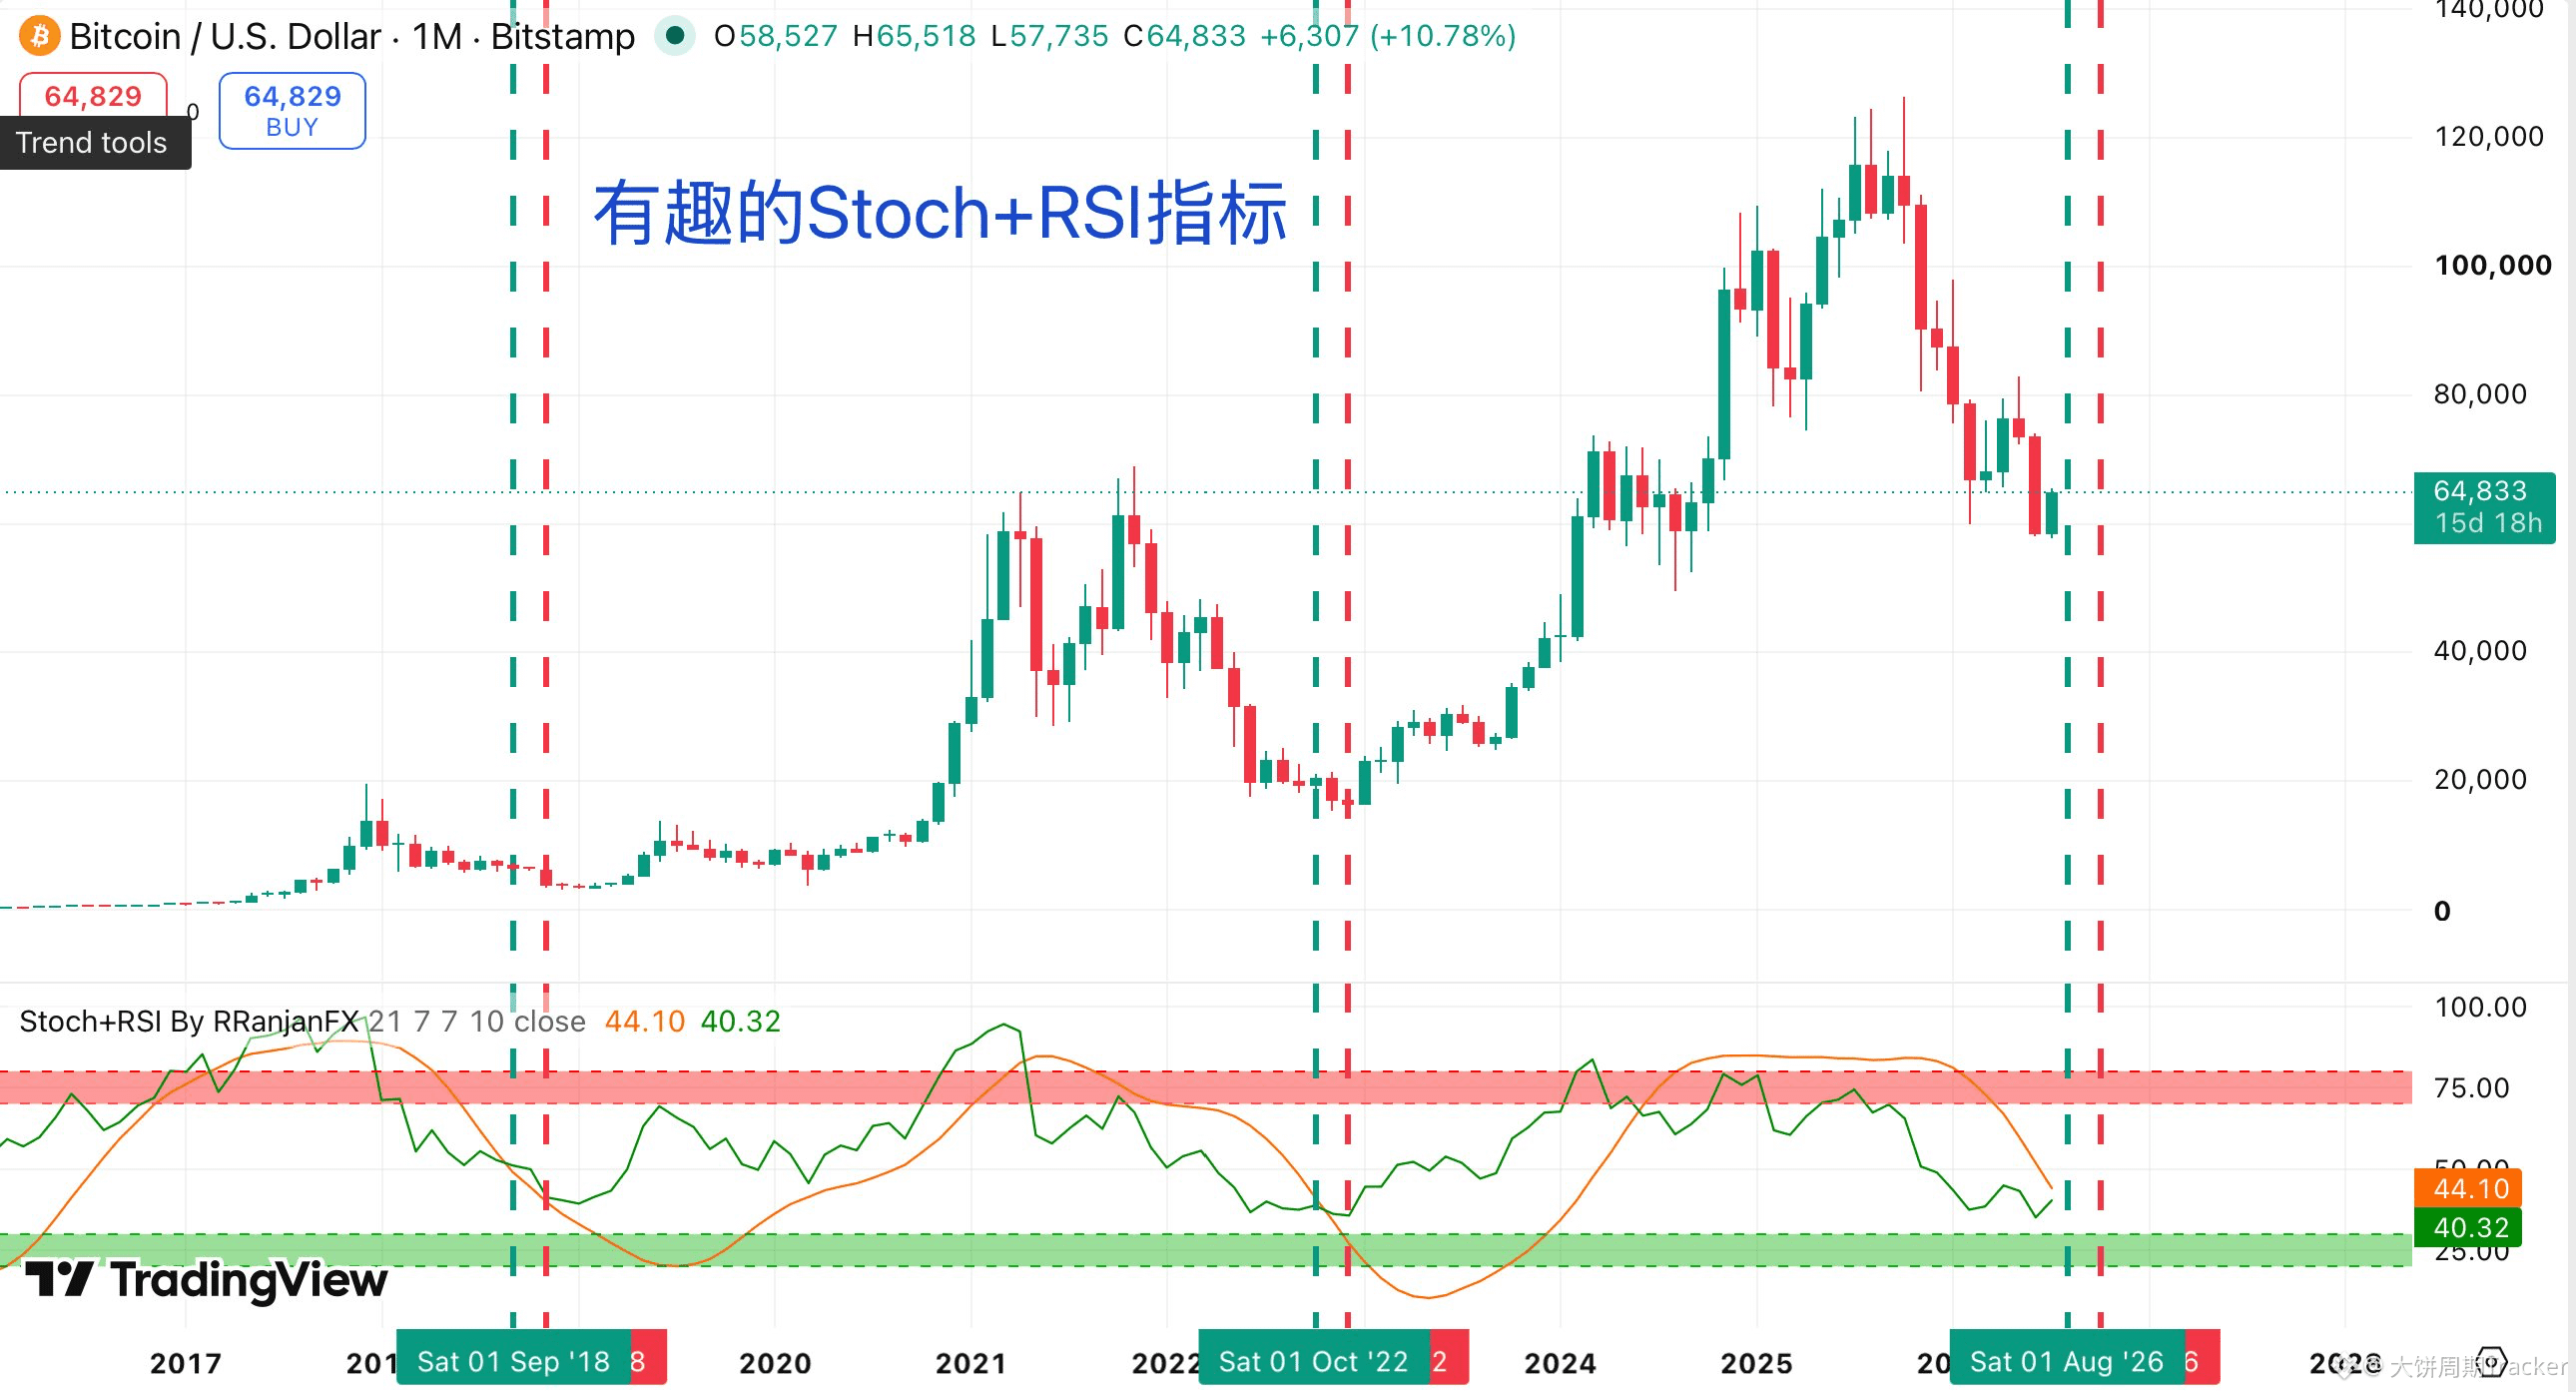
Bitcoin Stoch+RSI on the monthly chart: historic ironclad law—or could history repeat?!
The bottom of this bear market is very likely to be in October!
By combining the Bitcoin monthly chart with the Stoch+RSI indicators, the price action shows an extremely regular historical “mirror,” worth a deep retrospective analysis.
First, take a look at this big monthly chart:
In Bitcoin’s complete cycles from 2017 to today, the Stoch+RSI indicator (the green line is Stoch, and the orange line is the RSI smoothed line) has produced two clearly identifiable signals where the orange line crosses below the green line. Each time, it accurately corresponds to the time window when the bear-market bottom forms.
First time (bear market in 2018): The orange line crosses below the green line around November 2018. Then, the 2nd monthly candlestick (roughly around January 2019) marks when Bitcoin touches the cycle bottom, kicking off a multi-month base-building rebound.
Second time (bear market in 2022): The orange line crosses below the green line again around December 2022. The 2nd monthly candlestick, around February 2023, sees Bitcoin form another historical major bottom, followed by the super bull market of 2023–2024.
In both bear markets, the timing is highly consistent: after the orange line crosses below the green line, the 2nd monthly candlestick is the bottom. This is not a coincidence. On the monthly timeframe, Stoch+RSI reliably captures oversold extremes— the orange line represents RSI downward momentum, while the green line (Stoch) reflects the critical point of the oversold reversal. After the two lines cross, the market typically completes its final wave of capitulation and then enters a reversal build-up phase.
What about now? As can be clearly seen in the chart, in August 2026 the orange line is about to cross below the green line (the current green line is still falling from a high level while the orange line is accelerating downward). According to historical patterns:
August will complete the crossover
The 2nd monthly candlestick corresponds to around October 2026
This suggests that October will very likely become the final bottom zone for this Bitcoin bear market. Current price is about $64,873, and it has already pulled back significantly from the historical high. With the macro environment gradually shifting (the Fed’s rate-cut cycle, institutions accumulating coins, and the post-halving effect), once the bottom is confirmed, the upside potential is worth期待.
Friends, what do you think? Will it bottom in October, or is there still a lower move? Feel free to discuss rationally in the comments.
Data is based on publicly available charts only, for learning and交流 purposes. It does not constitute investment advice.
Bitcoin Stoch+RSI on the monthly chart: historic ironclad law—or could history repeat?!
The bottom of this bear market is very likely to be in October!
By combining the Bitcoin monthly chart with the Stoch+RSI indicators, the price action shows an extremely regular historical “mirror,” worth a deep retrospective analysis.
First, take a look at this big monthly chart:
In Bitcoin’s complete cycles from 2017 to today, the Stoch+RSI indicator (the green line is Stoch, and the orange line is the RSI smoothed line) has produced two clearly identifiable signals where the orange line crosses below the green line. Each time, it accurately corresponds to the time window when the bear-market bottom forms.
First time (bear market in 2018): The orange line crosses below the green line around November 2018. Then, the 2nd monthly candlestick (roughly around January 2019) marks when Bitcoin touches the cycle bottom, kicking off a multi-month base-building rebound.
Second time (bear market in 2022): The orange line crosses below the green line again around December 2022. The 2nd monthly candlestick, around February 2023, sees Bitcoin form another historical major bottom, followed by the super bull market of 2023–2024.
In both bear markets, the timing is highly consistent: after the orange line crosses below the green line, the 2nd monthly candlestick is the bottom. This is not a coincidence. On the monthly timeframe, Stoch+RSI reliably captures oversold extremes— the orange line represents RSI downward momentum, while the green line (Stoch) reflects the critical point of the oversold reversal. After the two lines cross, the market typically completes its final wave of capitulation and then enters a reversal build-up phase.
What about now? As can be clearly seen in the chart, in August 2026 the orange line is about to cross below the green line (the current green line is still falling from a high level while the orange line is accelerating downward). According to historical patterns:
August will complete the crossover
The 2nd monthly candlestick corresponds to around October 2026
This suggests that October will very likely become the final bottom zone for this Bitcoin bear market. Current price is about $64,873, and it has already pulled back significantly from the historical high. With the macro environment gradually shifting (the Fed’s rate-cut cycle, institutions accumulating coins, and the post-halving effect), once the bottom is confirmed, the upside potential is worth期待.
Friends, what do you think? Will it bottom in October, or is there still a lower move? Feel free to discuss rationally in the comments.
Data is based on publicly available charts only, for learning and交流 purposes. It does not constitute investment advice.
The bottom of this bear market is very likely to be in October!
By combining the Bitcoin monthly chart with the Stoch+RSI indicators, the price action shows an extremely regular historical “mirror,” worth a deep retrospective analysis.
First, take a look at this big monthly chart:
In Bitcoin’s complete cycles from 2017 to today, the Stoch+RSI indicator (the green line is Stoch, and the orange line is the RSI smoothed line) has produced two clearly identifiable signals where the orange line crosses below the green line. Each time, it accurately corresponds to the time window when the bear-market bottom forms.
First time (bear market in 2018): The orange line crosses below the green line around November 2018. Then, the 2nd monthly candlestick (roughly around January 2019) marks when Bitcoin touches the cycle bottom, kicking off a multi-month base-building rebound.
Second time (bear market in 2022): The orange line crosses below the green line again around December 2022. The 2nd monthly candlestick, around February 2023, sees Bitcoin form another historical major bottom, followed by the super bull market of 2023–2024.
In both bear markets, the timing is highly consistent: after the orange line crosses below the green line, the 2nd monthly candlestick is the bottom. This is not a coincidence. On the monthly timeframe, Stoch+RSI reliably captures oversold extremes— the orange line represents RSI downward momentum, while the green line (Stoch) reflects the critical point of the oversold reversal. After the two lines cross, the market typically completes its final wave of capitulation and then enters a reversal build-up phase.
What about now? As can be clearly seen in the chart, in August 2026 the orange line is about to cross below the green line (the current green line is still falling from a high level while the orange line is accelerating downward). According to historical patterns:
August will complete the crossover
The 2nd monthly candlestick corresponds to around October 2026
This suggests that October will very likely become the final bottom zone for this Bitcoin bear market. Current price is about $64,873, and it has already pulled back significantly from the historical high. With the macro environment gradually shifting (the Fed’s rate-cut cycle, institutions accumulating coins, and the post-halving effect), once the bottom is confirmed, the upside potential is worth期待.
Friends, what do you think? Will it bottom in October, or is there still a lower move? Feel free to discuss rationally in the comments.
Data is based on publicly available charts only, for learning and交流 purposes. It does not constitute investment advice.
1
187
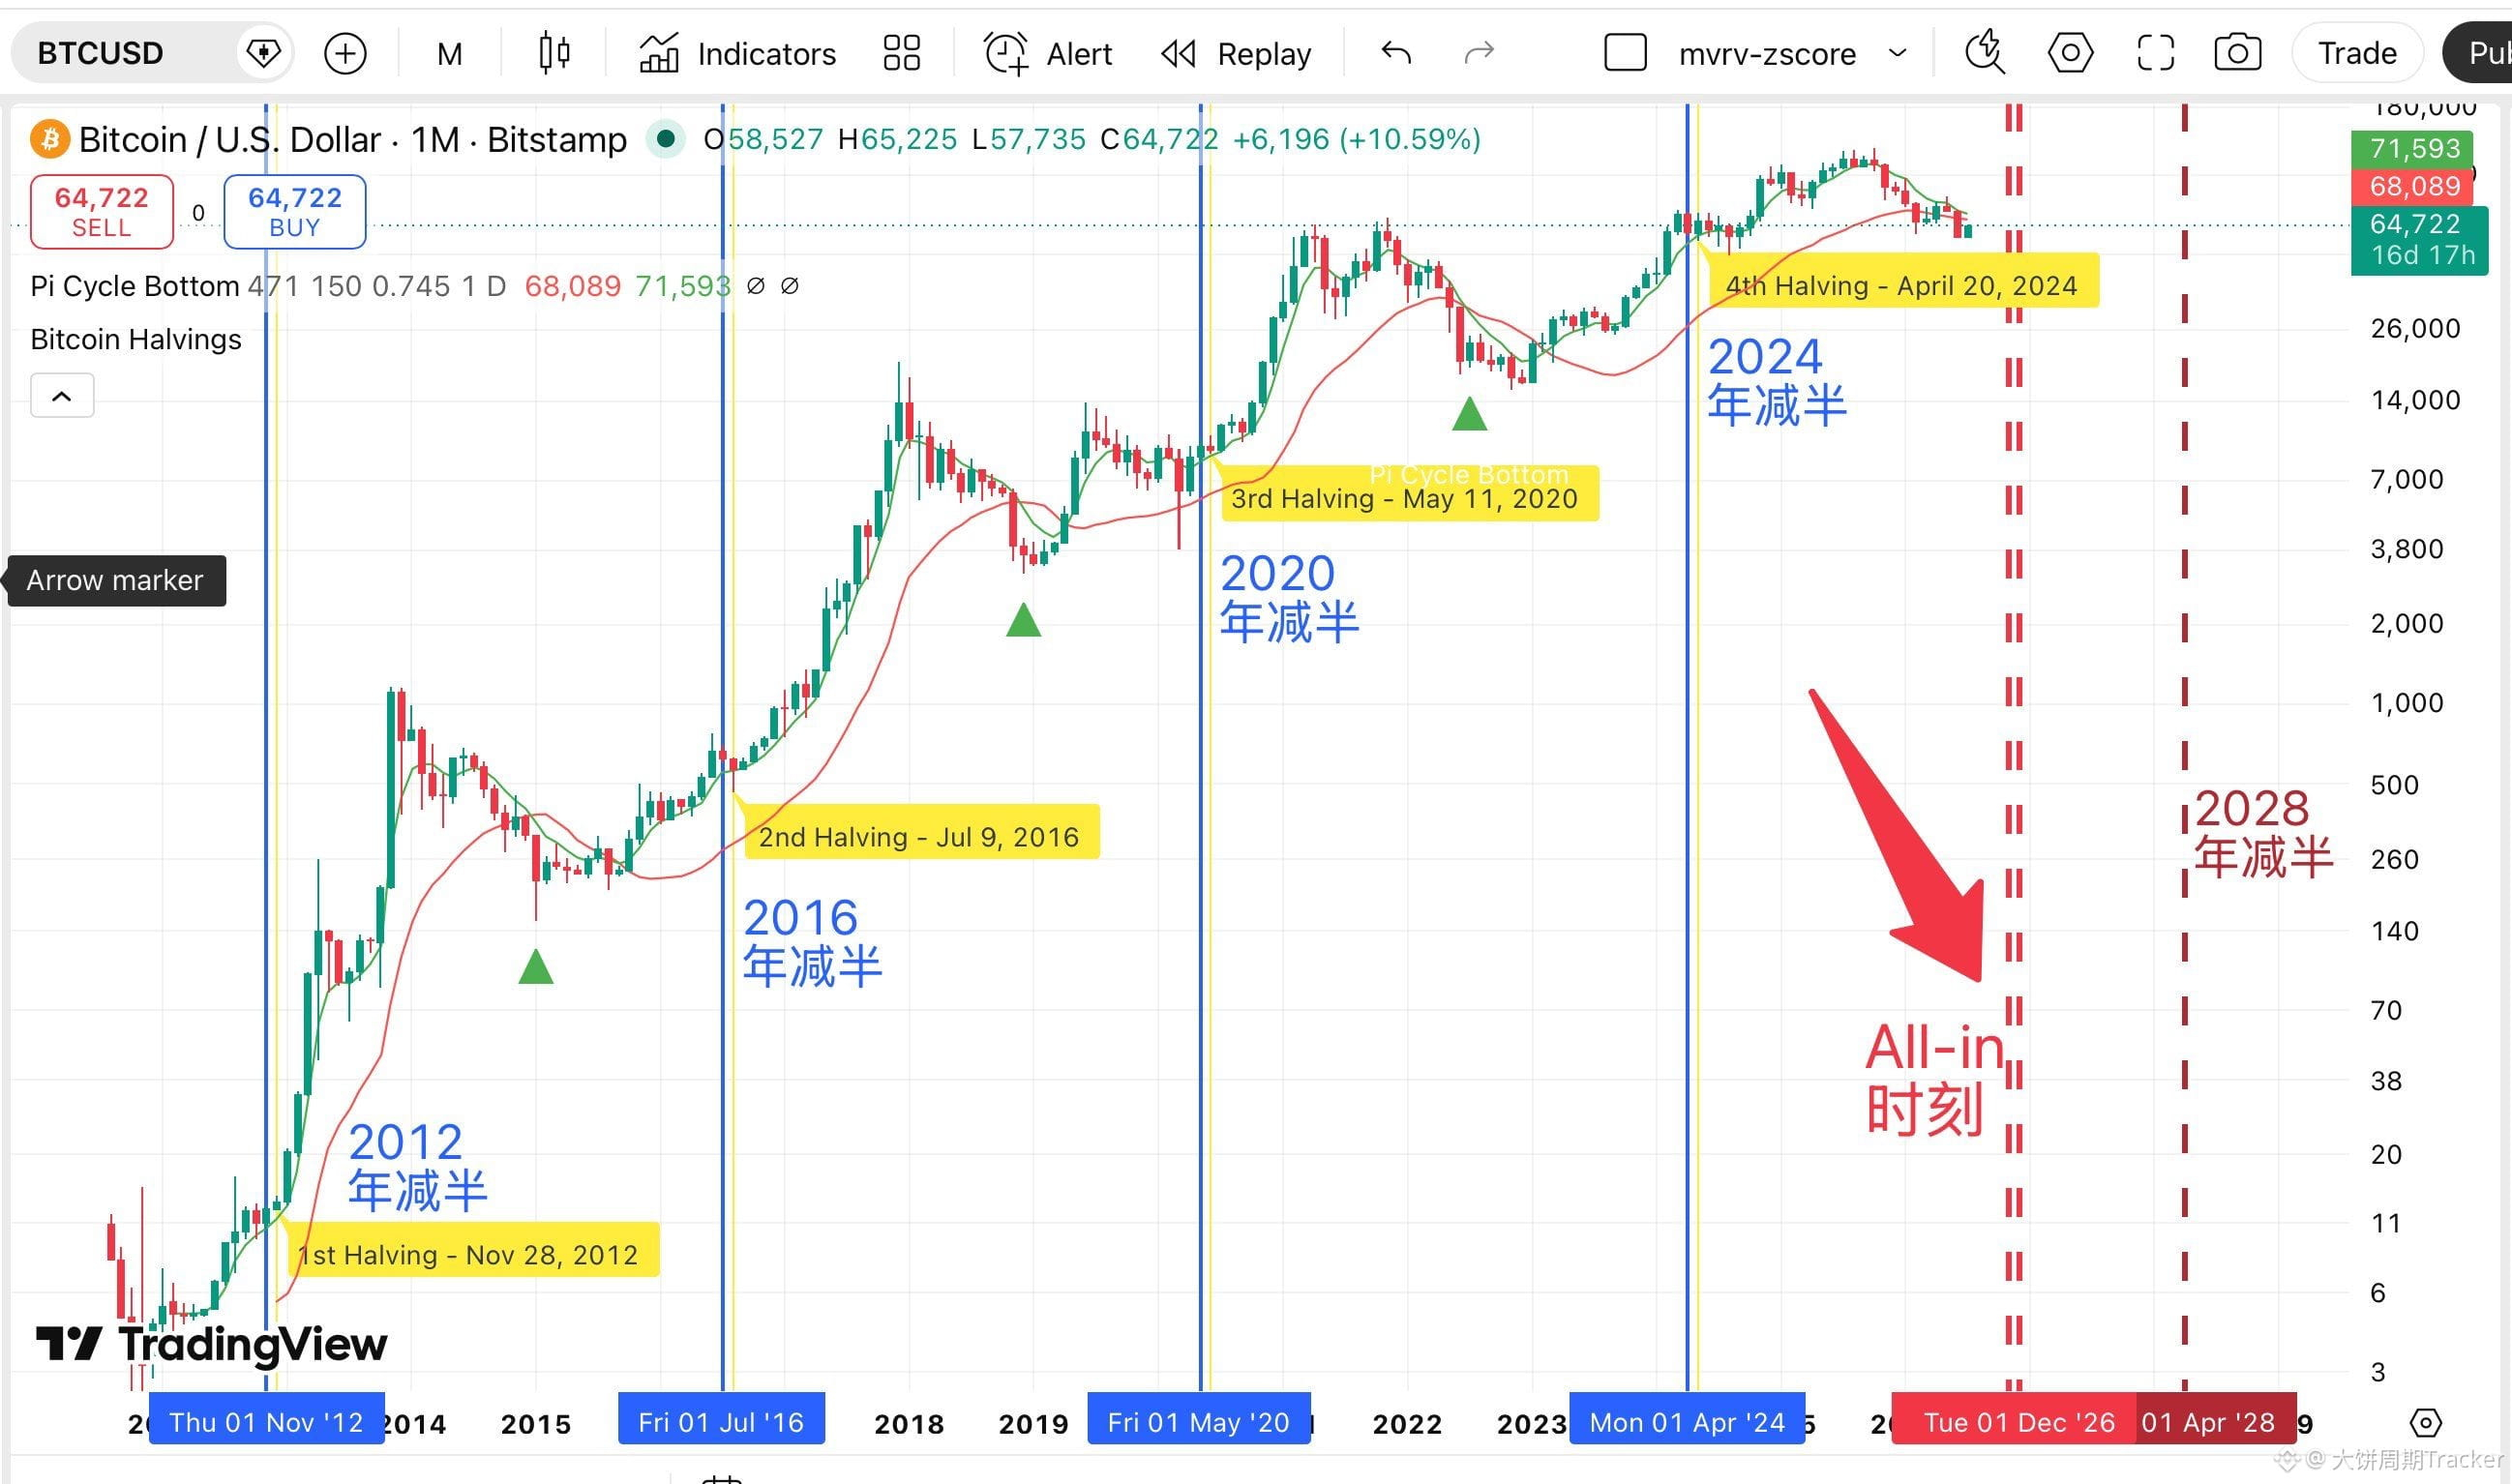
[Cycle Echo: Why the end of 2026 is the starting point of Bitcoin’s epic-level master plan?]
Bitcoin’s “four-year halving cycle” is not only a pattern, but also the self-fulfillment of collective consensus. History shows that the “500 days before the halving” is usually the bleakest period of the bear market—yet also a golden window for the cleanest positioning of capital.
By counting backward 500 days from the next halving (expected in mid-April 2028), this window will open from late November to mid-December 2026, with the midpoint around December 4.
“Carving on a boat” is not superstition. When global liquidity cycles and technical windows resonate, the end of 2026 will offer an extremely valuable “time safety margin.” Bear-market positioning depends on staggered, dull patience rather than perfectly timed bottom-picking. The winter at the end of 2026 is precisely where the next bull market is taking root. In the face of cycles, those who understand the规律 and endure solitude will eventually reap the compounding returns of time.
[Cycle Echo: Why the end of 2026 is the starting point of Bitcoin’s epic-level master plan?]
Bitcoin’s “four-year halving cycle” is not only a pattern, but also the self-fulfillment of collective consensus. History shows that the “500 days before the halving” is usually the bleakest period of the bear market—yet also a golden window for the cleanest positioning of capital.
By counting backward 500 days from the next halving (expected in mid-April 2028), this window will open from late November to mid-December 2026, with the midpoint around December 4.
“Carving on a boat” is not superstition. When global liquidity cycles and technical windows resonate, the end of 2026 will offer an extremely valuable “time safety margin.” Bear-market positioning depends on staggered, dull patience rather than perfectly timed bottom-picking. The winter at the end of 2026 is precisely where the next bull market is taking root. In the face of cycles, those who understand the规律 and endure solitude will eventually reap the compounding returns of time.
Bitcoin’s “four-year halving cycle” is not only a pattern, but also the self-fulfillment of collective consensus. History shows that the “500 days before the halving” is usually the bleakest period of the bear market—yet also a golden window for the cleanest positioning of capital.
By counting backward 500 days from the next halving (expected in mid-April 2028), this window will open from late November to mid-December 2026, with the midpoint around December 4.
“Carving on a boat” is not superstition. When global liquidity cycles and technical windows resonate, the end of 2026 will offer an extremely valuable “time safety margin.” Bear-market positioning depends on staggered, dull patience rather than perfectly timed bottom-picking. The winter at the end of 2026 is precisely where the next bull market is taking root. In the face of cycles, those who understand the规律 and endure solitude will eventually reap the compounding returns of time.
1
223
Article
Script Crossroads: BTC’s “Two-Pronged Preparation” at the Bear Market Bottom and the Ultimate AmbushScript Crossroads: BTC’s “Two-Pronged Preparation” at the Bear Market Bottom and the Ultimate Ambush
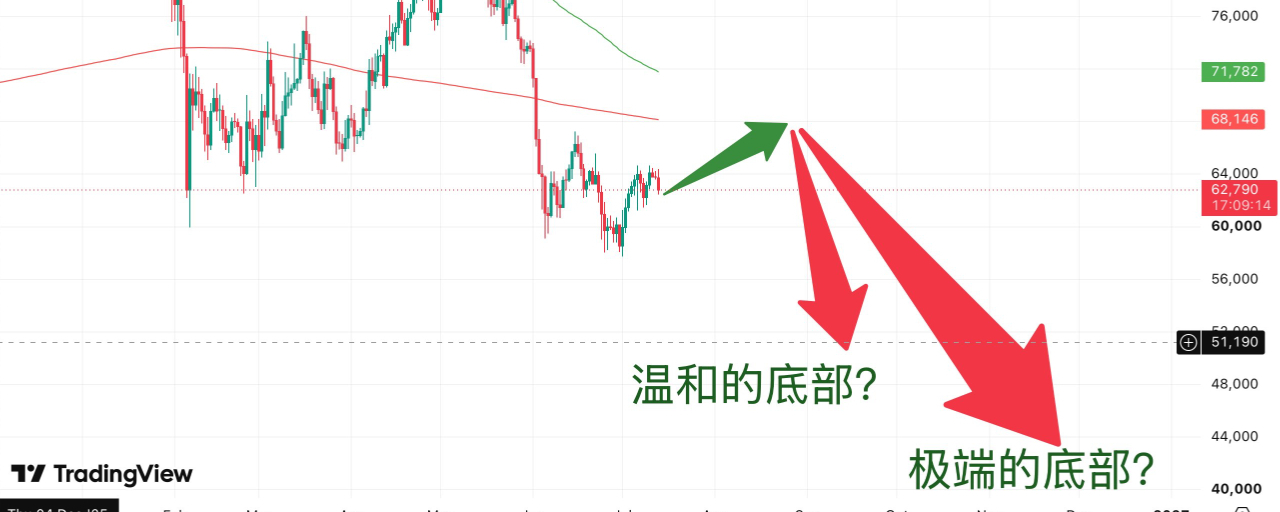
In the macro cycle of the crypto market, the most fascinating part is that “history won’t simply repeat, but it always follows the same rhyme.” As discussions about the “second half of the bear market” have recently heated up, and after combining technical analysis, price-volume relationships, and on-chain indicators, we find that the market’s next “script” has become increasingly clear.
As we previously judged the market’s rhythm, in bull and bear markets, 80% of the time is the torturous, boring range-bound chop, and what often decides the outcome is merely those 20% key windows. At the current crossroads of the cycle, the fourth leg of decline (the main force’s final strike) may be building up. Based on the fading of momentum and on-chain resonance, the BTC bear market bottom is very likely to evolve into one of the following two scenarios.
Script Crossroads: BTC’s “Two-Pronged Preparation” at the Bear Market Bottom and the Ultimate Ambush
Script Crossroads: BTC’s “Two-Pronged Preparation” at the Bear Market Bottom and the Ultimate Ambush
In the macro cycle of the crypto market, the most fascinating part is that “history won’t simply repeat, but it always follows the same rhyme.” As discussions about the “second half of the bear market” have recently heated up, and after combining technical analysis, price-volume relationships, and on-chain indicators, we find that the market’s next “script” has become increasingly clear.
As we previously judged the market’s rhythm, in bull and bear markets, 80% of the time is the torturous, boring range-bound chop, and what often decides the outcome is merely those 20% key windows. At the current crossroads of the cycle, the fourth leg of decline (the main force’s final strike) may be building up. Based on the fading of momentum and on-chain resonance, the BTC bear market bottom is very likely to evolve into one of the following two scenarios.
In the macro cycle of the crypto market, the most fascinating part is that “history won’t simply repeat, but it always follows the same rhyme.” As discussions about the “second half of the bear market” have recently heated up, and after combining technical analysis, price-volume relationships, and on-chain indicators, we find that the market’s next “script” has become increasingly clear.
As we previously judged the market’s rhythm, in bull and bear markets, 80% of the time is the torturous, boring range-bound chop, and what often decides the outcome is merely those 20% key windows. At the current crossroads of the cycle, the fourth leg of decline (the main force’s final strike) may be building up. Based on the fading of momentum and on-chain resonance, the BTC bear market bottom is very likely to evolve into one of the following two scenarios.
1
1
196
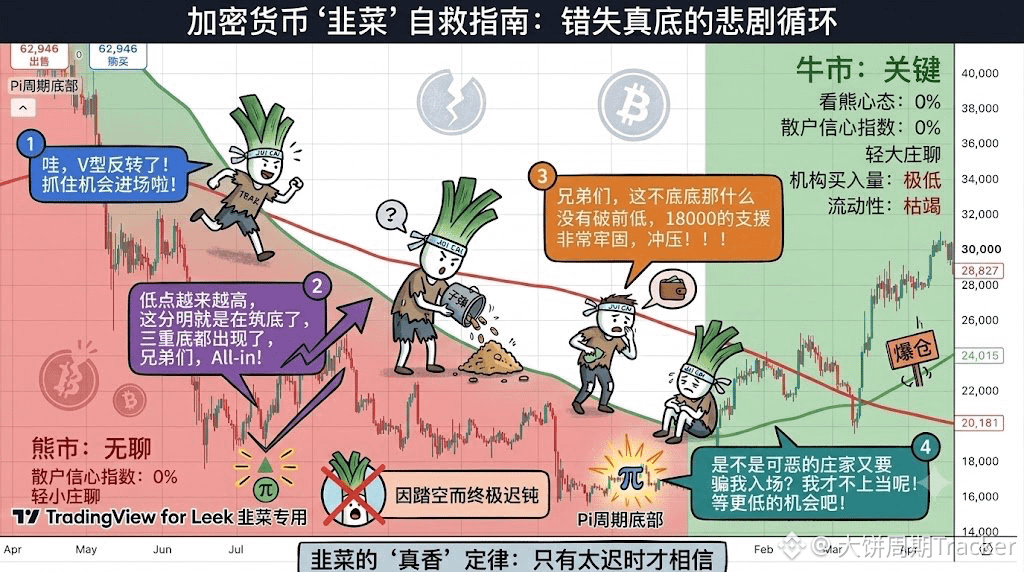
【The “True-Sweetness” Law of Leeks and the Ultimate Miss】
Just as I summarized in my previous post: during the 80% suffering-and-chop of a bear market, we always end up “believing when we shouldn’t, and refusing to believe even when we should—right up until we die by it.”
This chart perfectly shows what it means to go through the process of “having your trust stripped away by the market”:
In the first three rounds, we were full of spirit—treating every intermediate bounce as a V-reversal and a sure bottom—only to have the main players carve us up with a dull knife, bleeding away both our ammo and our confidence.
The most ironic part is this: when the Pi Cycle Bottom indicator finally closes and the true historical major bottom finally appears, desperate retail investors develop PTSD—trauma from repeated losses—insisting this is a “broker’s bait-and-pump scheme,” and vowing to wait for an even lower level of 12.00. So what happened? Real opportunity just drifted away in the arrogance of “I won’t fall for it.”
That’s what it means: burn your ammunition in boredom, lose your nerve during panic, and in the end shed tears from missing out.
Never hand over your rationality in the red volatility zone!
【The “True-Sweetness” Law of Leeks and the Ultimate Miss】
Just as I summarized in my previous post: during the 80% suffering-and-chop of a bear market, we always end up “believing when we shouldn’t, and refusing to believe even when we should—right up until we die by it.”
This chart perfectly shows what it means to go through the process of “having your trust stripped away by the market”:
In the first three rounds, we were full of spirit—treating every intermediate bounce as a V-reversal and a sure bottom—only to have the main players carve us up with a dull knife, bleeding away both our ammo and our confidence.
The most ironic part is this: when the Pi Cycle Bottom indicator finally closes and the true historical major bottom finally appears, desperate retail investors develop PTSD—trauma from repeated losses—insisting this is a “broker’s bait-and-pump scheme,” and vowing to wait for an even lower level of 12.00. So what happened? Real opportunity just drifted away in the arrogance of “I won’t fall for it.”
That’s what it means: burn your ammunition in boredom, lose your nerve during panic, and in the end shed tears from missing out.
Never hand over your rationality in the red volatility zone!
Just as I summarized in my previous post: during the 80% suffering-and-chop of a bear market, we always end up “believing when we shouldn’t, and refusing to believe even when we should—right up until we die by it.”
This chart perfectly shows what it means to go through the process of “having your trust stripped away by the market”:
In the first three rounds, we were full of spirit—treating every intermediate bounce as a V-reversal and a sure bottom—only to have the main players carve us up with a dull knife, bleeding away both our ammo and our confidence.
The most ironic part is this: when the Pi Cycle Bottom indicator finally closes and the true historical major bottom finally appears, desperate retail investors develop PTSD—trauma from repeated losses—insisting this is a “broker’s bait-and-pump scheme,” and vowing to wait for an even lower level of 12.00. So what happened? Real opportunity just drifted away in the arrogance of “I won’t fall for it.”
That’s what it means: burn your ammunition in boredom, lose your nerve during panic, and in the end shed tears from missing out.
Never hand over your rationality in the red volatility zone!
Paul Xue BTC 链上数据研究
·
--
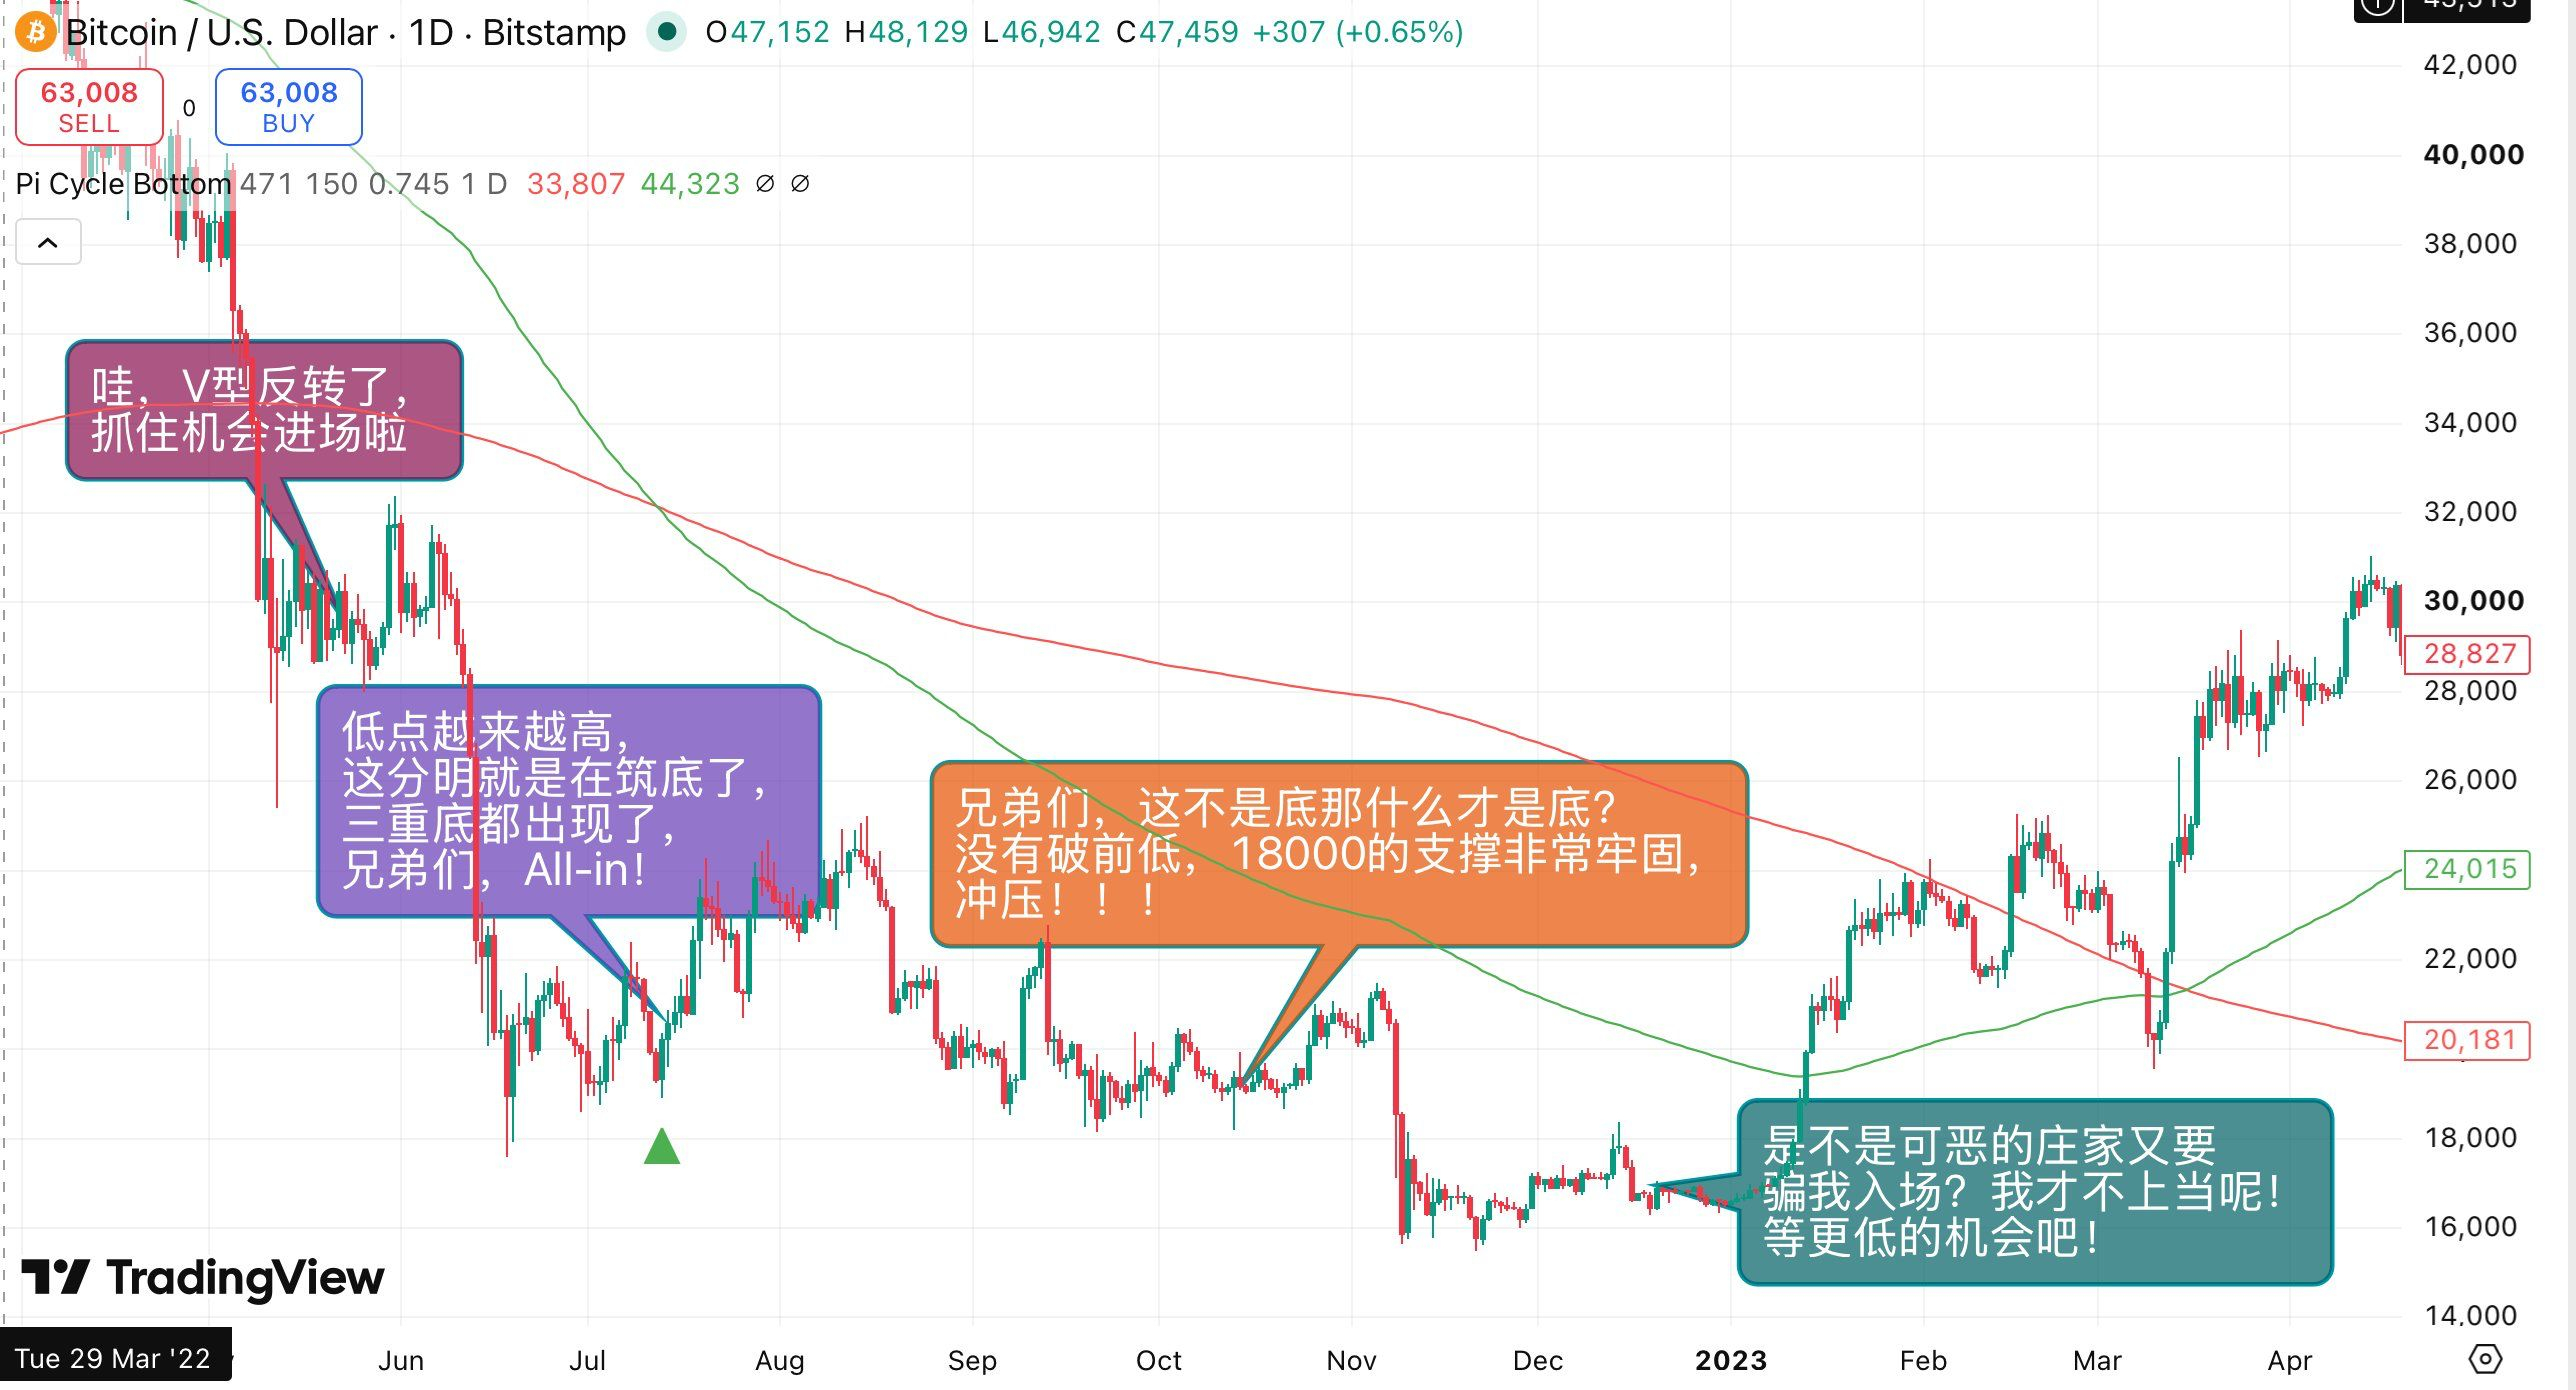
Bear-market bargain-hunting saga: I had a date with the bottom, but I flaked 😂
First time, 30K: “Wow, V’s reversed—let’s go!” Turned out it was fake. The first time, I believed.
Second time, 20K: “Clearly it’s building the base—triple bottom—All-in!” It was a scam. I believed again.
Third time, 18K: “Brothers, it hasn’t broken the prior low—support is solid, let’s go!” This time it was luring me in deeper. I believed yet again.
My money was gone.
When the real 16,000-bottom finally arrived, the main force started to push up.
Watching the red line turn green: “Hmph, this time it’s that awful dealer trying to trick me into entering! I won’t fall for it—I’ll wait for a lower chance!”
First time, 30K: “Wow, V’s reversed—let’s go!” Turned out it was fake. The first time, I believed.
Second time, 20K: “Clearly it’s building the base—triple bottom—All-in!” It was a scam. I believed again.
Third time, 18K: “Brothers, it hasn’t broken the prior low—support is solid, let’s go!” This time it was luring me in deeper. I believed yet again.
My money was gone.
When the real 16,000-bottom finally arrived, the main force started to push up.
Watching the red line turn green: “Hmph, this time it’s that awful dealer trying to trick me into entering! I won’t fall for it—I’ll wait for a lower chance!”
1
102
Bear-market bargain-hunting saga: I had a date with the bottom, but I flaked 😂
First time, 30K: “Wow, V’s reversed—let’s go!” Turned out it was fake. The first time, I believed.
Second time, 20K: “Clearly it’s building the base—triple bottom—All-in!” It was a scam. I believed again.
Third time, 18K: “Brothers, it hasn’t broken the prior low—support is solid, let’s go!” This time it was luring me in deeper. I believed yet again.
My money was gone.
When the real 16,000-bottom finally arrived, the main force started to push up.
Watching the red line turn green: “Hmph, this time it’s that awful dealer trying to trick me into entering! I won’t fall for it—I’ll wait for a lower chance!”
Bear-market bargain-hunting saga: I had a date with the bottom, but I flaked 😂
First time, 30K: “Wow, V’s reversed—let’s go!” Turned out it was fake. The first time, I believed.
Second time, 20K: “Clearly it’s building the base—triple bottom—All-in!” It was a scam. I believed again.
Third time, 18K: “Brothers, it hasn’t broken the prior low—support is solid, let’s go!” This time it was luring me in deeper. I believed yet again.
My money was gone.
When the real 16,000-bottom finally arrived, the main force started to push up.
Watching the red line turn green: “Hmph, this time it’s that awful dealer trying to trick me into entering! I won’t fall for it—I’ll wait for a lower chance!”
First time, 30K: “Wow, V’s reversed—let’s go!” Turned out it was fake. The first time, I believed.
Second time, 20K: “Clearly it’s building the base—triple bottom—All-in!” It was a scam. I believed again.
Third time, 18K: “Brothers, it hasn’t broken the prior low—support is solid, let’s go!” This time it was luring me in deeper. I believed yet again.
My money was gone.
When the real 16,000-bottom finally arrived, the main force started to push up.
Watching the red line turn green: “Hmph, this time it’s that awful dealer trying to trick me into entering! I won’t fall for it—I’ll wait for a lower chance!”
1
1
182
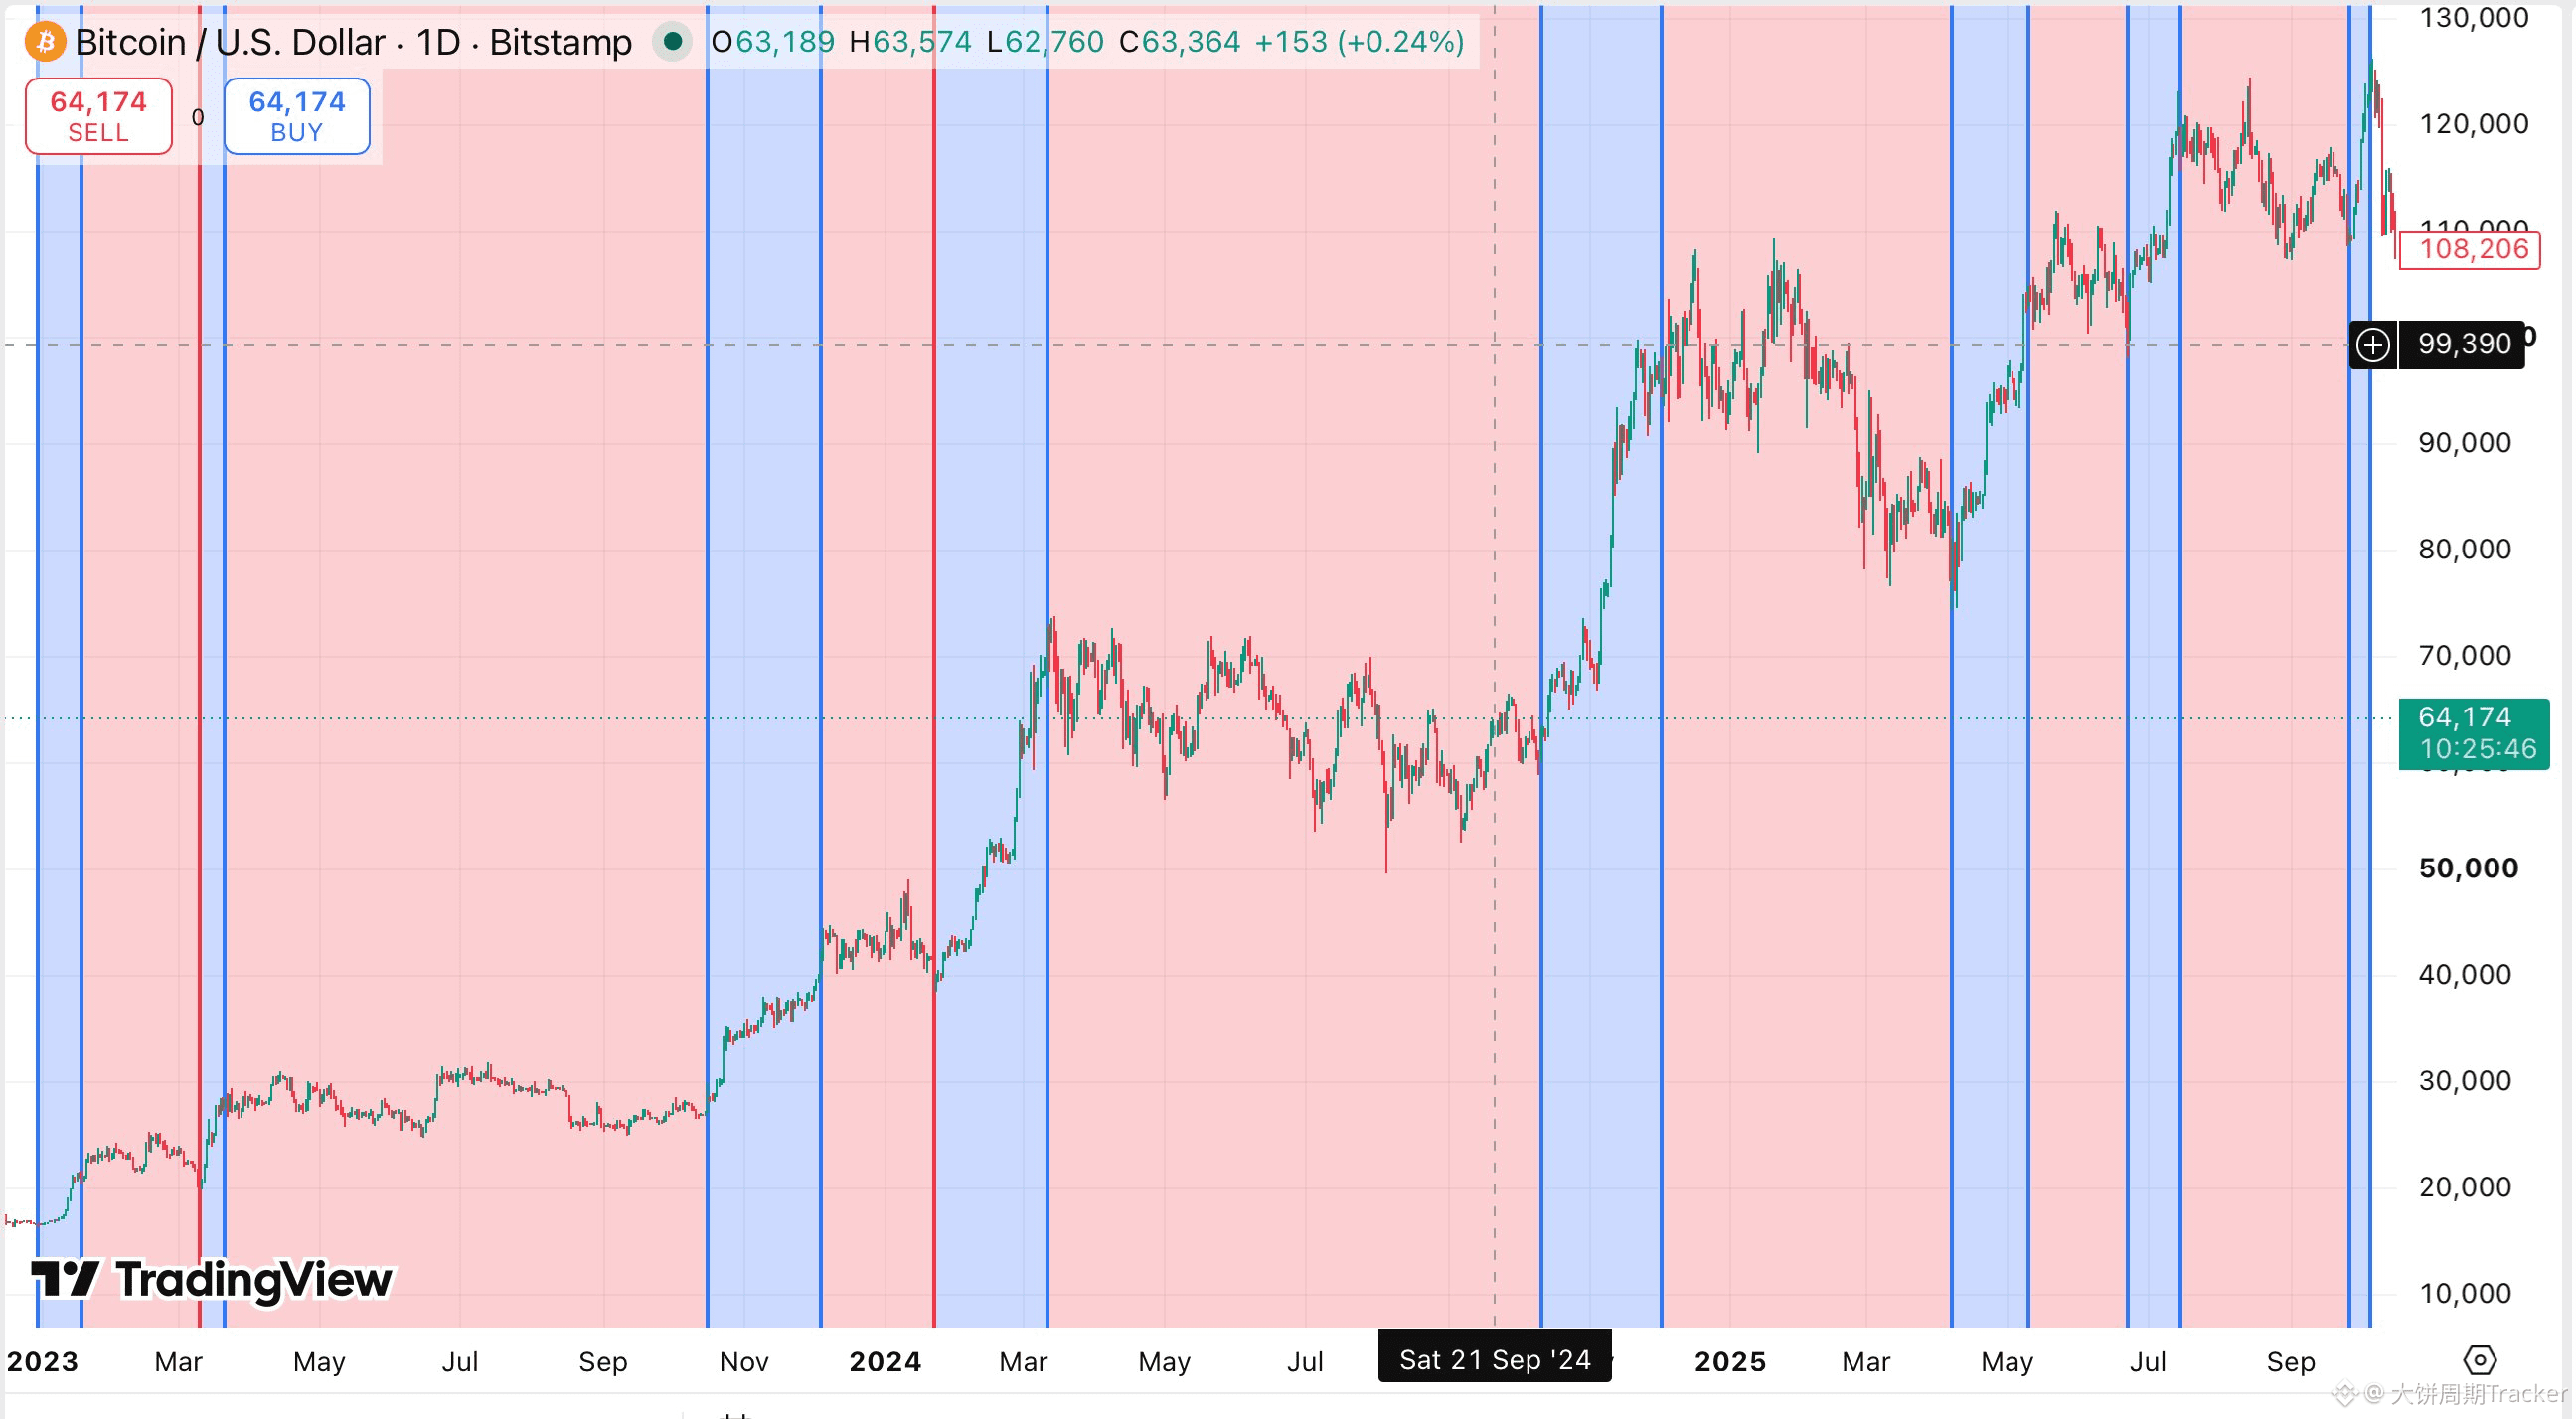
Many people think that in a bull market it’s just a relentless climb—account balances doubling day after day. But if you look at this candlestick chart of the Bitcoin bull run from 2022 to 2025, your understanding may be upended: even in a breathtaking bull market, the “spotlight moments” when prices surge sharply (the blue areas) are actually very rare, while the vast majority of the time (the red areas) is long, sideways consolidation and heartbreaking, grinding oscillations.
This is exactly the logic of a bear market. In a bear market, slow declines and sideways movement take up about 80% of the time, and the real crash usually happens over just a few days. In a bull market, the buildup, shakeouts, and sideways consolidation also account for over 80% of the time, while the truly impulse-like, explosive surges are concentrated in only 20% of the window.
The blue bars in the chart perfectly illustrate what it means for a rally to be “gone in the blink of an eye.” Several major breakout waves (such as late 2023, early 2024, and late 2024) were extremely fast, with strong explosive force—pushing the price to new highs within a short period of time. But afterward comes the red correction phases, which can last for months and wear people down (for example, the intense half-year volatility from March to October 2024).
This is also why most people still can’t make money in a bull market—some even lose money:
Die before dawn: During the long red consolidation and oscillation period, they lack patience or trade too often on short timeframes, and they fall right before the main surge.
Chasing in a bull market: When prices explode higher in the blue area, they get swept up by emotions, rush in out of FOMO, often buying near a local top, and then get tortured through long-term red sideways movement until they finally cut losses.
In crypto, one day is like a year for humans. The huge profits in a bull market, at their core, are the “interest” you earn for enduring long stretches of dull sideways trading and market swings.
Once you’ve understood this chart, your mindset can surpass 80% of retail investors: in the red areas, you can tolerate loneliness; in the blue areas, you don’t go crazy blindly. Real pros lay quietly during the red-dominated consolidation periods, feel at ease while waiting, and then calmly wait for those rare 20% blue spotlight moments to arrive.
Many people think that in a bull market it’s just a relentless climb—account balances doubling day after day. But if you look at this candlestick chart of the Bitcoin bull run from 2022 to 2025, your understanding may be upended: even in a breathtaking bull market, the “spotlight moments” when prices surge sharply (the blue areas) are actually very rare, while the vast majority of the time (the red areas) is long, sideways consolidation and heartbreaking, grinding oscillations.
This is exactly the logic of a bear market. In a bear market, slow declines and sideways movement take up about 80% of the time, and the real crash usually happens over just a few days. In a bull market, the buildup, shakeouts, and sideways consolidation also account for over 80% of the time, while the truly impulse-like, explosive surges are concentrated in only 20% of the window.
The blue bars in the chart perfectly illustrate what it means for a rally to be “gone in the blink of an eye.” Several major breakout waves (such as late 2023, early 2024, and late 2024) were extremely fast, with strong explosive force—pushing the price to new highs within a short period of time. But afterward comes the red correction phases, which can last for months and wear people down (for example, the intense half-year volatility from March to October 2024).
This is also why most people still can’t make money in a bull market—some even lose money:
Die before dawn: During the long red consolidation and oscillation period, they lack patience or trade too often on short timeframes, and they fall right before the main surge.
Chasing in a bull market: When prices explode higher in the blue area, they get swept up by emotions, rush in out of FOMO, often buying near a local top, and then get tortured through long-term red sideways movement until they finally cut losses.
In crypto, one day is like a year for humans. The huge profits in a bull market, at their core, are the “interest” you earn for enduring long stretches of dull sideways trading and market swings.
Once you’ve understood this chart, your mindset can surpass 80% of retail investors: in the red areas, you can tolerate loneliness; in the blue areas, you don’t go crazy blindly. Real pros lay quietly during the red-dominated consolidation periods, feel at ease while waiting, and then calmly wait for those rare 20% blue spotlight moments to arrive.
This is exactly the logic of a bear market. In a bear market, slow declines and sideways movement take up about 80% of the time, and the real crash usually happens over just a few days. In a bull market, the buildup, shakeouts, and sideways consolidation also account for over 80% of the time, while the truly impulse-like, explosive surges are concentrated in only 20% of the window.
The blue bars in the chart perfectly illustrate what it means for a rally to be “gone in the blink of an eye.” Several major breakout waves (such as late 2023, early 2024, and late 2024) were extremely fast, with strong explosive force—pushing the price to new highs within a short period of time. But afterward comes the red correction phases, which can last for months and wear people down (for example, the intense half-year volatility from March to October 2024).
This is also why most people still can’t make money in a bull market—some even lose money:
Die before dawn: During the long red consolidation and oscillation period, they lack patience or trade too often on short timeframes, and they fall right before the main surge.
Chasing in a bull market: When prices explode higher in the blue area, they get swept up by emotions, rush in out of FOMO, often buying near a local top, and then get tortured through long-term red sideways movement until they finally cut losses.
In crypto, one day is like a year for humans. The huge profits in a bull market, at their core, are the “interest” you earn for enduring long stretches of dull sideways trading and market swings.
Once you’ve understood this chart, your mindset can surpass 80% of retail investors: in the red areas, you can tolerate loneliness; in the blue areas, you don’t go crazy blindly. Real pros lay quietly during the red-dominated consolidation periods, feel at ease while waiting, and then calmly wait for those rare 20% blue spotlight moments to arrive.
Paul Xue BTC 链上数据研究
·
--
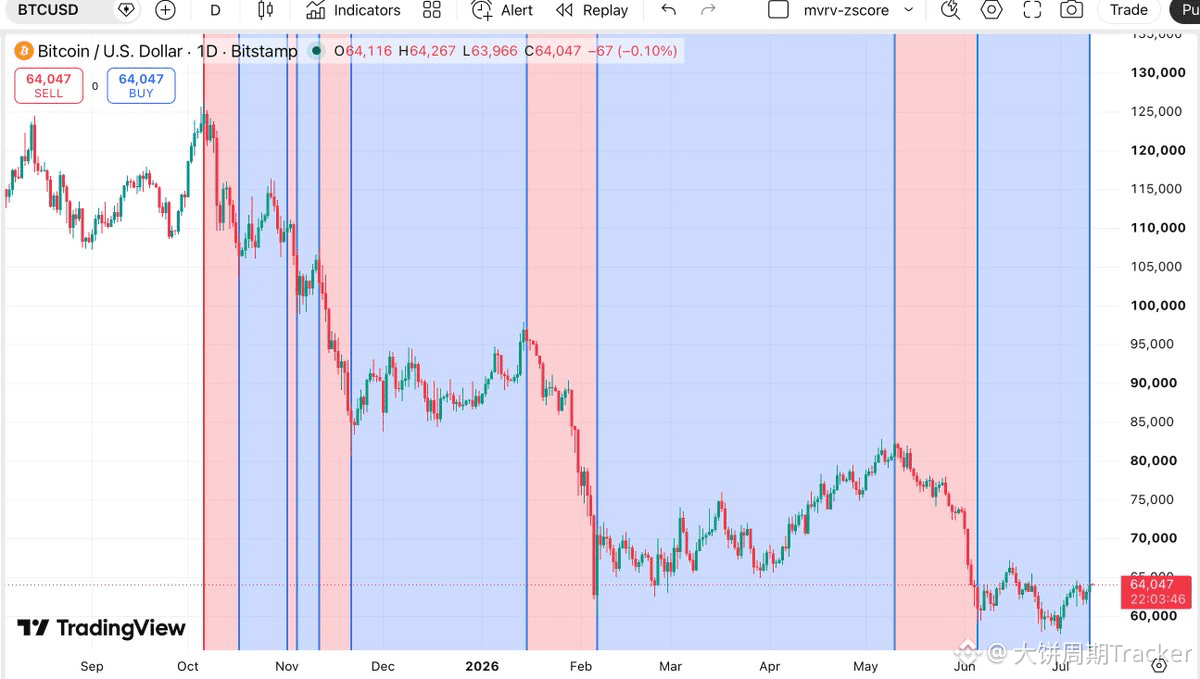
We often think that a bear market is simply a continuous decline. But if you calculate the time proportions carefully in the chart, you’ll be surprised to find that the truly fierce, large-scale drops (the steep bearish candles in the chart) actually take up a very small share of the time. Meanwhile, most of the time (the blue shaded areas), the market is instead going through what looks like a promising “bounce-back” or a frustrating “sideways consolidation.”
Why does this happen? It’s the perfect reflection of human nature and BTC’s characteristics.
Human nature’s weakness: refusing to admit failure. When BTC crashes hard from its highs (like the beginning of 2026 shown in the chart), most people’s first reaction isn’t to cut losses—it’s to wait for a “rebound to break even.” This mindset leads to a prolonged period of consolidation after the drop. Each small rebound gets interpreted as a “buy-the-dip opportunity,” pulling in new capital that then gets trapped, until it exhausts the patience of all holders.
BTC’s volatility: the intensity of the selloff versus the boredom of sideways trading. BTC is known for high volatility. Its declines are often accompanied by panic-driven liquidations and cascading leveraged forced liquidations, causing the price to plunge dramatically in a very short time. And then the subsequent “boring” sideways consolidation is the market digesting fear and rebuilding consensus (or falling into further despair)—a process that’s more torturous than the drop itself.
Final reflection:
A real bear market doesn’t bankrupt you in an instant. Instead, it slowly wears down your willpower, capital, and confidence through long waiting and intermittent hope (the blue intervals). Until most people— including those who were once firmly bullish— eventually cut their losses and exit in silence and despair, only then can the real bottom be considered to have arrived.
Look at this chart: in which blue interval did you once think, “the bear market is over”? And in which steep selloff interval did you experience the real panic? Leave your story in the comments.
Why does this happen? It’s the perfect reflection of human nature and BTC’s characteristics.
Human nature’s weakness: refusing to admit failure. When BTC crashes hard from its highs (like the beginning of 2026 shown in the chart), most people’s first reaction isn’t to cut losses—it’s to wait for a “rebound to break even.” This mindset leads to a prolonged period of consolidation after the drop. Each small rebound gets interpreted as a “buy-the-dip opportunity,” pulling in new capital that then gets trapped, until it exhausts the patience of all holders.
BTC’s volatility: the intensity of the selloff versus the boredom of sideways trading. BTC is known for high volatility. Its declines are often accompanied by panic-driven liquidations and cascading leveraged forced liquidations, causing the price to plunge dramatically in a very short time. And then the subsequent “boring” sideways consolidation is the market digesting fear and rebuilding consensus (or falling into further despair)—a process that’s more torturous than the drop itself.
Final reflection:
A real bear market doesn’t bankrupt you in an instant. Instead, it slowly wears down your willpower, capital, and confidence through long waiting and intermittent hope (the blue intervals). Until most people— including those who were once firmly bullish— eventually cut their losses and exit in silence and despair, only then can the real bottom be considered to have arrived.
Look at this chart: in which blue interval did you once think, “the bear market is over”? And in which steep selloff interval did you experience the real panic? Leave your story in the comments.
2
2
980
·
--
Bullish
If you could only hold one of the following assets for 10 years.
Which one would you choose?
If you could only hold one of the following assets for 20 years.
Which one would you choose?
Bitcoin
Ethereum
SpaceX
NVIDIA
Apple
Netflix
GOOGL
Tesla
Pop Mart
Kweichow Moutai
If you could only hold one of the following assets for 10 years.
Which one would you choose?
If you could only hold one of the following assets for 20 years.
Which one would you choose?
Bitcoin
Ethereum
SpaceX
NVIDIA
Apple
Netflix
GOOGL
Tesla
Pop Mart
Kweichow Moutai
Which one would you choose?
If you could only hold one of the following assets for 20 years.
Which one would you choose?
Bitcoin
Ethereum
SpaceX
NVIDIA
Apple
Netflix
GOOGL
Tesla
Pop Mart
Kweichow Moutai

1
102
We often think that a bear market is simply a continuous decline. But if you calculate the time proportions carefully in the chart, you’ll be surprised to find that the truly fierce, large-scale drops (the steep bearish candles in the chart) actually take up a very small share of the time. Meanwhile, most of the time (the blue shaded areas), the market is instead going through what looks like a promising “bounce-back” or a frustrating “sideways consolidation.”
Why does this happen? It’s the perfect reflection of human nature and BTC’s characteristics.
Human nature’s weakness: refusing to admit failure. When BTC crashes hard from its highs (like the beginning of 2026 shown in the chart), most people’s first reaction isn’t to cut losses—it’s to wait for a “rebound to break even.” This mindset leads to a prolonged period of consolidation after the drop. Each small rebound gets interpreted as a “buy-the-dip opportunity,” pulling in new capital that then gets trapped, until it exhausts the patience of all holders.
BTC’s volatility: the intensity of the selloff versus the boredom of sideways trading. BTC is known for high volatility. Its declines are often accompanied by panic-driven liquidations and cascading leveraged forced liquidations, causing the price to plunge dramatically in a very short time. And then the subsequent “boring” sideways consolidation is the market digesting fear and rebuilding consensus (or falling into further despair)—a process that’s more torturous than the drop itself.
Final reflection:
A real bear market doesn’t bankrupt you in an instant. Instead, it slowly wears down your willpower, capital, and confidence through long waiting and intermittent hope (the blue intervals). Until most people— including those who were once firmly bullish— eventually cut their losses and exit in silence and despair, only then can the real bottom be considered to have arrived.
Look at this chart: in which blue interval did you once think, “the bear market is over”? And in which steep selloff interval did you experience the real panic? Leave your story in the comments.
We often think that a bear market is simply a continuous decline. But if you calculate the time proportions carefully in the chart, you’ll be surprised to find that the truly fierce, large-scale drops (the steep bearish candles in the chart) actually take up a very small share of the time. Meanwhile, most of the time (the blue shaded areas), the market is instead going through what looks like a promising “bounce-back” or a frustrating “sideways consolidation.”
Why does this happen? It’s the perfect reflection of human nature and BTC’s characteristics.
Human nature’s weakness: refusing to admit failure. When BTC crashes hard from its highs (like the beginning of 2026 shown in the chart), most people’s first reaction isn’t to cut losses—it’s to wait for a “rebound to break even.” This mindset leads to a prolonged period of consolidation after the drop. Each small rebound gets interpreted as a “buy-the-dip opportunity,” pulling in new capital that then gets trapped, until it exhausts the patience of all holders.
BTC’s volatility: the intensity of the selloff versus the boredom of sideways trading. BTC is known for high volatility. Its declines are often accompanied by panic-driven liquidations and cascading leveraged forced liquidations, causing the price to plunge dramatically in a very short time. And then the subsequent “boring” sideways consolidation is the market digesting fear and rebuilding consensus (or falling into further despair)—a process that’s more torturous than the drop itself.
Final reflection:
A real bear market doesn’t bankrupt you in an instant. Instead, it slowly wears down your willpower, capital, and confidence through long waiting and intermittent hope (the blue intervals). Until most people— including those who were once firmly bullish— eventually cut their losses and exit in silence and despair, only then can the real bottom be considered to have arrived.
Look at this chart: in which blue interval did you once think, “the bear market is over”? And in which steep selloff interval did you experience the real panic? Leave your story in the comments.
Why does this happen? It’s the perfect reflection of human nature and BTC’s characteristics.
Human nature’s weakness: refusing to admit failure. When BTC crashes hard from its highs (like the beginning of 2026 shown in the chart), most people’s first reaction isn’t to cut losses—it’s to wait for a “rebound to break even.” This mindset leads to a prolonged period of consolidation after the drop. Each small rebound gets interpreted as a “buy-the-dip opportunity,” pulling in new capital that then gets trapped, until it exhausts the patience of all holders.
BTC’s volatility: the intensity of the selloff versus the boredom of sideways trading. BTC is known for high volatility. Its declines are often accompanied by panic-driven liquidations and cascading leveraged forced liquidations, causing the price to plunge dramatically in a very short time. And then the subsequent “boring” sideways consolidation is the market digesting fear and rebuilding consensus (or falling into further despair)—a process that’s more torturous than the drop itself.
Final reflection:
A real bear market doesn’t bankrupt you in an instant. Instead, it slowly wears down your willpower, capital, and confidence through long waiting and intermittent hope (the blue intervals). Until most people— including those who were once firmly bullish— eventually cut their losses and exit in silence and despair, only then can the real bottom be considered to have arrived.
Look at this chart: in which blue interval did you once think, “the bear market is over”? And in which steep selloff interval did you experience the real panic? Leave your story in the comments.
1
1
294
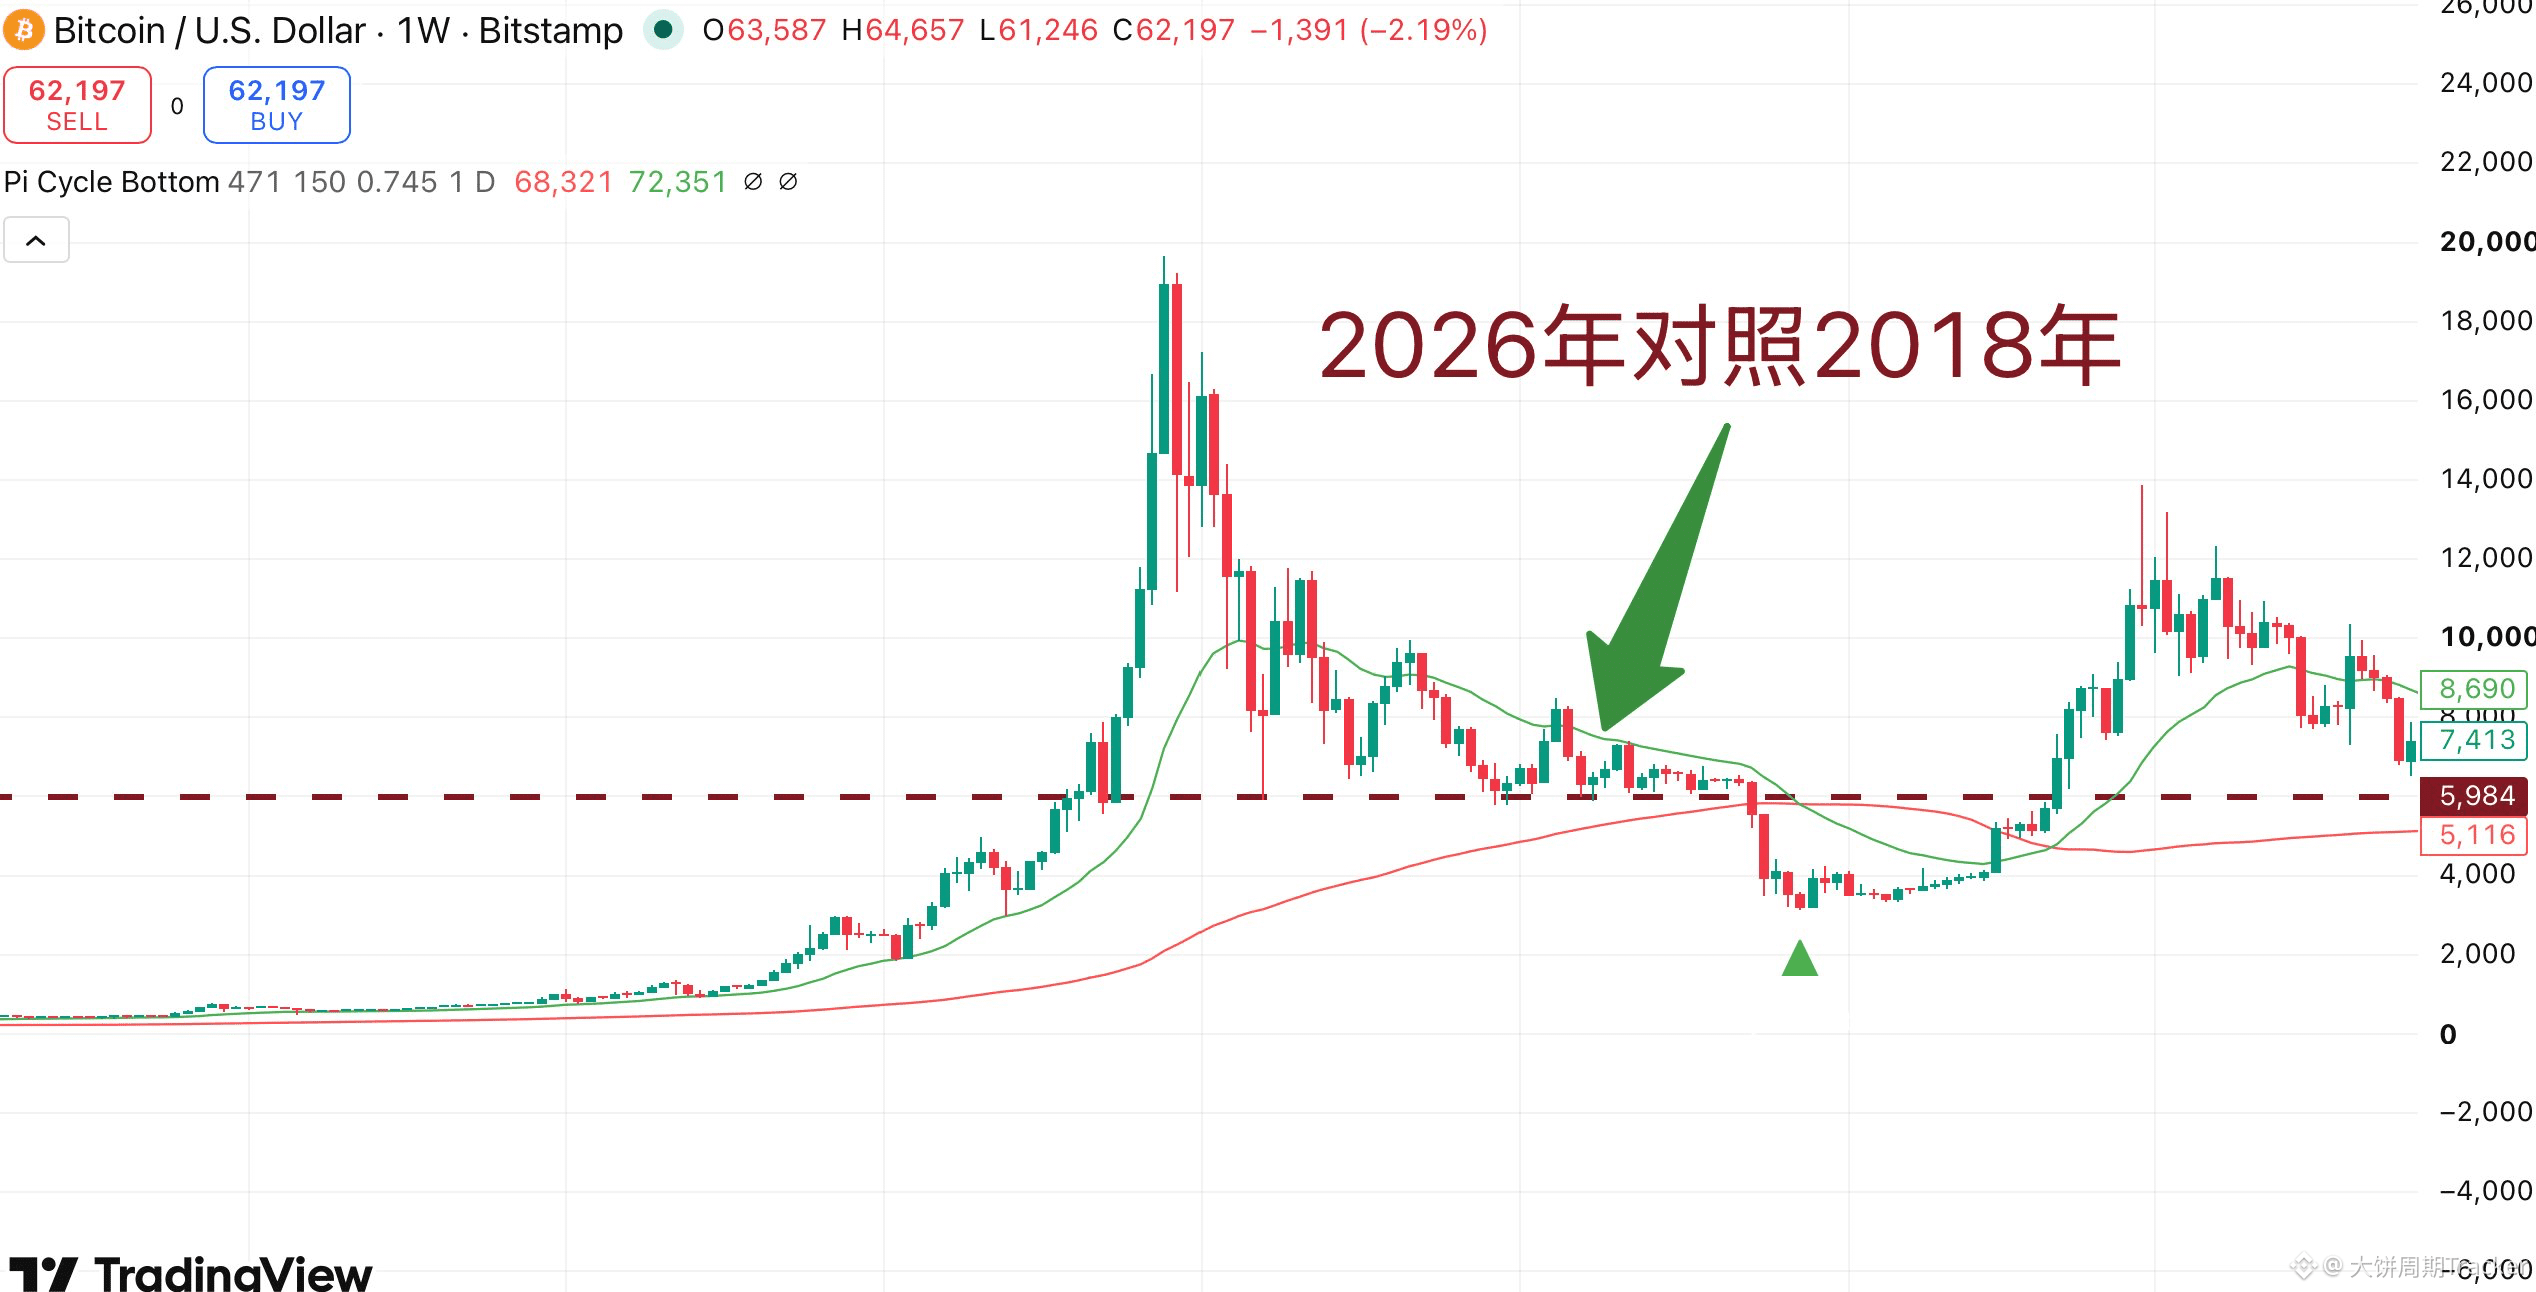
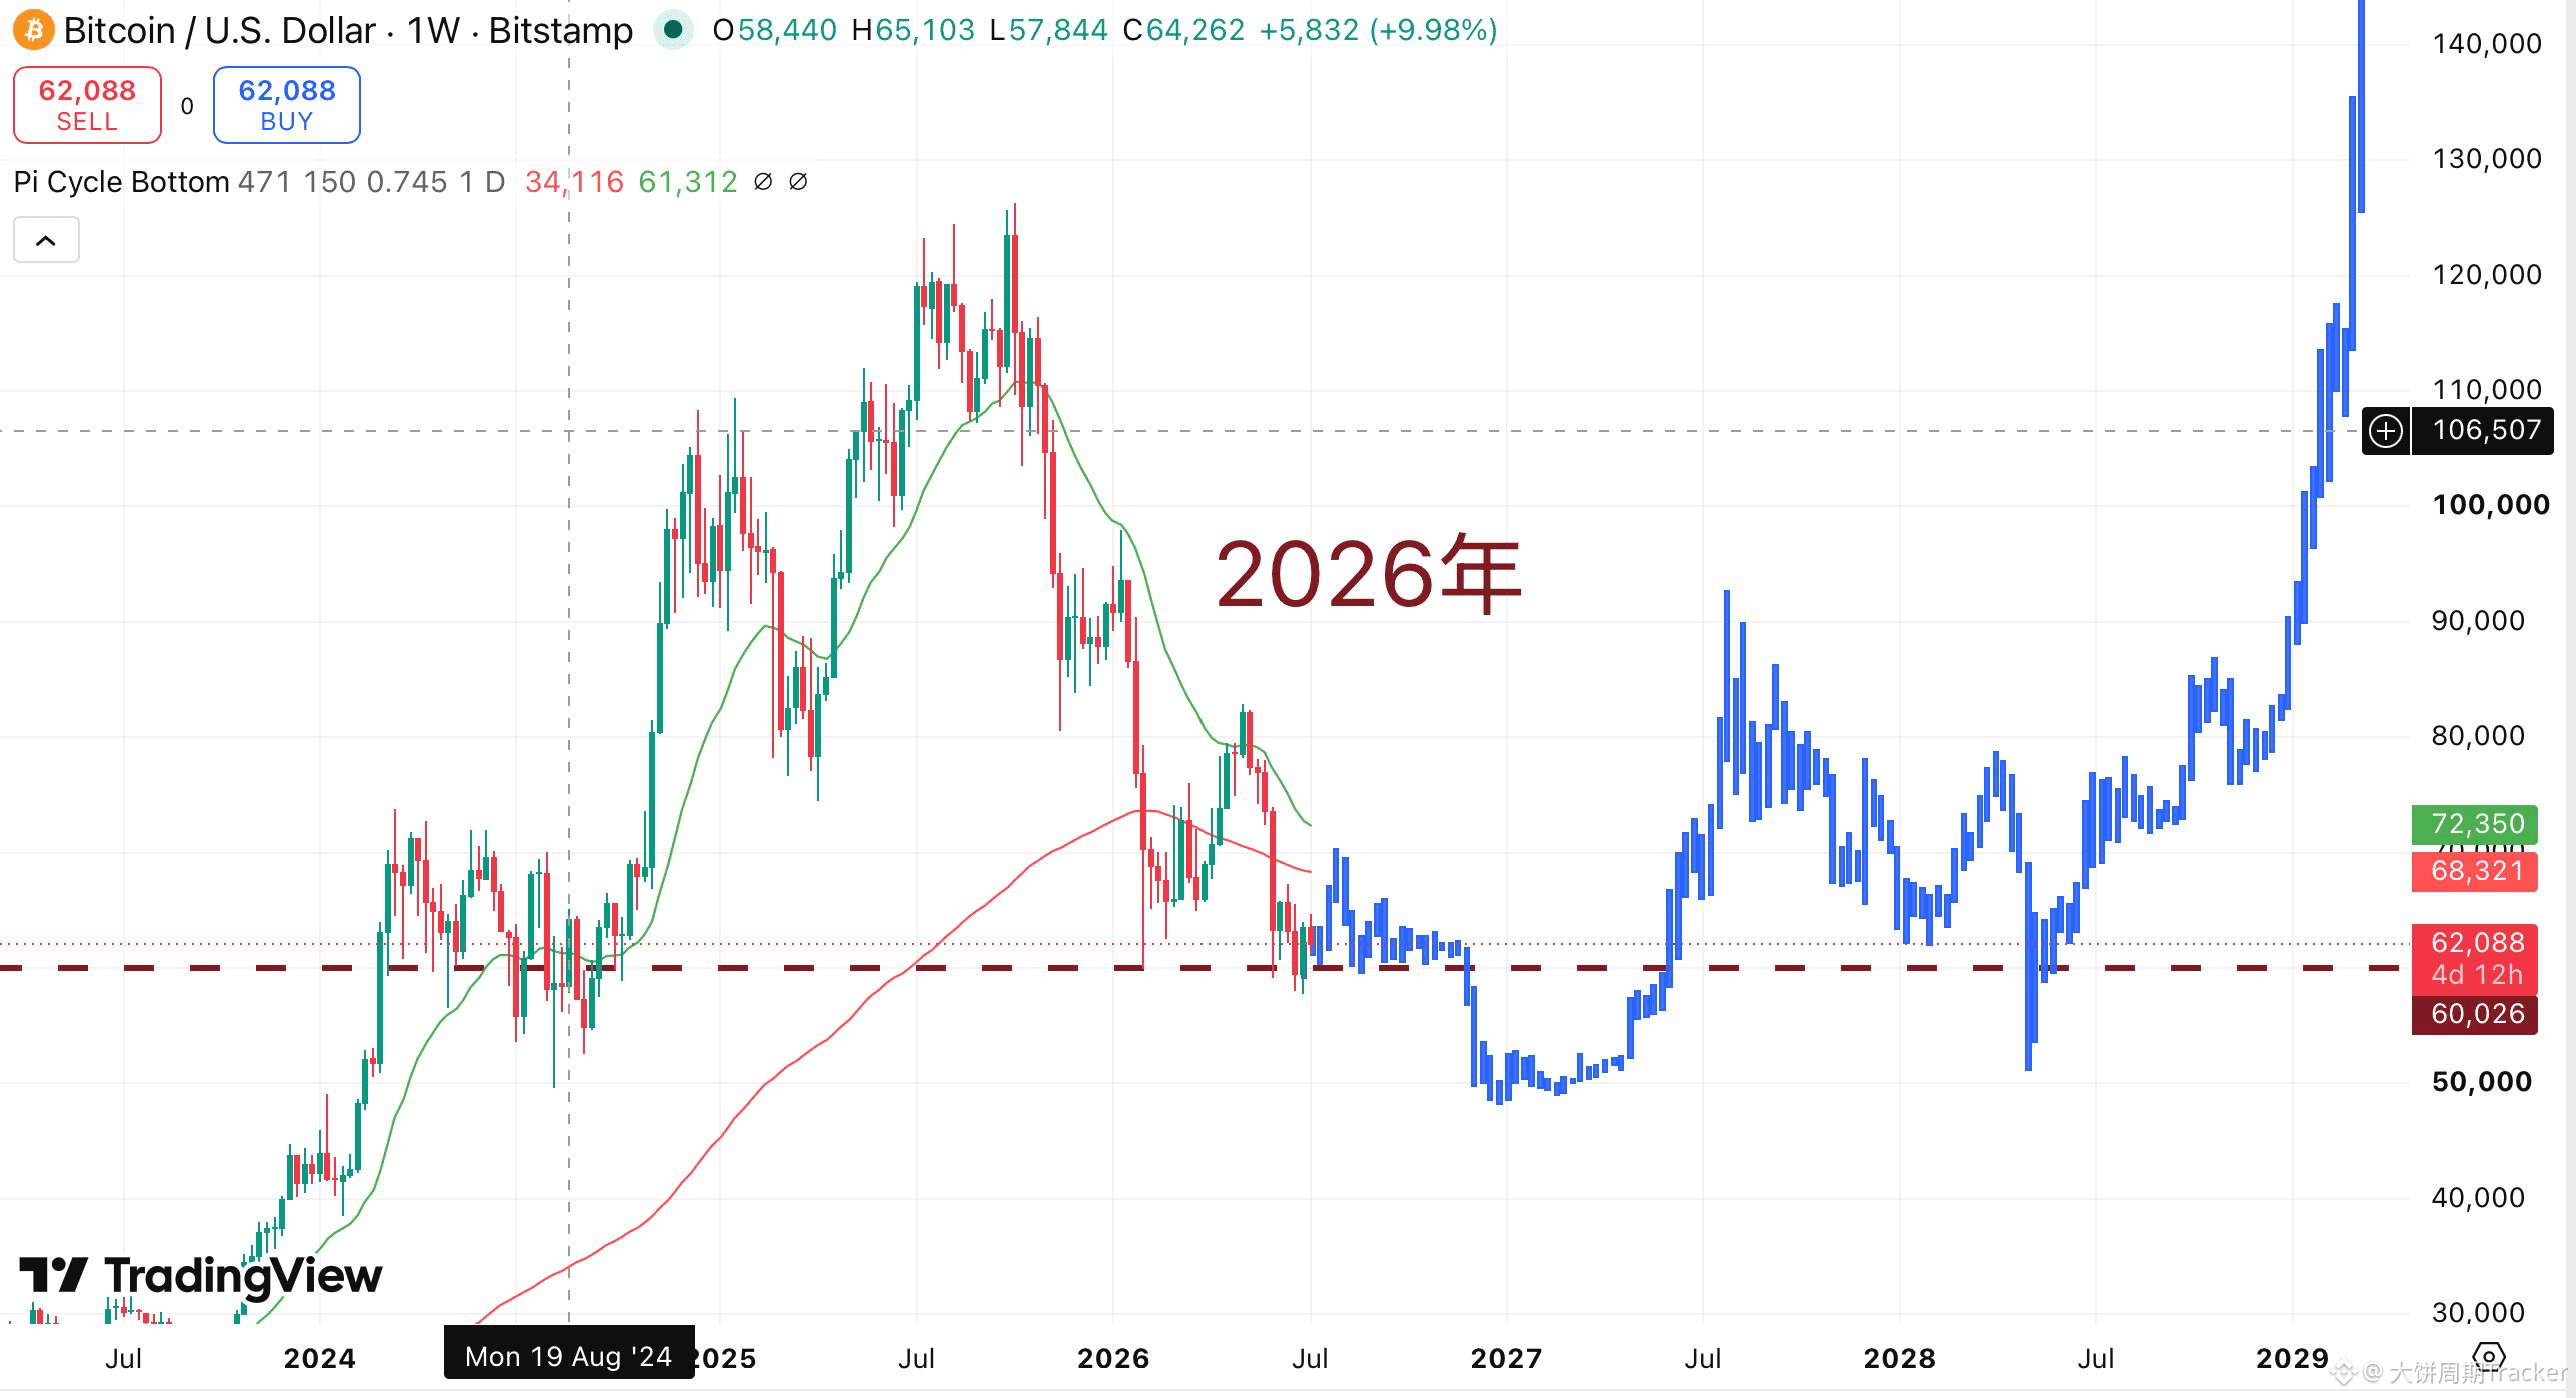
Will 2026 repeat the走势 of 2018?
History won’t simply repeat itself, but it always falls into the same rhyme scheme. The 2018 support at 6,000 looked extremely solid, yet it was mercilessly broken. Is the 60,000 support in 2026 the same? Not long ago, it was falsely broken and then reclaimed. Does that mean it will also be mercilessly broken in the second half of the year?
Will 2026 repeat the走势 of 2018?
History won’t simply repeat itself, but it always falls into the same rhyme scheme. The 2018 support at 6,000 looked extremely solid, yet it was mercilessly broken. Is the 60,000 support in 2026 the same? Not long ago, it was falsely broken and then reclaimed. Does that mean it will also be mercilessly broken in the second half of the year?
History won’t simply repeat itself, but it always falls into the same rhyme scheme. The 2018 support at 6,000 looked extremely solid, yet it was mercilessly broken. Is the 60,000 support in 2026 the same? Not long ago, it was falsely broken and then reclaimed. Does that mean it will also be mercilessly broken in the second half of the year?
2
1
505
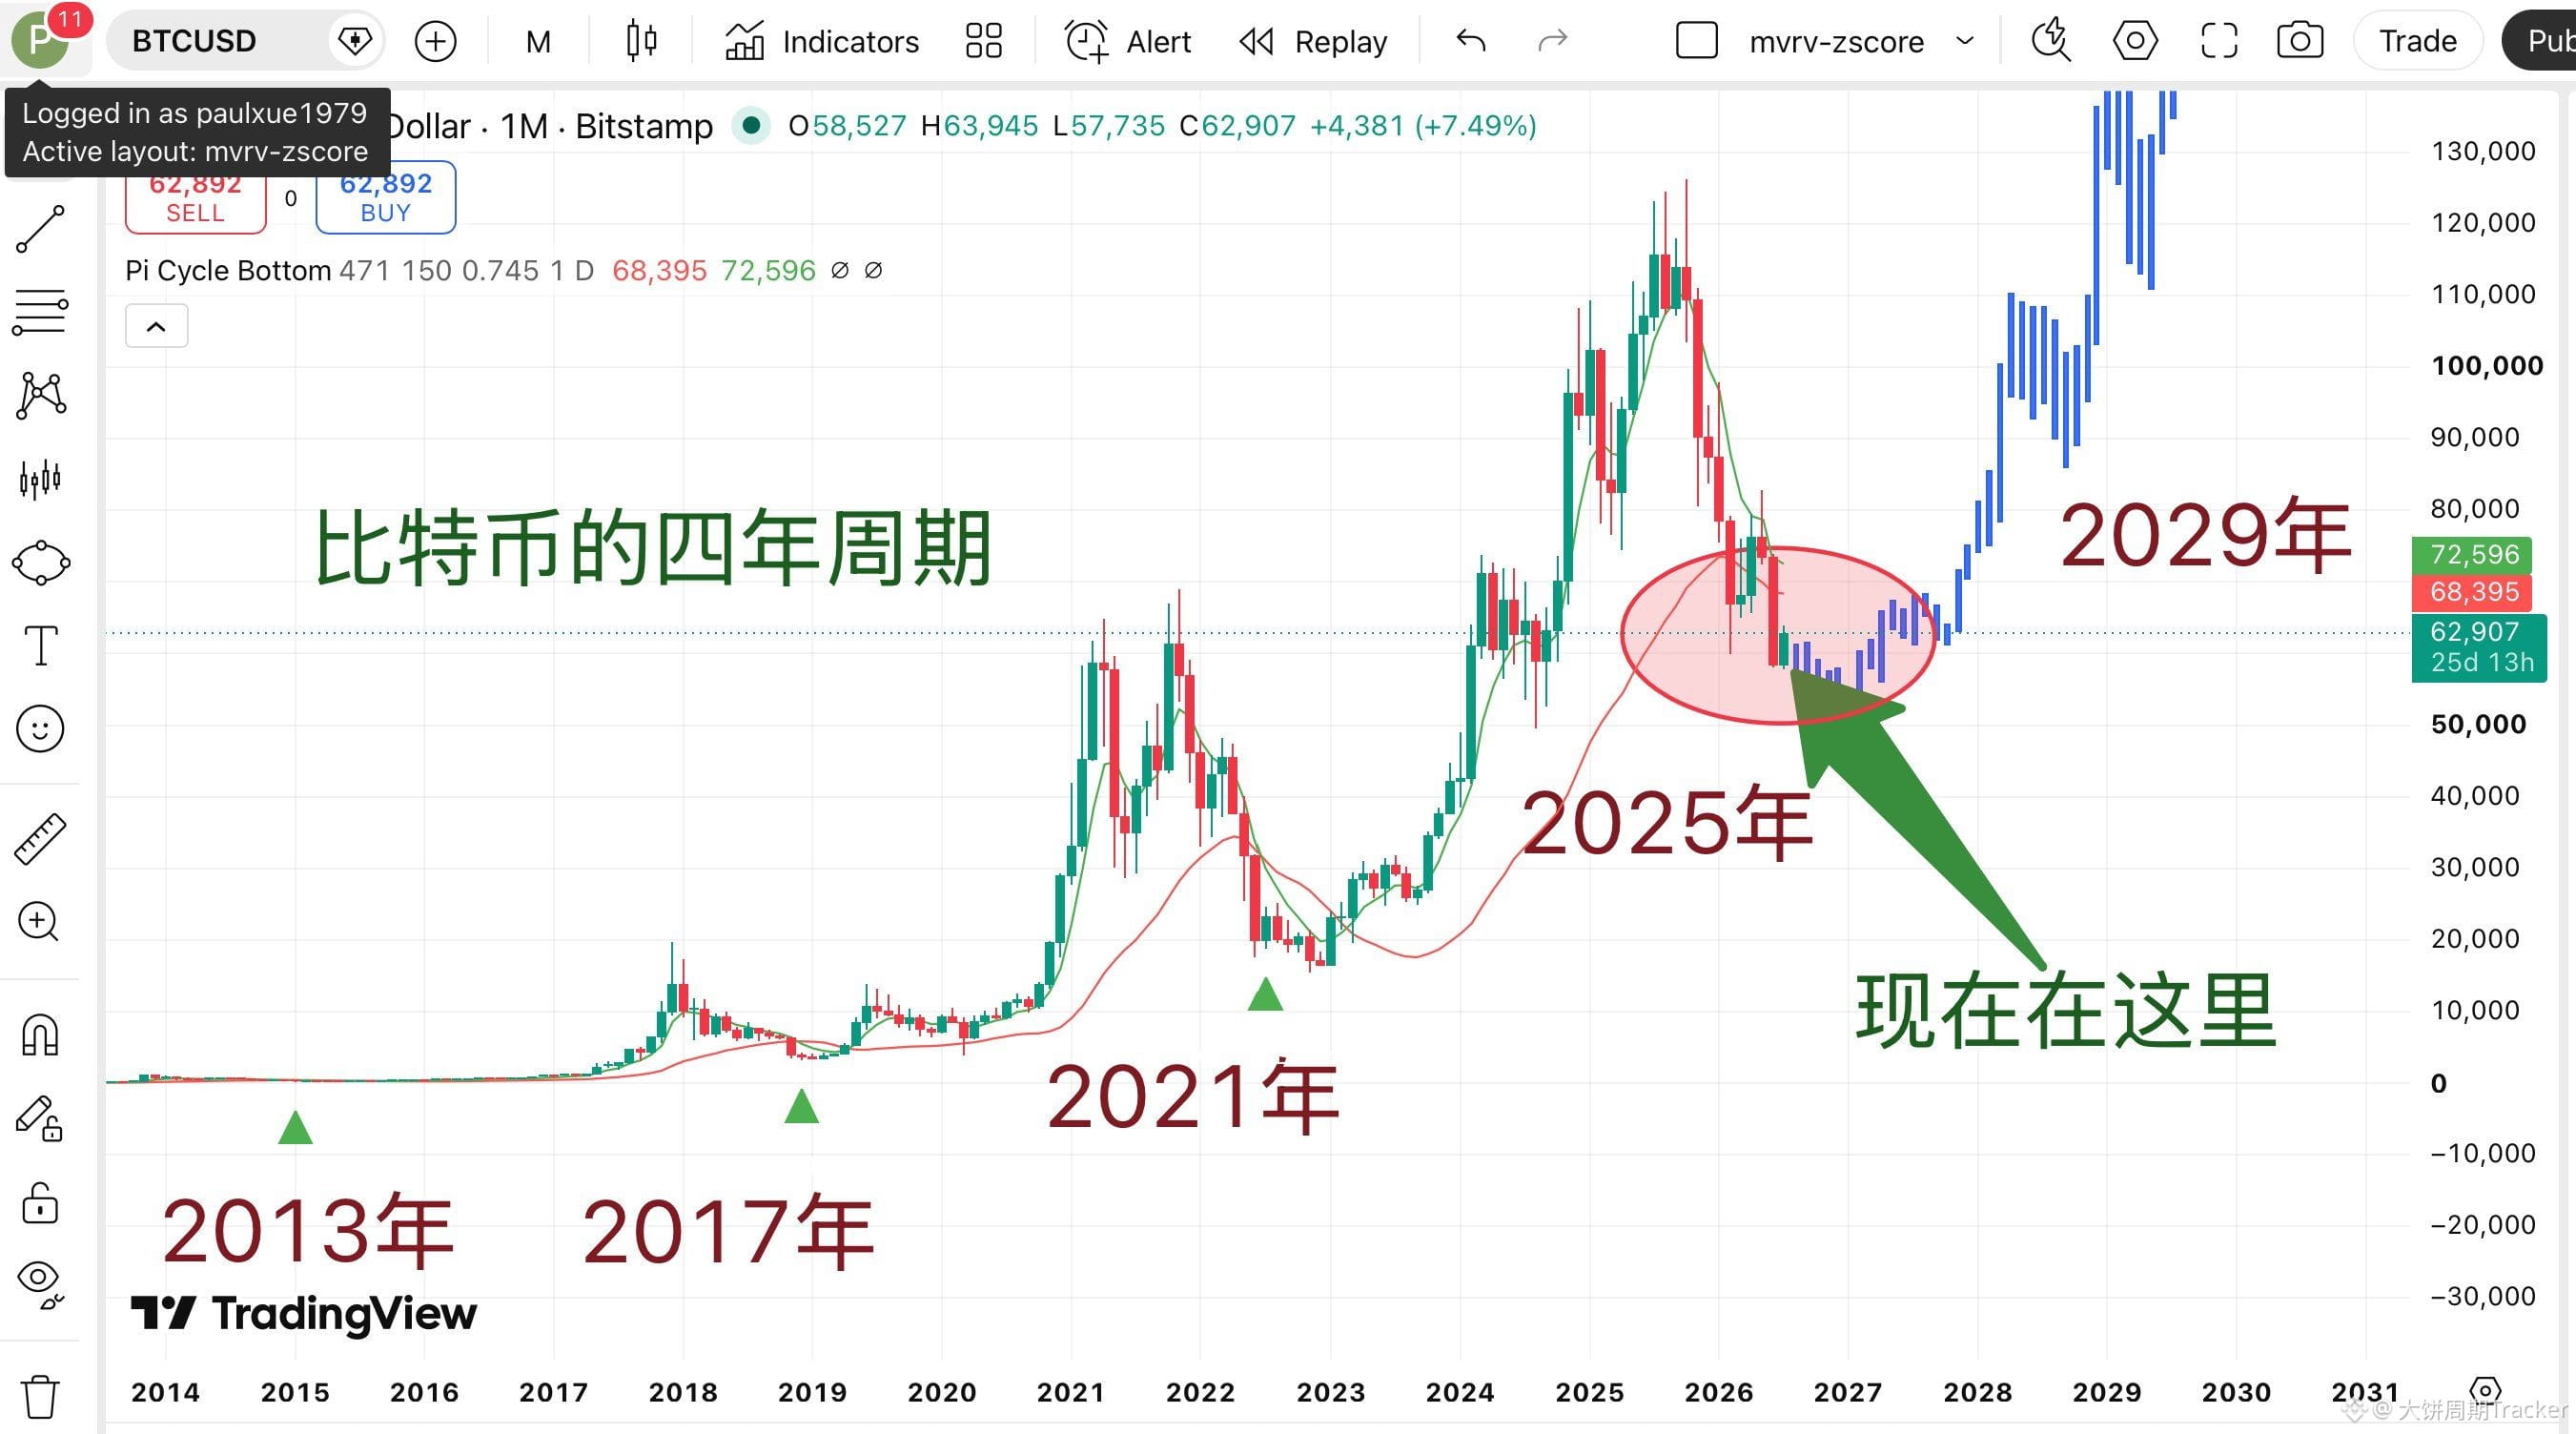
Bitcoin can be considered the only asset that can be described as “crossing the river by cutting the boat’s mark.” Although many people say the four-year cycle no longer exists (I don’t know how they came to that conclusion), until it’s broken, I’d rather choose to believe. The position we’re in right now is already very close to the bottom of this bear-market cycle—only the last drop remains. Of course, even if you start entering in batches from now until the end of the year, that’s also possible.
Bitcoin can be considered the only asset that can be described as “crossing the river by cutting the boat’s mark.” Although many people say the four-year cycle no longer exists (I don’t know how they came to that conclusion), until it’s broken, I’d rather choose to believe. The position we’re in right now is already very close to the bottom of this bear-market cycle—only the last drop remains. Of course, even if you start entering in batches from now until the end of the year, that’s also possible.
1
2
1.8k
【Bitcoin’s Rebound Script: Mid-August Might Be the Key Turning Point】
On July 1, Bitcoin found support at the midpoint of a falling channel and launched a phased rebound. But a closer look at the chart reveals hidden risks that cannot be ignored: the rebound trading volume from July 1 to 3 (excluding the weekend) is clearly weaker than the selloff volume from June 23 to 25. This typical volume–price divergence suggests that the buying interest in the market is relatively weak, leaving the bulls with insufficient follow-through.
Therefore, for this rebound, it is crucial not to be blindly optimistic. The target range of $68,000–$69,000 remains unchanged.
Judging by the trend structure, since this rebound began from the midpoint of the channel, the most likely endpoint is a retest of the upper boundary of the down channel. Notably, the intersection between the rebound target zone and the upper boundary of the channel happens to point to mid-August.
In terms of timing cycles, Bitcoin will very likely continue to trade sideways and rebound up to mid-August, and after being suppressed upon touching the channel’s upper boundary, it may once again shift back into a downtrend. In the “dead time,” manage your position sizes well and patiently wait for the ultimate convergence of time and price.
(The analysis above is for reference only and does not constitute investment advice!)
【Bitcoin’s Rebound Script: Mid-August Might Be the Key Turning Point】
On July 1, Bitcoin found support at the midpoint of a falling channel and launched a phased rebound. But a closer look at the chart reveals hidden risks that cannot be ignored: the rebound trading volume from July 1 to 3 (excluding the weekend) is clearly weaker than the selloff volume from June 23 to 25. This typical volume–price divergence suggests that the buying interest in the market is relatively weak, leaving the bulls with insufficient follow-through.
Therefore, for this rebound, it is crucial not to be blindly optimistic. The target range of $68,000–$69,000 remains unchanged.
Judging by the trend structure, since this rebound began from the midpoint of the channel, the most likely endpoint is a retest of the upper boundary of the down channel. Notably, the intersection between the rebound target zone and the upper boundary of the channel happens to point to mid-August.
In terms of timing cycles, Bitcoin will very likely continue to trade sideways and rebound up to mid-August, and after being suppressed upon touching the channel’s upper boundary, it may once again shift back into a downtrend. In the “dead time,” manage your position sizes well and patiently wait for the ultimate convergence of time and price.
(The analysis above is for reference only and does not constitute investment advice!)
On July 1, Bitcoin found support at the midpoint of a falling channel and launched a phased rebound. But a closer look at the chart reveals hidden risks that cannot be ignored: the rebound trading volume from July 1 to 3 (excluding the weekend) is clearly weaker than the selloff volume from June 23 to 25. This typical volume–price divergence suggests that the buying interest in the market is relatively weak, leaving the bulls with insufficient follow-through.
Therefore, for this rebound, it is crucial not to be blindly optimistic. The target range of $68,000–$69,000 remains unchanged.
Judging by the trend structure, since this rebound began from the midpoint of the channel, the most likely endpoint is a retest of the upper boundary of the down channel. Notably, the intersection between the rebound target zone and the upper boundary of the channel happens to point to mid-August.
In terms of timing cycles, Bitcoin will very likely continue to trade sideways and rebound up to mid-August, and after being suppressed upon touching the channel’s upper boundary, it may once again shift back into a downtrend. In the “dead time,” manage your position sizes well and patiently wait for the ultimate convergence of time and price.
(The analysis above is for reference only and does not constitute investment advice!)
Paul Xue BTC 链上数据研究
·
--
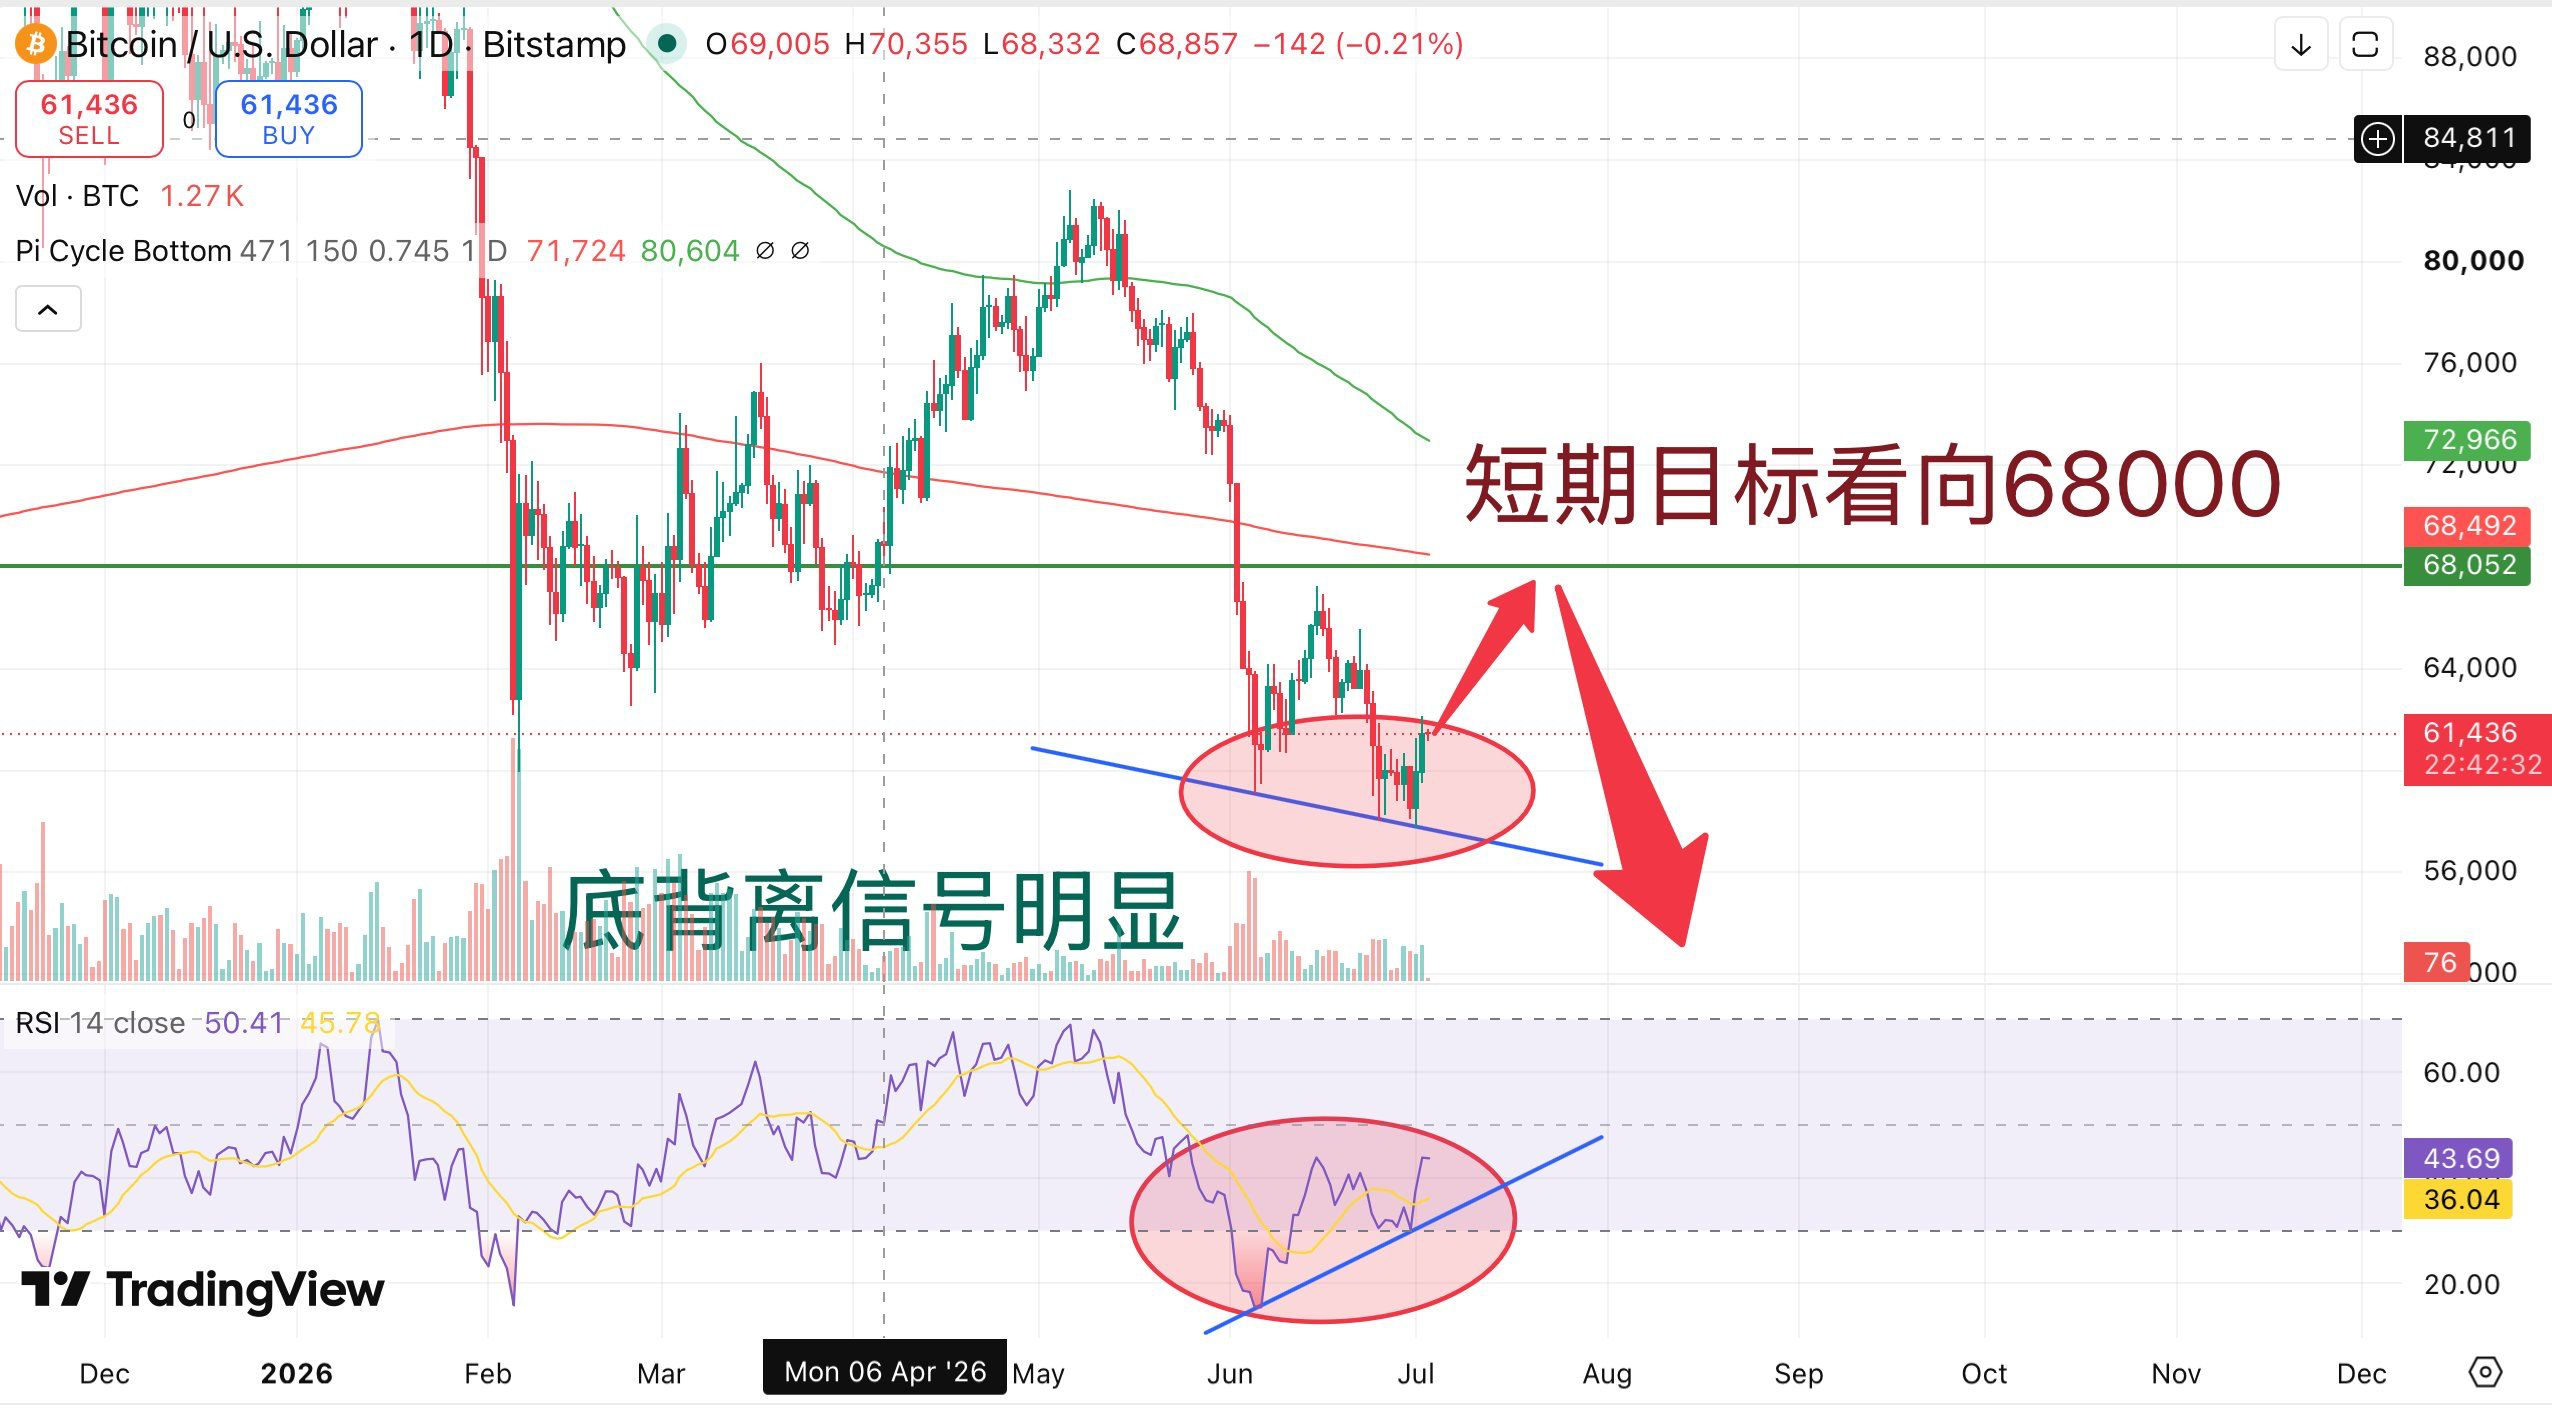
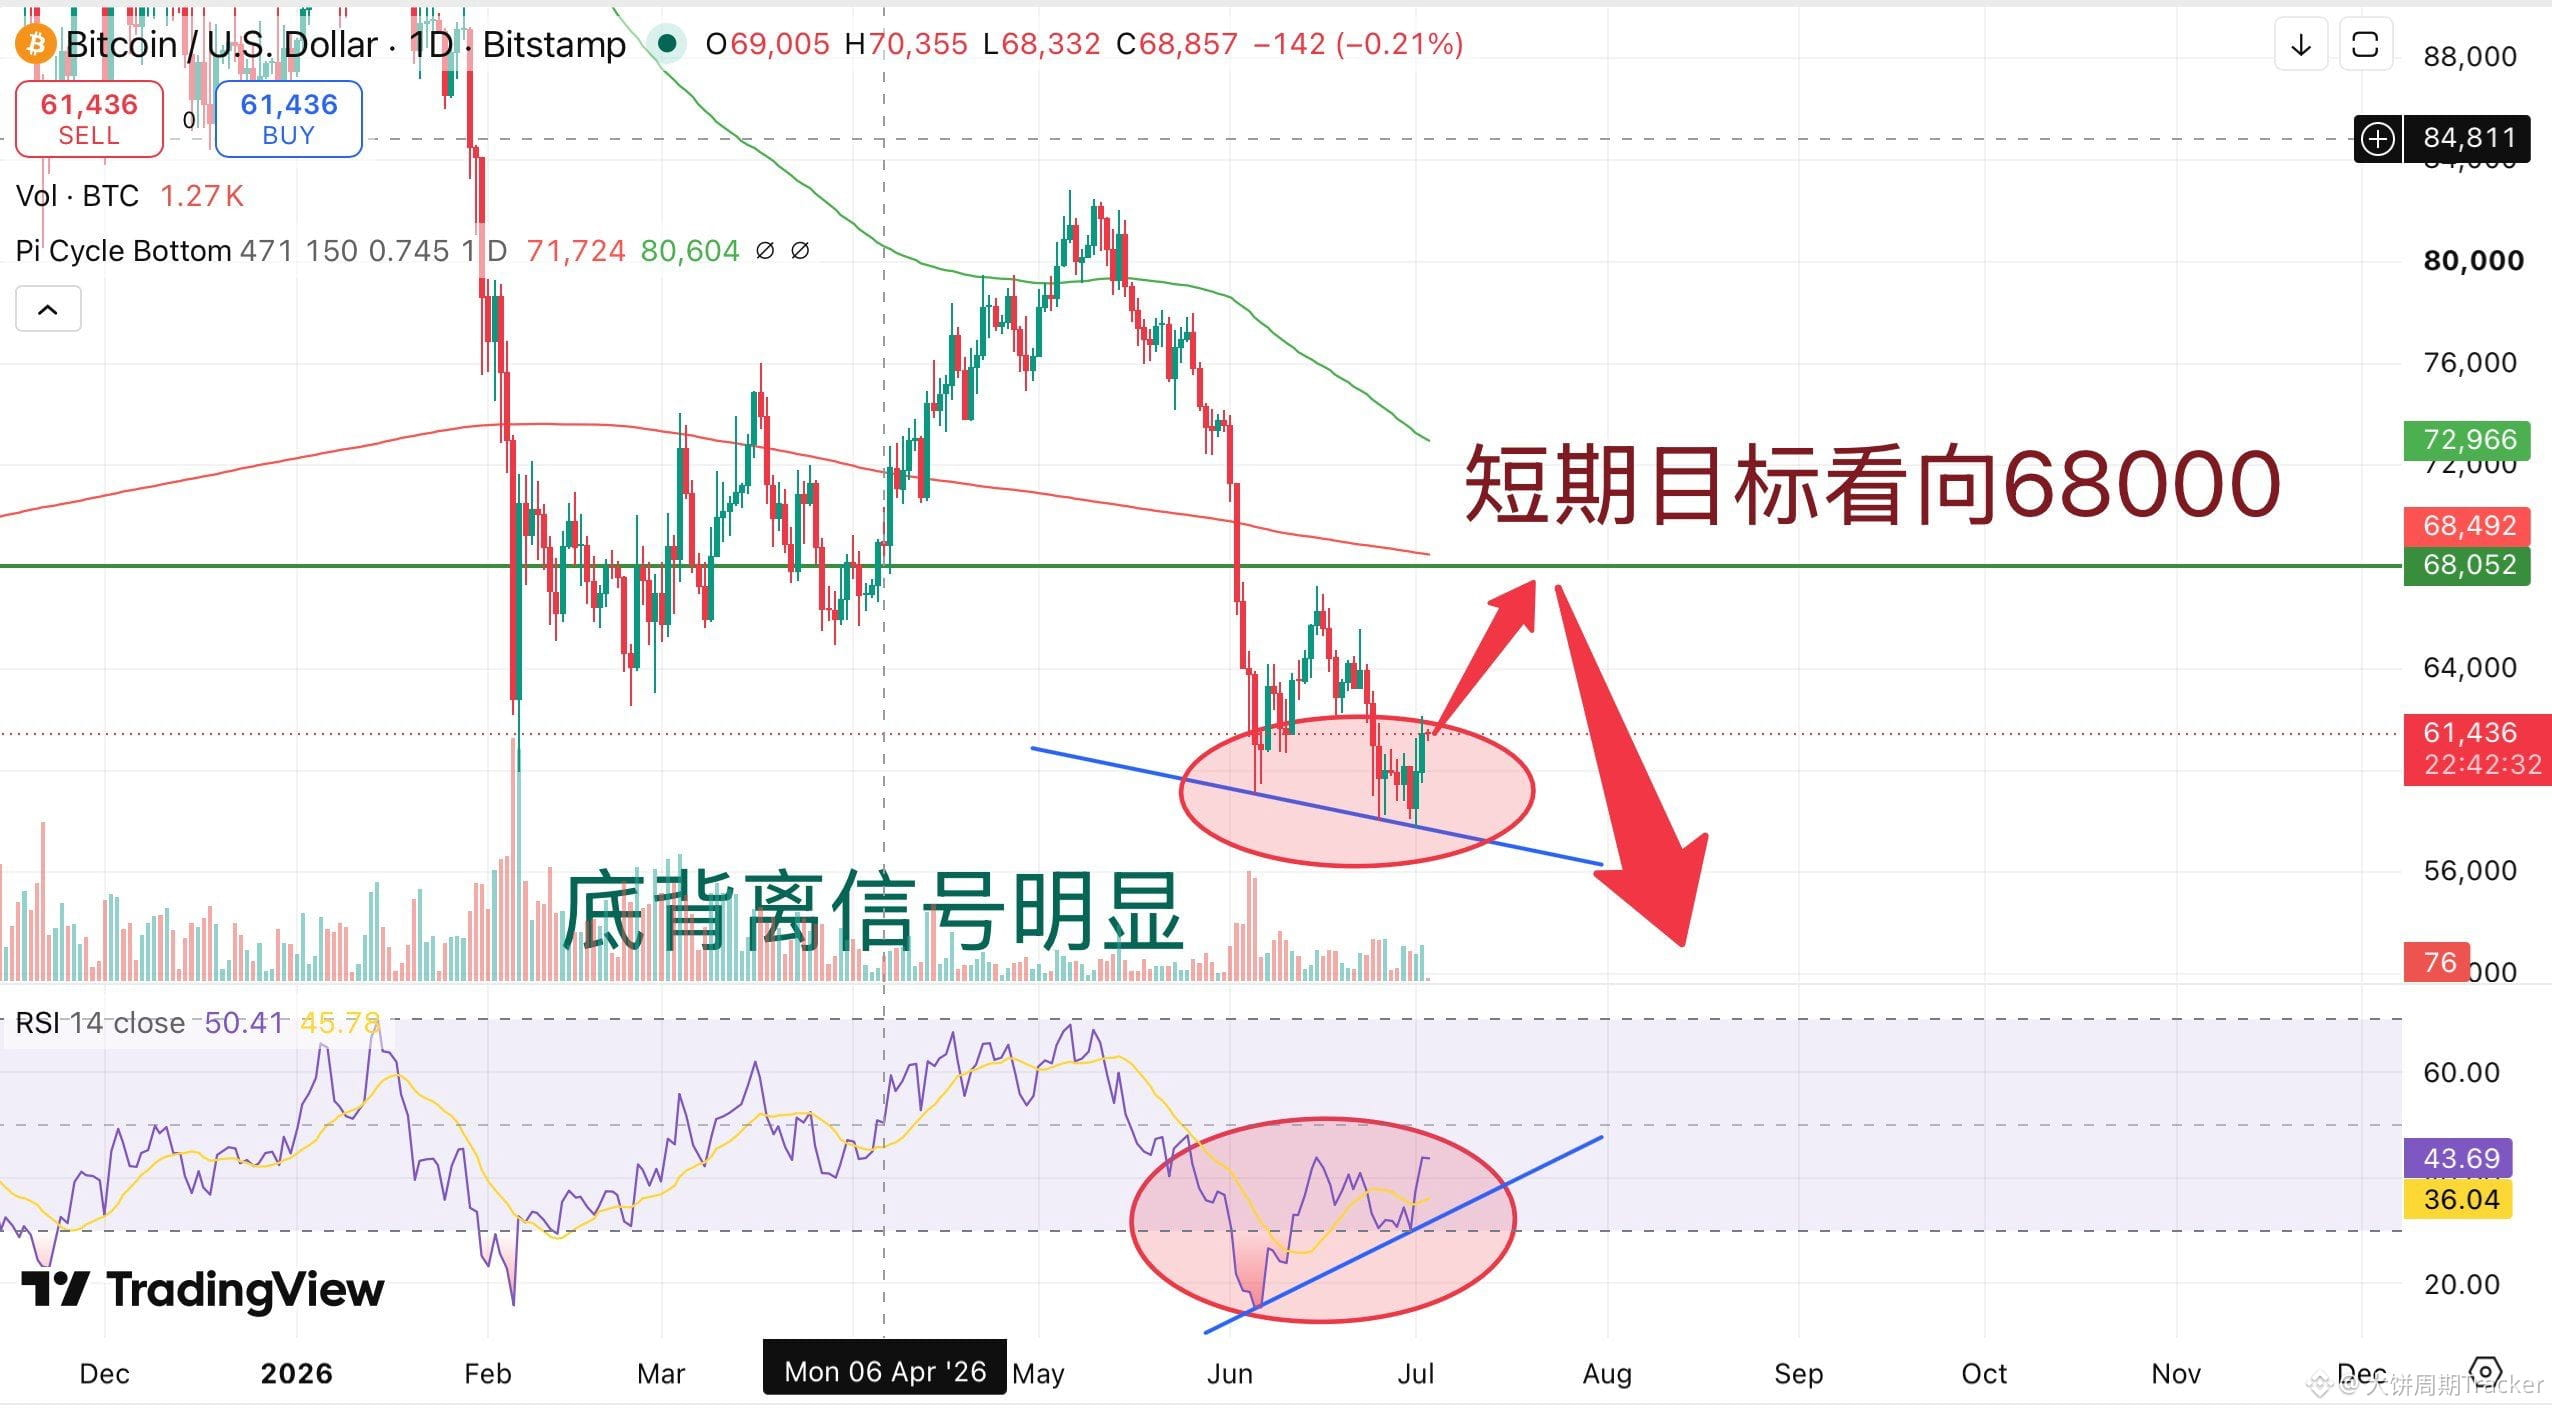
BullishBitcoin on the daily chart also shows a very clear bearish divergence. For the short-term target, it looks toward the area around 68,000—this is a high-probability short-term opportunity that can be seized. However, however, however—this is still a bearish market phase. After that, there will be another big drop, driving down toward the final bottom around 50,000, or even lower! $BTC
1
163
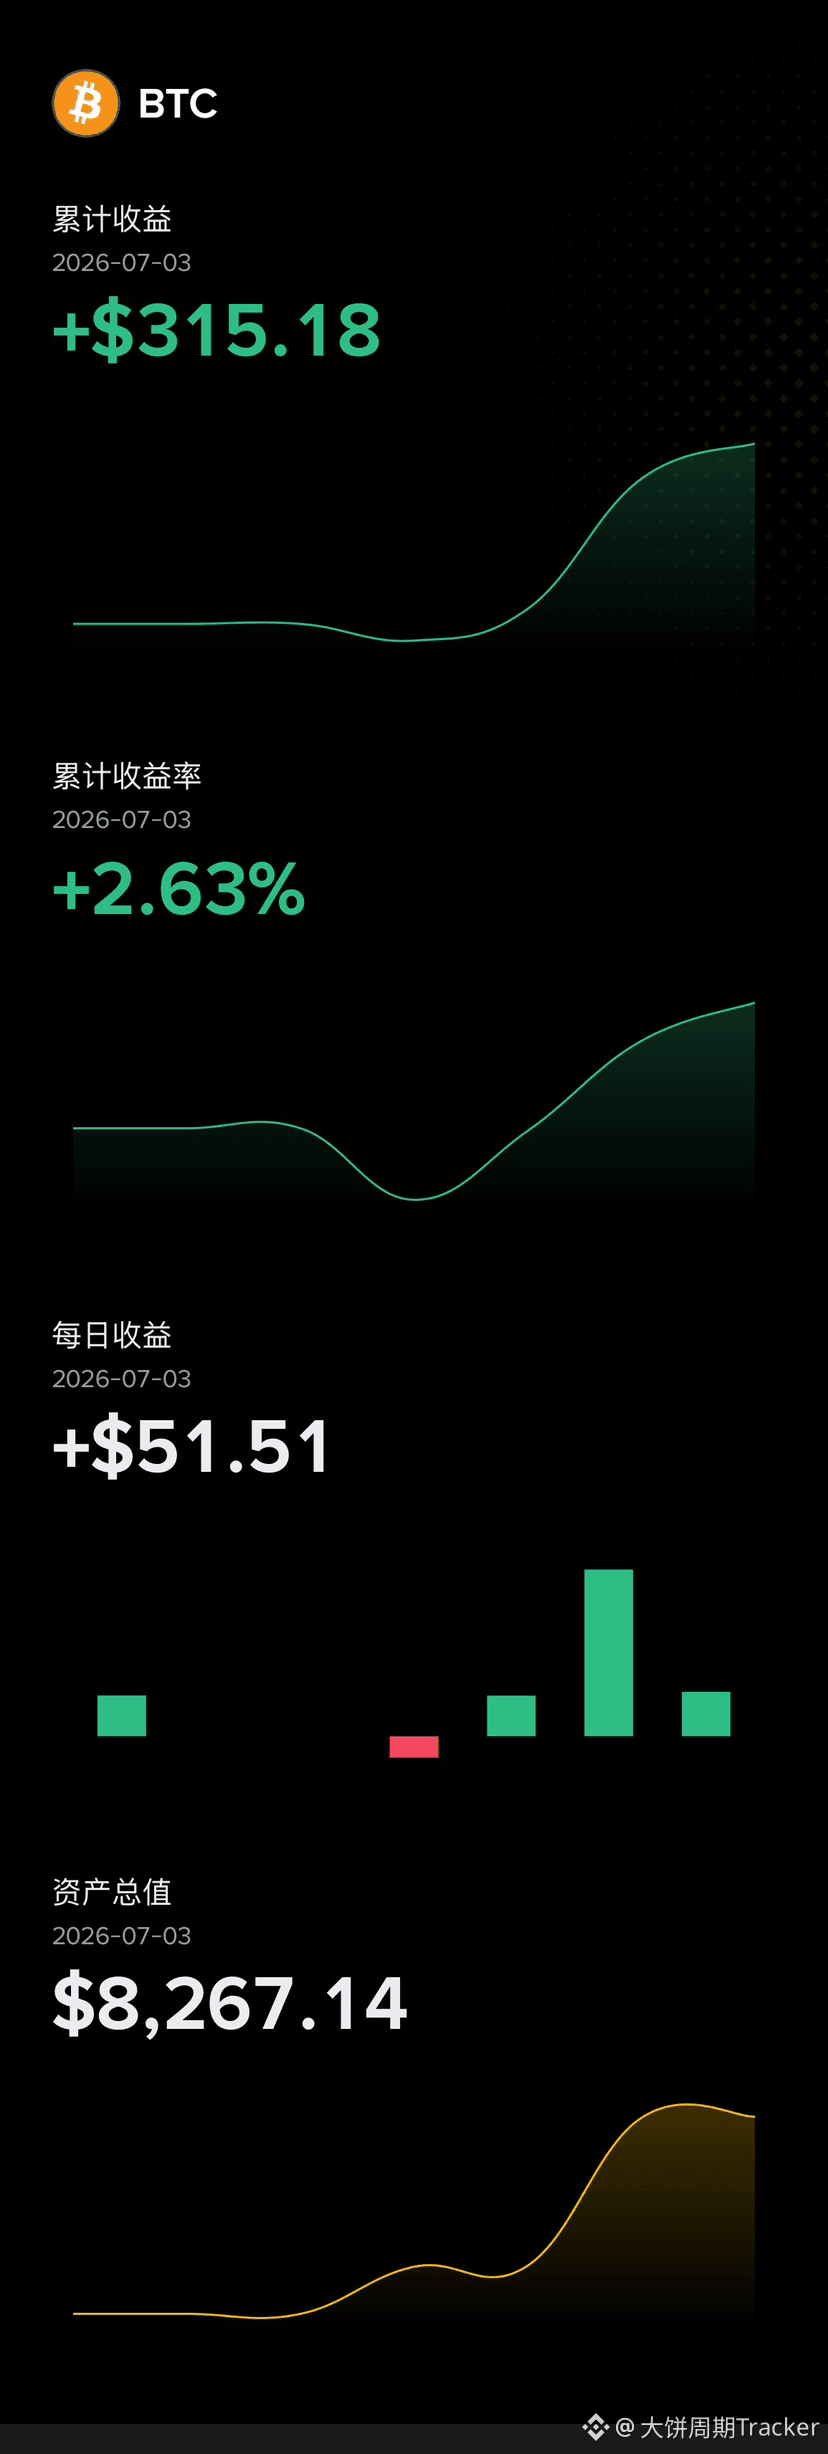
Having formally entered the coin world, I bought Bitcoin with a small position two days ago. For now, I’m only dealing with Bitcoin spot and am looking to trade a short-term swing 😎
Having formally entered the coin world, I bought Bitcoin with a small position two days ago. For now, I’m only dealing with Bitcoin spot and am looking to trade a short-term swing 😎
2
311
·
--
Bullish
Bitcoin on the daily chart also shows a very clear bearish divergence. For the short-term target, it looks toward the area around 68,000—this is a high-probability short-term opportunity that can be seized. However, however, however—this is still a bearish market phase. After that, there will be another big drop, driving down toward the final bottom around 50,000, or even lower! $BTC
Bitcoin on the daily chart also shows a very clear bearish divergence. For the short-term target, it looks toward the area around 68,000—this is a high-probability short-term opportunity that can be seized. However, however, however—this is still a bearish market phase. After that, there will be another big drop, driving down toward the final bottom around 50,000, or even lower! $BTC
Paul Xue BTC 链上数据研究
·
--
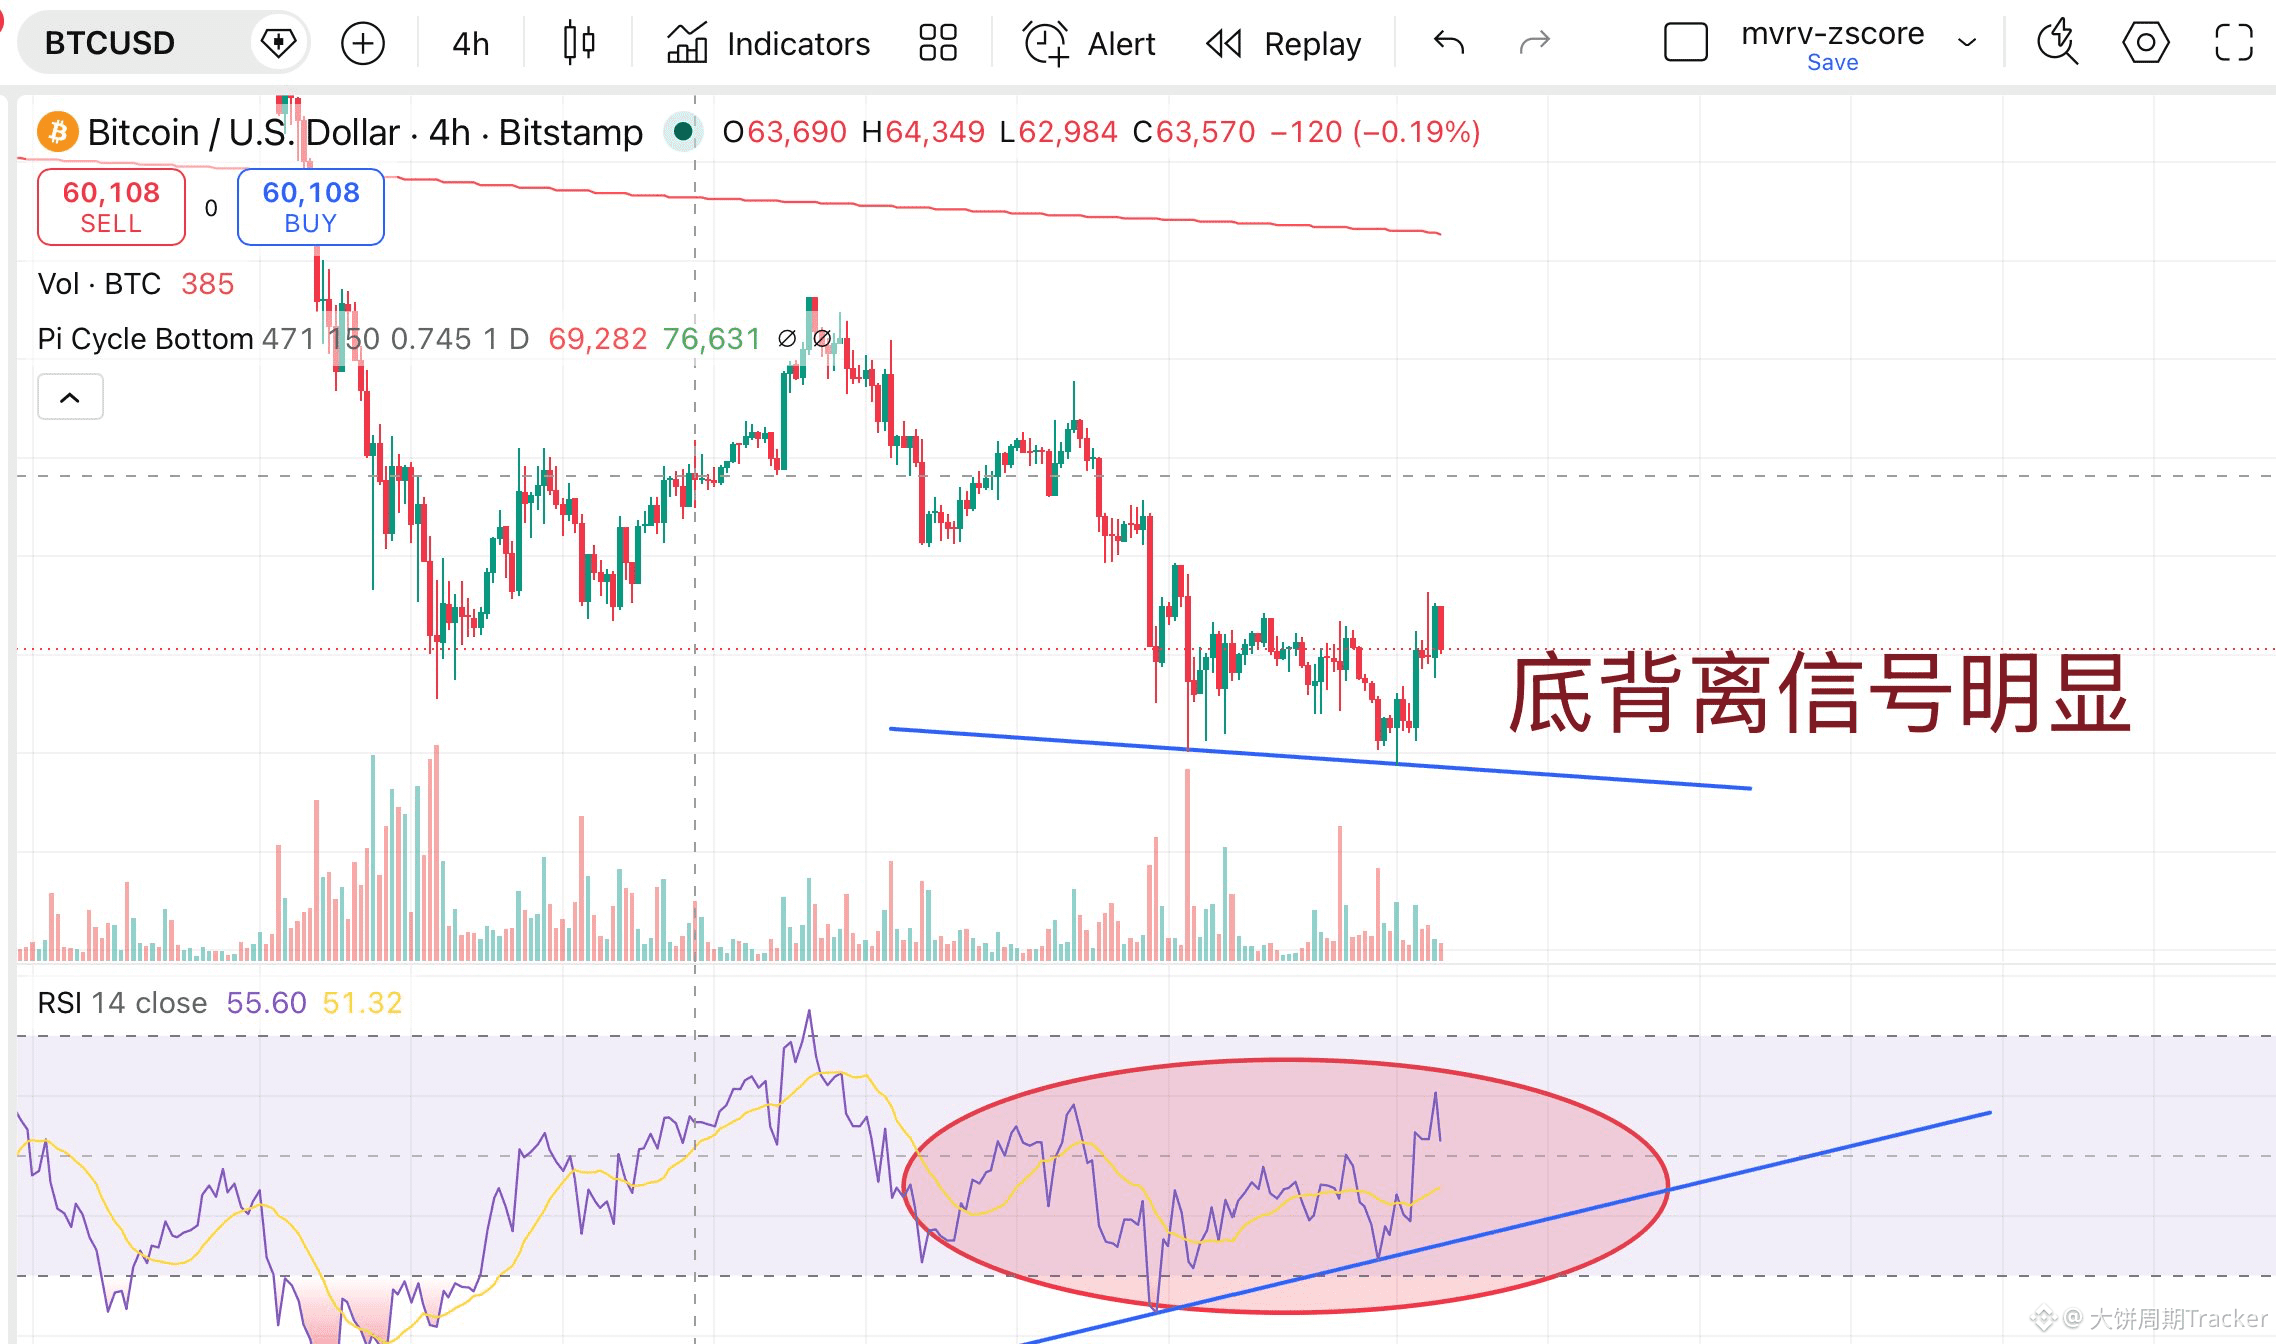
With Bitcoin’s strong rebound last night, the bottom divergence signal in this wave is especially clear. It’s okay to take a short-term long in this moment. When you see it around 68,000, multiple technical experts have supported this view. Buy some BTC spot without leverage!
Not investment advice—please consider it yourself!
Not investment advice—please consider it yourself!
1
1
329
With Bitcoin’s strong rebound last night, the bottom divergence signal in this wave is especially clear. It’s okay to take a short-term long in this moment. When you see it around 68,000, multiple technical experts have supported this view. Buy some BTC spot without leverage!
Not investment advice—please consider it yourself!
With Bitcoin’s strong rebound last night, the bottom divergence signal in this wave is especially clear. It’s okay to take a short-term long in this moment. When you see it around 68,000, multiple technical experts have supported this view. Buy some BTC spot without leverage!
Not investment advice—please consider it yourself!
Not investment advice—please consider it yourself!
1
2
156
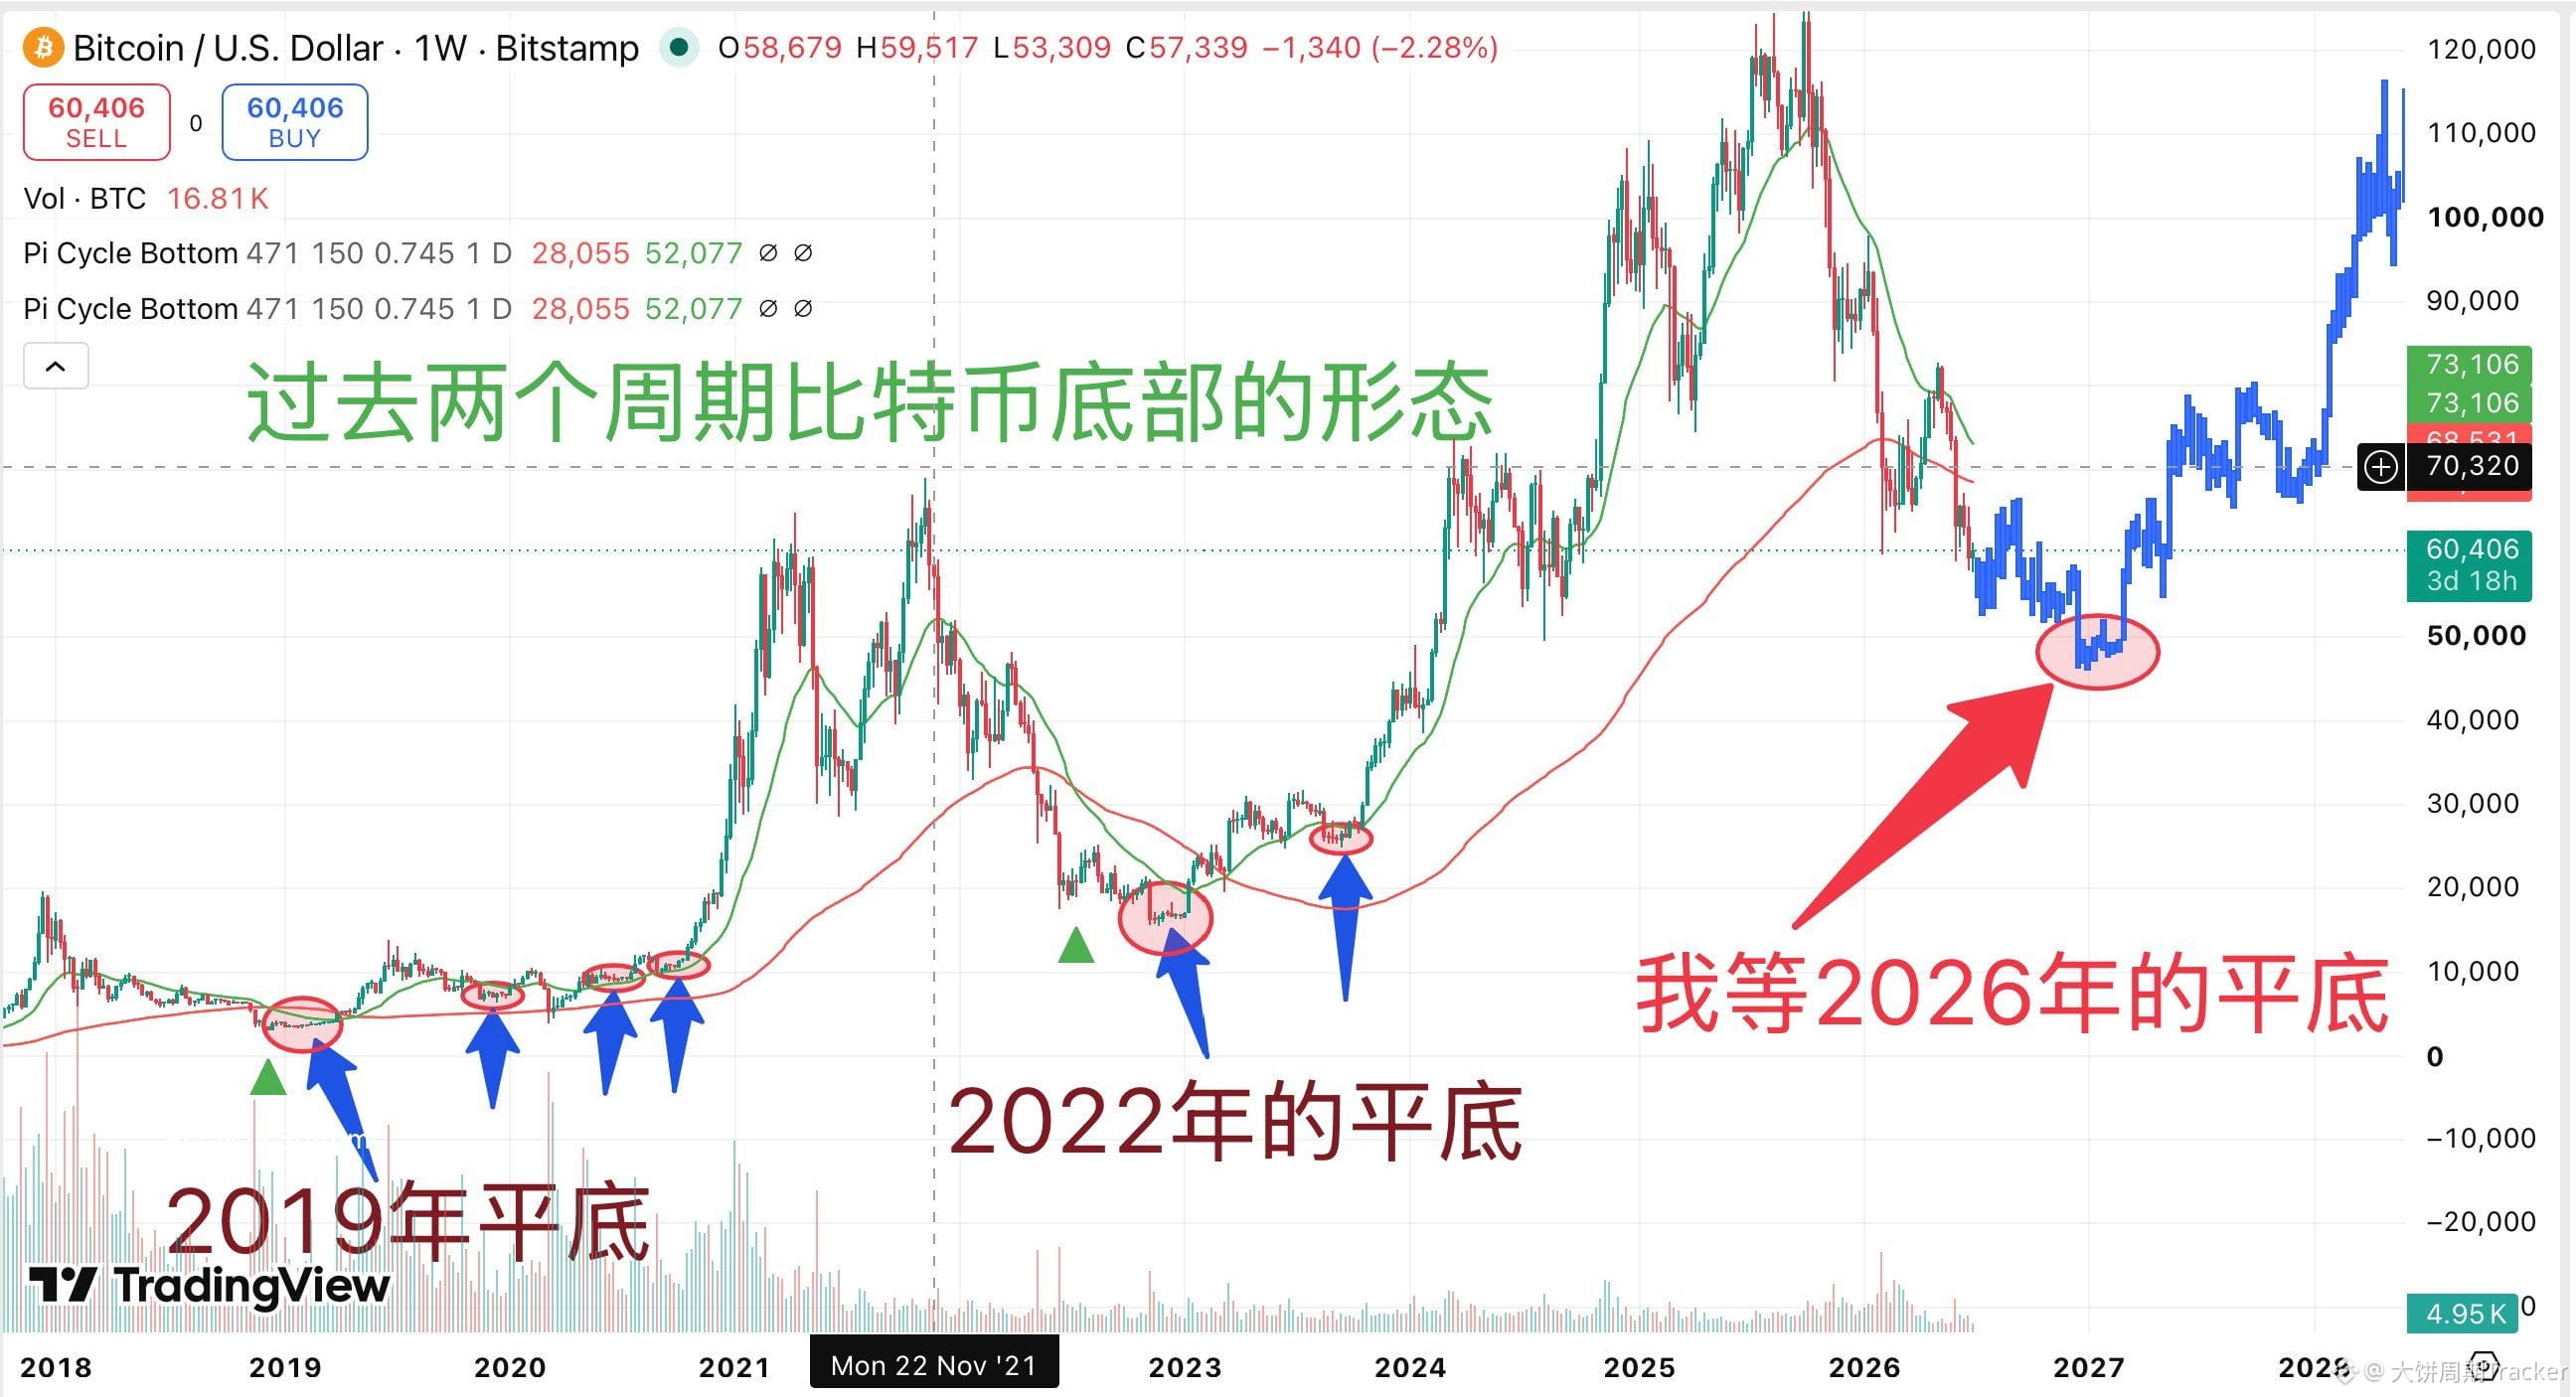
Some people like watching others draw candlestick charts, and I’ll doodle too 😀
I will wait for the bearish market cycle bottom of BTC in 2026. No one can accurately predict the exact time of the bottom, but once the bottom’s shape shows up, don’t hesitate.
Some people like watching others draw candlestick charts, and I’ll doodle too 😀
I will wait for the bearish market cycle bottom of BTC in 2026. No one can accurately predict the exact time of the bottom, but once the bottom’s shape shows up, don’t hesitate.
I will wait for the bearish market cycle bottom of BTC in 2026. No one can accurately predict the exact time of the bottom, but once the bottom’s shape shows up, don’t hesitate.
Paul Xue BTC 链上数据研究
·
--
Let’s talk about why Bitcoin forms a “flat” bottom:
Judging from the historical price action across the past two cycles, Bitcoin’s bottoming process often requires a continuous 2–3 months of a “flat base” or even a “grinding down” pattern. A sharp, decisive V-shaped reversal like what you often see in the U.S. stock market is quite rare. Behind this, it’s essentially the inevitable interplay between technical indicator mean-reversion and human weakness.
From the indicator perspective, what’s shown in the chart is the Pi Cycle Bottom (the Pi-cycle bottom indicator) along with long-term moving averages. After the market goes through a major sell-off and price breaks below—or endlessly approaches—the green and red long-term moving average lines, it indicates that the market has entered an absolute value zone of extreme oversold conditions. At this point, on-chain indicators such as the MVRV Z-Score also typically fall to near ice-cold levels. This “flatness” is, in reality, an “energy accumulation period” where long and short forces repeatedly tug-of-war around historical absolute support levels, exchanging hands over and over, until supply and demand for positions are finally cleared.
And what truly makes the bottom so flat and so prolonged are human weaknesses:
1. Fear and despair (refusing to trade from the left side): Before the bottom arrives, the massive drawdown (for example, late 2018 and late 2022) shatters all market confidence. At this time, “extreme fear” in human nature takes the upper hand. Retail traders and even institutions are in a state of “once bitten, twice shy.” Even if prices are at extreme lows, people still don’t dare to buy because they fear there could be even newer lows—so the bottom lacks the explosive buying power from retail.
2. Eroding patience (position washing): Big players and main funds understand human nature well. They won’t choose a V-shaped reversal to “carry retail traders on their shoulders.” Instead, they use months of sideways consolidation (a flat base), exploiting the human tendency toward “lack of patience” and “eagerness for quick results,” to flush out the last shred of retail conviction that survived the initial crash but gets worn down during the prolonged sideways period. This is what people call “time trading for space.”
In short, only when trading volume becomes extremely thin, speculators have fully exited, and positions have been transferred and settled from retail traders into long-term believers (Long Time HODLers), can this “flat base” be considered truly constructed. The pullbacks at the beginning of a bull market work the same way—rebuilding consensus through sideways action. Once you understand the “flat bottom,” you understand the market’s deepest sense of reverence and the struggle between players.
Judging from the historical price action across the past two cycles, Bitcoin’s bottoming process often requires a continuous 2–3 months of a “flat base” or even a “grinding down” pattern. A sharp, decisive V-shaped reversal like what you often see in the U.S. stock market is quite rare. Behind this, it’s essentially the inevitable interplay between technical indicator mean-reversion and human weakness.
From the indicator perspective, what’s shown in the chart is the Pi Cycle Bottom (the Pi-cycle bottom indicator) along with long-term moving averages. After the market goes through a major sell-off and price breaks below—or endlessly approaches—the green and red long-term moving average lines, it indicates that the market has entered an absolute value zone of extreme oversold conditions. At this point, on-chain indicators such as the MVRV Z-Score also typically fall to near ice-cold levels. This “flatness” is, in reality, an “energy accumulation period” where long and short forces repeatedly tug-of-war around historical absolute support levels, exchanging hands over and over, until supply and demand for positions are finally cleared.
And what truly makes the bottom so flat and so prolonged are human weaknesses:
1. Fear and despair (refusing to trade from the left side): Before the bottom arrives, the massive drawdown (for example, late 2018 and late 2022) shatters all market confidence. At this time, “extreme fear” in human nature takes the upper hand. Retail traders and even institutions are in a state of “once bitten, twice shy.” Even if prices are at extreme lows, people still don’t dare to buy because they fear there could be even newer lows—so the bottom lacks the explosive buying power from retail.
2. Eroding patience (position washing): Big players and main funds understand human nature well. They won’t choose a V-shaped reversal to “carry retail traders on their shoulders.” Instead, they use months of sideways consolidation (a flat base), exploiting the human tendency toward “lack of patience” and “eagerness for quick results,” to flush out the last shred of retail conviction that survived the initial crash but gets worn down during the prolonged sideways period. This is what people call “time trading for space.”
In short, only when trading volume becomes extremely thin, speculators have fully exited, and positions have been transferred and settled from retail traders into long-term believers (Long Time HODLers), can this “flat base” be considered truly constructed. The pullbacks at the beginning of a bull market work the same way—rebuilding consensus through sideways action. Once you understand the “flat bottom,” you understand the market’s deepest sense of reverence and the struggle between players.
2
96
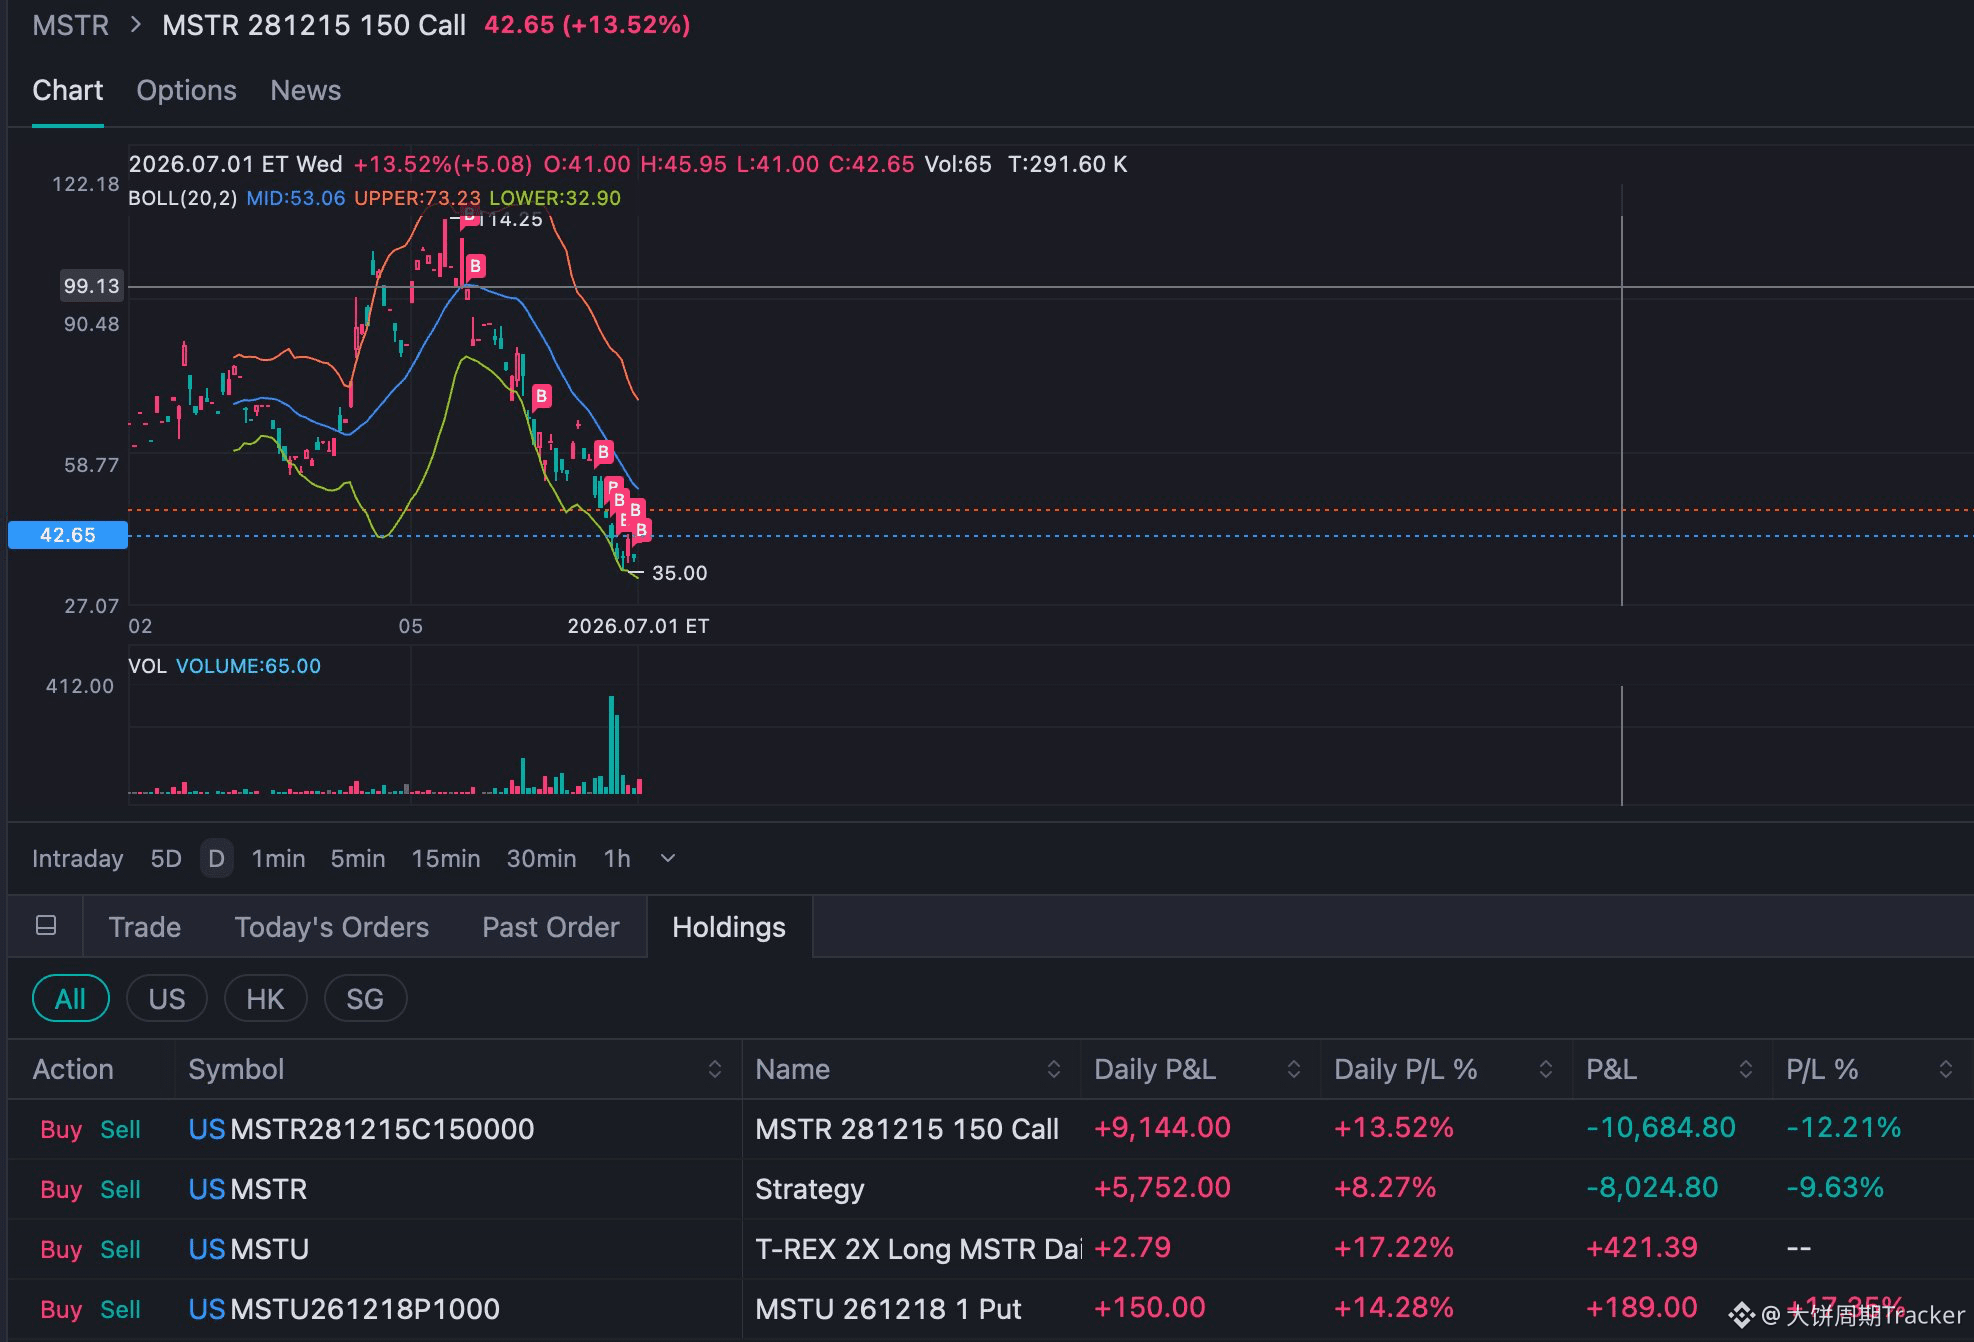
The volatility of the big biscuit stock is too high—it really requires a big heart!
Because our judgment based on MSTR indicates it will bottom before BTC, that's why we built the position early. Yesterday we had a strong rebound, which reduced the loss by more than 40%. If another rebound like that comes, we can break even 😅
The volatility of the big biscuit stock is too high—it really requires a big heart!
Because our judgment based on MSTR indicates it will bottom before BTC, that's why we built the position early. Yesterday we had a strong rebound, which reduced the loss by more than 40%. If another rebound like that comes, we can break even 😅
Because our judgment based on MSTR indicates it will bottom before BTC, that's why we built the position early. Yesterday we had a strong rebound, which reduced the loss by more than 40%. If another rebound like that comes, we can break even 😅
MSTR+9.15%
MSTRUS+7.78%
2
207
Log in to explore more content
Join global crypto users on Binance Square
⚡️ Get latest and useful information about crypto.
💬 Trusted by the world’s largest crypto exchange.
👍 Discover real insights from verified creators.
Email / Phone number
Trending Topics
BitcoinHits$85K
1,660 views
95 Discussing
Roughly $5B in visible $BTC short liquidations stacked between $83K–$85K. In an uptrend, that's fuel.
When shorts liquidate, they're forced to market-buy. That buying pressure drives price higher, triggering the next layer of liquidations above — a cascade of demand feeding itself.
We saw this exact dynamic on the run from $67K to $80K. The setup looks identical now. Expect the next leg to follow the same playbook: liquidation-driven momentum, systematic buying pressure, and continuation until the fuel runs out.
This is how bull markets accelerate. The chart is setting up clean, and the mechanics are in place. Watch for the break above $83K — that's where the cascade starts.
QuantFreedom
·4 Likes
·2.6k views
ECBStartsBlockchainEuroSettlement
1,835 views
205 Discussing
SouthAfricaProposesCryptoExchangeControls
11,556 views
423 Discussing