
硅谷居士搬运号
876 Posts

硅谷居士搬运号
Report
Block User
清华本科,美国计算机博士,硅谷软件工程师兼经理。兴趣包括开发软件、投资理财、健身和写作。
订阅会员可以给我发私信交流投资理财问题。
小红书号、脸书号、文学城号:硅谷居士。
X平台上唯一的“硅谷居士”号。谨防骗子账户!
我没有Telegram、WhatsApp 账号。不要进骗子拉的群。
0 Following
1.3K+ Followers
843 Liked
Posts
·
--
See translation
QDII美股基金近期的涨势可谓十分瞩目。即使面临着较高的溢价情况,投资者们配置美股的热情依然不减,资金仍在不断地大举涌入。
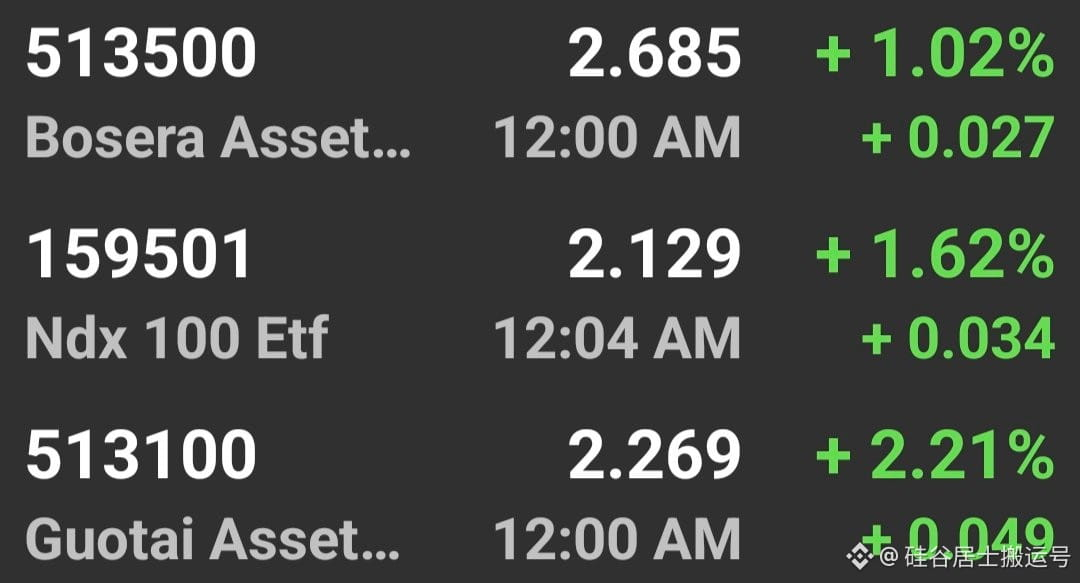
实际上,我之前向大家推荐的几只指数基金,目前的溢价水平已经攀升到了几乎是历史最高的位置。具体来看各项数据,博时标普513500的最新溢价率为10.3%,嘉实纳指159501的溢价率为14.3%,而国泰纳指513100的溢价率则是达到了14.7%。
回顾自去年以来的情况,部分朋友因为顾虑溢价过高而一直保持观望,迟迟不敢入场。如今再看,这种犹豫着实让他们错失了极其丰厚的财富红利。
基于此,我给大家的一贯建议始终没有改变,那就是完全可以忽略溢价因素的影响,放下担忧闭眼果断买入即可。
QDII美股基金近期的涨势可谓十分瞩目。即使面临着较高的溢价情况,投资者们配置美股的热情依然不减,资金仍在不断地大举涌入。
实际上,我之前向大家推荐的几只指数基金,目前的溢价水平已经攀升到了几乎是历史最高的位置。具体来看各项数据,博时标普513500的最新溢价率为10.3%,嘉实纳指159501的溢价率为14.3%,而国泰纳指513100的溢价率则是达到了14.7%。
回顾自去年以来的情况,部分朋友因为顾虑溢价过高而一直保持观望,迟迟不敢入场。如今再看,这种犹豫着实让他们错失了极其丰厚的财富红利。
基于此,我给大家的一贯建议始终没有改变,那就是完全可以忽略溢价因素的影响,放下担忧闭眼果断买入即可。
实际上,我之前向大家推荐的几只指数基金,目前的溢价水平已经攀升到了几乎是历史最高的位置。具体来看各项数据,博时标普513500的最新溢价率为10.3%,嘉实纳指159501的溢价率为14.3%,而国泰纳指513100的溢价率则是达到了14.7%。
回顾自去年以来的情况,部分朋友因为顾虑溢价过高而一直保持观望,迟迟不敢入场。如今再看,这种犹豫着实让他们错失了极其丰厚的财富红利。
基于此,我给大家的一贯建议始终没有改变,那就是完全可以忽略溢价因素的影响,放下担忧闭眼果断买入即可。
4
·
--
See translation
近期美国市场QDII基金的整体表现异常强劲,涨幅十分亮眼。即便面临着较高的溢价成本,广大投资者依然热情高涨,持续将大量资金投入美股之中。
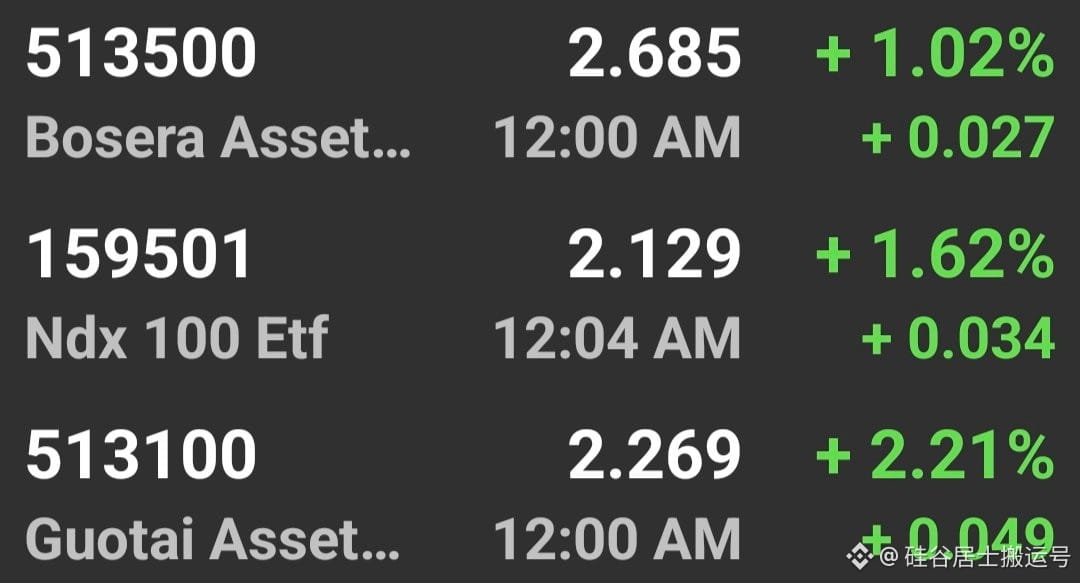
如果观察我此前为大家挑选并介绍的那几只指数型基金,你会发现它们当下的溢价指标已经攀升至历史顶峰附近。从具体的产品数据来看,博时标普513500目前的溢价水平为10.3%,嘉实纳指159501的溢价率为14.3%,而国泰纳指513100更是拥有高达14.7%的溢价率。
回顾自去年以来的行情周期,很多朋友正是因为过度担忧这种高溢价现象,从而一直在场外观望,迟迟不敢采取买入行动。然而现实情况是,这种过度谨慎的态度让他们白白流失了极其丰厚的投资回报。
针对目前的市场情况,我想要坚持分享给大家的核心观点未曾改变。那就是建议各位朋友直接无视当前的溢价因素,放宽心,果断且持续地进行买入操作。
近期美国市场QDII基金的整体表现异常强劲,涨幅十分亮眼。即便面临着较高的溢价成本,广大投资者依然热情高涨,持续将大量资金投入美股之中。
如果观察我此前为大家挑选并介绍的那几只指数型基金,你会发现它们当下的溢价指标已经攀升至历史顶峰附近。从具体的产品数据来看,博时标普513500目前的溢价水平为10.3%,嘉实纳指159501的溢价率为14.3%,而国泰纳指513100更是拥有高达14.7%的溢价率。
回顾自去年以来的行情周期,很多朋友正是因为过度担忧这种高溢价现象,从而一直在场外观望,迟迟不敢采取买入行动。然而现实情况是,这种过度谨慎的态度让他们白白流失了极其丰厚的投资回报。
针对目前的市场情况,我想要坚持分享给大家的核心观点未曾改变。那就是建议各位朋友直接无视当前的溢价因素,放宽心,果断且持续地进行买入操作。
如果观察我此前为大家挑选并介绍的那几只指数型基金,你会发现它们当下的溢价指标已经攀升至历史顶峰附近。从具体的产品数据来看,博时标普513500目前的溢价水平为10.3%,嘉实纳指159501的溢价率为14.3%,而国泰纳指513100更是拥有高达14.7%的溢价率。
回顾自去年以来的行情周期,很多朋友正是因为过度担忧这种高溢价现象,从而一直在场外观望,迟迟不敢采取买入行动。然而现实情况是,这种过度谨慎的态度让他们白白流失了极其丰厚的投资回报。
针对目前的市场情况,我想要坚持分享给大家的核心观点未曾改变。那就是建议各位朋友直接无视当前的溢价因素,放宽心,果断且持续地进行买入操作。
3
·
--
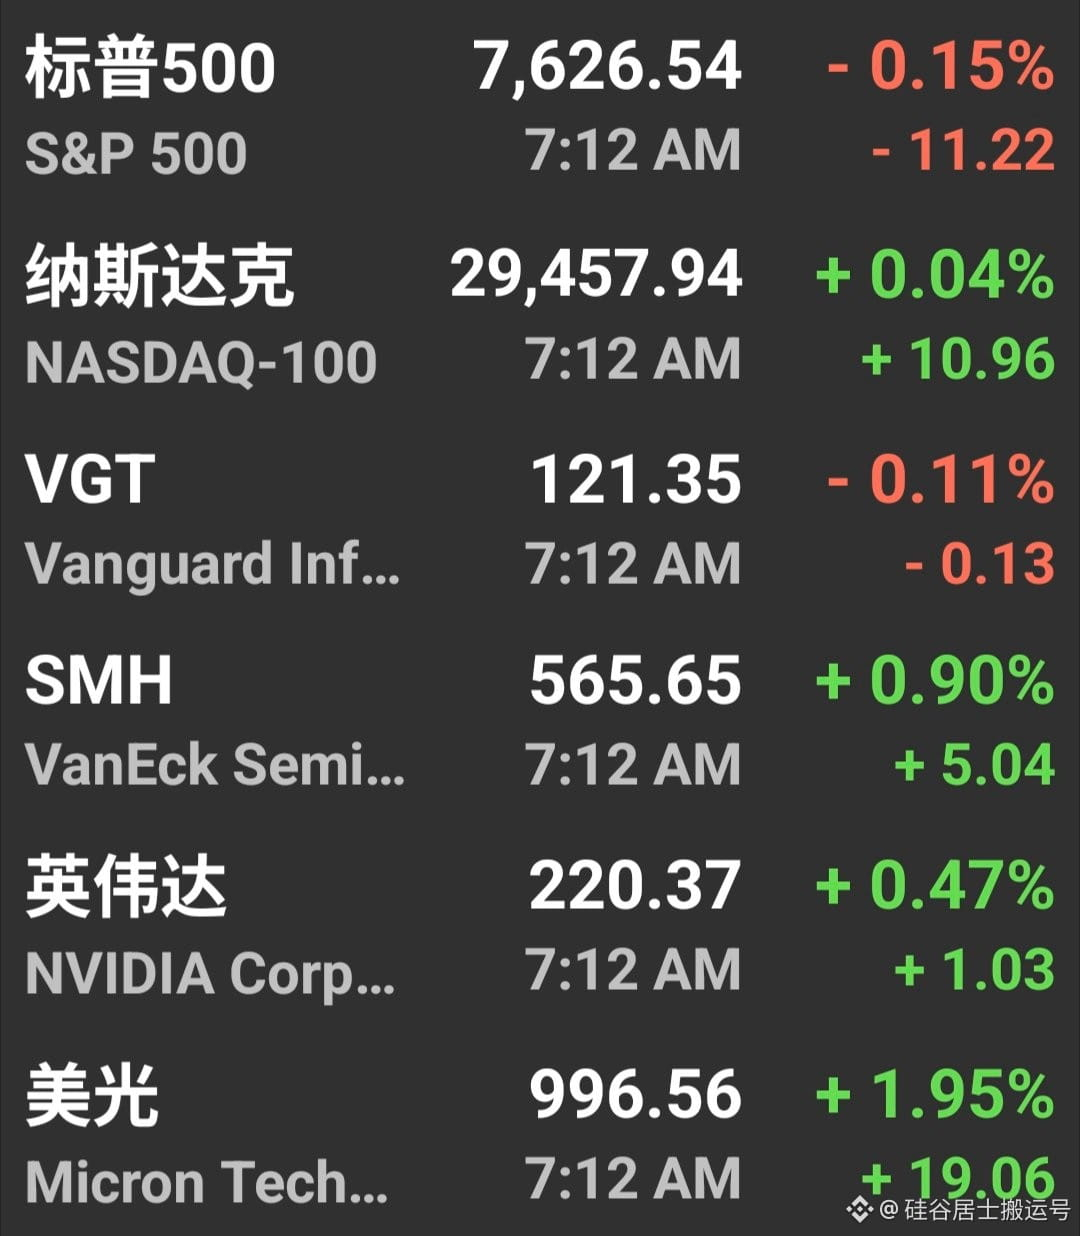
Reflecting on the morning trading session of September 18, the semiconductor sector stood out in the market, showcasing striking performance and leading the pack. At the same time, the storage segment also moved very strongly, successfully rebounding sharply for the second consecutive trading day.
#smh #半导体
Reflecting on the morning trading session of September 18, the semiconductor sector stood out in the market, showcasing striking performance and leading the pack. At the same time, the storage segment also moved very strongly, successfully rebounding sharply for the second consecutive trading day.
#smh #半导体
#smh #半导体
172
·
--
Investment Circle Titan Officially Hands Over the Reins
Recently, Buffett announced a major decision to the public: he has officially stepped down as Chairman of Berkshire Hathaway. Born in 1930, this investment legend is now 96 years old.
According to the company’s arrangements, his son Howard will take over the business in full, serving as the new Chairman, and the appointment takes effect immediately.
With his retirement, an era that belonged to him has come to an end. As for how long it will be before another “stock god” with such immense influence emerges again, that remains an unknown.
Investment Circle Titan Officially Hands Over the Reins
Recently, Buffett announced a major decision to the public: he has officially stepped down as Chairman of Berkshire Hathaway. Born in 1930, this investment legend is now 96 years old.
According to the company’s arrangements, his son Howard will take over the business in full, serving as the new Chairman, and the appointment takes effect immediately.
With his retirement, an era that belonged to him has come to an end. As for how long it will be before another “stock god” with such immense influence emerges again, that remains an unknown.
Recently, Buffett announced a major decision to the public: he has officially stepped down as Chairman of Berkshire Hathaway. Born in 1930, this investment legend is now 96 years old.
According to the company’s arrangements, his son Howard will take over the business in full, serving as the new Chairman, and the appointment takes effect immediately.
With his retirement, an era that belonged to him has come to an end. As for how long it will be before another “stock god” with such immense influence emerges again, that remains an unknown.
2.5k
·
--
The Investment Legend of One Era Waves Goodbye
Recently, Berkshire Hathaway has undergone a major personnel change. Buffett has officially announced to the public that he will no longer serve as the company’s chairman. This decision takes effect immediately upon announcement, and the role is now assumed by his son, Howard.
Born in 1930, this titan of the investment world is now 96 years old. As he steps away from the stage, people can’t help but reflect on how long the future will have to wait before we can witness the birth of another “Sage of Stocks” with an equally powerful appeal and influence.
The Investment Legend of One Era Waves Goodbye
Recently, Berkshire Hathaway has undergone a major personnel change. Buffett has officially announced to the public that he will no longer serve as the company’s chairman. This decision takes effect immediately upon announcement, and the role is now assumed by his son, Howard.
Born in 1930, this titan of the investment world is now 96 years old. As he steps away from the stage, people can’t help but reflect on how long the future will have to wait before we can witness the birth of another “Sage of Stocks” with an equally powerful appeal and influence.
Recently, Berkshire Hathaway has undergone a major personnel change. Buffett has officially announced to the public that he will no longer serve as the company’s chairman. This decision takes effect immediately upon announcement, and the role is now assumed by his son, Howard.
Born in 1930, this titan of the investment world is now 96 years old. As he steps away from the stage, people can’t help but reflect on how long the future will have to wait before we can witness the birth of another “Sage of Stocks” with an equally powerful appeal and influence.
263
·
--
A Splendid Turnaround by a Legendary Figure in the Investment World
Recently, Berkshire Hathaway has undergone a major personnel change. Warren Buffett, who is beloved by many, has officially announced his decision to step down as the company’s Chairman. According to the latest arrangement, his son, Howard, will take over this responsibility and serve as the new Chairman of the next term, with the appointment to take effect immediately.
Looking back on the long years of this investment master, born in 1830, Buffett is now 96 years old this year.
With his retirement, an era has come to a close. People can’t help but wonder and wait, silently wondering how long the investment world must wait before another “stock god” with such extraordinary influence emerges again.
A Splendid Turnaround by a Legendary Figure in the Investment World
Recently, Berkshire Hathaway has undergone a major personnel change. Warren Buffett, who is beloved by many, has officially announced his decision to step down as the company’s Chairman. According to the latest arrangement, his son, Howard, will take over this responsibility and serve as the new Chairman of the next term, with the appointment to take effect immediately.
Looking back on the long years of this investment master, born in 1830, Buffett is now 96 years old this year.
With his retirement, an era has come to a close. People can’t help but wonder and wait, silently wondering how long the investment world must wait before another “stock god” with such extraordinary influence emerges again.
Recently, Berkshire Hathaway has undergone a major personnel change. Warren Buffett, who is beloved by many, has officially announced his decision to step down as the company’s Chairman. According to the latest arrangement, his son, Howard, will take over this responsibility and serve as the new Chairman of the next term, with the appointment to take effect immediately.
Looking back on the long years of this investment master, born in 1830, Buffett is now 96 years old this year.
With his retirement, an era has come to a close. People can’t help but wonder and wait, silently wondering how long the investment world must wait before another “stock god” with such extraordinary influence emerges again.
616
·
--
Friends, do you know which U.S. states have the highest concentration of Chinese residents?
Based on the latest data released by the U.S. Census Bureau on ethnic surveys and community studies, if we include multiracial and mixed-heritage groups in a full-scope count, the total population of Chinese people across the United States has already exceeded 5.5 million.
Of note, nearly half of Chinese residents nationwide choose to live in California and New York. Among them, California ranks first by a wide margin. It is the most densely populated area for Chinese communities, with a population size even more than twice that of New York.
To give you a more intuitive understanding, here is a rundown of the top ten states with the largest Chinese populations across the U.S. (rankings marked with #), along with the local disposable income per capita:
Rank #1 is California, with a total of 1.97 million Chinese residents and a per-capita income of 77,000.
Rank #2 is New York State, with a total of 770,000 Chinese residents and a per-capita income of 74,000.
Rank #3 is Texas, with a total of 300,000 Chinese residents and a per-capita income of 65,000.
Rank #4 is Washington State, with a total of 230,000 Chinese residents and a per-capita income of 80,000.
Rank #5 is Hawaii, with a total of 220,000 Chinese residents and a per-capita income of 67,000.
Rank #6 is Massachusetts, with a total of 210,000 Chinese residents and a per-capita income of 82,000.
Rank #7 is New Jersey, with a total of 190,000 Chinese residents and a per-capita income of 76,000.
Rank #8 is Illinois, with a total of 160,000 Chinese residents and a per-capita income of 68,000.
Rank #9 is Pennsylvania, with a total of 130,000 Chinese residents and a per-capita income of 65,000.
Rank #10 is Florida, with a total of 120,000 Chinese residents and a per-capita income of 67,000.
Overall, among these ten states with the largest Chinese populations, the top three in terms of disposable income per capita are Massachusetts, Washington State, and California.
Friends, do you know which U.S. states have the highest concentration of Chinese residents?
Based on the latest data released by the U.S. Census Bureau on ethnic surveys and community studies, if we include multiracial and mixed-heritage groups in a full-scope count, the total population of Chinese people across the United States has already exceeded 5.5 million.
Of note, nearly half of Chinese residents nationwide choose to live in California and New York. Among them, California ranks first by a wide margin. It is the most densely populated area for Chinese communities, with a population size even more than twice that of New York.
To give you a more intuitive understanding, here is a rundown of the top ten states with the largest Chinese populations across the U.S. (rankings marked with #), along with the local disposable income per capita:
Rank #1 is California, with a total of 1.97 million Chinese residents and a per-capita income of 77,000.
Rank #2 is New York State, with a total of 770,000 Chinese residents and a per-capita income of 74,000.
Rank #3 is Texas, with a total of 300,000 Chinese residents and a per-capita income of 65,000.
Rank #4 is Washington State, with a total of 230,000 Chinese residents and a per-capita income of 80,000.
Rank #5 is Hawaii, with a total of 220,000 Chinese residents and a per-capita income of 67,000.
Rank #6 is Massachusetts, with a total of 210,000 Chinese residents and a per-capita income of 82,000.
Rank #7 is New Jersey, with a total of 190,000 Chinese residents and a per-capita income of 76,000.
Rank #8 is Illinois, with a total of 160,000 Chinese residents and a per-capita income of 68,000.
Rank #9 is Pennsylvania, with a total of 130,000 Chinese residents and a per-capita income of 65,000.
Rank #10 is Florida, with a total of 120,000 Chinese residents and a per-capita income of 67,000.
Overall, among these ten states with the largest Chinese populations, the top three in terms of disposable income per capita are Massachusetts, Washington State, and California.
Based on the latest data released by the U.S. Census Bureau on ethnic surveys and community studies, if we include multiracial and mixed-heritage groups in a full-scope count, the total population of Chinese people across the United States has already exceeded 5.5 million.
Of note, nearly half of Chinese residents nationwide choose to live in California and New York. Among them, California ranks first by a wide margin. It is the most densely populated area for Chinese communities, with a population size even more than twice that of New York.
To give you a more intuitive understanding, here is a rundown of the top ten states with the largest Chinese populations across the U.S. (rankings marked with #), along with the local disposable income per capita:
Rank #1 is California, with a total of 1.97 million Chinese residents and a per-capita income of 77,000.
Rank #2 is New York State, with a total of 770,000 Chinese residents and a per-capita income of 74,000.
Rank #3 is Texas, with a total of 300,000 Chinese residents and a per-capita income of 65,000.
Rank #4 is Washington State, with a total of 230,000 Chinese residents and a per-capita income of 80,000.
Rank #5 is Hawaii, with a total of 220,000 Chinese residents and a per-capita income of 67,000.
Rank #6 is Massachusetts, with a total of 210,000 Chinese residents and a per-capita income of 82,000.
Rank #7 is New Jersey, with a total of 190,000 Chinese residents and a per-capita income of 76,000.
Rank #8 is Illinois, with a total of 160,000 Chinese residents and a per-capita income of 68,000.
Rank #9 is Pennsylvania, with a total of 130,000 Chinese residents and a per-capita income of 65,000.
Rank #10 is Florida, with a total of 120,000 Chinese residents and a per-capita income of 67,000.
Overall, among these ten states with the largest Chinese populations, the top three in terms of disposable income per capita are Massachusetts, Washington State, and California.
1
81
·
--
Are you curious where the Chinese diaspora across the United States is mainly concentrated?
The U.S. Census Bureau has recently released the latest ethnic census and community survey data. The results show that if people with mixed-race and multi-ethnic backgrounds are included in the full-scope calculation, the total Chinese population in the U.S. has already exceeded 5.5 million.
In terms of regional distribution, nearly half of Chinese people choose to settle in California and New York. California ranks first nationwide in terms of the number of Chinese residents, and its total Chinese population is more than twice that of New York.
Below, we have compiled the top ten U.S. states by Chinese population, along with the corresponding per-capita disposable income levels in each (unit: USD):
# State Name Population Income Level
1 California 1.97 million 77,000
2 New York 0.77 million 74,000
3 Texas 0.30 million 65,000
4 Washington 0.23 million 80,000
5 Hawaii 0.22 million 67,000
6 Massachusetts 0.21 million 82,000
7 New Jersey 0.19 million 76,000
8 Illinois 0.16 million 68,000
9 Pennsylvania 0.13 million 65,000
10 Florida 0.12 million 67,000
Notably, among the ten states with the highest number of Chinese residents, the top three in per-capita disposable income are Massachusetts, Washington, and California.
Are you curious where the Chinese diaspora across the United States is mainly concentrated?
The U.S. Census Bureau has recently released the latest ethnic census and community survey data. The results show that if people with mixed-race and multi-ethnic backgrounds are included in the full-scope calculation, the total Chinese population in the U.S. has already exceeded 5.5 million.
In terms of regional distribution, nearly half of Chinese people choose to settle in California and New York. California ranks first nationwide in terms of the number of Chinese residents, and its total Chinese population is more than twice that of New York.
Below, we have compiled the top ten U.S. states by Chinese population, along with the corresponding per-capita disposable income levels in each (unit: USD):
# State Name Population Income Level
1 California 1.97 million 77,000
2 New York 0.77 million 74,000
3 Texas 0.30 million 65,000
4 Washington 0.23 million 80,000
5 Hawaii 0.22 million 67,000
6 Massachusetts 0.21 million 82,000
7 New Jersey 0.19 million 76,000
8 Illinois 0.16 million 68,000
9 Pennsylvania 0.13 million 65,000
10 Florida 0.12 million 67,000
Notably, among the ten states with the highest number of Chinese residents, the top three in per-capita disposable income are Massachusetts, Washington, and California.
The U.S. Census Bureau has recently released the latest ethnic census and community survey data. The results show that if people with mixed-race and multi-ethnic backgrounds are included in the full-scope calculation, the total Chinese population in the U.S. has already exceeded 5.5 million.
In terms of regional distribution, nearly half of Chinese people choose to settle in California and New York. California ranks first nationwide in terms of the number of Chinese residents, and its total Chinese population is more than twice that of New York.
Below, we have compiled the top ten U.S. states by Chinese population, along with the corresponding per-capita disposable income levels in each (unit: USD):
# State Name Population Income Level
1 California 1.97 million 77,000
2 New York 0.77 million 74,000
3 Texas 0.30 million 65,000
4 Washington 0.23 million 80,000
5 Hawaii 0.22 million 67,000
6 Massachusetts 0.21 million 82,000
7 New Jersey 0.19 million 76,000
8 Illinois 0.16 million 68,000
9 Pennsylvania 0.13 million 65,000
10 Florida 0.12 million 67,000
Notably, among the ten states with the highest number of Chinese residents, the top three in per-capita disposable income are Massachusetts, Washington, and California.
181
·
--
An interesting bit of industry history is that Intel, now famous for processors, originally established its footing in the market by producing memory chips. With a strategic shift, Intel later chose to focus on the CPU segment,退出 the DRAM memory market, and sold its flash memory business to South Korea’s SK hynix.
Times have changed, and the very market Intel once abandoned is now facing major upheavals. Recently, Intel CEO Pat Gelsinger candidly acknowledged that current prices for memory chips have surged by 5 to 7 times. He also warned that this supply shortage situation could become even more severe by 2027.
The frantic rise in prices is putting enormous cost pressure on consumer electronics endpoints. At present, in some low-end phones and laptops, storage chips alone account for as much as about 75% of the total cost—an unprecedented figure in the history of the industry.
Concerns about this shortage trend are not limited to Intel. Other companies, such as Micron and SK hynix, have also made closely aligned predictions, openly stating that by 2027 we may witness one of the most severe memory-chip supply shortages in human history.
#SMH #semiconductor #ai
An interesting bit of industry history is that Intel, now famous for processors, originally established its footing in the market by producing memory chips. With a strategic shift, Intel later chose to focus on the CPU segment,退出 the DRAM memory market, and sold its flash memory business to South Korea’s SK hynix.
Times have changed, and the very market Intel once abandoned is now facing major upheavals. Recently, Intel CEO Pat Gelsinger candidly acknowledged that current prices for memory chips have surged by 5 to 7 times. He also warned that this supply shortage situation could become even more severe by 2027.
The frantic rise in prices is putting enormous cost pressure on consumer electronics endpoints. At present, in some low-end phones and laptops, storage chips alone account for as much as about 75% of the total cost—an unprecedented figure in the history of the industry.
Concerns about this shortage trend are not limited to Intel. Other companies, such as Micron and SK hynix, have also made closely aligned predictions, openly stating that by 2027 we may witness one of the most severe memory-chip supply shortages in human history.
#SMH #semiconductor #ai
Times have changed, and the very market Intel once abandoned is now facing major upheavals. Recently, Intel CEO Pat Gelsinger candidly acknowledged that current prices for memory chips have surged by 5 to 7 times. He also warned that this supply shortage situation could become even more severe by 2027.
The frantic rise in prices is putting enormous cost pressure on consumer electronics endpoints. At present, in some low-end phones and laptops, storage chips alone account for as much as about 75% of the total cost—an unprecedented figure in the history of the industry.
Concerns about this shortage trend are not limited to Intel. Other companies, such as Micron and SK hynix, have also made closely aligned predictions, openly stating that by 2027 we may witness one of the most severe memory-chip supply shortages in human history.
#SMH #semiconductor #ai
1
4
531
·
--
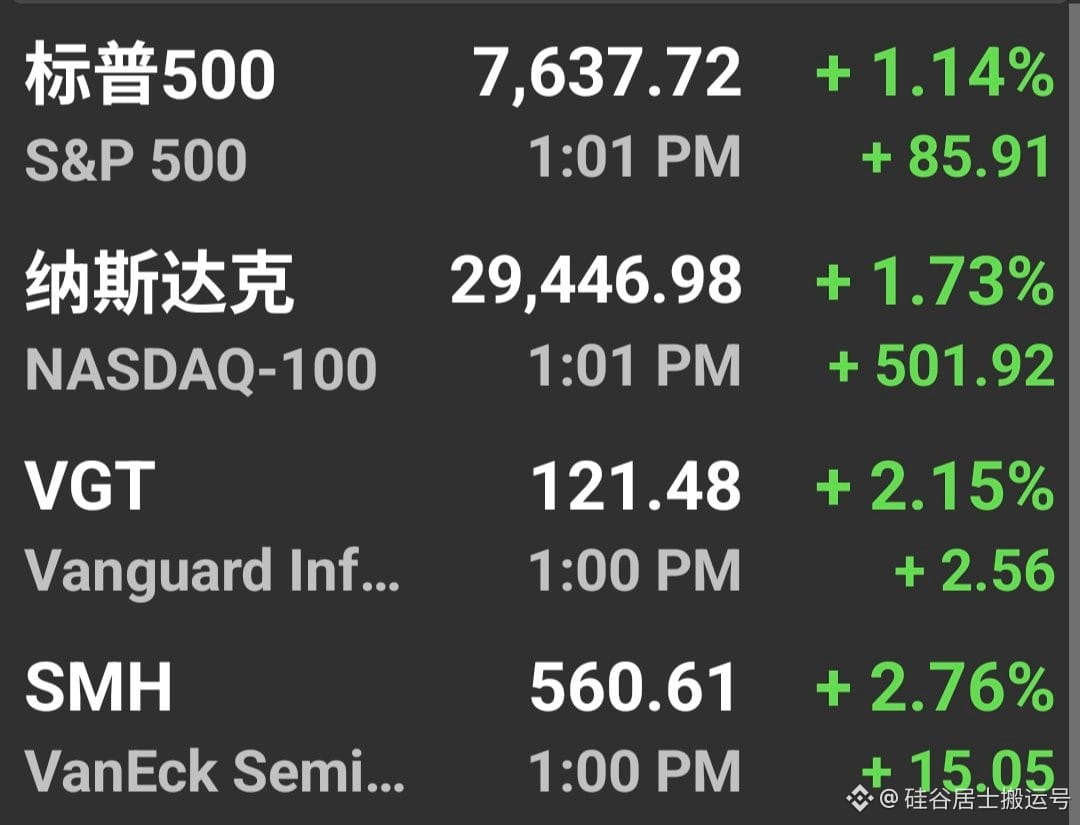
It is precisely amid the uneasy atmosphere felt by the broad investing public that the U.S. stock market, time and again, has set new all-time highs. Just like today’s rally in the U.S. stock market, it has indeed greatly boosted market confidence. Looking back at the past few days, I had advised everyone that at this stage they should remain greedy, though I’m not sure how many friends actually took this advice in the end.
It is precisely amid the uneasy atmosphere felt by the broad investing public that the U.S. stock market, time and again, has set new all-time highs. Just like today’s rally in the U.S. stock market, it has indeed greatly boosted market confidence. Looking back at the past few days, I had advised everyone that at this stage they should remain greedy, though I’m not sure how many friends actually took this advice in the end.
98
·
--
Nvidia’s CEO Jensen Huang recently revealed that the company expects its chip sales for the next fiscal year to double. If this projection can be successfully turned into reality, then by this time next year, Nvidia’s stock price is certain to far exceed its current level.
Nvidia’s CEO Jensen Huang recently revealed that the company expects its chip sales for the next fiscal year to double. If this projection can be successfully turned into reality, then by this time next year, Nvidia’s stock price is certain to far exceed its current level.
1
1
1
44
·
--
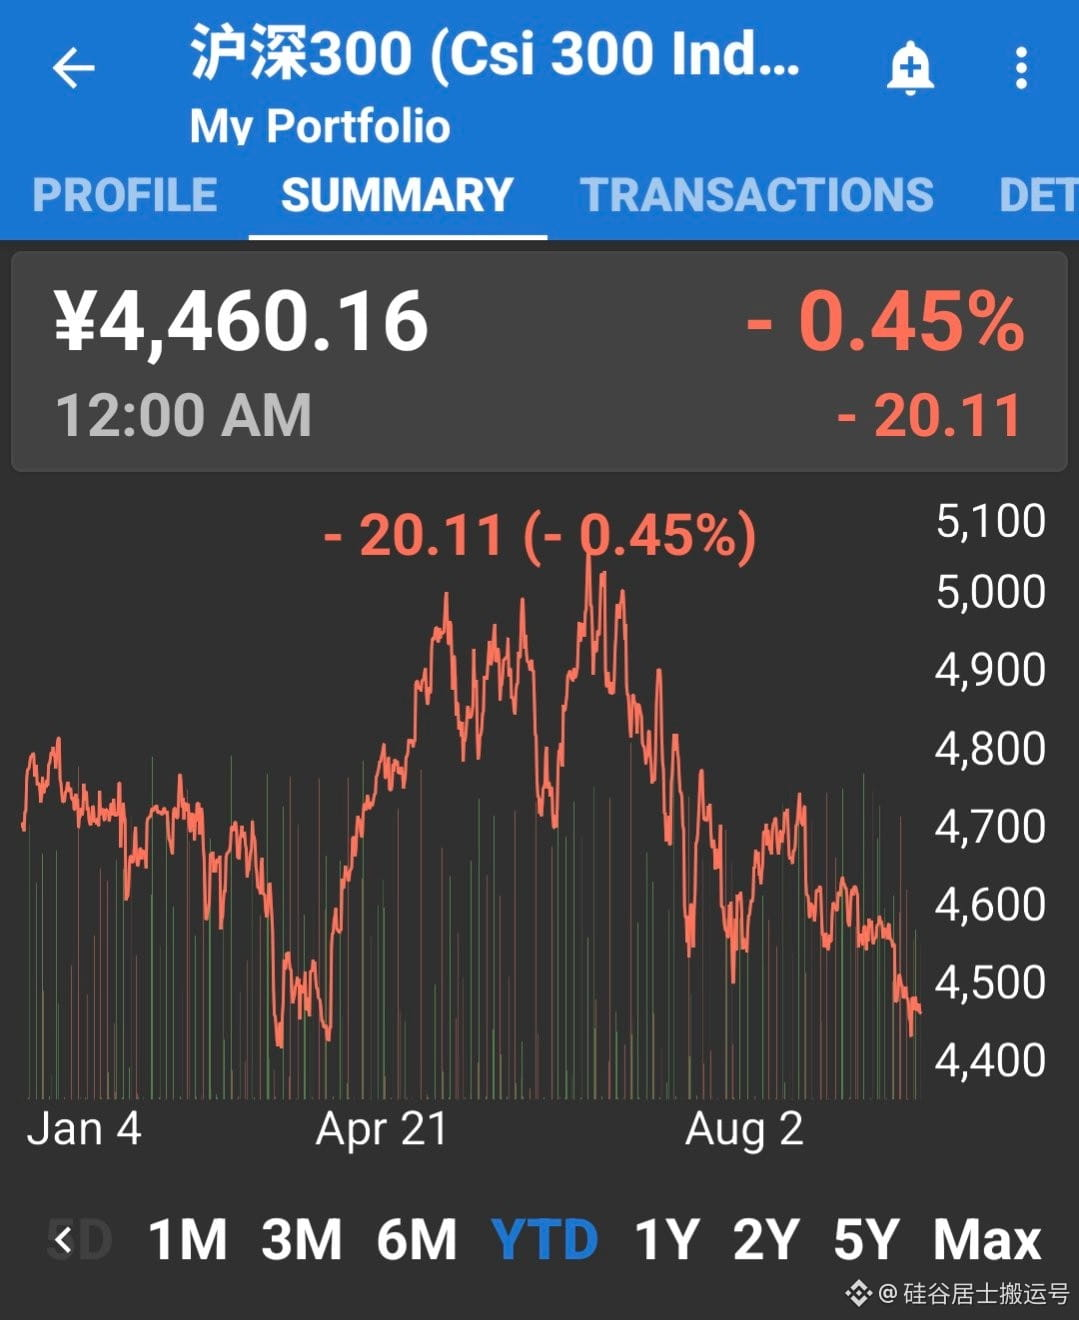
Looking back on 2026, amid a broad uptrend wave across stock markets worldwide, the CSI 300 Index once again has charted a distinct, independent course. Since the start of this year, the index has not kept pace with global benchmarks and has instead recorded a decline of 0.45%.
Looking back on 2026, amid a broad uptrend wave across stock markets worldwide, the CSI 300 Index once again has charted a distinct, independent course. Since the start of this year, the index has not kept pace with global benchmarks and has instead recorded a decline of 0.45%.
42
·
--
Verified
Today, a friend asked me a very interesting question: since the Federal Reserve has already raised interest rates, why has the U.S. stock market still maintained an upward trend?
The most essential truth behind this is that financial markets had already fully priced in the expectation of rate hikes in advance, and reflected it in current stock prices. Capital markets have long been the most averse to the unknown. Once the decision to raise rates is officially implemented, it means that a major source of uncertainty has been removed, and investors’ sentiment can naturally be effectively restored.
Looking back at past trends, similar market reactions have, in fact, been playing out repeatedly throughout history. A very typical example is in 2023, when, despite the Fed’s aggressive rate-hike policy, the U.S. stock market not only failed to falter, but instead saw a very strong rebound. Over the entire 2023 fiscal year, the Nasdaq index surged by 53.8%.
Today, a friend asked me a very interesting question: since the Federal Reserve has already raised interest rates, why has the U.S. stock market still maintained an upward trend?
The most essential truth behind this is that financial markets had already fully priced in the expectation of rate hikes in advance, and reflected it in current stock prices. Capital markets have long been the most averse to the unknown. Once the decision to raise rates is officially implemented, it means that a major source of uncertainty has been removed, and investors’ sentiment can naturally be effectively restored.
Looking back at past trends, similar market reactions have, in fact, been playing out repeatedly throughout history. A very typical example is in 2023, when, despite the Fed’s aggressive rate-hike policy, the U.S. stock market not only failed to falter, but instead saw a very strong rebound. Over the entire 2023 fiscal year, the Nasdaq index surged by 53.8%.
The most essential truth behind this is that financial markets had already fully priced in the expectation of rate hikes in advance, and reflected it in current stock prices. Capital markets have long been the most averse to the unknown. Once the decision to raise rates is officially implemented, it means that a major source of uncertainty has been removed, and investors’ sentiment can naturally be effectively restored.
Looking back at past trends, similar market reactions have, in fact, been playing out repeatedly throughout history. A very typical example is in 2023, when, despite the Fed’s aggressive rate-hike policy, the U.S. stock market not only failed to falter, but instead saw a very strong rebound. Over the entire 2023 fiscal year, the Nasdaq index surged by 53.8%.
1
692
·
--
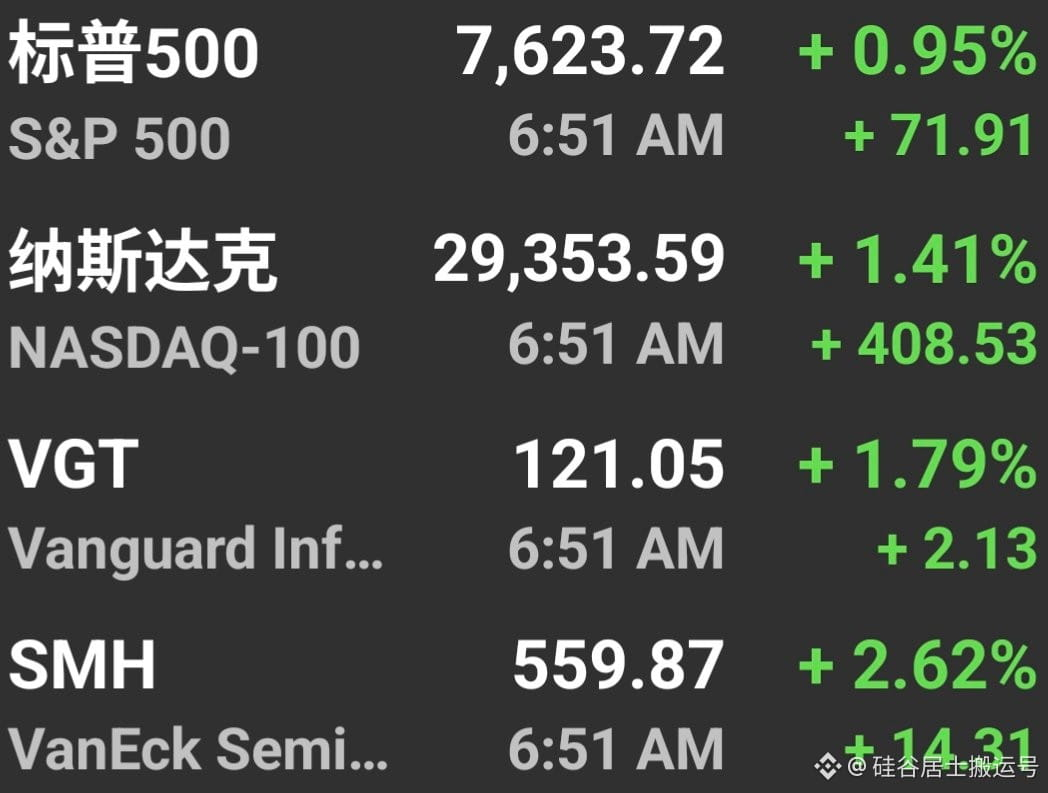
During the morning trading session on September 17, the stock market opened with a strongly positive and upbeat outlook overall. Of particular note are the semiconductor and technology-related sectors—both of which demonstrated a very strong and remarkable upward momentum throughout the day.
During the morning trading session on September 17, the stock market opened with a strongly positive and upbeat outlook overall. Of particular note are the semiconductor and technology-related sectors—both of which demonstrated a very strong and remarkable upward momentum throughout the day.
95
·
--
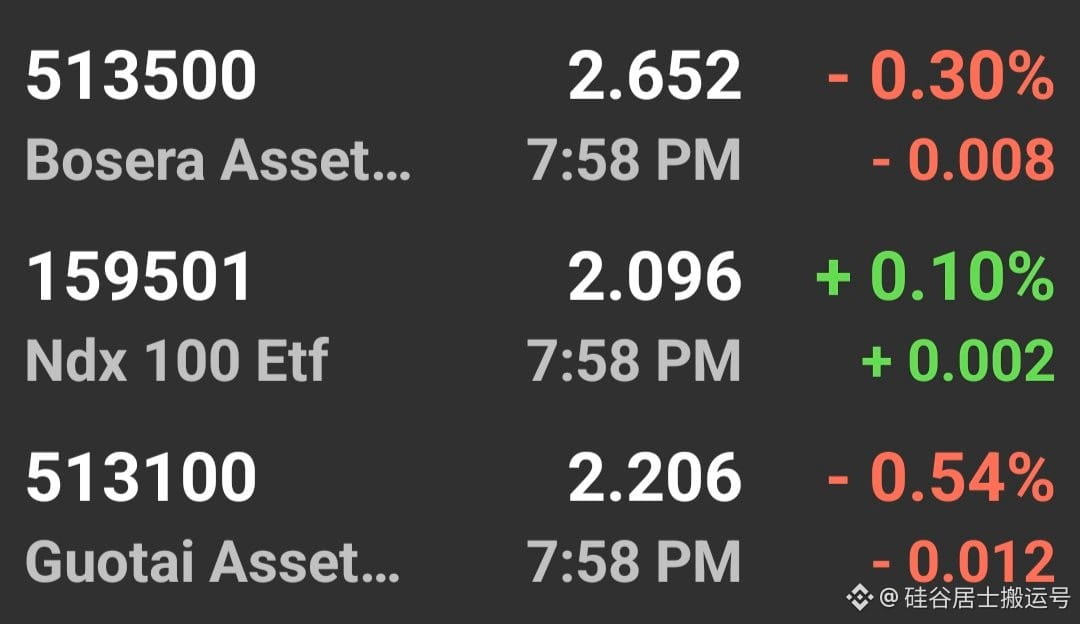
Recently, there have been many voices from outside saying that the popularity of the Harvest Nasdaq 100 Index fund owes much to my fans’ enthusiastic support. In response, I want to say that high-quality fund products deserve to be well-regarded and chosen.
If we look objectively at the performance data since the beginning of this year alone, the Harvest Nasdaq 100 Index fund is indeed significantly ahead of the Cathay Nasdaq 100 Index fund in terms of performance. Specifically, fund code 159501 has achieved a return of 17.6%, while the Cathay Nasdaq 100 Index fund with code 513100 has a return of 15.8% over the same period. Comparing the return performance of these two funds, there is a clear gap of exactly 1.8% between them.
Recently, there have been many voices from outside saying that the popularity of the Harvest Nasdaq 100 Index fund owes much to my fans’ enthusiastic support. In response, I want to say that high-quality fund products deserve to be well-regarded and chosen.
If we look objectively at the performance data since the beginning of this year alone, the Harvest Nasdaq 100 Index fund is indeed significantly ahead of the Cathay Nasdaq 100 Index fund in terms of performance. Specifically, fund code 159501 has achieved a return of 17.6%, while the Cathay Nasdaq 100 Index fund with code 513100 has a return of 15.8% over the same period. Comparing the return performance of these two funds, there is a clear gap of exactly 1.8% between them.
If we look objectively at the performance data since the beginning of this year alone, the Harvest Nasdaq 100 Index fund is indeed significantly ahead of the Cathay Nasdaq 100 Index fund in terms of performance. Specifically, fund code 159501 has achieved a return of 17.6%, while the Cathay Nasdaq 100 Index fund with code 513100 has a return of 15.8% over the same period. Comparing the return performance of these two funds, there is a clear gap of exactly 1.8% between them.
110
·
--
Albert Einstein once marveled that compound interest is the world’s eighth wonder. Those who truly understand it can benefit from it, while the ignorant will eventually pay the price.
Looking at the life trajectory of stock legend Warren Buffett, he was born in 1930 during the Great Depression in the United States. Fast forward to 1996—by then he had just turned 66. At an age when most Americans have long since settled into their retirement years, he had already accumulated an astonishing fortune of $17 billion, undoubtedly making him a standout among his peers. Yet this legendary figure neither chose an easy retirement nor made a major transfer of his core assets into conventional low-risk areas like bank deposits or bonds. Instead, he continued to let the vast majority of his funds ride the waves in the stock market.
Twenty-nine years later, in 2025, at age 95, Buffett’s net worth surged to a jaw-dropping $150 billion. This also means that roughly 90% of the wealth he has in his hands was generated in the 29 years after he turned 66. During those years, even though his average annual wealth growth rate of 7.8% did not surpass the 9.6% performance of the S&P 500 index fund over the same period, he still easily outperformed bonds with returns of only 4% and bank deposits with returns of just 3%. Buffett’s history of asset multiplication perfectly illustrates the incredible power of compound interest.
This year marks my 21st year in the workforce. When I reflect on how my own assets have changed over time, I’ve found a highly similar pattern. Specifically, more than 55% of our family’s wealth was accumulated in the most recent 3 years. Stretch that to the past 6 years, and the proportion reaches 75% or more. And if we go back 12 years, it has created 90% or more of the family’s wealth.
Suppose I continue working until I retire at 65, and assume that at that time the family’s total assets are A. Since most of my current assets are stock index funds, and I intend to keep following a fully invested allocation strategy in stock index funds going forward, I estimate that the annualized return of the entire portfolio can still remain around 11%. Meanwhile, based on the annual reports released by the Social Security Administration (SSA), after retirement we can receive about $100,000 per year in Social Security benefits. To cover the shortfall in everyday expenses, the amount we would need to withdraw each year from our individual retirement accounts should not exceed 1% of total assets. Therefore, I conclude that after age 65, the family’s net-asset average annual growth rate will likely stay around 9%.
With those assumptions, when I live to 90, the formula for net assets will be: A x 1.1^25 = A x 10.8 (here we should clarify that “^” represents the exponentiation function). That means that by then, I can proudly say that 91% of my wealth (equal to 9.8A ÷ 10.8A) was generated after age 65.
If I’m lucky enough to live to 95, my net assets would become: A x 1.1^30 = A x 17.4. In that case, the portion of wealth created after age 65 would be as high as 94% (equal to 16.4A ÷ 17.4A). This is the compound-interest magic I’ve personally experienced!
I strongly believe this to be true. As long as I strictly follow my investment discipline, take the most straightforward approach to regularly invest in and hold a few stock index funds for the long term, there is absolutely no need to pursue flashy trading techniques or spend energy searching for other investment targets. That alone is enough to beat more than 95% of participants in the market, and then accumulate a fairly substantial nest egg.
I’m very much looking forward to having friends support my continued creation through subscribing to my membership service. I will frequently post in-depth articles exclusively for members, and you can also message me anytime to ask any questions you may have about investment and personal finance. The subscription link is: https://x.com/SVScholar/creator-subscriptions/subscribe
If you’re interested in exploring my financial philosophy and hands-on experience further, you’re welcome to visit the Amazon website or Google Play Books, search for my Chinese book 《Wealth Shortcut》, or check out the English version 《The Shortcut to Wealth: Your Simple Roadmap to Financial Independence》. There are also related purchase links in my pinned post.
#FinancialFreedom #WealthFreedom #Finance #PersonalFinance #USStocks #USA #Stocks #Funds #Investing #Nasdaq #VGT #AI #SMH
Albert Einstein once marveled that compound interest is the world’s eighth wonder. Those who truly understand it can benefit from it, while the ignorant will eventually pay the price.
Looking at the life trajectory of stock legend Warren Buffett, he was born in 1930 during the Great Depression in the United States. Fast forward to 1996—by then he had just turned 66. At an age when most Americans have long since settled into their retirement years, he had already accumulated an astonishing fortune of $17 billion, undoubtedly making him a standout among his peers. Yet this legendary figure neither chose an easy retirement nor made a major transfer of his core assets into conventional low-risk areas like bank deposits or bonds. Instead, he continued to let the vast majority of his funds ride the waves in the stock market.
Twenty-nine years later, in 2025, at age 95, Buffett’s net worth surged to a jaw-dropping $150 billion. This also means that roughly 90% of the wealth he has in his hands was generated in the 29 years after he turned 66. During those years, even though his average annual wealth growth rate of 7.8% did not surpass the 9.6% performance of the S&P 500 index fund over the same period, he still easily outperformed bonds with returns of only 4% and bank deposits with returns of just 3%. Buffett’s history of asset multiplication perfectly illustrates the incredible power of compound interest.
This year marks my 21st year in the workforce. When I reflect on how my own assets have changed over time, I’ve found a highly similar pattern. Specifically, more than 55% of our family’s wealth was accumulated in the most recent 3 years. Stretch that to the past 6 years, and the proportion reaches 75% or more. And if we go back 12 years, it has created 90% or more of the family’s wealth.
Suppose I continue working until I retire at 65, and assume that at that time the family’s total assets are A. Since most of my current assets are stock index funds, and I intend to keep following a fully invested allocation strategy in stock index funds going forward, I estimate that the annualized return of the entire portfolio can still remain around 11%. Meanwhile, based on the annual reports released by the Social Security Administration (SSA), after retirement we can receive about $100,000 per year in Social Security benefits. To cover the shortfall in everyday expenses, the amount we would need to withdraw each year from our individual retirement accounts should not exceed 1% of total assets. Therefore, I conclude that after age 65, the family’s net-asset average annual growth rate will likely stay around 9%.
With those assumptions, when I live to 90, the formula for net assets will be: A x 1.1^25 = A x 10.8 (here we should clarify that “^” represents the exponentiation function). That means that by then, I can proudly say that 91% of my wealth (equal to 9.8A ÷ 10.8A) was generated after age 65.
If I’m lucky enough to live to 95, my net assets would become: A x 1.1^30 = A x 17.4. In that case, the portion of wealth created after age 65 would be as high as 94% (equal to 16.4A ÷ 17.4A). This is the compound-interest magic I’ve personally experienced!
I strongly believe this to be true. As long as I strictly follow my investment discipline, take the most straightforward approach to regularly invest in and hold a few stock index funds for the long term, there is absolutely no need to pursue flashy trading techniques or spend energy searching for other investment targets. That alone is enough to beat more than 95% of participants in the market, and then accumulate a fairly substantial nest egg.
I’m very much looking forward to having friends support my continued creation through subscribing to my membership service. I will frequently post in-depth articles exclusively for members, and you can also message me anytime to ask any questions you may have about investment and personal finance. The subscription link is: https://x.com/SVScholar/creator-subscriptions/subscribe
If you’re interested in exploring my financial philosophy and hands-on experience further, you’re welcome to visit the Amazon website or Google Play Books, search for my Chinese book 《Wealth Shortcut》, or check out the English version 《The Shortcut to Wealth: Your Simple Roadmap to Financial Independence》. There are also related purchase links in my pinned post.
#FinancialFreedom #WealthFreedom #Finance #PersonalFinance #USStocks #USA #Stocks #Funds #Investing #Nasdaq #VGT #AI #SMH
Looking at the life trajectory of stock legend Warren Buffett, he was born in 1930 during the Great Depression in the United States. Fast forward to 1996—by then he had just turned 66. At an age when most Americans have long since settled into their retirement years, he had already accumulated an astonishing fortune of $17 billion, undoubtedly making him a standout among his peers. Yet this legendary figure neither chose an easy retirement nor made a major transfer of his core assets into conventional low-risk areas like bank deposits or bonds. Instead, he continued to let the vast majority of his funds ride the waves in the stock market.
Twenty-nine years later, in 2025, at age 95, Buffett’s net worth surged to a jaw-dropping $150 billion. This also means that roughly 90% of the wealth he has in his hands was generated in the 29 years after he turned 66. During those years, even though his average annual wealth growth rate of 7.8% did not surpass the 9.6% performance of the S&P 500 index fund over the same period, he still easily outperformed bonds with returns of only 4% and bank deposits with returns of just 3%. Buffett’s history of asset multiplication perfectly illustrates the incredible power of compound interest.
This year marks my 21st year in the workforce. When I reflect on how my own assets have changed over time, I’ve found a highly similar pattern. Specifically, more than 55% of our family’s wealth was accumulated in the most recent 3 years. Stretch that to the past 6 years, and the proportion reaches 75% or more. And if we go back 12 years, it has created 90% or more of the family’s wealth.
Suppose I continue working until I retire at 65, and assume that at that time the family’s total assets are A. Since most of my current assets are stock index funds, and I intend to keep following a fully invested allocation strategy in stock index funds going forward, I estimate that the annualized return of the entire portfolio can still remain around 11%. Meanwhile, based on the annual reports released by the Social Security Administration (SSA), after retirement we can receive about $100,000 per year in Social Security benefits. To cover the shortfall in everyday expenses, the amount we would need to withdraw each year from our individual retirement accounts should not exceed 1% of total assets. Therefore, I conclude that after age 65, the family’s net-asset average annual growth rate will likely stay around 9%.
With those assumptions, when I live to 90, the formula for net assets will be: A x 1.1^25 = A x 10.8 (here we should clarify that “^” represents the exponentiation function). That means that by then, I can proudly say that 91% of my wealth (equal to 9.8A ÷ 10.8A) was generated after age 65.
If I’m lucky enough to live to 95, my net assets would become: A x 1.1^30 = A x 17.4. In that case, the portion of wealth created after age 65 would be as high as 94% (equal to 16.4A ÷ 17.4A). This is the compound-interest magic I’ve personally experienced!
I strongly believe this to be true. As long as I strictly follow my investment discipline, take the most straightforward approach to regularly invest in and hold a few stock index funds for the long term, there is absolutely no need to pursue flashy trading techniques or spend energy searching for other investment targets. That alone is enough to beat more than 95% of participants in the market, and then accumulate a fairly substantial nest egg.
I’m very much looking forward to having friends support my continued creation through subscribing to my membership service. I will frequently post in-depth articles exclusively for members, and you can also message me anytime to ask any questions you may have about investment and personal finance. The subscription link is: https://x.com/SVScholar/creator-subscriptions/subscribe
If you’re interested in exploring my financial philosophy and hands-on experience further, you’re welcome to visit the Amazon website or Google Play Books, search for my Chinese book 《Wealth Shortcut》, or check out the English version 《The Shortcut to Wealth: Your Simple Roadmap to Financial Independence》. There are also related purchase links in my pinned post.
#FinancialFreedom #WealthFreedom #Finance #PersonalFinance #USStocks #USA #Stocks #Funds #Investing #Nasdaq #VGT #AI #SMH
VGTETF-0.02%
SMHB+0.50%
157
·
--
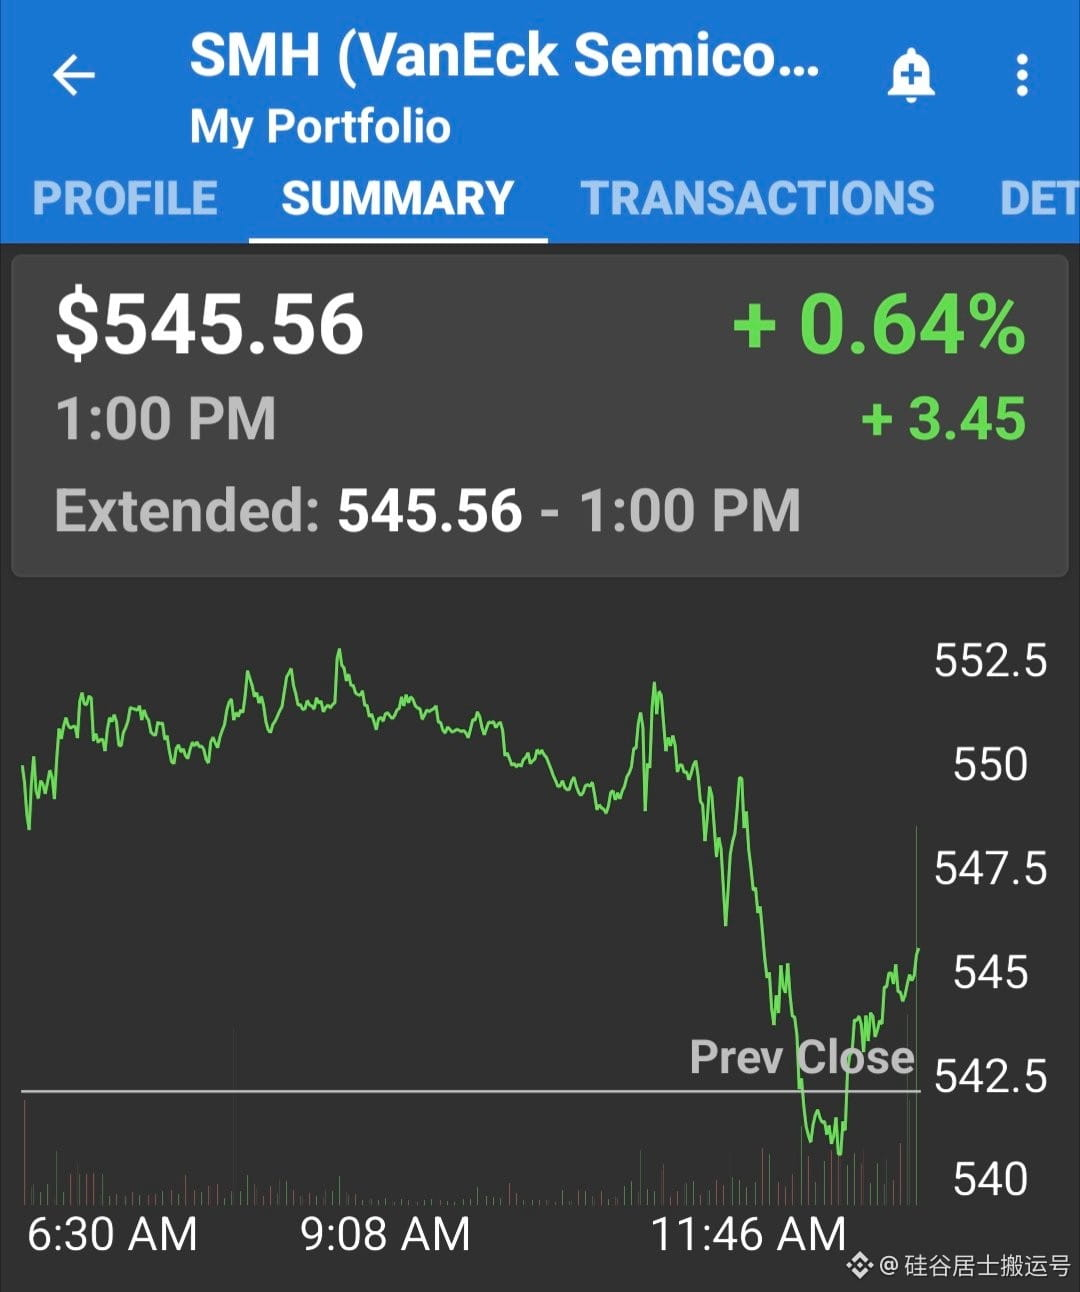
The market on Wednesday afternoon played out like a soap opera.
At the day’s press conference, the remarks from the Federal Reserve chair left investors quite puzzled, and the market briefly fell into a state of confusion. During this period, the shares of semiconductor-related funds also swung wildly, like riding a roller coaster. Fortunately, nothing went wrong—these funds managed to log gains by the close.
Looking ahead, the focus for everyone now will be entirely on the third-quarter financial reports that major companies are about to disclose.
The market on Wednesday afternoon played out like a soap opera.
At the day’s press conference, the remarks from the Federal Reserve chair left investors quite puzzled, and the market briefly fell into a state of confusion. During this period, the shares of semiconductor-related funds also swung wildly, like riding a roller coaster. Fortunately, nothing went wrong—these funds managed to log gains by the close.
Looking ahead, the focus for everyone now will be entirely on the third-quarter financial reports that major companies are about to disclose.
At the day’s press conference, the remarks from the Federal Reserve chair left investors quite puzzled, and the market briefly fell into a state of confusion. During this period, the shares of semiconductor-related funds also swung wildly, like riding a roller coaster. Fortunately, nothing went wrong—these funds managed to log gains by the close.
Looking ahead, the focus for everyone now will be entirely on the third-quarter financial reports that major companies are about to disclose.
36
·
--
The Federal Reserve Announces a 0.25% Interest Rate Increase
On September 16, the Federal Open Market Committee of the Federal Reserve officially made an important decision, announcing that it would raise interest rates by 0.25%. During the voting that day, all 12 members of the committee cast their votes in favor of the move. Notably, this is the first interest-rate hike by the Federal Reserve in the past three years.
The Federal Reserve Announces a 0.25% Interest Rate Increase
On September 16, the Federal Open Market Committee of the Federal Reserve officially made an important decision, announcing that it would raise interest rates by 0.25%. During the voting that day, all 12 members of the committee cast their votes in favor of the move. Notably, this is the first interest-rate hike by the Federal Reserve in the past three years.
On September 16, the Federal Open Market Committee of the Federal Reserve officially made an important decision, announcing that it would raise interest rates by 0.25%. During the voting that day, all 12 members of the committee cast their votes in favor of the move. Notably, this is the first interest-rate hike by the Federal Reserve in the past three years.
16
·
--
In the early trading session on September 16, the U.S. stock market withstood the intense pressure of the Federal Reserve’s rate hikes and still maintained an unafraid forward momentum. At present, the market is eagerly looking forward to the Fed chair to deliver some positive remarks, which could provide additional impetus for the U.S. stocks to further recoup their previous losses.
In the early trading session on September 16, the U.S. stock market withstood the intense pressure of the Federal Reserve’s rate hikes and still maintained an unafraid forward momentum. At present, the market is eagerly looking forward to the Fed chair to deliver some positive remarks, which could provide additional impetus for the U.S. stocks to further recoup their previous losses.
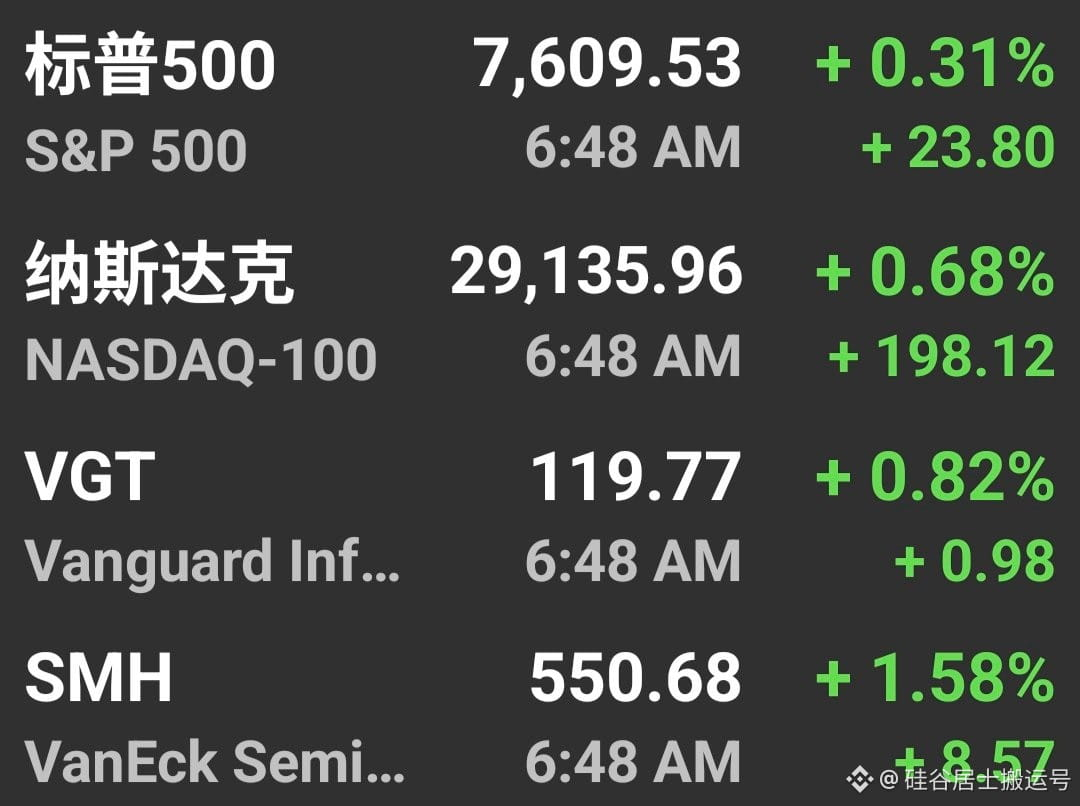
17
·
--
During the morning trading session on September 16, despite the many pressures brought by the Federal Reserve’s rate hikes, the U.S. stock market has still maintained a strong upward trend. Currently, the market is expecting the Fed Chair to issue some positive and friendly signals, which would help the semiconductor sector successfully recoup its previous losses.
During the morning trading session on September 16, despite the many pressures brought by the Federal Reserve’s rate hikes, the U.S. stock market has still maintained a strong upward trend. Currently, the market is expecting the Fed Chair to issue some positive and friendly signals, which would help the semiconductor sector successfully recoup its previous losses.
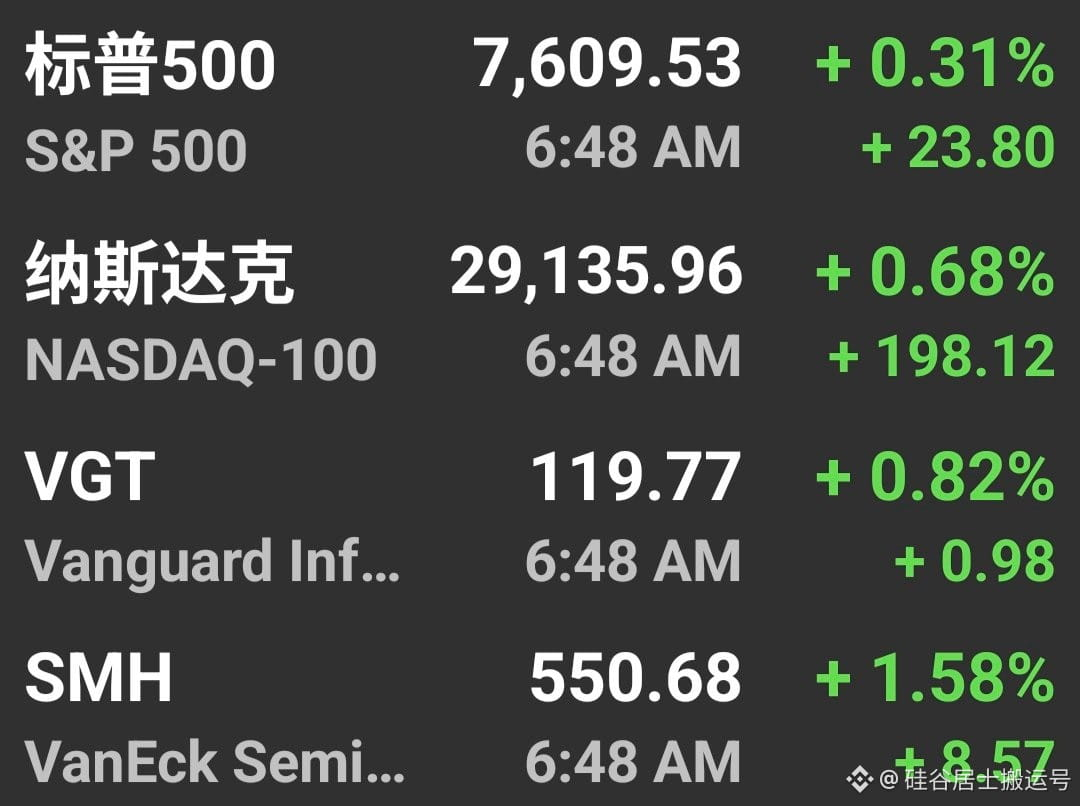
28
Log in to explore more content
Join global crypto users on Binance Square
⚡️ Get latest and useful information about crypto.
💬 Trusted by the world’s largest crypto exchange.
👍 Discover real insights from verified creators.
Email / Phone number
Trending Topics
BTCBreaks80K
17,822 views
560 Discussing
🚨 BITCOIN $80K IS BACK IN FOCUS! 🔥
BTC is pushing toward the $80,000 psychological resistance after reclaiming the $78K zone. A clean breakout and hold above $80K could bring $82K–$85K into focus next. 📈
But traders need to watch the rejection zone carefully — losing $77K–$78K could trigger another pullback.
🎯 Key levels:
• 🔥 Breakout: $80K
• 🚀 Next zone: $82K–$85K
• ⚠️ Support: $77K–$78K
$80K isn’t just a number — it’s the level bulls need to conquer.
Are we about to see the next BTC breakout? 👇
#bitcoin #BTC #BinanceSquare #btcbreaks80k
$BTC
ASHFAQ NAEEM
·3 Likes
·4.4k views
比特币突破8万
27,624 views
80 Discussing
BuffettBecomesBerkshireChairmanEmeritus
1,017 views
124 Discussing