

CryptoTraders.com
372 Posts

CryptoTraders.com
Report
Block User
Home of Top Analysts, Elite Trade Alerts, Cutting-Edge Algorithms, and Powerful Scanners — all built to give you the edge in any market. Join & Activate your 14-day free trial now to see the results yourself!
0 Following
4 Followers
3 Liked
Posts
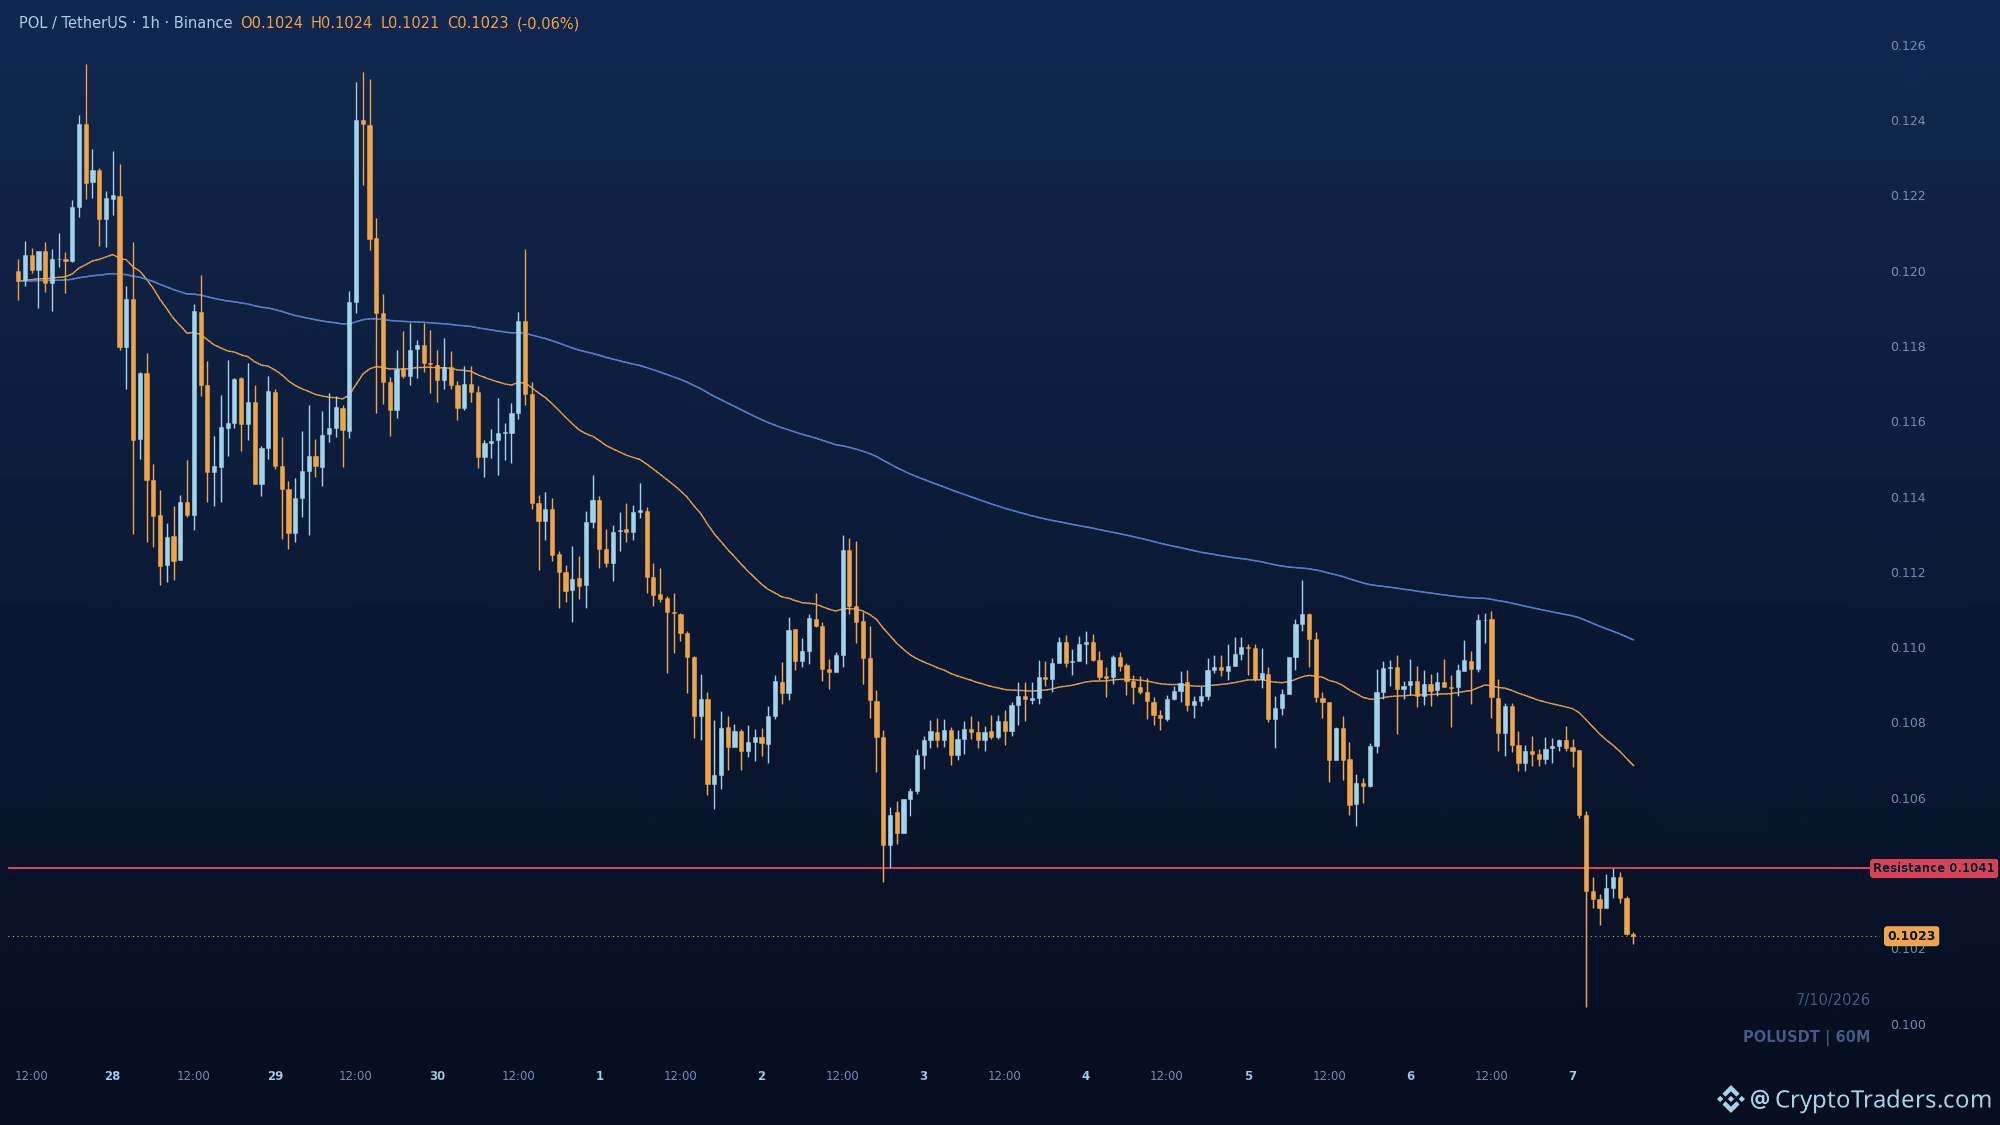
$POL earned a watchlist spot today because 0.10412 is now the line that decides whether this bounce is a dead cat or a real turn. Price is still under both falling EMAs, so the trend stays lower highs and lower lows. Sellers already swept 0.10045 and price reclaimed it, which leaves the chart sitting in discount. A weak push into 0.10412 is where sellers would likely step back in and resume the decline. Below 0.10045, there is no visible structure underneath to catch a slide. So which is it here, a failed bounce off 0.10412 or a base building above 0.10045? The group works through setups like this one every day, details are in the profile. #Altcoin Season#
$POL earned a watchlist spot today because 0.10412 is now the line that decides whether this bounce is a dead cat or a real turn. Price is still under both falling EMAs, so the trend stays lower highs and lower lows. Sellers already swept 0.10045 and price reclaimed it, which leaves the chart sitting in discount. A weak push into 0.10412 is where sellers would likely step back in and resume the decline. Below 0.10045, there is no visible structure underneath to catch a slide. So which is it here, a failed bounce off 0.10412 or a base building above 0.10045? The group works through setups like this one every day, details are in the profile. #Altcoin Season#
27
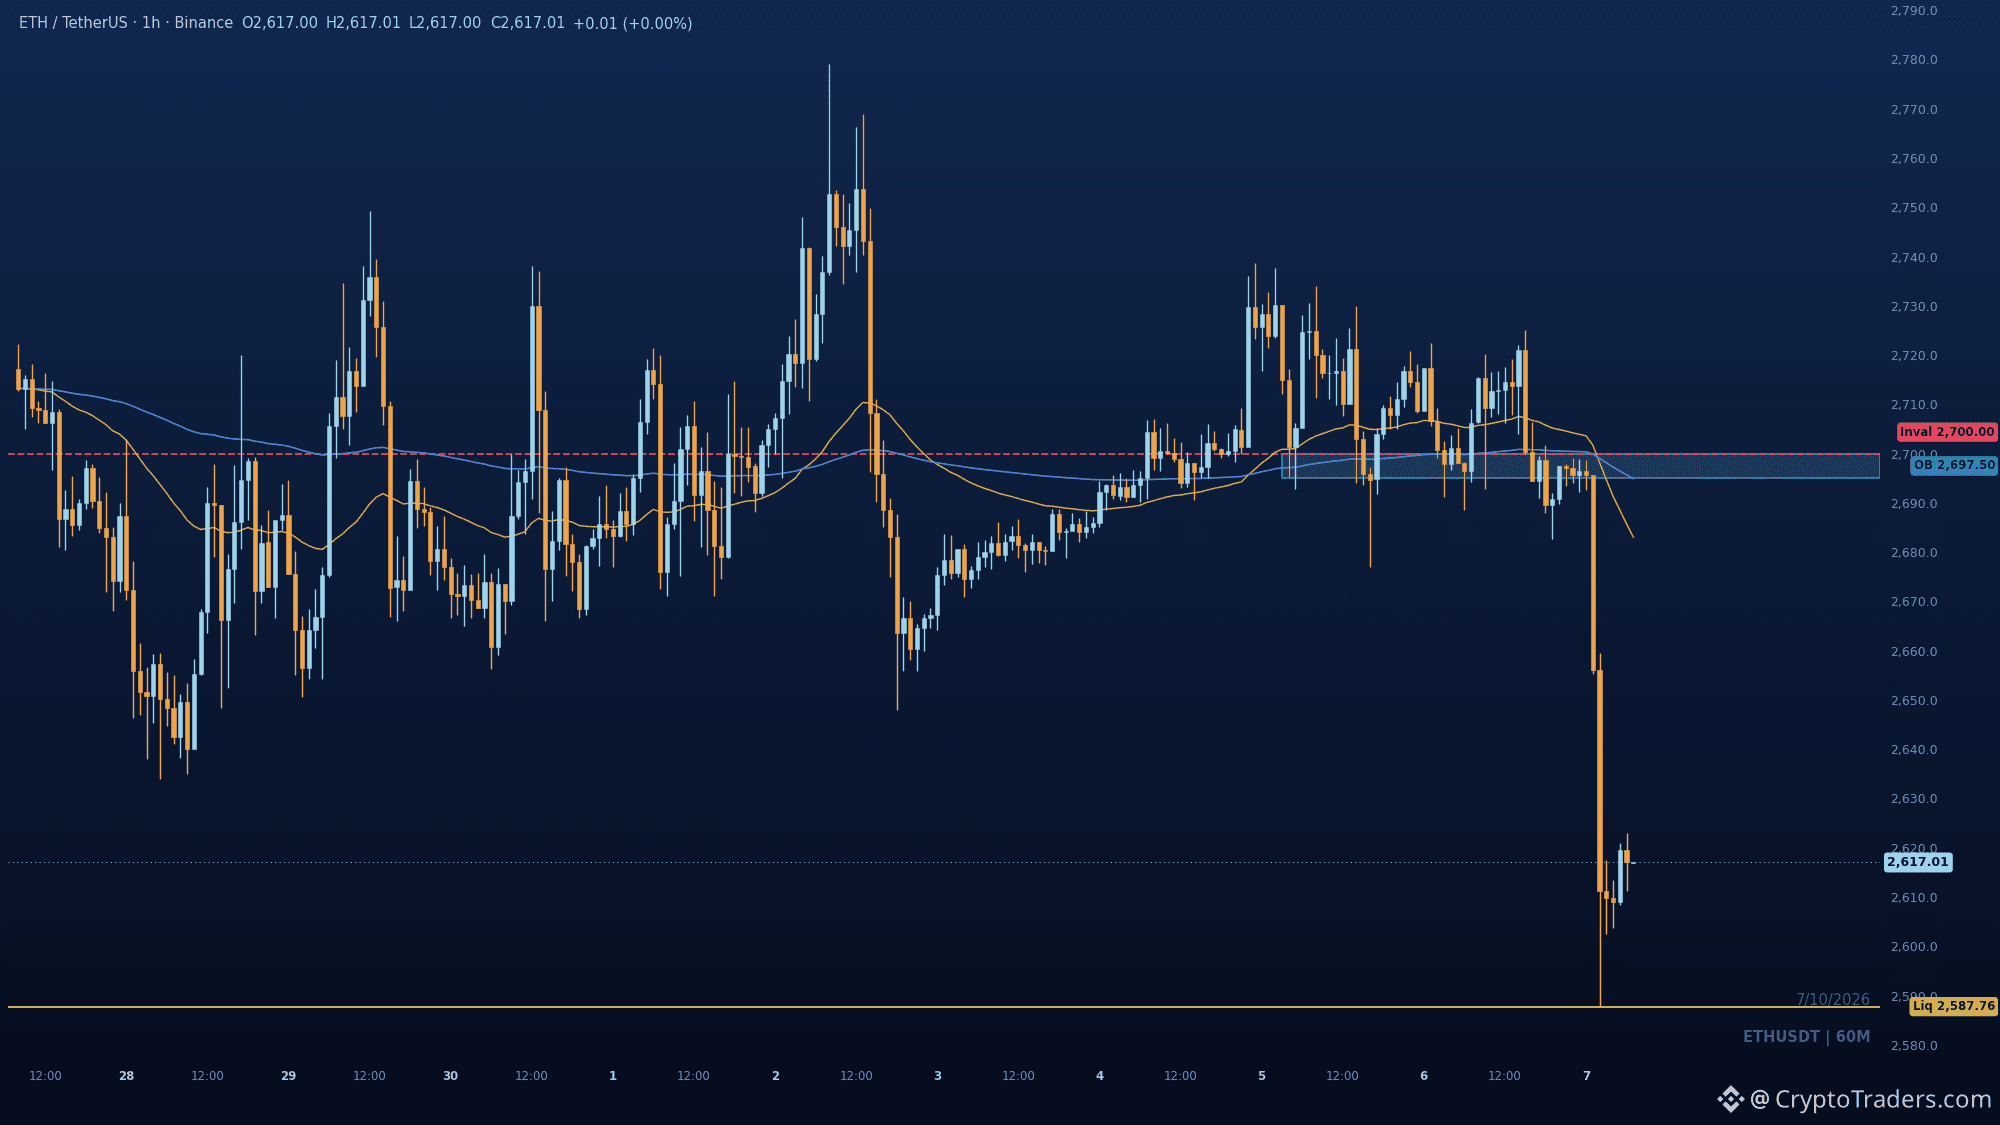
$ETH swept 2,587.76 in a single hour wick, and that fast a reclaim is the one thing on this chart that does not fit a clean breakdown. Structure is still bearish after the downside break, price sitting below both EMAs and under the old swing low. The wick into 2,587.76 looks like sell-side liquidity taken, with sellers likely to retest that low. Any bounce runs into 2,695 to 2,700, the last opposing candle before the selloff. Acceptance above 2,700 would weaken this read; until then the 2,587.76 low stays the magnet. Did that wick mark the low, or just reload the sellers? More reads like this land daily in the group, bio has the way in. #Altcoin Season#
$ETH swept 2,587.76 in a single hour wick, and that fast a reclaim is the one thing on this chart that does not fit a clean breakdown. Structure is still bearish after the downside break, price sitting below both EMAs and under the old swing low. The wick into 2,587.76 looks like sell-side liquidity taken, with sellers likely to retest that low. Any bounce runs into 2,695 to 2,700, the last opposing candle before the selloff. Acceptance above 2,700 would weaken this read; until then the 2,587.76 low stays the magnet. Did that wick mark the low, or just reload the sellers? More reads like this land daily in the group, bio has the way in. #Altcoin Season#
42
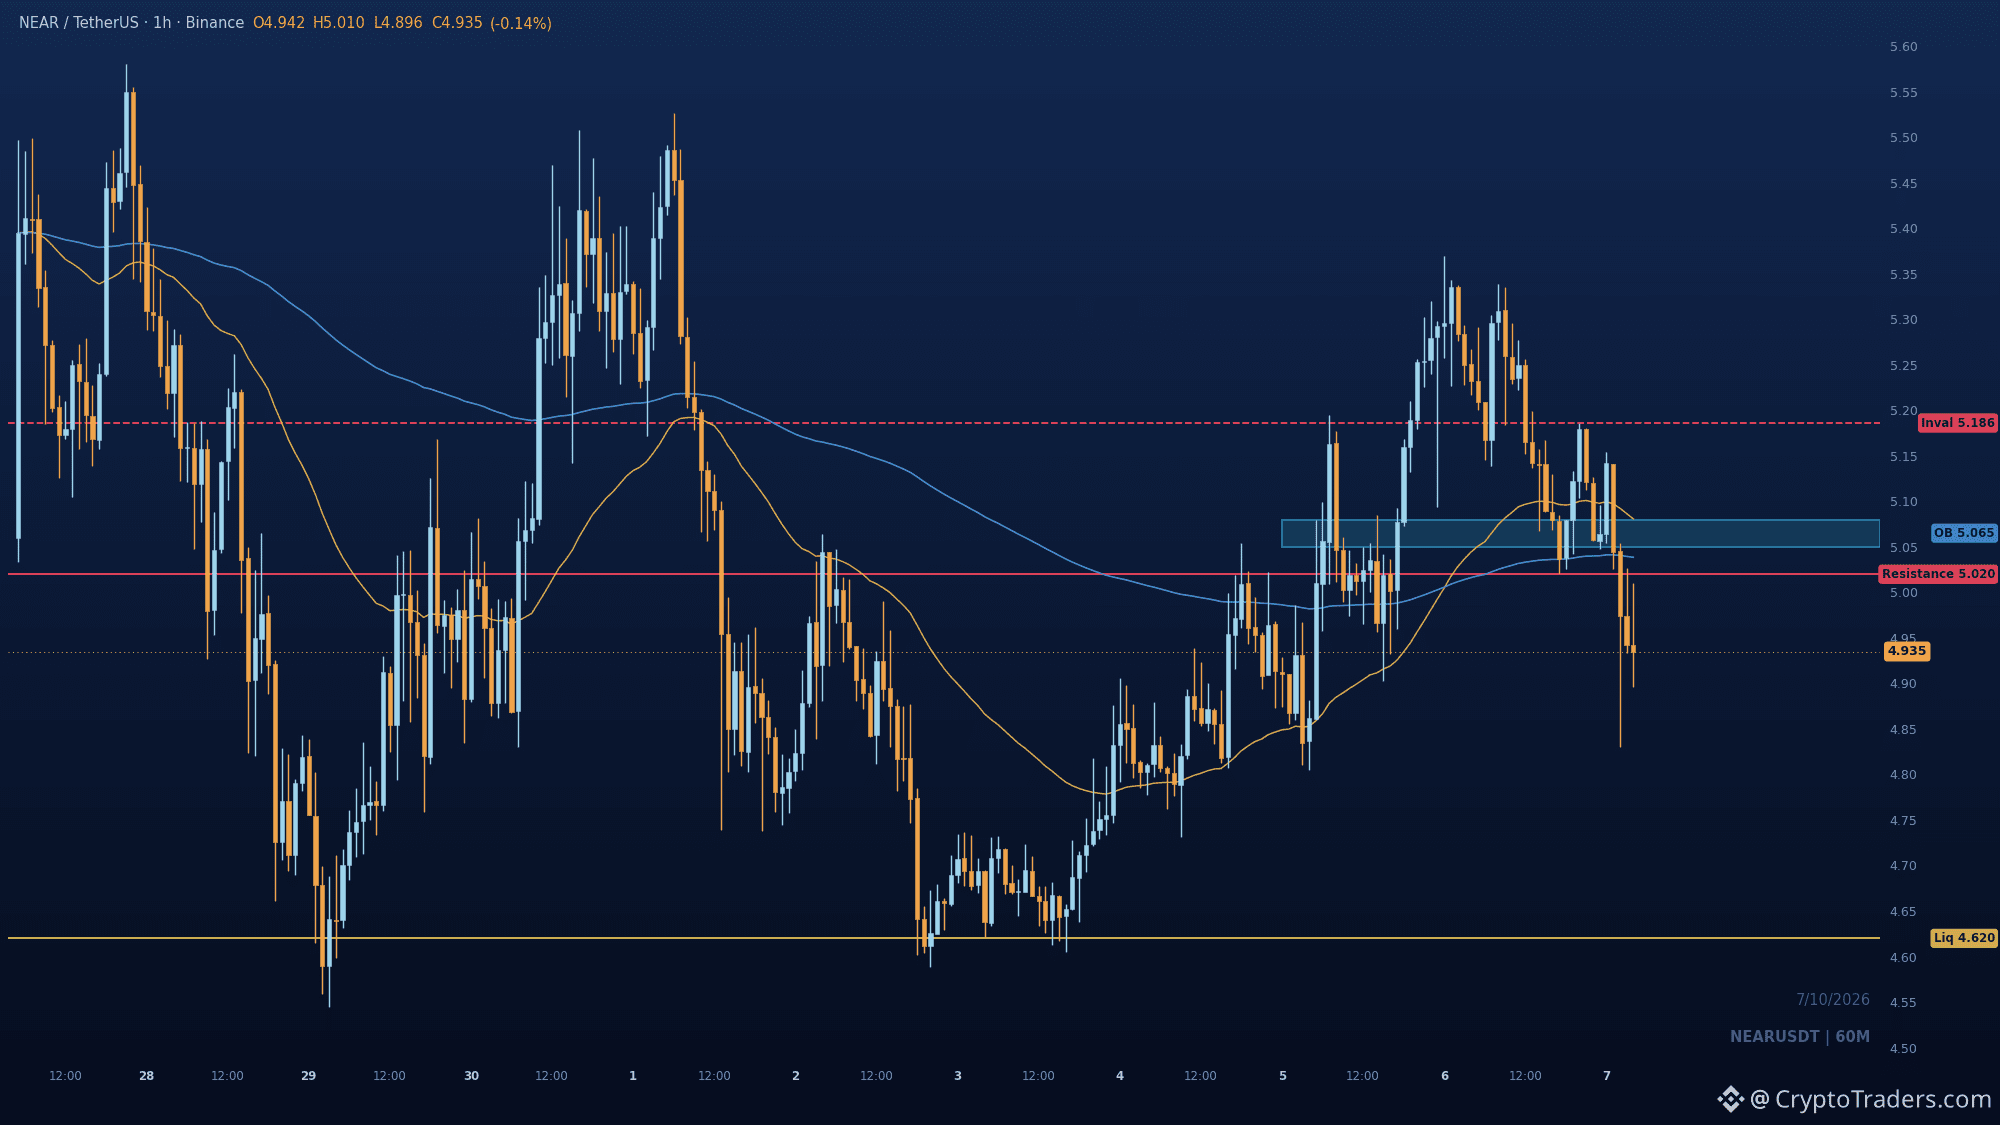
5.02. That is the level $NEAR needs to fail on any bounce, and sellers just broke it. Price got rejected at 5.35 and lost the 5.02 swing low, now sitting at 4.94 below both EMAs. The 5.02 to 5.08 block is the retest zone, the last bullish candle before the selloff plus the broken swing low stacked together. If that retest gets sold over the next few hours, 4.62 is where the sell-side liquidity sits. Reclaiming 5.186 flips this back to constructive and voids the setup. Do you think 5.02 gets retested today or does price slide straight to 4.62? We post reads like this every day in the group, details in bio. #Altcoin Season#
5.02. That is the level $NEAR needs to fail on any bounce, and sellers just broke it. Price got rejected at 5.35 and lost the 5.02 swing low, now sitting at 4.94 below both EMAs. The 5.02 to 5.08 block is the retest zone, the last bullish candle before the selloff plus the broken swing low stacked together. If that retest gets sold over the next few hours, 4.62 is where the sell-side liquidity sits. Reclaiming 5.186 flips this back to constructive and voids the setup. Do you think 5.02 gets retested today or does price slide straight to 4.62? We post reads like this every day in the group, details in bio. #Altcoin Season#
55
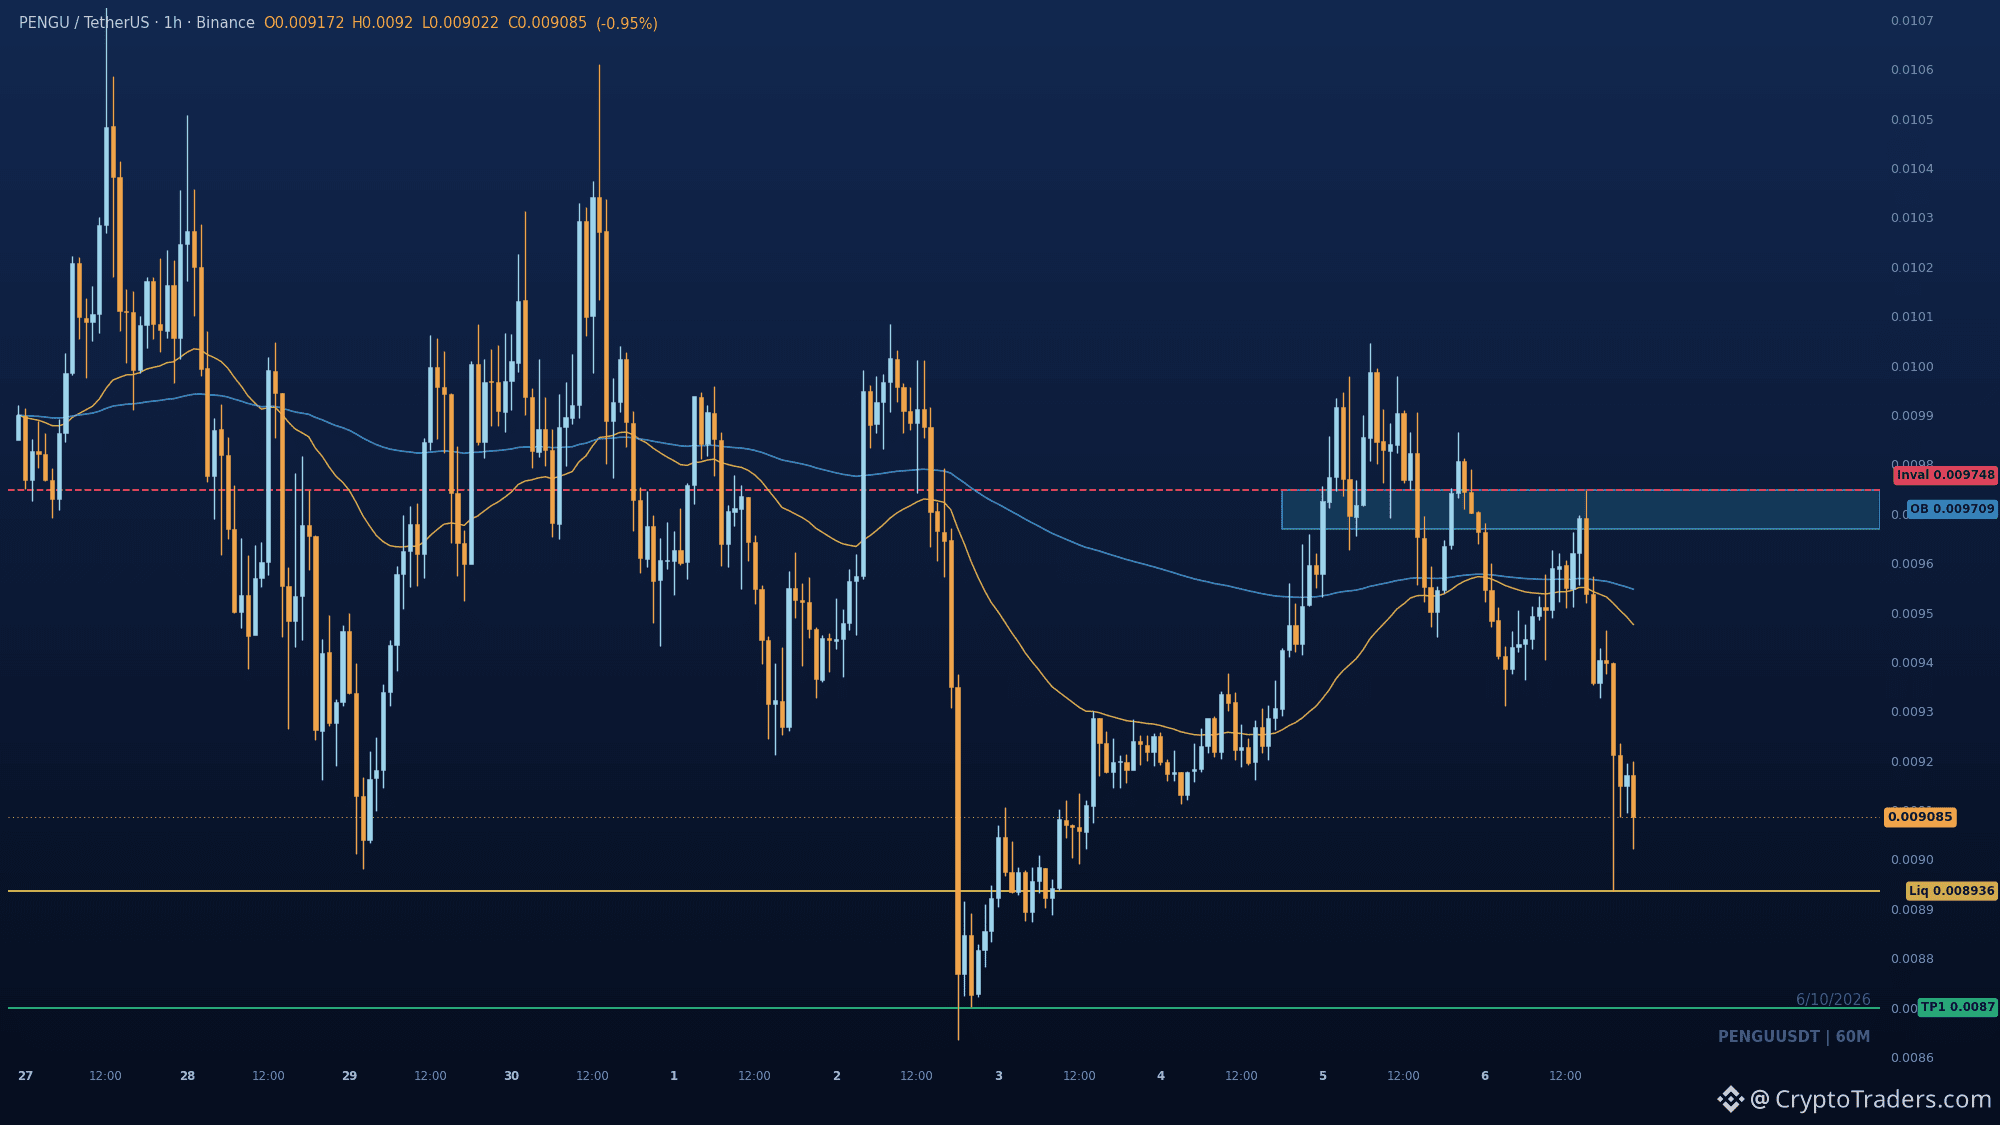
$PENGU just broke down through local support, and the 0.008936 low is the level that already caught the last flush earlier in this window. Sellers rejected price under both EMAs and drove the sharp leg lower, leaving the chart in discount with bearish structure intact. A weak bounce likely retests 0.00947 to 0.00955 beneath the EMAs before sellers press back down. Losing 0.008936 on a close favors continuation toward the prior window low near 0.0087. Only a reclaim of 0.009748, the last bullish candle before this selloff, flips the read. Do you think 0.008936 holds as a floor, or does it give way to 0.0087? More reads like this land daily in the group, bio has the way in. #Altcoin Season#
$PENGU just broke down through local support, and the 0.008936 low is the level that already caught the last flush earlier in this window. Sellers rejected price under both EMAs and drove the sharp leg lower, leaving the chart in discount with bearish structure intact. A weak bounce likely retests 0.00947 to 0.00955 beneath the EMAs before sellers press back down. Losing 0.008936 on a close favors continuation toward the prior window low near 0.0087. Only a reclaim of 0.009748, the last bullish candle before this selloff, flips the read. Do you think 0.008936 holds as a floor, or does it give way to 0.0087? More reads like this land daily in the group, bio has the way in. #Altcoin Season#
84
Bitcoin sits at 85,620 while its biggest corporate buyer pivots to buybacks, not coins 📉 1⃣ Strategy's wallet went quiet: the firm spent 176.3 million buying back its 12 percent STRC preferred stock while picking up only 28.7 million of $BTC between October 1 and 4. Treasury accumulation now competes with preferred-share support for the same capital. 2⃣ ETF demand is thinning at the edges: U.S. spot Bitcoin ETFs saw 89.8 million in net outflows on October 5 even as 69.9 million flowed into BlackRock's IBIT. ARKB and FBTC bled, so the aggregate picture leans on one vehicle. 3⃣ Regulated rails keep widening: the CFTC opened consultation on an optional federal pathway for retail margin and leverage, and OKX with NYSE owner ICE filed for tokenized shares of 63 listed companies with dividends and voting rights. No approvals yet, but distribution and fee competition could shift. Marginal buyers are pulling back just as the plumbing around them loosens up. Which of these three threads matters most for the next leg? Reads like this land every day in the group, bio shows the way in. #BTC Price Analysis# #Bitcoin Price Prediction: What is Bitcoins next move?# #Macro Insights#
Bitcoin sits at 85,620 while its biggest corporate buyer pivots to buybacks, not coins 📉 1⃣ Strategy's wallet went quiet: the firm spent 176.3 million buying back its 12 percent STRC preferred stock while picking up only 28.7 million of $BTC between October 1 and 4. Treasury accumulation now competes with preferred-share support for the same capital. 2⃣ ETF demand is thinning at the edges: U.S. spot Bitcoin ETFs saw 89.8 million in net outflows on October 5 even as 69.9 million flowed into BlackRock's IBIT. ARKB and FBTC bled, so the aggregate picture leans on one vehicle. 3⃣ Regulated rails keep widening: the CFTC opened consultation on an optional federal pathway for retail margin and leverage, and OKX with NYSE owner ICE filed for tokenized shares of 63 listed companies with dividends and voting rights. No approvals yet, but distribution and fee competition could shift. Marginal buyers are pulling back just as the plumbing around them loosens up. Which of these three threads matters most for the next leg? Reads like this land every day in the group, bio shows the way in. #BTC Price Analysis# #Bitcoin Price Prediction: What is Bitcoins next move?# #Macro Insights#
8
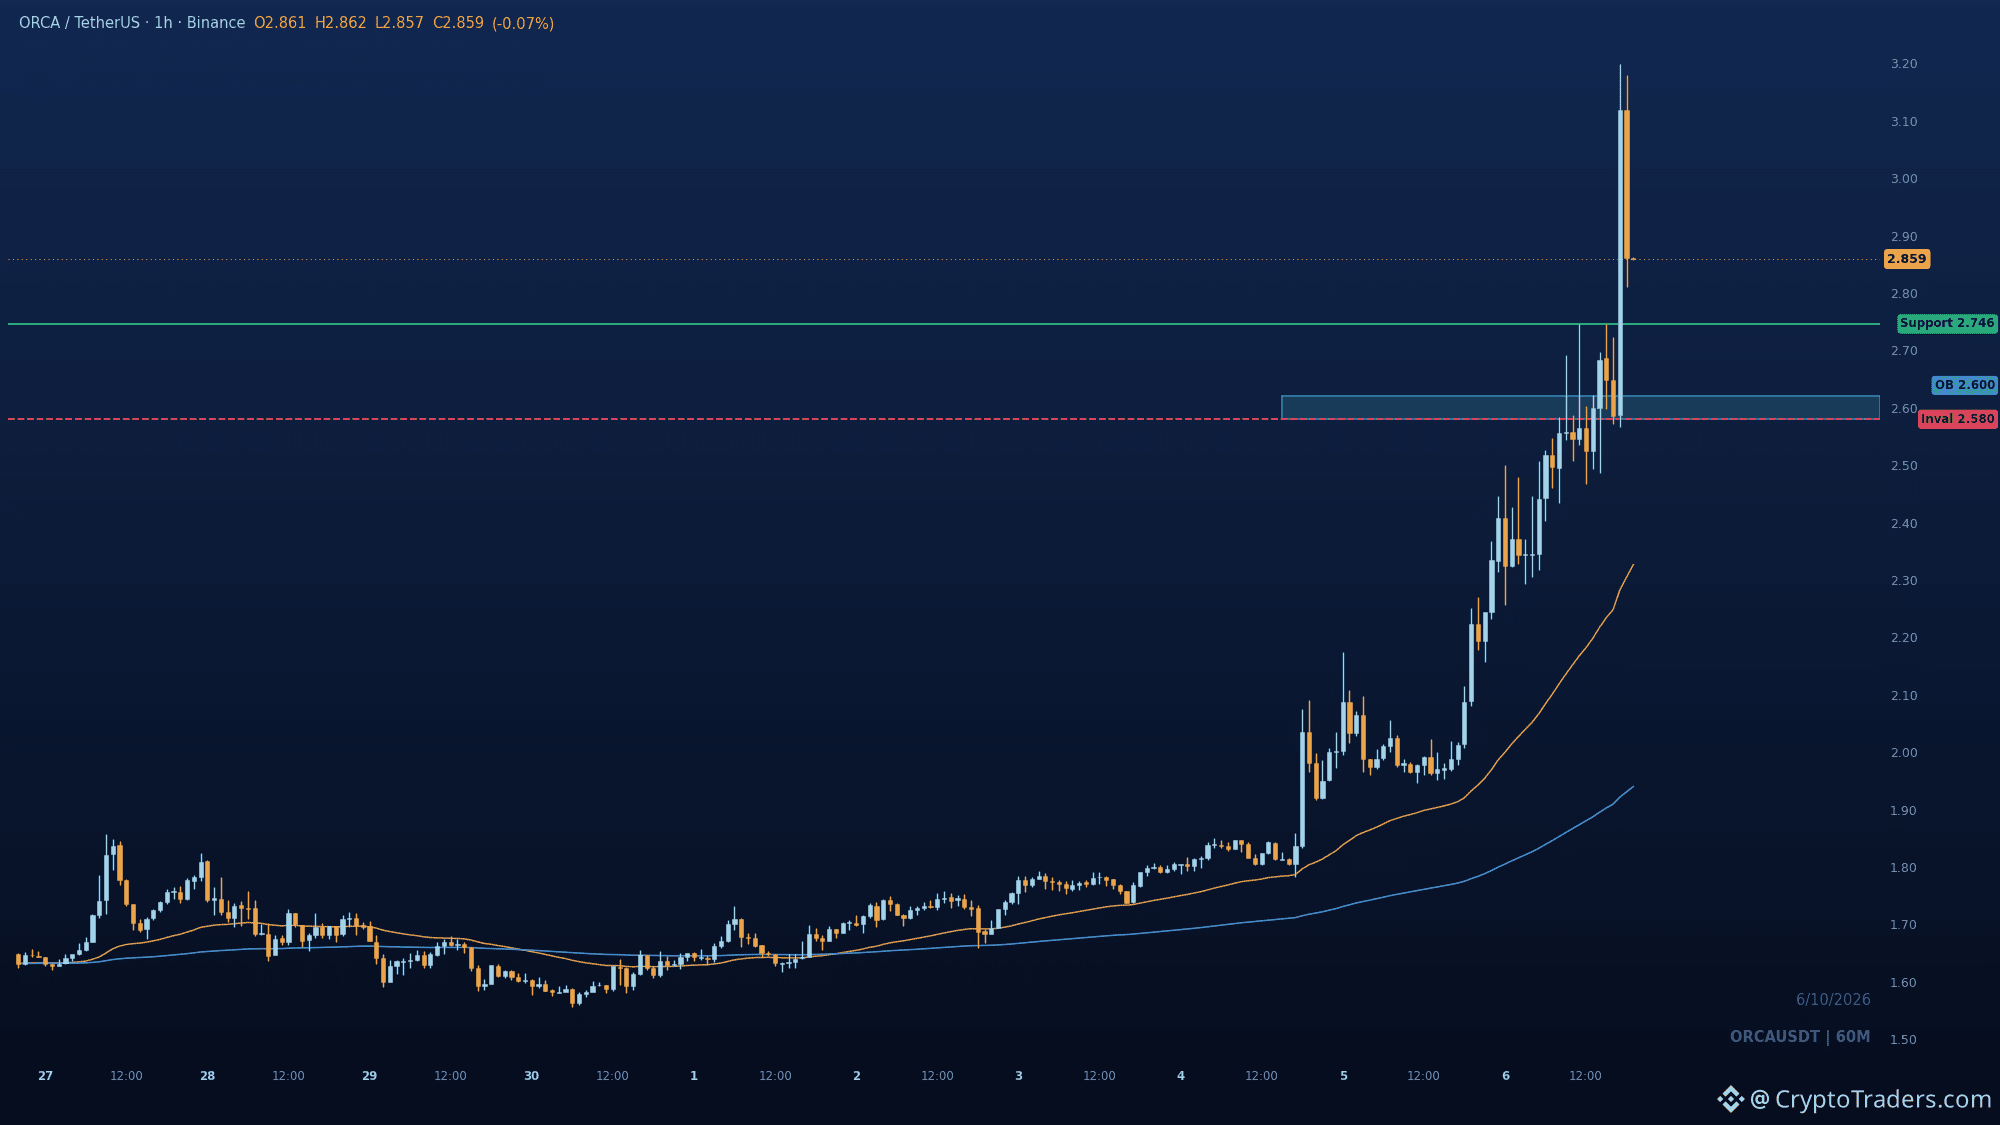
$ORCA is up 37% and now the market has to decide between holding above 2.746 or sliding back into the 2.58-2.62 block. Price broke the 2.746 swing high with real displacement, so that level flipped from resistance to the line bulls need to defend. A hold and reclaim there keeps the uptrend intact toward fresh highs, since no higher structural pool is visible in this window. Losing 2.58 would invalidate the breakout and put the impulse back in question. What would you need to see on the next candle before trusting either side? We post reads like this every day in the group, so check the bio for more. #Altcoin Season#
$ORCA is up 37% and now the market has to decide between holding above 2.746 or sliding back into the 2.58-2.62 block. Price broke the 2.746 swing high with real displacement, so that level flipped from resistance to the line bulls need to defend. A hold and reclaim there keeps the uptrend intact toward fresh highs, since no higher structural pool is visible in this window. Losing 2.58 would invalidate the breakout and put the impulse back in question. What would you need to see on the next candle before trusting either side? We post reads like this every day in the group, so check the bio for more. #Altcoin Season#
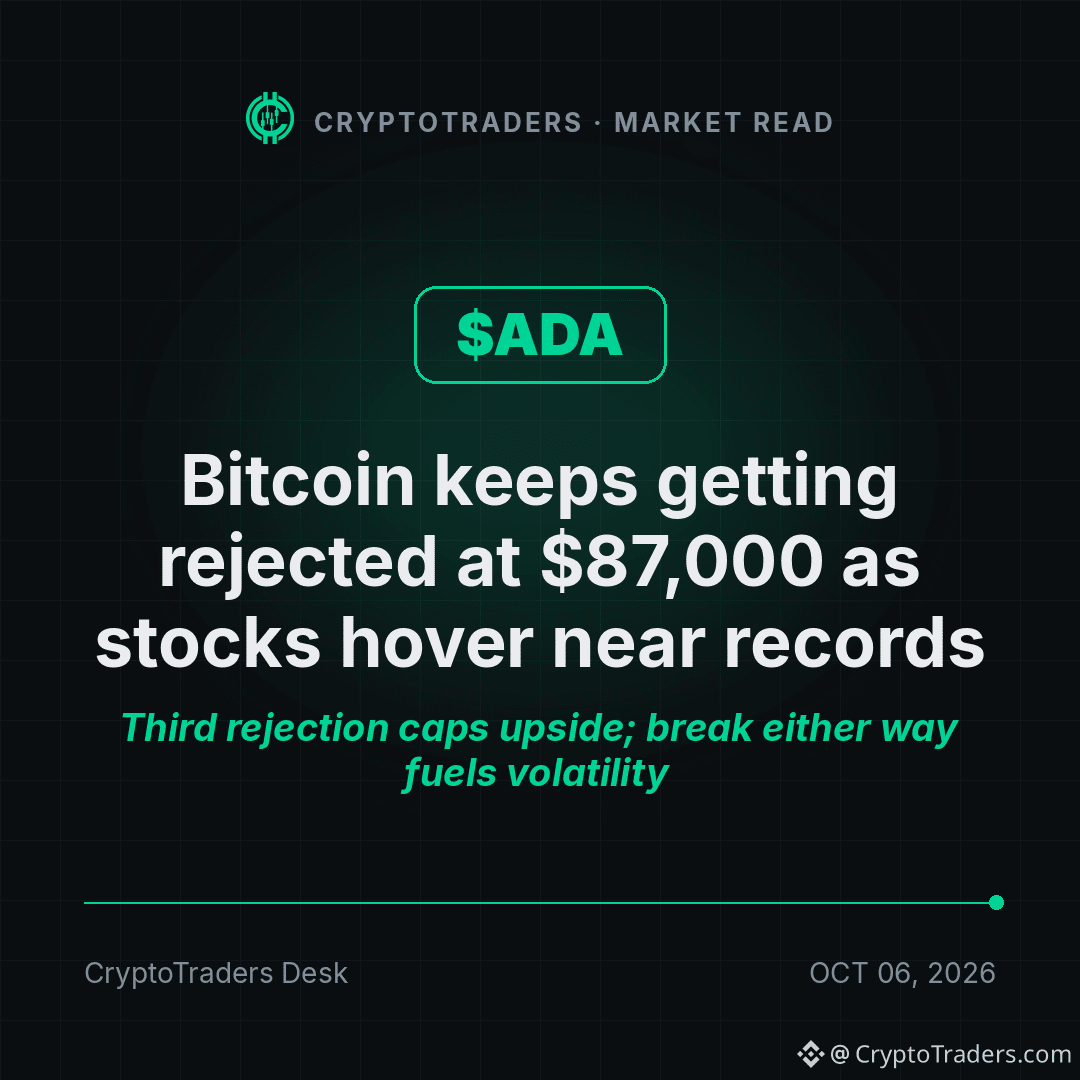
Bitcoin keeps banging its head on 87,000 while $ADA quietly rips 11% 📈 Highlights: ▪ BTC fell 1.2% to about 85,600 after its third rejection near 87,000 since Sept. 23 ▪ Total crypto market cap slipped to 2.93 trillion ▪ ADA gained 11% on the day, standing out against the majors ▪ Major stock indexes stayed near records while crypto cooled My Take ADA's 11% move is a relative-strength outlier in a tape where BTC is stuck in a narrowing triangle. 🟢 That kind of divergence often draws attention when the broader market is flat. 🔴 It also means ADA is extended while BTC sets the direction, and a downside break drags everything. 🟡 No new fundamental catalyst here, just a short-term technical read. Do you treat ADA's strength as real rotation or just a beta bounce off BTC's range? More reads like this land in the group every day, the bio has the way in. #Altcoin Season# #Macro Insights#
Bitcoin keeps banging its head on 87,000 while $ADA quietly rips 11% 📈 Highlights: ▪ BTC fell 1.2% to about 85,600 after its third rejection near 87,000 since Sept. 23 ▪ Total crypto market cap slipped to 2.93 trillion ▪ ADA gained 11% on the day, standing out against the majors ▪ Major stock indexes stayed near records while crypto cooled My Take ADA's 11% move is a relative-strength outlier in a tape where BTC is stuck in a narrowing triangle. 🟢 That kind of divergence often draws attention when the broader market is flat. 🔴 It also means ADA is extended while BTC sets the direction, and a downside break drags everything. 🟡 No new fundamental catalyst here, just a short-term technical read. Do you treat ADA's strength as real rotation or just a beta bounce off BTC's range? More reads like this land in the group every day, the bio has the way in. #Altcoin Season# #Macro Insights#
30
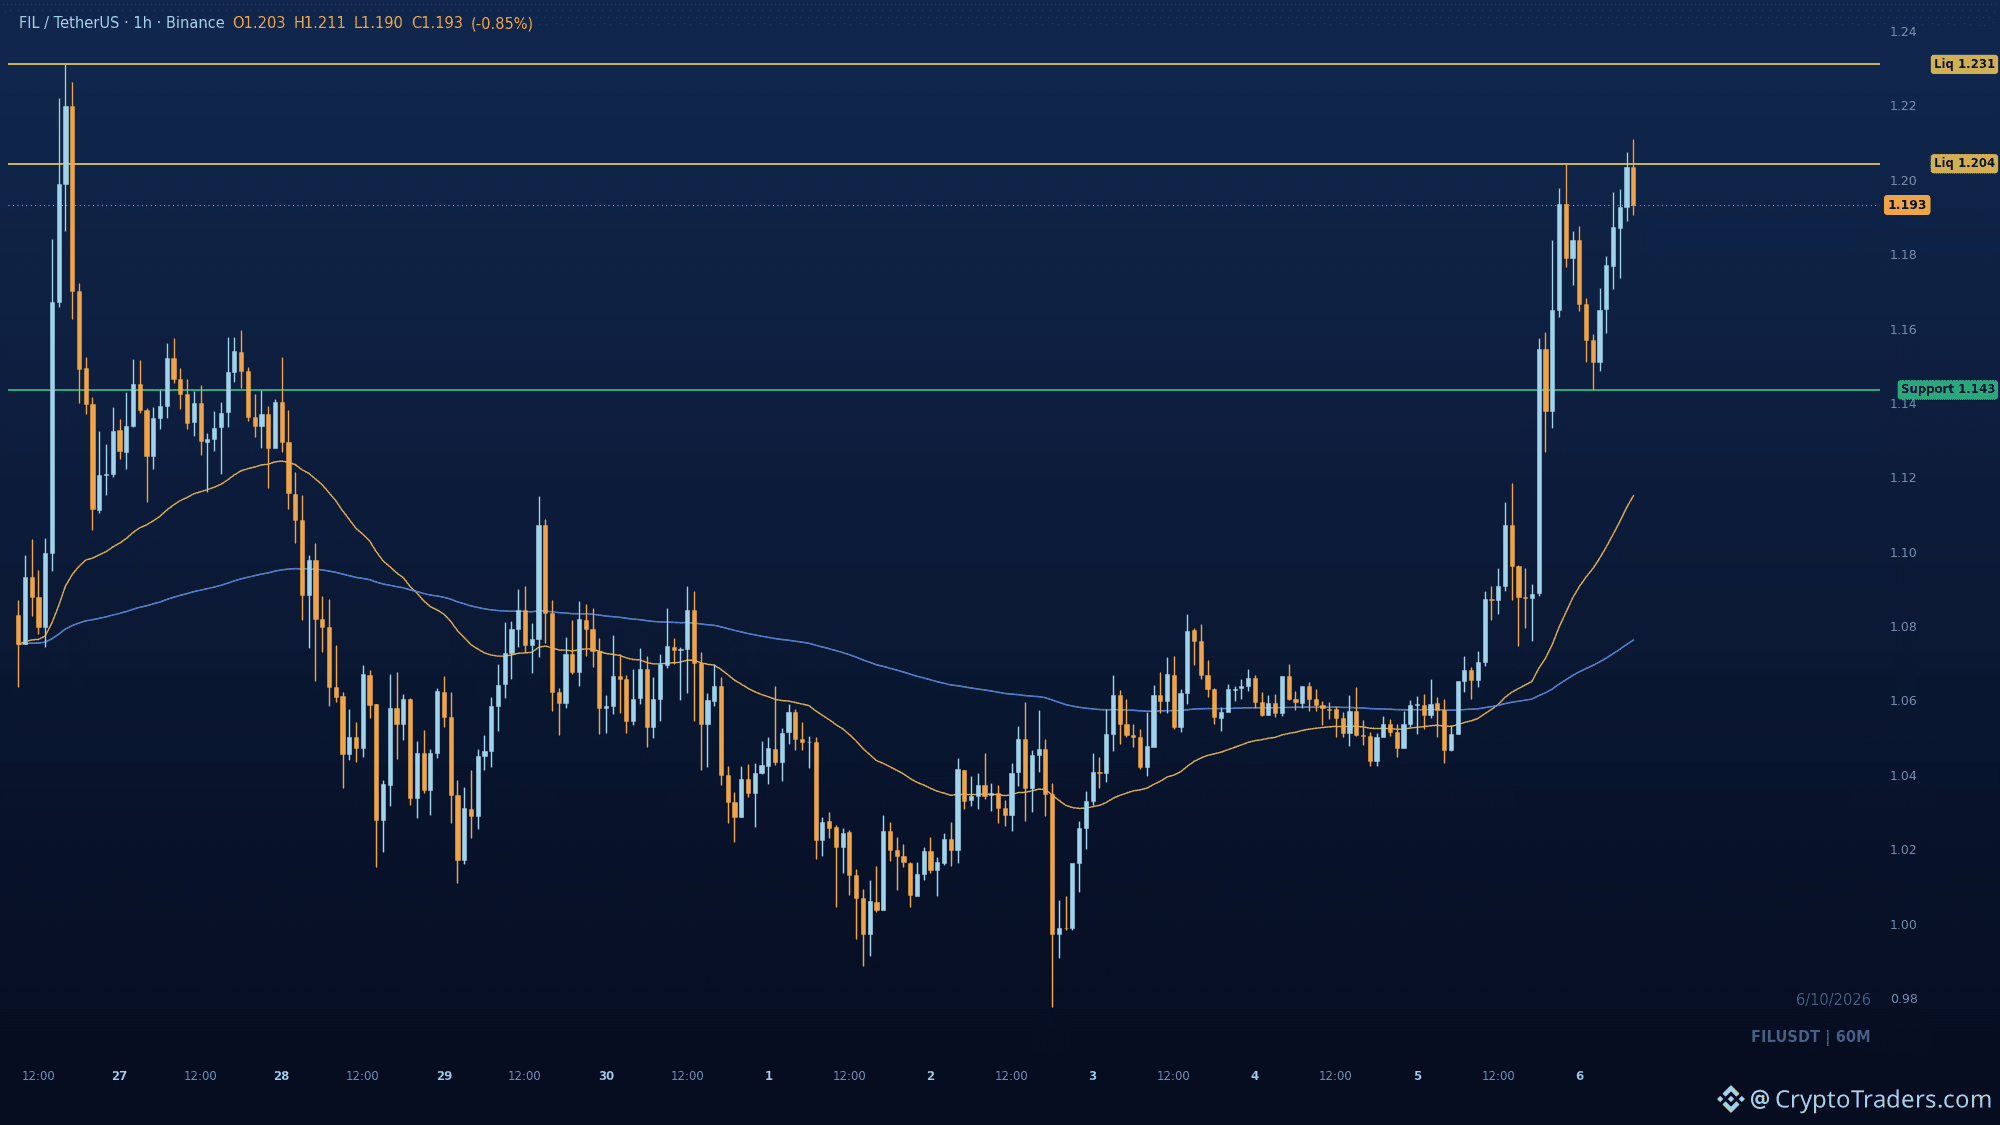
$FIL is pinned under 1.2043, and that exact level is what capped price earlier in this window before buyers finally took structure. That break above the prior highs is the tell: the base near the range lows failed to hold sellers down, and the rally came in impulsive. 1.2043 is buy-side liquidity sitting right on top of spot. Clear it and the prior window high at 1.231 is the next reference. If it rejects here, 1.1435 is the structural pullback to watch. Lose that and the reversal read is dead. How are you playing this one, breakout or waiting for the retrace? Plenty more reads like this land in our community every morning, details in the profile. #Altcoin Season#
$FIL is pinned under 1.2043, and that exact level is what capped price earlier in this window before buyers finally took structure. That break above the prior highs is the tell: the base near the range lows failed to hold sellers down, and the rally came in impulsive. 1.2043 is buy-side liquidity sitting right on top of spot. Clear it and the prior window high at 1.231 is the next reference. If it rejects here, 1.1435 is the structural pullback to watch. Lose that and the reversal read is dead. How are you playing this one, breakout or waiting for the retrace? Plenty more reads like this land in our community every morning, details in the profile. #Altcoin Season#
31
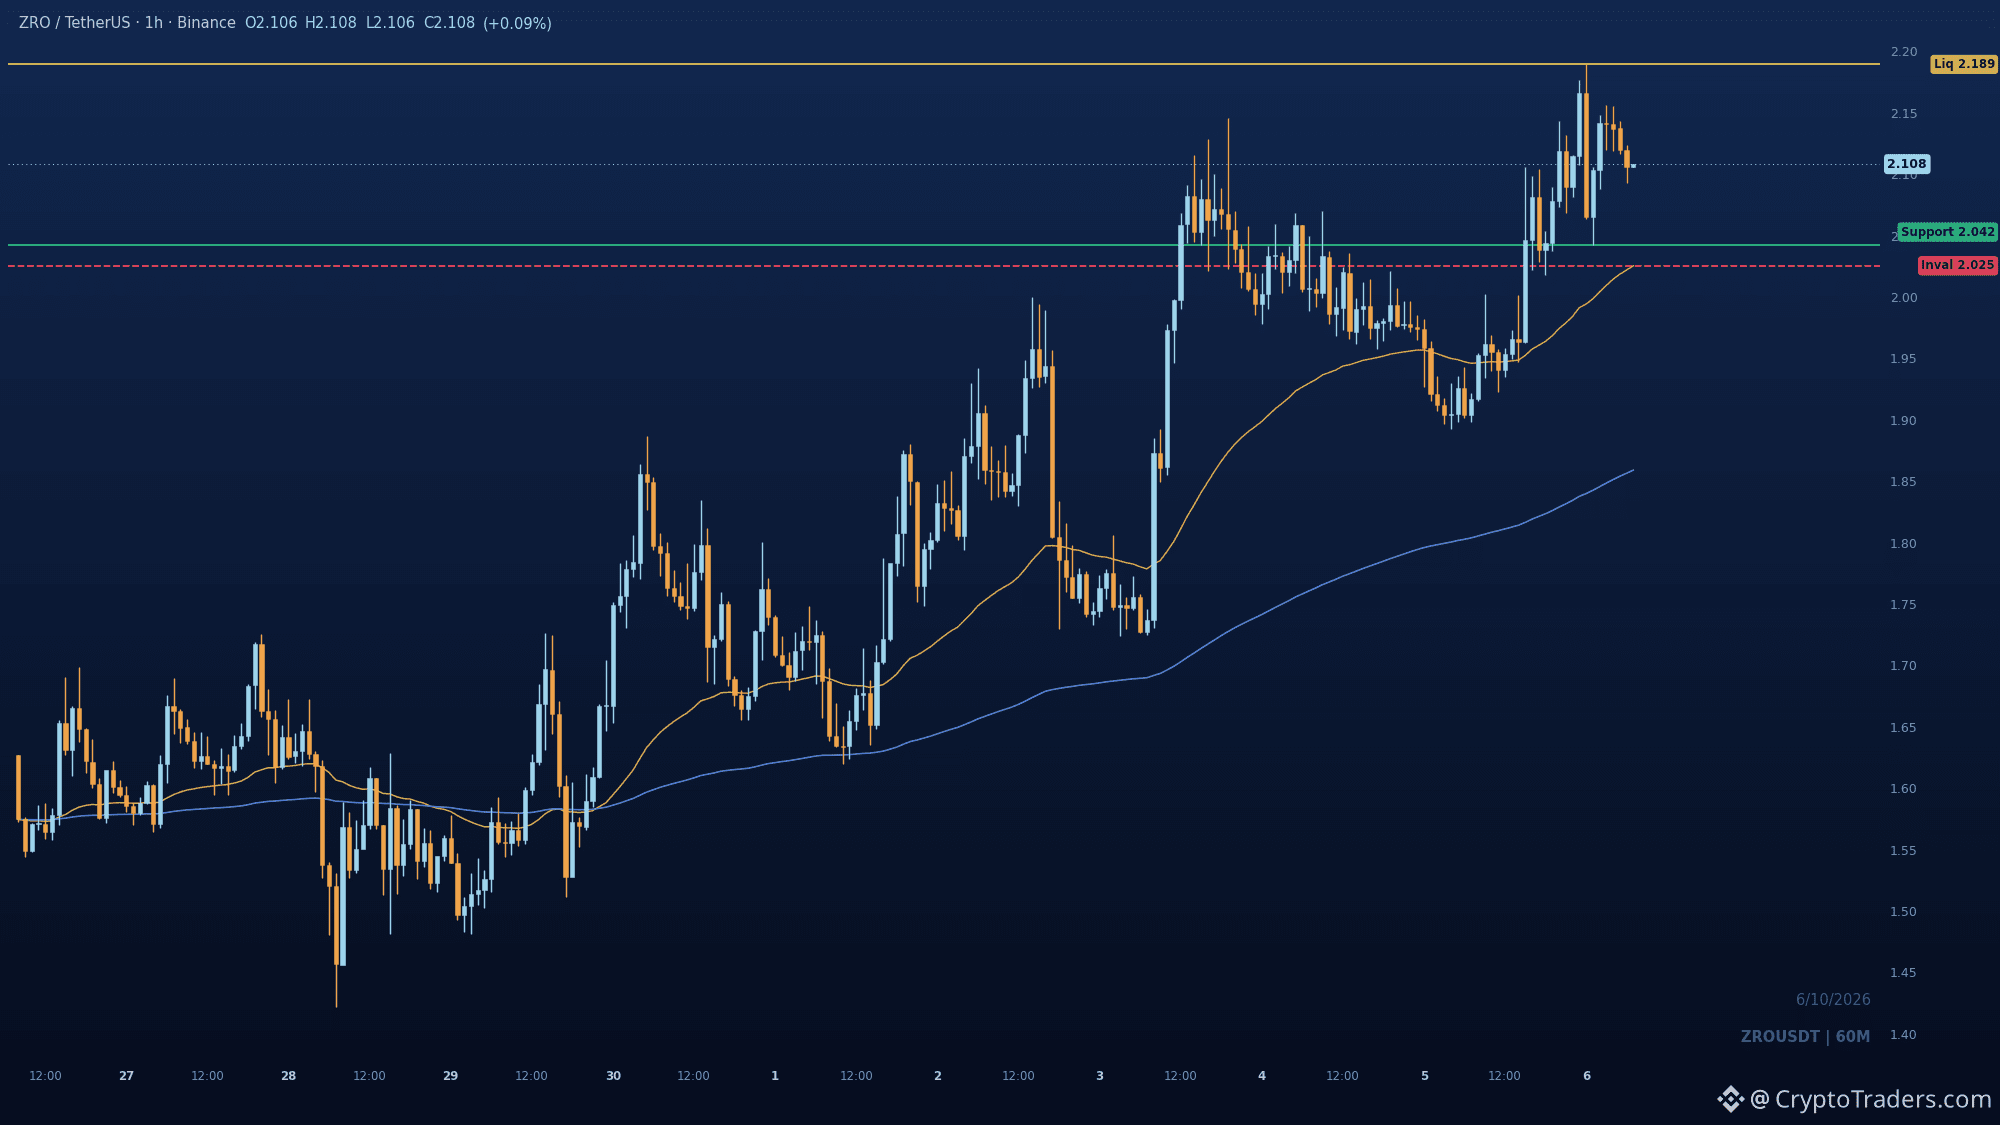
$ZRO just printed an upside break of structure on the 1h and is holding the retest above its rising EMAs. Buyers reclaimed the prior consolidation and the pullback is sitting on the 2.0422 swing low, not through it. That is the level I would lean on over 2.0254, because a hold there keeps the 2.1894 buy-side liquidity as the live draw. Lose 2.0254 and the whole expansion gets handed back. Which side of 2.0422 do you think gives first? More charts like this land in the group every day, bio has the way in. #Altcoin Season#
$ZRO just printed an upside break of structure on the 1h and is holding the retest above its rising EMAs. Buyers reclaimed the prior consolidation and the pullback is sitting on the 2.0422 swing low, not through it. That is the level I would lean on over 2.0254, because a hold there keeps the 2.1894 buy-side liquidity as the live draw. Lose 2.0254 and the whole expansion gets handed back. Which side of 2.0422 do you think gives first? More charts like this land in the group every day, bio has the way in. #Altcoin Season#
40
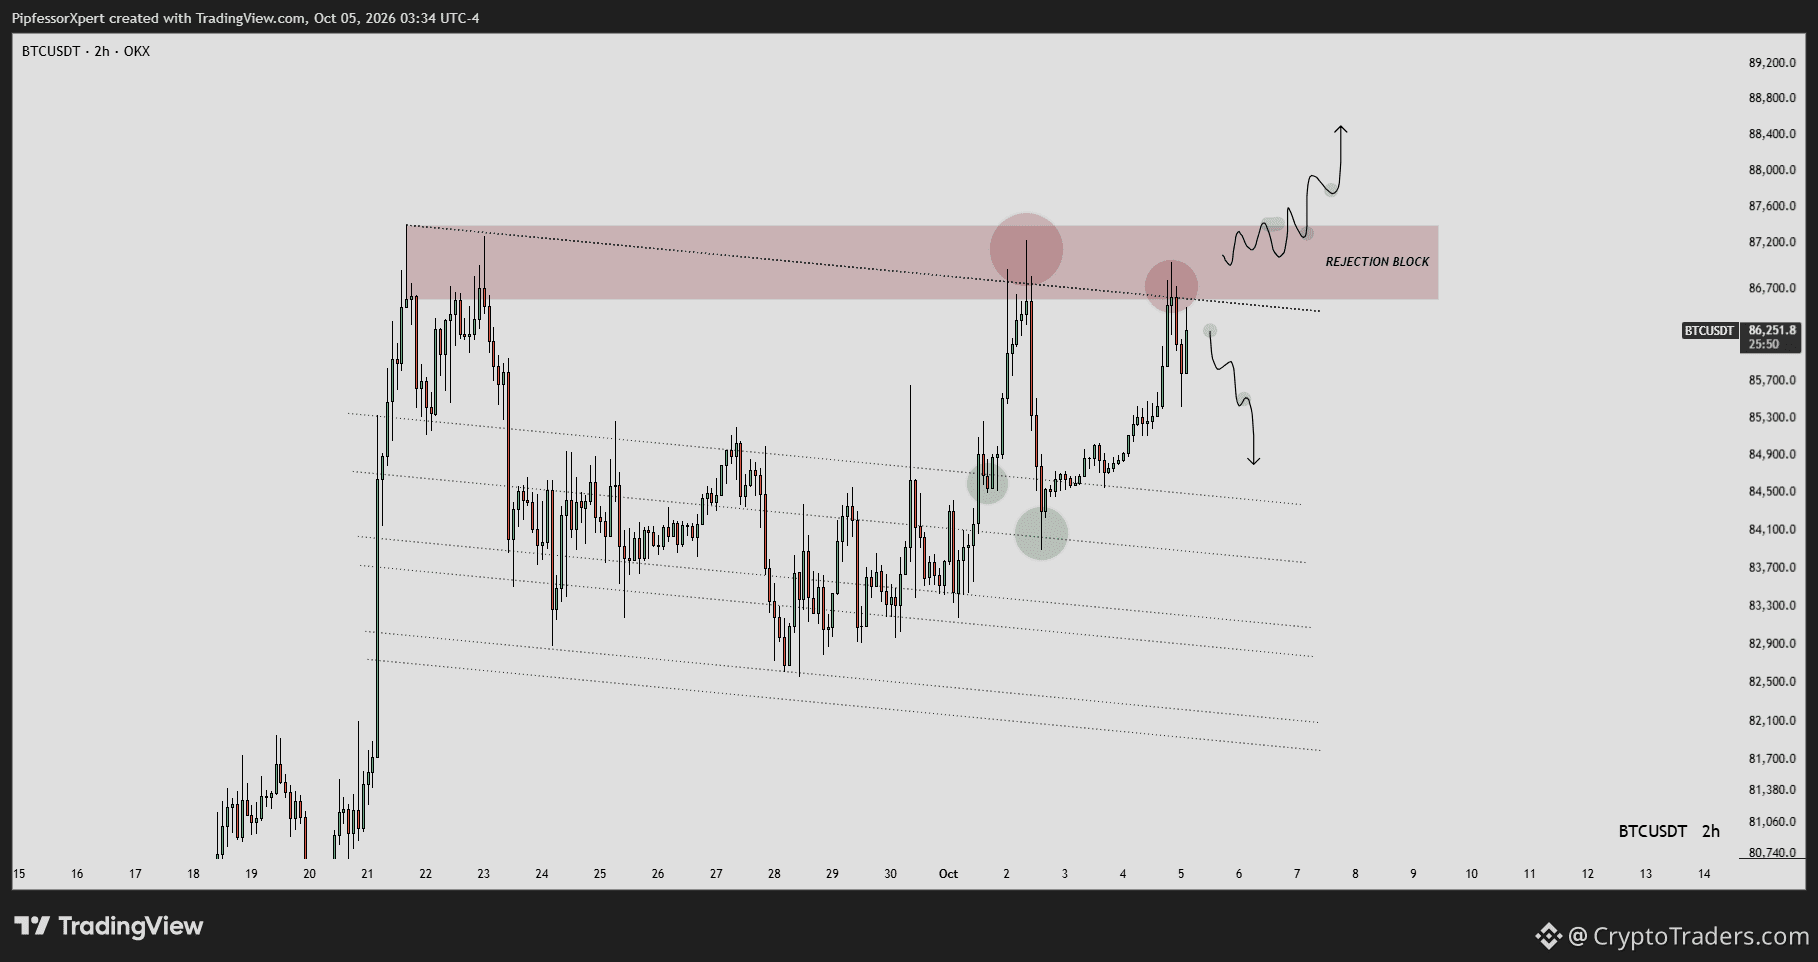
Everyone is reading this $BTC bounce as the start of something, but the chart still has sellers parked overhead. Price rallied out of the descending channel and straight into the 86,600 to 87,400 rejection block, with trendline resistance stacked on top of it. That zone is the whole battleground. Sellers have defended it repeatedly and are still capping upside here. 87K is the line that matters. A reclaim and hold above it confirms buyers absorbed the supply and opens continuation. Until then this is a bounce into resistance, not a breakout, and rejection keeps the downside scenario live. Are you treating 87K as the flip level or the fade level? More charts like this land daily in the group, bio has the way in. #BTC Price Analysis# #Bitcoin Price Prediction: What is Bitcoins next move?#
Everyone is reading this $BTC bounce as the start of something, but the chart still has sellers parked overhead. Price rallied out of the descending channel and straight into the 86,600 to 87,400 rejection block, with trendline resistance stacked on top of it. That zone is the whole battleground. Sellers have defended it repeatedly and are still capping upside here. 87K is the line that matters. A reclaim and hold above it confirms buyers absorbed the supply and opens continuation. Until then this is a bounce into resistance, not a breakout, and rejection keeps the downside scenario live. Are you treating 87K as the flip level or the fade level? More charts like this land daily in the group, bio has the way in. #BTC Price Analysis# #Bitcoin Price Prediction: What is Bitcoins next move?#
62
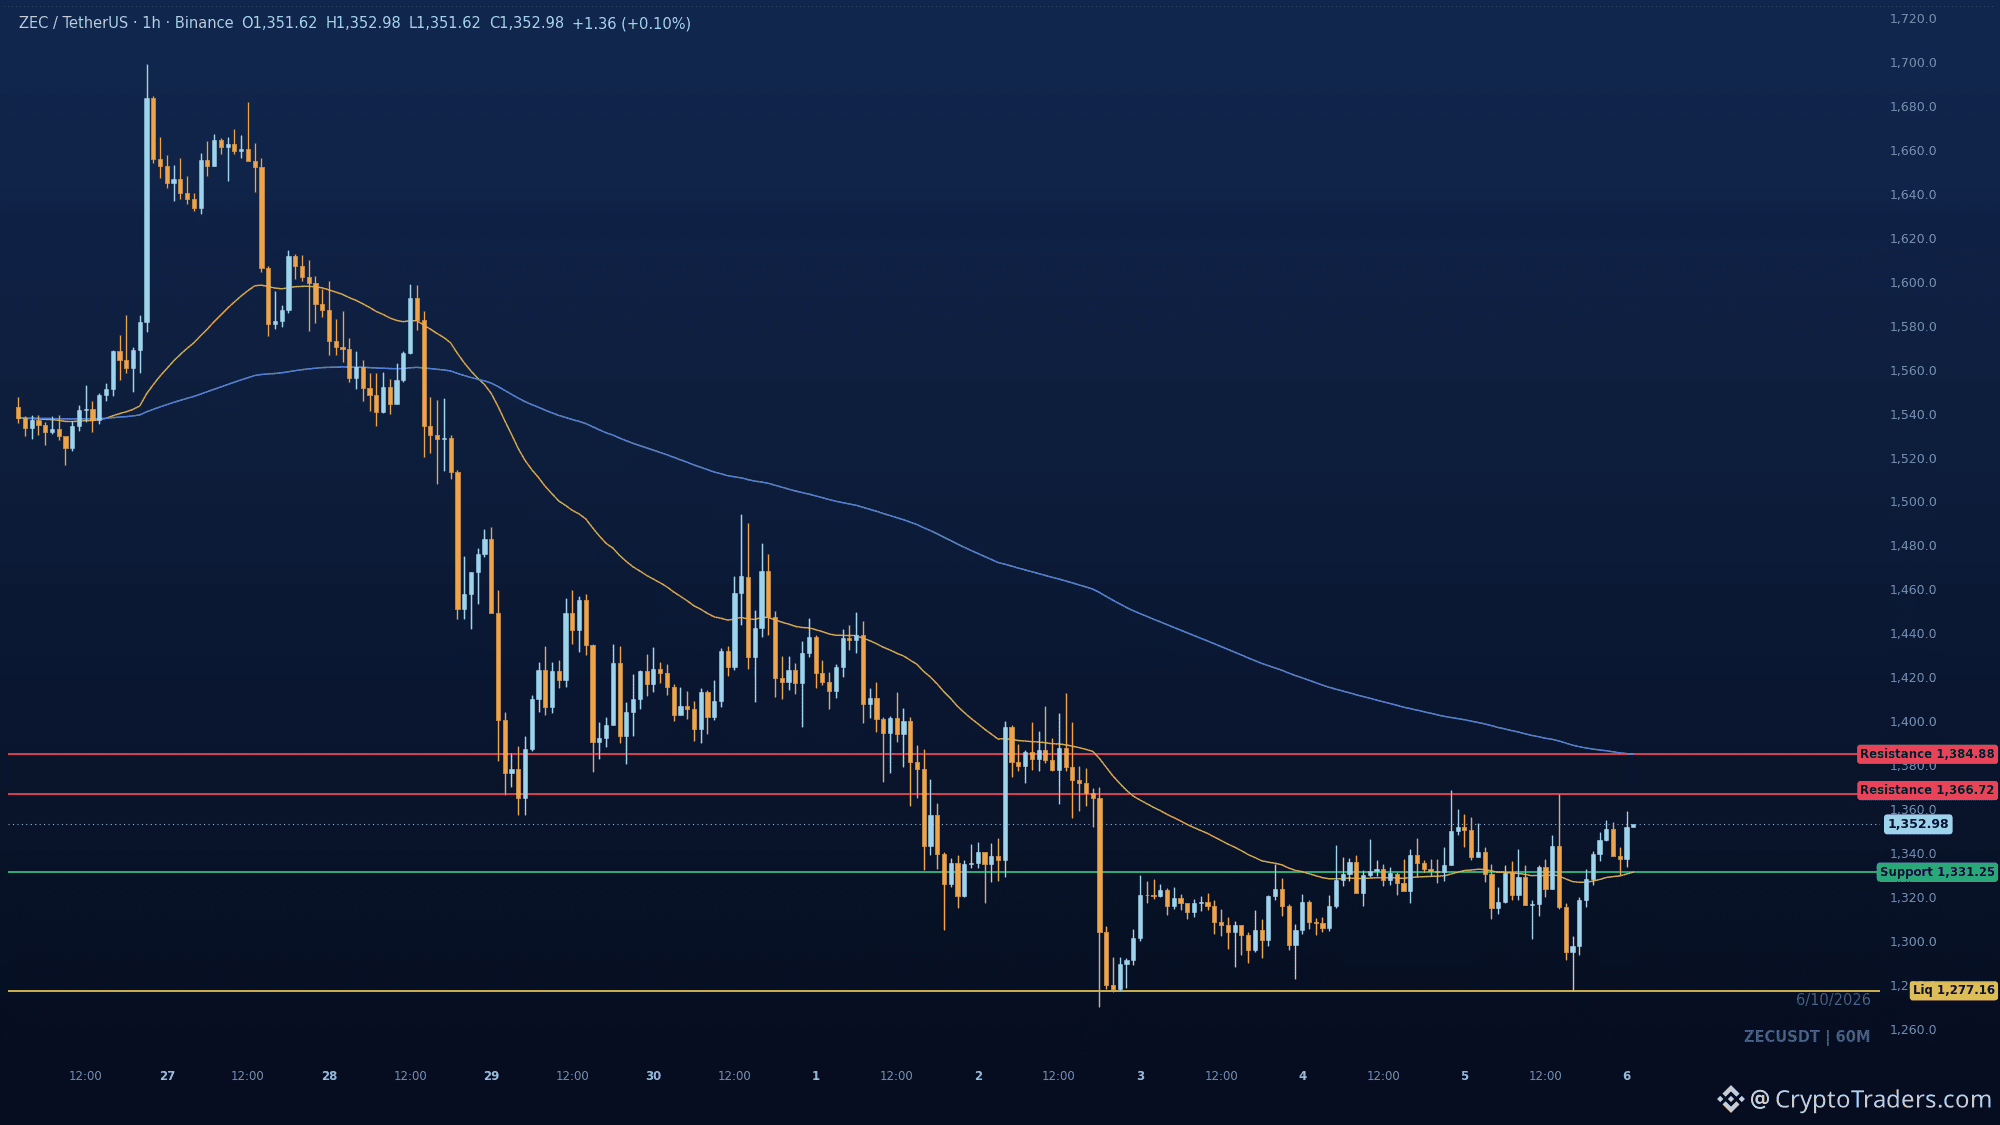
$ZEC swept the 1277 sell-side liquidity and bounced, but the rebound already stalled under the falling 200 EMA at 1384.88. The 1h structure still reads bearish: no confirmed break of structure, price capped below that overhead EMA the whole way up. First test is 1331.25, the 50 EMA. Holding it keeps a retest of 1366.72 in play. Losing 1331 turns the bounce into a lower high and puts 1277.16 back on the table. Continuation is the base case here. The surprise would be a clean reclaim of 1384.88. Are you treating this bounce as a lower high or the start of something? More reads like this land daily in the group, bio has the way in. #Altcoin Season#
$ZEC swept the 1277 sell-side liquidity and bounced, but the rebound already stalled under the falling 200 EMA at 1384.88. The 1h structure still reads bearish: no confirmed break of structure, price capped below that overhead EMA the whole way up. First test is 1331.25, the 50 EMA. Holding it keeps a retest of 1366.72 in play. Losing 1331 turns the bounce into a lower high and puts 1277.16 back on the table. Continuation is the base case here. The surprise would be a clean reclaim of 1384.88. Are you treating this bounce as a lower high or the start of something? More reads like this land daily in the group, bio has the way in. #Altcoin Season#
69
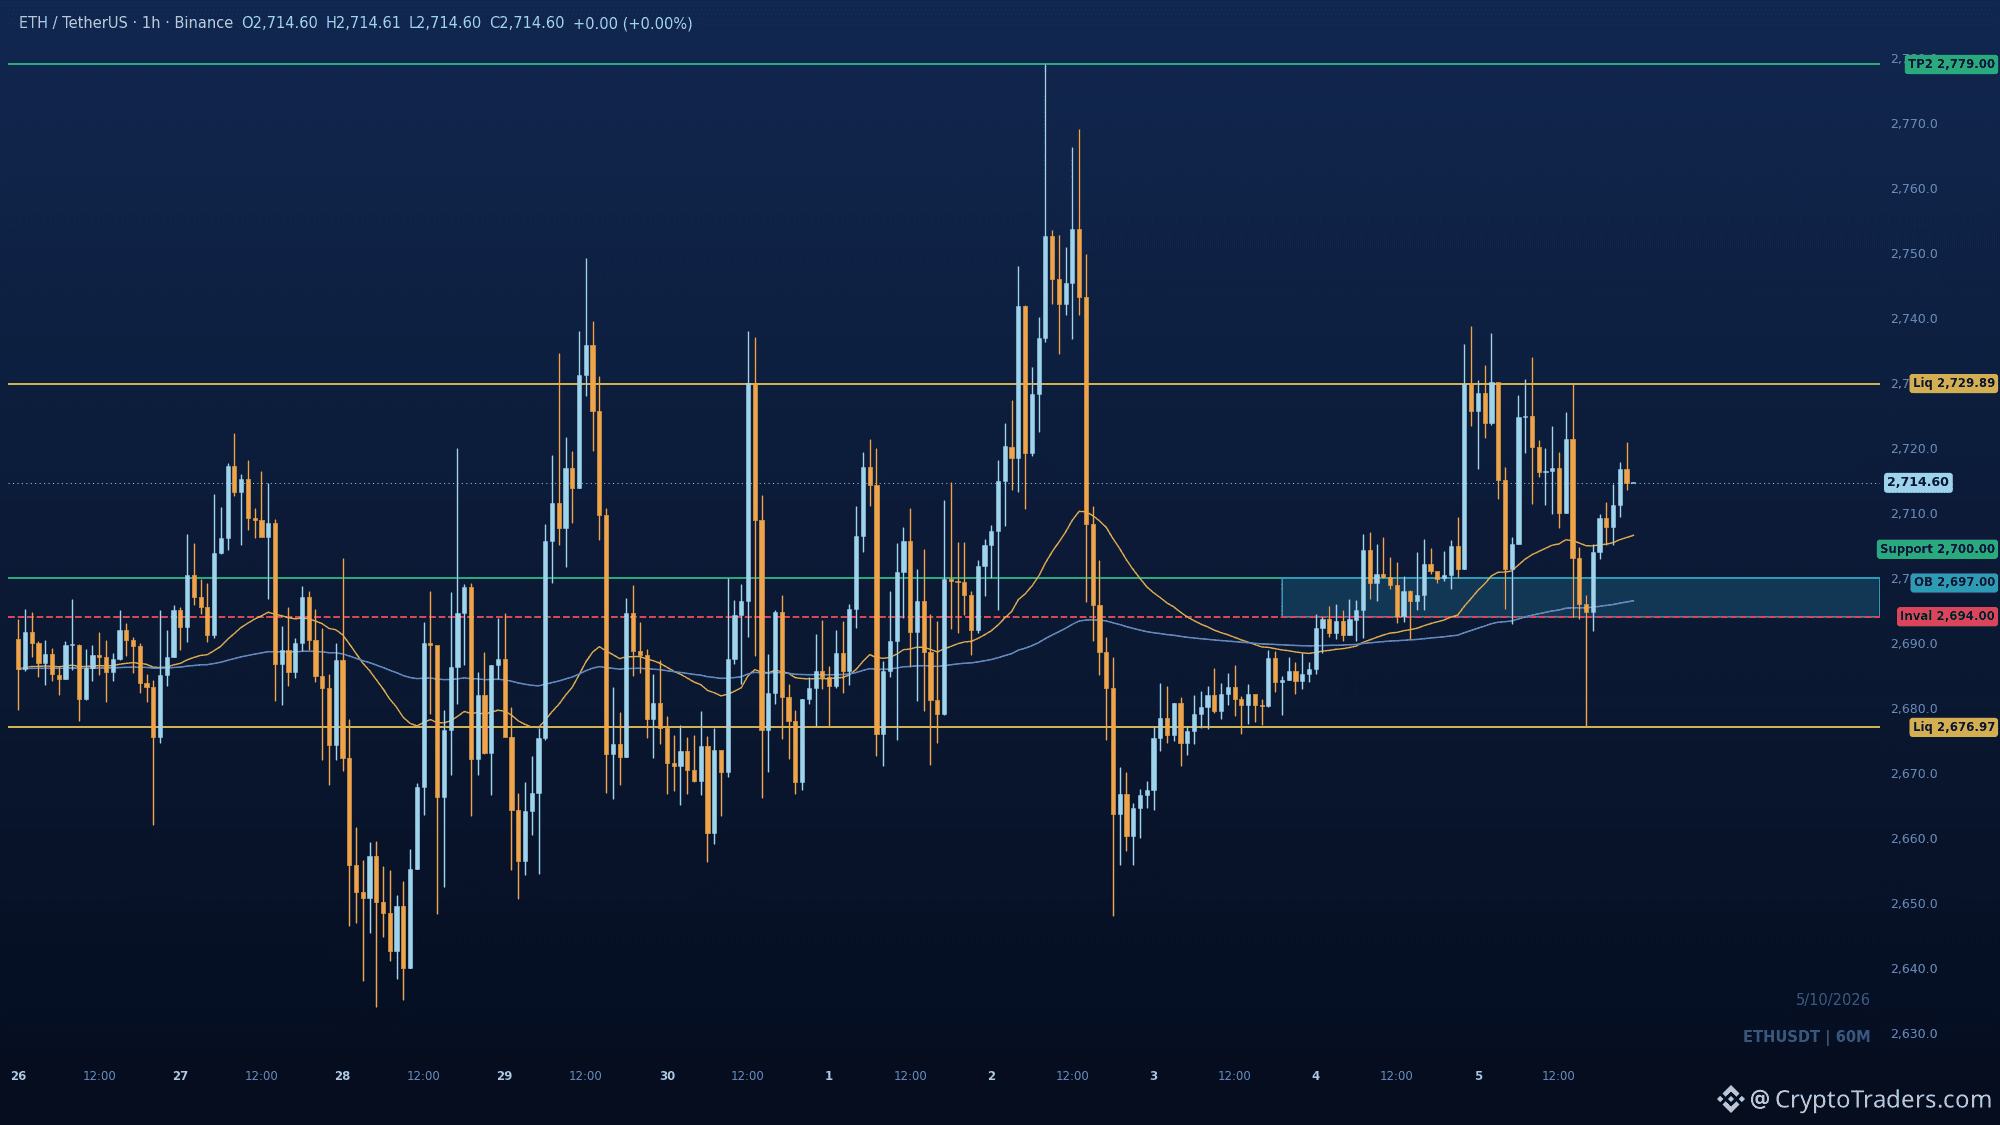
2,729.89. That number is the whole story on $ETH right now, and it is sitting less than 15 points above spot. The 1h reclaimed 2700 and has been printing higher lows above both EMAs since the sweep to 2660. Buy-side liquidity is stacked at that 2729.89 swing high. A clean break there, and 2779 is the next level in the visible range. Before that, expect a shallow dip into 2706 to 2700. That zone is the reclaimed level plus the bullish order block, so it should hold on a first test. Lose 2694 and the higher-low sequence is dead, with sell-side liquidity waiting at 2676.97. How long do you think price coils under 2729.89 before it takes the high? Charts like this land in the group every day, bio has the way in. #Altcoin Season#
2,729.89. That number is the whole story on $ETH right now, and it is sitting less than 15 points above spot. The 1h reclaimed 2700 and has been printing higher lows above both EMAs since the sweep to 2660. Buy-side liquidity is stacked at that 2729.89 swing high. A clean break there, and 2779 is the next level in the visible range. Before that, expect a shallow dip into 2706 to 2700. That zone is the reclaimed level plus the bullish order block, so it should hold on a first test. Lose 2694 and the higher-low sequence is dead, with sell-side liquidity waiting at 2676.97. How long do you think price coils under 2729.89 before it takes the high? Charts like this land in the group every day, bio has the way in. #Altcoin Season#
Hyperliquid just unlocked a revenue stream that does not need trading volume: $HYPE buybacks now have a second funding leg 📈 1⃣ **USDC interest arrives** Hyperliquid accrued 14.58 million in interest on its USDC reserves under the Coinbase-Circle arrangement. That single distribution equals roughly 26 percent of September's HYPE buybacks, and it scales with stablecoin balances and rates rather than market activity. 2⃣ **ETF demand is thinning** US spot Bitcoin ETFs pulled in only 82.9 million from September 28 to October 2, down 96.5 percent from the prior week's 2.386 billion. BlackRock's IBIT stayed positive while the rest bled, so non-ETF buyers matter more now. 3⃣ **ETH and SOL flows flipped** Tracked Ether funds swung to 106.8 million of net outflows after 589.5 million of inflows the week before. Solana went from 160 million of inflows to 4.6 million of outflows, with Bitwise's staking fund driving most of the reversal. The buyback engine is diversifying away from volume, which is the part of this story most people are still underpricing. Which matters more for HYPE here, the new interest stream or the broader flow retreat? Reads like this go up every day in the group, and the bio shows how to get in. #Altcoin Season# #Macro Insights#
Hyperliquid just unlocked a revenue stream that does not need trading volume: $HYPE buybacks now have a second funding leg 📈 1⃣ **USDC interest arrives** Hyperliquid accrued 14.58 million in interest on its USDC reserves under the Coinbase-Circle arrangement. That single distribution equals roughly 26 percent of September's HYPE buybacks, and it scales with stablecoin balances and rates rather than market activity. 2⃣ **ETF demand is thinning** US spot Bitcoin ETFs pulled in only 82.9 million from September 28 to October 2, down 96.5 percent from the prior week's 2.386 billion. BlackRock's IBIT stayed positive while the rest bled, so non-ETF buyers matter more now. 3⃣ **ETH and SOL flows flipped** Tracked Ether funds swung to 106.8 million of net outflows after 589.5 million of inflows the week before. Solana went from 160 million of inflows to 4.6 million of outflows, with Bitwise's staking fund driving most of the reversal. The buyback engine is diversifying away from volume, which is the part of this story most people are still underpricing. Which matters more for HYPE here, the new interest stream or the broader flow retreat? Reads like this go up every day in the group, and the bio shows how to get in. #Altcoin Season# #Macro Insights#
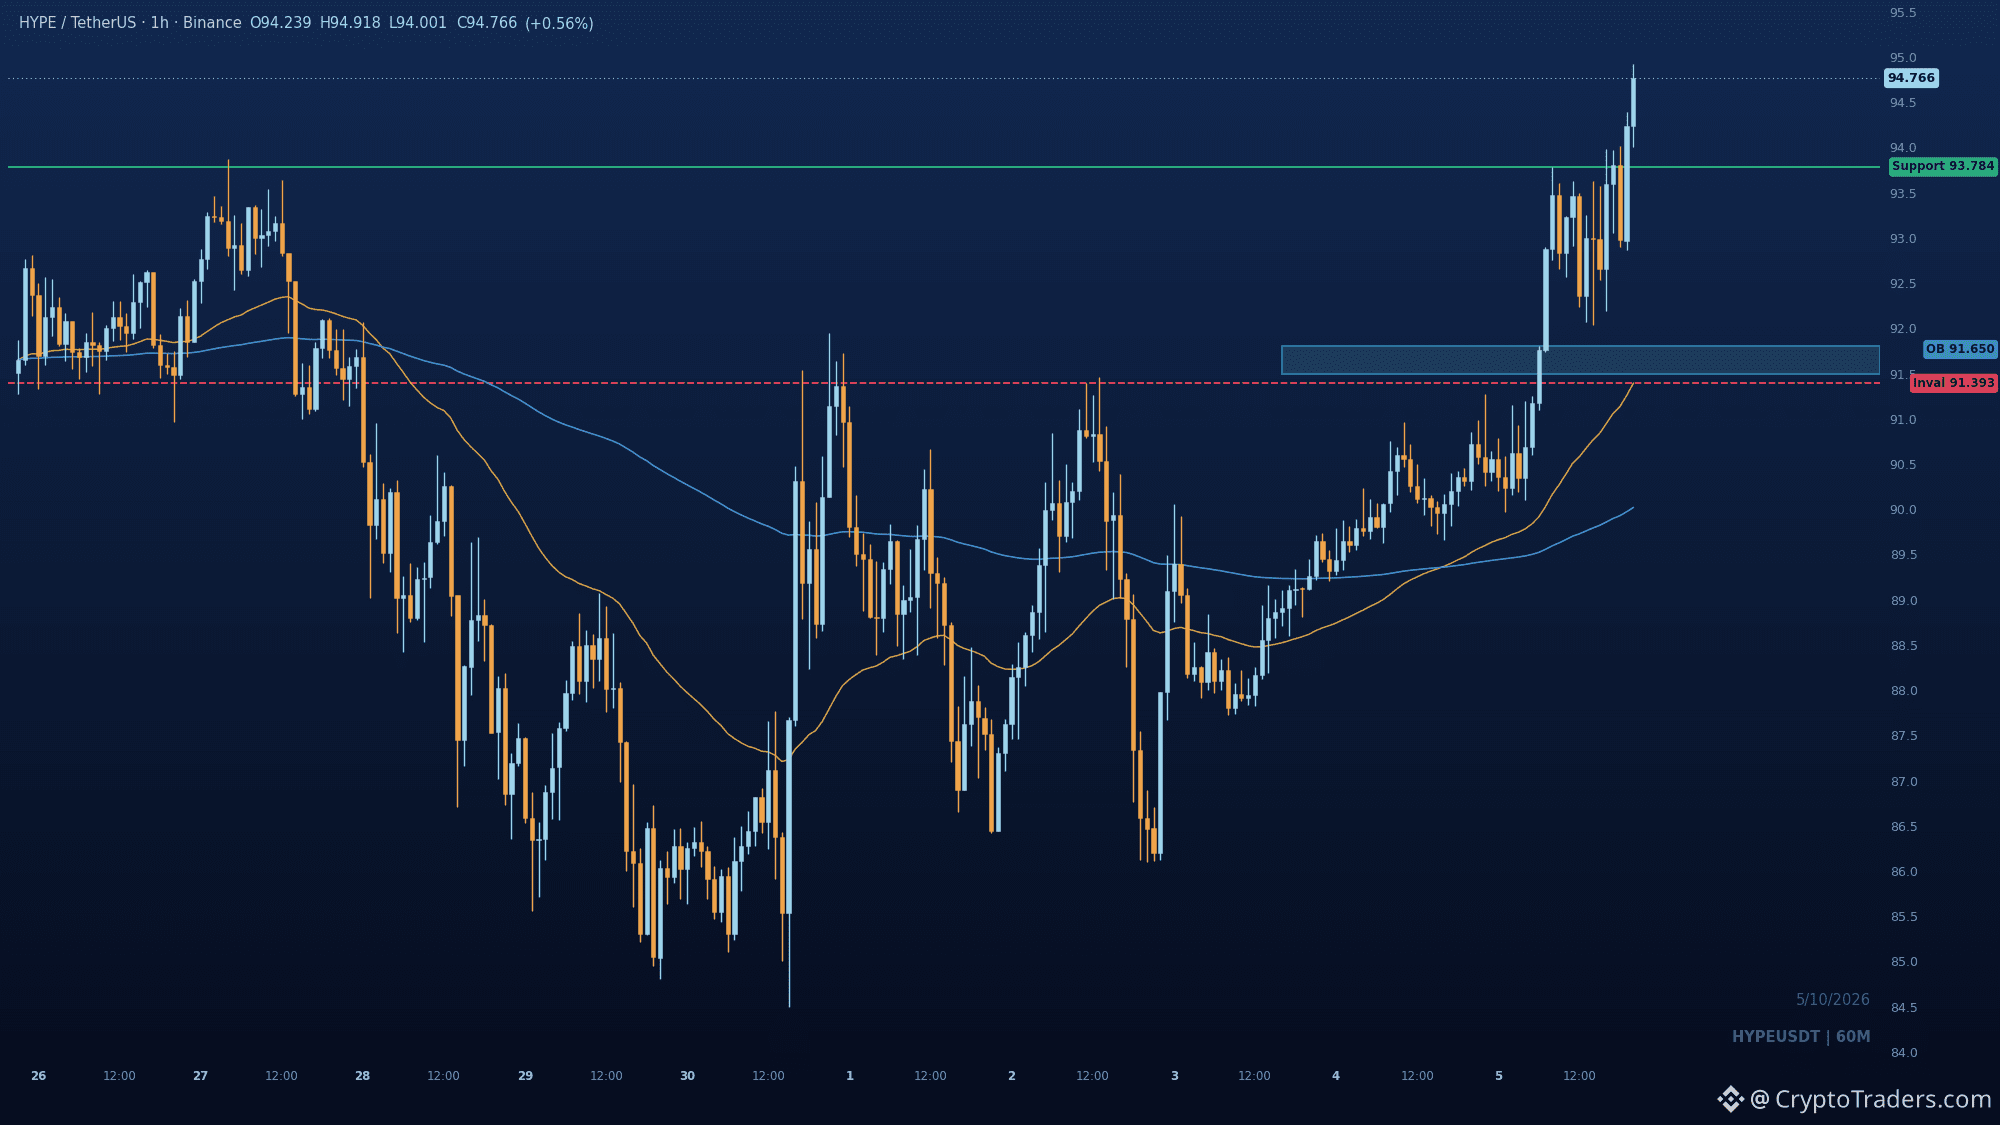
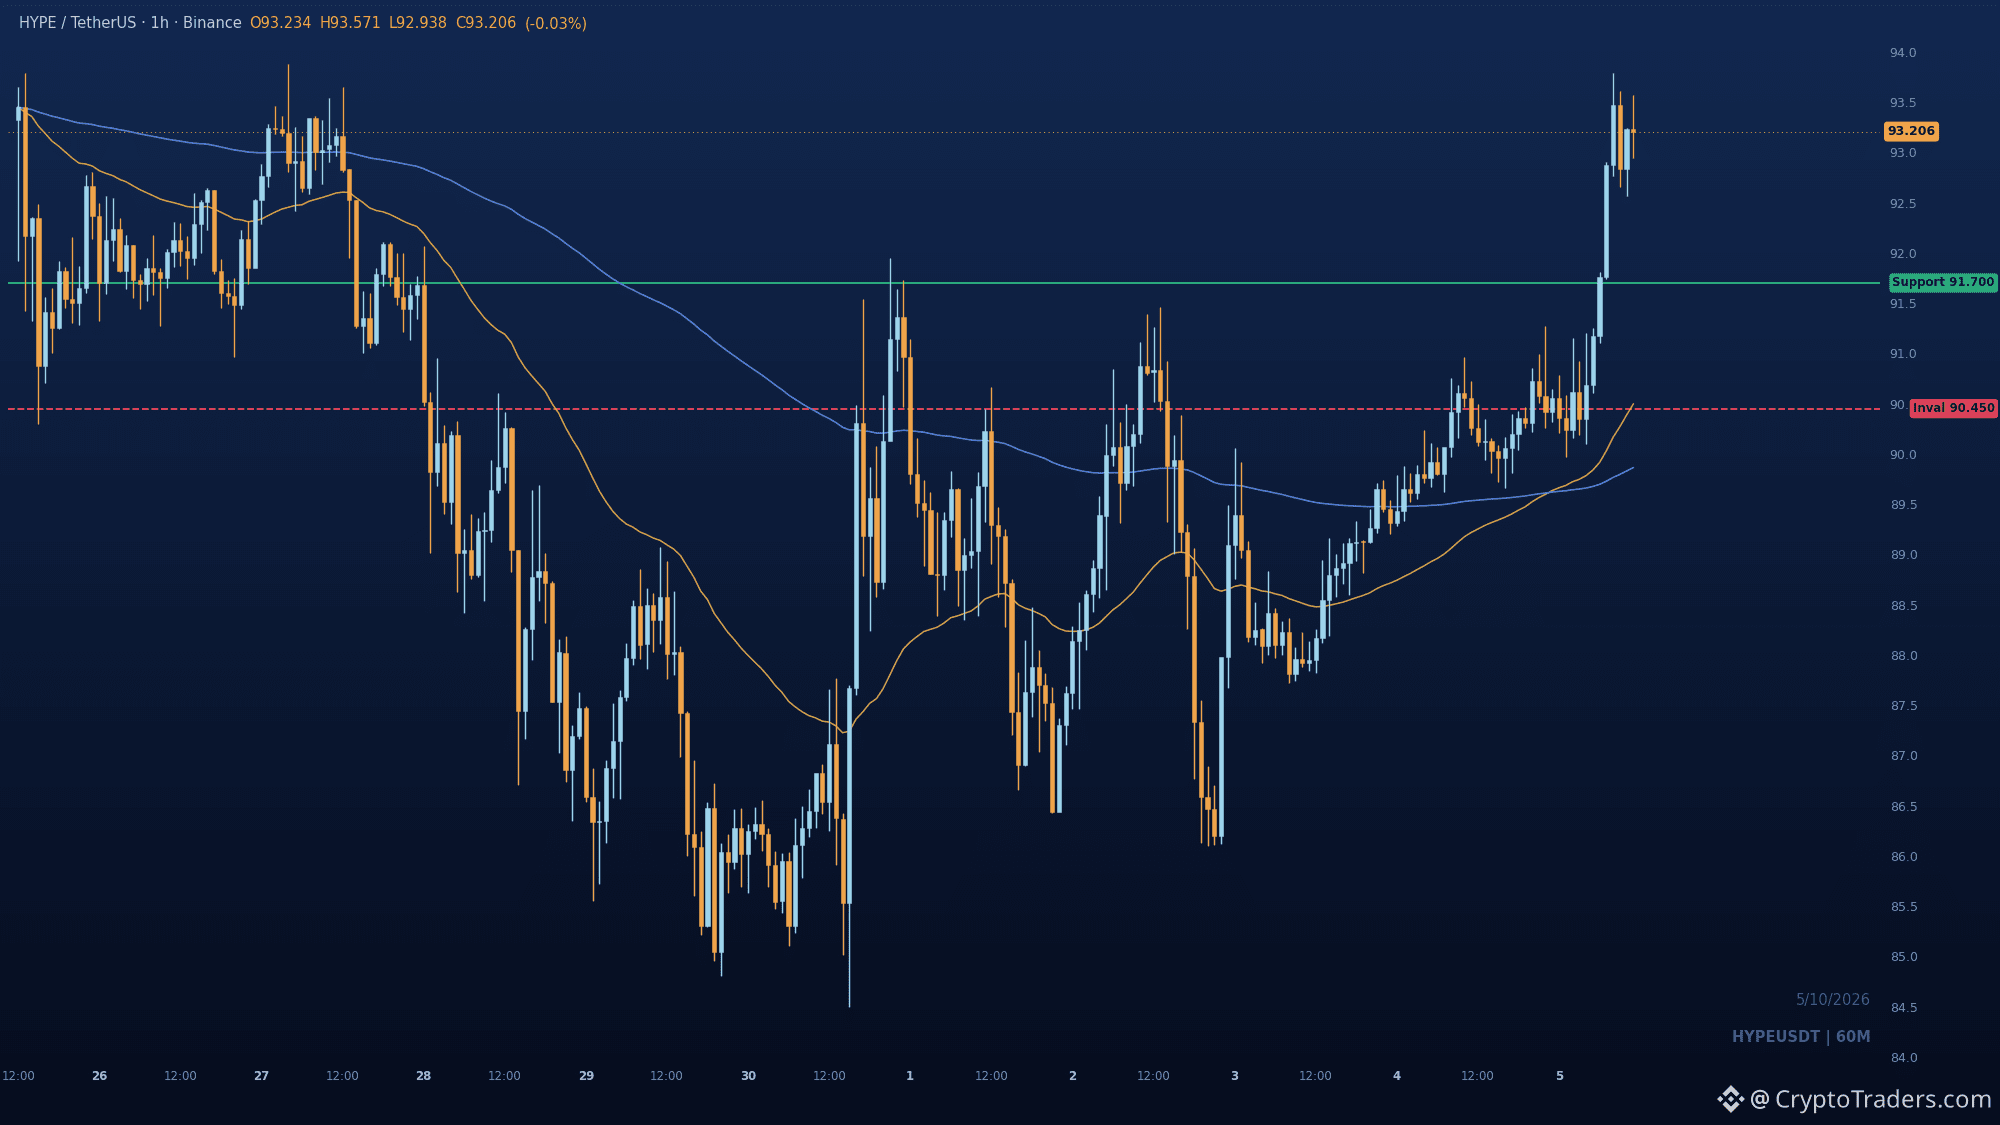
$HYPE earns the watchlist spot today because it just printed a break of structure above 91.7 and is now sitting in open upside discovery at 93.19. The recovery off the range low ran clean, and the BOS above the prior high near 91.7 confirms buyers took control of the 1h. Price is extended into premium here, so the level that matters is 91.7 as a breakout retest. Holding that shelf keeps the continuation read alive. What I need to see before believing the pullback is a real reversal: a 1h close back under 90.45, which flips the structure and kills the breakout. Are you treating 91.7 as the line in the sand, or waiting for a deeper flush? We map setups like this with the community every single day, details in the profile. #Altcoin Season#
$HYPE earns the watchlist spot today because it just printed a break of structure above 91.7 and is now sitting in open upside discovery at 93.19. The recovery off the range low ran clean, and the BOS above the prior high near 91.7 confirms buyers took control of the 1h. Price is extended into premium here, so the level that matters is 91.7 as a breakout retest. Holding that shelf keeps the continuation read alive. What I need to see before believing the pullback is a real reversal: a 1h close back under 90.45, which flips the structure and kills the breakout. Are you treating 91.7 as the line in the sand, or waiting for a deeper flush? We map setups like this with the community every single day, details in the profile. #Altcoin Season#
31
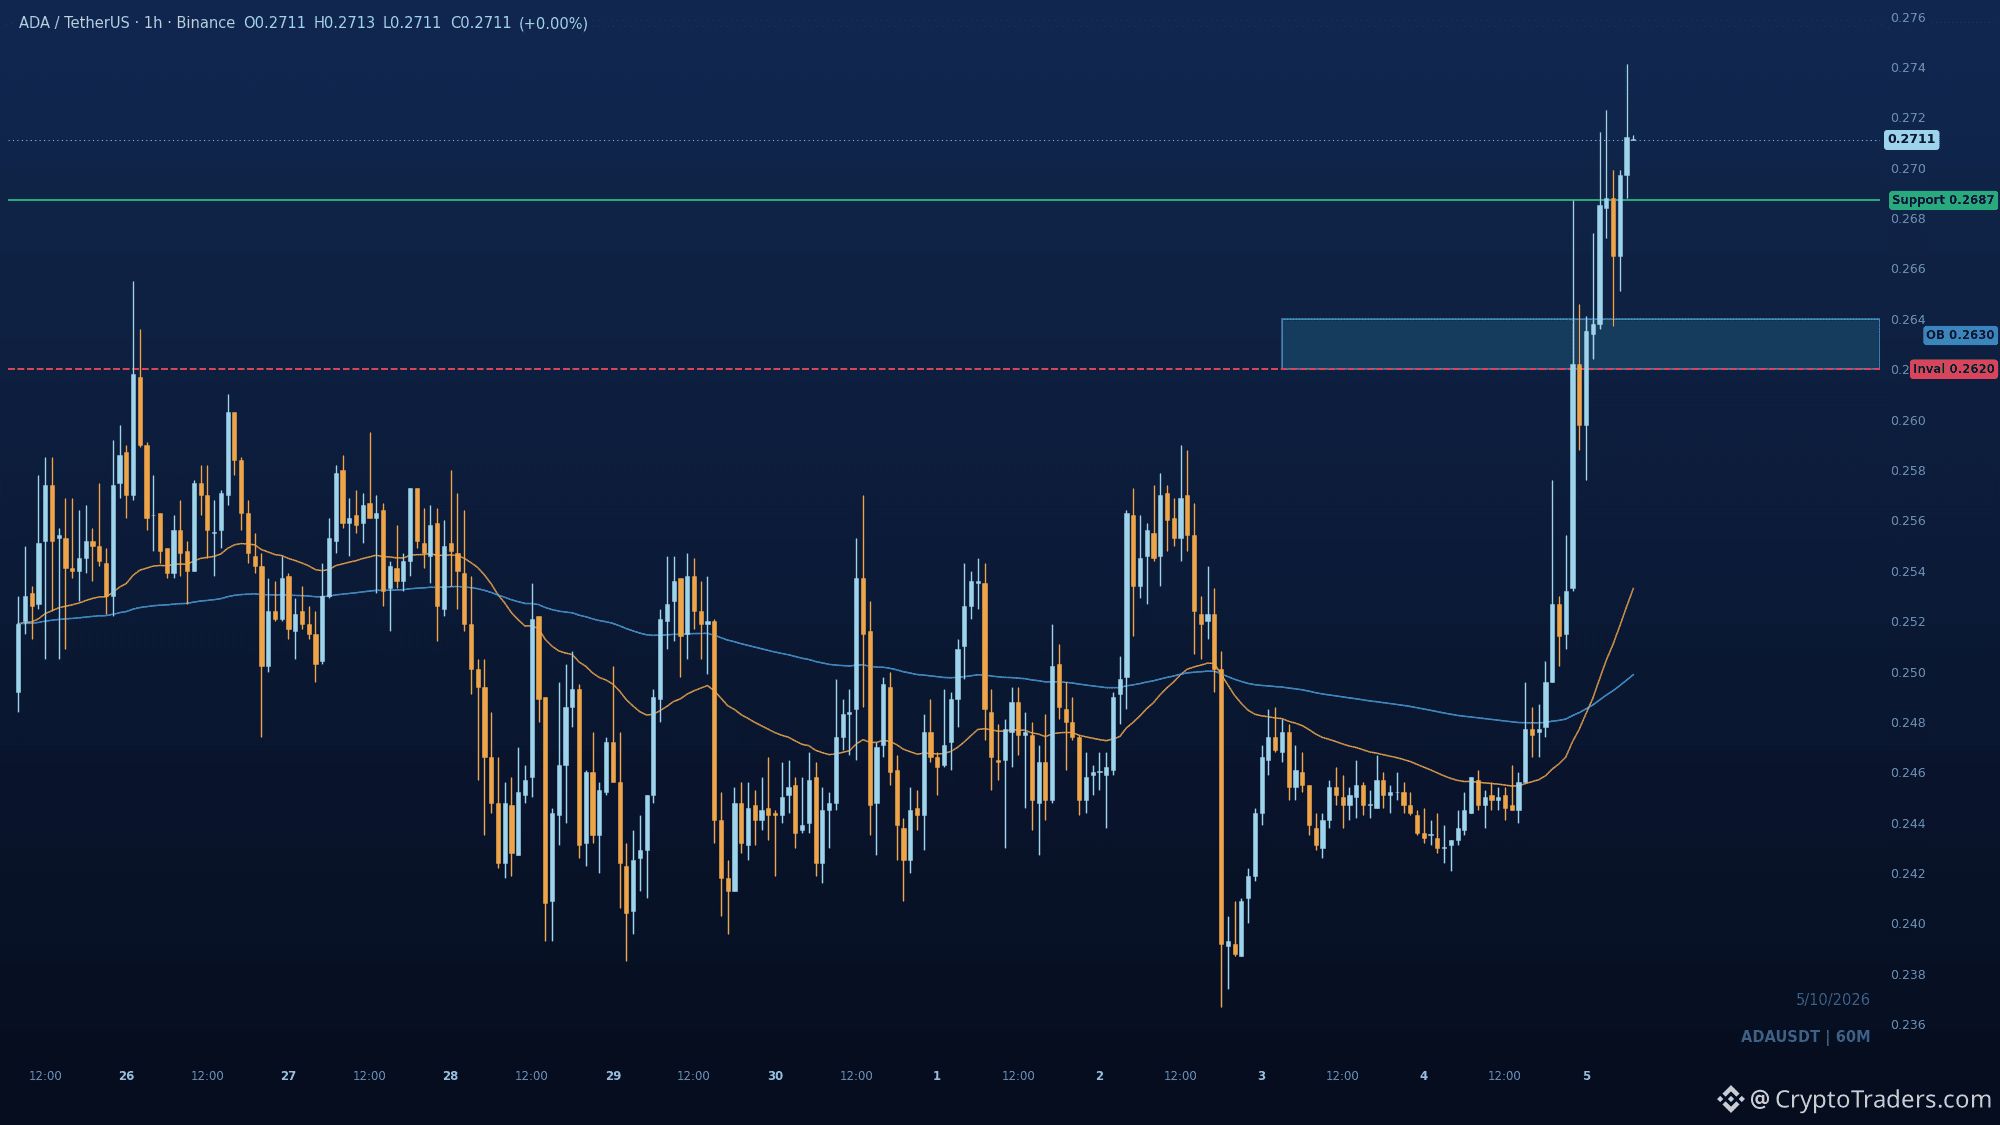
$ADA is up 10.8 percent in 24h and the 1h chart reads this as continuation, not a fade, with price pressing fresh highs above the 0.2687 break. The impulse cleared the prior 0.2687 swing high after buyers defended the 0.244 swing low, so that old high is now the line to hold. Hold above 0.2687 and the next expansion targets 0.2741. Lose it and the 0.262 to 0.264 base is the deeper retrace zone. Invalidation sits at 0.262, where the continuation leg started. Are you treating 0.2687 as flipped support or just a pause before the real pullback? More reads like this land daily in the group, details in my bio. #Altcoin Season#
$ADA is up 10.8 percent in 24h and the 1h chart reads this as continuation, not a fade, with price pressing fresh highs above the 0.2687 break. The impulse cleared the prior 0.2687 swing high after buyers defended the 0.244 swing low, so that old high is now the line to hold. Hold above 0.2687 and the next expansion targets 0.2741. Lose it and the 0.262 to 0.264 base is the deeper retrace zone. Invalidation sits at 0.262, where the continuation leg started. Are you treating 0.2687 as flipped support or just a pause before the real pullback? More reads like this land daily in the group, details in my bio. #Altcoin Season#
29
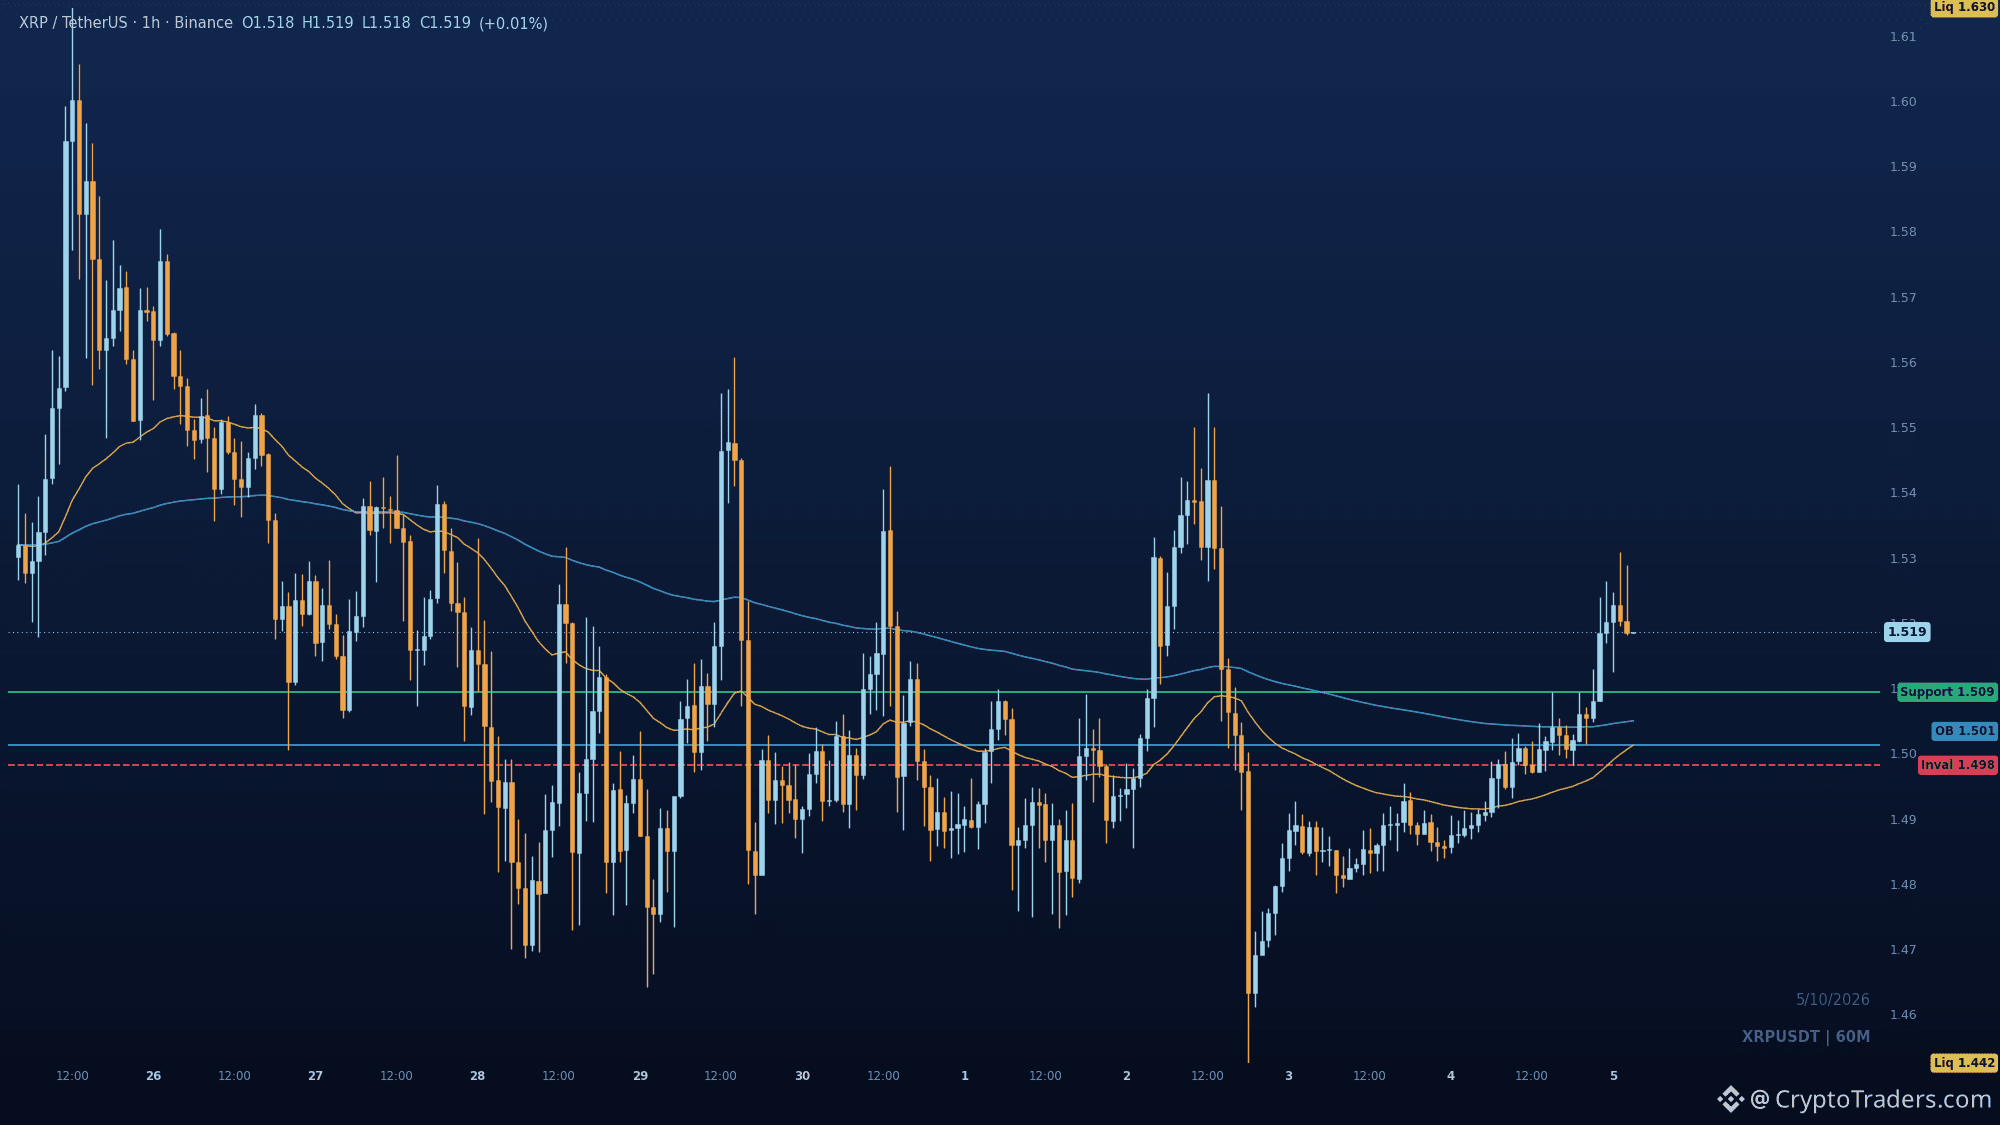
$XRP is trading near 1.52, up 2.0% on the day, and what matters is where it holds rather than the headline making rounds. Trump named Jay Clayton to lead a new federal Super Intelligence Force. Clayton's SEC brought 57 crypto cases and sued Ripple over 1.3 billion in December 2020, so the name draws attention. The role is AI policy and carries no new action involving Ripple or XRP. Quieter and more relevant: Franklin Templeton's tokenized value on the XRP Ledger is up more than 6,000%, and Ripple president Monica Long used XRP Seoul to argue the bigger story ahead is credit rather than bridge payments. Whales have stayed sidelined through the chop. The chart: the 1h read has turned constructive. Price swept toward the range low, recovered the EMAs and reclaimed the swing high at 1.5094, and it now trades at 40.6% of the range, in discount. A dip into 1.5094 down to 1.505, where the reclaimed swing high meets the EMA cluster order block at 1.5013 to 1.505, is the first place bids should show. Holding that shelf keeps 1.6299 in play, with buy-side liquidity resting there. Failure costs anyone already long this: 1.4982 is the invalidation. Lose it and the reclaim reads as a fakeout, leaving that position underwater with the 1.4425 sell-side pool at the range low as the next real draw, roughly five percent below spot before structure steadies. What to watch: how price reacts on a retest of 1.5094, whether whale holdings move off the sidelines, and follow-through in tokenized assets on the ledger. A close back below 1.4982 flips the bias lower. If 1.5094 gets tapped and buyers don't show, do you cut there or wait for 1.4982? Reads like this post daily in the group, and my bio shows the way in. #Altcoin Season# #Macro Insights#
$XRP is trading near 1.52, up 2.0% on the day, and what matters is where it holds rather than the headline making rounds. Trump named Jay Clayton to lead a new federal Super Intelligence Force. Clayton's SEC brought 57 crypto cases and sued Ripple over 1.3 billion in December 2020, so the name draws attention. The role is AI policy and carries no new action involving Ripple or XRP. Quieter and more relevant: Franklin Templeton's tokenized value on the XRP Ledger is up more than 6,000%, and Ripple president Monica Long used XRP Seoul to argue the bigger story ahead is credit rather than bridge payments. Whales have stayed sidelined through the chop. The chart: the 1h read has turned constructive. Price swept toward the range low, recovered the EMAs and reclaimed the swing high at 1.5094, and it now trades at 40.6% of the range, in discount. A dip into 1.5094 down to 1.505, where the reclaimed swing high meets the EMA cluster order block at 1.5013 to 1.505, is the first place bids should show. Holding that shelf keeps 1.6299 in play, with buy-side liquidity resting there. Failure costs anyone already long this: 1.4982 is the invalidation. Lose it and the reclaim reads as a fakeout, leaving that position underwater with the 1.4425 sell-side pool at the range low as the next real draw, roughly five percent below spot before structure steadies. What to watch: how price reacts on a retest of 1.5094, whether whale holdings move off the sidelines, and follow-through in tokenized assets on the ledger. A close back below 1.4982 flips the bias lower. If 1.5094 gets tapped and buyers don't show, do you cut there or wait for 1.4982? Reads like this post daily in the group, and my bio shows the way in. #Altcoin Season# #Macro Insights#
39
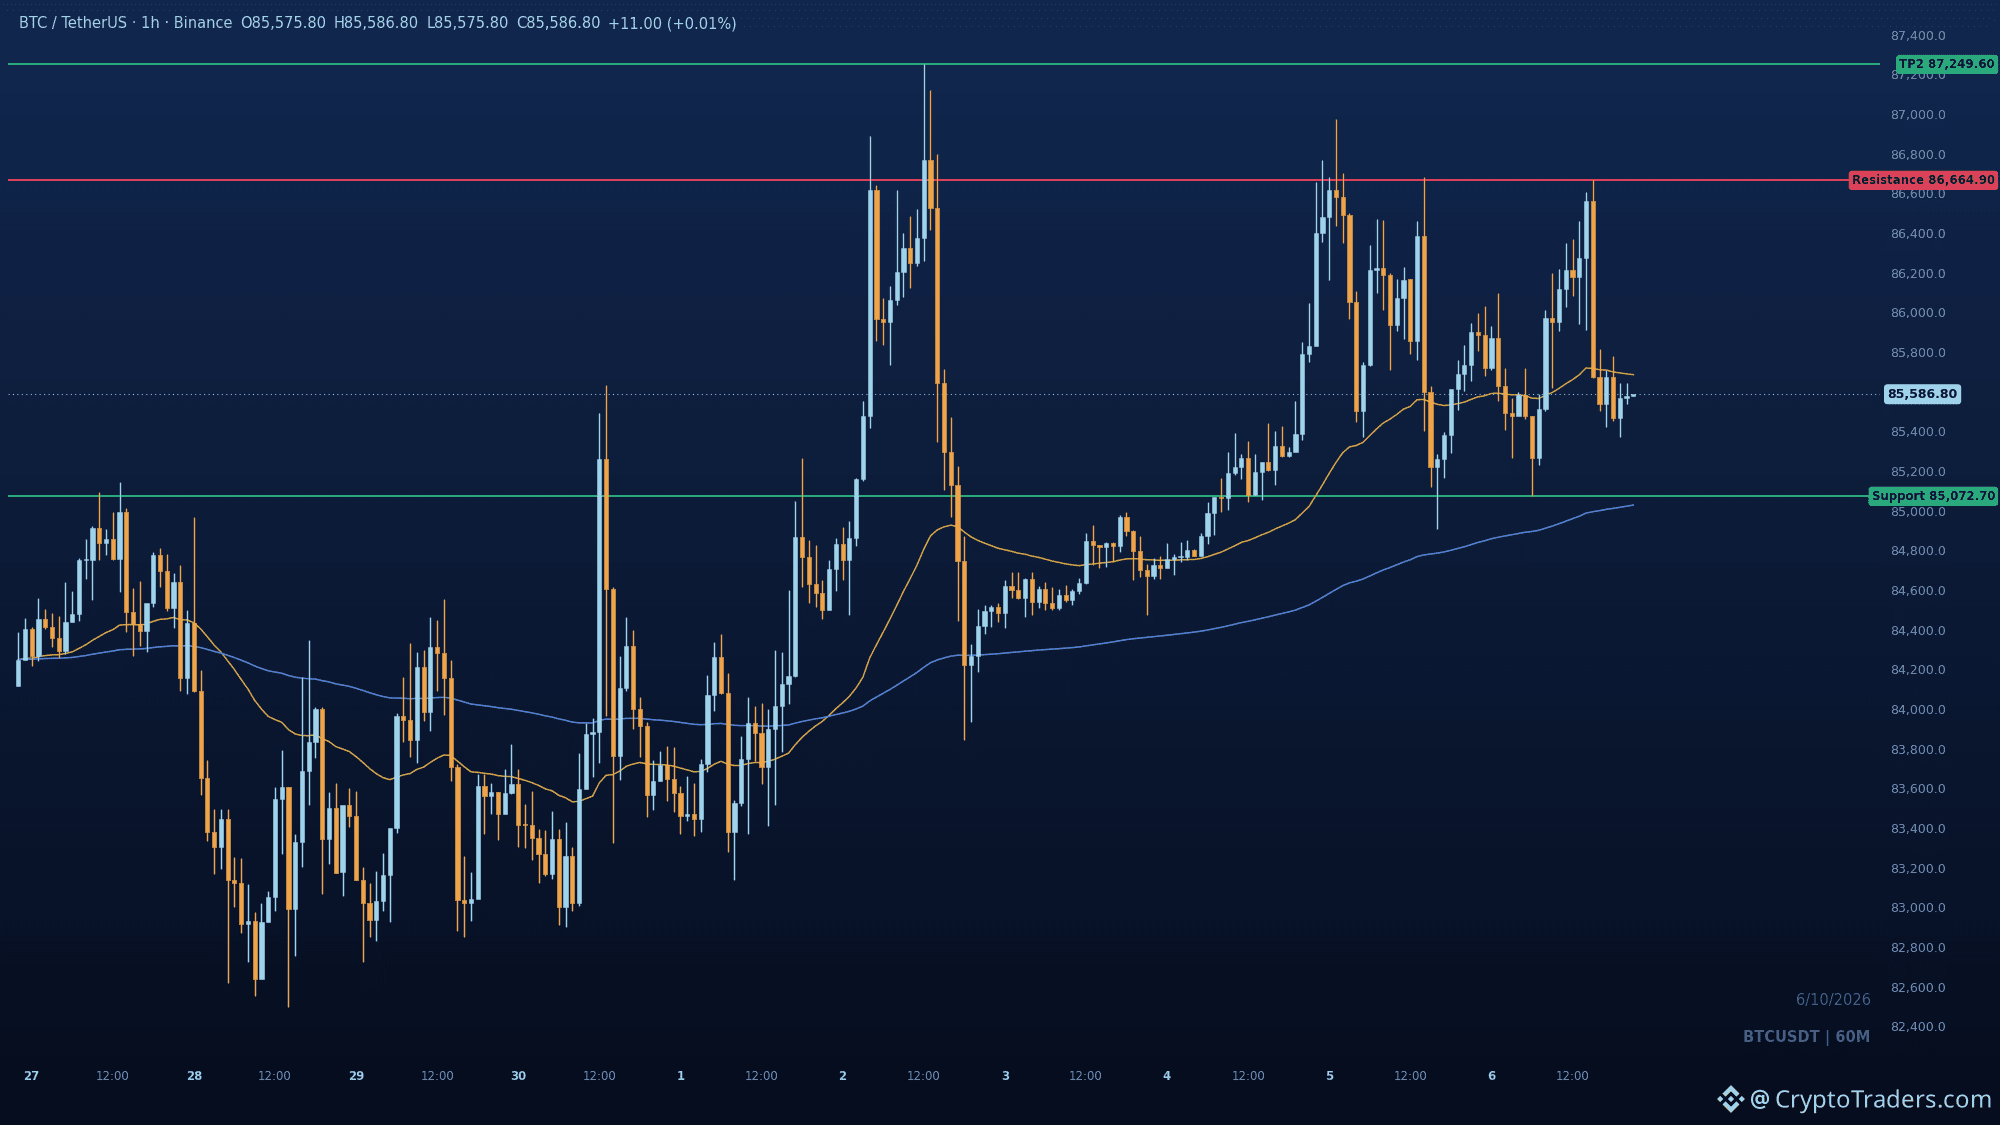
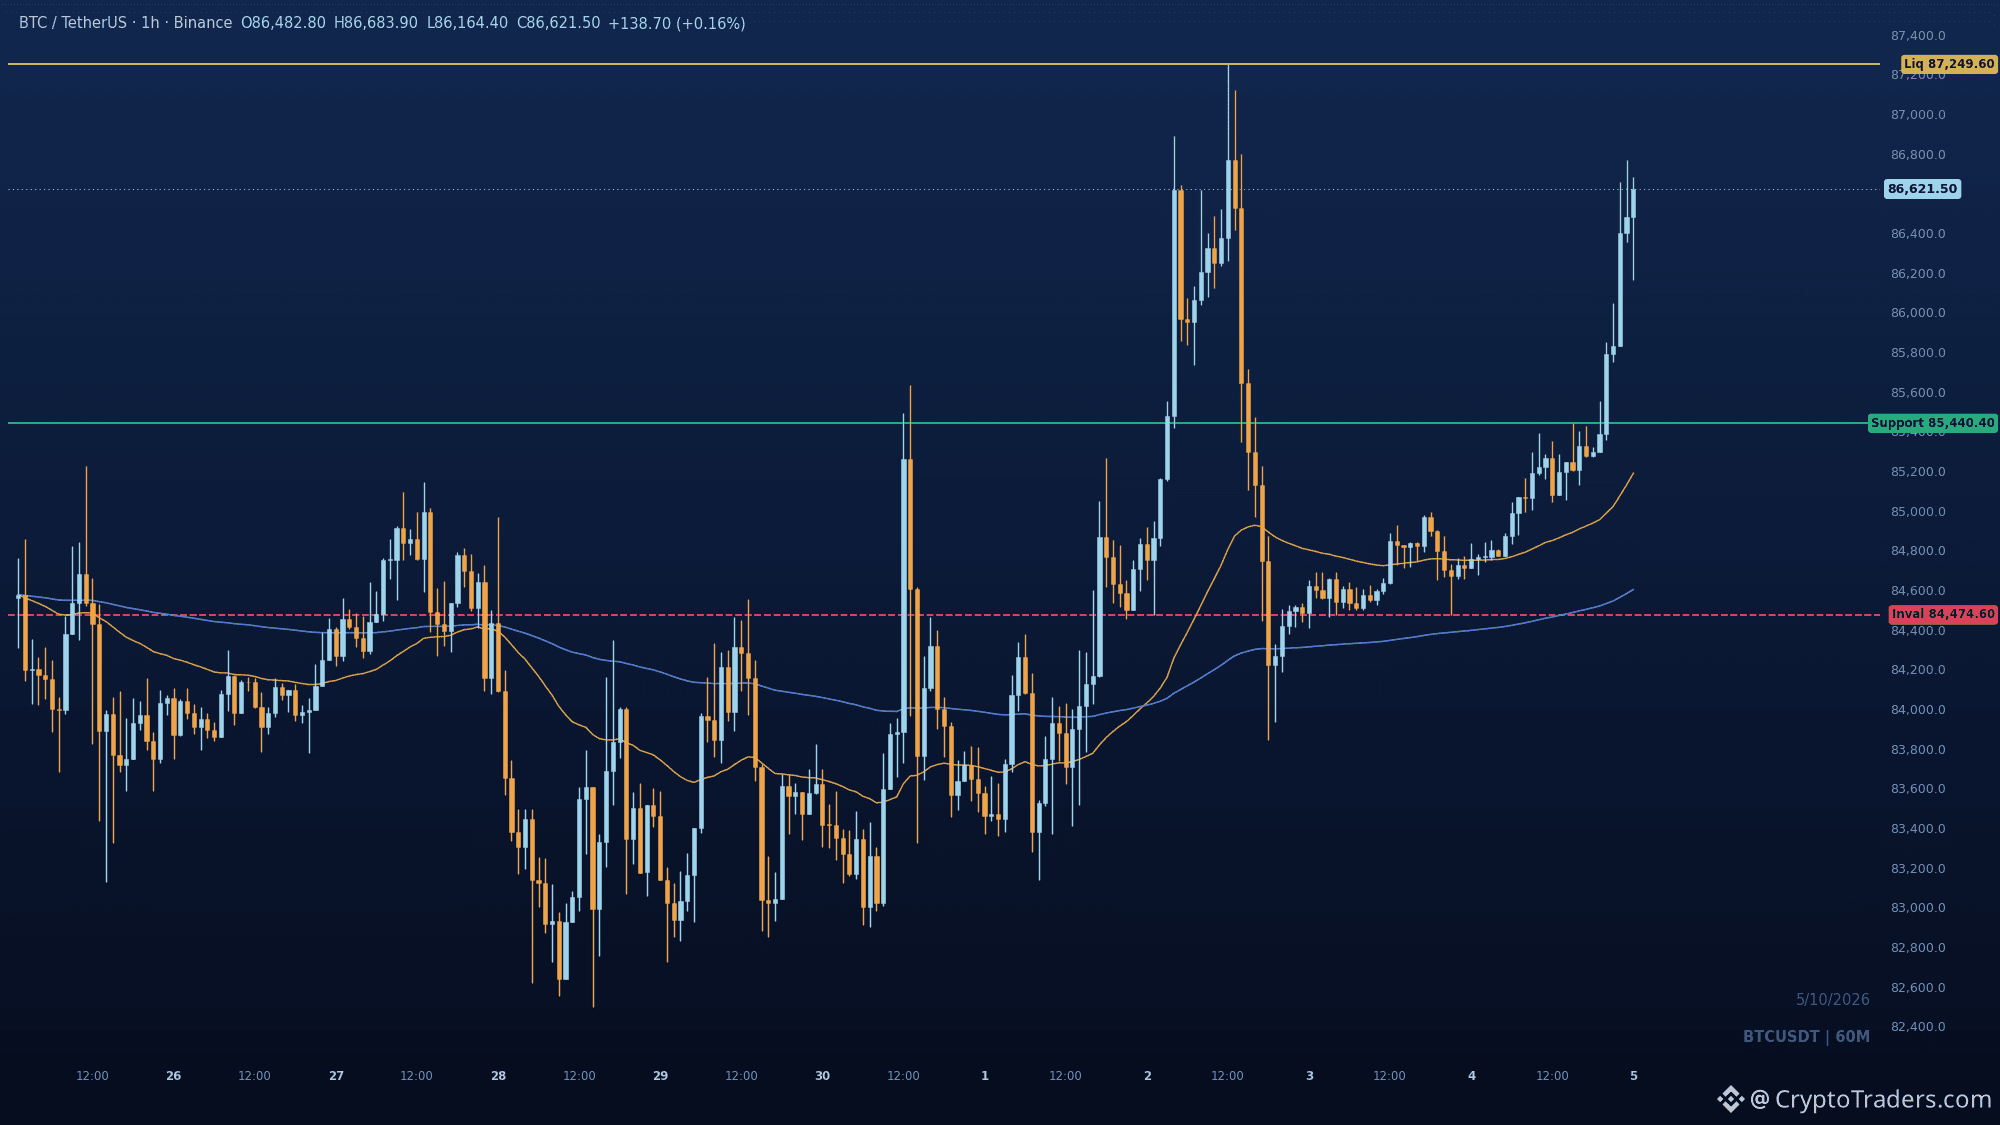
$BTC added 2.2 percent in 24h and the 1h chart says that push has follow-through, with price holding above the 85,440.4 breakout. Buyers took out that prior swing high and both EMAs now sit under spot, so the structure stays bullish while 85,440.4 holds as flipped support. Next upside reference is the 87,249.6 prior high, where buy-side liquidity is sitting. Losing 85,440.4 on a sustained basis is the cost of staying long here: it invalidates the breakout and puts 84,474.6 back in play. Are you treating 85,440.4 as the line that decides this leg? More reads like this land in the group every day, details in my bio. #BTC Price Analysis# #Bitcoin Price Prediction: What is Bitcoins next move?#
$BTC added 2.2 percent in 24h and the 1h chart says that push has follow-through, with price holding above the 85,440.4 breakout. Buyers took out that prior swing high and both EMAs now sit under spot, so the structure stays bullish while 85,440.4 holds as flipped support. Next upside reference is the 87,249.6 prior high, where buy-side liquidity is sitting. Losing 85,440.4 on a sustained basis is the cost of staying long here: it invalidates the breakout and puts 84,474.6 back in play. Are you treating 85,440.4 as the line that decides this leg? More reads like this land in the group every day, details in my bio. #BTC Price Analysis# #Bitcoin Price Prediction: What is Bitcoins next move?#
53
$FET ripped 12.6 percent while the rest of the board sat still, and the 0.248 shelf it just broke is the tell. That level capped price earlier in this window before buyers punched through it, and it is now the first thing standing under the pullback from 0.2606. Holding 0.248 keeps the breakout structure intact and leaves room above the swing high. A decisive close below 0.239 flips this back to a failed push and weakens the whole leg off 0.221. Does 0.248 hold as support on the retest, or does the 0.2606 rejection drag price back under it? More charts like this land daily in the group, my bio has the way in. #Altcoin Season#
$FET ripped 12.6 percent while the rest of the board sat still, and the 0.248 shelf it just broke is the tell. That level capped price earlier in this window before buyers punched through it, and it is now the first thing standing under the pullback from 0.2606. Holding 0.248 keeps the breakout structure intact and leaves room above the swing high. A decisive close below 0.239 flips this back to a failed push and weakens the whole leg off 0.221. Does 0.248 hold as support on the retest, or does the 0.2606 rejection drag price back under it? More charts like this land daily in the group, my bio has the way in. #Altcoin Season#
65
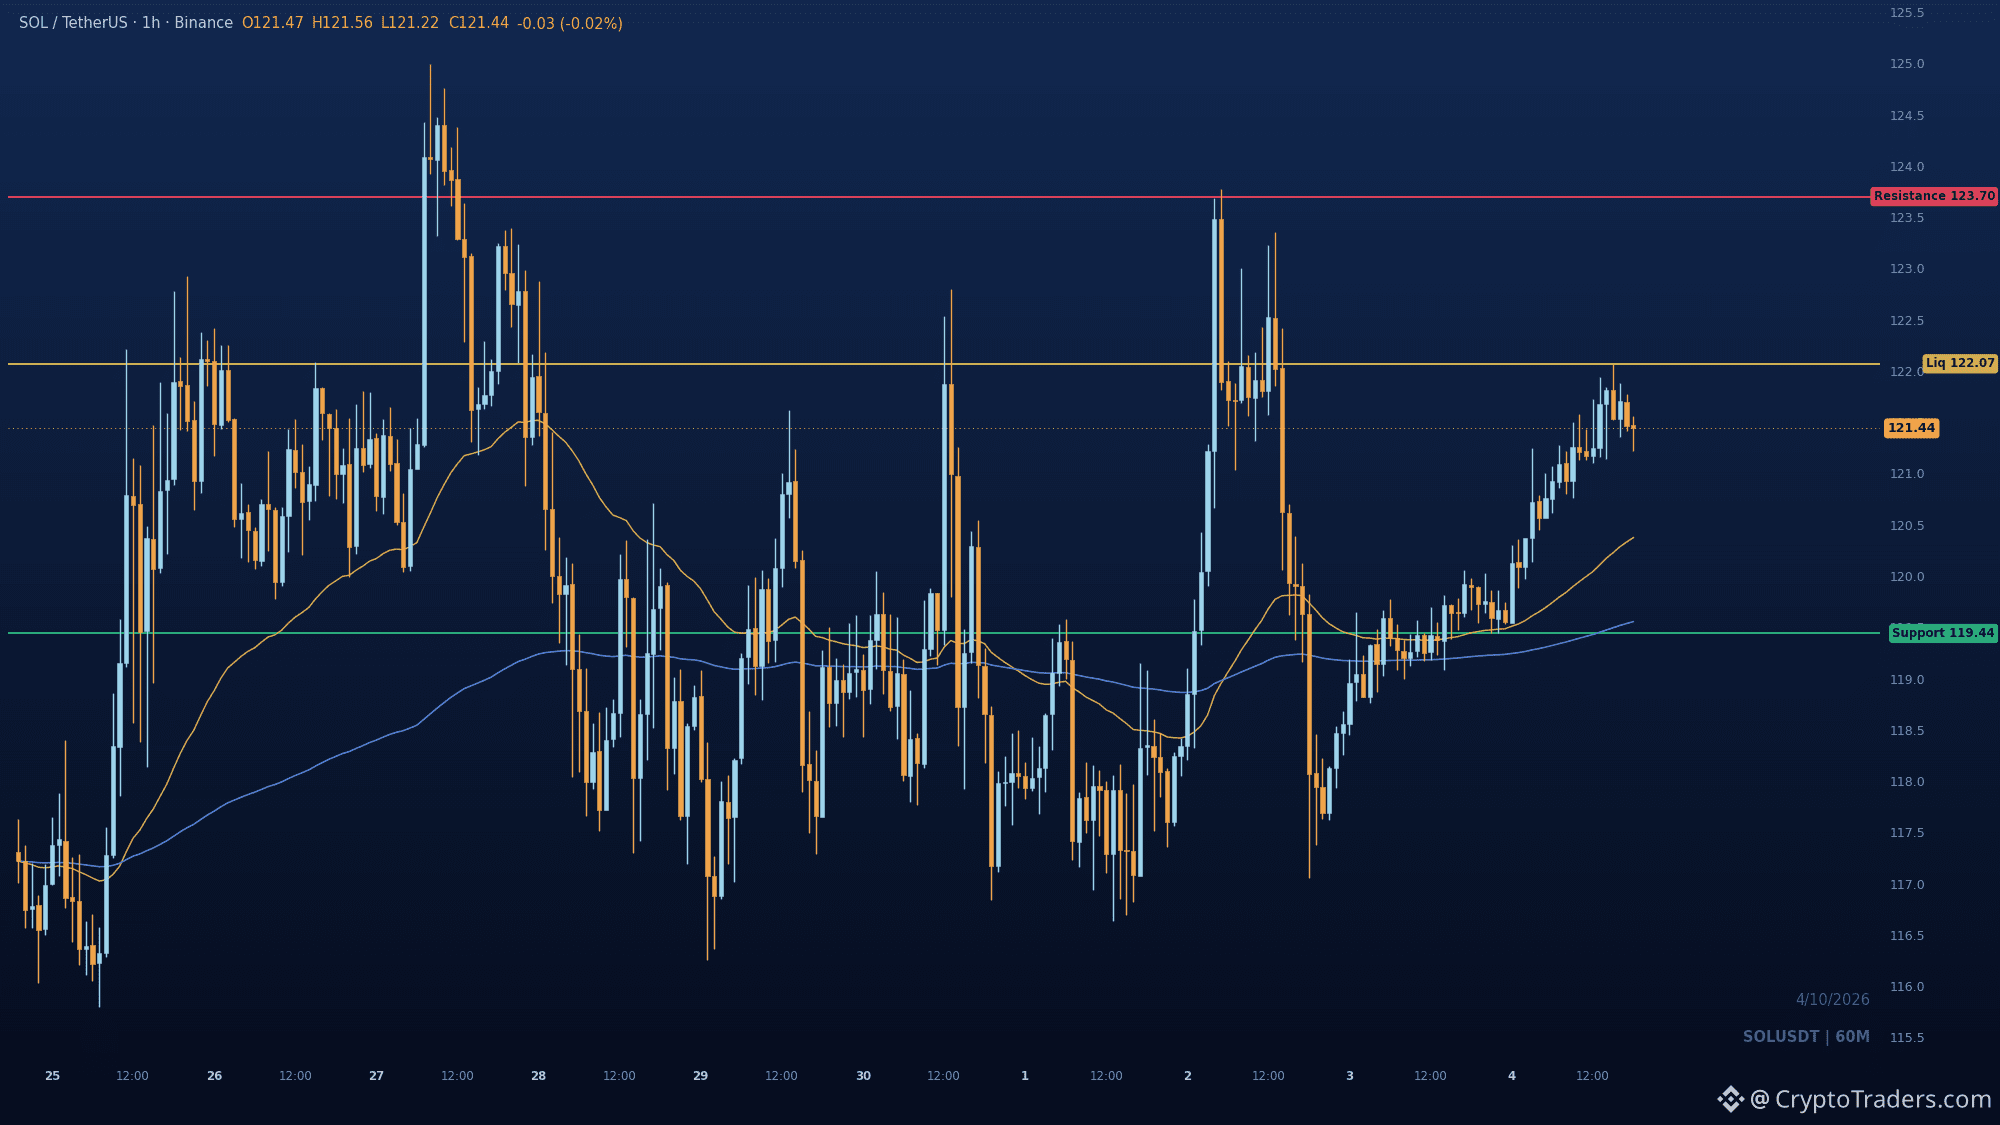
$SOL is on the watchlist because it just took back the 119.44 to 120 shelf and is pressing the 122.07 swing high, which puts it in the top half of its hourly range. The chart shows higher lows since the reclaim, with price riding back above the moving averages. Above 122.07 there is a buy-side pool, and a clean hold through it brings 123.7 into view. What I need to see before believing the continuation: a close above 122.07 that does not immediately get sold back into the range. What kills it: losing 119.44. That is the swing low holding this recovery together, and a break there flips the structure. Where do you want to see SOL close this hourly candle? #Altcoin Season#
$SOL is on the watchlist because it just took back the 119.44 to 120 shelf and is pressing the 122.07 swing high, which puts it in the top half of its hourly range. The chart shows higher lows since the reclaim, with price riding back above the moving averages. Above 122.07 there is a buy-side pool, and a clean hold through it brings 123.7 into view. What I need to see before believing the continuation: a close above 122.07 that does not immediately get sold back into the range. What kills it: losing 119.44. That is the swing low holding this recovery together, and a break there flips the structure. Where do you want to see SOL close this hourly candle? #Altcoin Season#
20
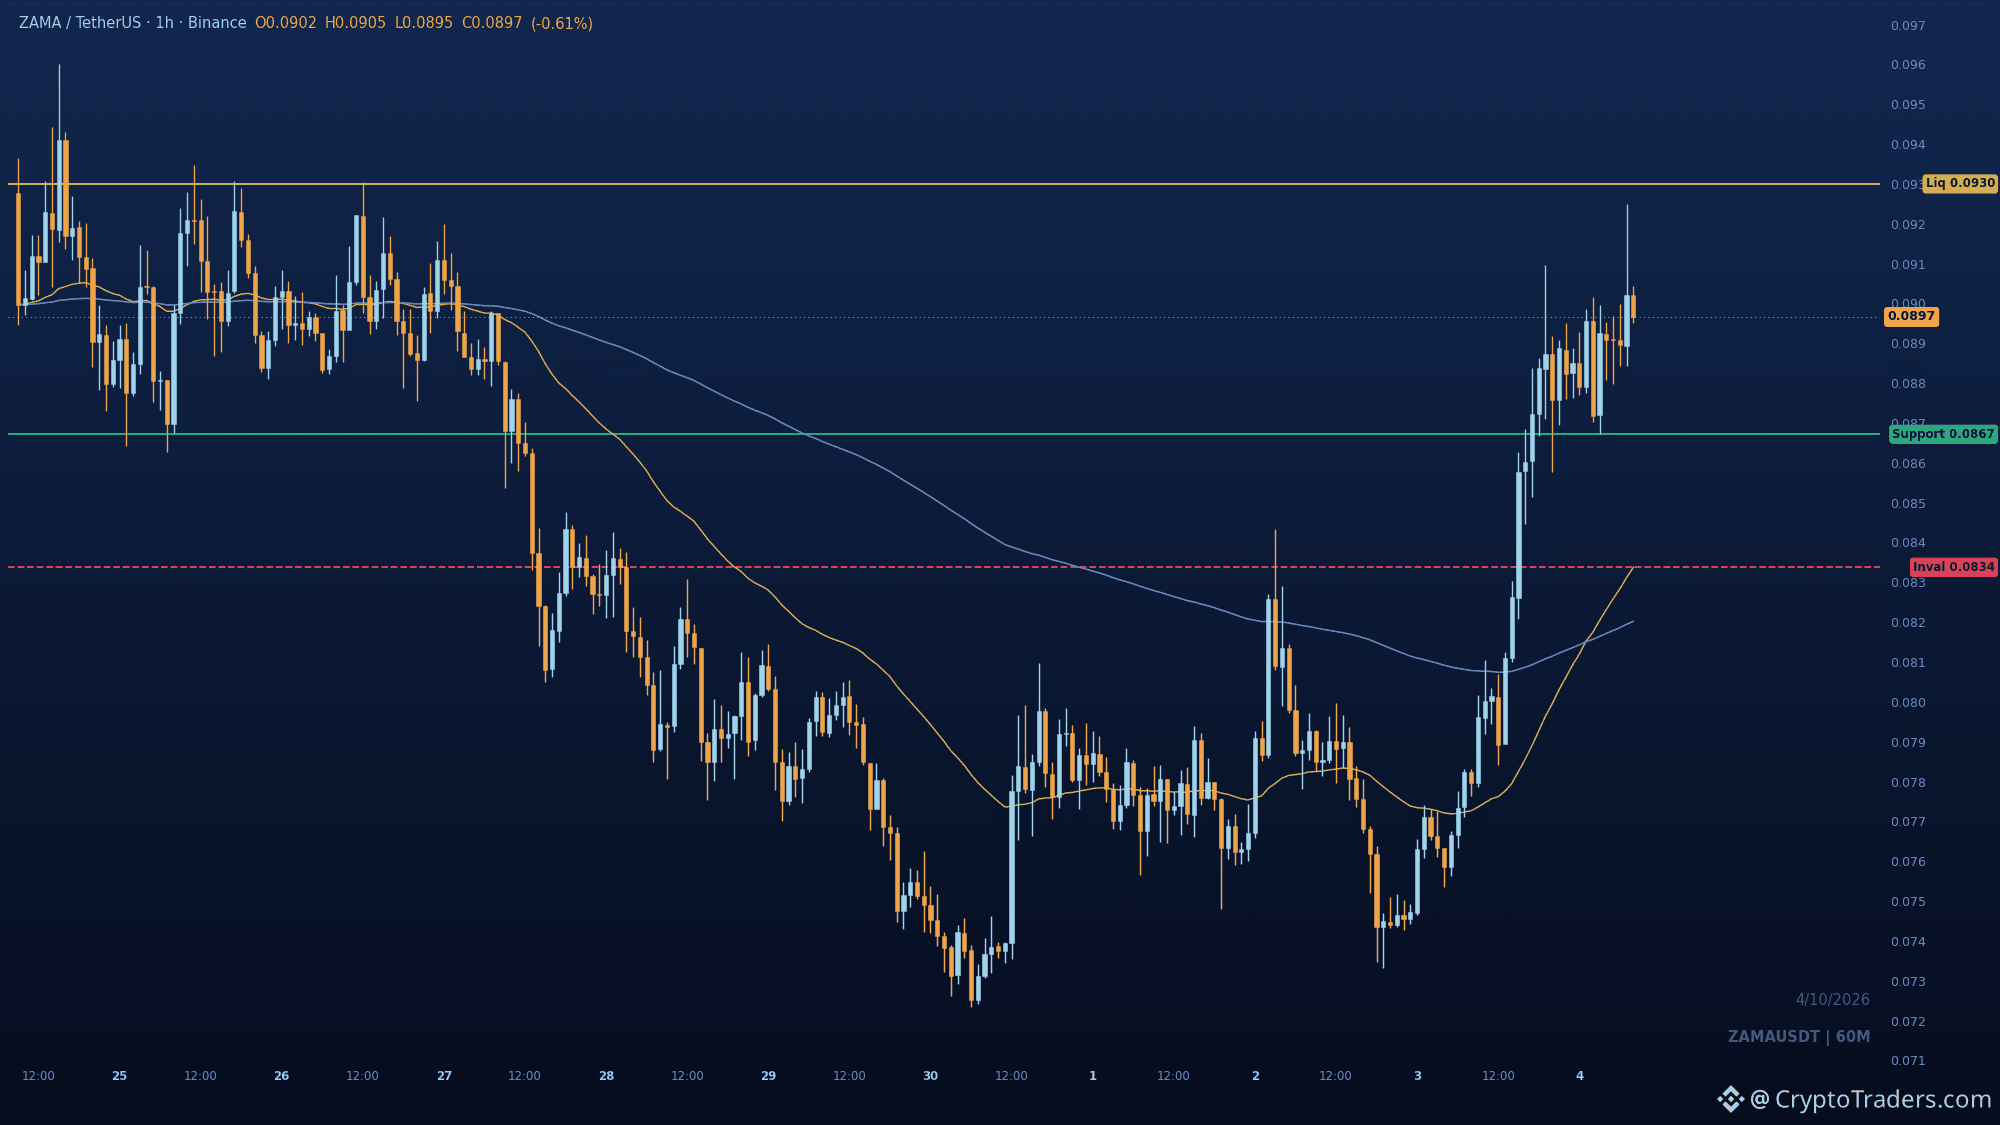
$ZAMA is up 15.1 percent on the day and the 1h chart says the move is being defended rather than faded. Buyers drove price to the range low, then reclaimed the moving averages and broke above the prior consolidation. Structure has flipped bullish and price is in the upper half of the range. 0.08672 is the swing low that now acts as pullback support. Defend that and 0.093 is the prior swing-high liquidity sitting overhead. Lose 0.08337751 and the bid that paid for this leg is gone, which changes the story even if the candles look similar. Are you watching 0.08672 for a retest or waiting on the 0.093 sweep? We map setups like this with the community every morning, so check in for the daily read. #Altcoin Season#
$ZAMA is up 15.1 percent on the day and the 1h chart says the move is being defended rather than faded. Buyers drove price to the range low, then reclaimed the moving averages and broke above the prior consolidation. Structure has flipped bullish and price is in the upper half of the range. 0.08672 is the swing low that now acts as pullback support. Defend that and 0.093 is the prior swing-high liquidity sitting overhead. Lose 0.08337751 and the bid that paid for this leg is gone, which changes the story even if the candles look similar. Are you watching 0.08672 for a retest or waiting on the 0.093 sweep? We map setups like this with the community every morning, so check in for the daily read. #Altcoin Season#
27
Log in to explore more content
Join global crypto users on Binance Square
⚡️ Get latest and useful information about crypto.
💬 Trusted by the world’s largest crypto exchange.
👍 Discover real insights from verified creators.
Email / Phone number
Trending Topics
BinanceLaunchesBinanceIntelligence
784,991 views
4,913 Discussing
#binancelaunchesbinanceintelligence 🚨 WHAT IF THE NEXT BIG EXCHANGE BATTLE ISN’T ABOUT FEES? 👀
Binance just made a bigger move than adding another AI chatbot.
With Binance Intelligence, AI is moving deeper into the exchange — from understanding market data to building trading workflows. 🤖⚡
The real question is:
Who has the best liquidity?
Or who has the smartest AI layer?
If users can research, test ideas and manage trading workflows without switching between different tools, the exchange itself could become a financial assistant.
That could be a much bigger shift than it looks today.
If Binance Intelligence drives more users, more strategies and more trading activity, $BNB could become one of the tokens to watch. 👀
Is Binance building the future of AI-powered finance?
$BNB
#binancelaunchesbinanceintelligence #BinanceAI #CryptoAI #AITrading
Suleman Khan Haqqani
·35 Likes
·32.9k views
BTCFallsBelow$84K
41,954 views
137 Discussing
DubaiVARAIssuesReserveAssetAuditCircular
14,628 views
506 Discussing