

عبدالجواد
لااقدم وعودا سريعة ولا اطارد أرقاما عابرة هدفي أعمق بناء هوية تعرف دون شرح وتحس دون تفسير.محتواي موجه لمن يبحث عن المعنى خلف الصورة وعن الاحساس خلف الصوت
Frequent Trader
2.8 Years
271 Following
7.8K Followers
6.3K+ Liked
Posts
All
Quotes
Live
PINNED
عبدالجواد
·
--
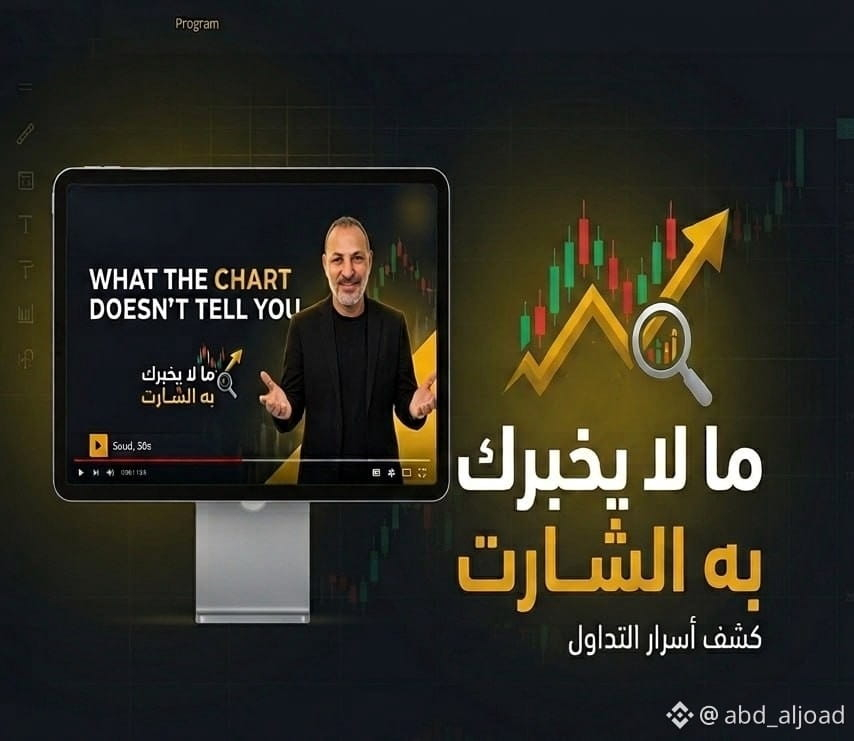
[Replay] 🎙️ 🎙 Series 'What the Chart Won't Tell You'
Episode Two — 'How the Market Maker Thinks'
35 m 42 s · 443 listens
PINNED

عبدالجواد
·
--
$BTC
@
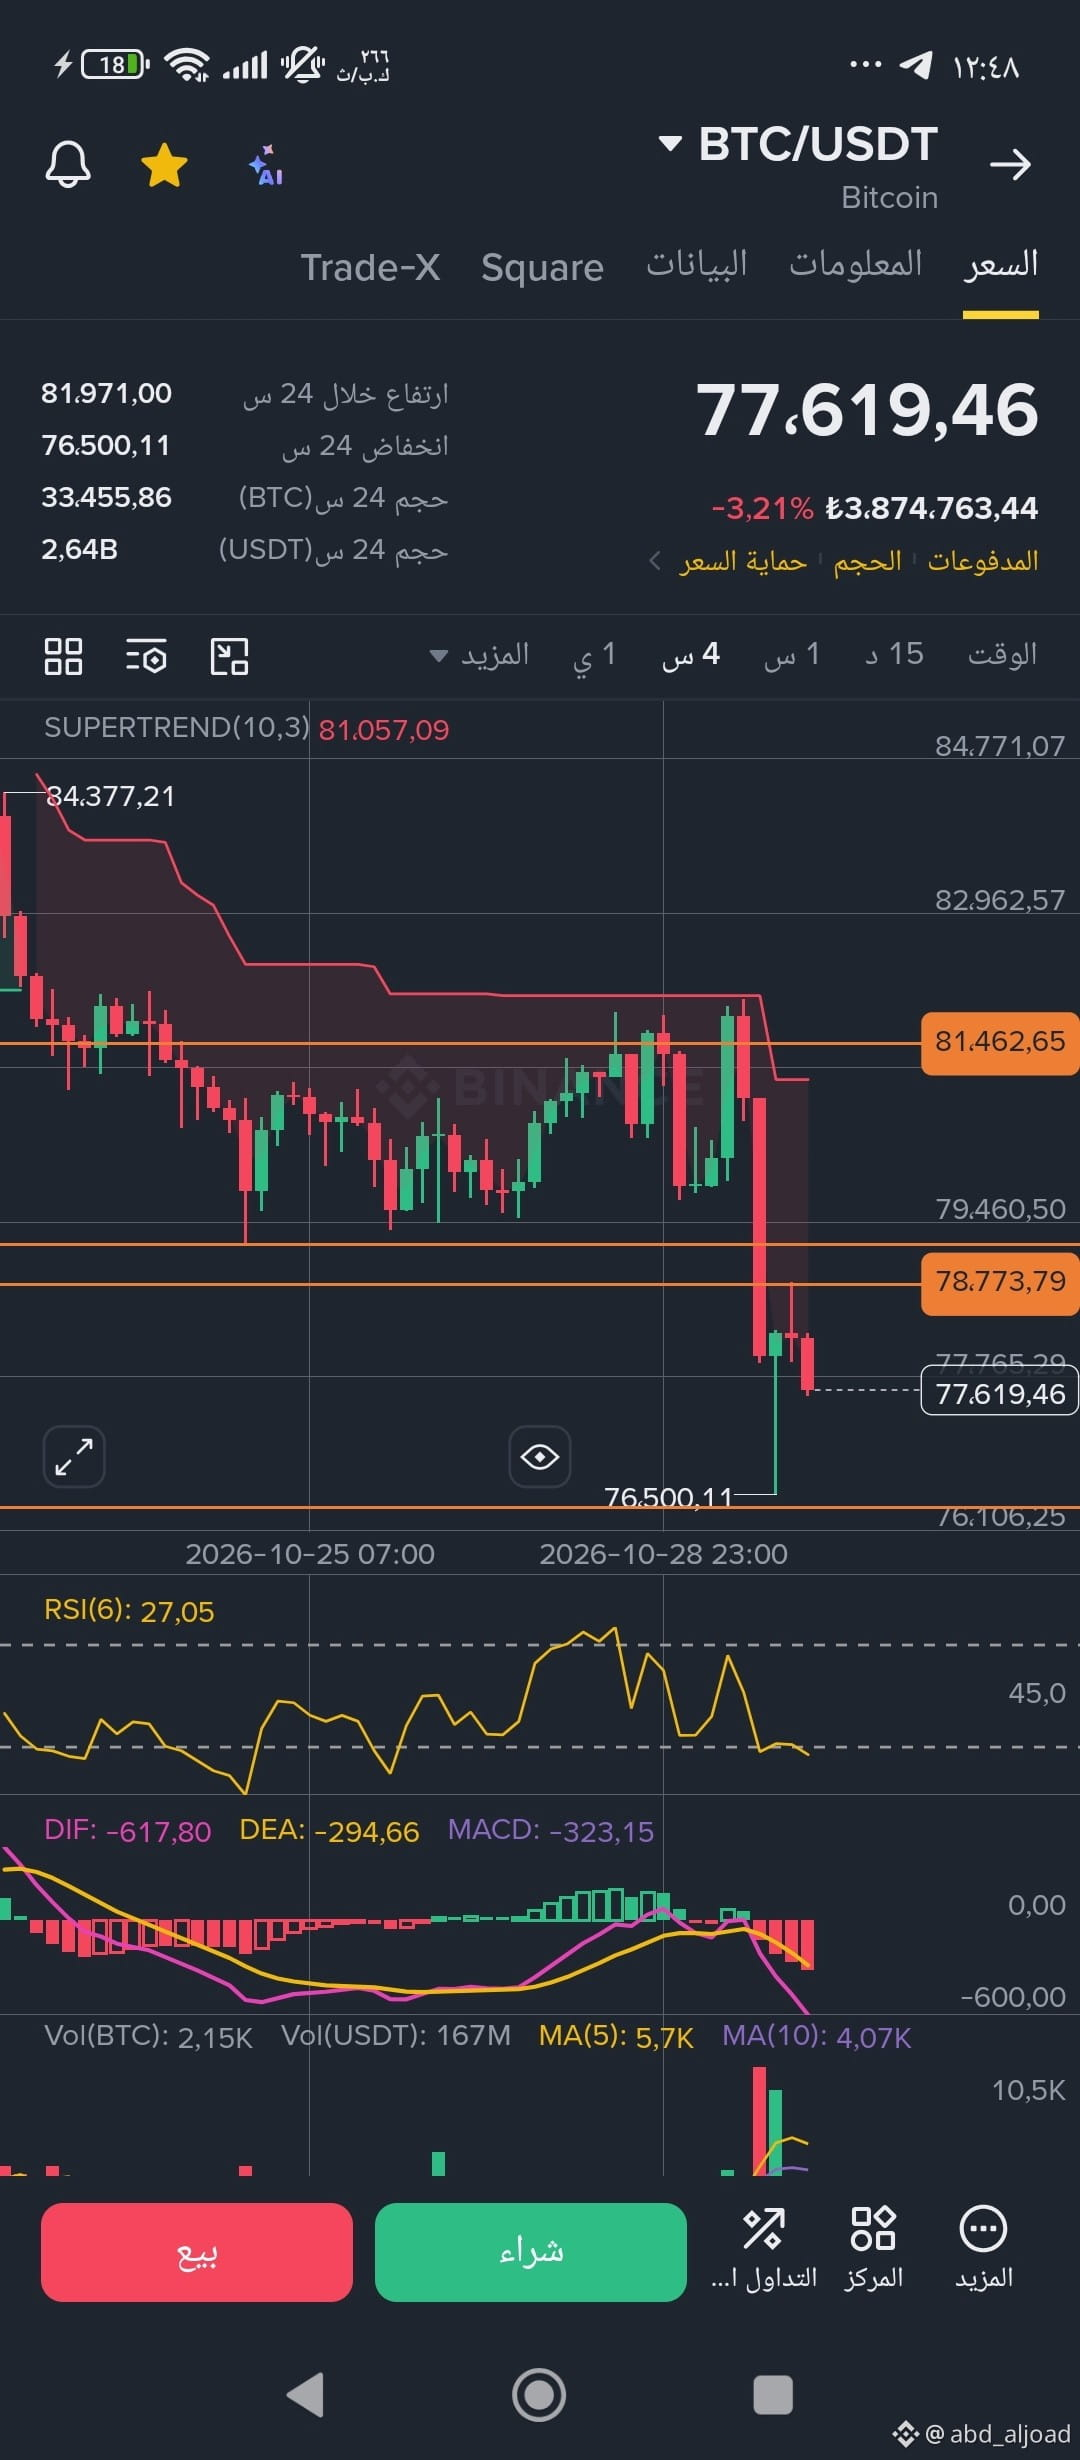
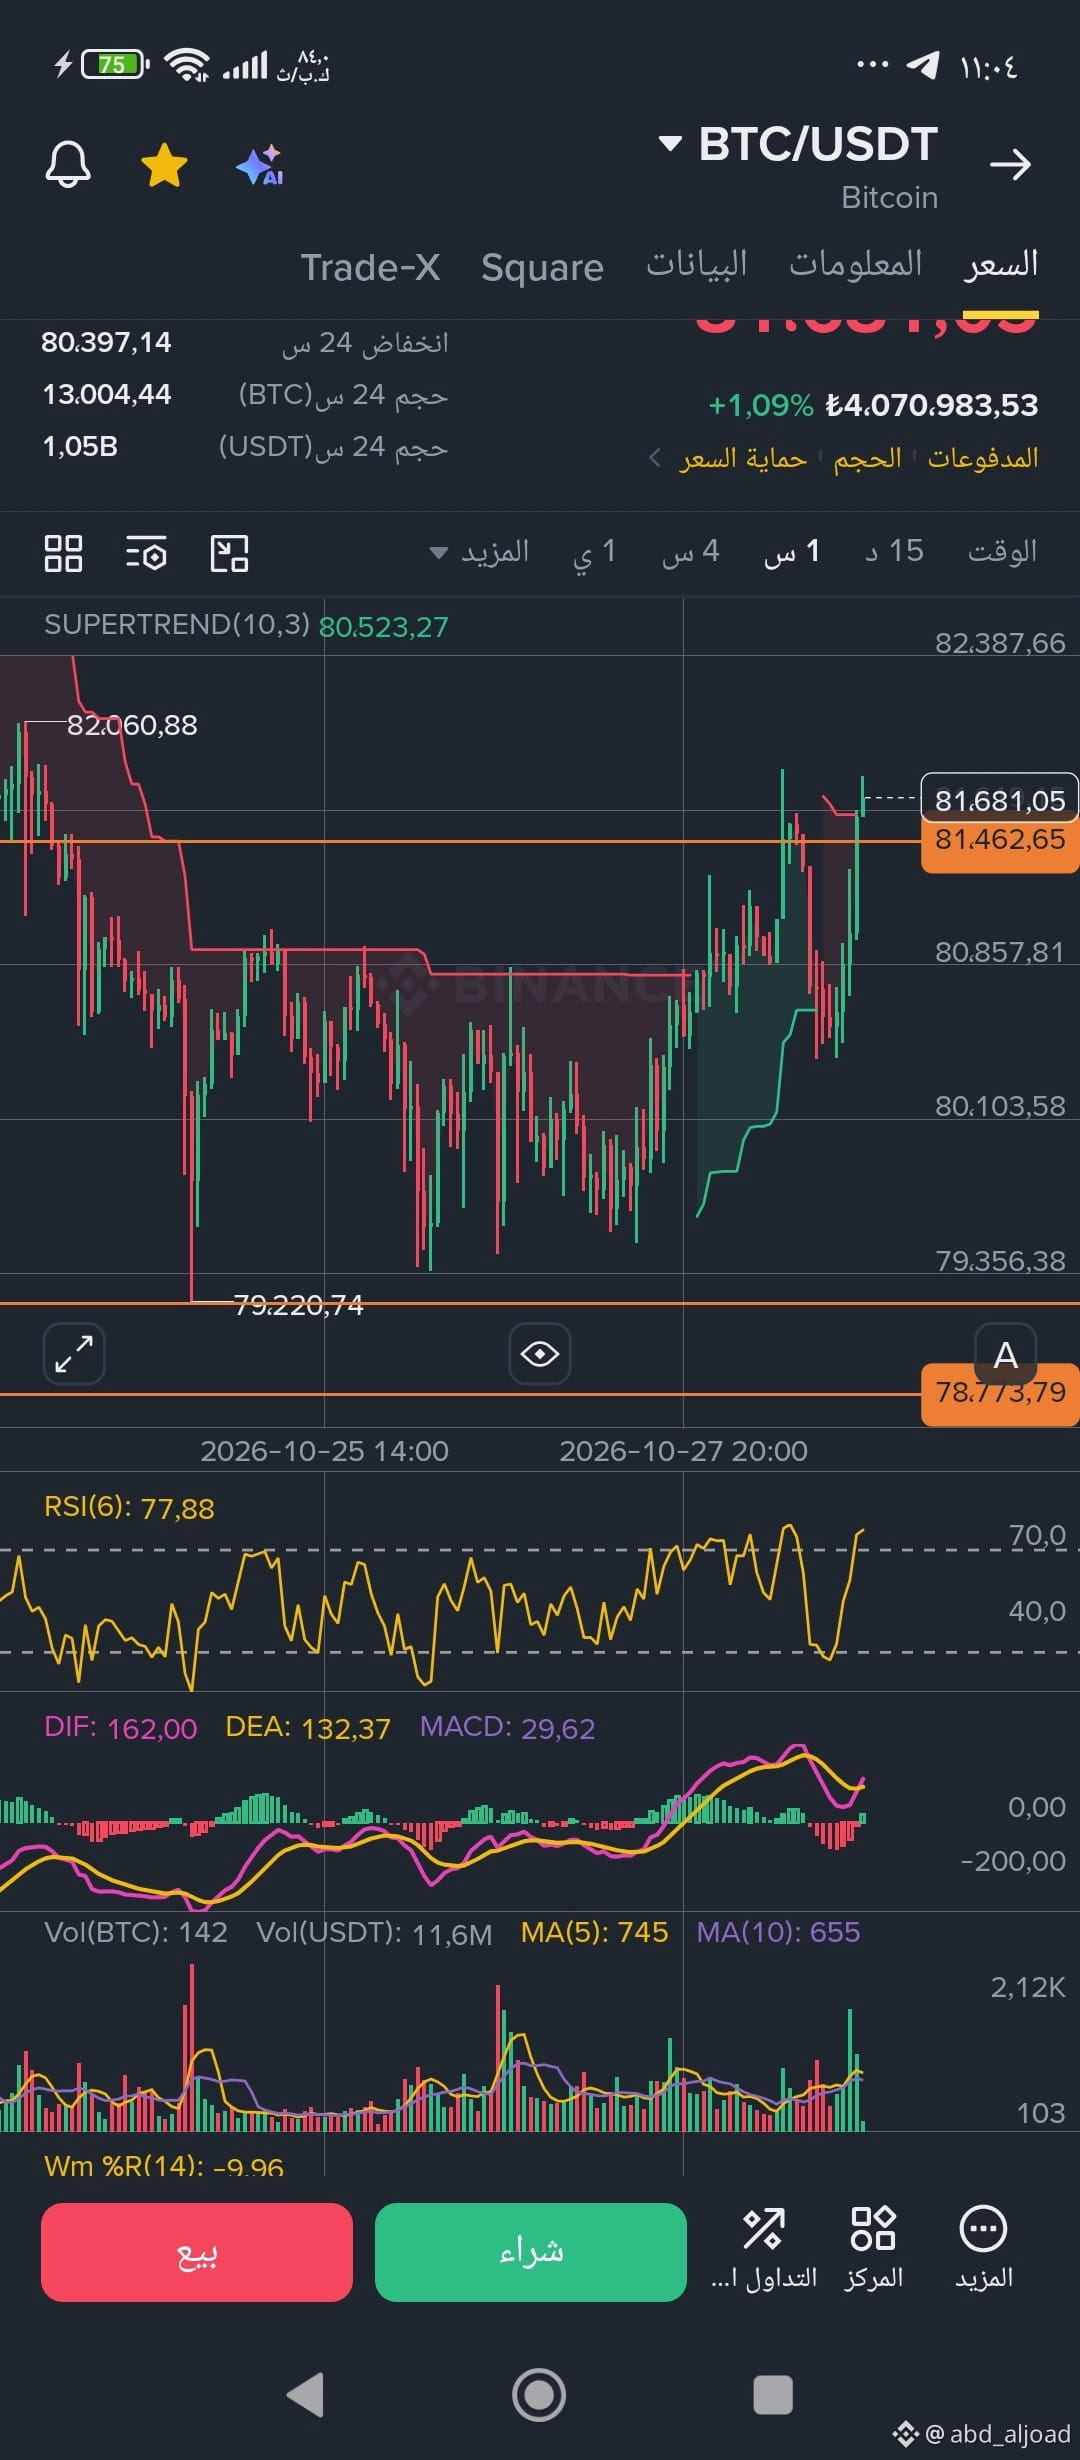
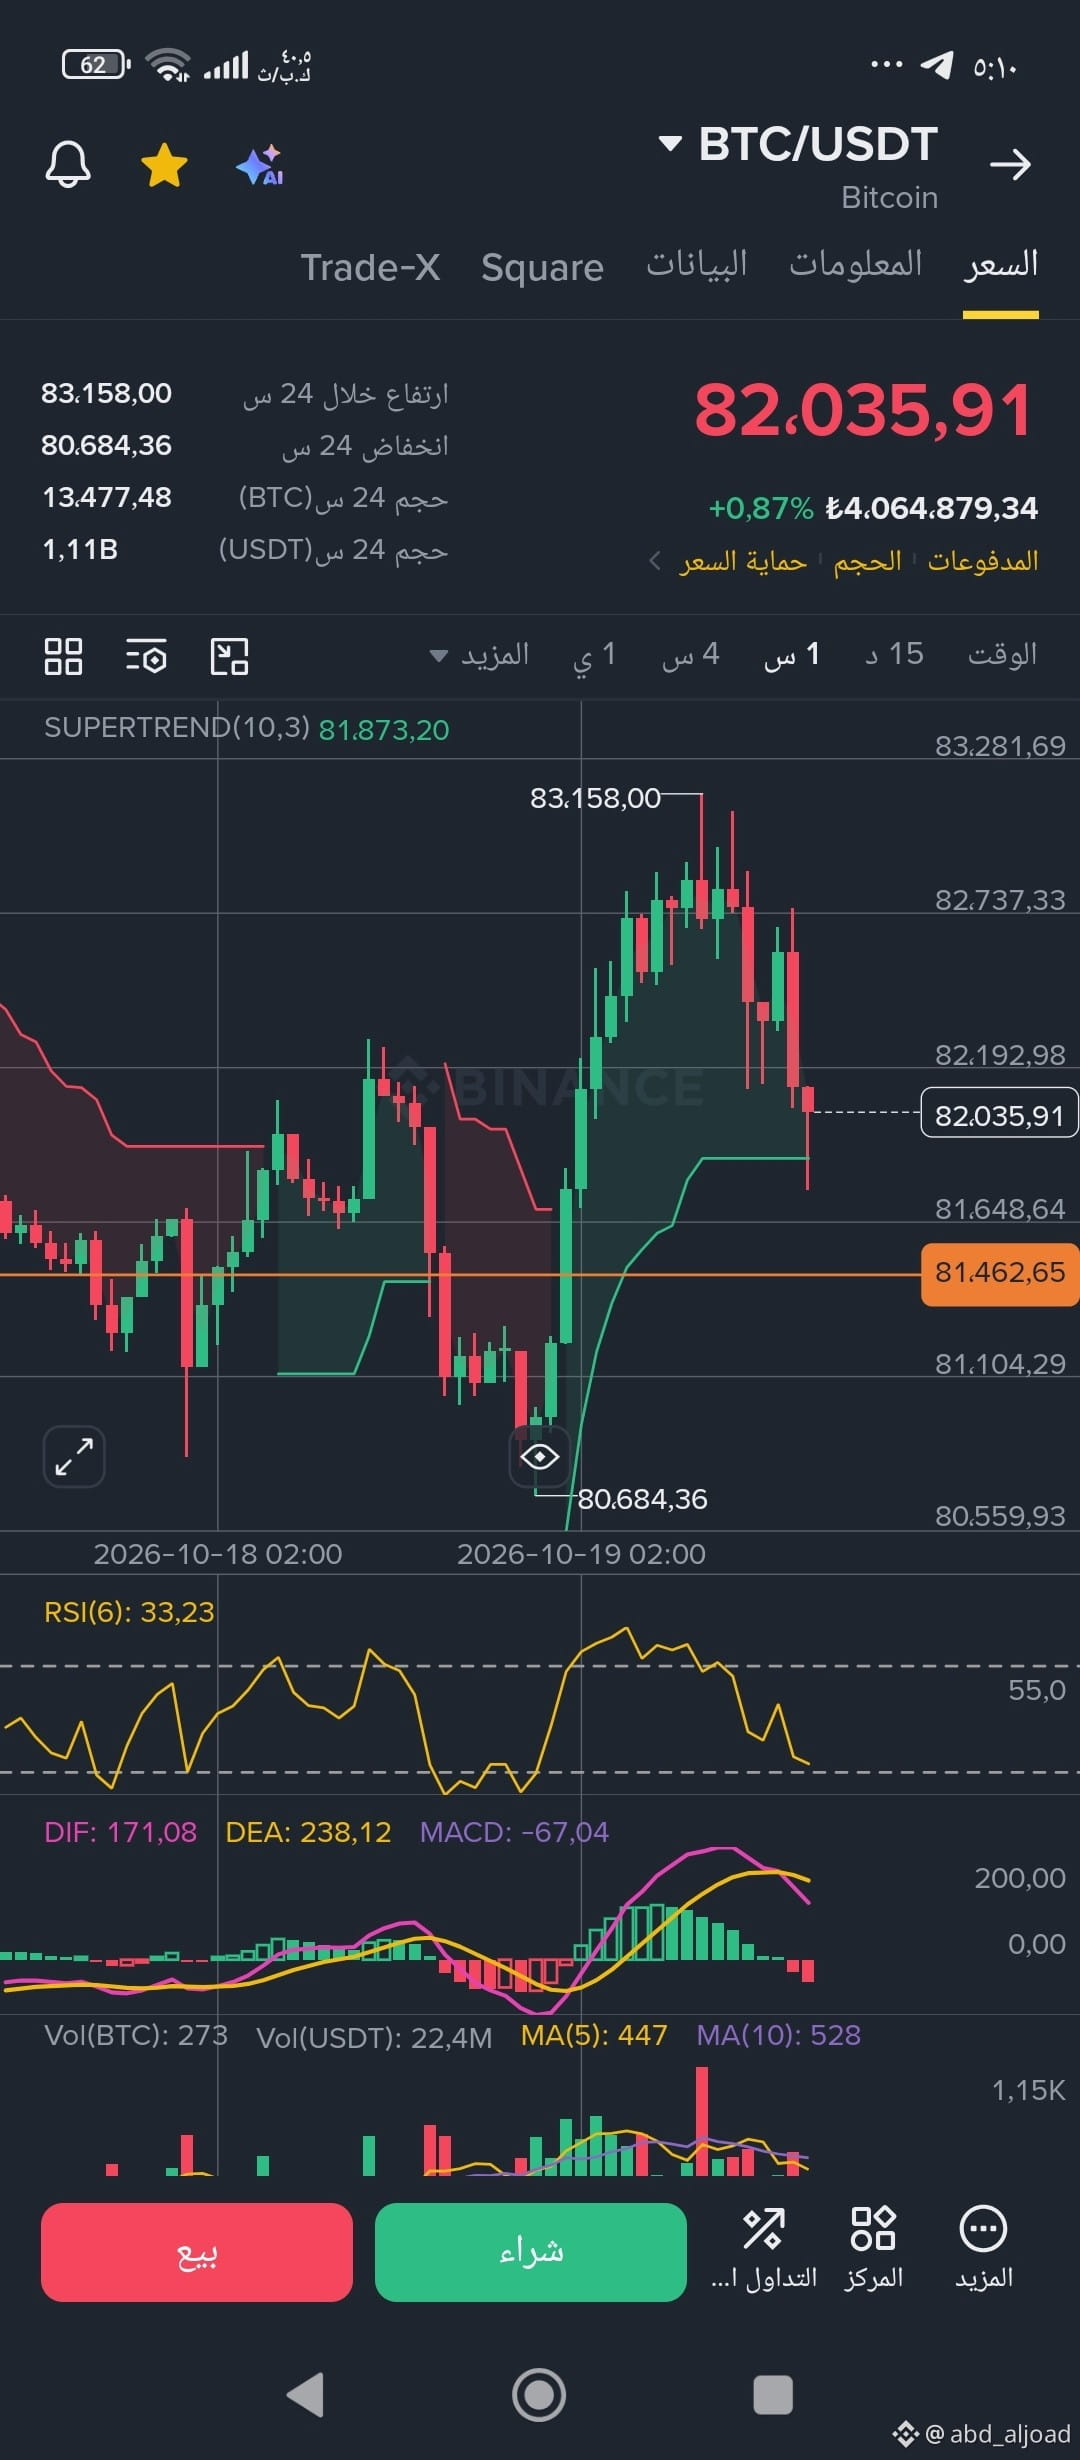
We are following and observing—we have reached the zero hour.
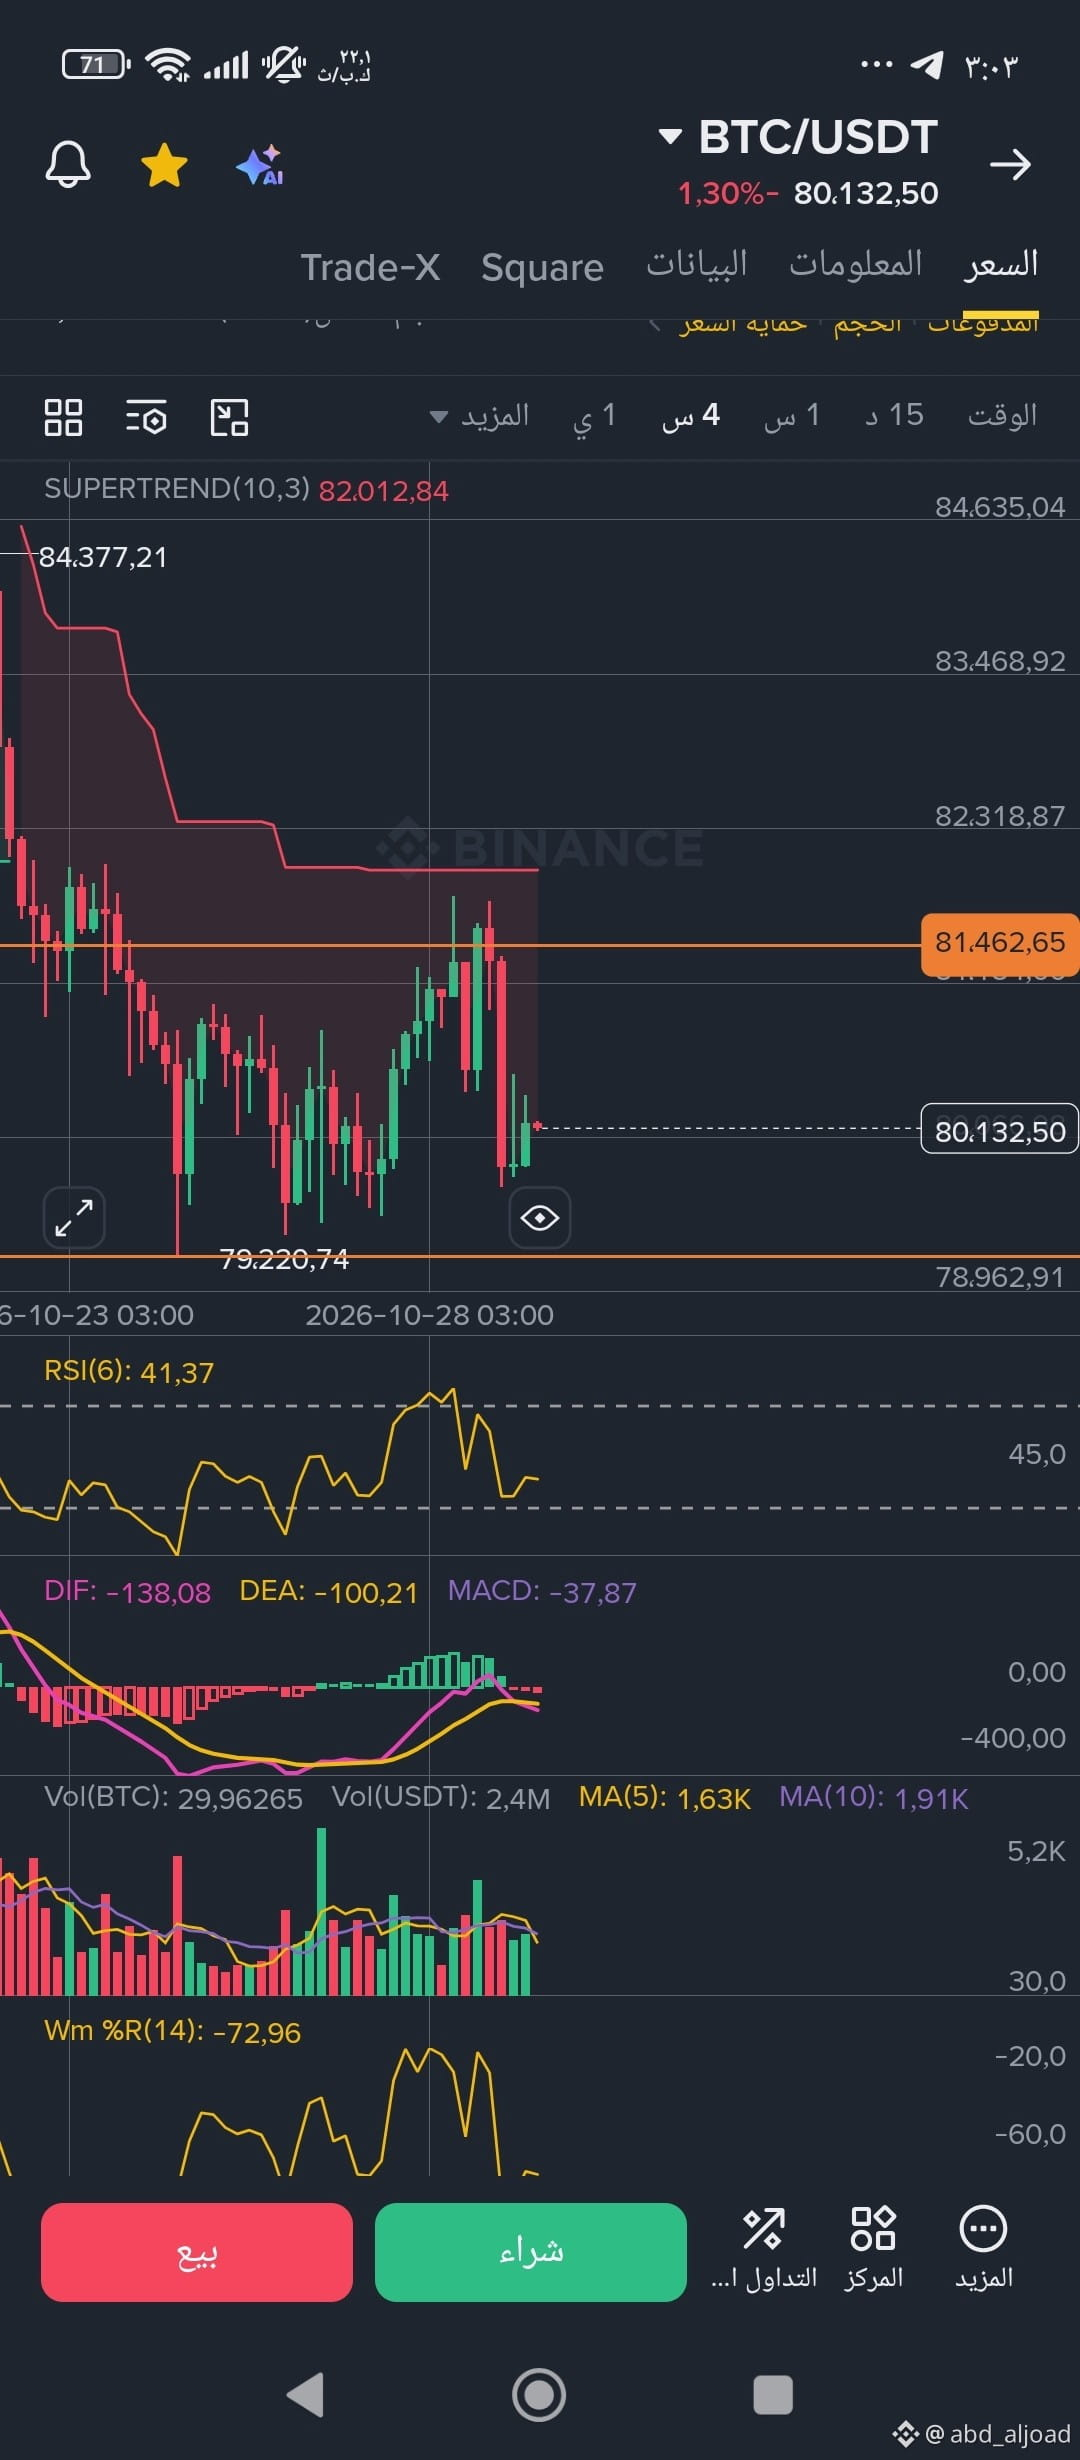
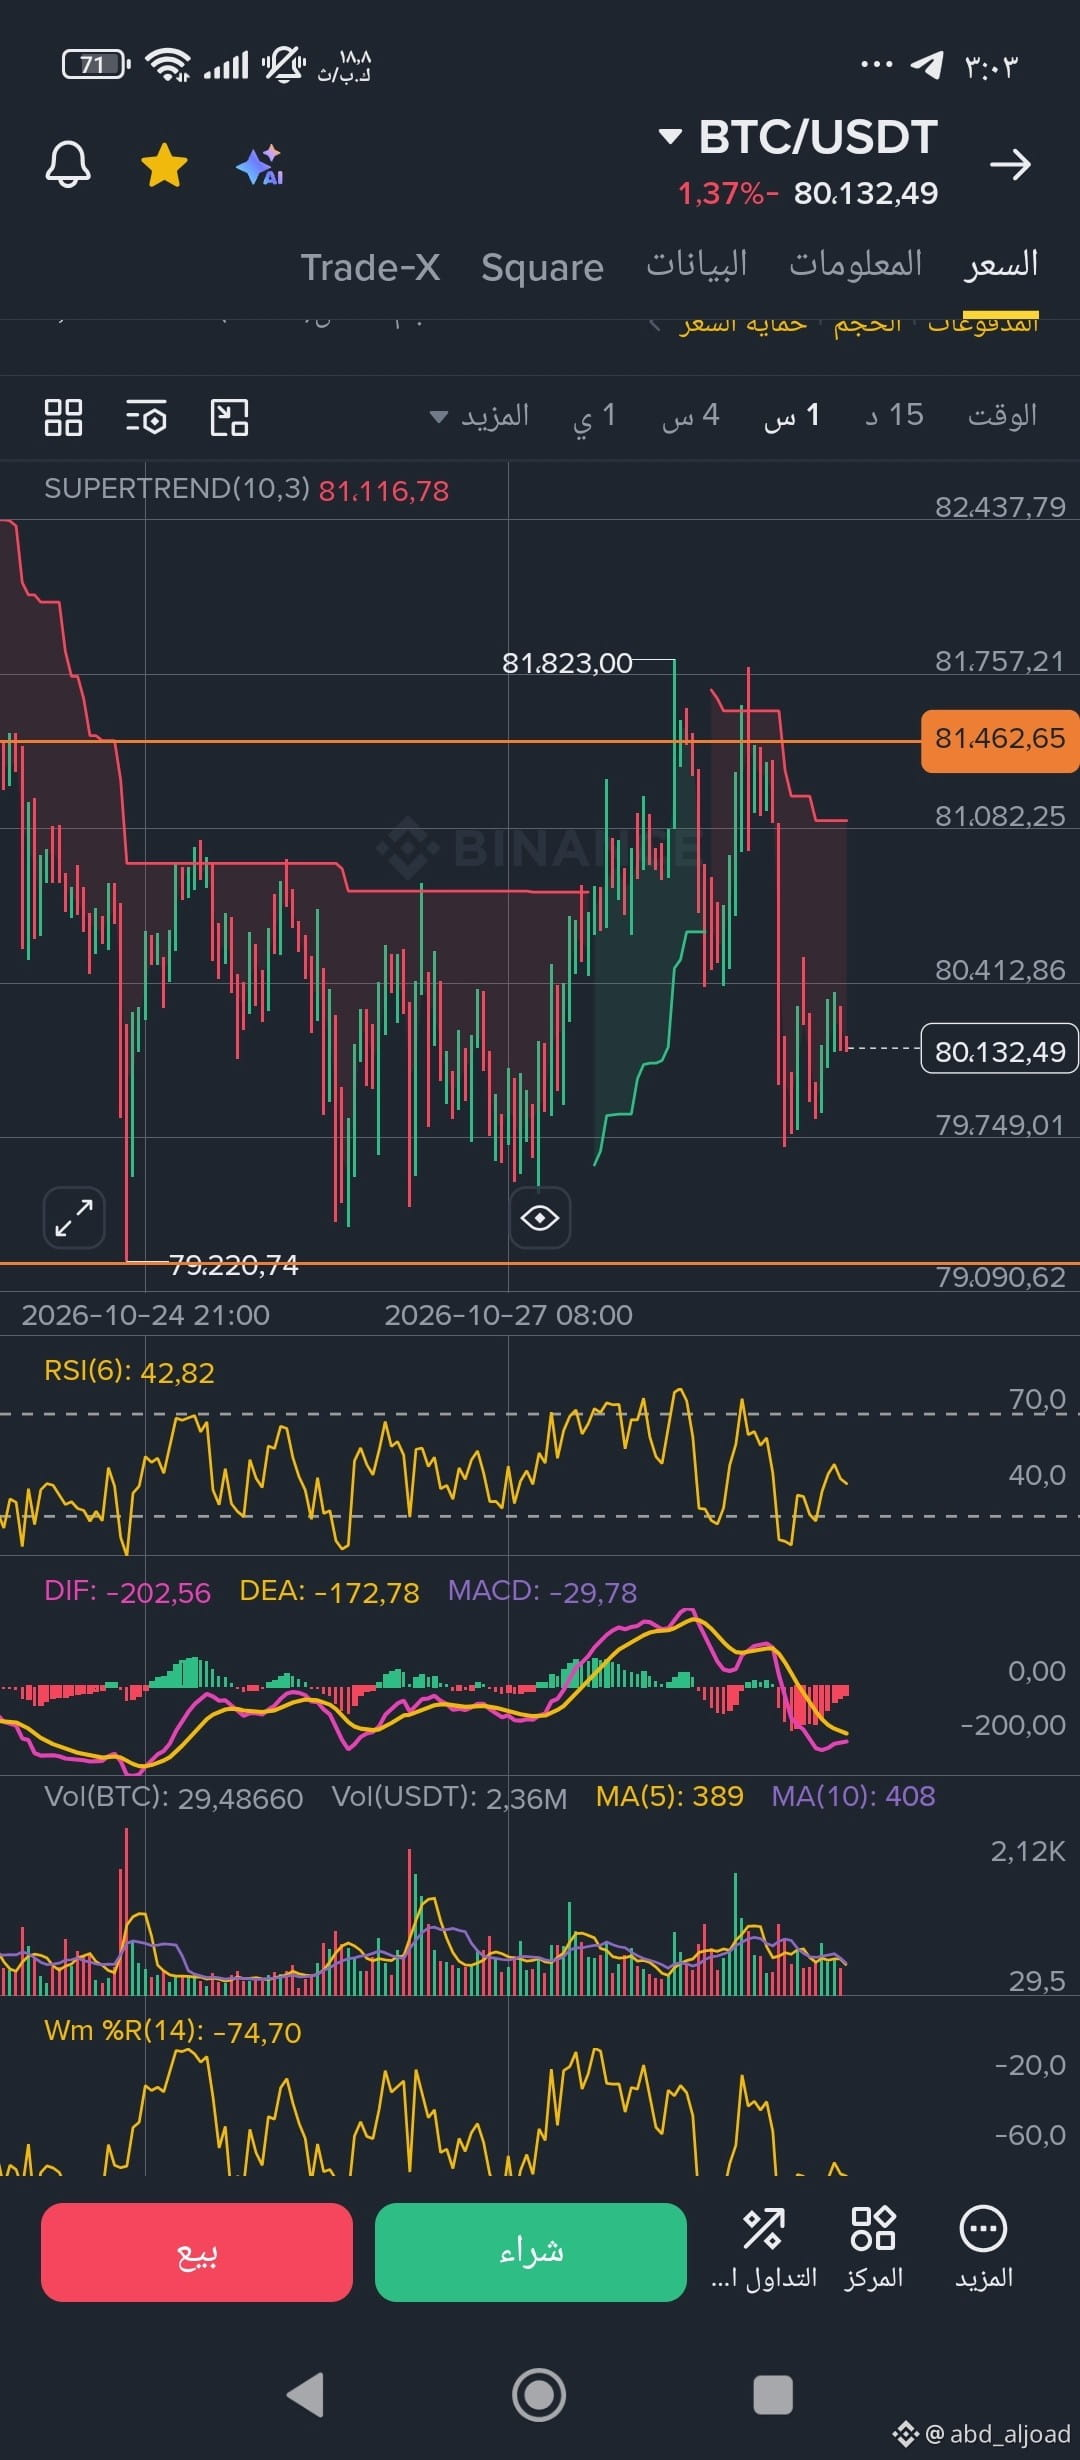
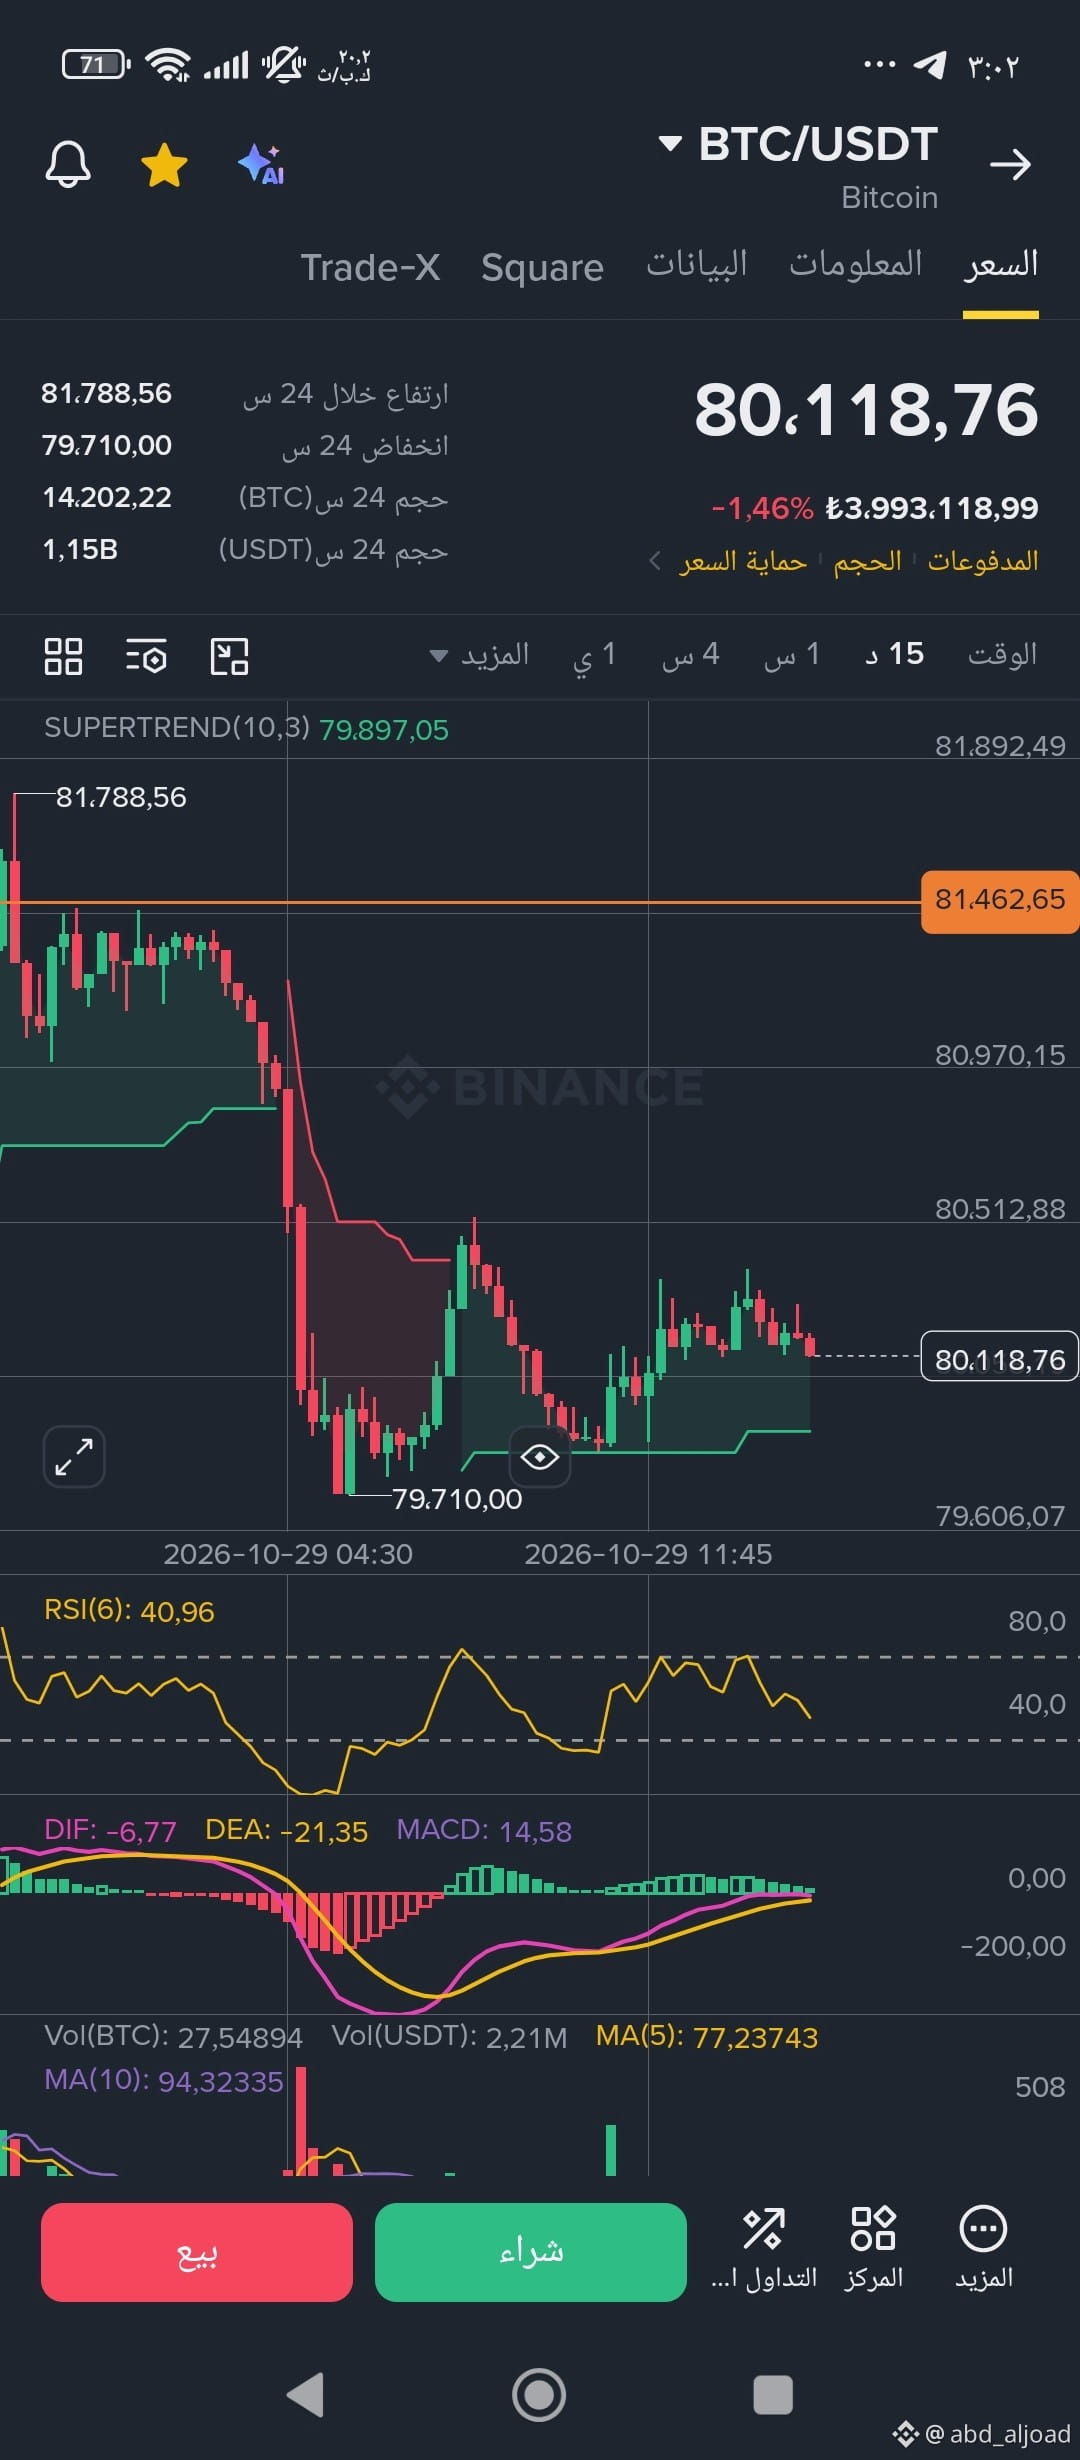
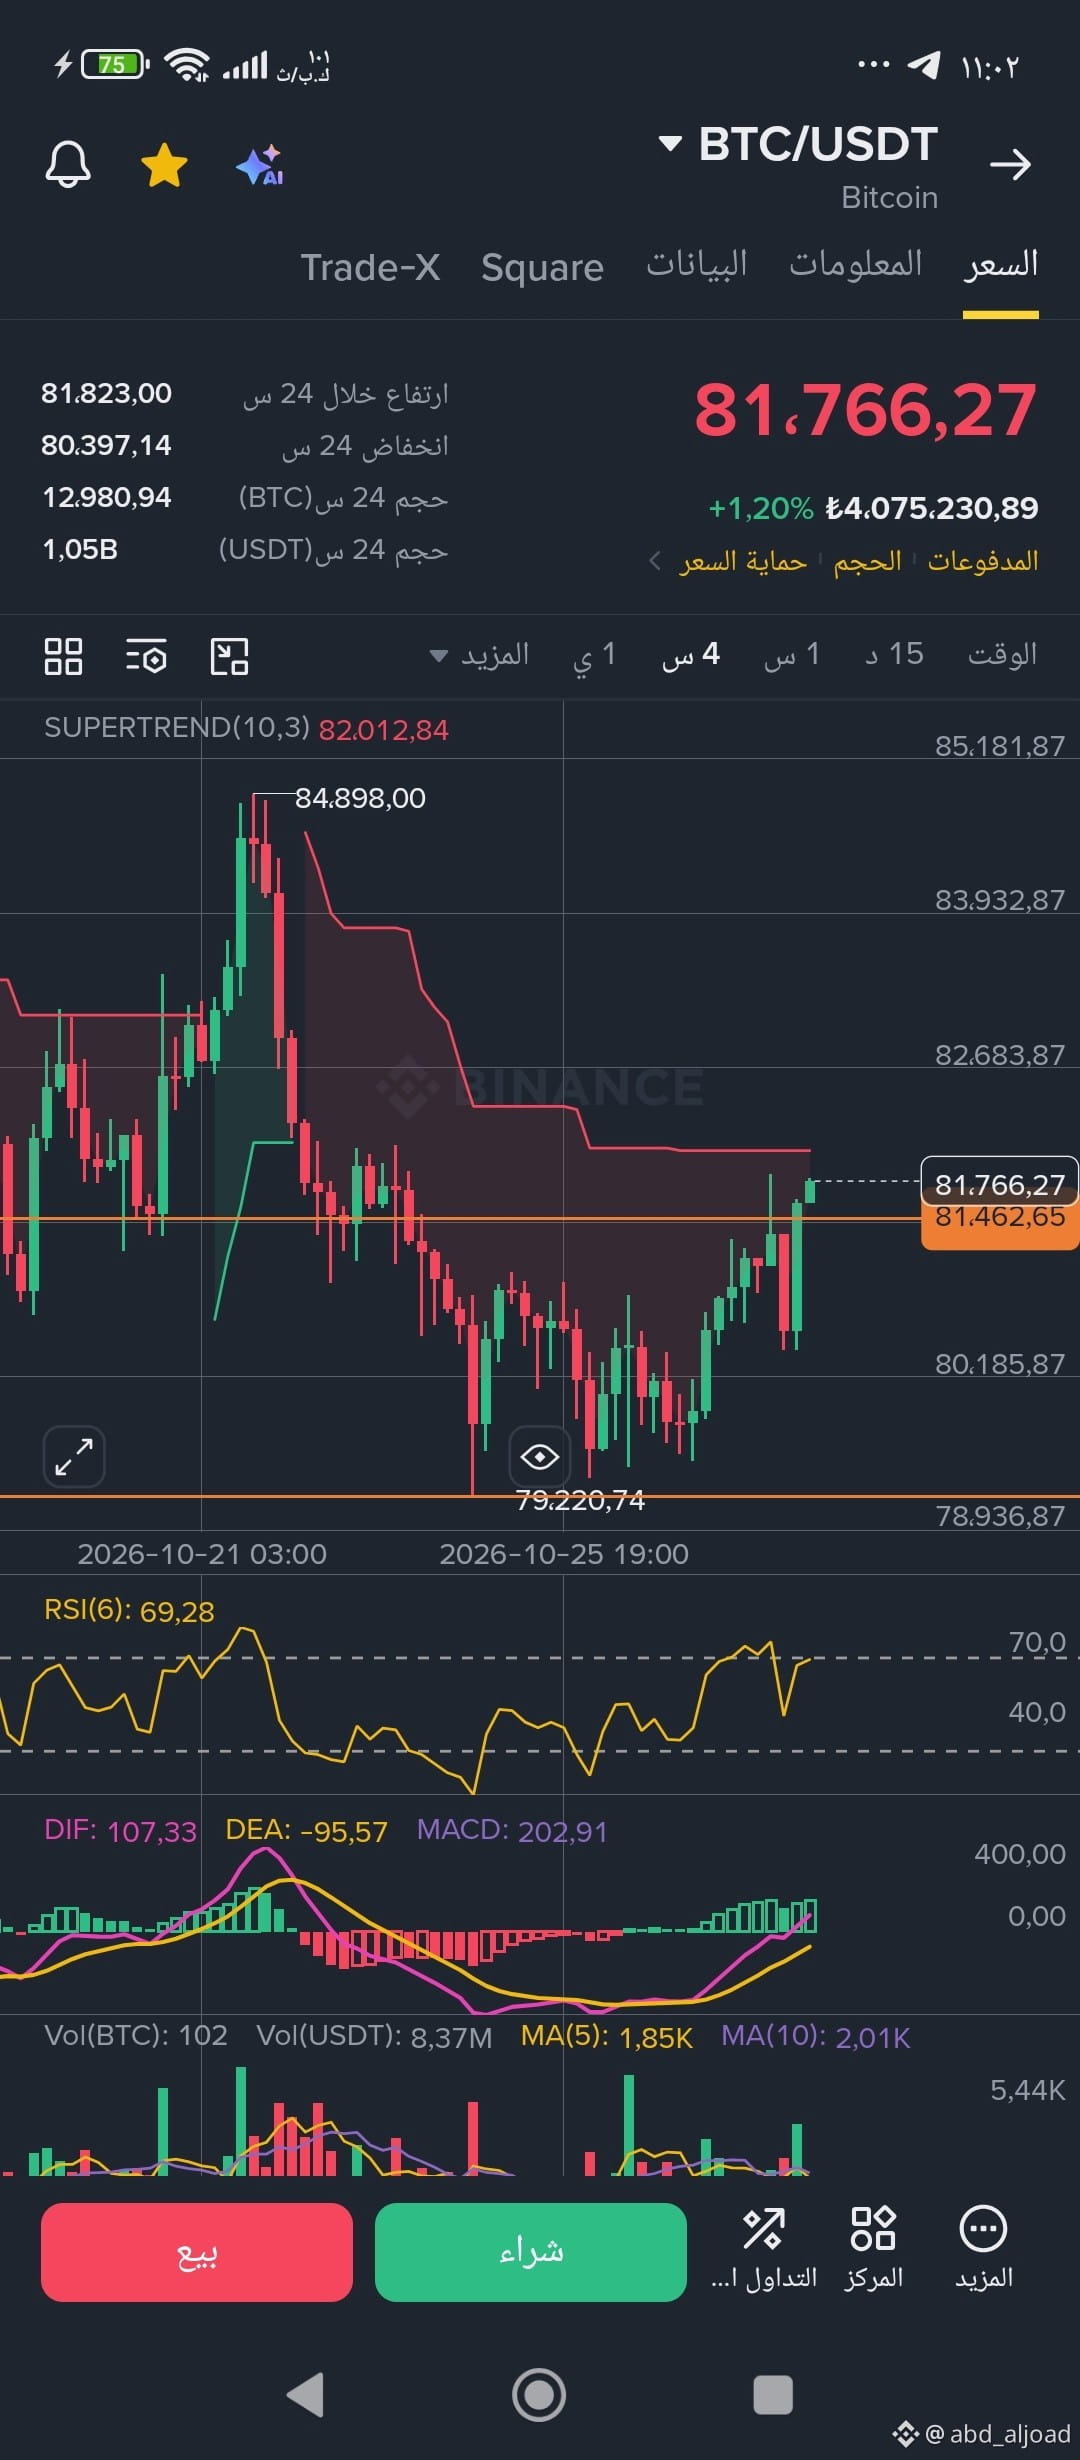
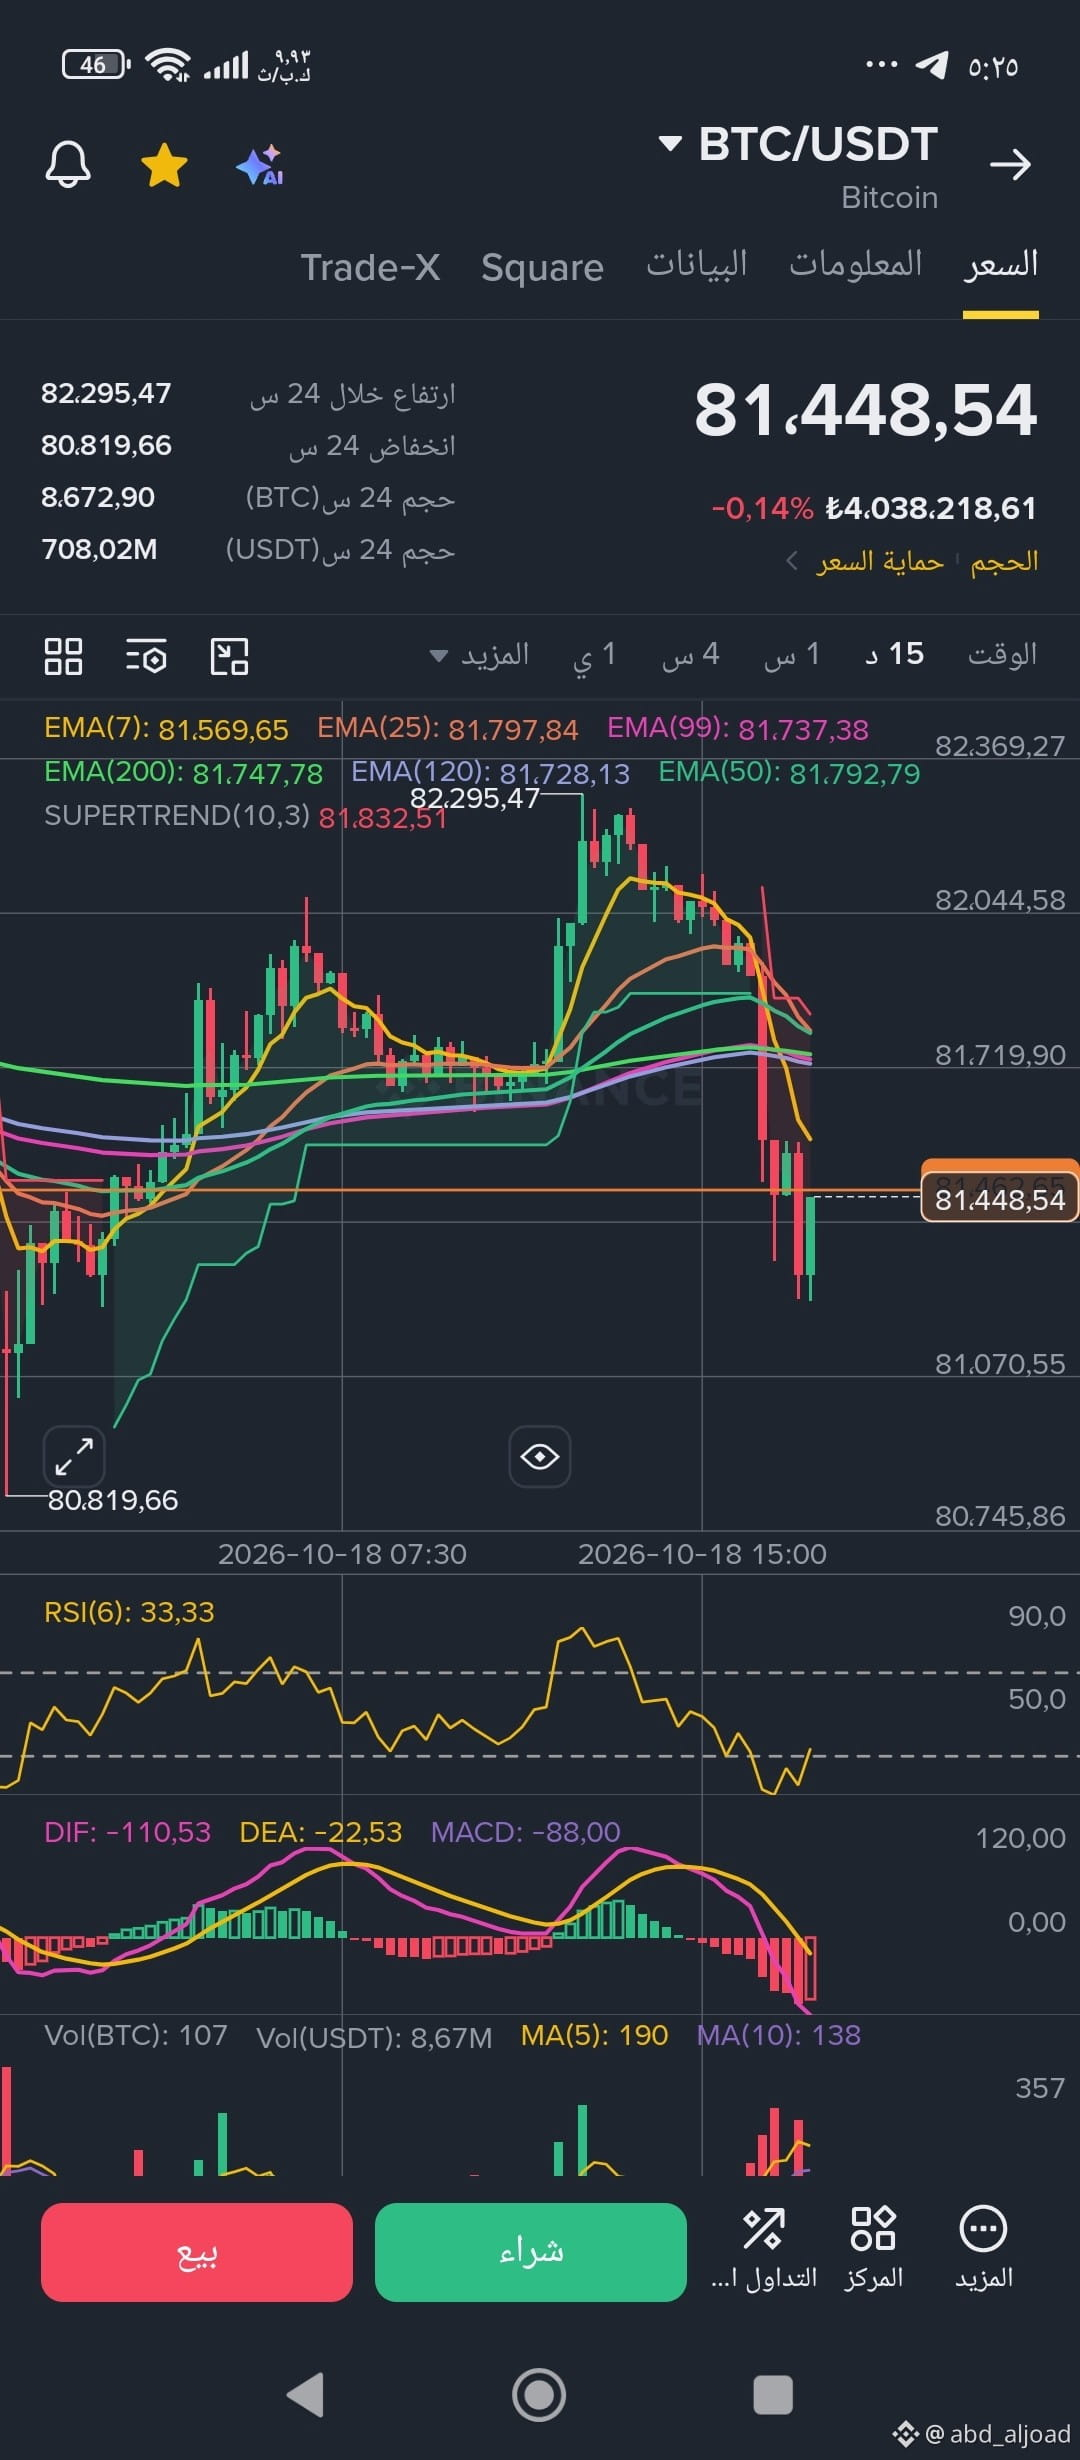
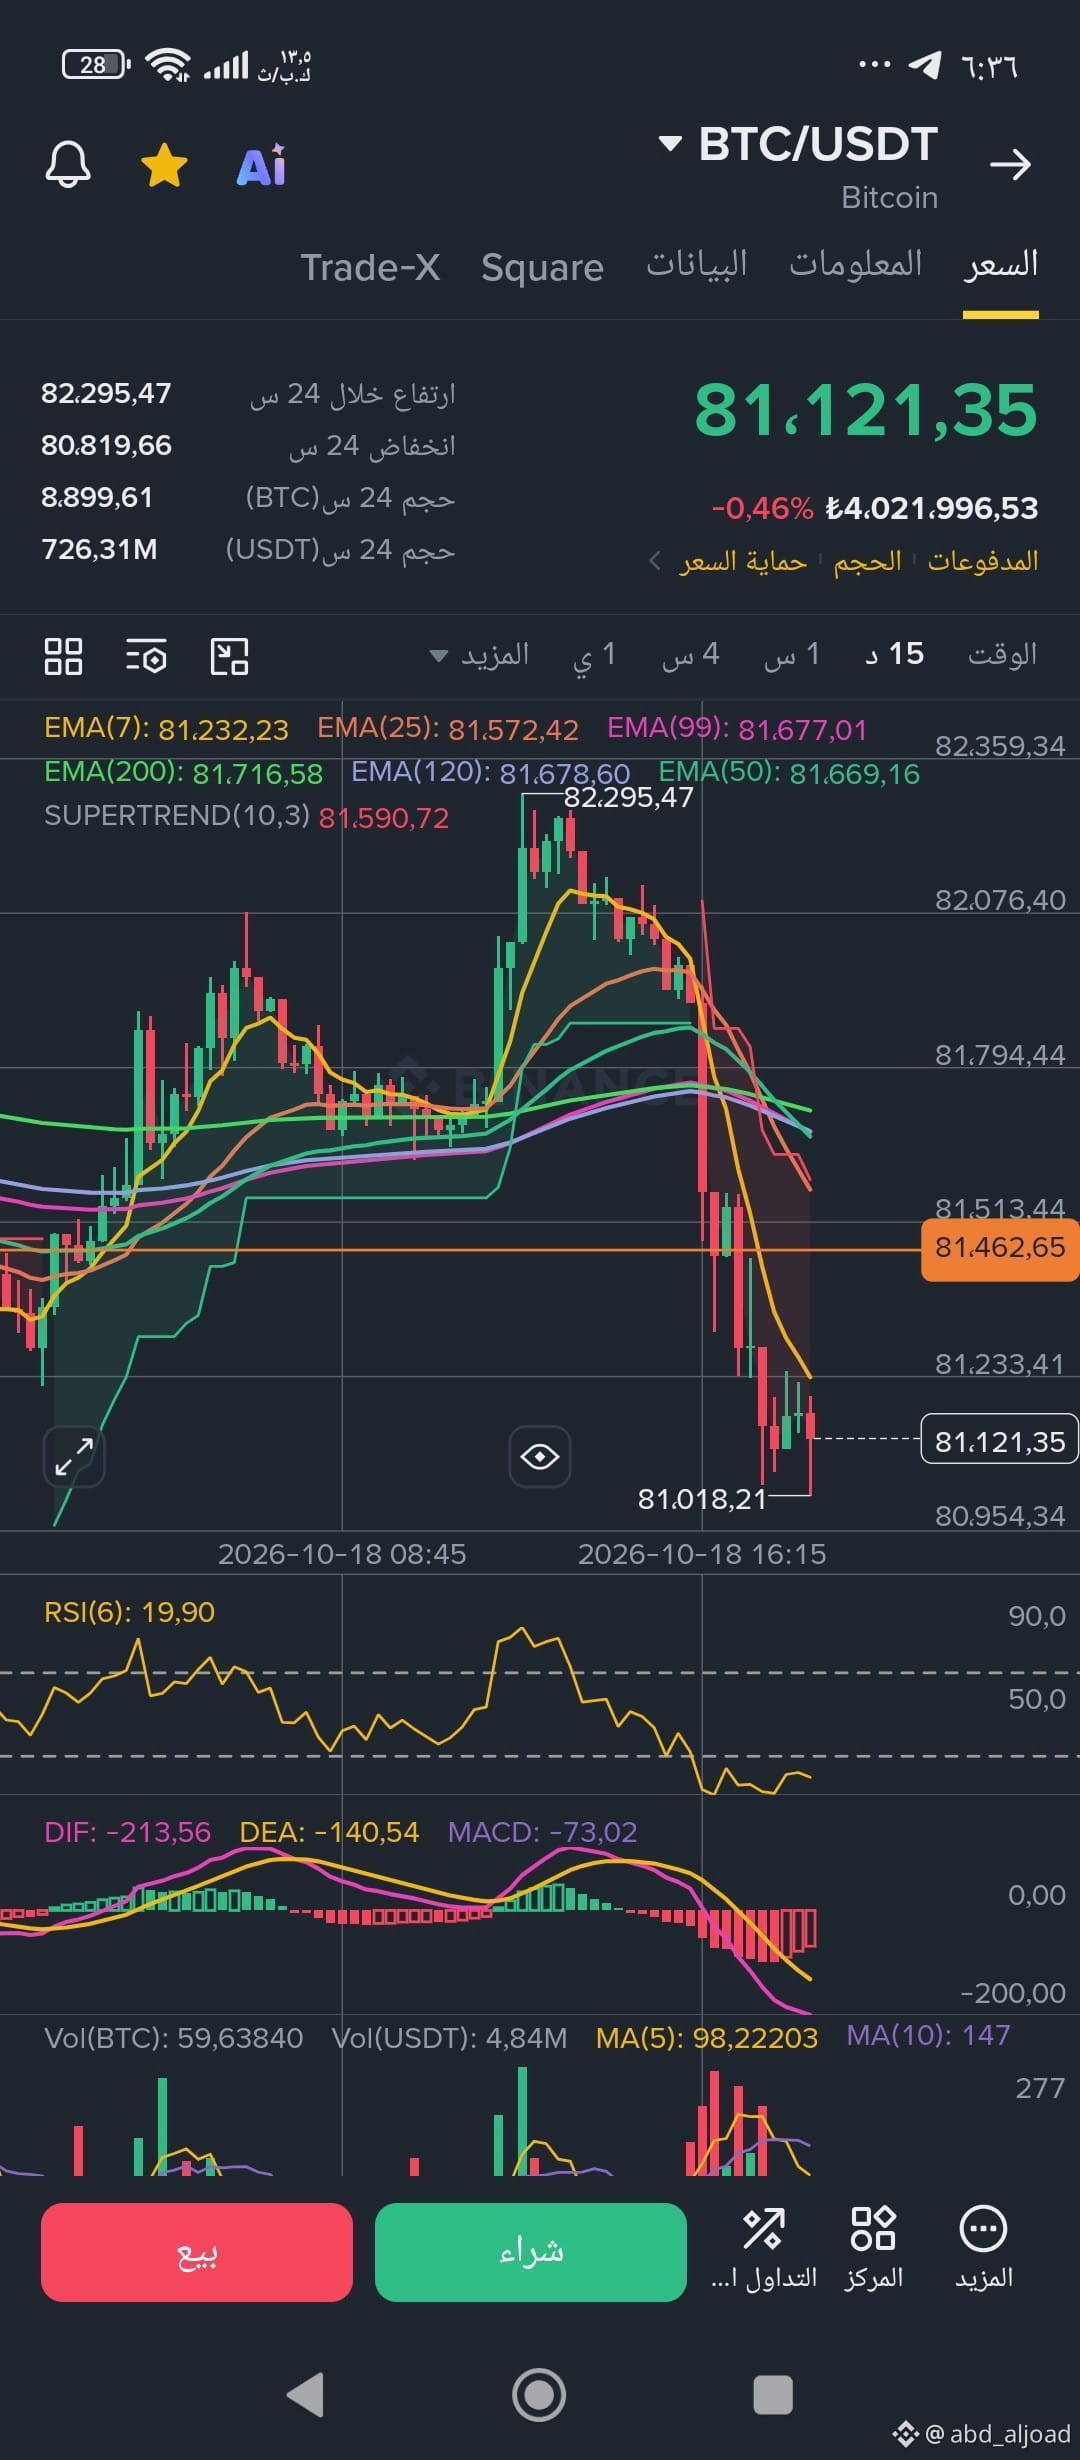
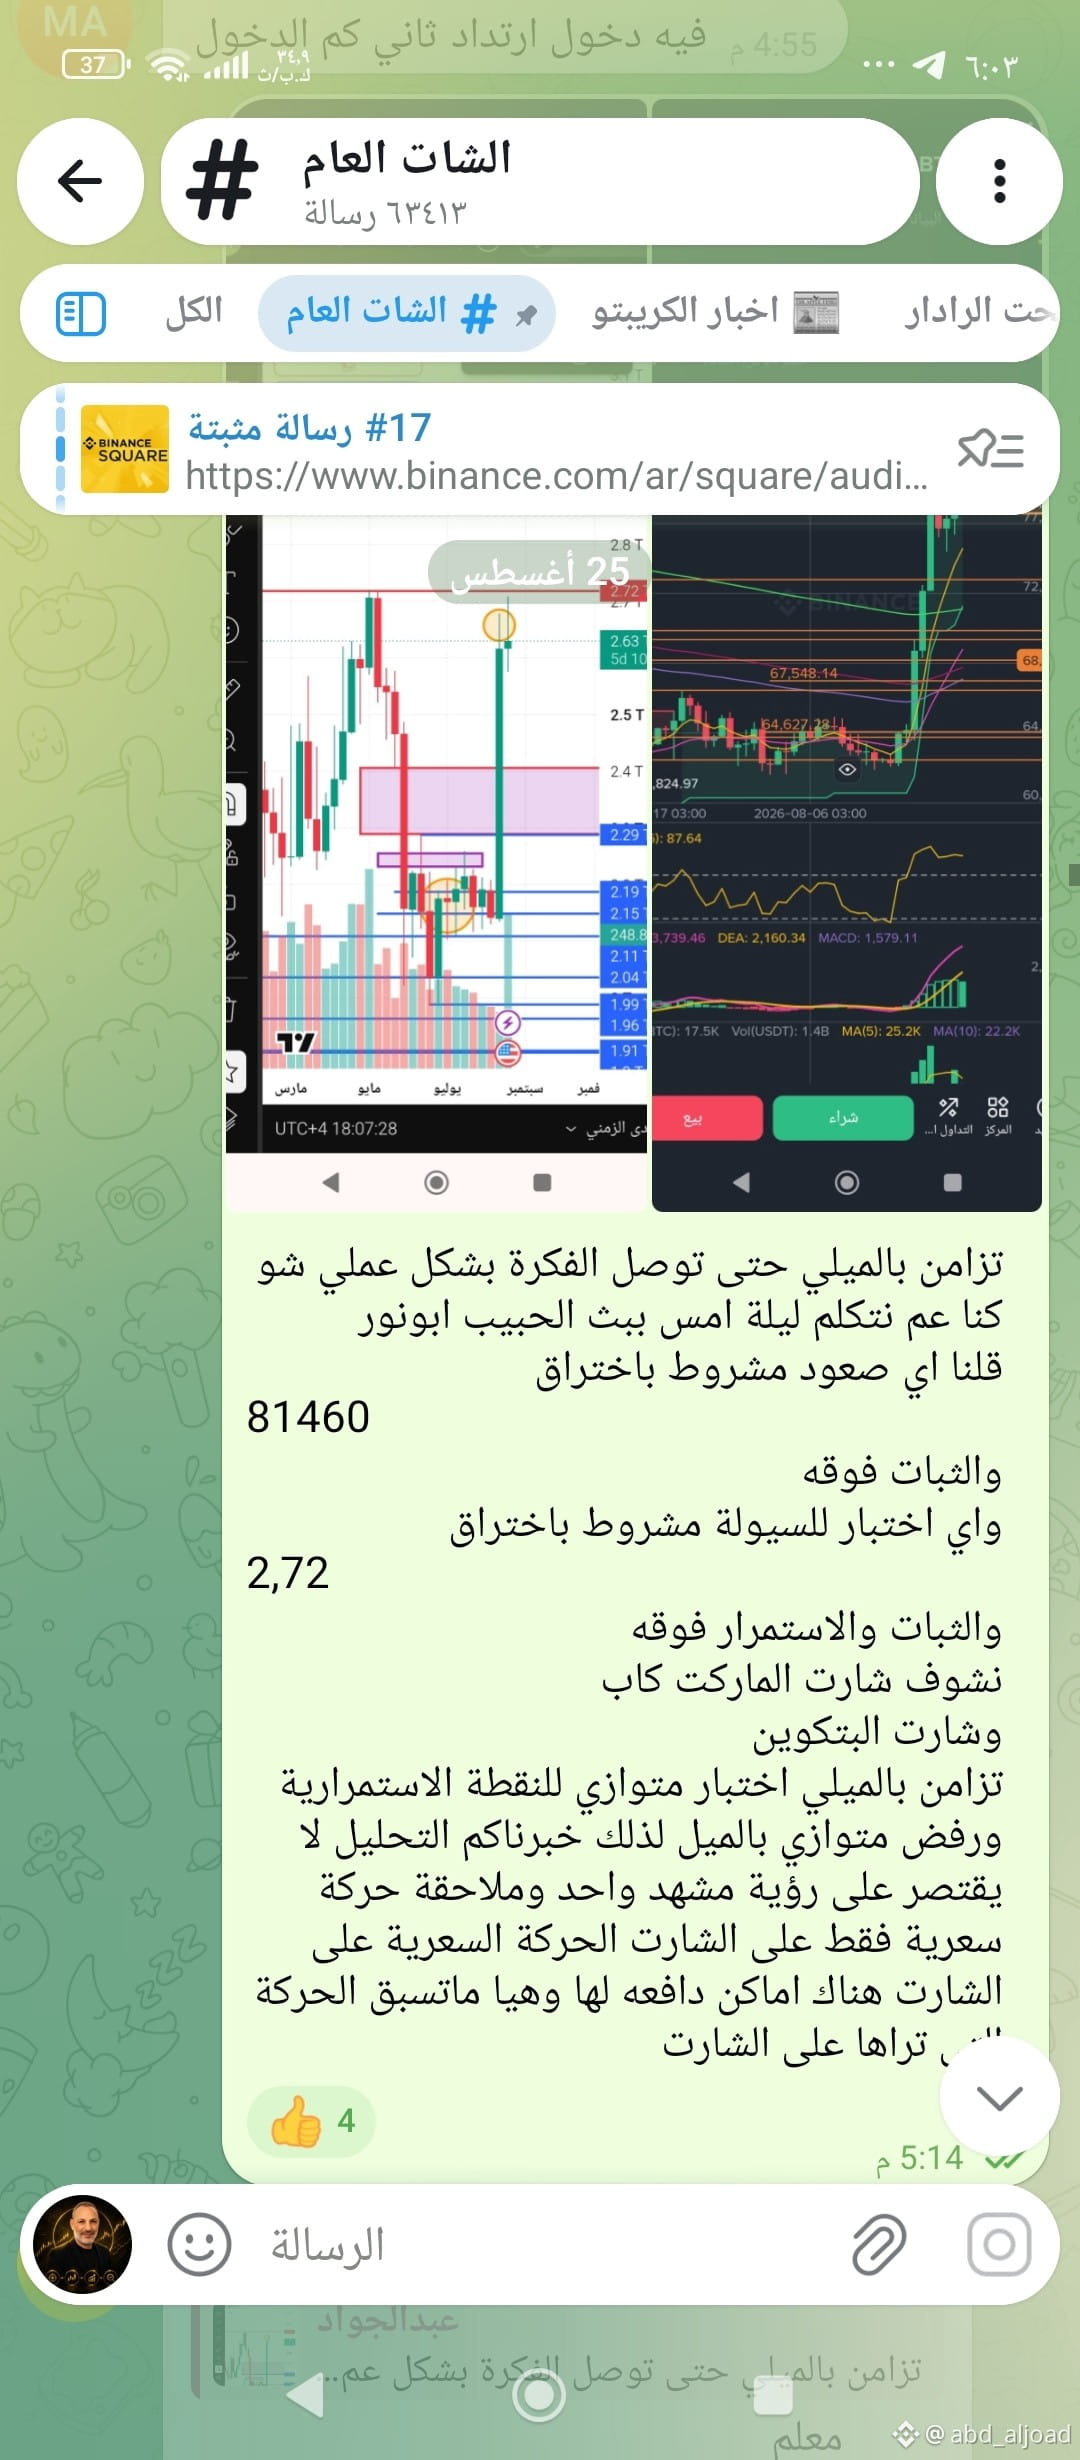
81462
If only you knew what this technical point means.
Know, dear observer: without this technical zone, and with all closes above this number, there will be no rise. Don’t let the price’s short-term movement deceive you. Your trades are safe as long as the price is above this number: a rise with real momentum, not price manipulation and false breakouts.
The market has still not given any signs of a strong recovery.
The most important things to monitor now are the monthly close in a few days—at what level will it close?—and, more importantly, the close of the first week of next month. These will show the strength of the market’s momentum, based on the technical zones where the closes occur.
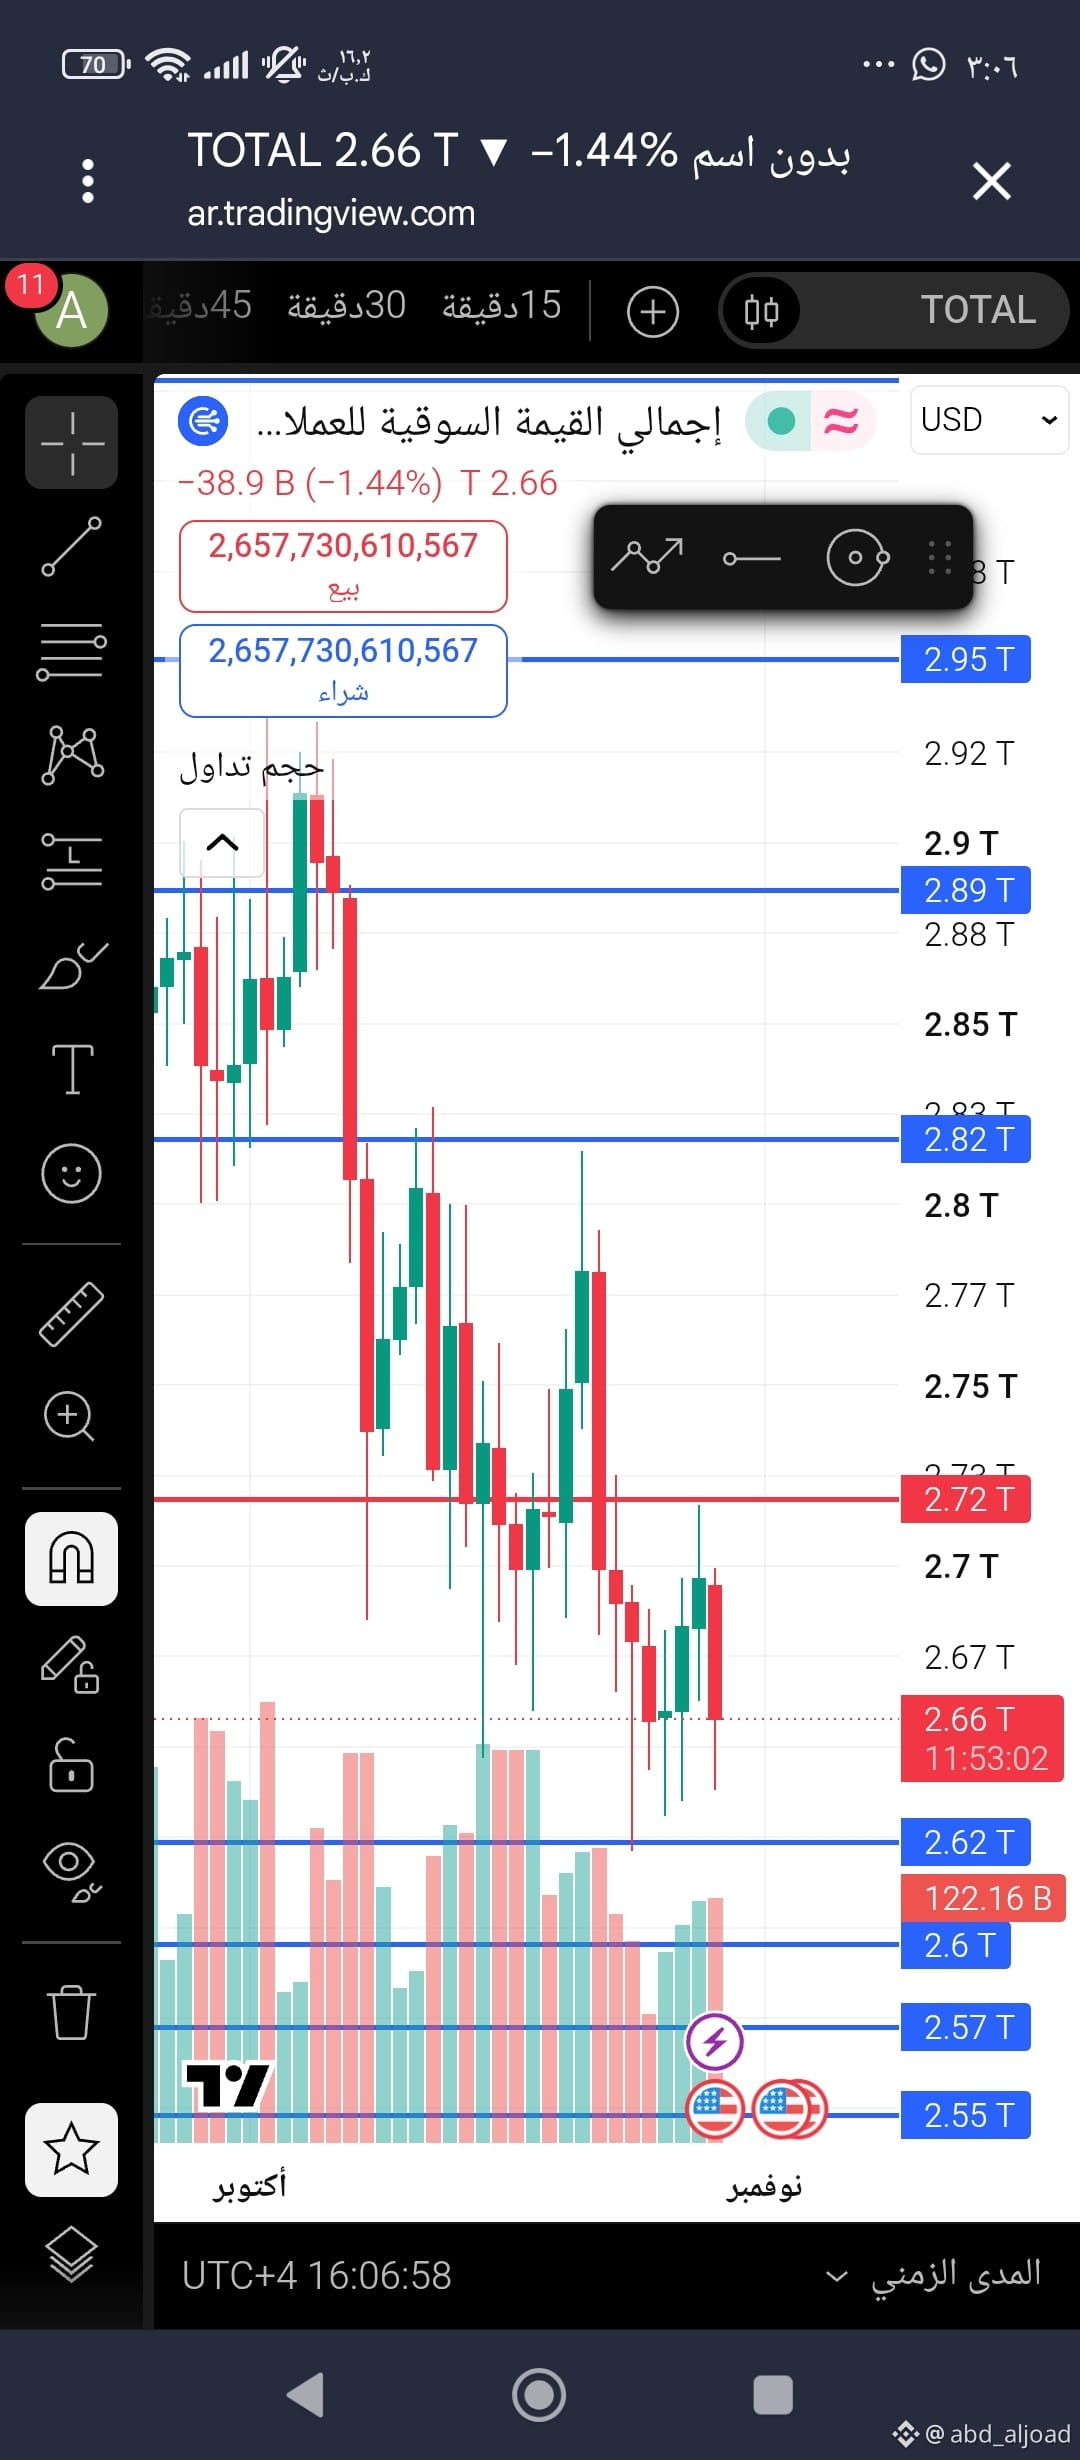
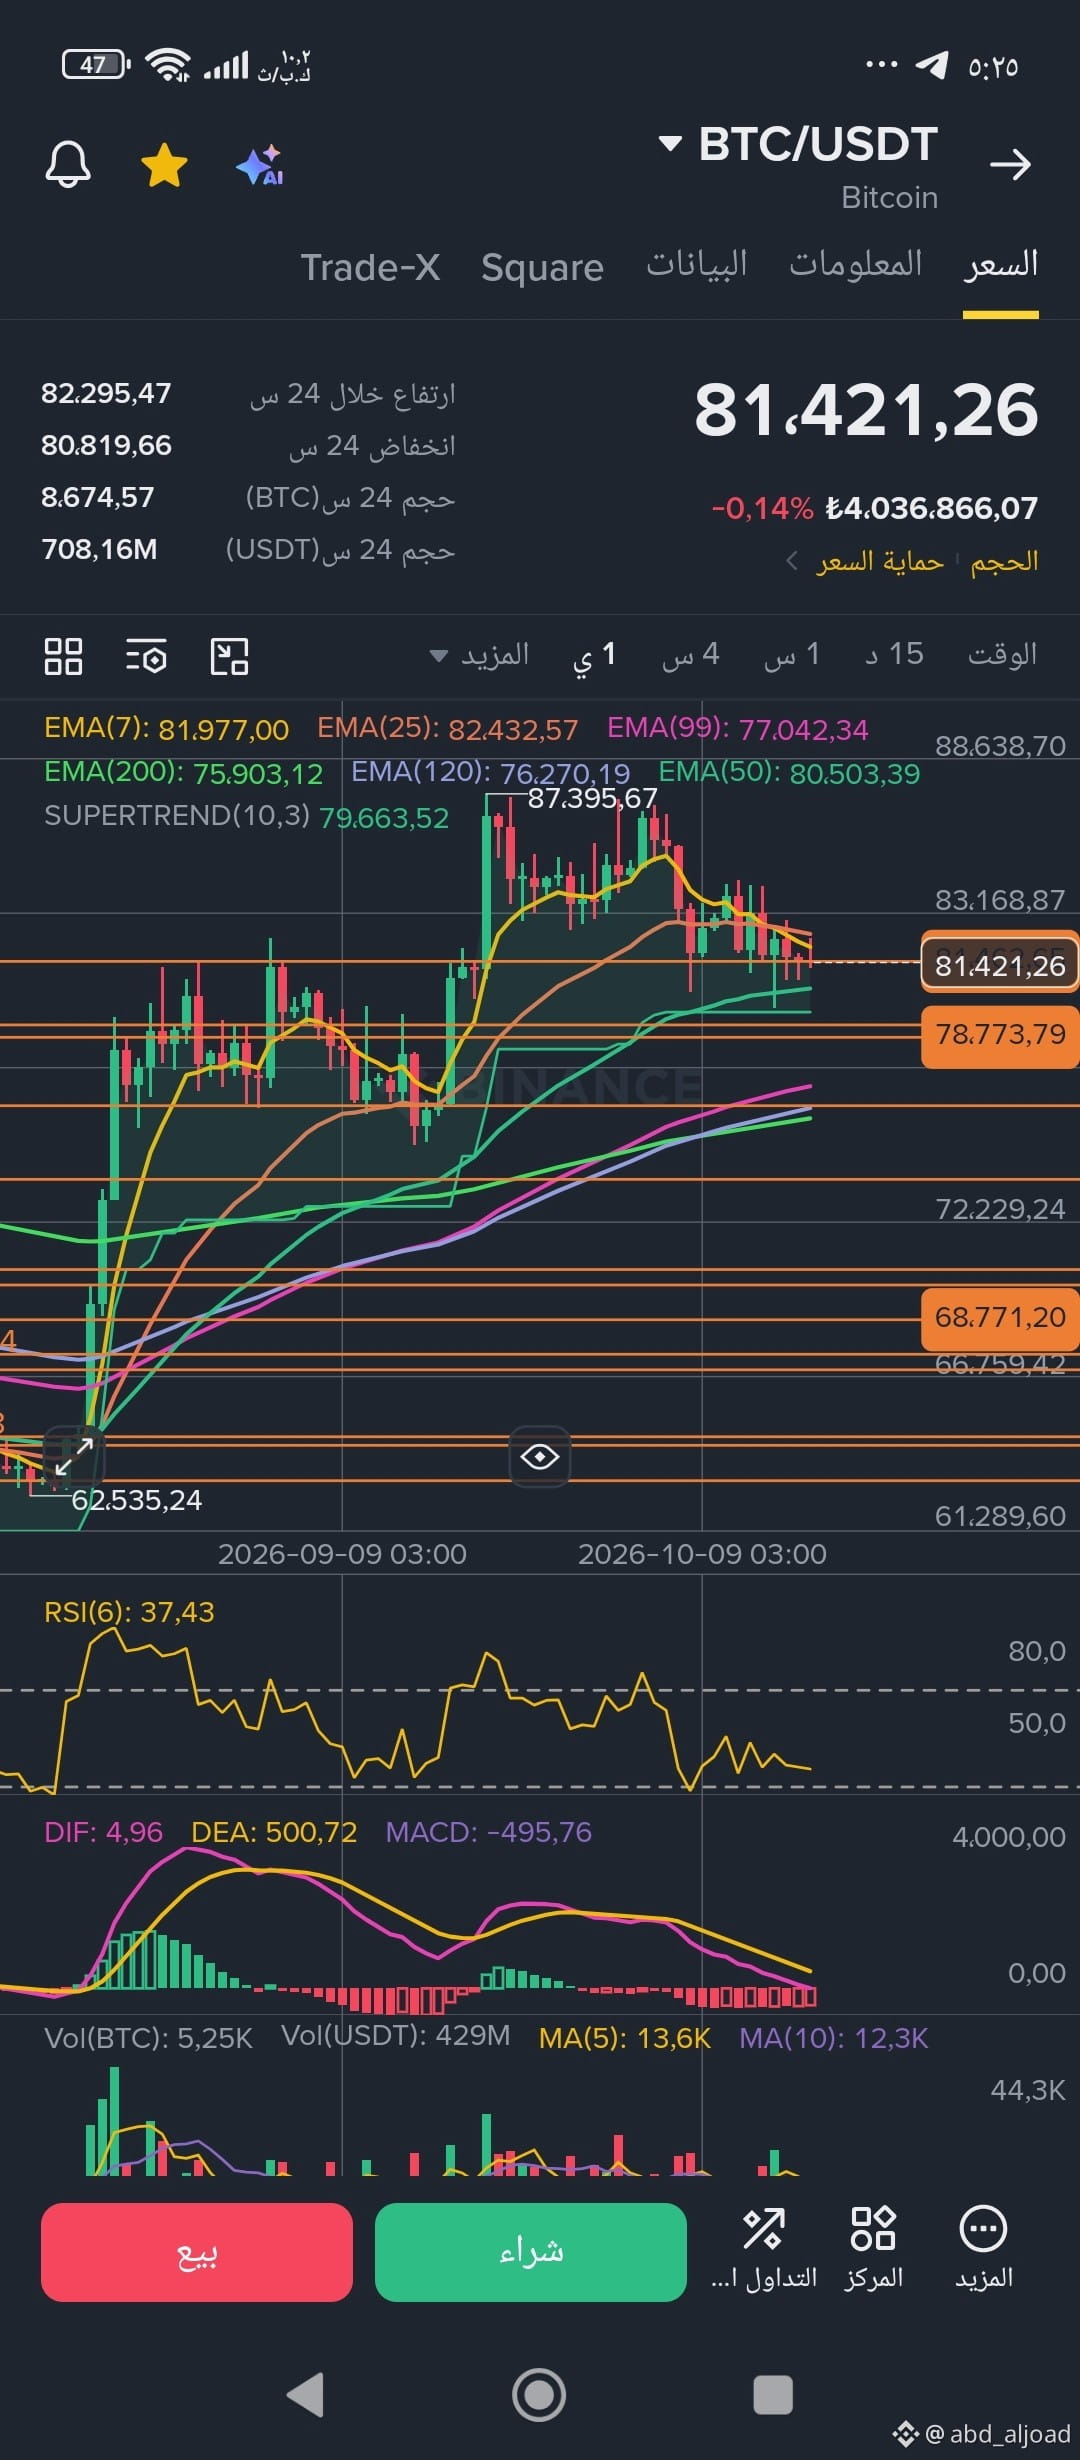
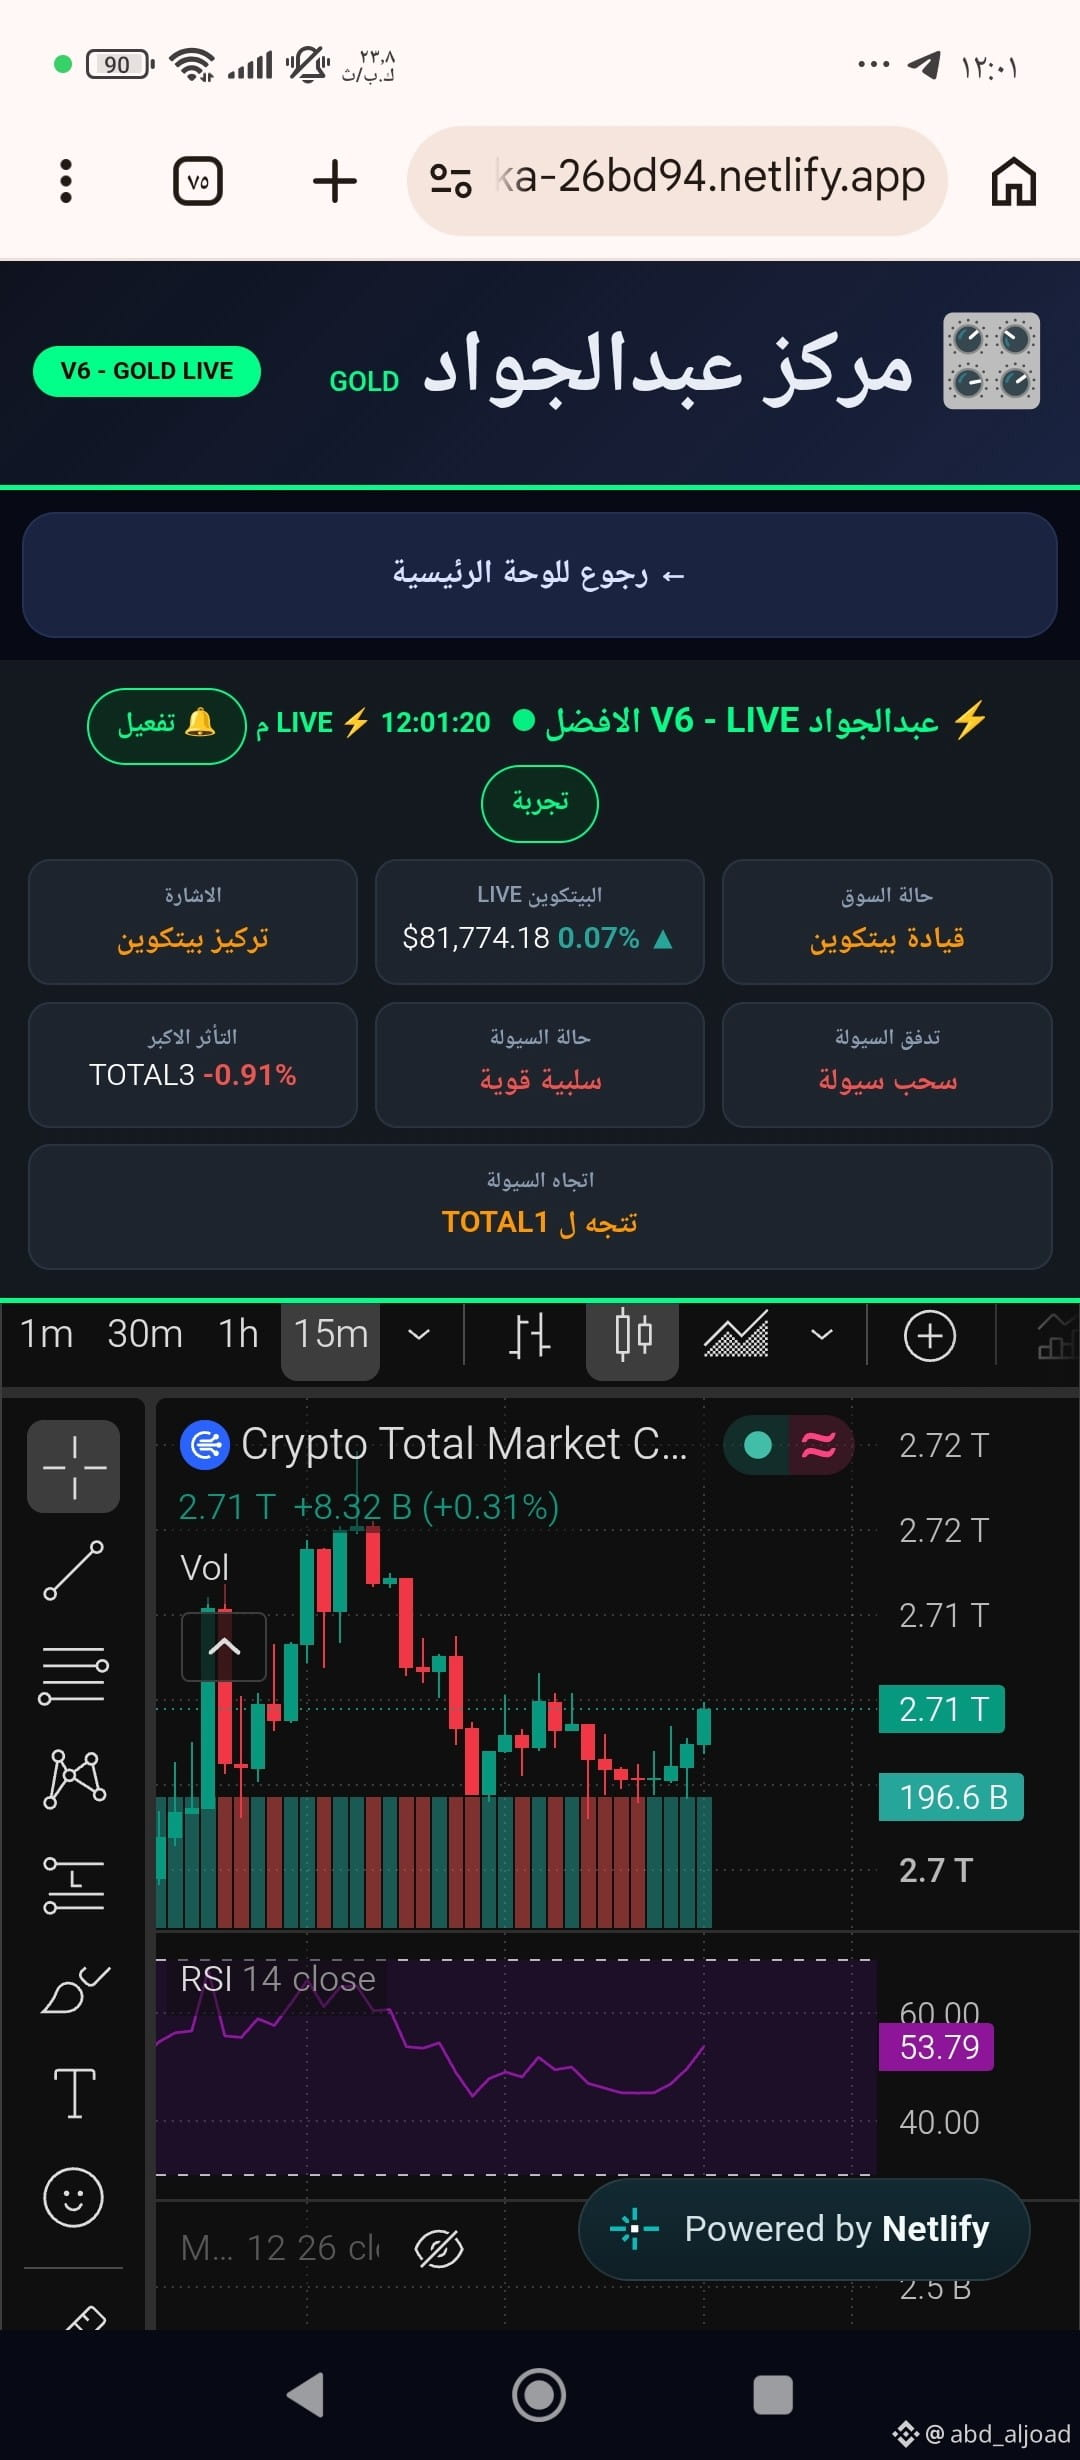
Also monitor liquidity strength in the market cap: is the market cap recovering, turning around, and breaking through the fiercest resistance it currently faces at 2,72T?
Making it a strong support zone would be reflected in Bitcoin’s price action as it breaks through the pivotal decision point at 81462 and makes it a support zone that no weekly close can break below.
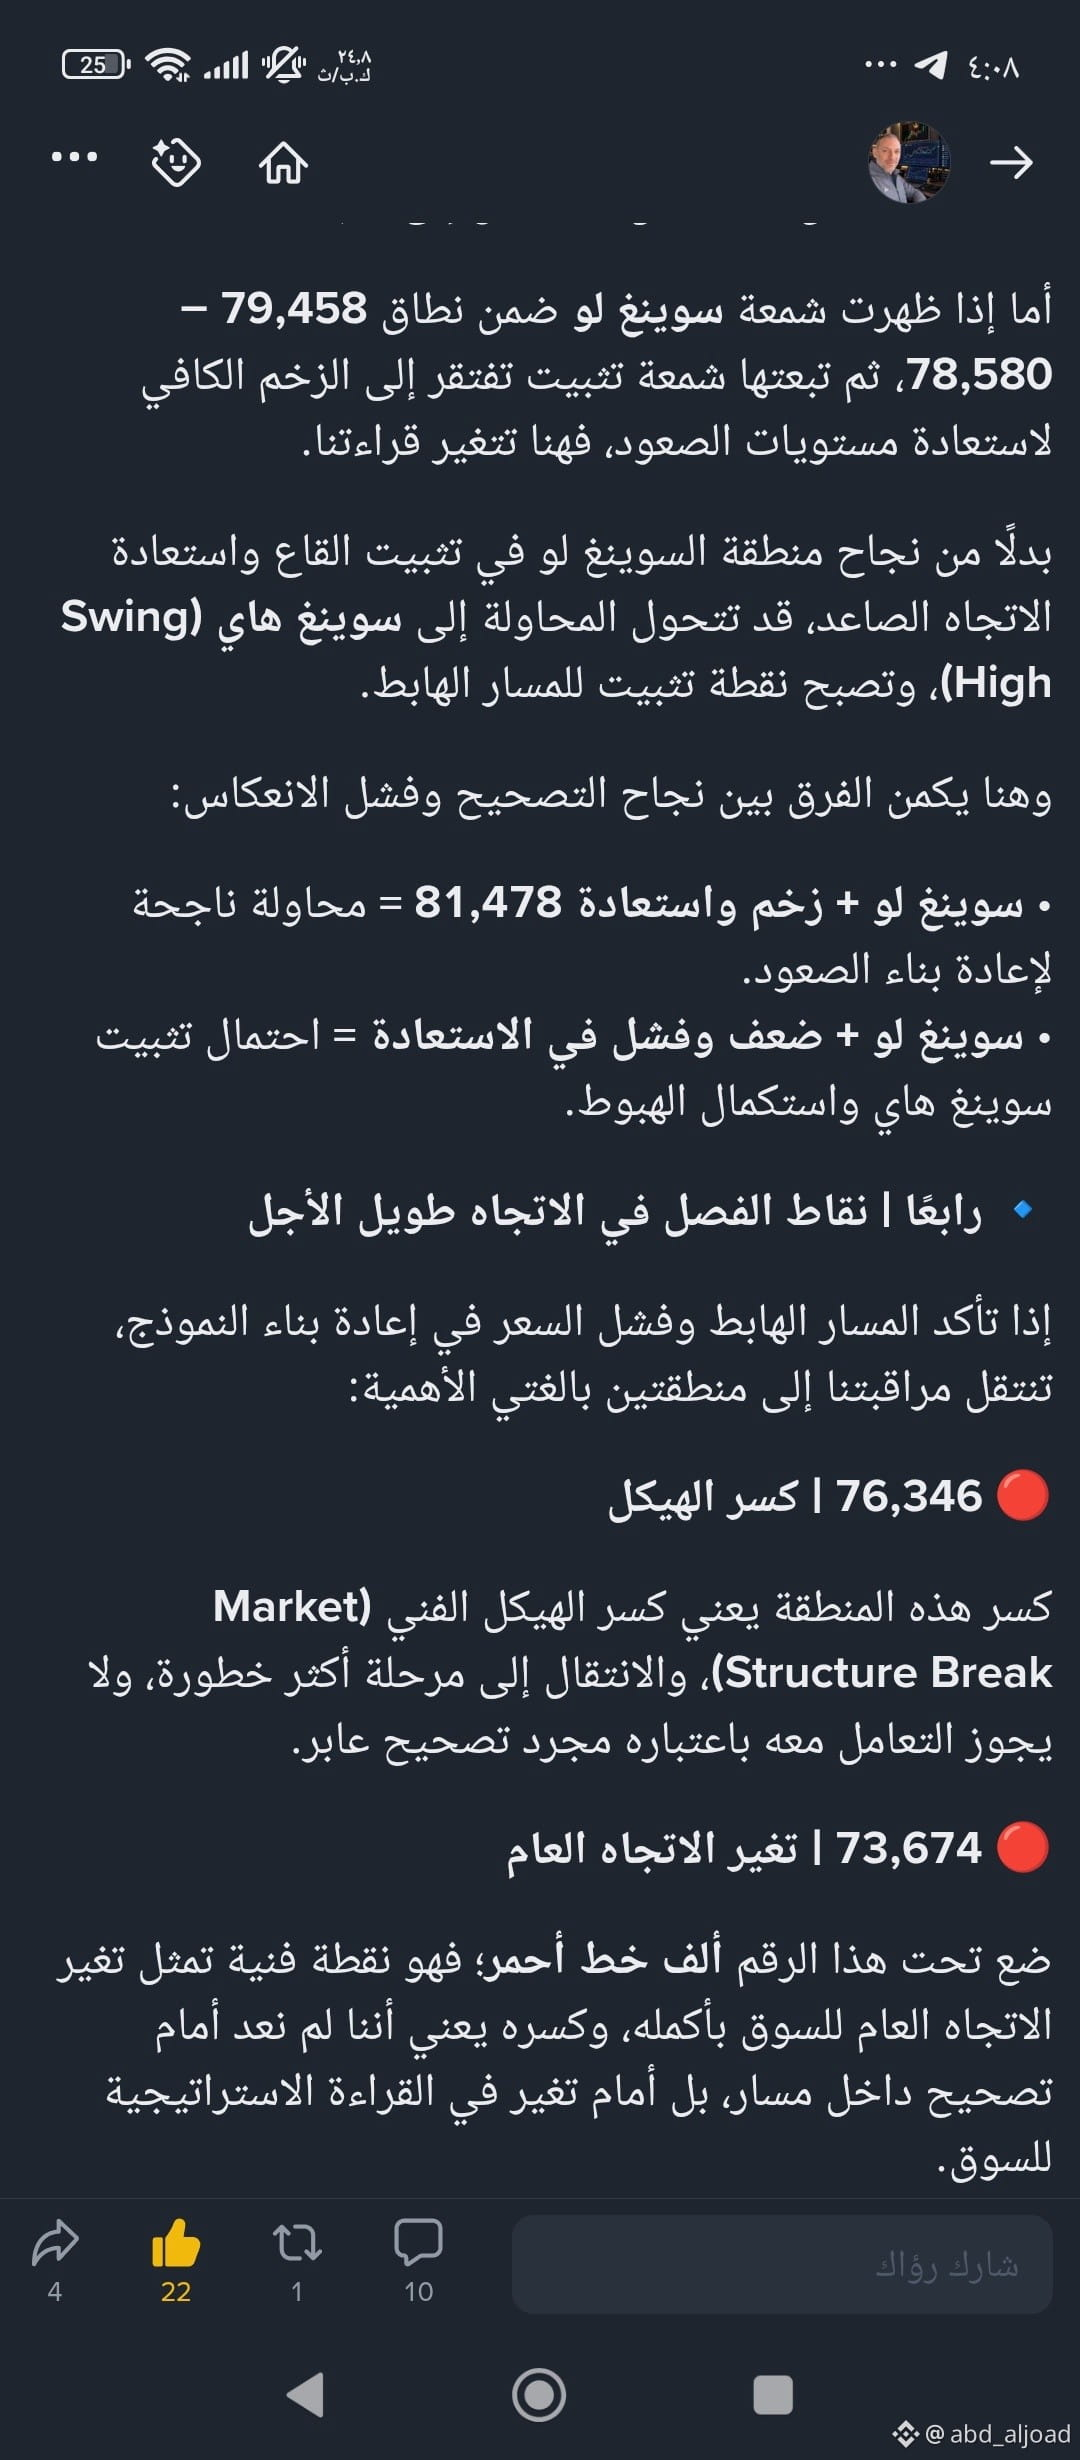
Otherwise, if price and liquidity fail to break through and reclaim these technical zones, that would be an early warning to watch for a correction.
This is only a technical reading; don’t base any financial decision on it. Do your own research and make your own decisions.
And God knows best.
Good luck to everyone, God willing.
عبدالجواد
·
--
$BTC
@
We are following and observing—we have reached the zero hour.
81462
If only you knew what this technical point means.
Know, dear observer: without this technical zone, and with all closes above this number, there will be no rise. Don’t let the price’s short-term movement deceive you. Your trades are safe as long as the price is above this number: a rise with real momentum, not price manipulation and false breakouts.
The market has still not given any signs of a strong recovery.
The most important things to monitor now are the monthly close in a few days—at what level will it close?—and, more importantly, the close of the first week of next month. These will show the strength of the market’s momentum, based on the technical zones where the closes occur.
Also monitor liquidity strength in the market cap: is the market cap recovering, turning around, and breaking through the fiercest resistance it currently faces at 2,72T?
Making it a strong support zone would be reflected in Bitcoin’s price action as it breaks through the pivotal decision point at 81462 and makes it a support zone that no weekly close can break below.
Otherwise, if price and liquidity fail to break through and reclaim these technical zones, that would be an early warning to watch for a correction.
This is only a technical reading; don’t base any financial decision on it. Do your own research and make your own decisions.
And God knows best.
Good luck to everyone, God willing.
@
We are following and observing—we have reached the zero hour.
81462
If only you knew what this technical point means.
Know, dear observer: without this technical zone, and with all closes above this number, there will be no rise. Don’t let the price’s short-term movement deceive you. Your trades are safe as long as the price is above this number: a rise with real momentum, not price manipulation and false breakouts.
The market has still not given any signs of a strong recovery.
The most important things to monitor now are the monthly close in a few days—at what level will it close?—and, more importantly, the close of the first week of next month. These will show the strength of the market’s momentum, based on the technical zones where the closes occur.
Also monitor liquidity strength in the market cap: is the market cap recovering, turning around, and breaking through the fiercest resistance it currently faces at 2,72T?
Making it a strong support zone would be reflected in Bitcoin’s price action as it breaks through the pivotal decision point at 81462 and makes it a support zone that no weekly close can break below.
Otherwise, if price and liquidity fail to break through and reclaim these technical zones, that would be an early warning to watch for a correction.
This is only a technical reading; don’t base any financial decision on it. Do your own research and make your own decisions.
And God knows best.
Good luck to everyone, God willing.
عبدالجواد
·
--
Zero Statement | From the map of possibilities to the final scene… Bitcoin faces the test of completing the structure
$BTC
@
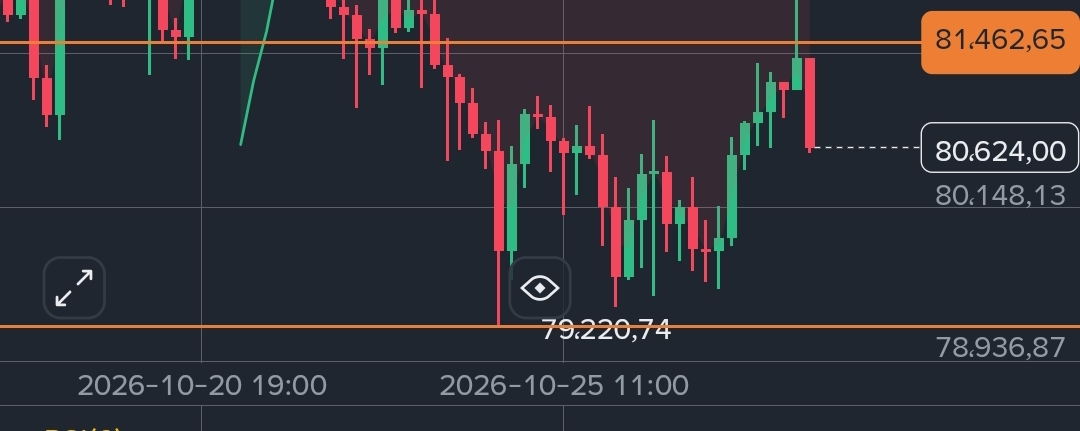
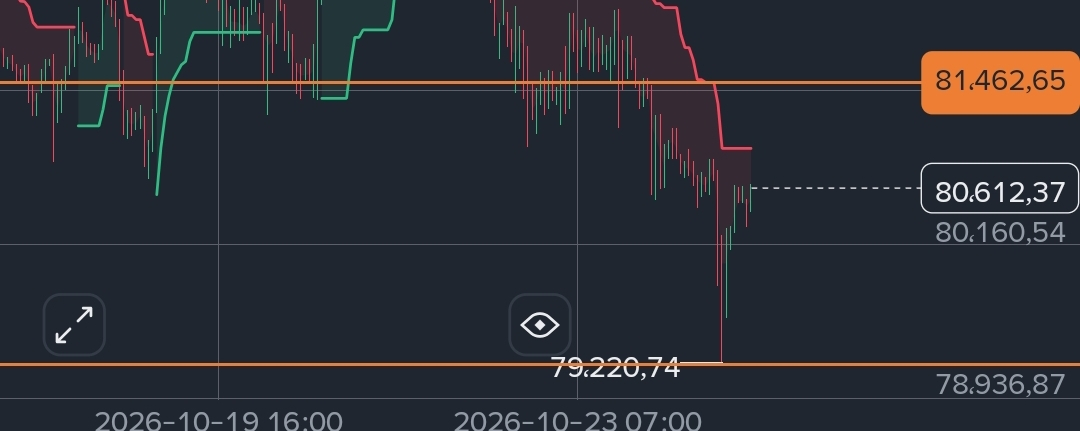
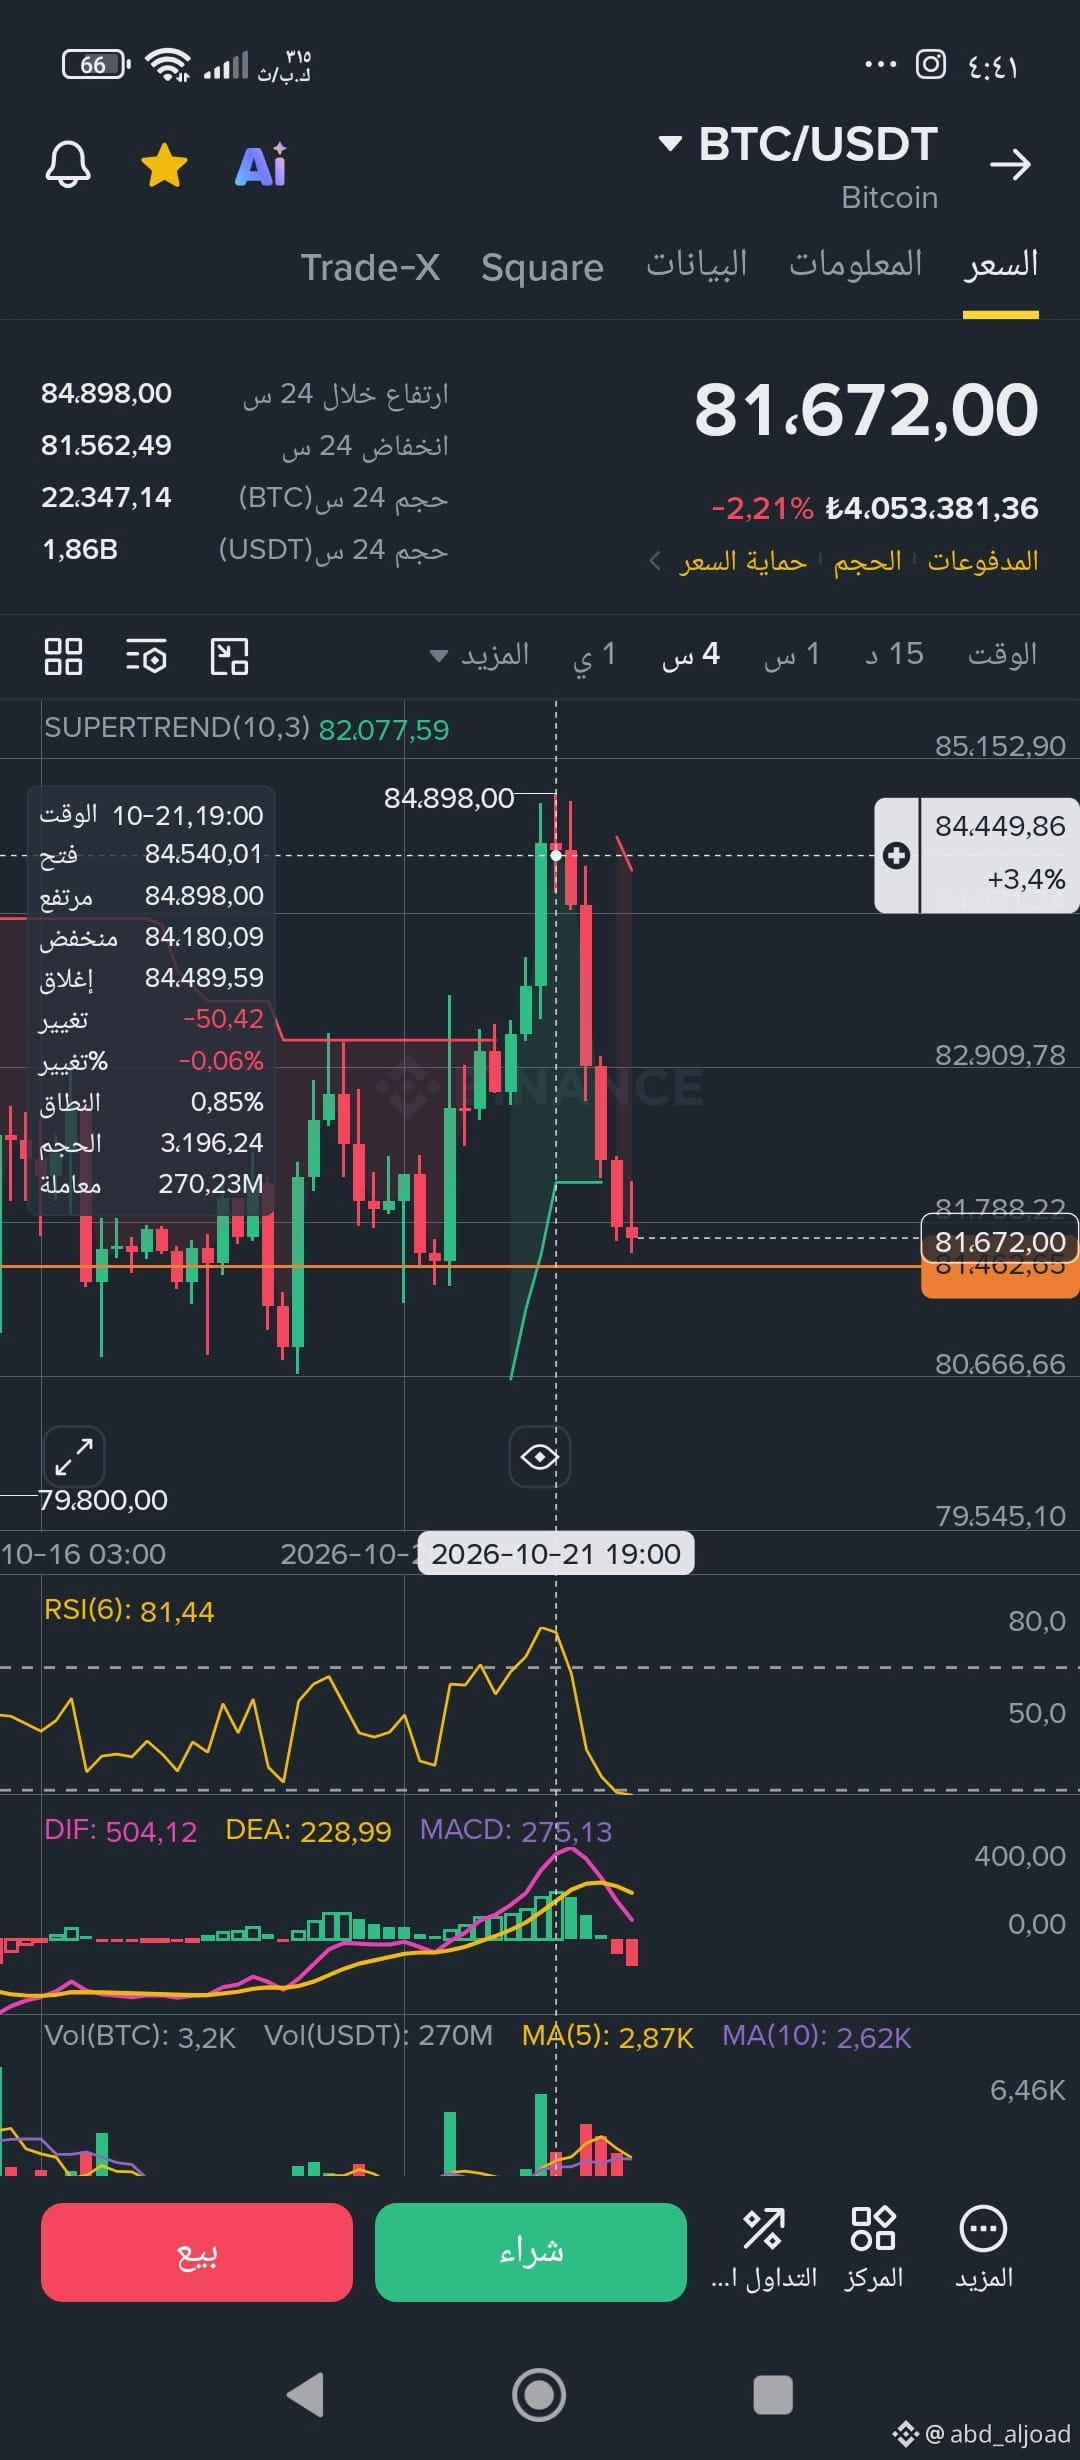
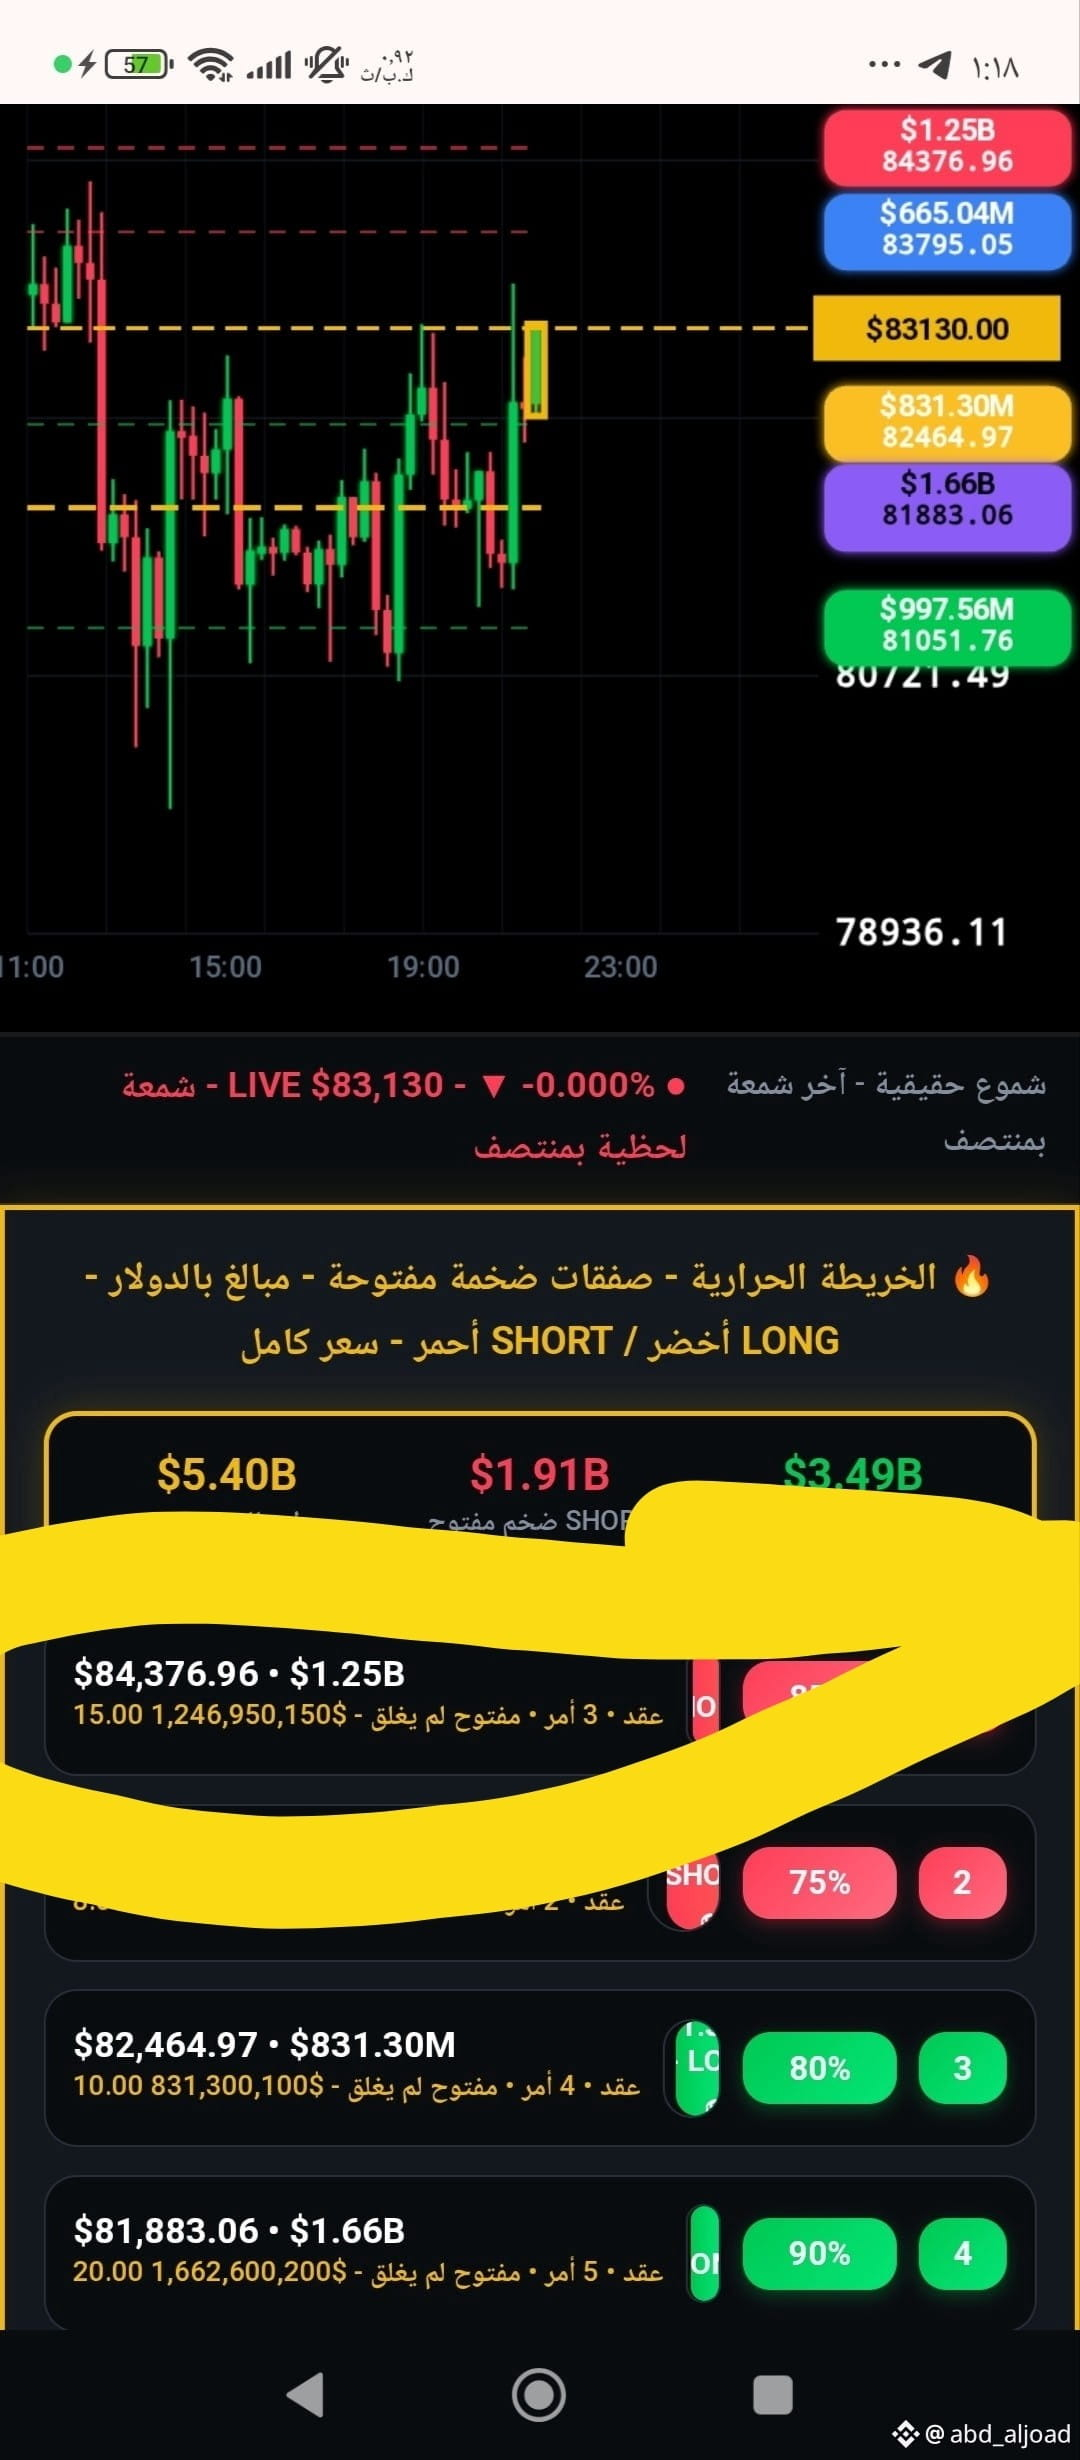
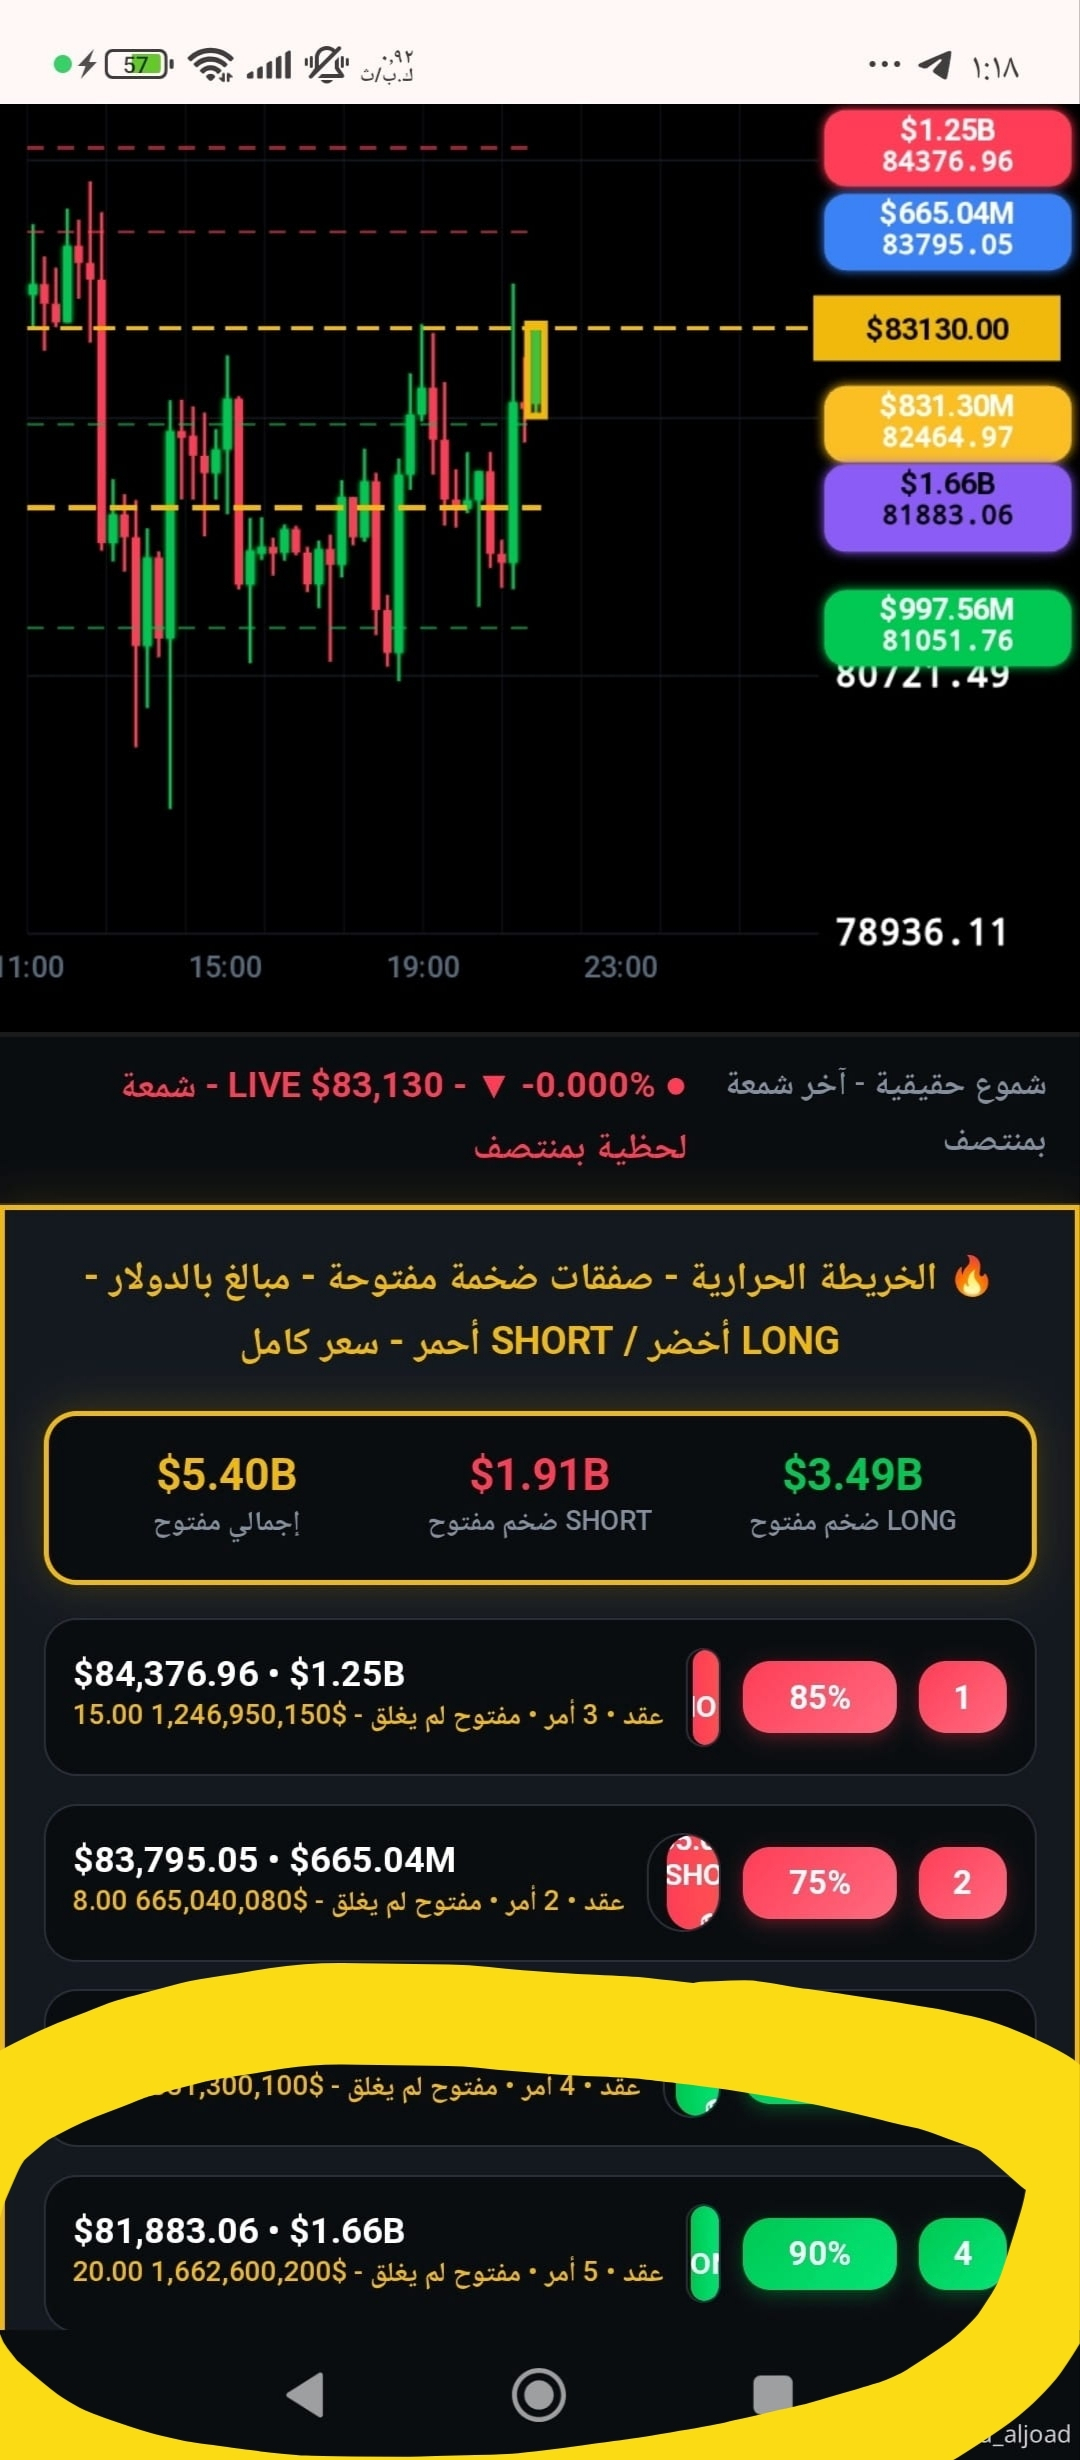
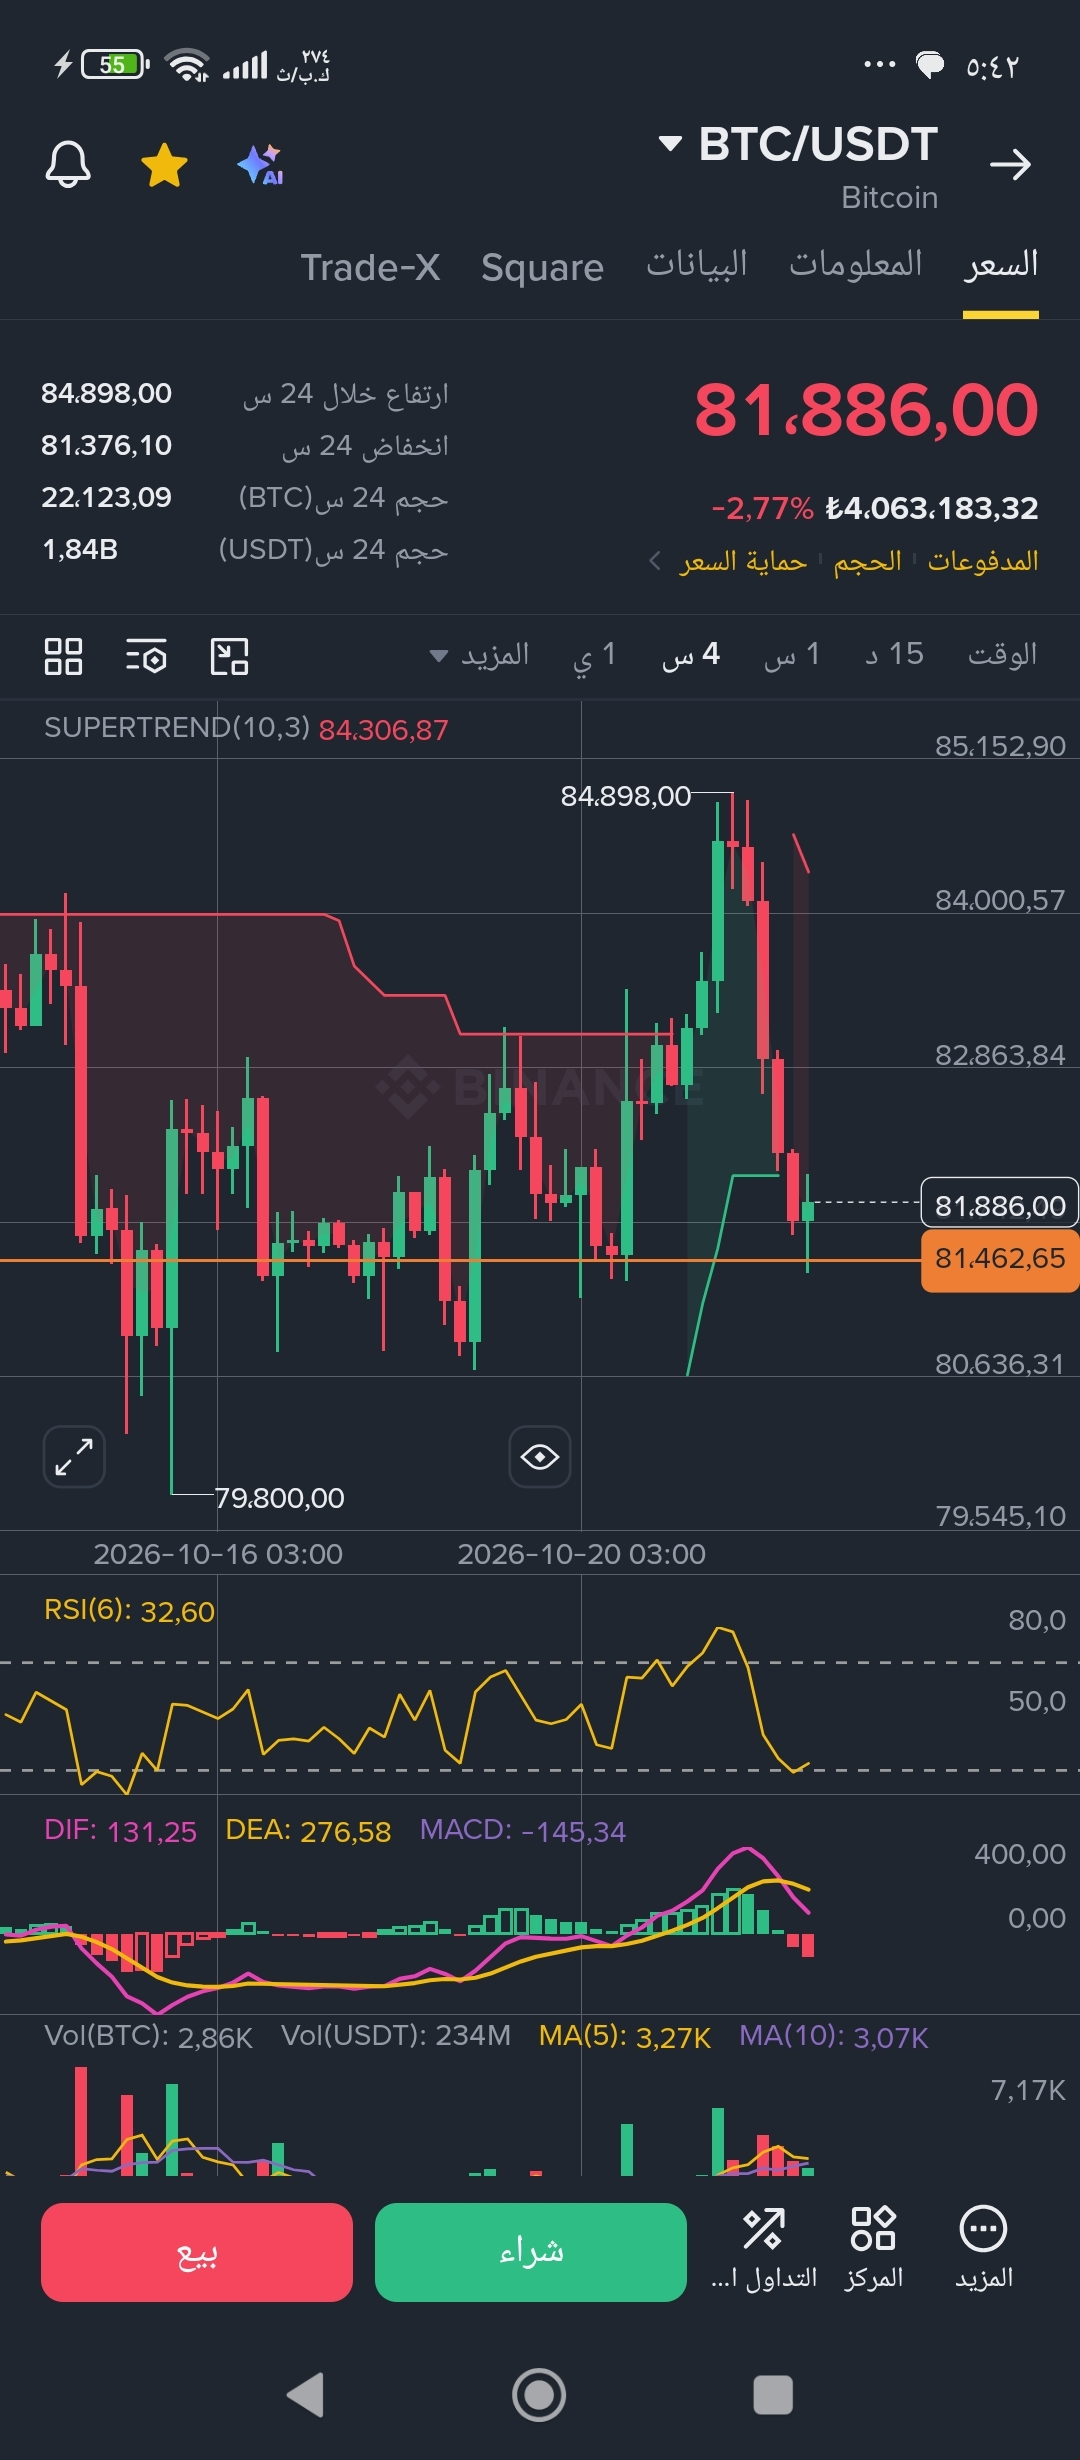
25 days ago, when we shared an analysis post
Zero Statement
And we laid out its precise details. These numbers meant nothing on the chart, and this scenario had no meaning.
Today, 25 days later, do you think it was a roadmap for building the structure down to its finest details?
Zero Statement | 25 days ago, we mapped out the possibilities… and today we’re watching the scene whose details we warned about!
عبدالجواد
·
--
$BTC
$BNB
$ETH
@
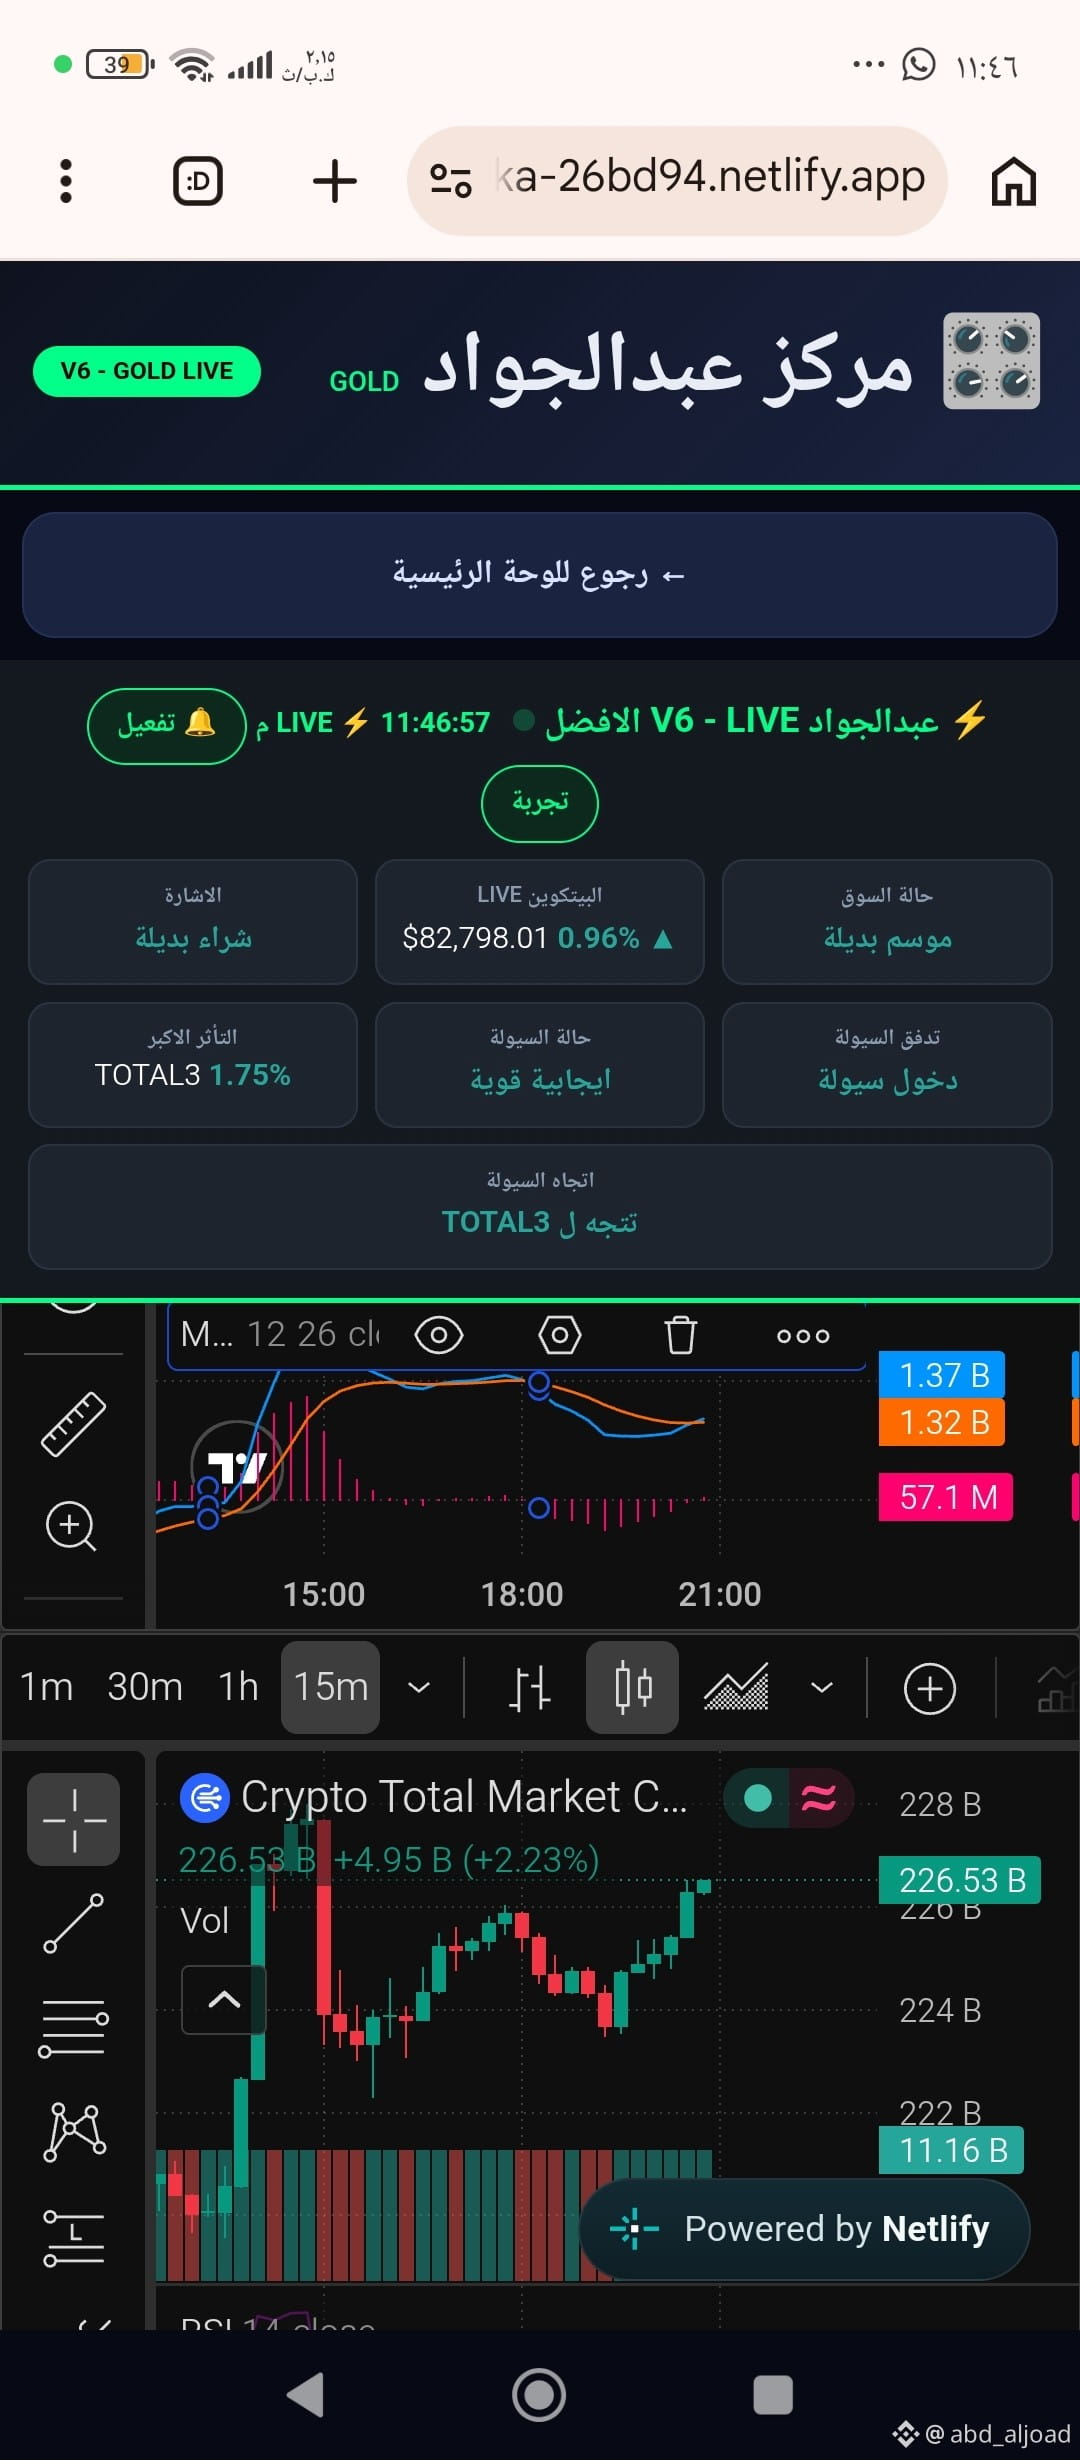
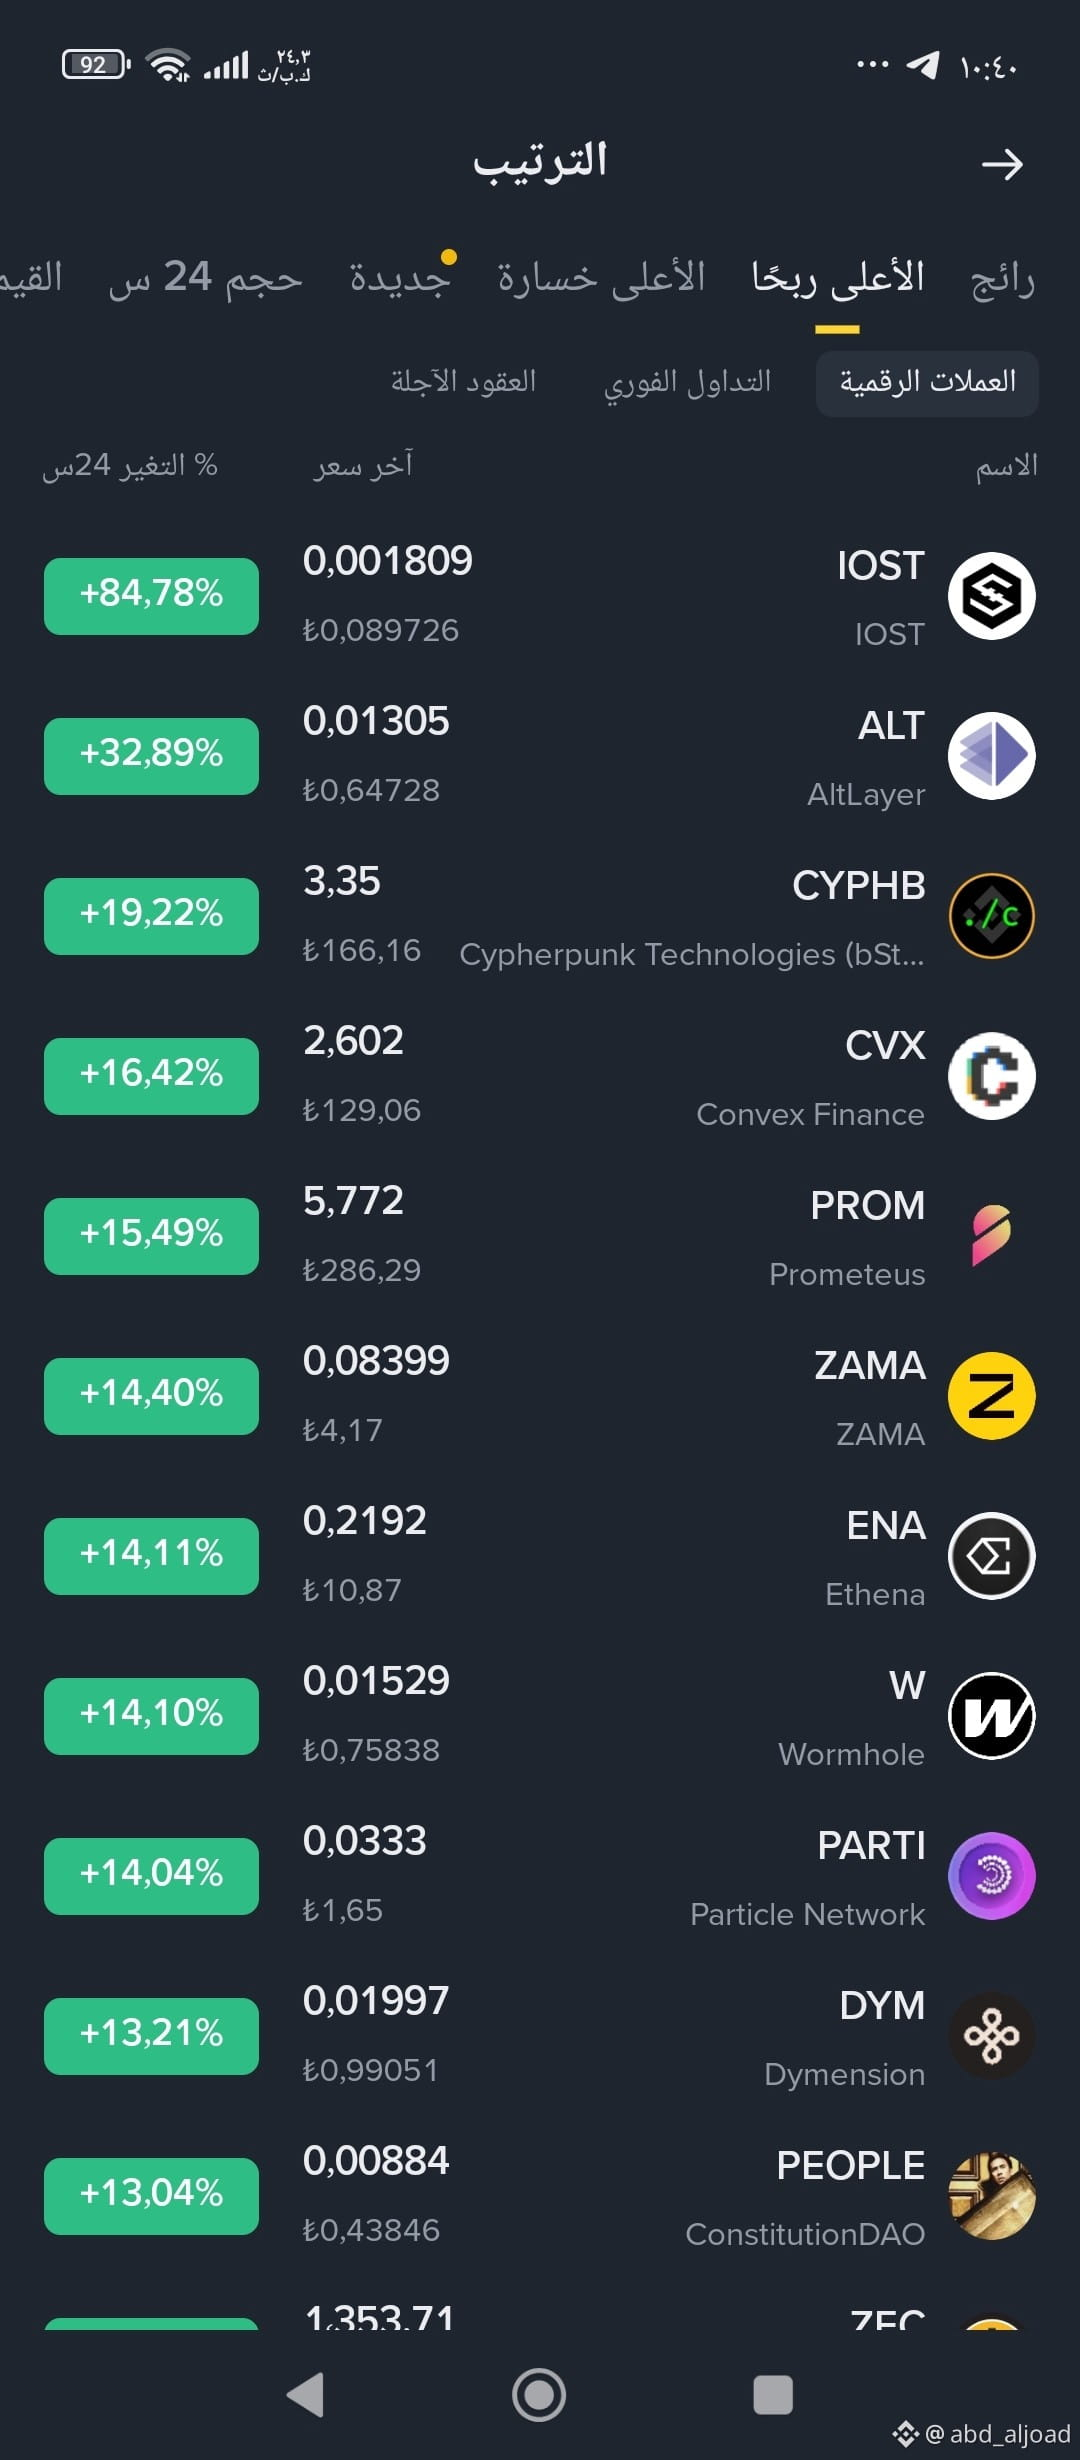
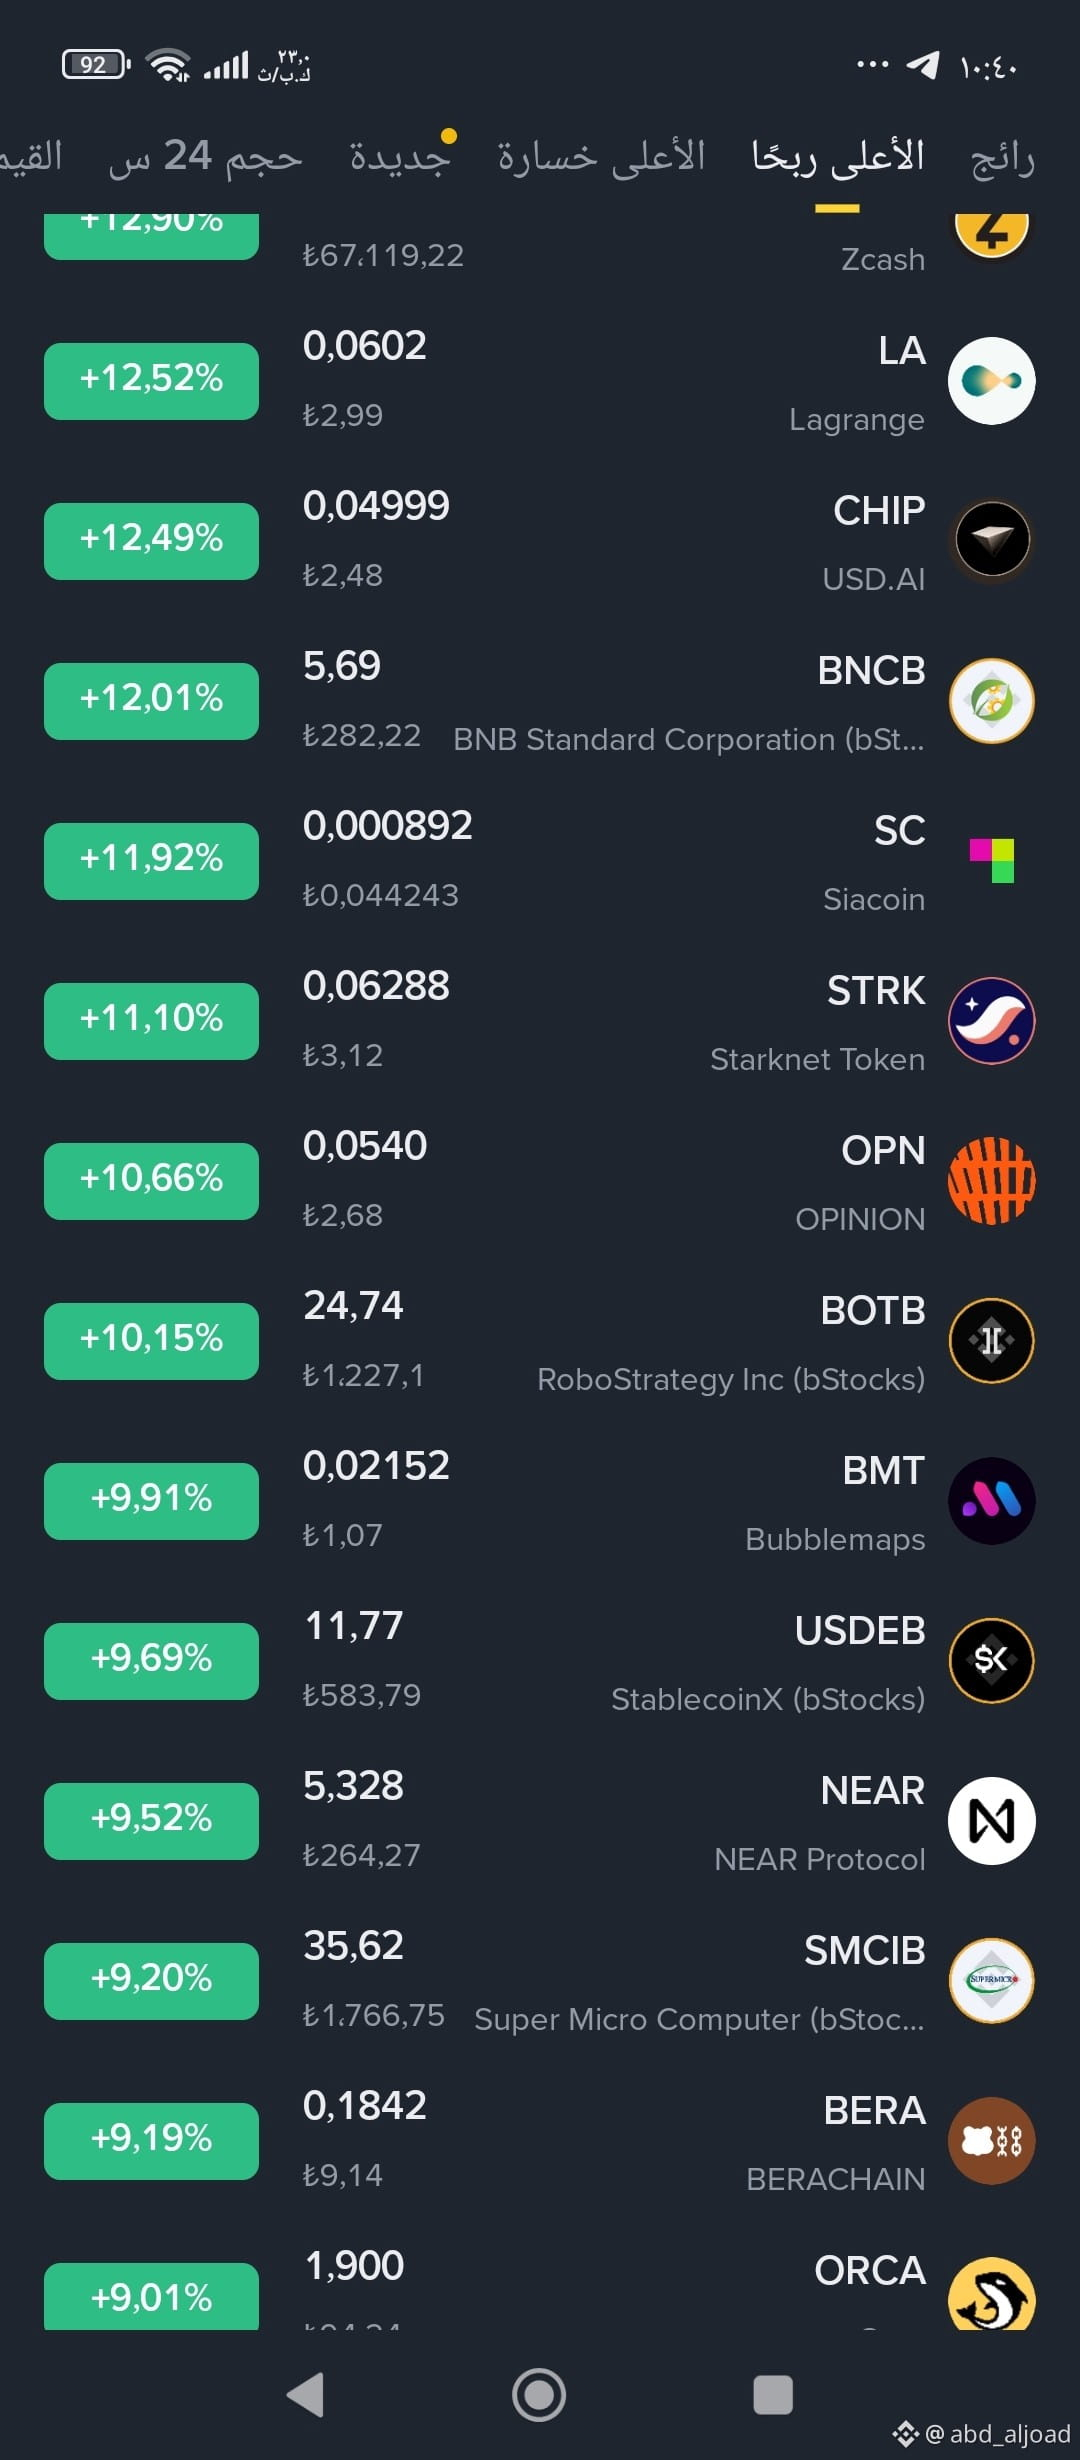
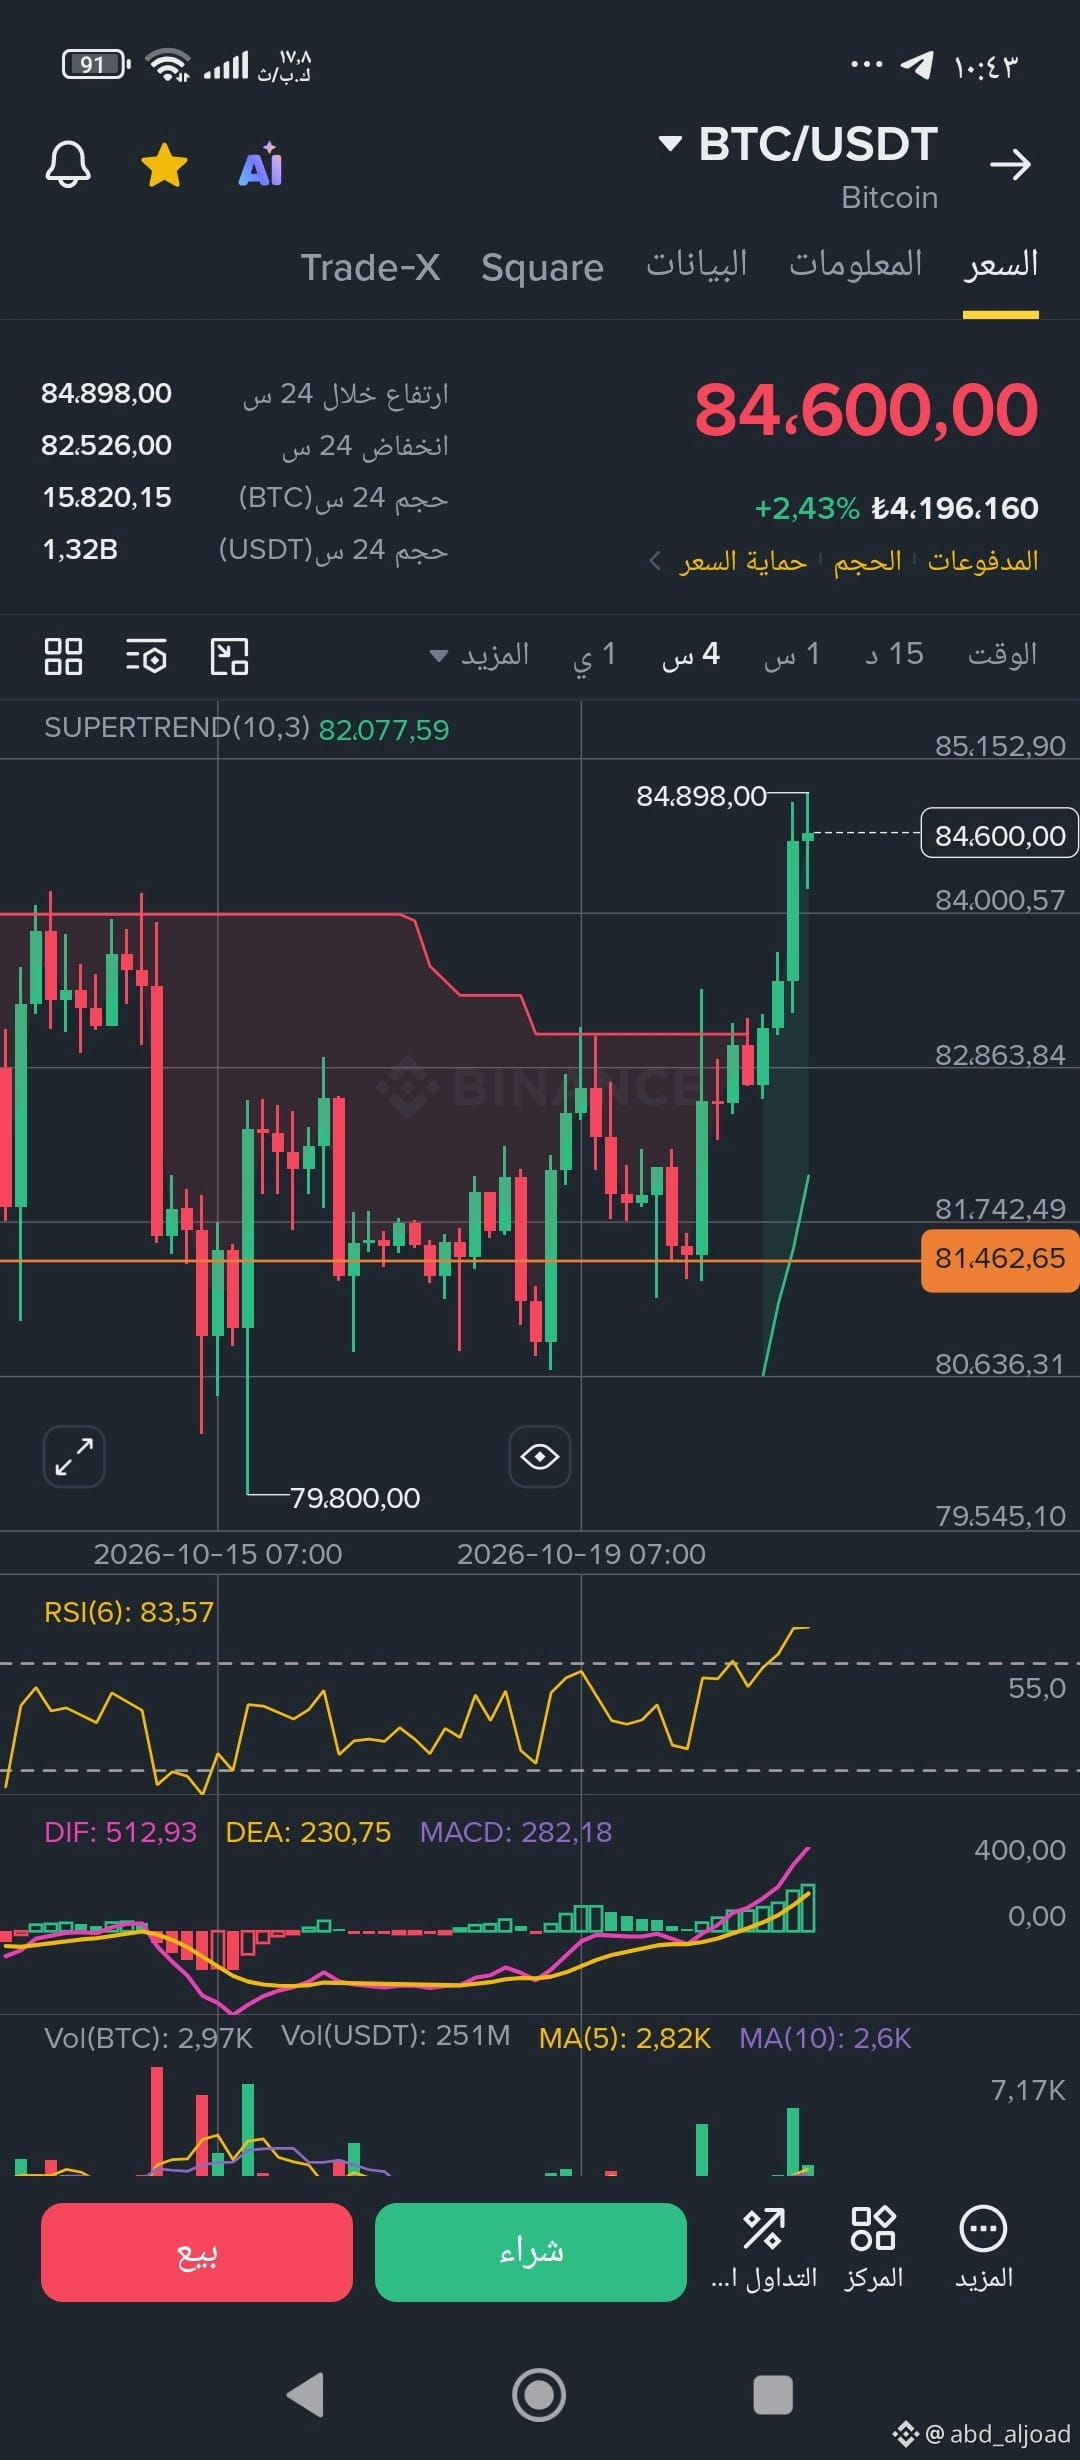
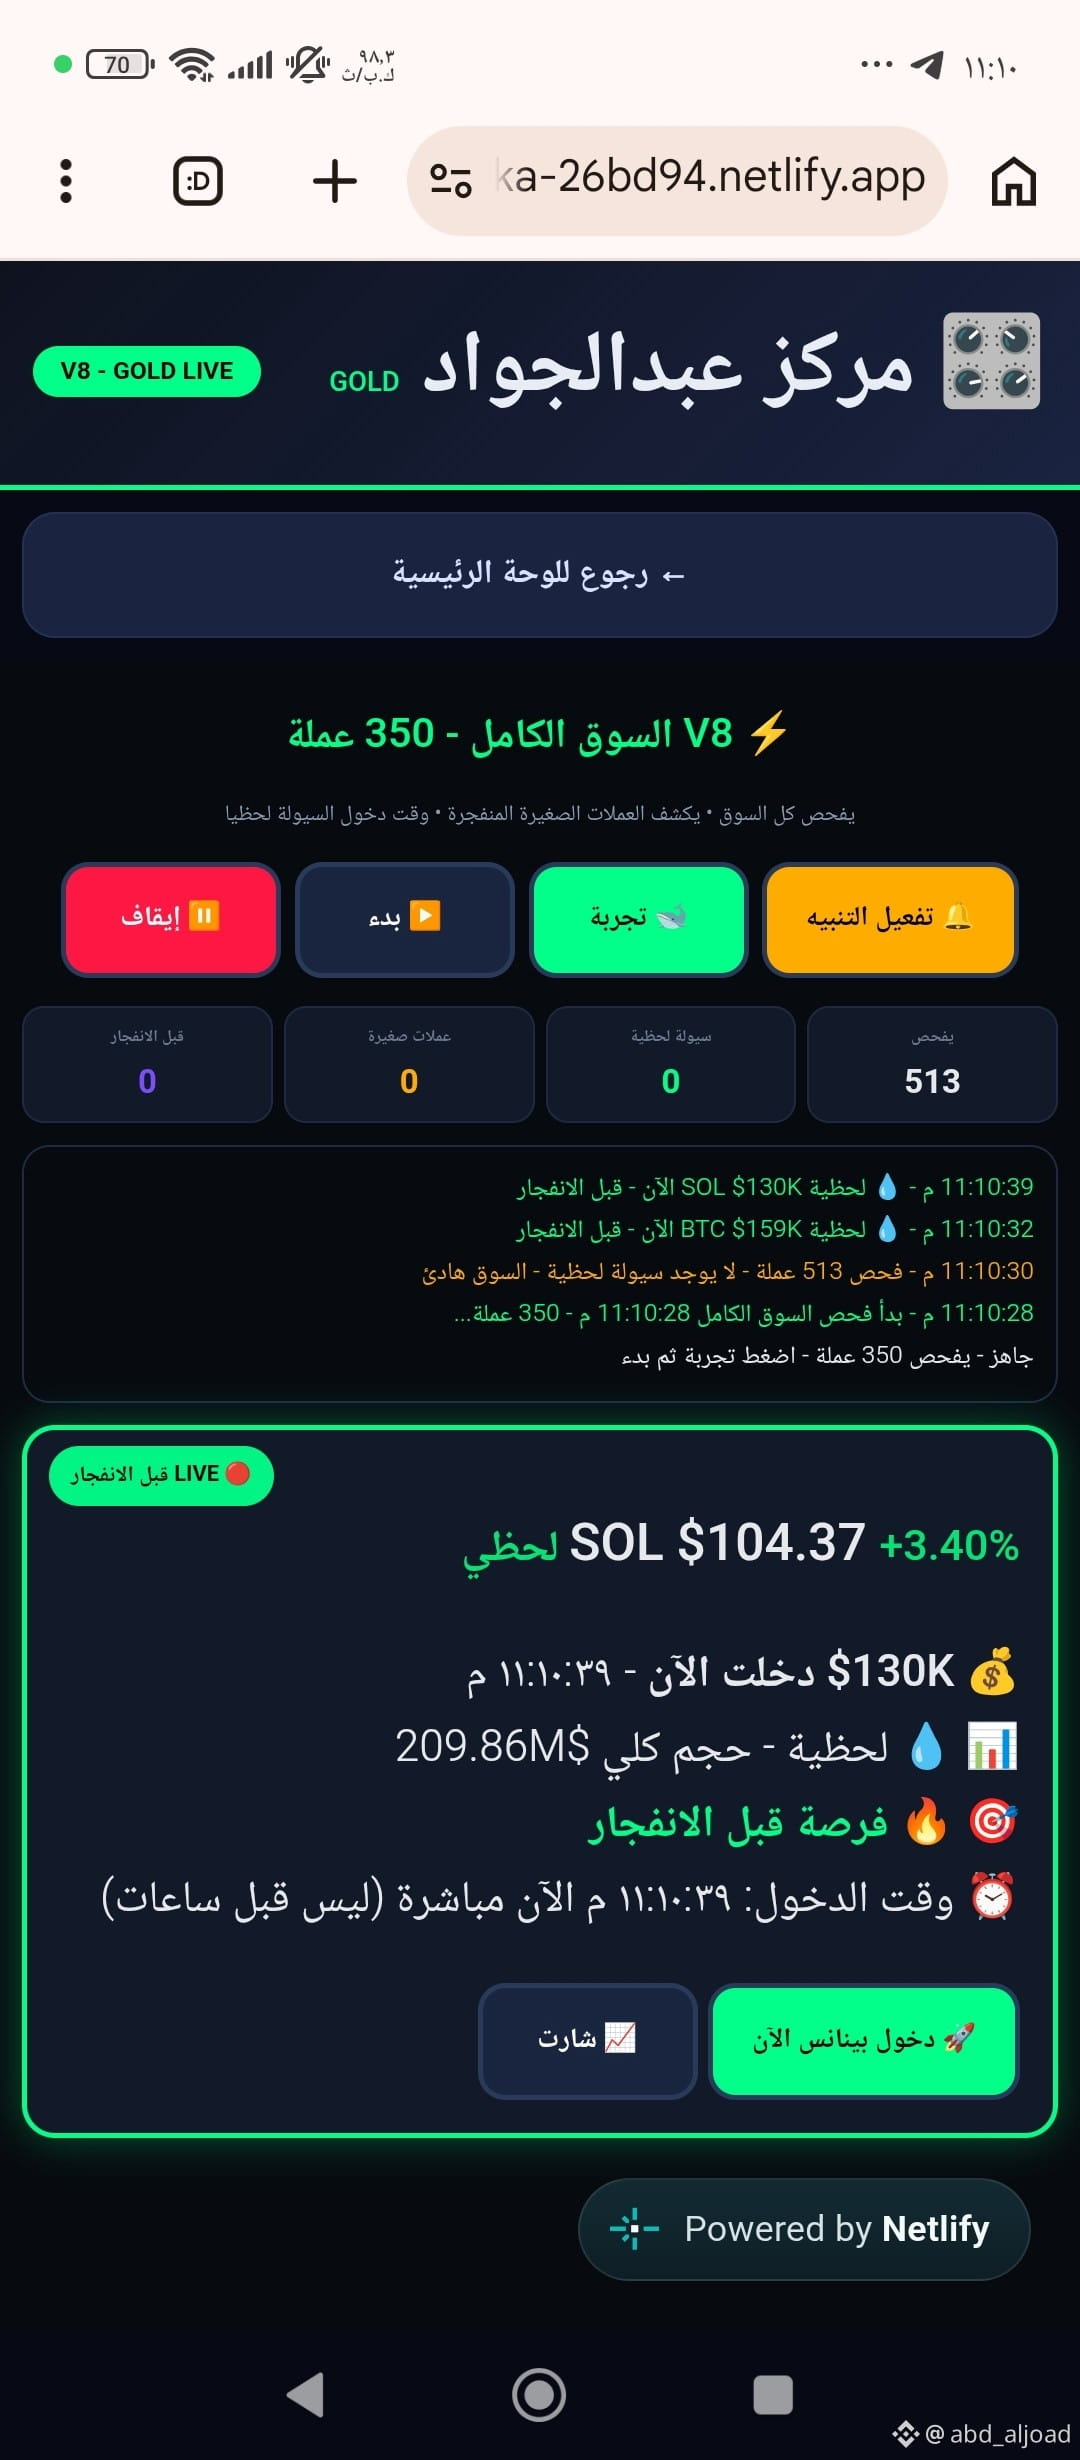
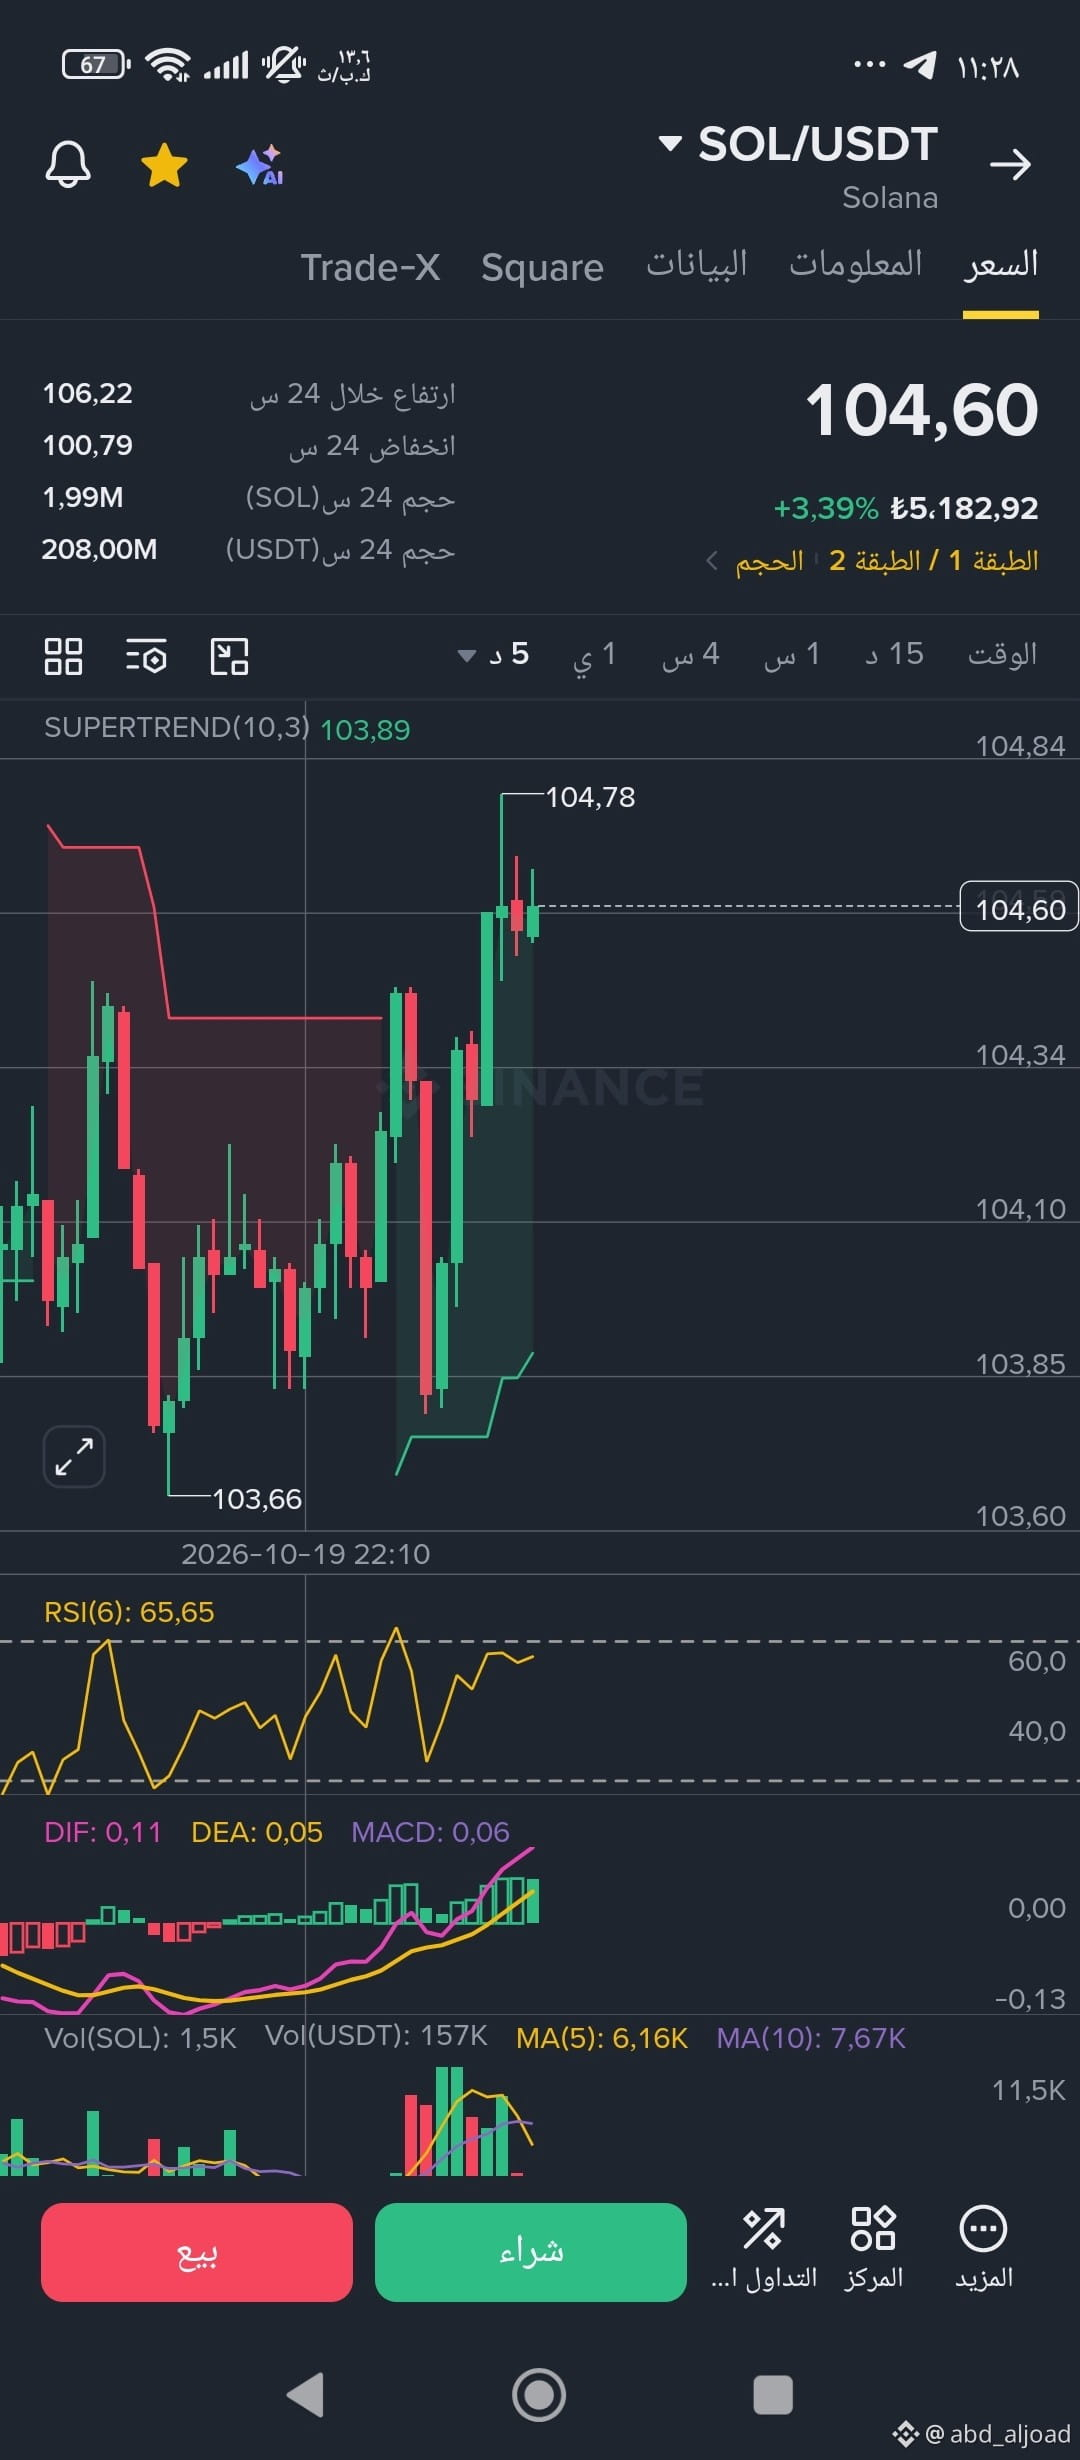
Project Bayan Zero
Battlefield coordinates for Logistics Expert No. 2
We consider the expert a double agent who may give us false signals
until he proves his loyalty through accurate monitoring and precise coordinates of what is happening on the battlefield.
Save the areas he observed, and we'll test him when the price reaches them.
عبدالجواد
·
--
$BTC
$BNB
$ETH
#total3
#TOTALMARKET1
@
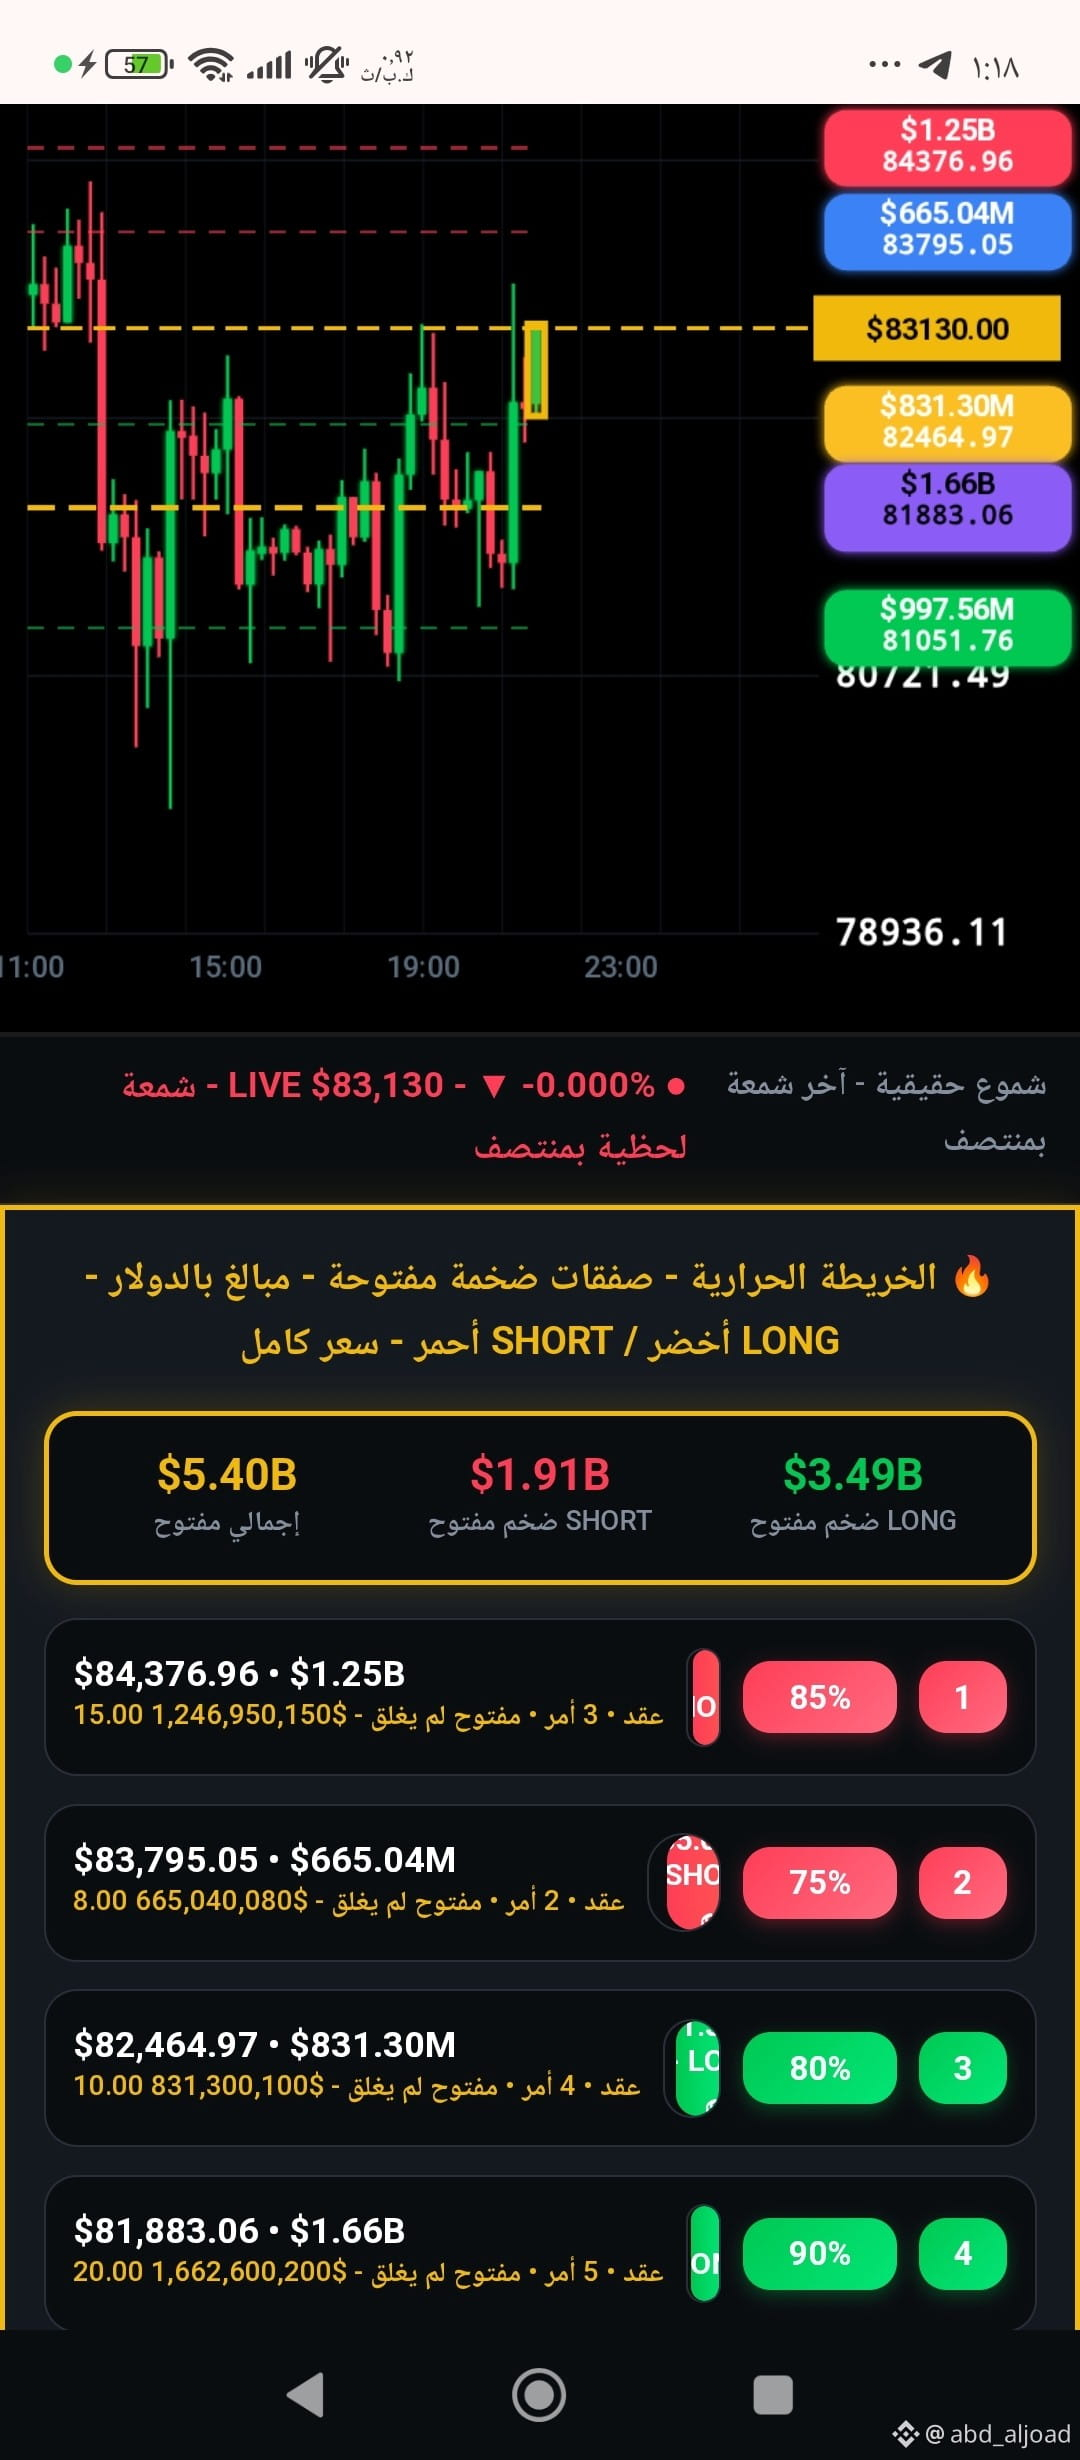
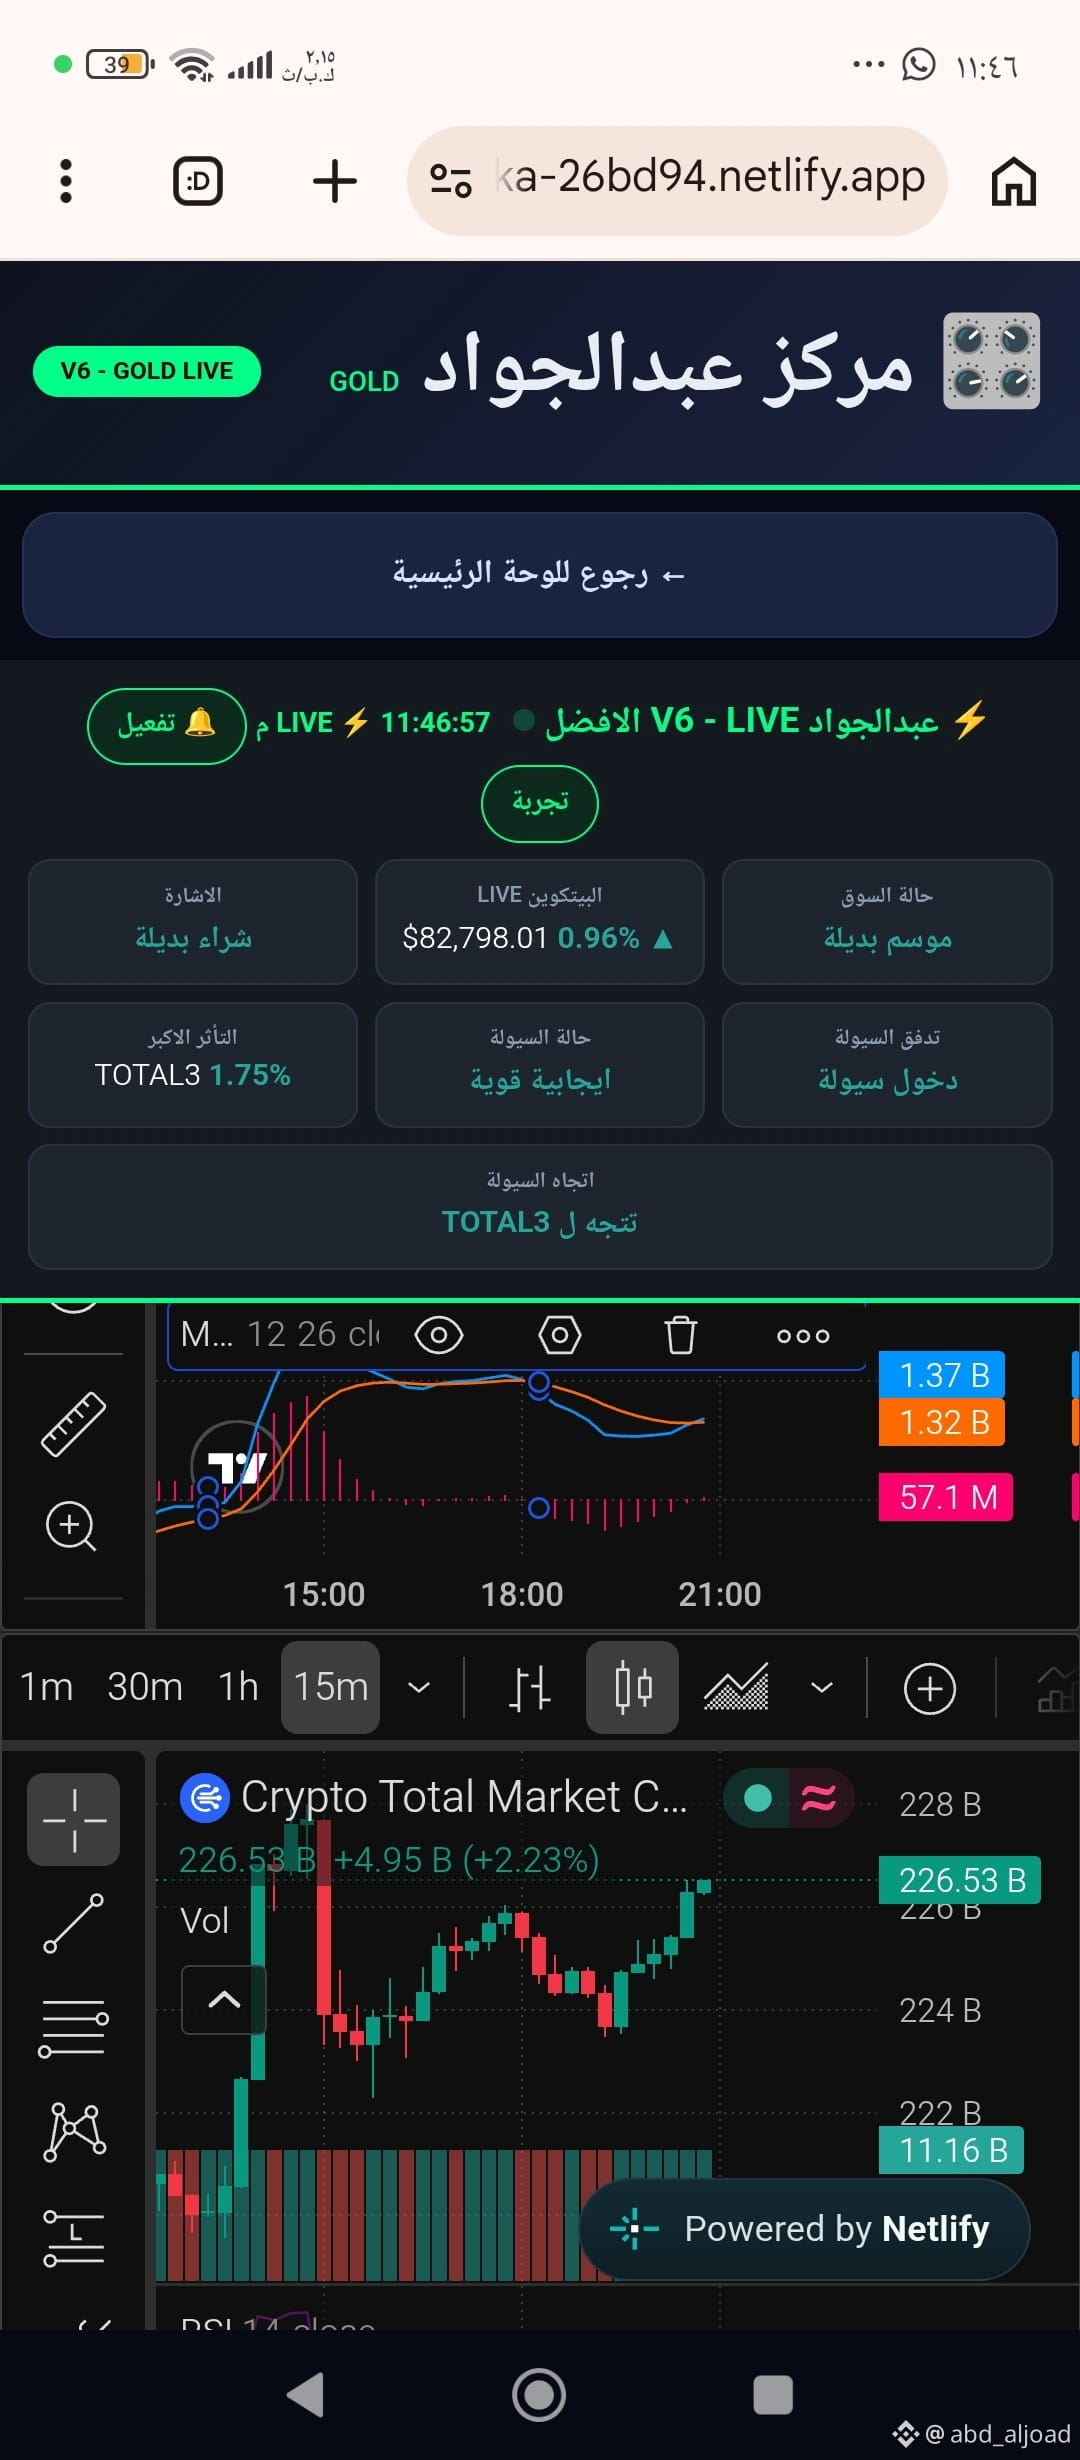
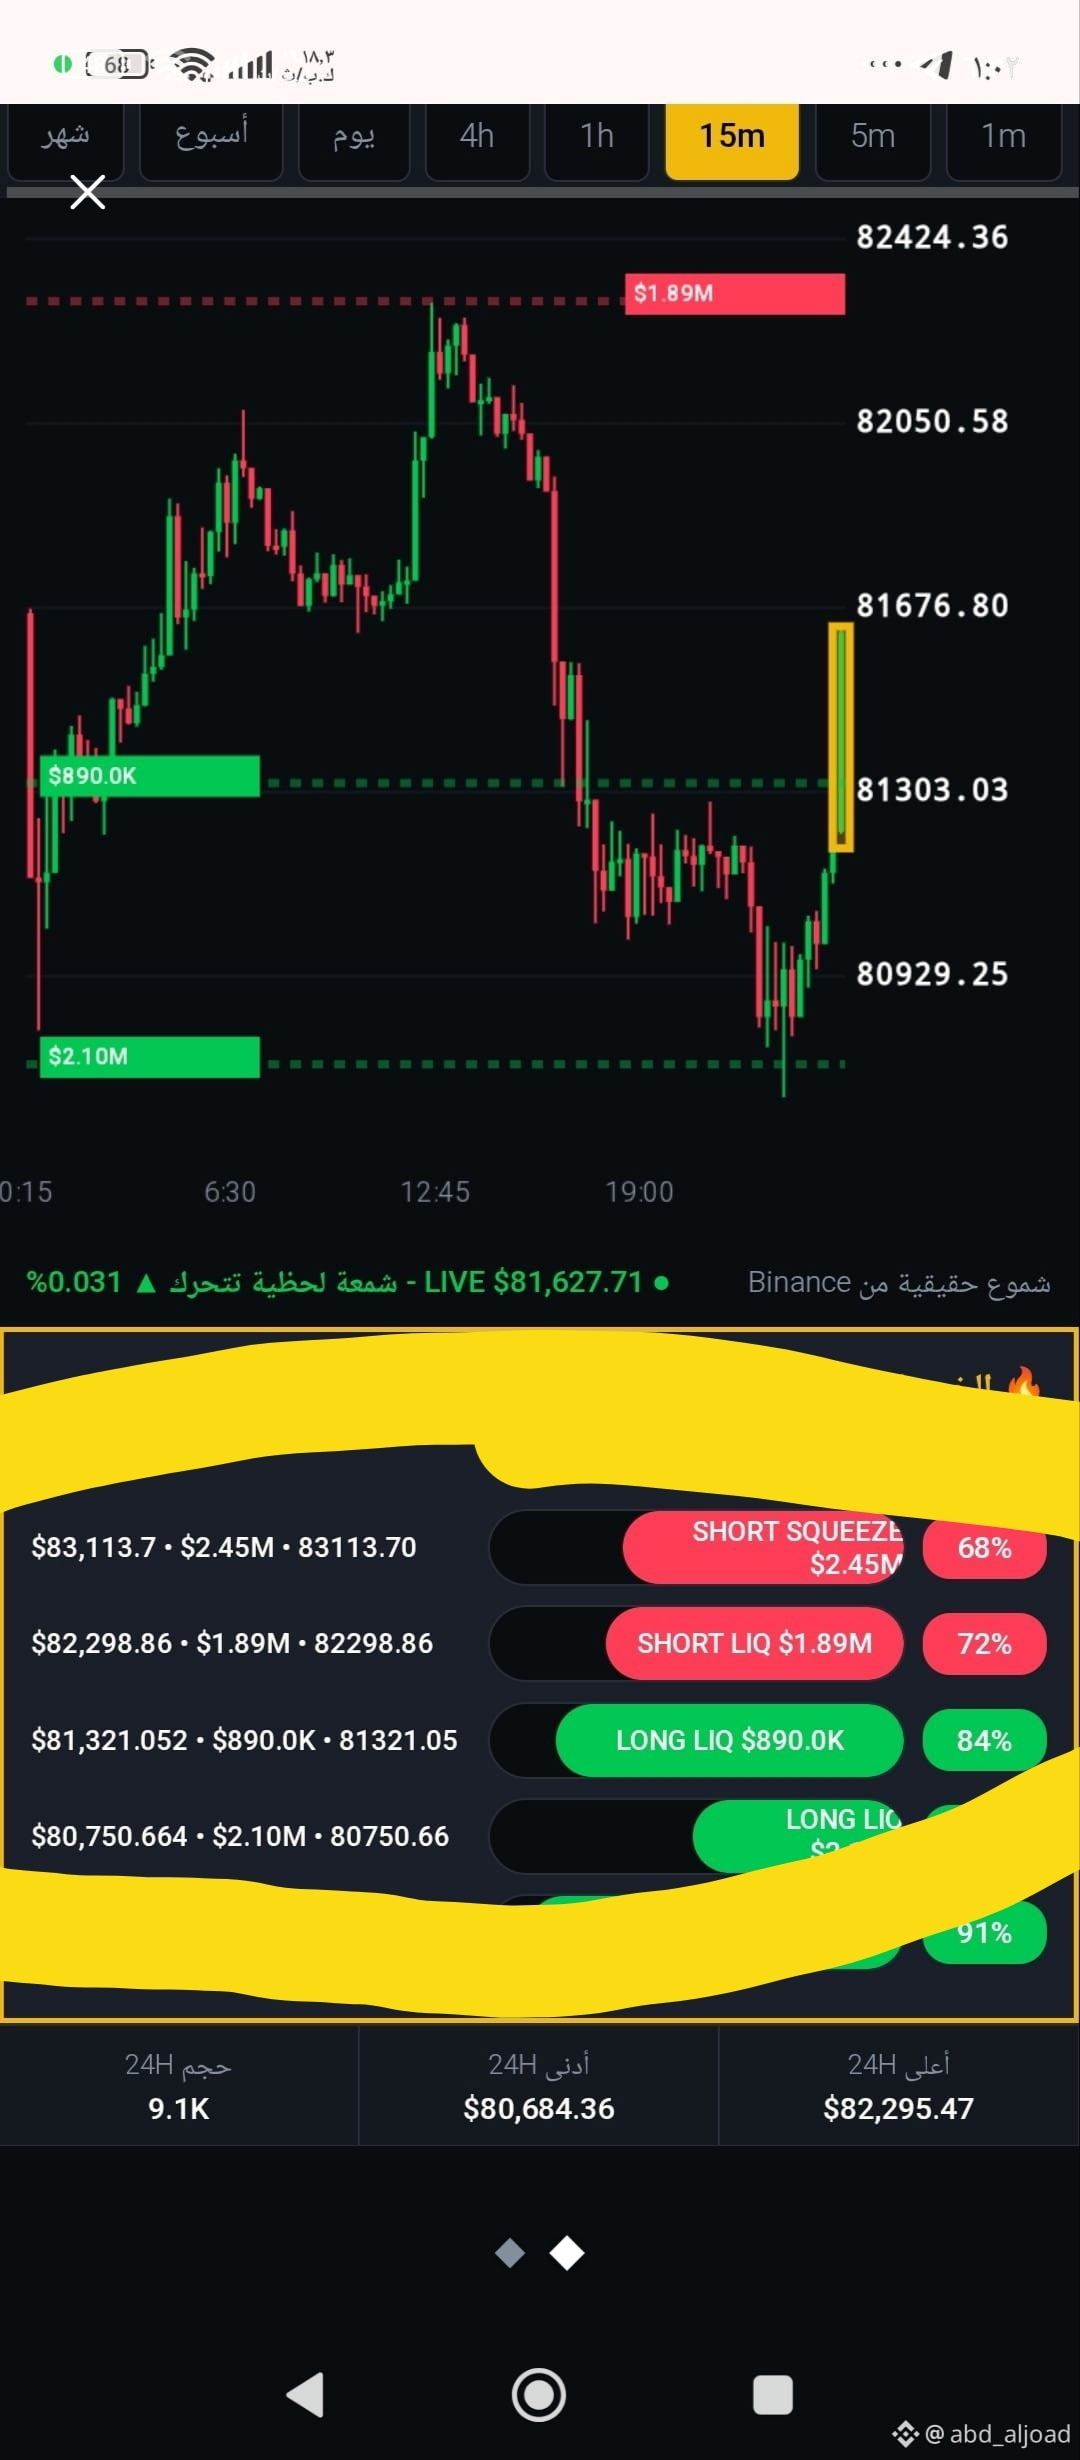
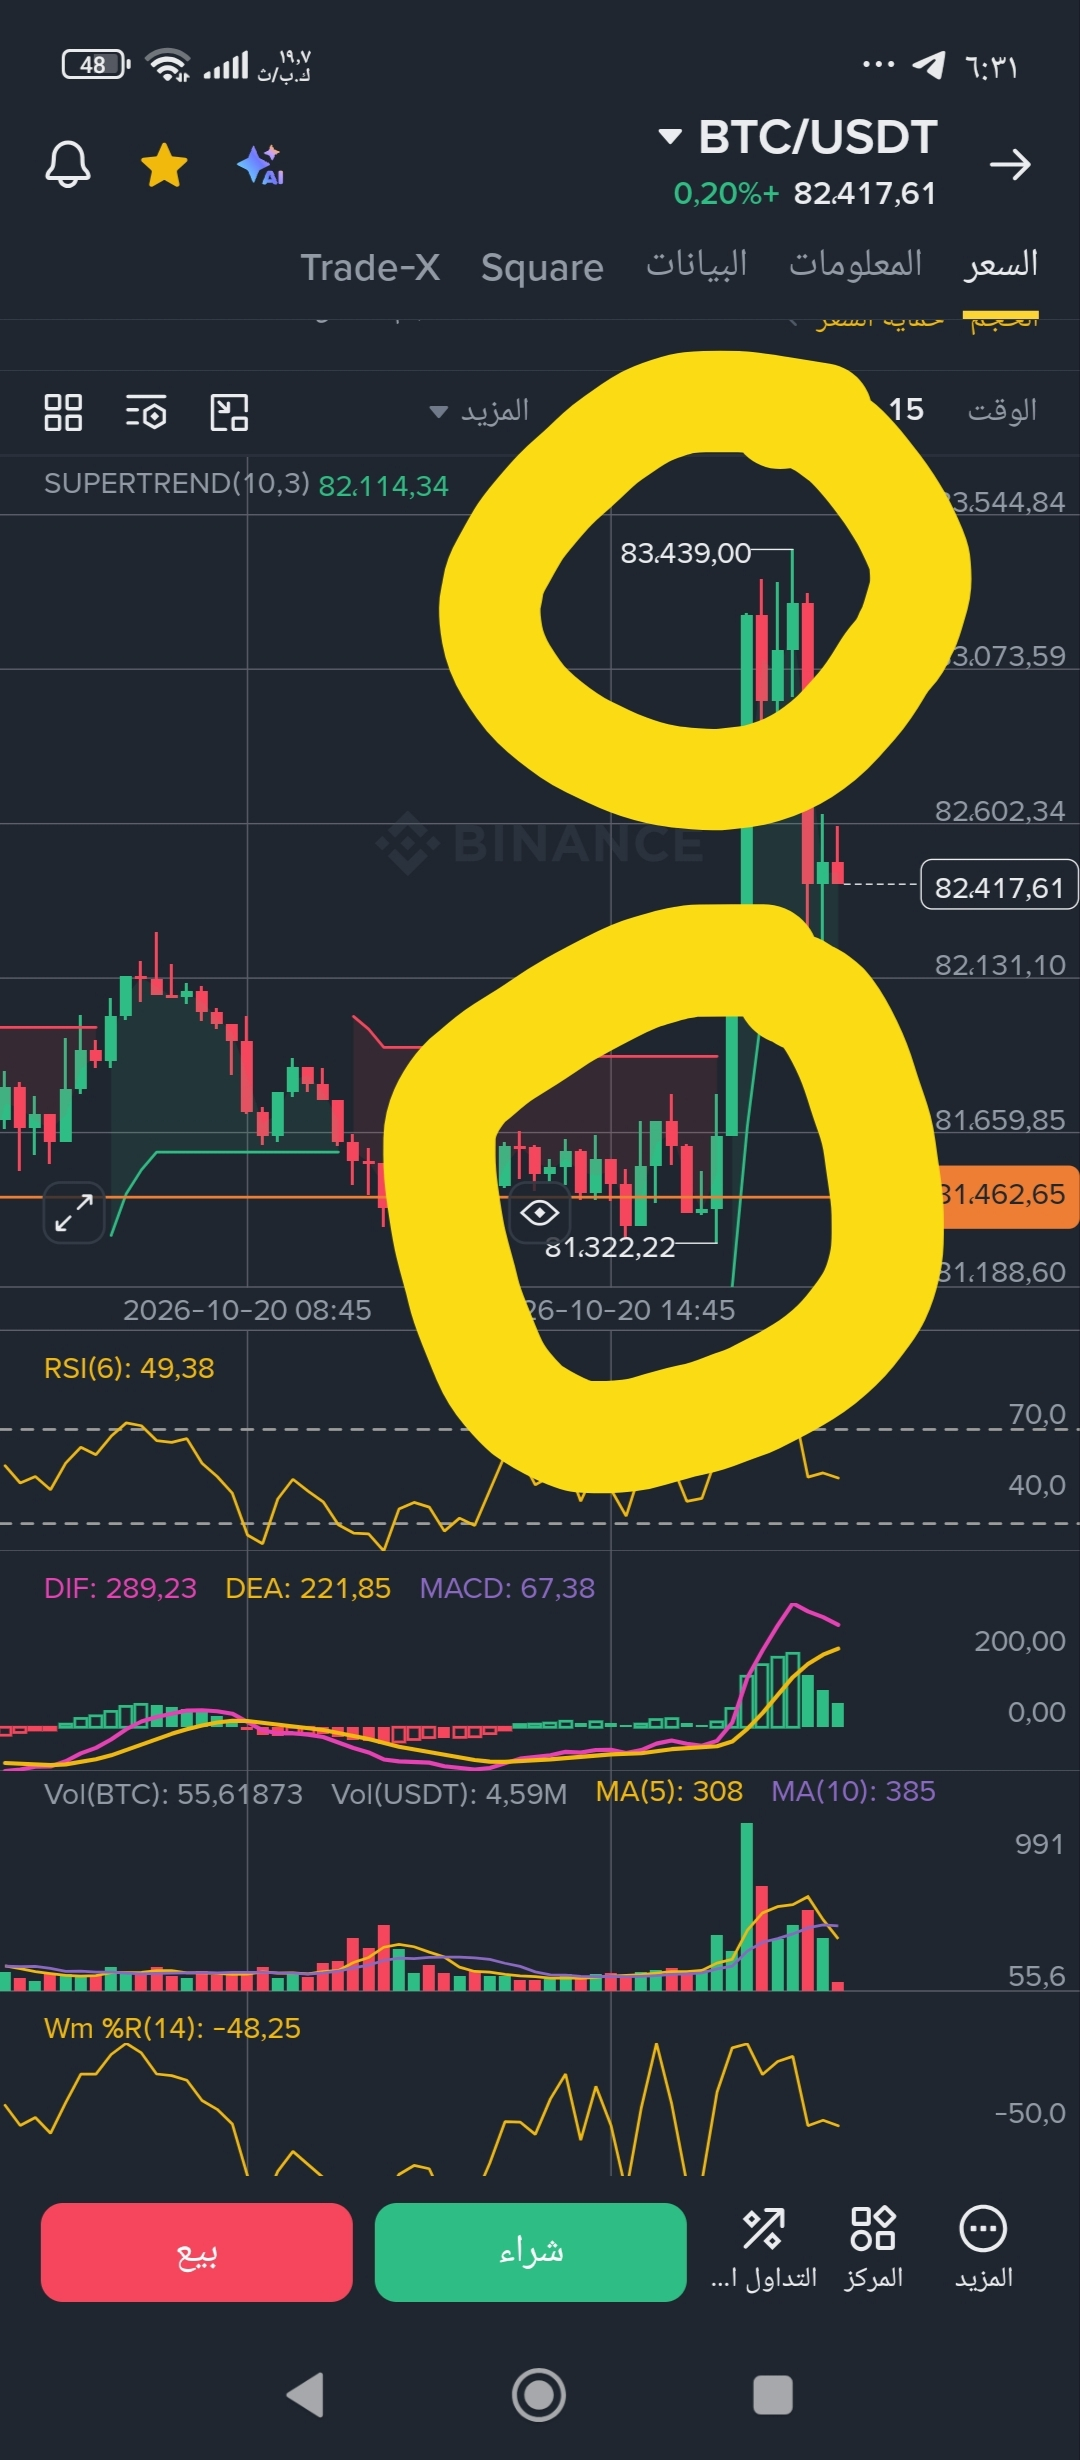
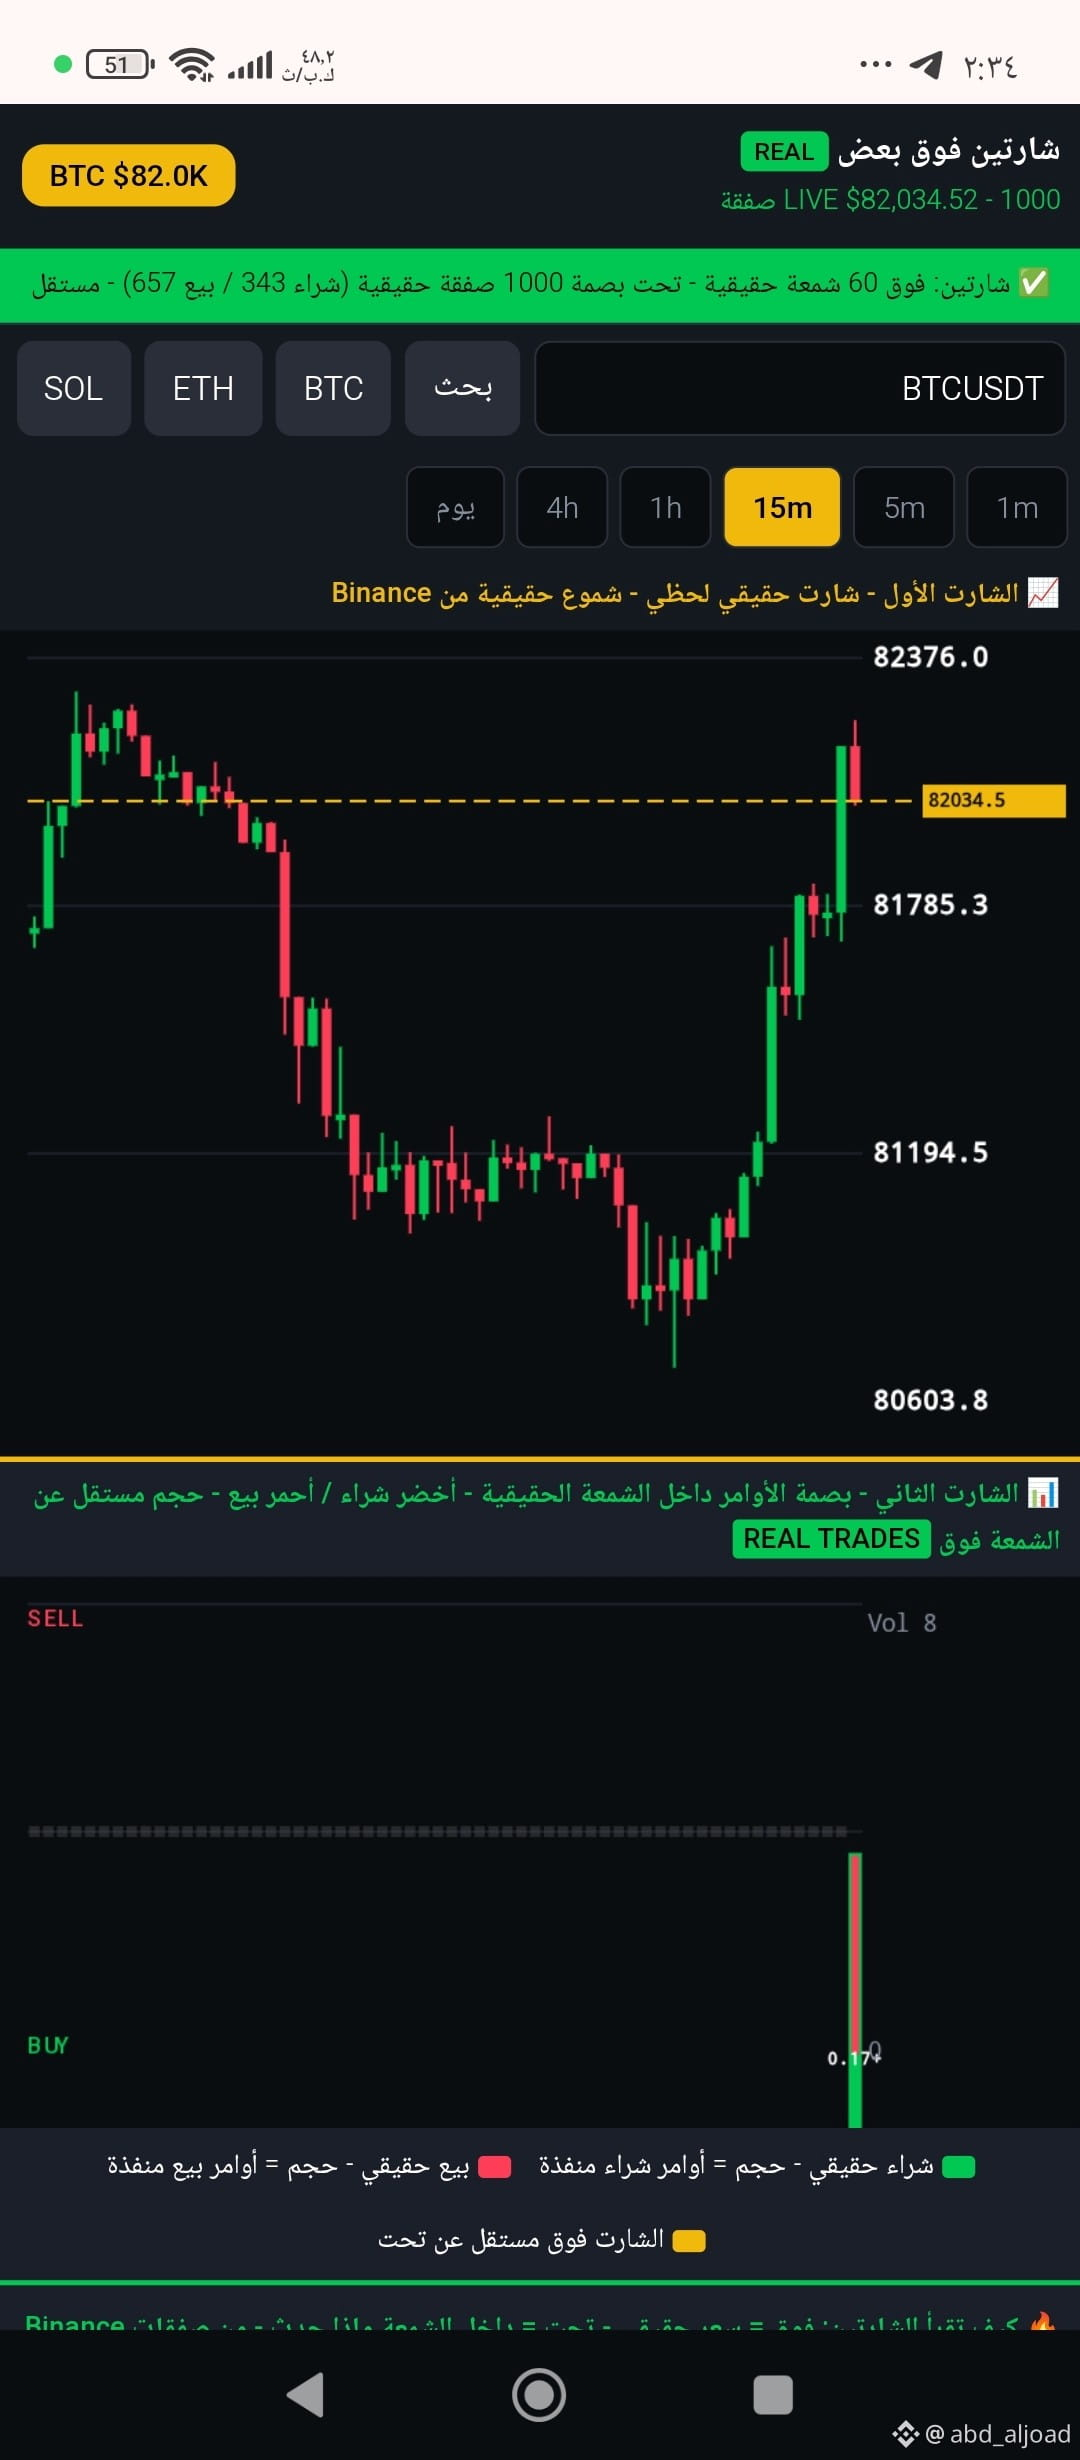
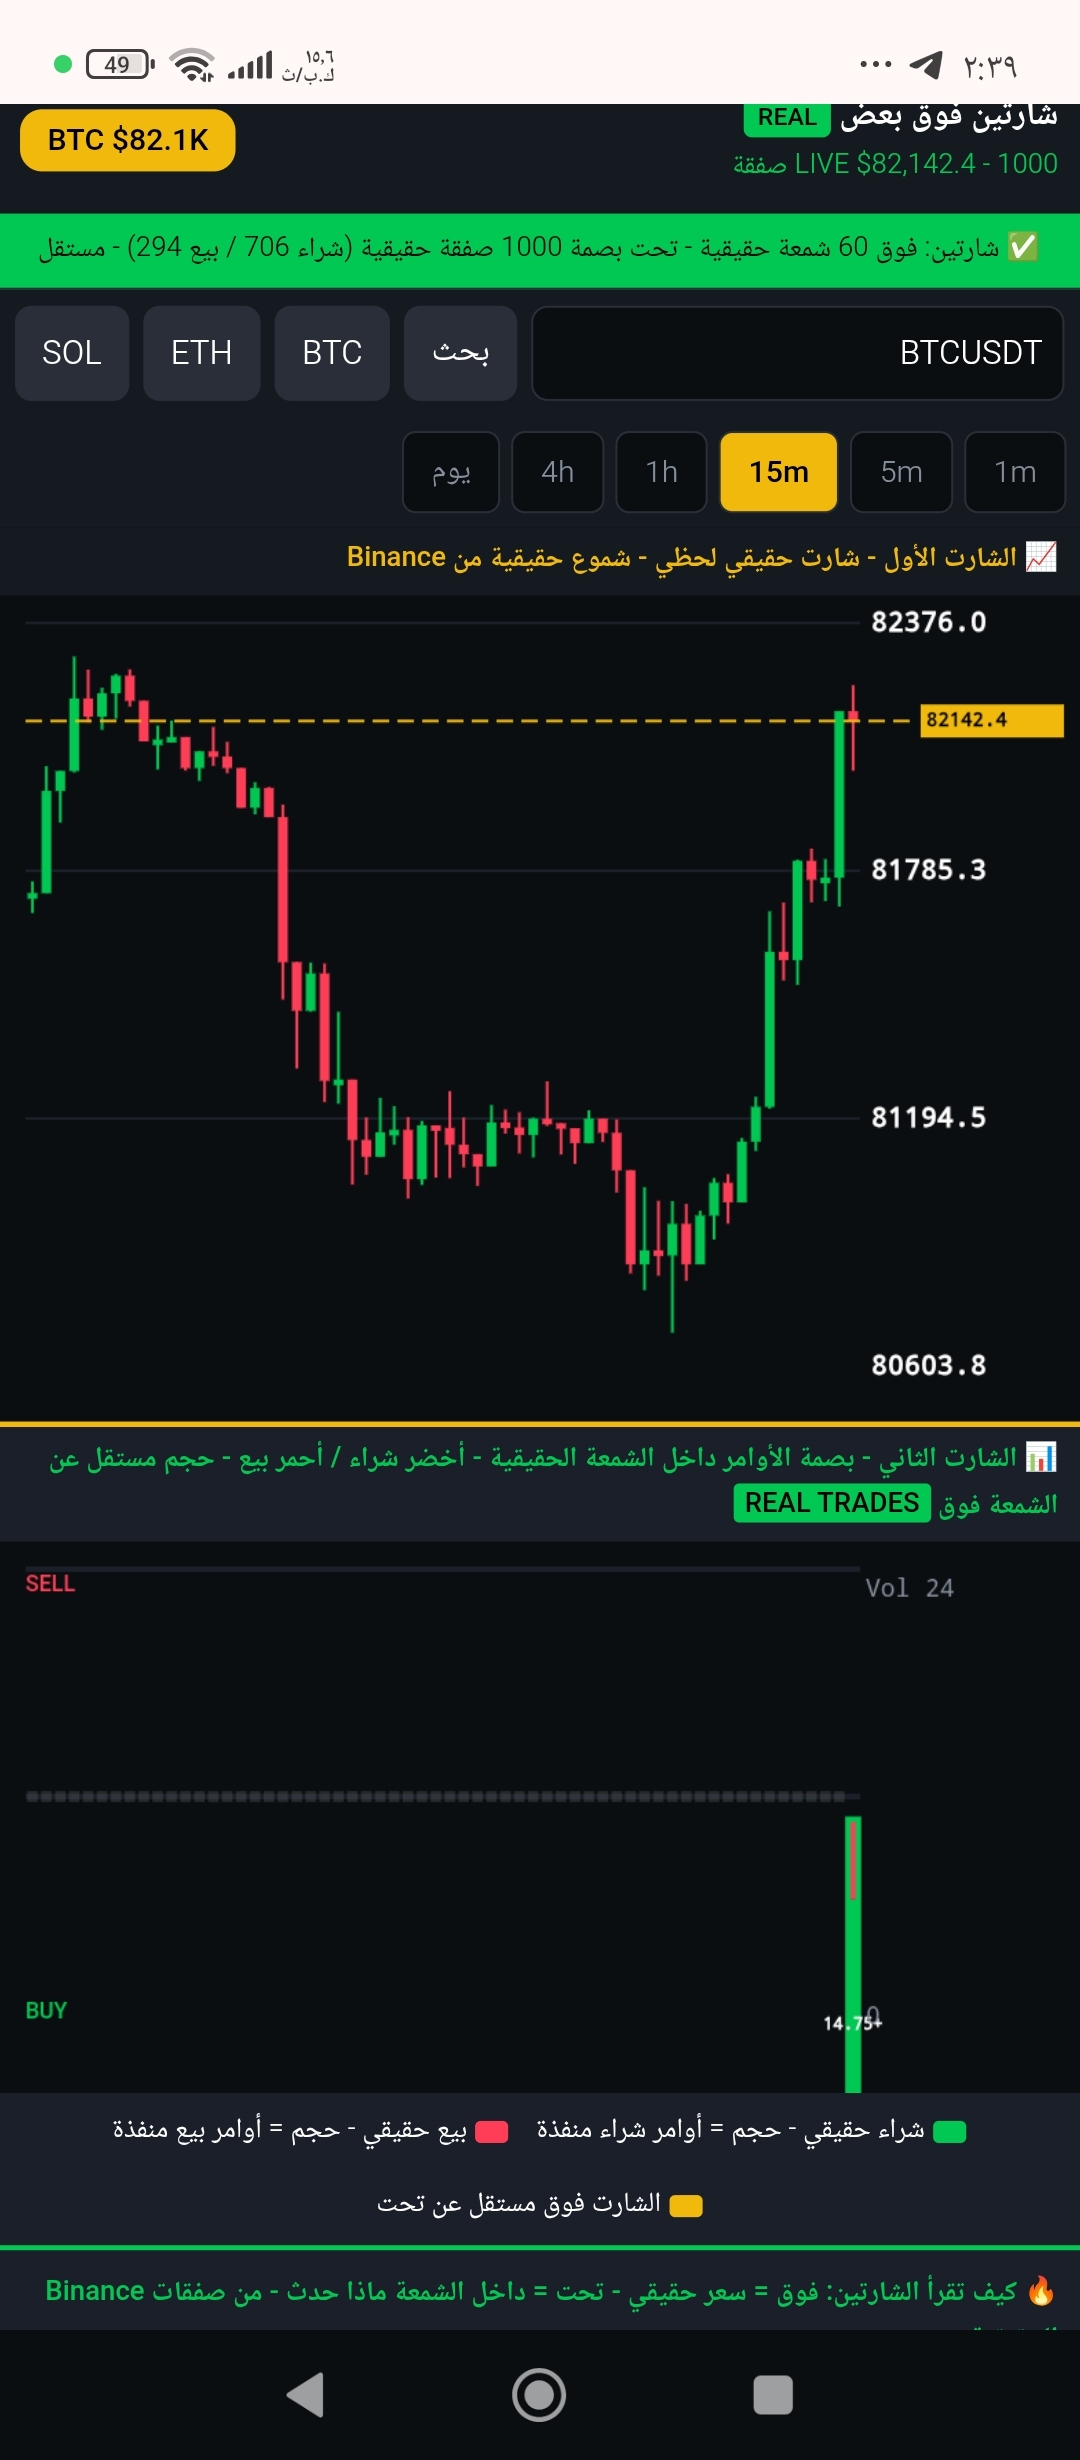
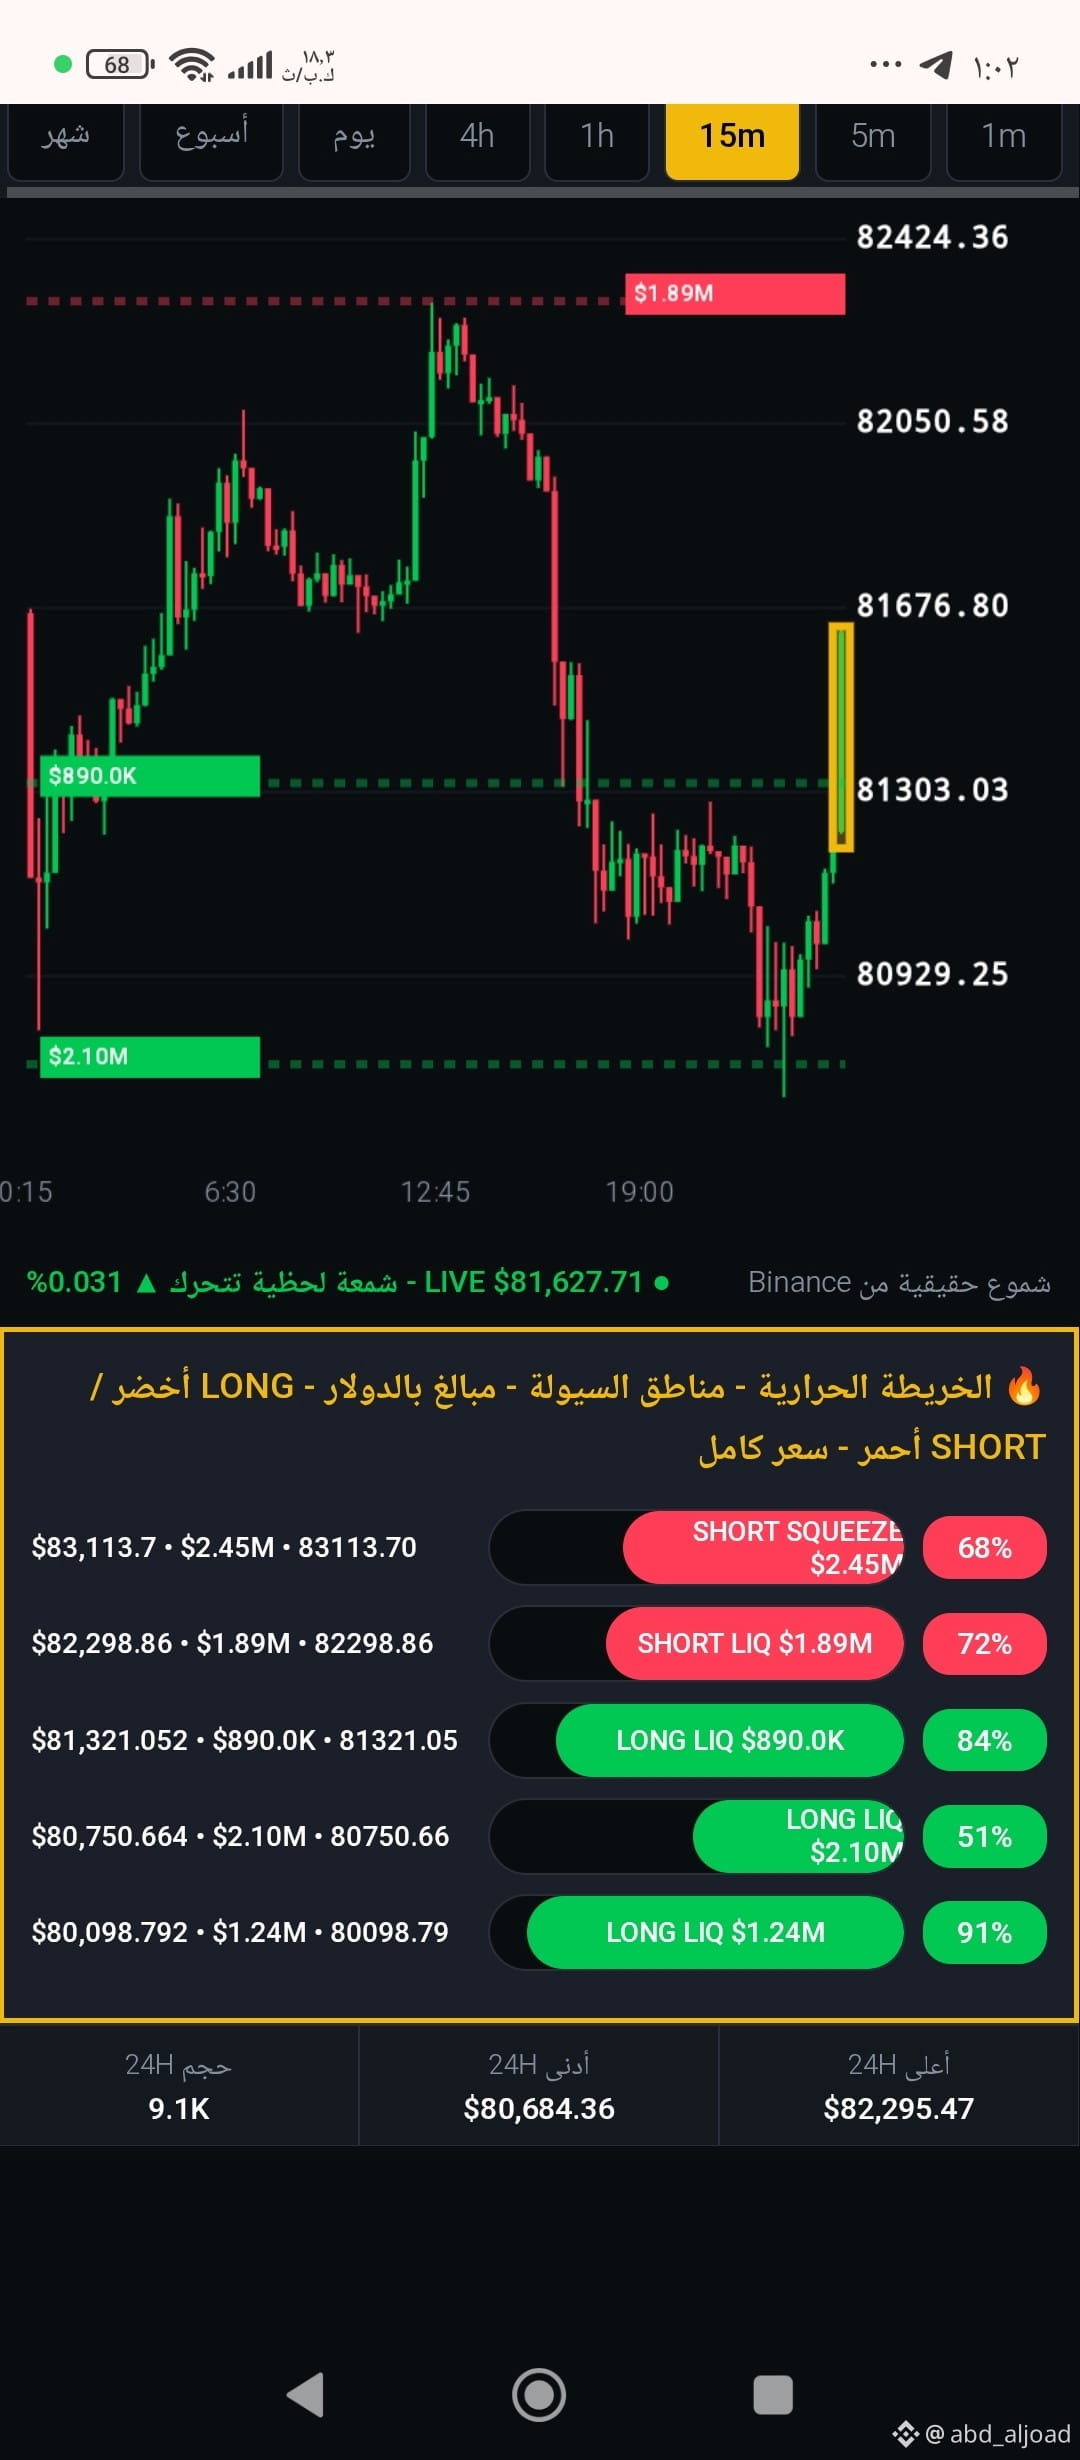
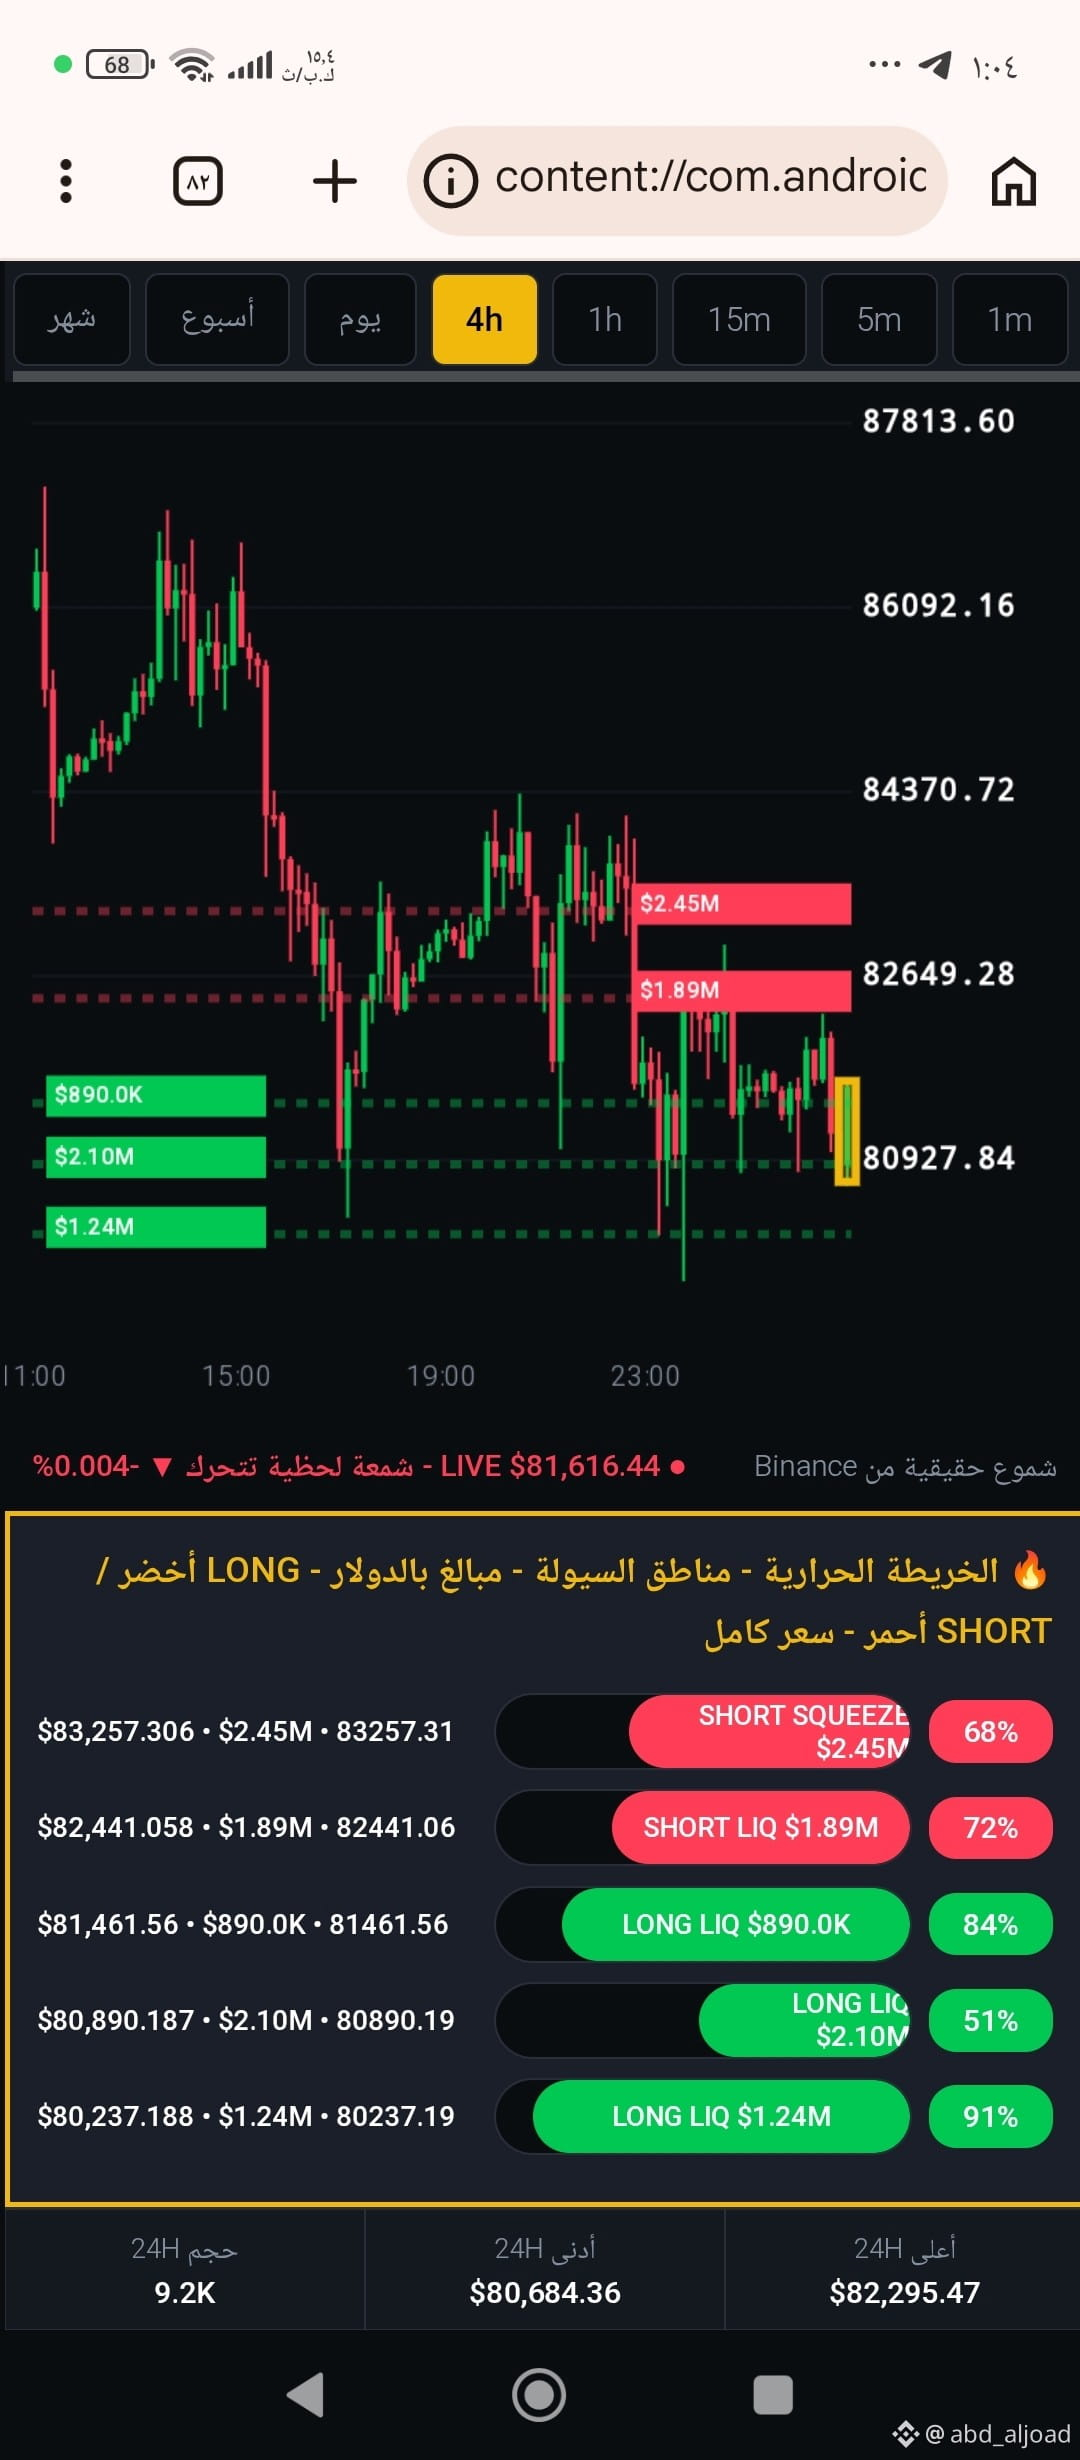
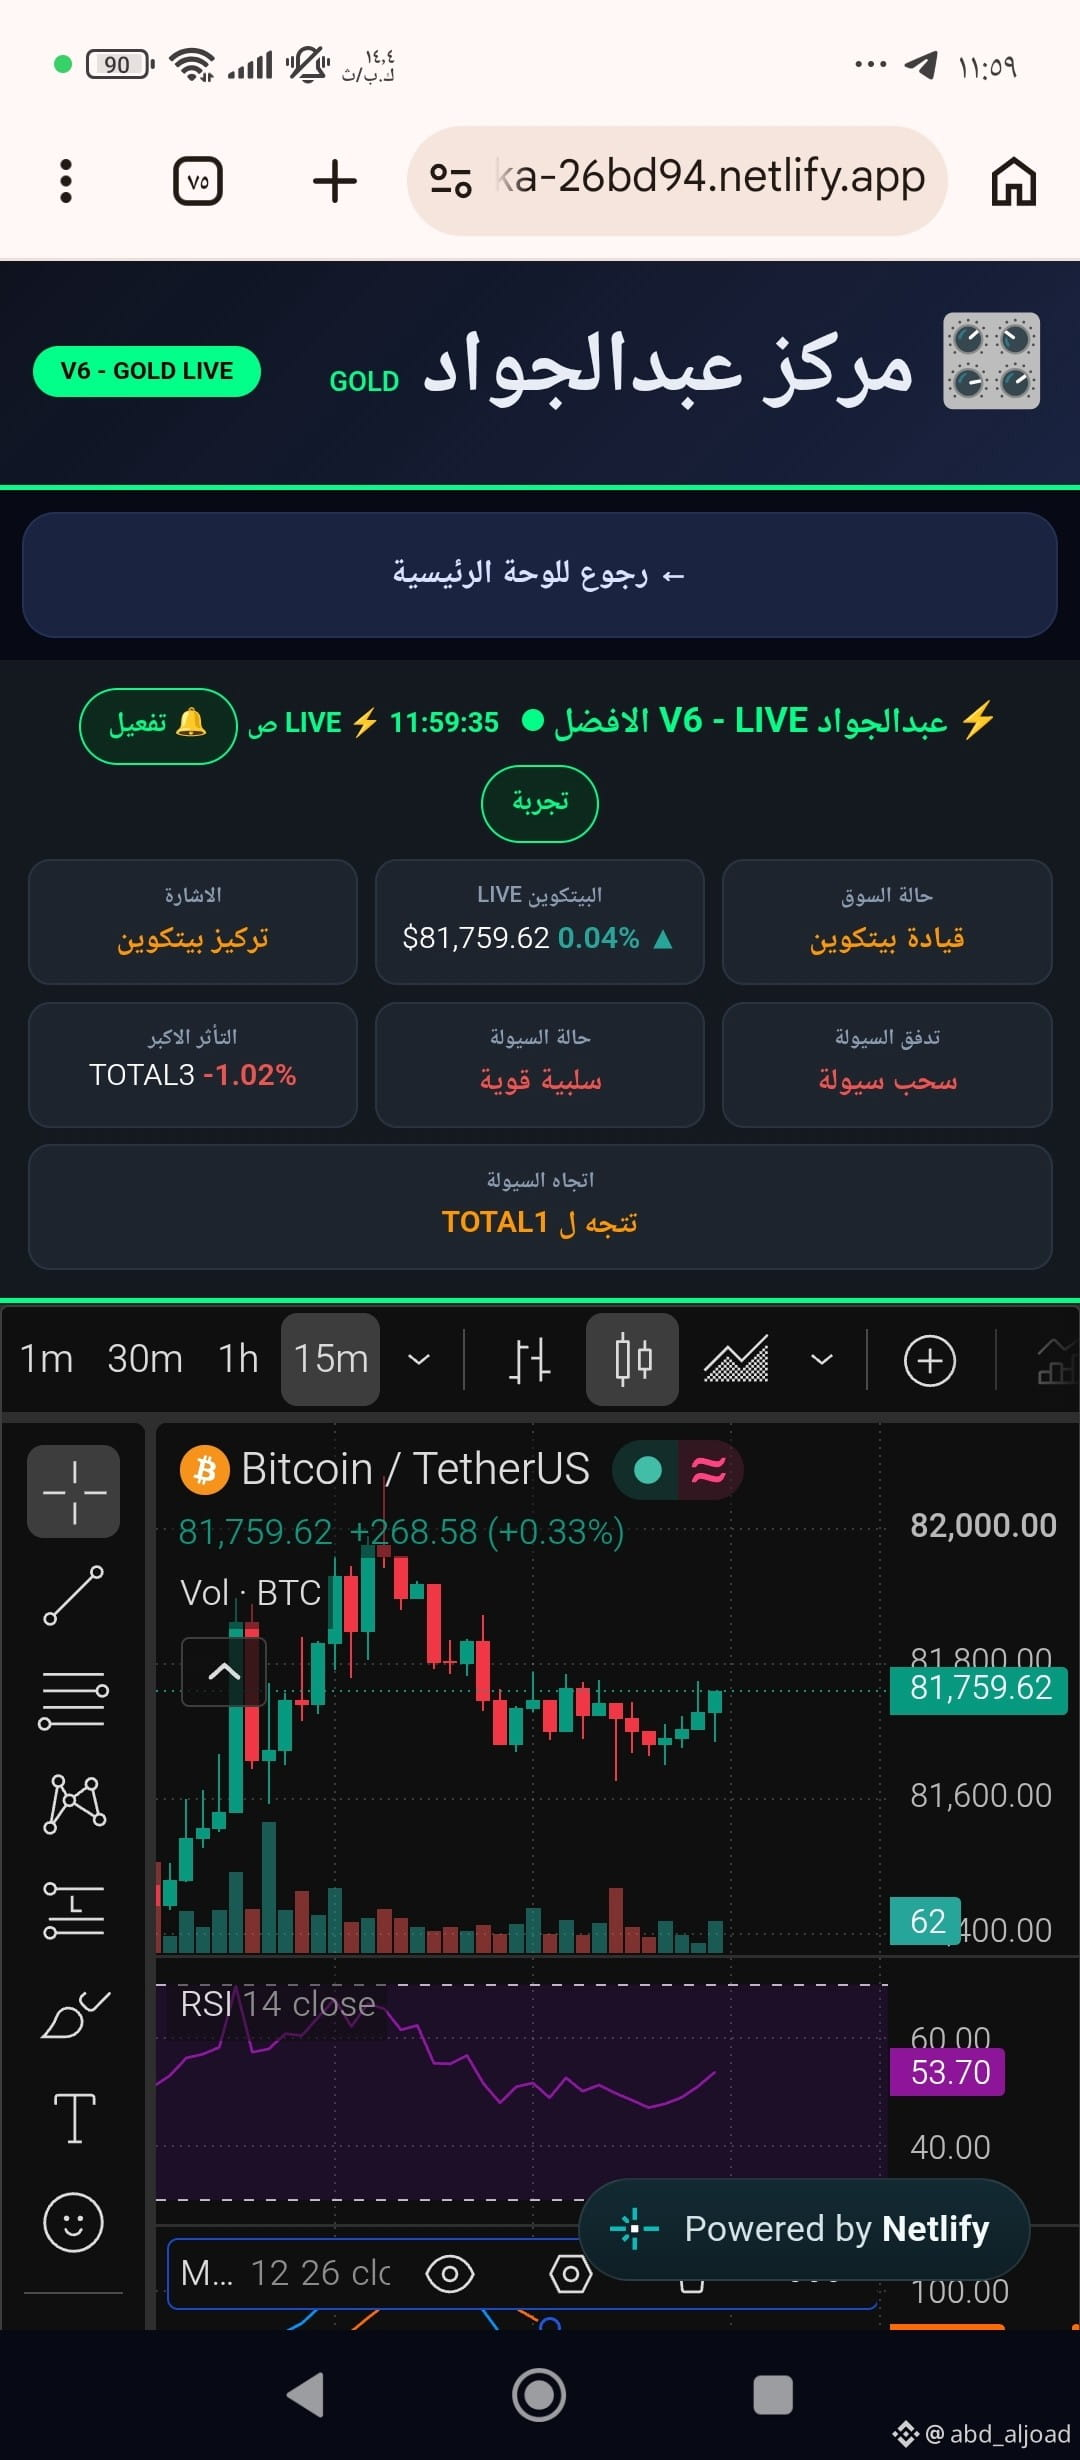
Is there early monitoring of things that don’t appear publicly? Let’s track the coordinates.
The most dangerous logistics agent planted on the battlefield as part of
Project Bayan Zero.
This is a project test, not financial advice. Do your own research and make your own decisions. These are only logistical readings of what the battlefield is hiding from you.
God knows best.
Good luck to everyone.
عبدالجواد
·
--
$BTC
#LiquidationHeatmap
@
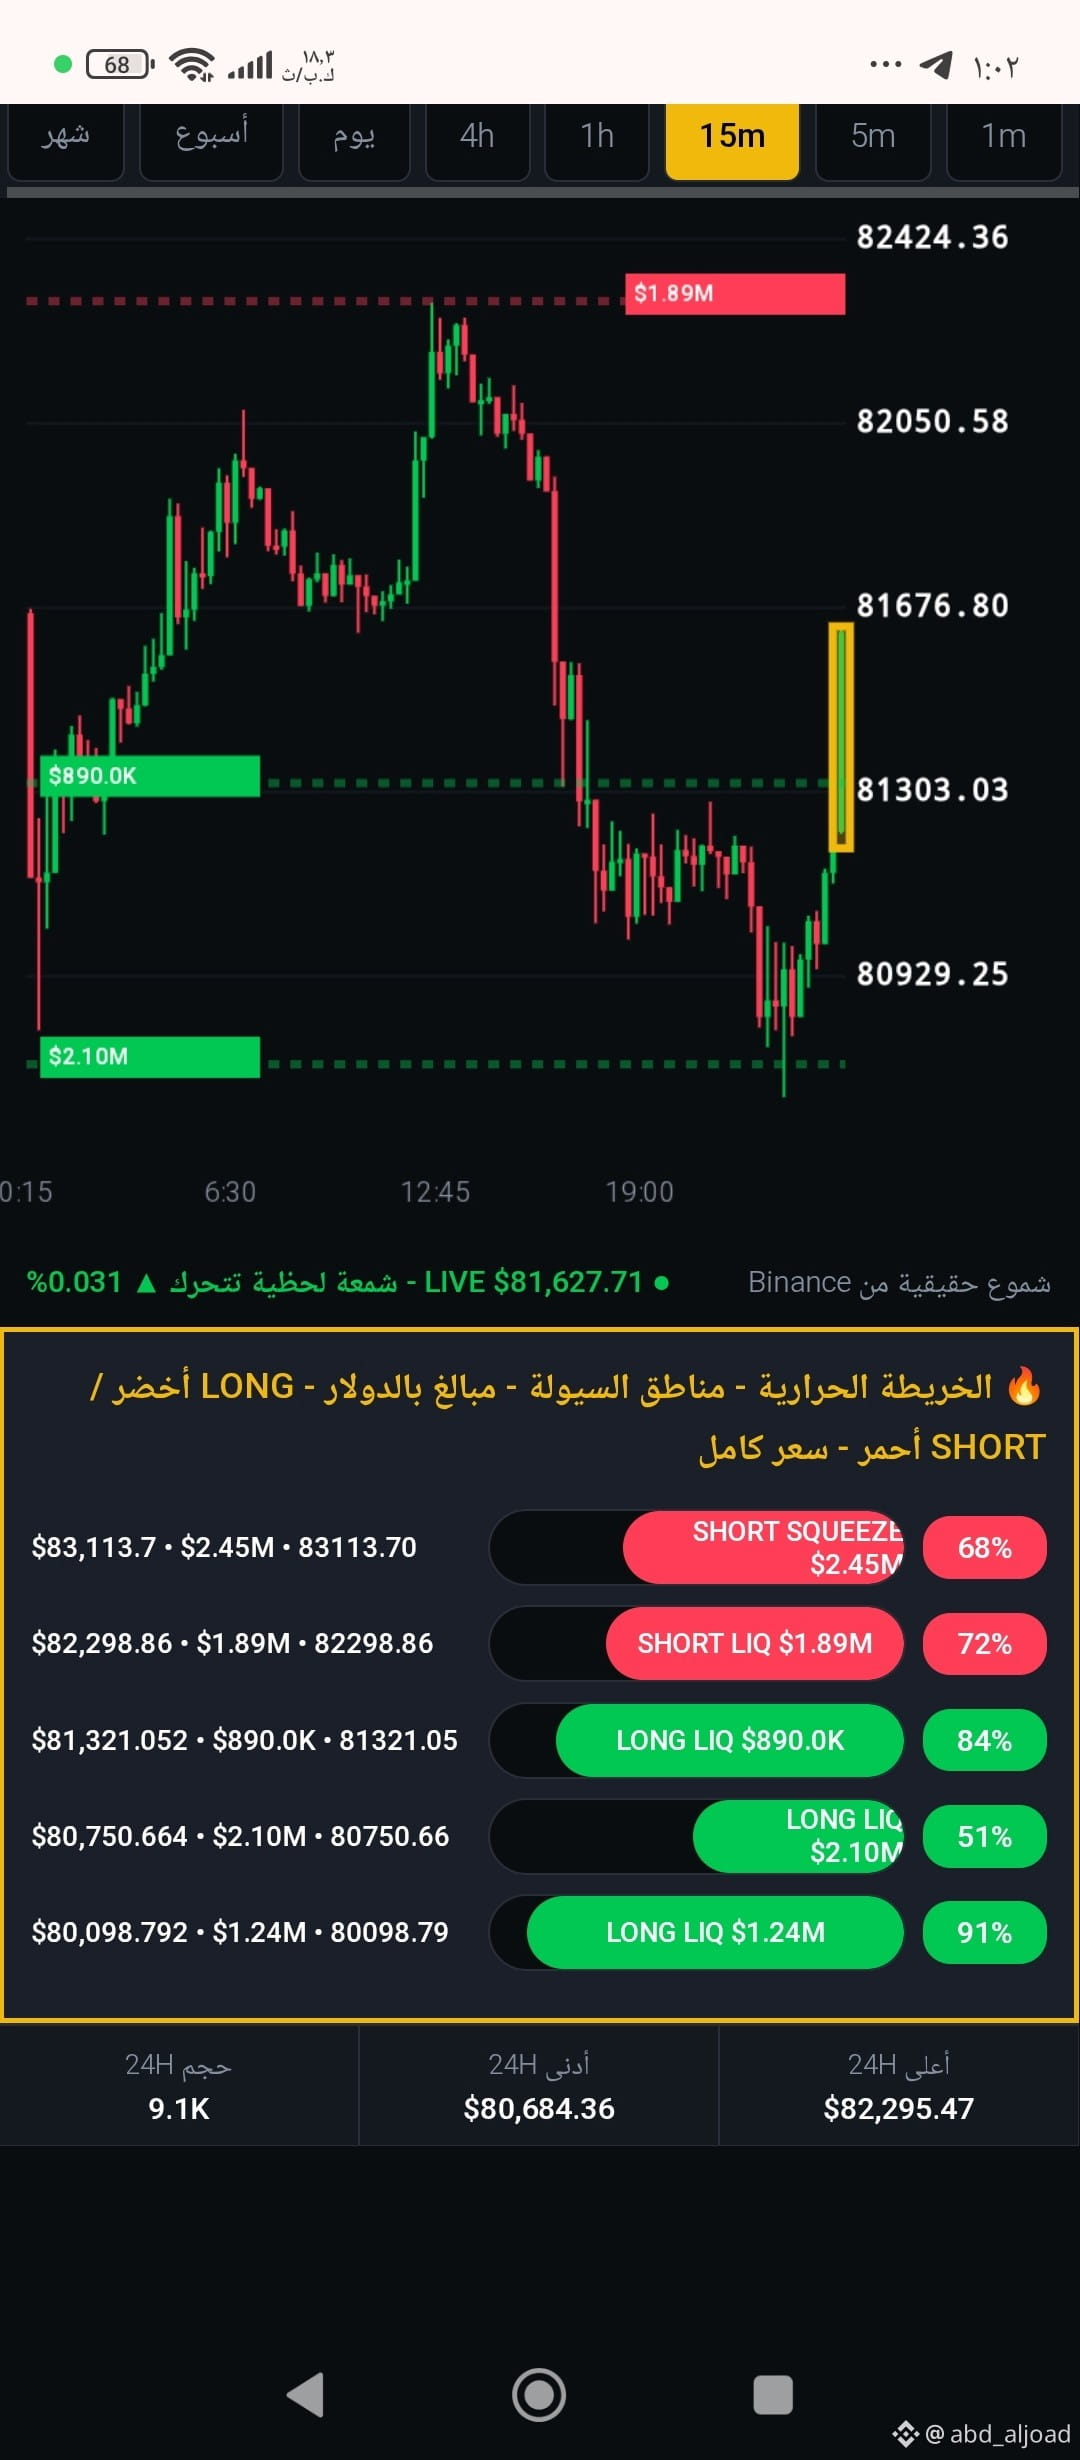
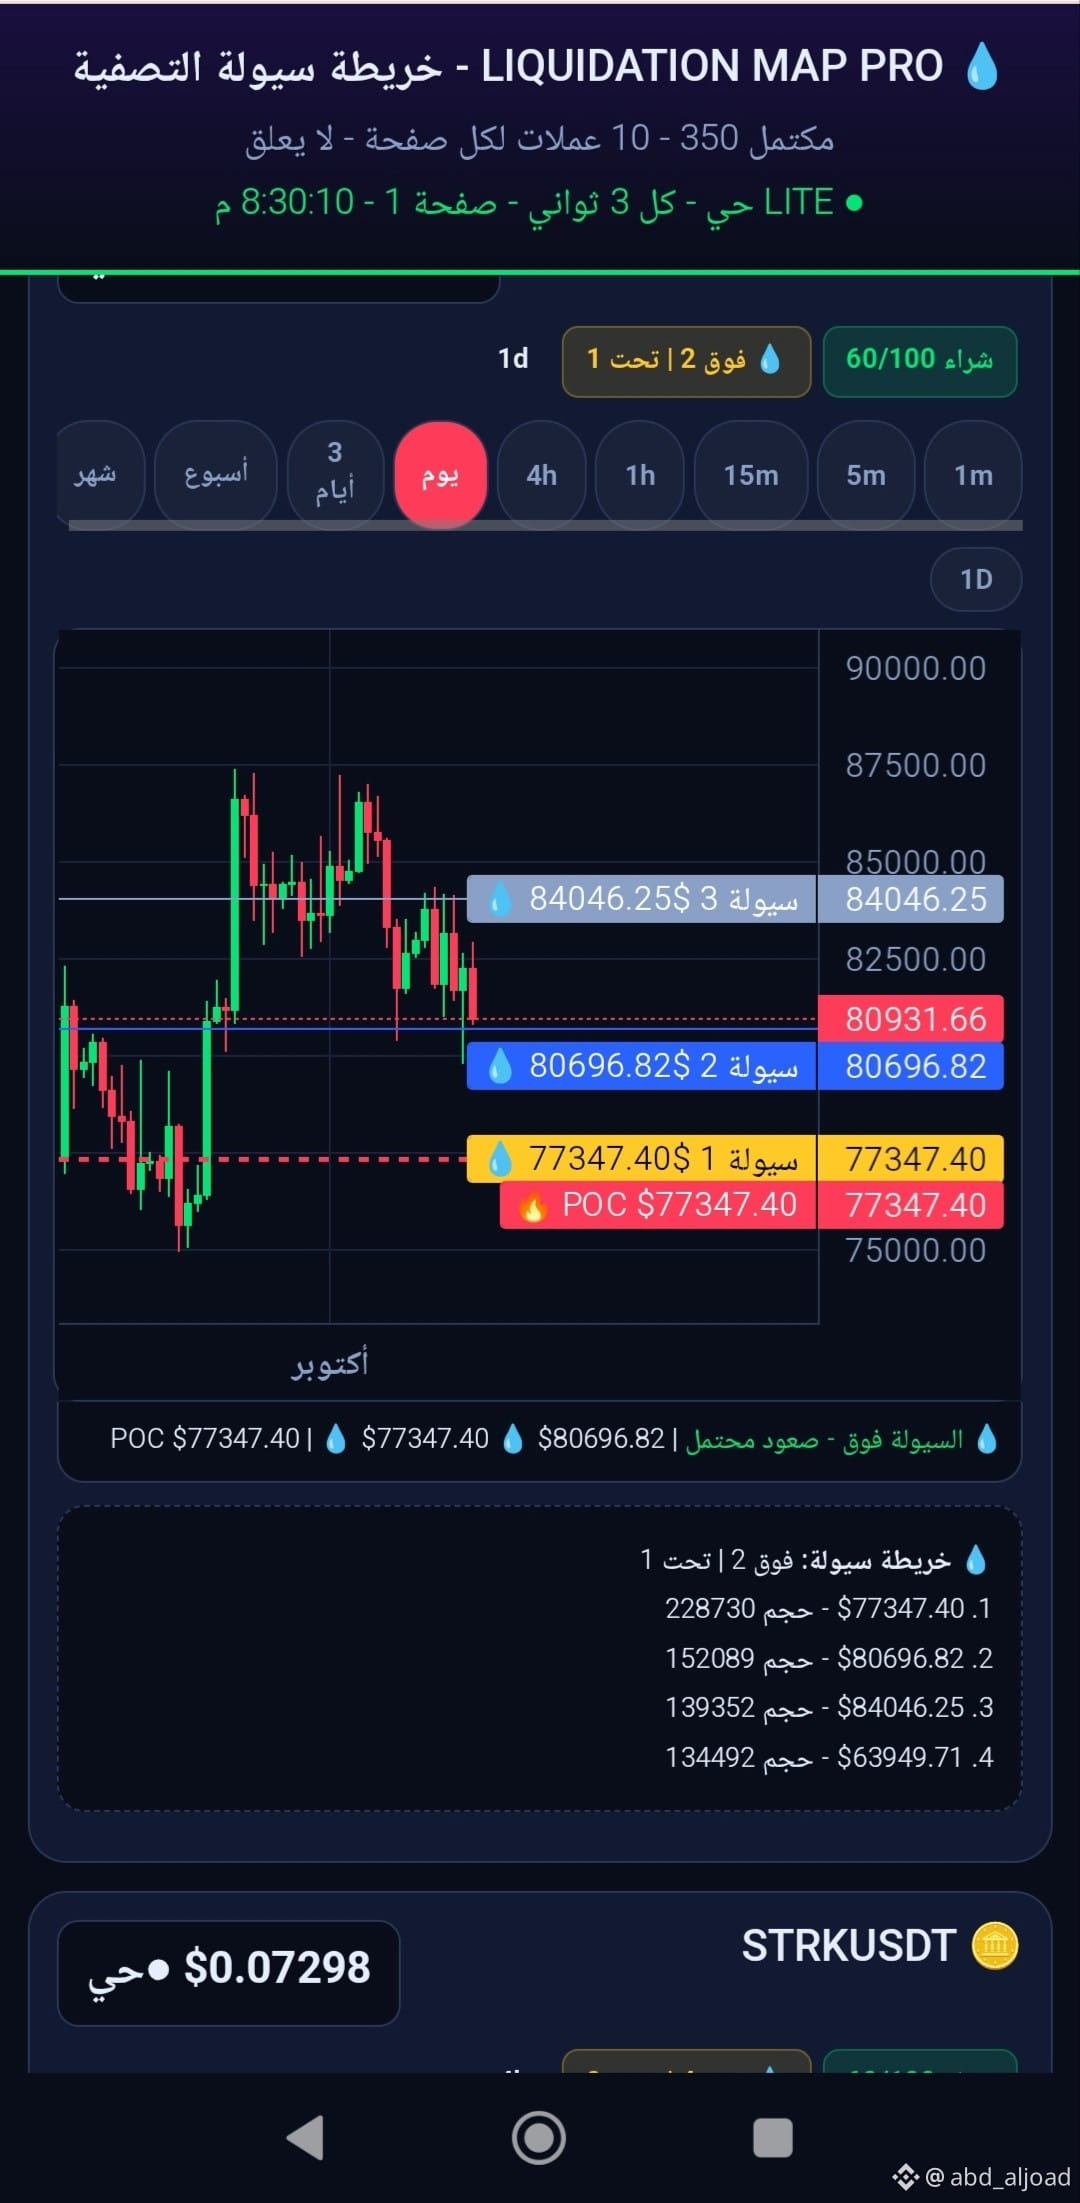
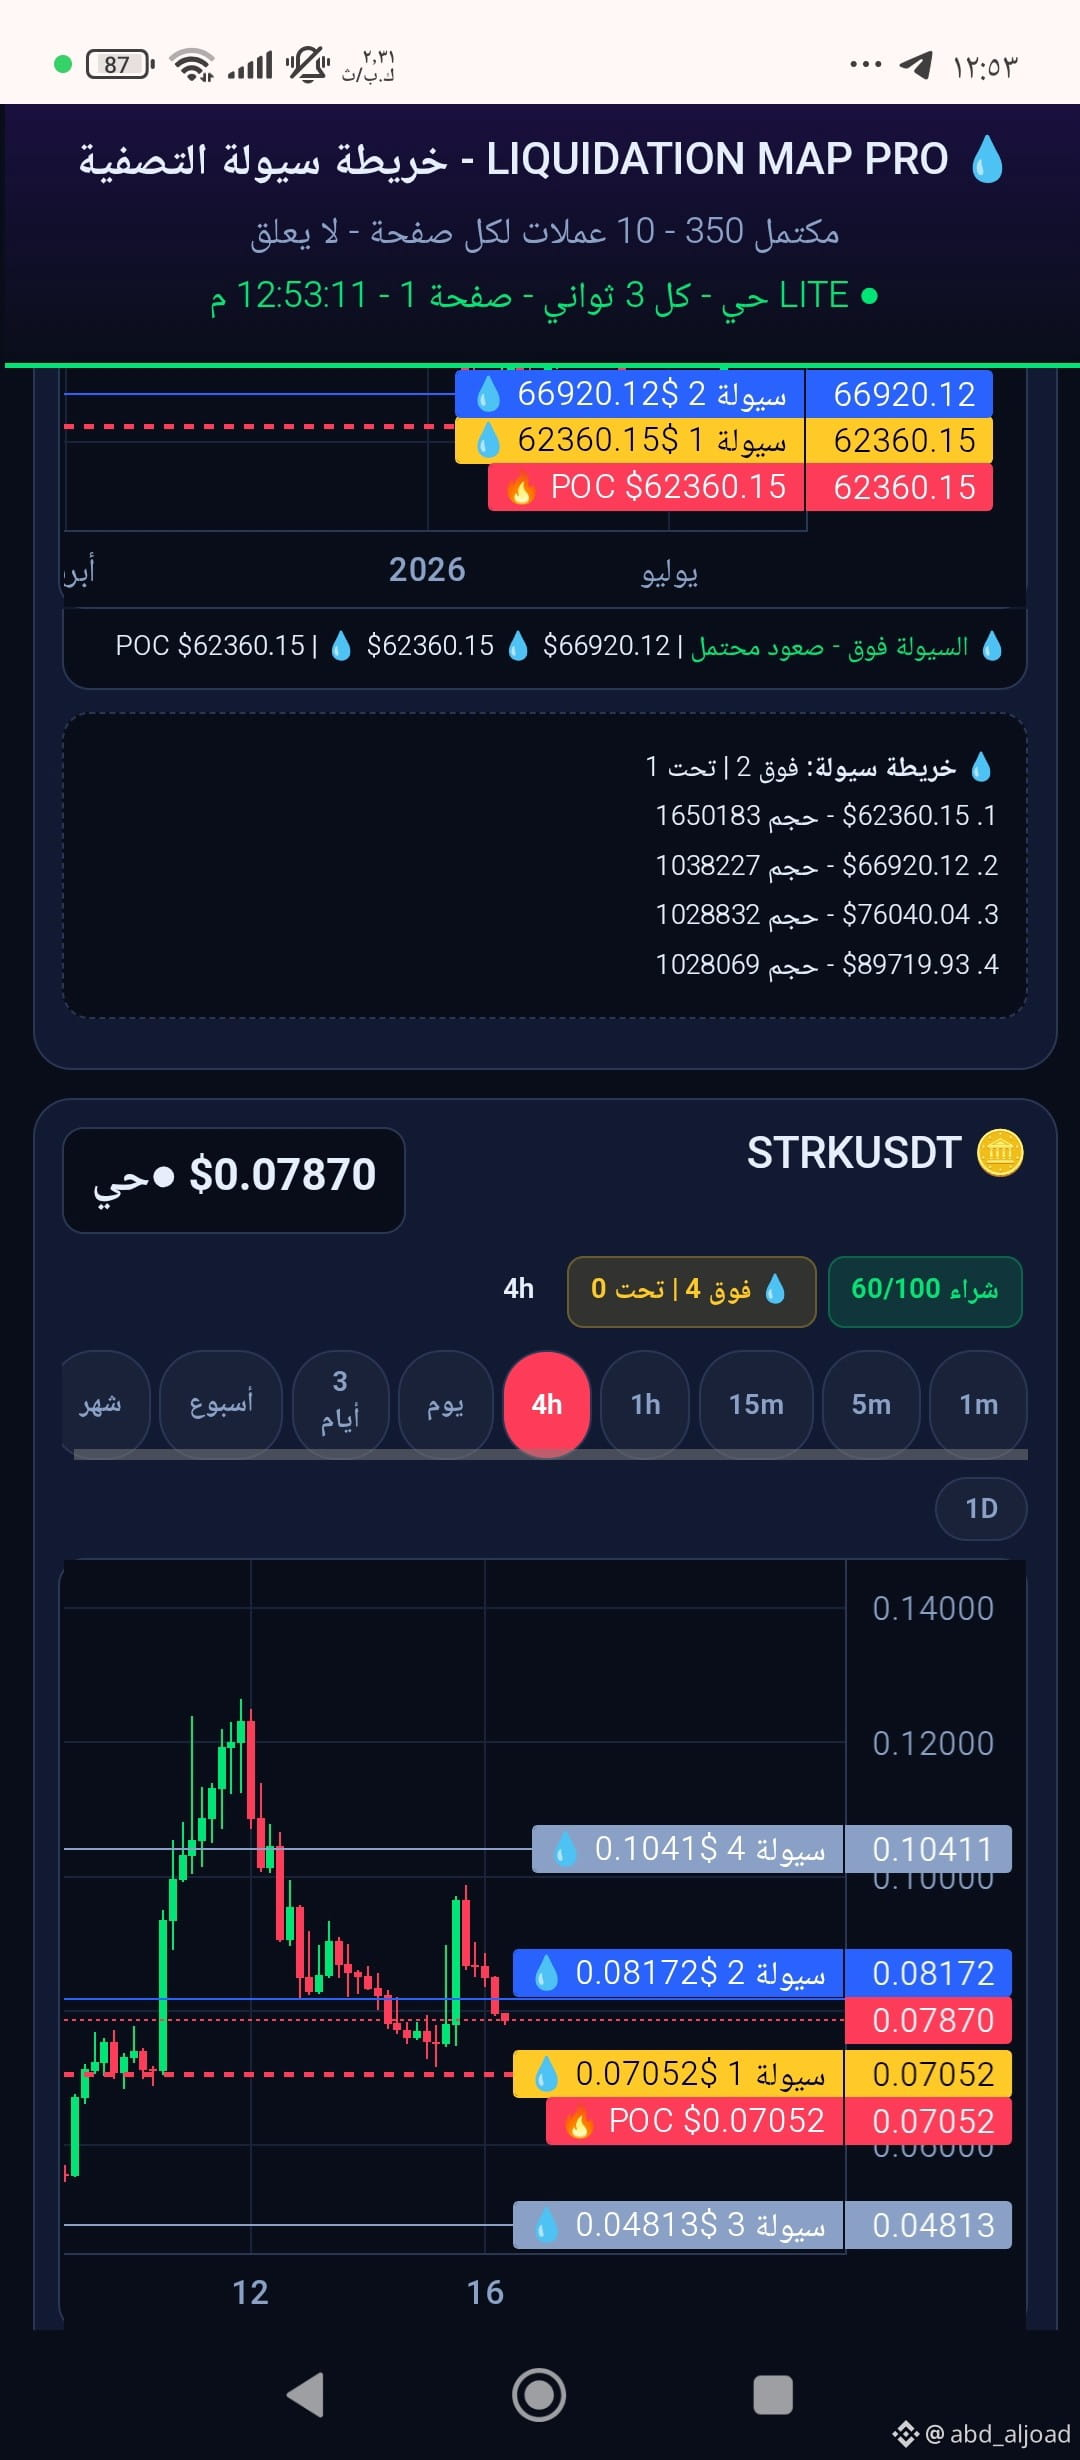
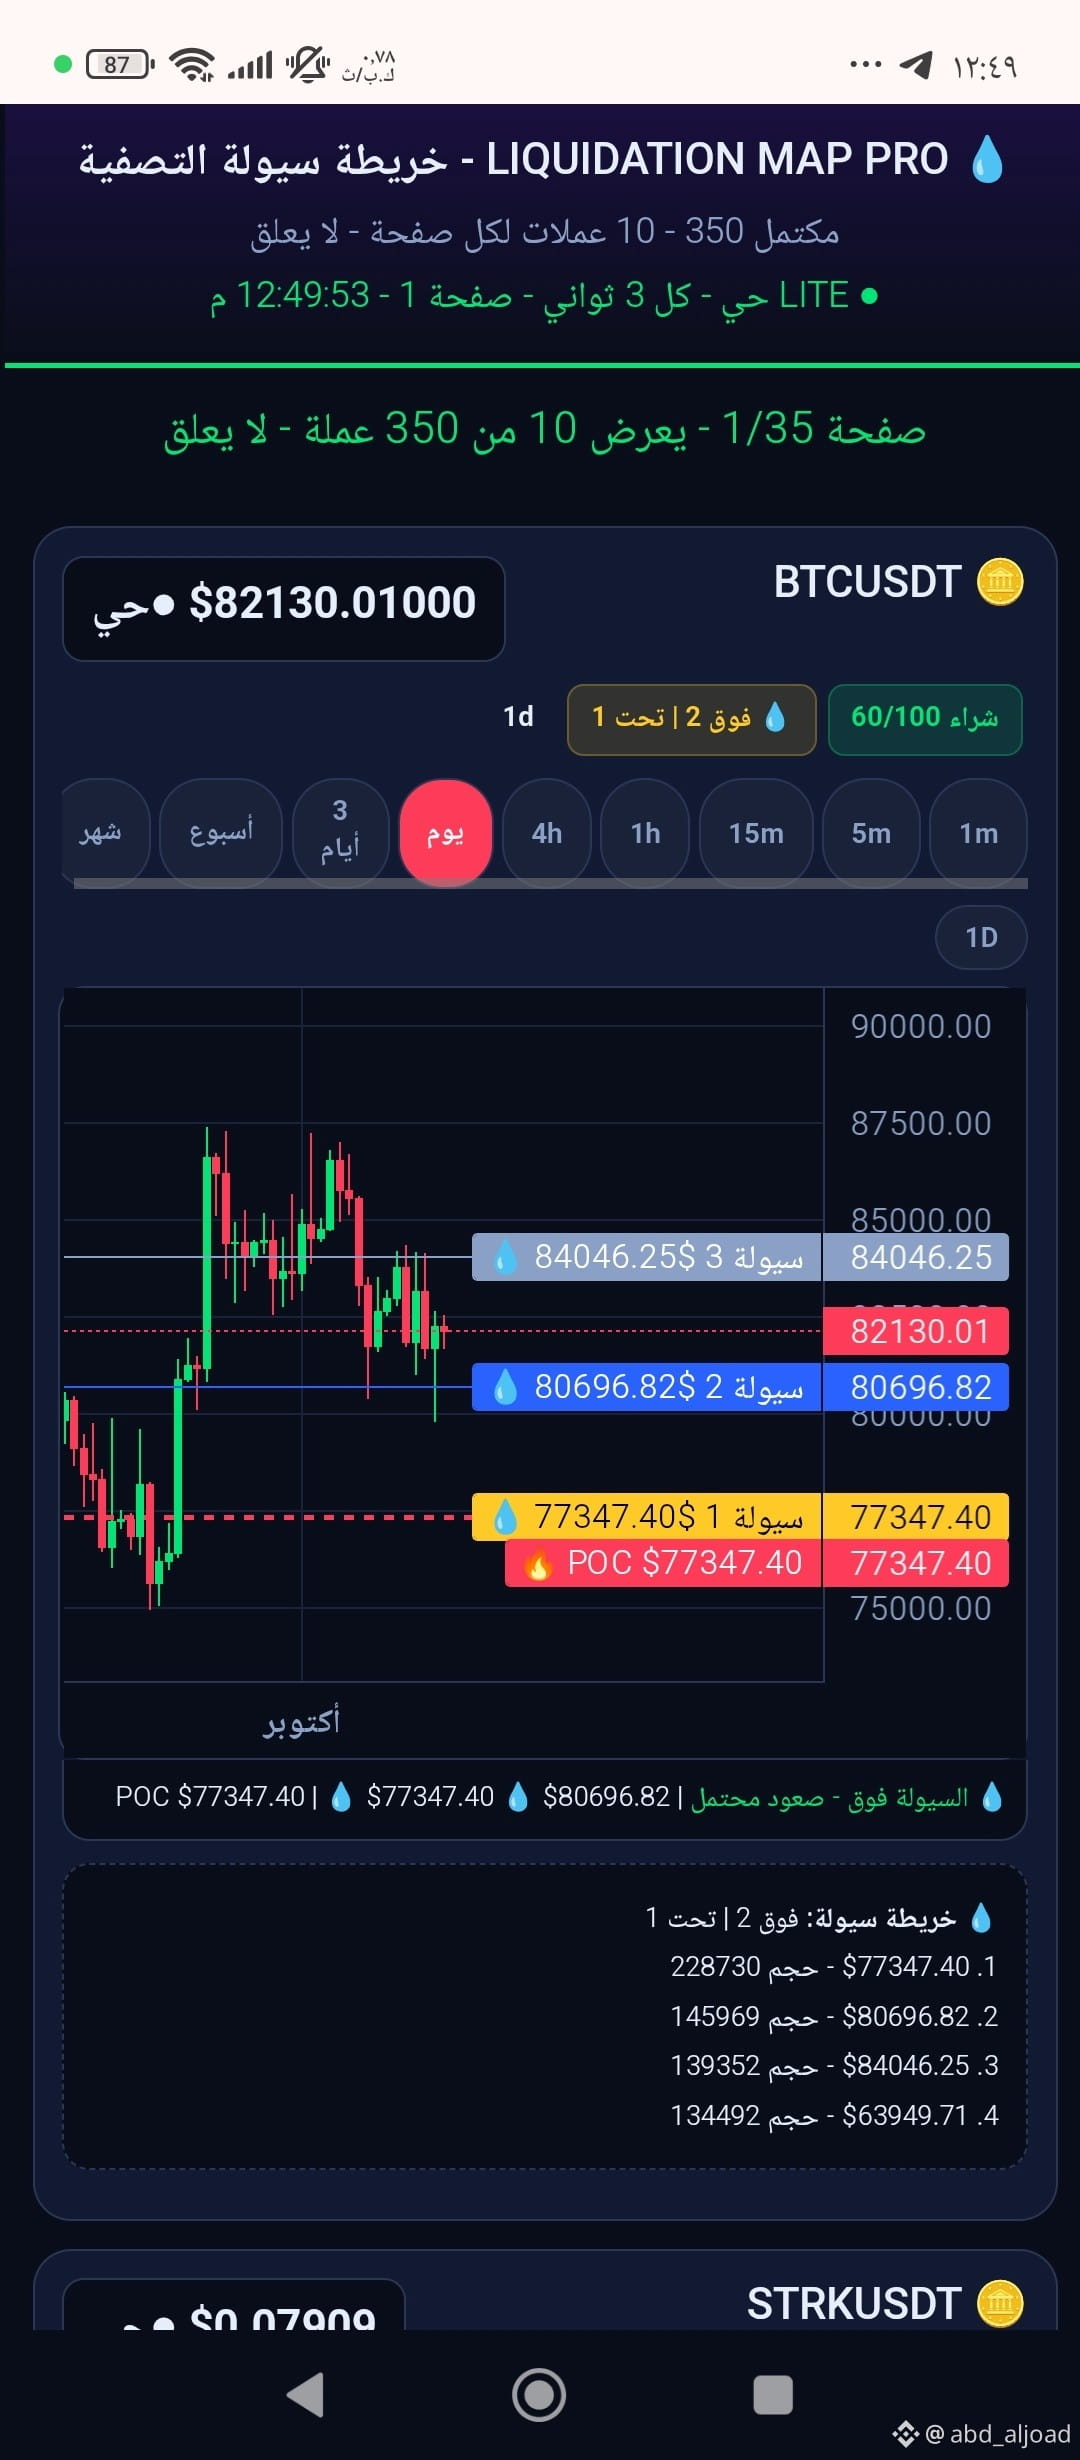
Developing a heatmap that tracks target liquidity zones in any currency, with real-time updates.
Under testing
#LiquidationHeatmap
@
Developing a heatmap that tracks target liquidity zones in any currency, with real-time updates.
Under testing
عبدالجواد
·
--
$BTC
#LiquidationHeatmap
@
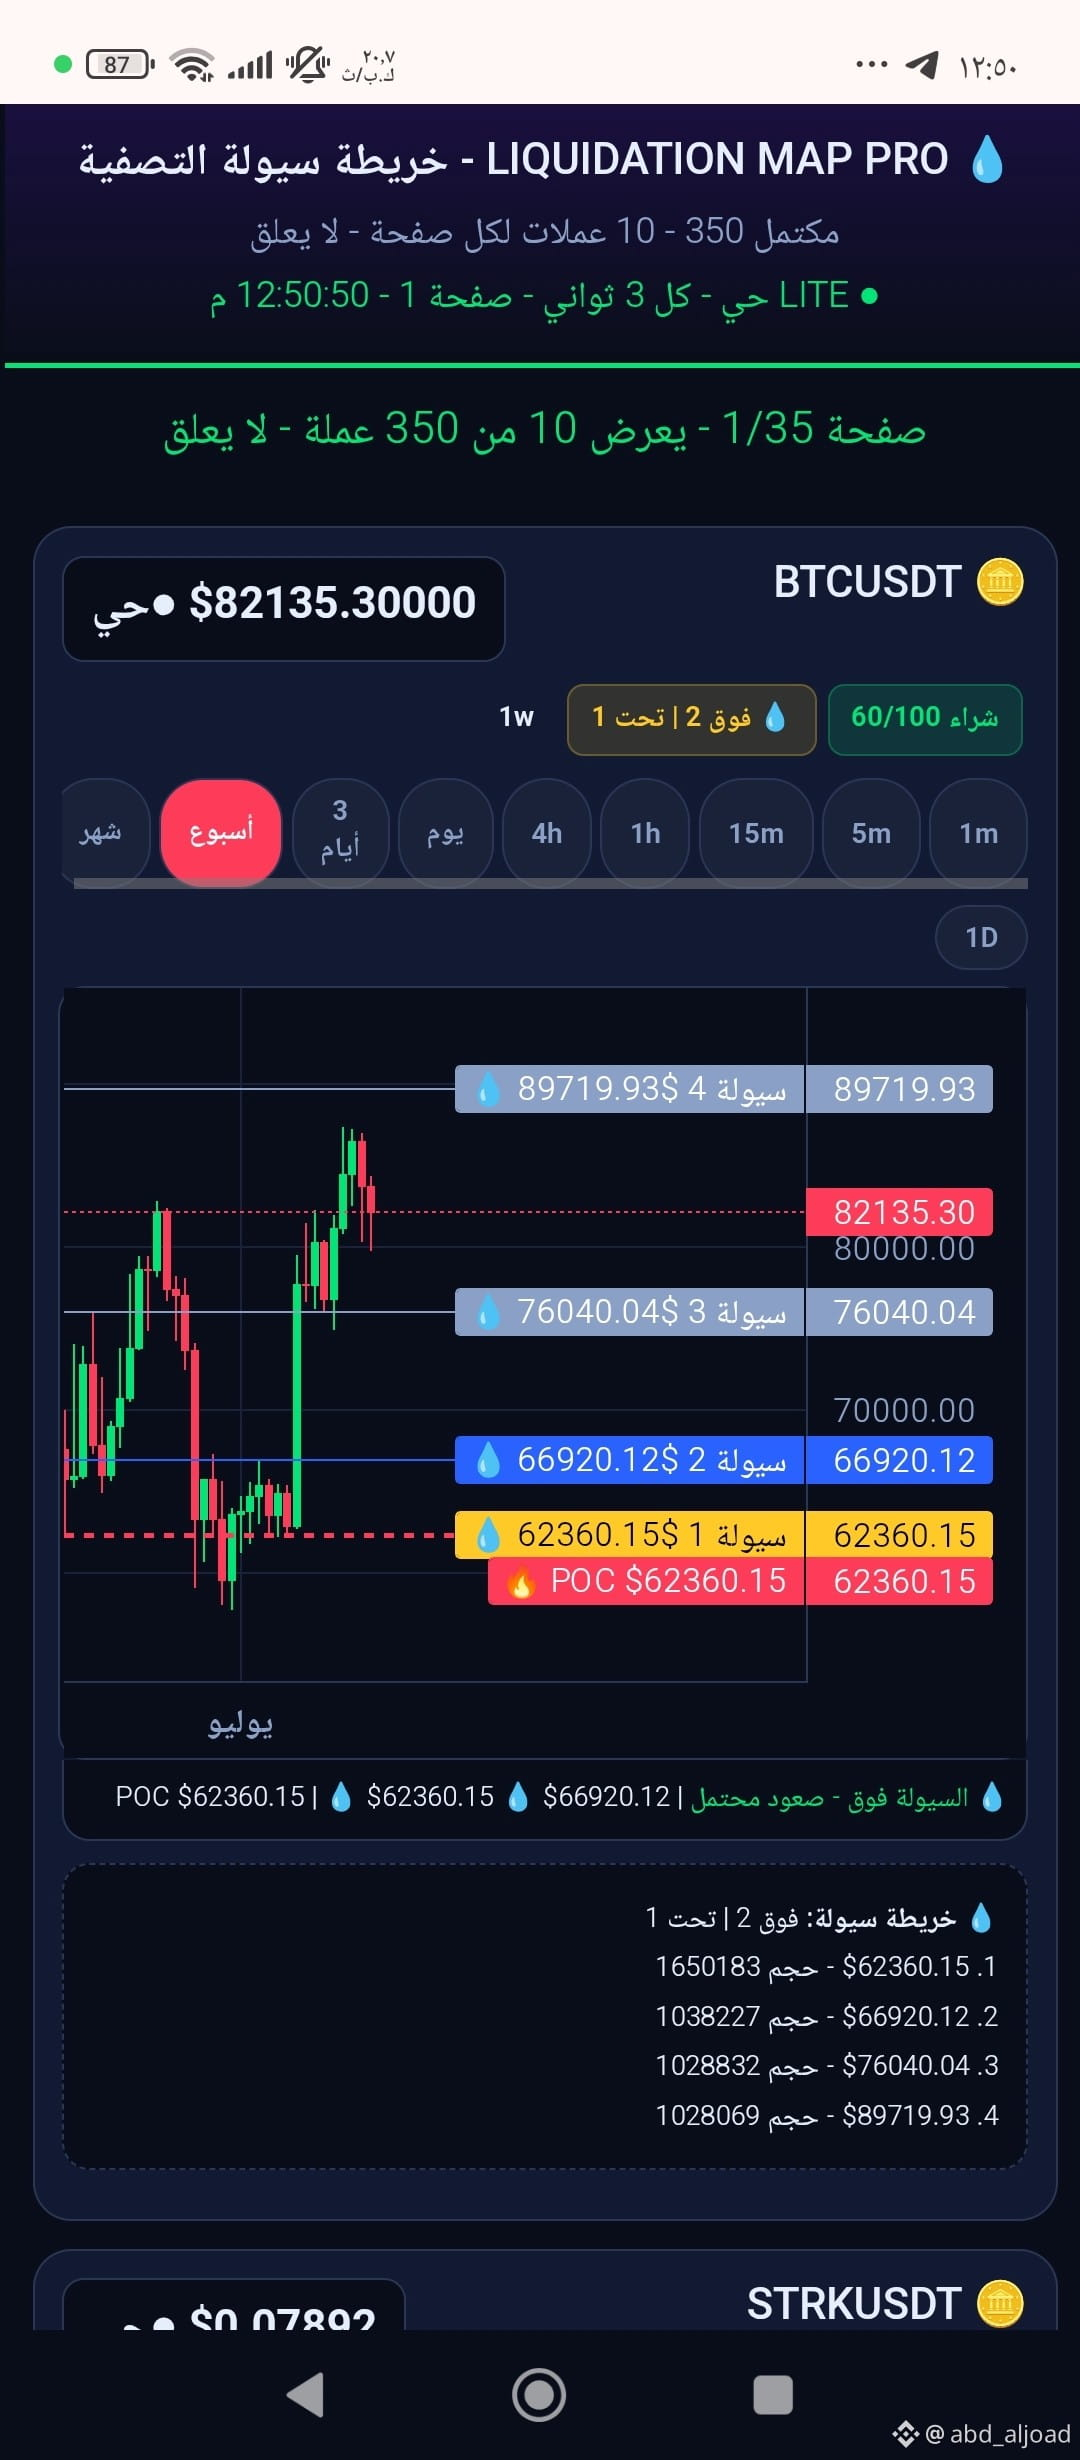
Developing a heatmap that tracks target liquidity zones in any currency, with real-time updates.
Under testing
#LiquidationHeatmap
@
Developing a heatmap that tracks target liquidity zones in any currency, with real-time updates.
Under testing
Log in to explore more content