
陈大炮_
1.6k Posts

陈大炮_
 Square Verified+
Report
Block User
你记住 普通人想翻身 数据线一定要买长一点
币安八折手续费自动返邀请码:AAAA9
公众号:AAAA9

Top 30D Traders by Volume
62 Following
35.2K+ Followers
18.2K+ Liked
1 Badges
Posts
All
Quotes
Videos
Live
PINNED
·
--
You are invited to join my group
Dapao’s chat room: https://app.binance.com/uni-qr/LKa1ZyCK
You are invited to join my group
Dapao’s chat room: https://app.binance.com/uni-qr/LKa1ZyCK
Dapao’s chat room: https://app.binance.com/uni-qr/LKa1ZyCK


8
252
PINNED
·
--
Binance rebate relationship re-binding — explanations of three methods📢 Method 1: Self-service re-binding flow
🔗 Link: [点击](https://www.bsmkweb.cc/activity/referral/bind-ref)
Applicable users: New users who registered recently and have not made any top-ups/coin purchases/trading activity
Users must simultaneously meet the following conditions:
1. KYC information has not been used for other accounts within the past 180 days
2. There is currently no referral relationship (no upstream referrer)
3. Account is the primary account (Parent Account)
4. Registration time is no more than 30 days
5. This account has no top-up, coin purchase, or trading activity (no top-up/no first deposit)
6. Not marked as a trader who violated rules
🔗 How to proceed: Users should enter through the link above, and manually fill in the inviter’s/big brother’s invitation code as required to complete the re-binding.
Binance rebate relationship re-binding — explanations of three methods
📢 Method 1: Self-service re-binding flow
🔗 Link: 点击
Applicable users: New users who registered recently and have not made any top-ups/coin purchases/trading activity
Users must simultaneously meet the following conditions:
1. KYC information has not been used for other accounts within the past 180 days
2. There is currently no referral relationship (no upstream referrer)
3. Account is the primary account (Parent Account)
4. Registration time is no more than 30 days
5. This account has no top-up, coin purchase, or trading activity (no top-up/no first deposit)
6. Not marked as a trader who violated rules
🔗 How to proceed: Users should enter through the link above, and manually fill in the inviter’s/big brother’s invitation code as required to complete the re-binding.
🔗 Link: 点击
Applicable users: New users who registered recently and have not made any top-ups/coin purchases/trading activity
Users must simultaneously meet the following conditions:
1. KYC information has not been used for other accounts within the past 180 days
2. There is currently no referral relationship (no upstream referrer)
3. Account is the primary account (Parent Account)
4. Registration time is no more than 30 days
5. This account has no top-up, coin purchase, or trading activity (no top-up/no first deposit)
6. Not marked as a trader who violated rules
🔗 How to proceed: Users should enter through the link above, and manually fill in the inviter’s/big brother’s invitation code as required to complete the re-binding.
4
336
·
--
$ETH
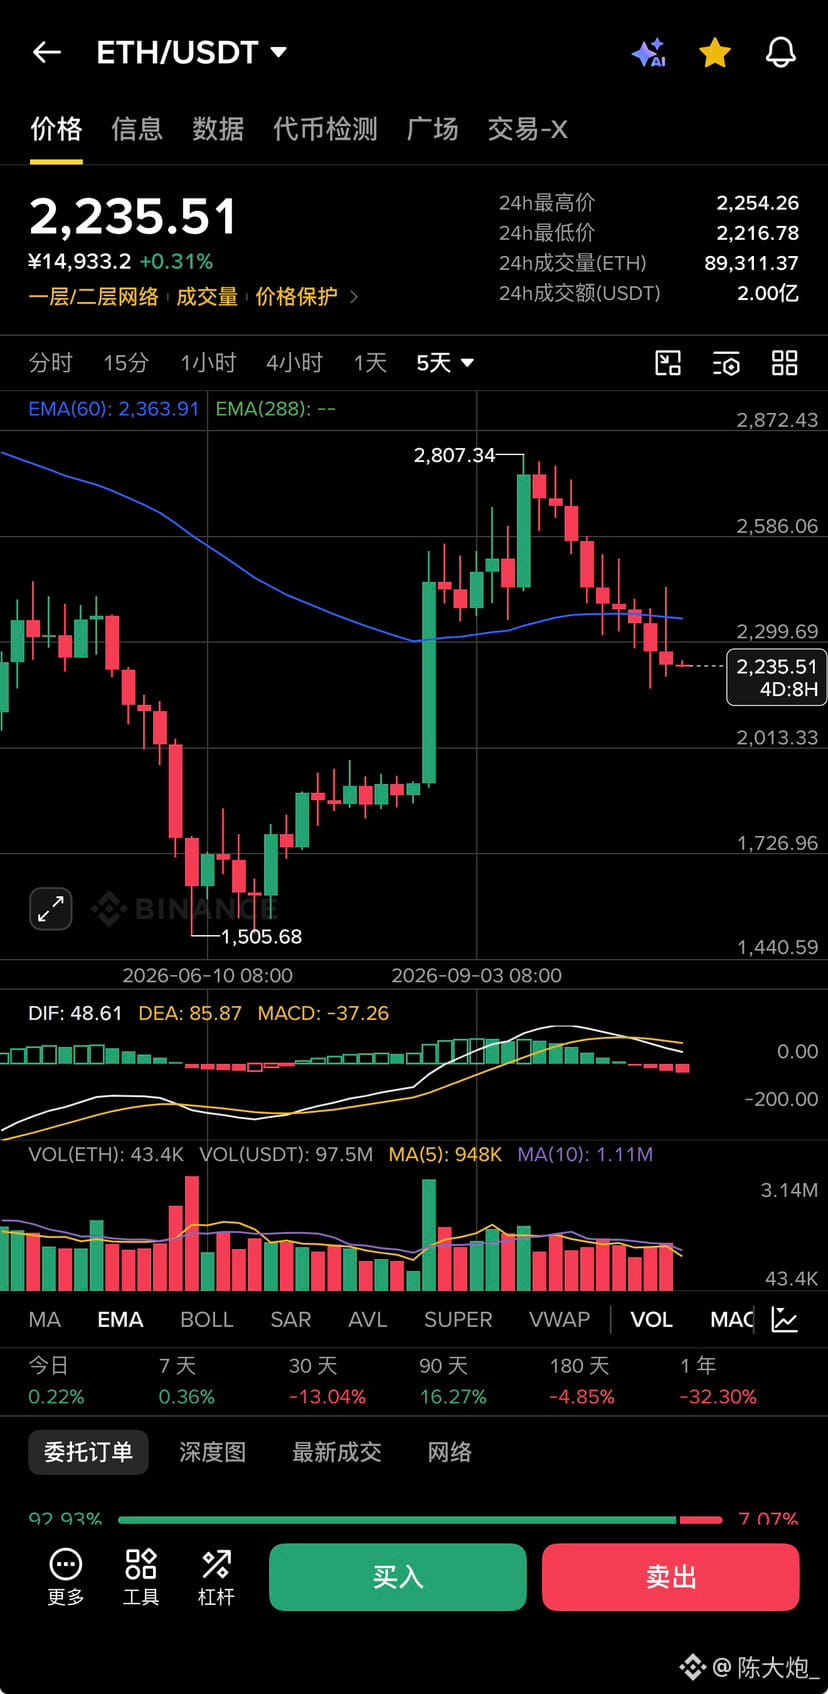
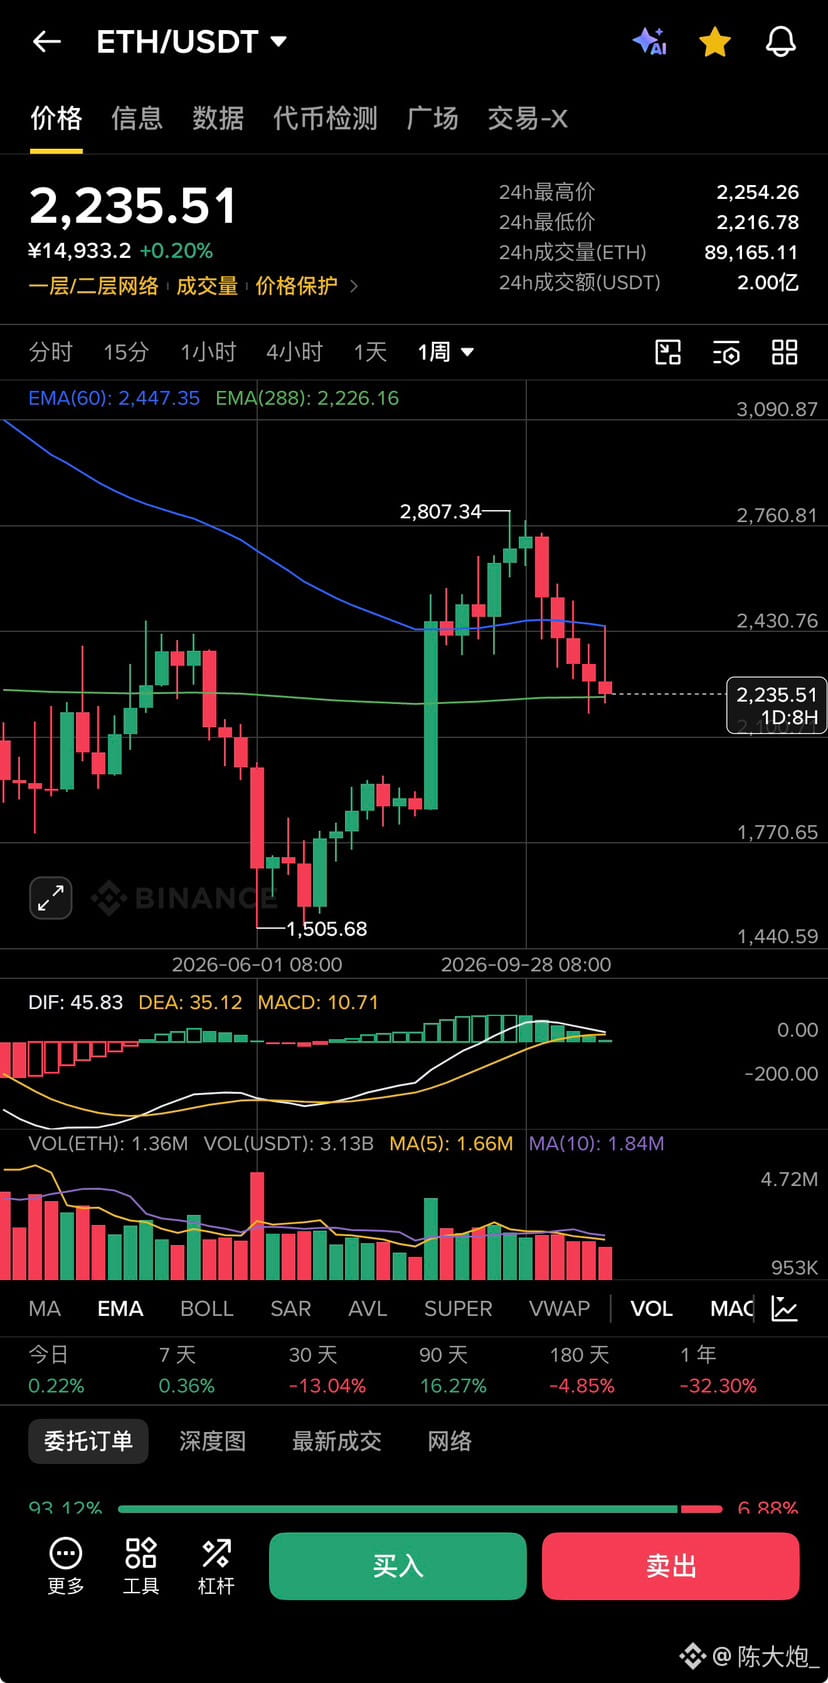
Ethereum has had 10 consecutive down days on the 5-day chart
The weekly chart has also had 5 consecutive down weeks
What’s going on?
Hahahaha..
$ETH
Ethereum has had 10 consecutive down days on the 5-day chart
The weekly chart has also had 5 consecutive down weeks
What’s going on?
Hahahaha..
Ethereum has had 10 consecutive down days on the 5-day chart
The weekly chart has also had 5 consecutive down weeks
What’s going on?
Hahahaha..
1.2k
·
--
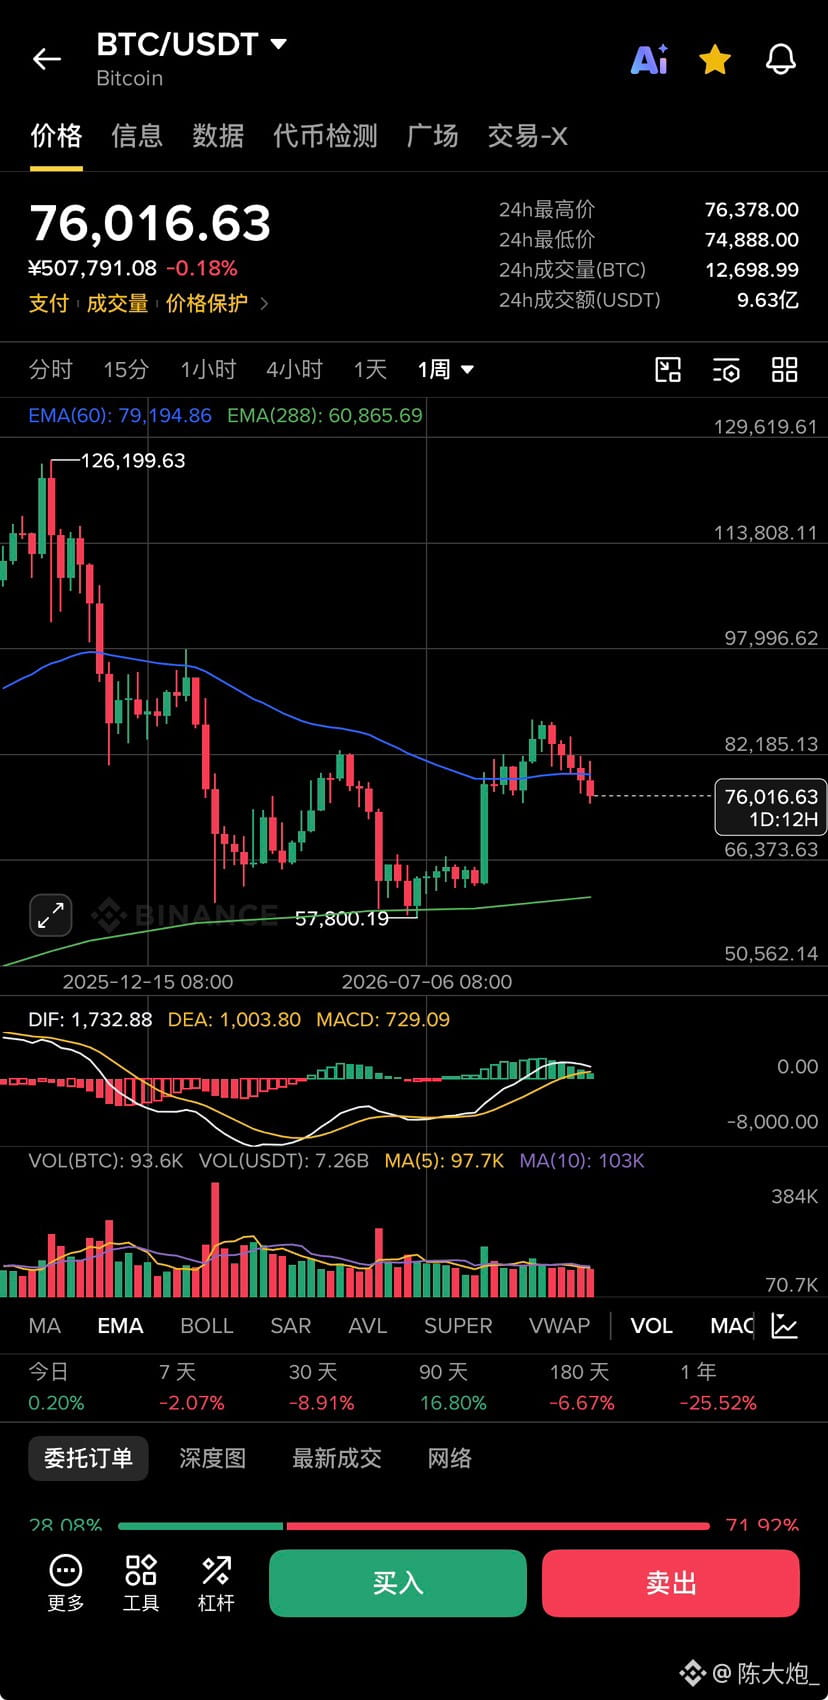
$BTC Bitcoin: if it can't close the weekly candle above 76300, then watch the 73600–71300 range below.
$BTC Bitcoin: if it can't close the weekly candle above 76300, then watch the 73600–71300 range below.
1
348
·
--
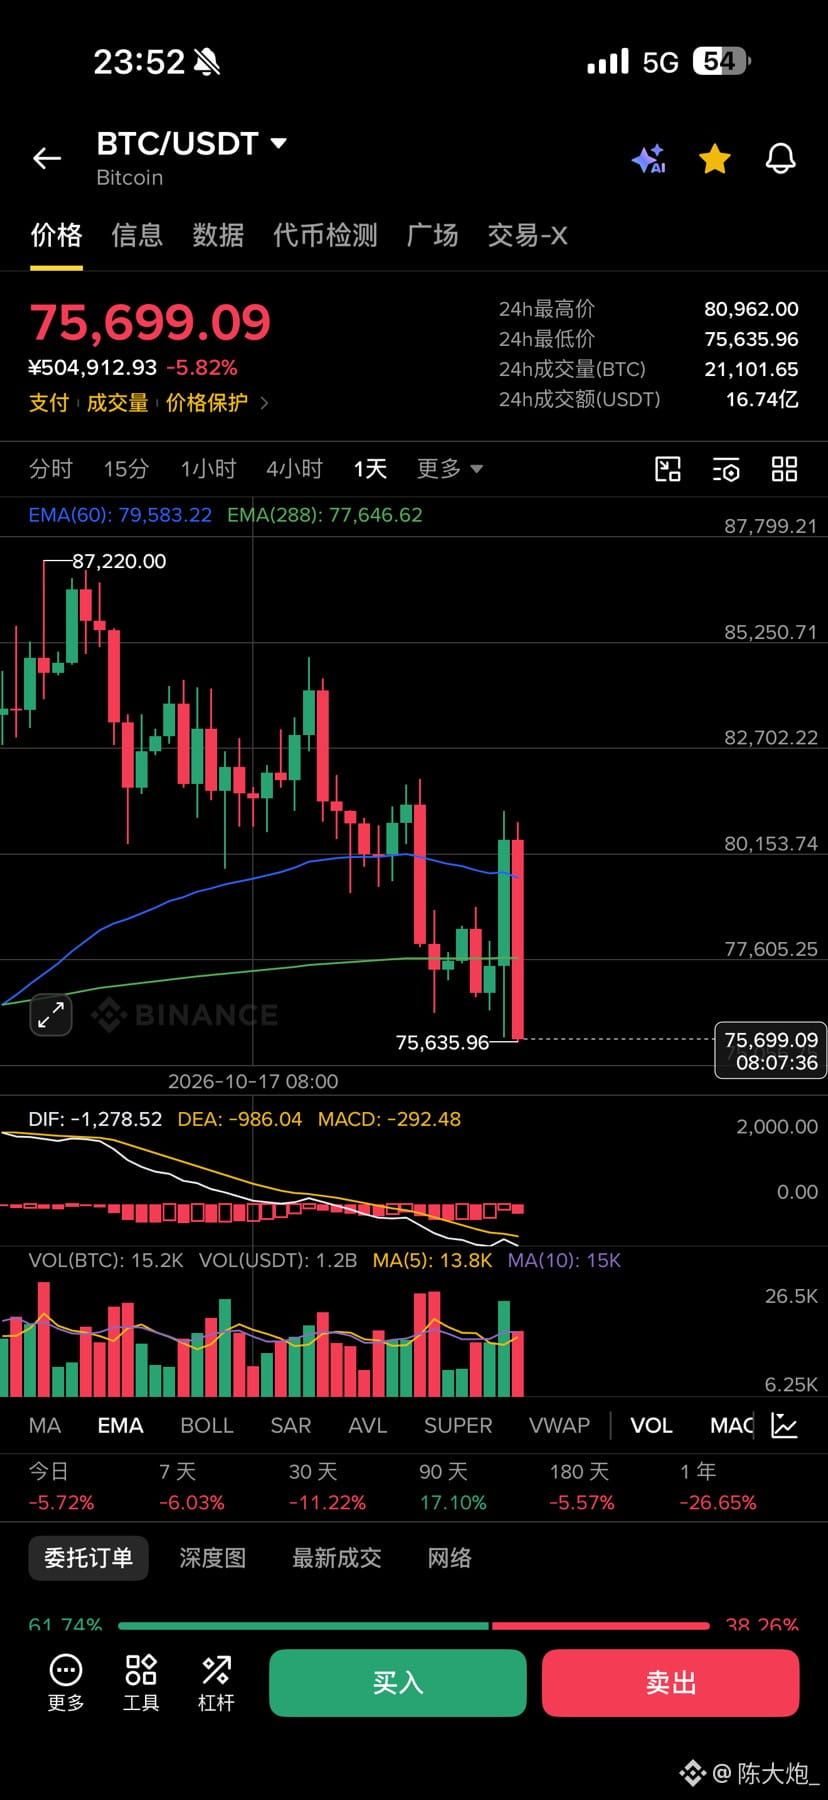
$BTC Up 5,000, down 8,000. No fun, guys. The wind on the rooftop is so strong.
$BTC Up 5,000, down 8,000. No fun, guys. The wind on the rooftop is so strong.
1
423
·
--
$SNXX
Paying respects to the U.S. stock market 🙏
$SNXX
Paying respects to the U.S. stock market 🙏
Paying respects to the U.S. stock market 🙏
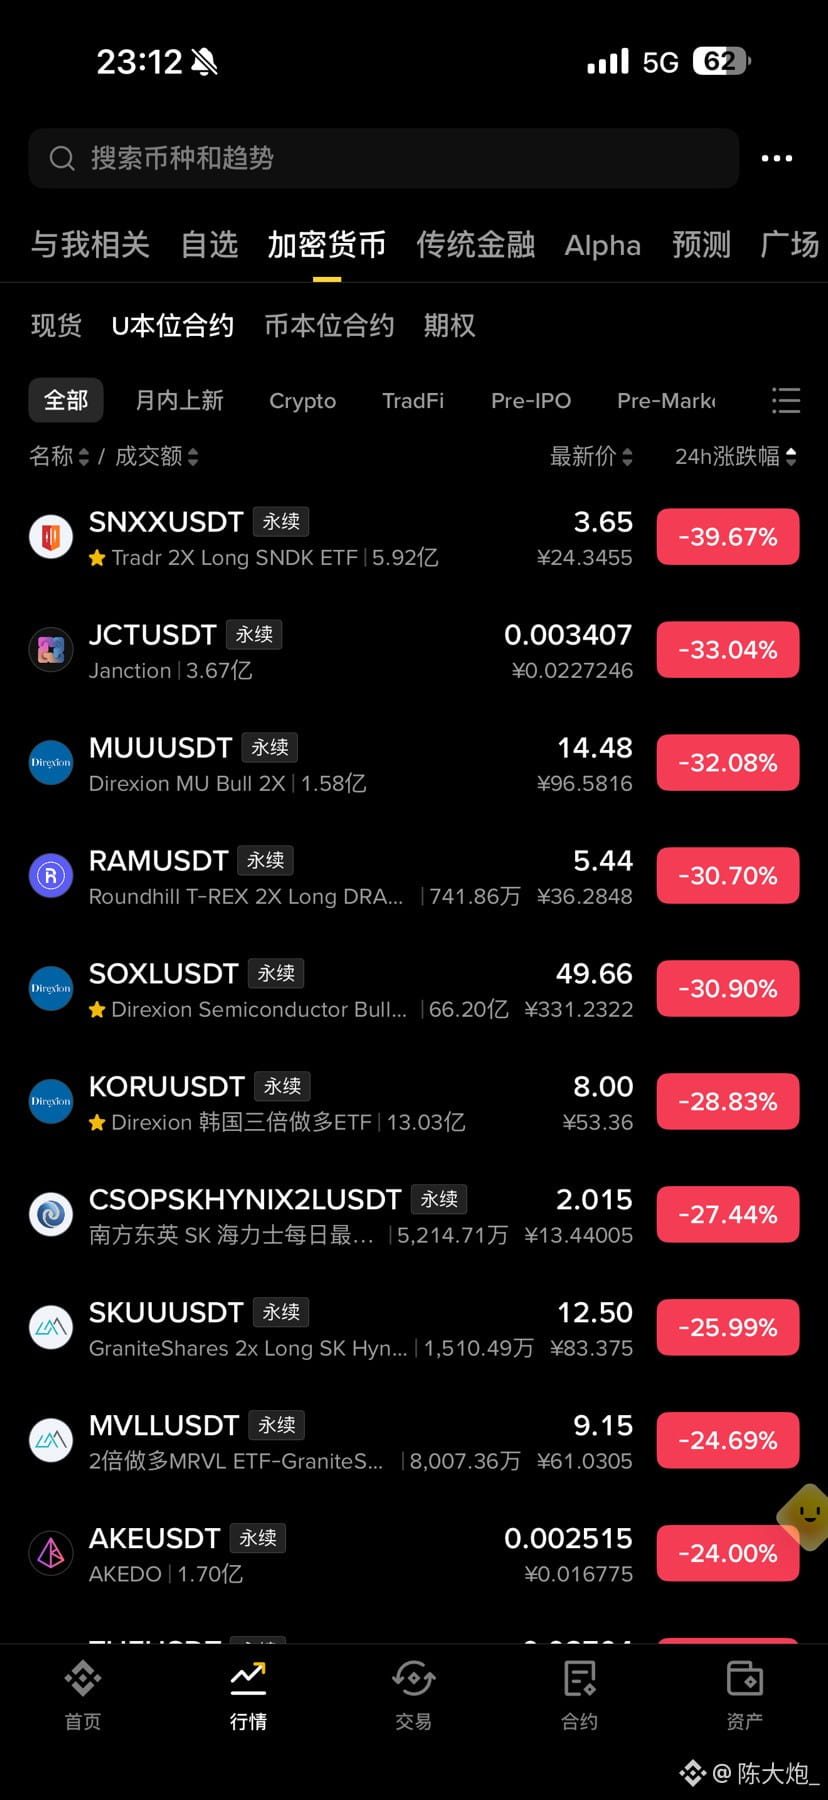
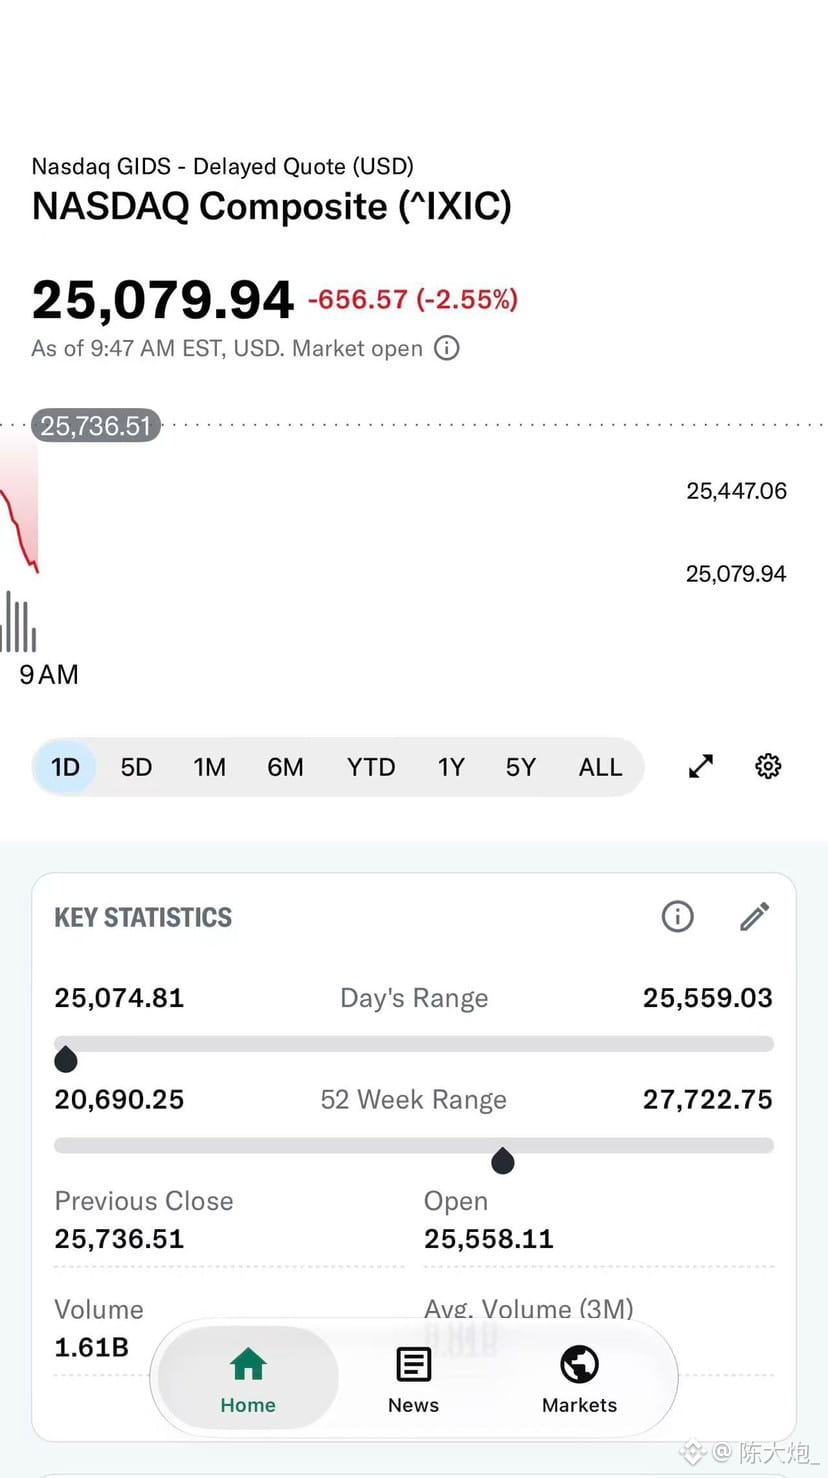
629
·
--
$BTC On the Painting Gate
Damn bookmaker, you win 🤡
$BTC On the Painting Gate
Damn bookmaker, you win 🤡
Damn bookmaker, you win 🤡
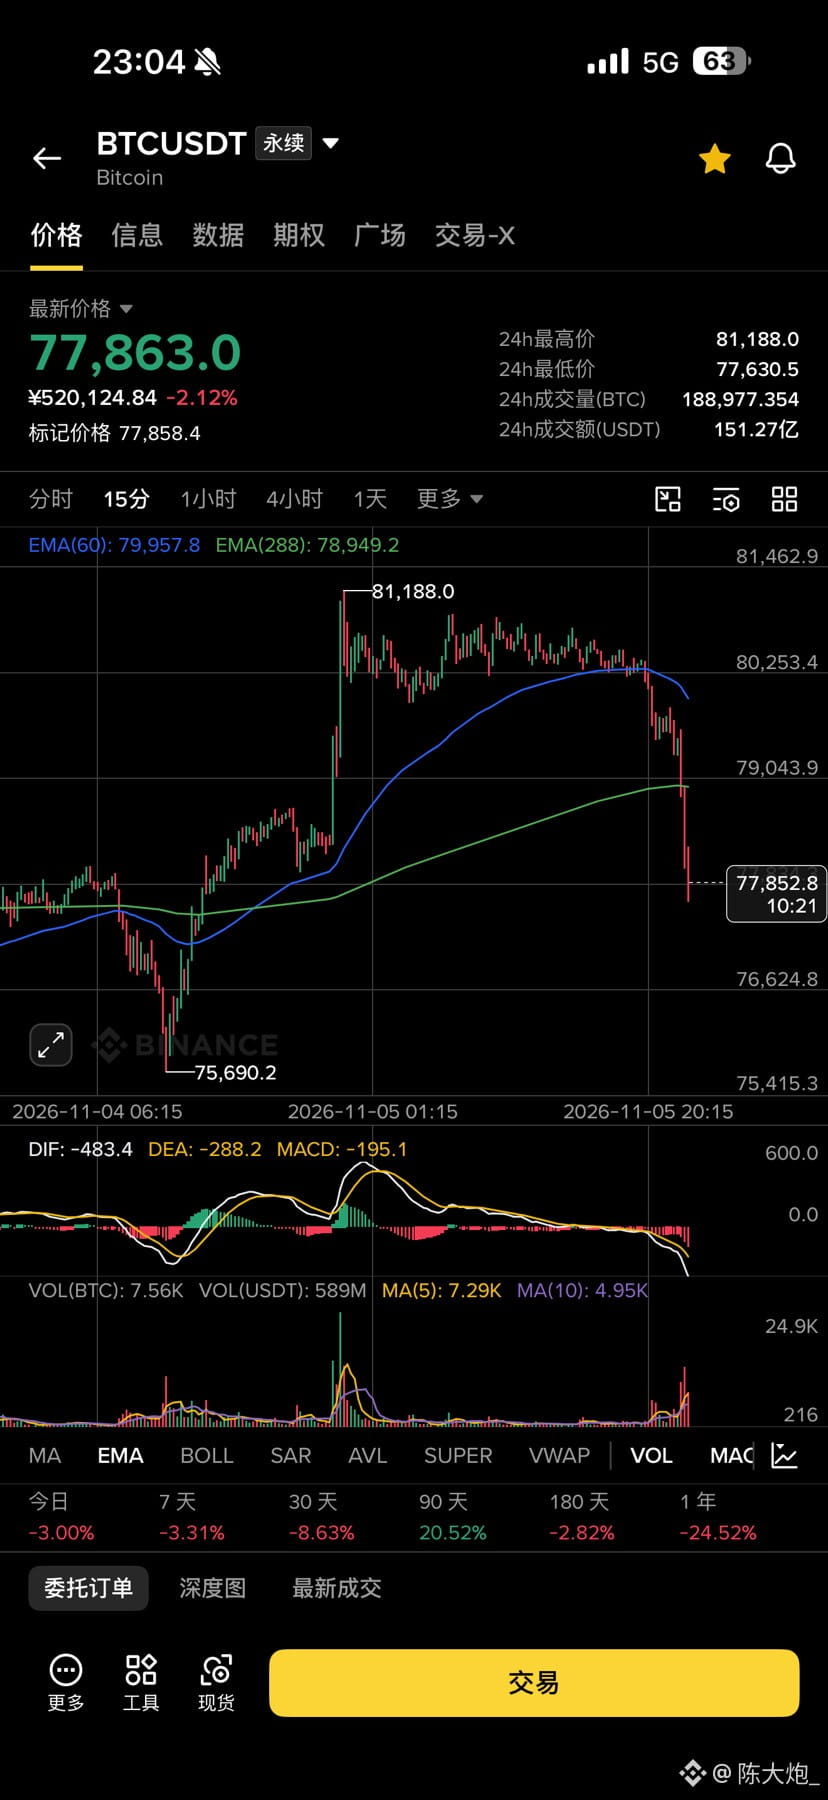
127
·
--
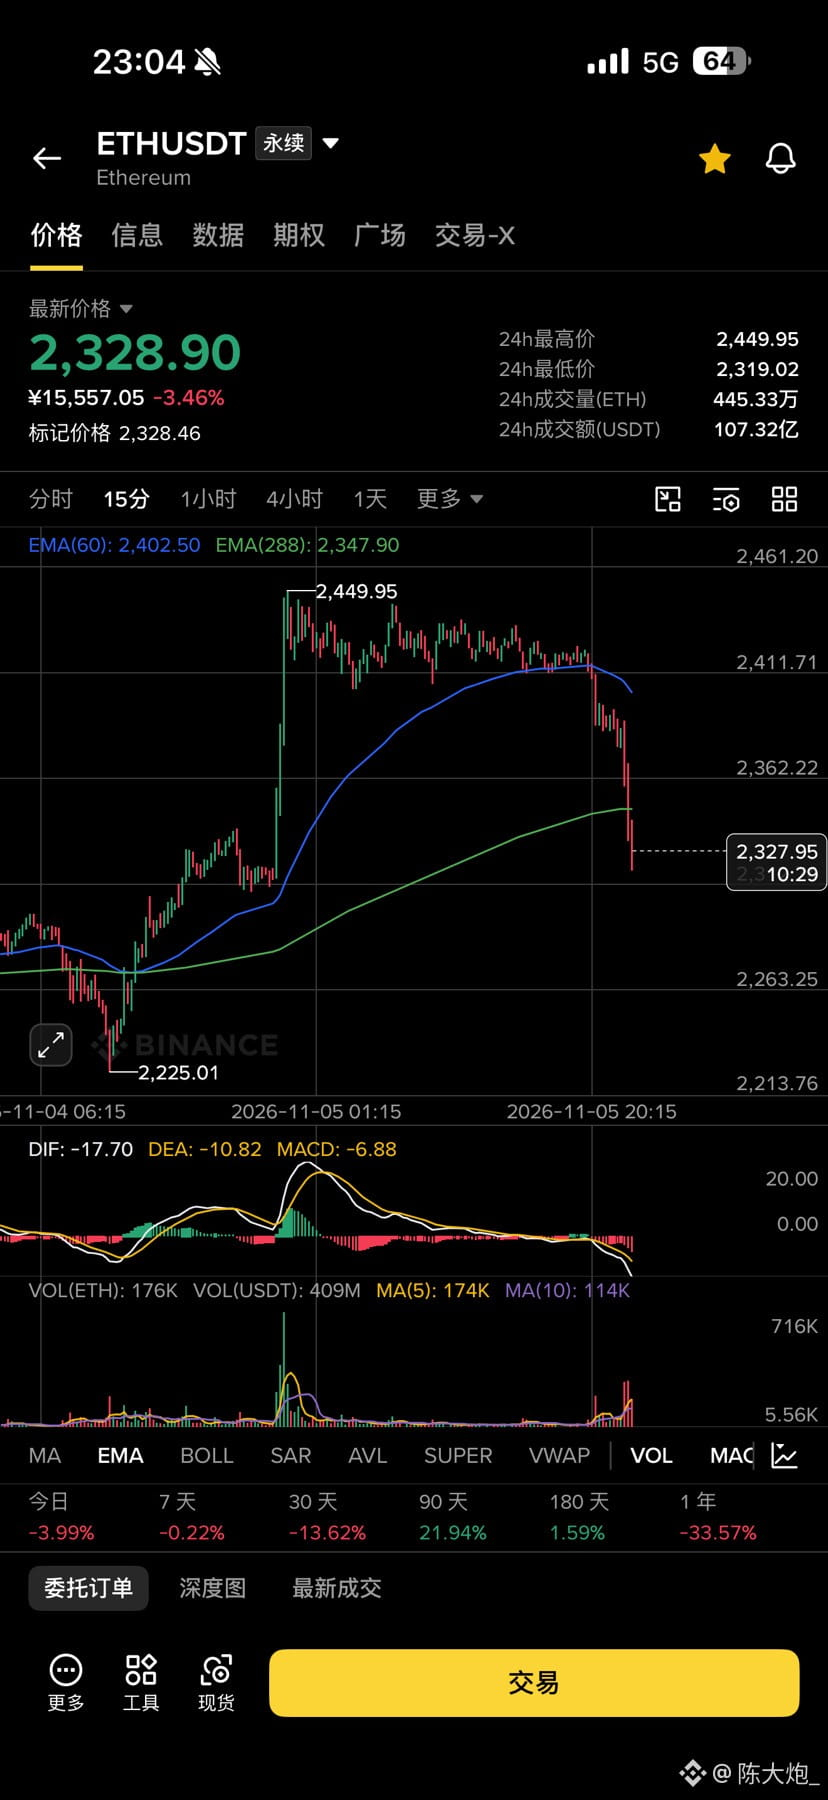
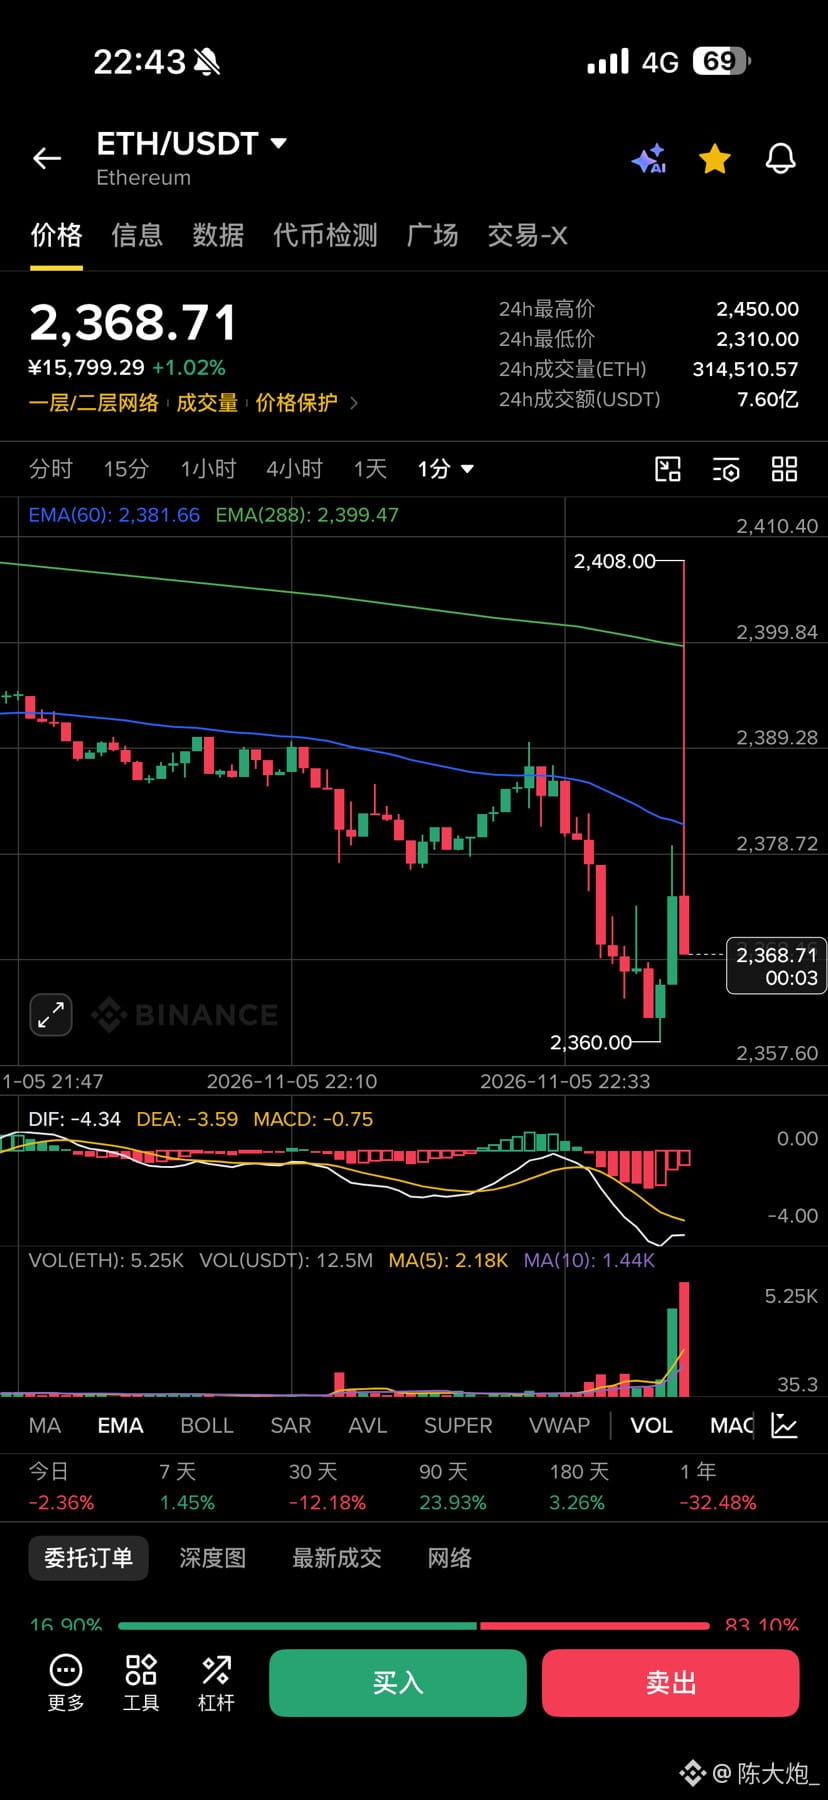
Why has $ETH been getting so many long wicks lately?
Why has $ETH been getting so many long wicks lately?
412
·
--
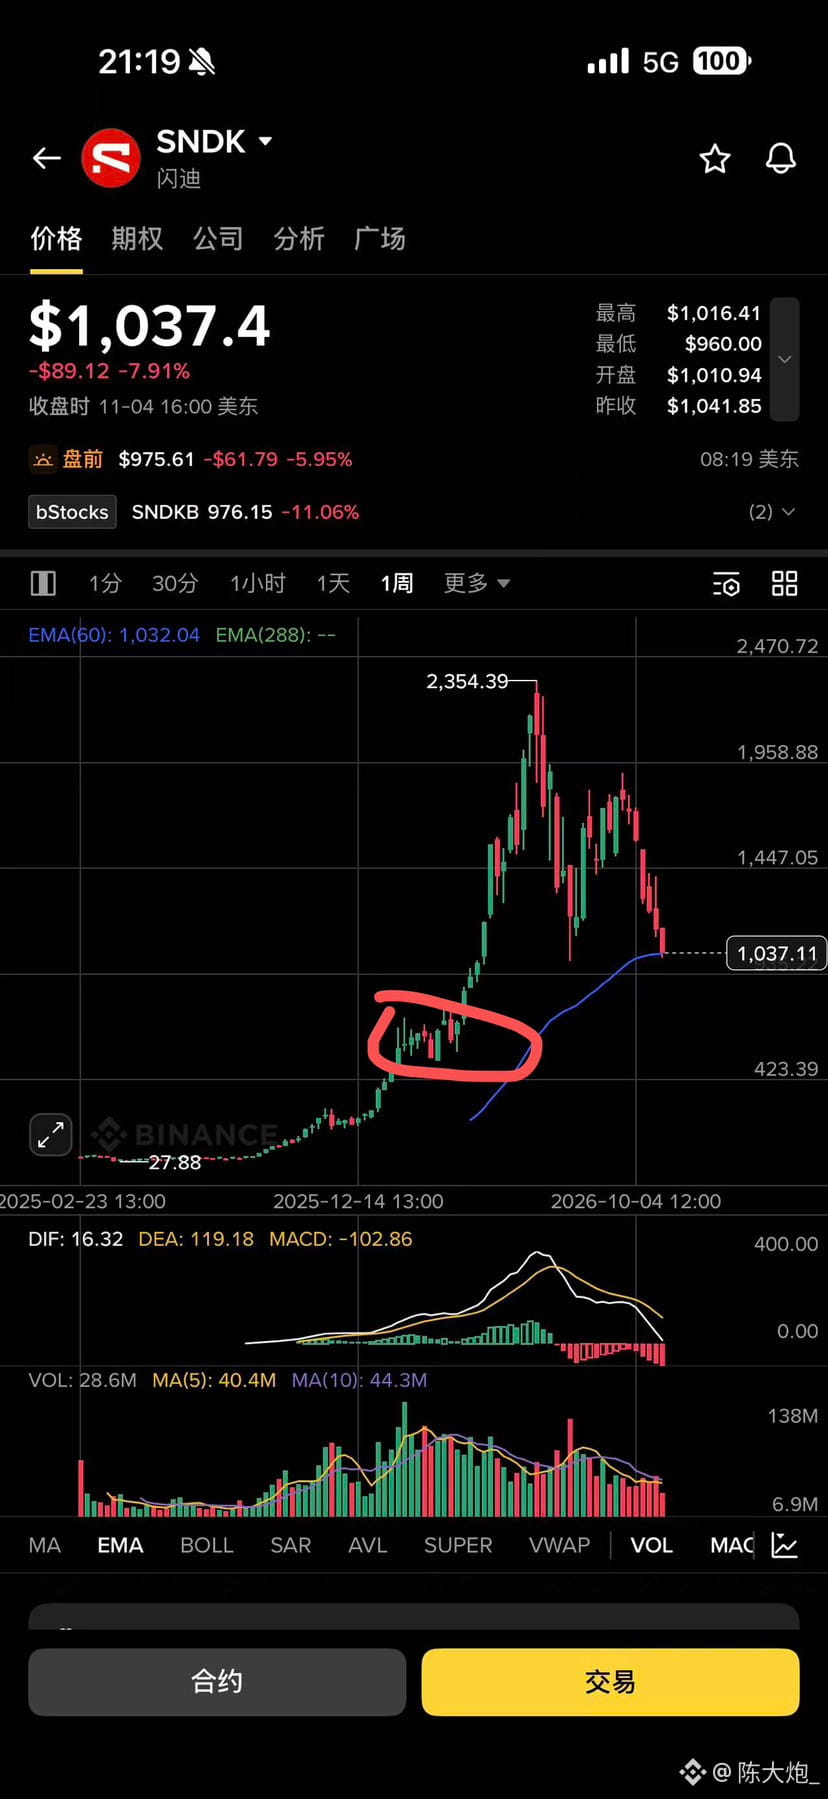
$SNDK
SanDisk, this is how you're supposed to look at it.
$SNDK
SanDisk, this is how you're supposed to look at it.
SanDisk, this is how you're supposed to look at it.
1.4k
·
--
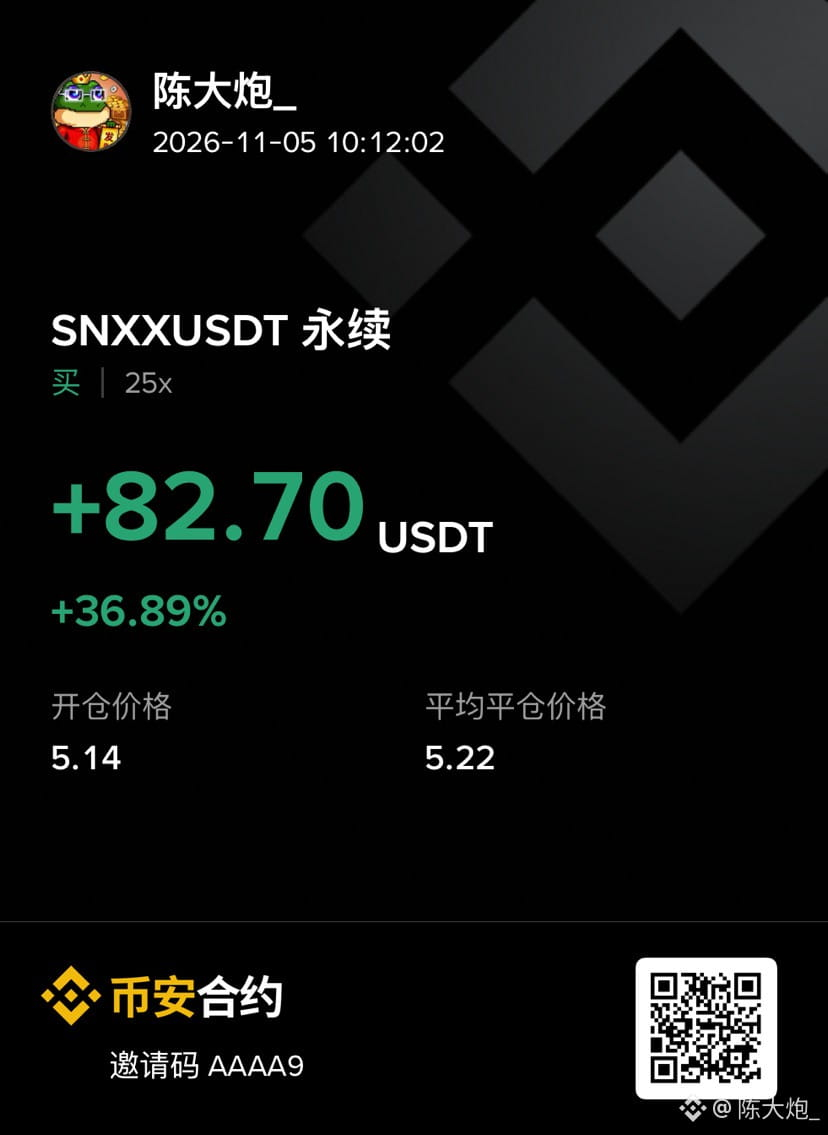
$SNXX
U.S. stocks have bounced back from -1.4% this morning
to -0.8%
I caught a short-term rebound
You can't hold positions in U.S. stocks for long lately
Here's hoping for a rebound in Q4
$SNXX
U.S. stocks have bounced back from -1.4% this morning
to -0.8%
I caught a short-term rebound
You can't hold positions in U.S. stocks for long lately
Here's hoping for a rebound in Q4
U.S. stocks have bounced back from -1.4% this morning
to -0.8%
I caught a short-term rebound
You can't hold positions in U.S. stocks for long lately
Here's hoping for a rebound in Q4
166
·
--
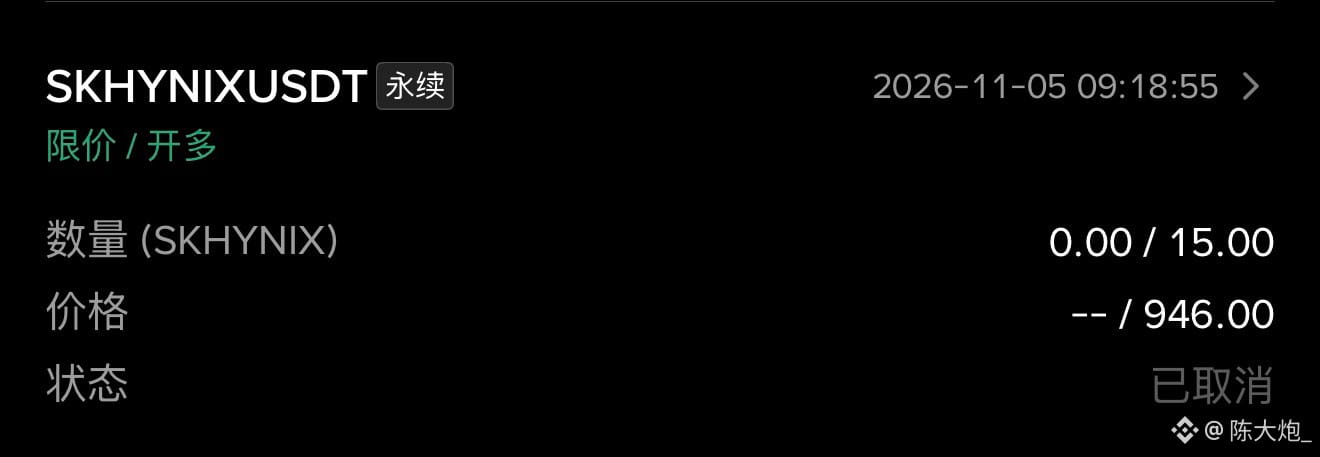
$SKHYNIX Damn, I canceled the pinpoint entry myself.
I caught a rebound of over ten points and got out.
That’s the most satisfying kind.
$SKHYNIX Damn, I canceled the pinpoint entry myself.
I caught a rebound of over ten points and got out.
That’s the most satisfying kind.
I caught a rebound of over ten points and got out.
That’s the most satisfying kind.
1.6k
·
--
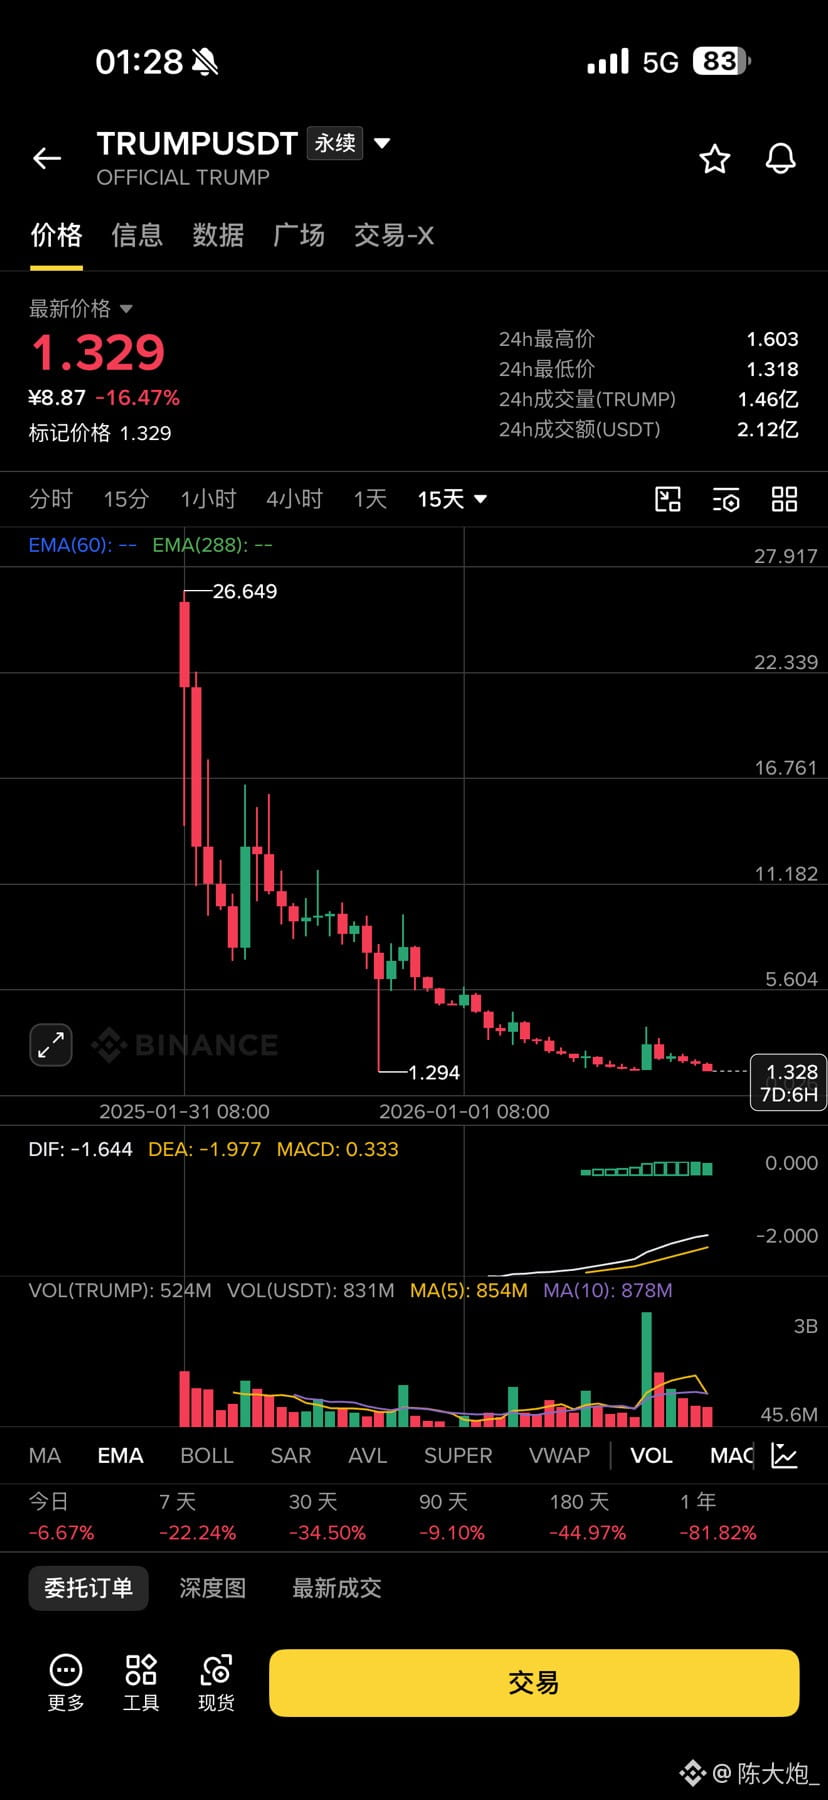
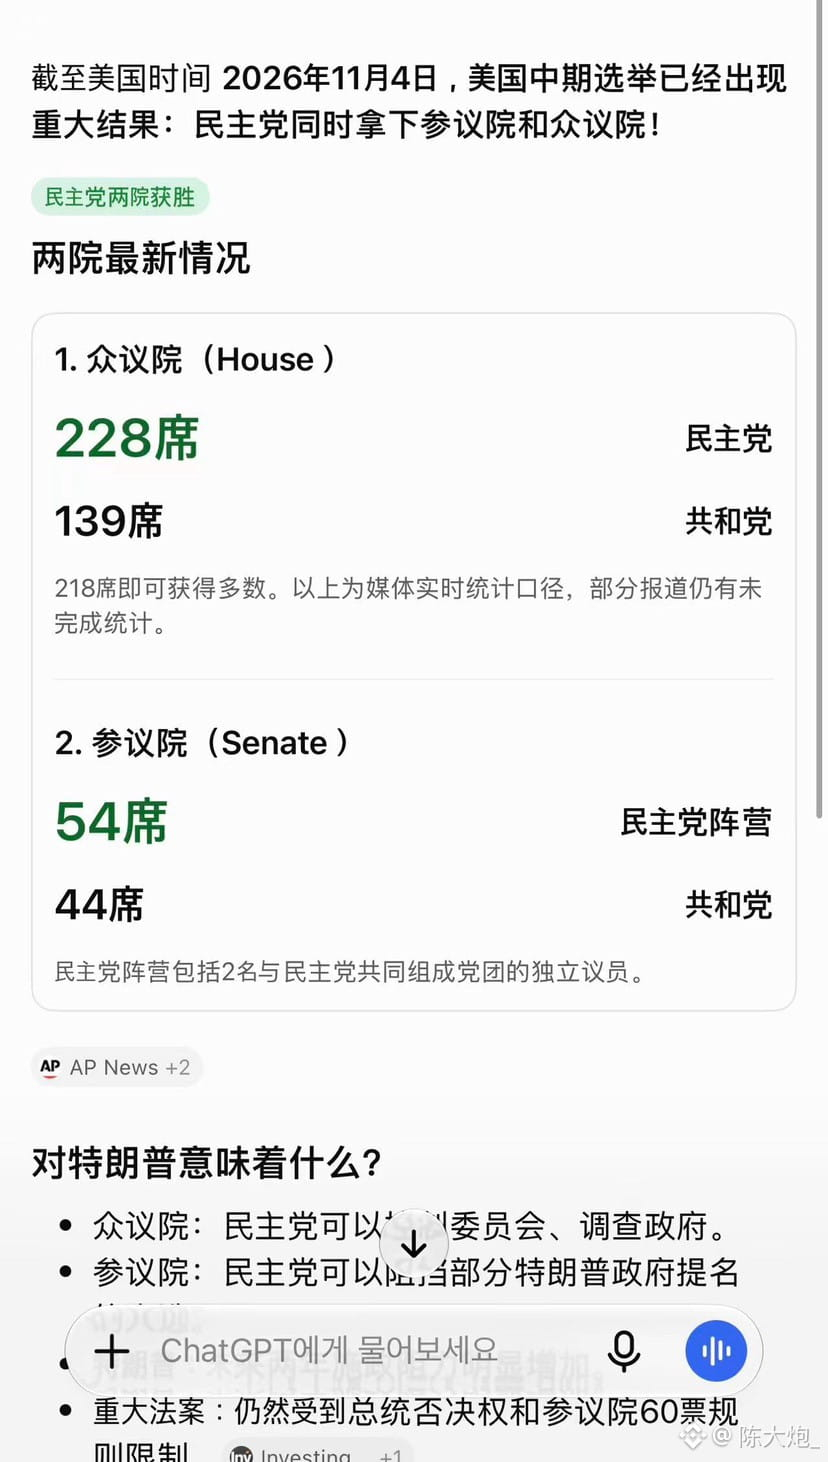
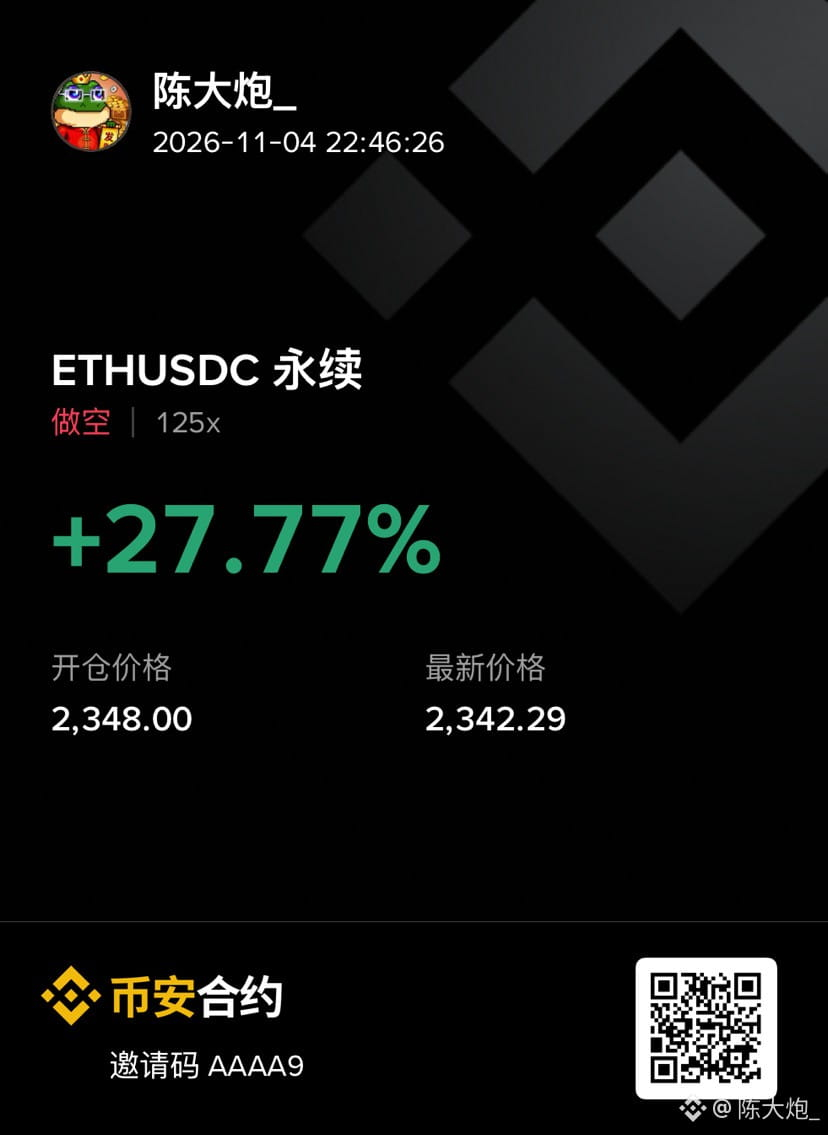
$TRUMP
Trump lost pretty decisively.
He lost, and so did the token.
$TRUMP
Trump lost pretty decisively.
He lost, and so did the token.
Trump lost pretty decisively.
He lost, and so did the token.
560
·
--
🎙️ Bitcoin rebounds after a sharp wick—don't chase the rally
End
04 h 24 m 28 s
400
0
0
·
--
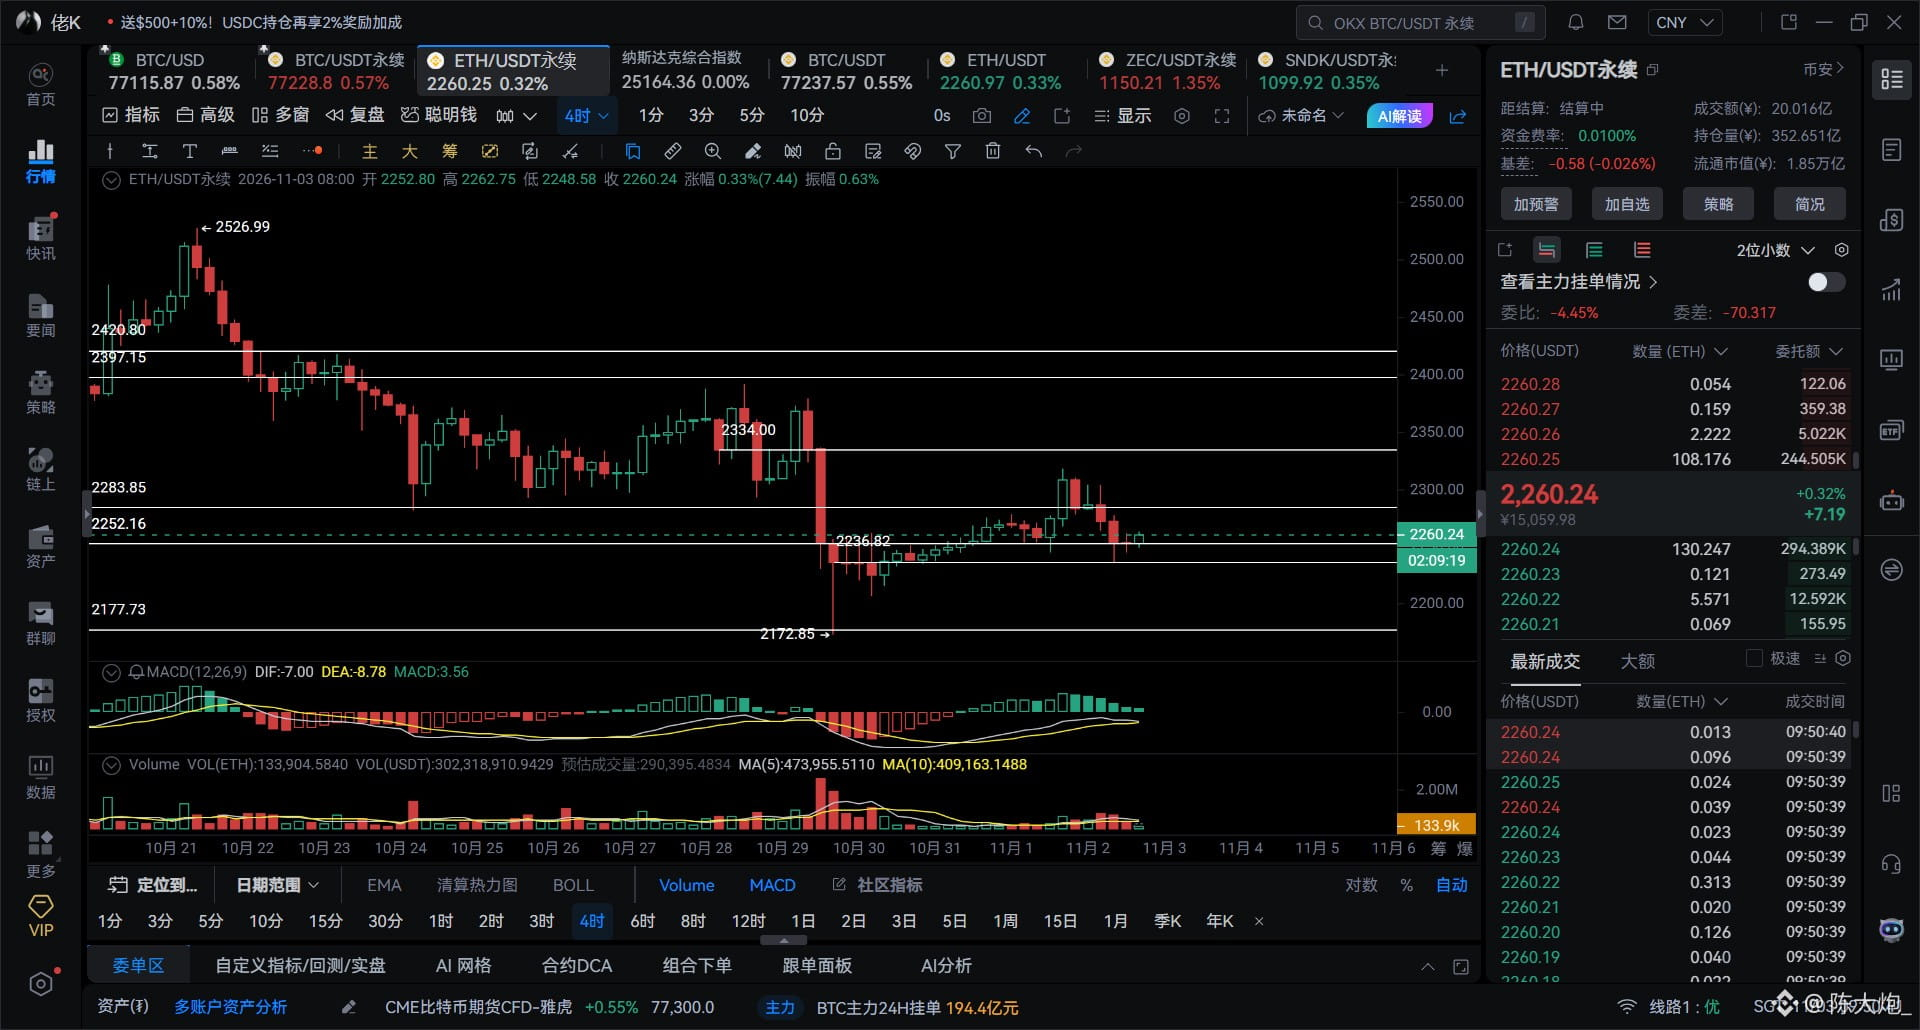
11.3 ETH Market Analysis
Ethereum looks stronger overall than Bitcoin, and going long also offers better risk-reward.
However, the market needs to hold above 2334; otherwise, it will likely continue moving sideways overall.
Death cross on the 5-day/3-day lines; the 2-day timeframe has fallen below the zero line; 12/8-hour divergence is bottoming out.
Hidden divergence on the 6/4-hour timeframes; underwater death cross on the 3-hour timeframe; underwater bottoming on the 15/30-minute timeframes.
Intraday resistance above: 2265, 2283, 2304, 2334.
Intraday support below: 2236, 2172, 2156, 2111.
11.3 ETH Market Analysis
Ethereum looks stronger overall than Bitcoin, and going long also offers better risk-reward.
However, the market needs to hold above 2334; otherwise, it will likely continue moving sideways overall.
Death cross on the 5-day/3-day lines; the 2-day timeframe has fallen below the zero line; 12/8-hour divergence is bottoming out.
Hidden divergence on the 6/4-hour timeframes; underwater death cross on the 3-hour timeframe; underwater bottoming on the 15/30-minute timeframes.
Intraday resistance above: 2265, 2283, 2304, 2334.
Intraday support below: 2236, 2172, 2156, 2111.
Ethereum looks stronger overall than Bitcoin, and going long also offers better risk-reward.
However, the market needs to hold above 2334; otherwise, it will likely continue moving sideways overall.
Death cross on the 5-day/3-day lines; the 2-day timeframe has fallen below the zero line; 12/8-hour divergence is bottoming out.
Hidden divergence on the 6/4-hour timeframes; underwater death cross on the 3-hour timeframe; underwater bottoming on the 15/30-minute timeframes.
Intraday resistance above: 2265, 2283, 2304, 2334.
Intraday support below: 2236, 2172, 2156, 2111.
329
·
--
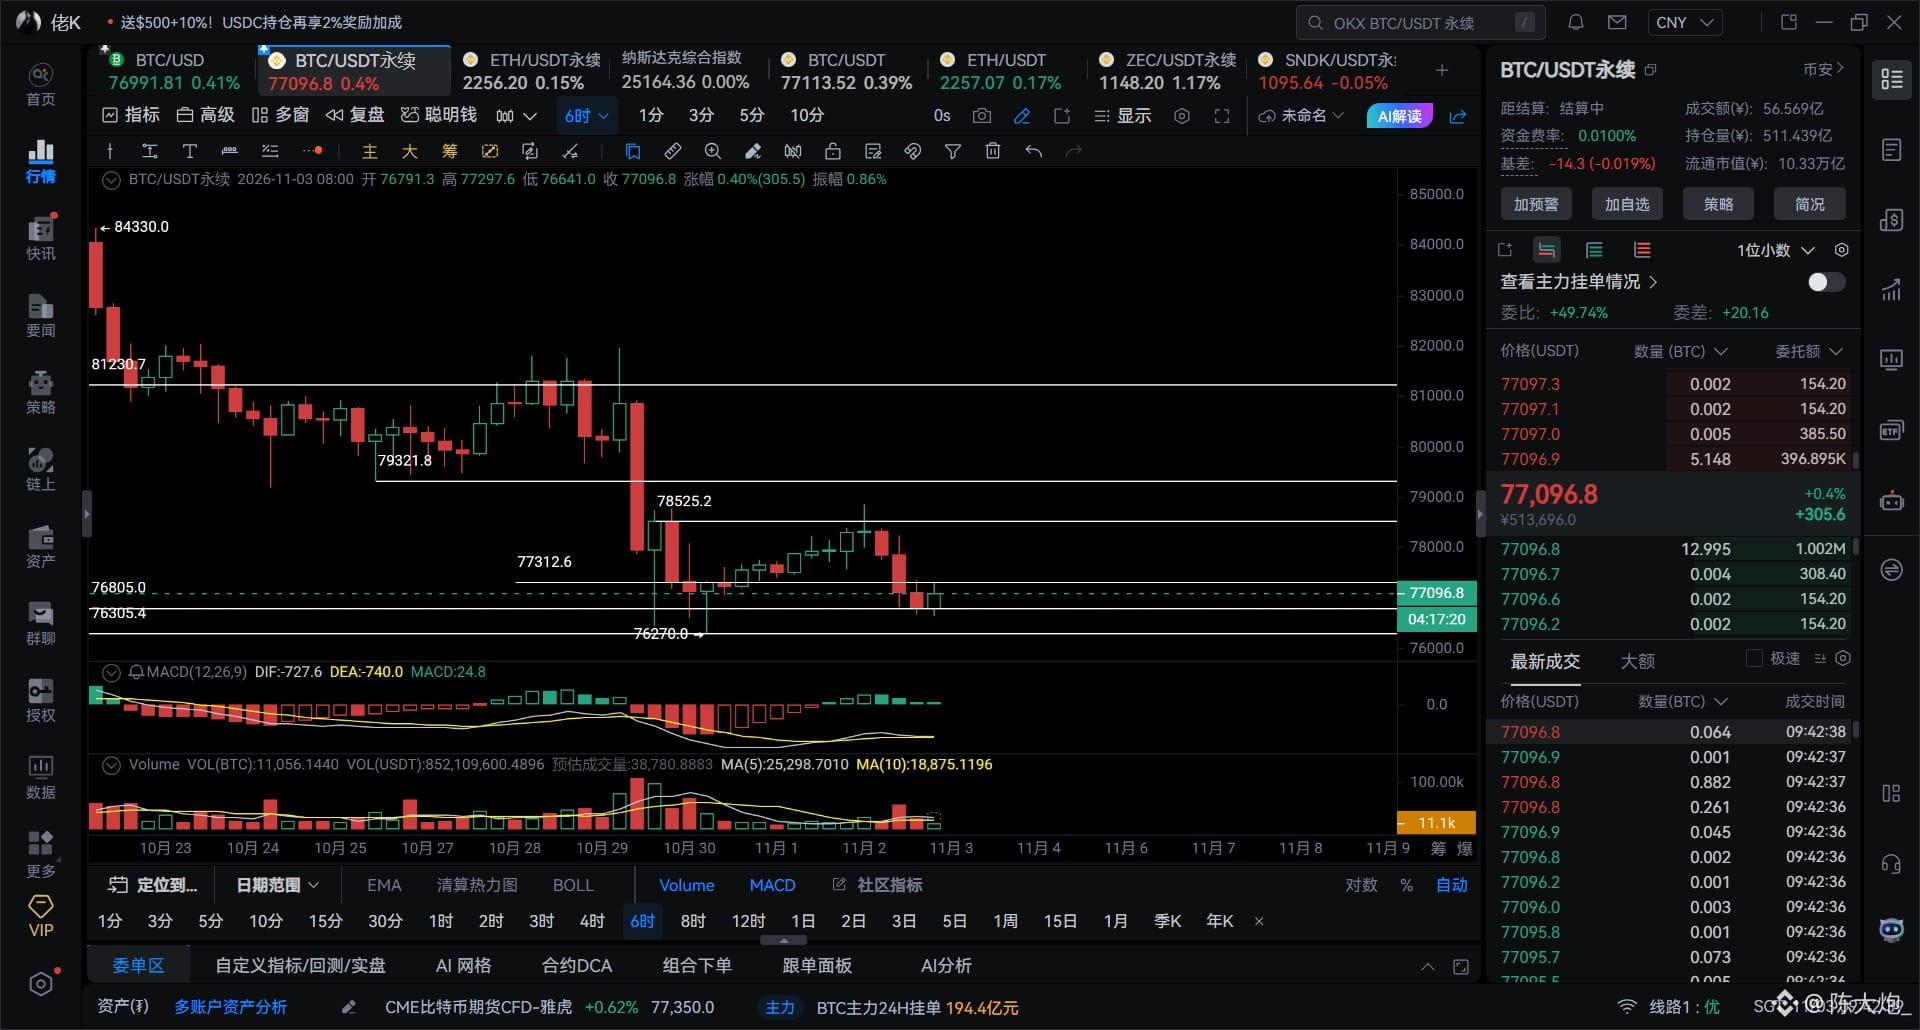
11.3 BTC Market Analysis
Bitcoin weekly hidden divergence: resistance above at 79,200. Yesterday, price touched 78,850 and began to pull back.
Price must not break below 76,270; otherwise, it will test 75,600, the zero line on the 2-day/3-day timeframes.
The 12-hour/8-hour charts are still below water and have not formed a golden cross. Hidden divergence on the 4-hour/6-hour charts; inverted on the 2-hour chart.
The 15-minute/30-minute charts are at the bottom. Don't take on too large a long position; scale in gradually.
Intraday resistance above: 77,500 78,200 79,200
Intraday support below: 76,800 76,300 75,600
11.3 BTC Market Analysis
Bitcoin weekly hidden divergence: resistance above at 79,200. Yesterday, price touched 78,850 and began to pull back.
Price must not break below 76,270; otherwise, it will test 75,600, the zero line on the 2-day/3-day timeframes.
The 12-hour/8-hour charts are still below water and have not formed a golden cross. Hidden divergence on the 4-hour/6-hour charts; inverted on the 2-hour chart.
The 15-minute/30-minute charts are at the bottom. Don't take on too large a long position; scale in gradually.
Intraday resistance above: 77,500 78,200 79,200
Intraday support below: 76,800 76,300 75,600
Bitcoin weekly hidden divergence: resistance above at 79,200. Yesterday, price touched 78,850 and began to pull back.
Price must not break below 76,270; otherwise, it will test 75,600, the zero line on the 2-day/3-day timeframes.
The 12-hour/8-hour charts are still below water and have not formed a golden cross. Hidden divergence on the 4-hour/6-hour charts; inverted on the 2-hour chart.
The 15-minute/30-minute charts are at the bottom. Don't take on too large a long position; scale in gradually.
Intraday resistance above: 77,500 78,200 79,200
Intraday support below: 76,800 76,300 75,600
480
·
--
$BTC
When U.S. midterm election results will be announced (Beijing/Singapore time, November 4):
From 7:00 a.m.: Polling stations across the Eastern time zone begin closing.
8:00 a.m.–12:00 p.m.: Initial results pour in, vote counts from key swing states are revealed, and media outlets begin projecting the overall outcome.
Over the next few days: If the race is close, it may take several days to determine the final outcome.
#美国中期选举倒计时,美股博弈窗口已开启?
$BTC
When U.S. midterm election results will be announced (Beijing/Singapore time, November 4):
From 7:00 a.m.: Polling stations across the Eastern time zone begin closing.
8:00 a.m.–12:00 p.m.: Initial results pour in, vote counts from key swing states are revealed, and media outlets begin projecting the overall outcome.
Over the next few days: If the race is close, it may take several days to determine the final outcome.
#美国中期选举倒计时,美股博弈窗口已开启?
When U.S. midterm election results will be announced (Beijing/Singapore time, November 4):
From 7:00 a.m.: Polling stations across the Eastern time zone begin closing.
8:00 a.m.–12:00 p.m.: Initial results pour in, vote counts from key swing states are revealed, and media outlets begin projecting the overall outcome.
Over the next few days: If the race is close, it may take several days to determine the final outcome.
#美国中期选举倒计时,美股博弈窗口已开启?
1
335
Log in to explore more content
Join global crypto users on Binance Square
⚡️ Get latest and useful information about crypto.
💬 Trusted by the world’s largest crypto exchange.
👍 Discover real insights from verified creators.
Email / Phone number
Trending Topics
BinanceReopensWithdrawalsForHYPE&APT
2,710 views
107 Discussing
#BinanceReopensWithdrawalsForHYPE&APT
🚨🔥 BINANCE WITHDRAWALS ARE BACK! HYPE & APT GET THE GREEN LIGHT 🟢💰
After days of uncertainty, Binance has reportedly reopened withdrawals for HYPE 🟣 and APT 🔵, giving holders a much needed reason to breathe again. 😮💨😂
The situation followed Binance’s security related restrictions that temporarily affected withdrawals for several assets. Naturally, crypto Twitter reacted like someone had unplugged the internet. 📉😱📱
But now, HYPE and APT are back in the withdrawal zone. 🚀🏦
For HYPE holders, this is especially significant. Hyperliquid has become one of the most closely watched decentralized trading ecosystems, so restored withdrawal access removes a major layer of uncertainty. 🧠⚡
APT holders also get some relief as Aptos withdrawals resume. The bigger picture, however, is more interesting. Binance appears to be taking a gradual approach to restoring affected assets rather than simply flipping every withdrawal switch at once. 🔐🛡️
That may be frustrating for traders, but from a security perspective, slow and careful is probably better than fast and reckless. Nobody wants Binance saying, “Good news, withdrawals are back!” only to discover the hackers are also celebrating. 😂💀
The lesson here is simple: exchange liquidity is convenient, but custody comes with counterparty risk. 🏦⚠️ Your coins may be yours in theory, but while they sit on an exchange, access ultimately depends on the exchange’s systems and policies.
HYPE and APT getting the green light is encouraging. 🟢🚀
Now everyone is watching the remaining assets and asking the billion dollar question:
WHO’S NEXT? 👀💰🔥
Crypto never sleeps… apparently neither does Binance’s IT department. 😂🤖
$HYPE $APT
Philboom
·0 Likes
·138 views
SouthKoreaDraftLawTargets15To20%ShareholderCap
6,447 views
109 Discussing
KeplrAdvisesSocialLoginUsersToTransferAssets
11,165 views
211 Discussing