

Halit Buğra
152 Posts

Halit Buğra
Report
Block User
A legend trader
5 Following
16.9K+ Followers
4.5K+ Liked
Posts
·
--
I’M SHARING RED PACKETS WITH EVERYONE!
Want to get your reward?
How to participate:
Follow me
Comment “YES”
Repost this post
Complete ALL the tasks to qualify.
Everyone who completes the tasks gets a reward.
Let’s go!
I’M SHARING RED PACKETS WITH EVERYONE!
Want to get your reward?
How to participate:
Follow me
Comment “YES”
Repost this post
Complete ALL the tasks to qualify.
Everyone who completes the tasks gets a reward.
Let’s go!
Want to get your reward?
How to participate:
Follow me
Comment “YES”
Repost this post
Complete ALL the tasks to qualify.
Everyone who completes the tasks gets a reward.
Let’s go!
235
2
13
235
·
--
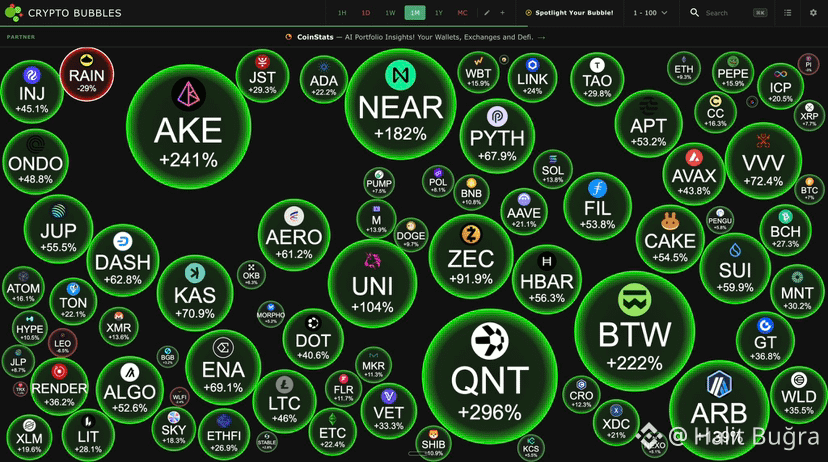
ALTCOIN SEASON IS ERUPTING EVERYWHERE.
The market is turning aggressively green, and some altcoins are posting monster monthly moves.
$QNT +296%
$AKE +241%
$BTW +222%
$NEAR +182%
$ARB +139%
$UNI +104%
$ZEC +91.9%
$VVV +72.4%
$KAS +70.9%
$ENA +69.1%
$PYTH +67.9%
And the strength isn’t isolated. $SUI, $JUP, $AERO, $HBAR, $FIL, $CAKE, $AVAX, $ONDO, $LINK, $ICP and dozens more are flashing green.
I’ve got $100,000 ready to deploy.
But after moves this explosive, I’m not blindly chasing green candles. I’m looking for strong narratives, real liquidity, clean setups and altcoins that still have room to run.
If you had $100K sitting on the sidelines right now, what are the top 3 altcoins you’d be buying?
Drop the tickers. I’m building the watchlist.
ALTCOIN SEASON IS ERUPTING EVERYWHERE.
The market is turning aggressively green, and some altcoins are posting monster monthly moves.
$QNT +296%
$AKE +241%
$BTW +222%
$NEAR +182%
$ARB +139%
$UNI +104%
$ZEC +91.9%
$VVV +72.4%
$KAS +70.9%
$ENA +69.1%
$PYTH +67.9%
And the strength isn’t isolated. $SUI, $JUP, $AERO, $HBAR, $FIL, $CAKE, $AVAX, $ONDO, $LINK, $ICP and dozens more are flashing green.
I’ve got $100,000 ready to deploy.
But after moves this explosive, I’m not blindly chasing green candles. I’m looking for strong narratives, real liquidity, clean setups and altcoins that still have room to run.
If you had $100K sitting on the sidelines right now, what are the top 3 altcoins you’d be buying?
Drop the tickers. I’m building the watchlist.
The market is turning aggressively green, and some altcoins are posting monster monthly moves.
$QNT +296%
$AKE +241%
$BTW +222%
$NEAR +182%
$ARB +139%
$UNI +104%
$ZEC +91.9%
$VVV +72.4%
$KAS +70.9%
$ENA +69.1%
$PYTH +67.9%
And the strength isn’t isolated. $SUI, $JUP, $AERO, $HBAR, $FIL, $CAKE, $AVAX, $ONDO, $LINK, $ICP and dozens more are flashing green.
I’ve got $100,000 ready to deploy.
But after moves this explosive, I’m not blindly chasing green candles. I’m looking for strong narratives, real liquidity, clean setups and altcoins that still have room to run.
If you had $100K sitting on the sidelines right now, what are the top 3 altcoins you’d be buying?
Drop the tickers. I’m building the watchlist.
1
1.4k
·
--
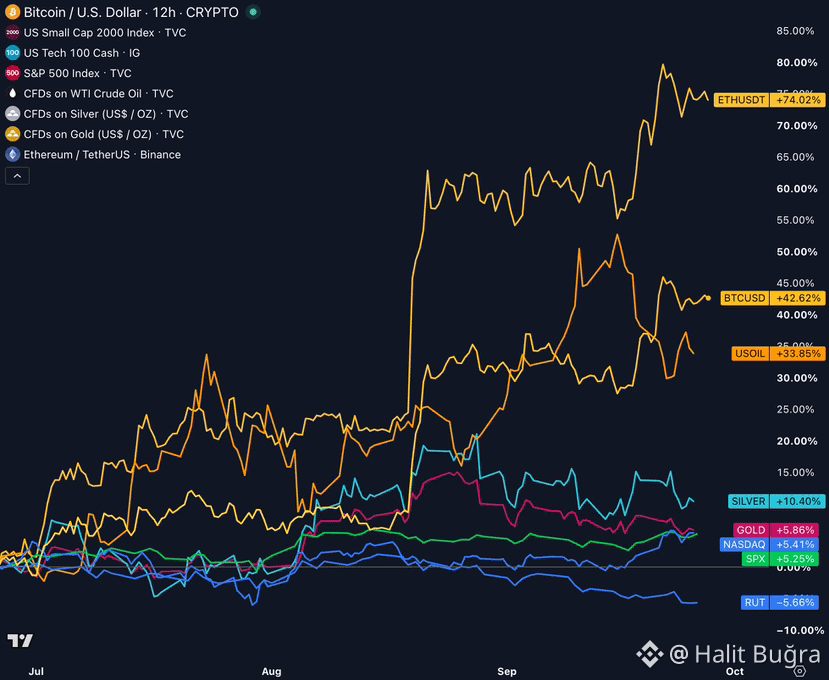
CRYPTO IS CRUSHING EVERY OTHER MAJOR ASSET SINCE JUNE.
Ethereum leads the charge with an explosive +74%, while Bitcoin has delivered a massive +42.6% move.
Oil is up +33.8%, but traditional safe havens are far behind — Silver +10.4% and Gold +5.9%.
Even equities haven’t come close. Nasdaq sits at +5.4%, the S&P 500 at +5.3%, while Small Caps are actually down -5.7%.
The performance gap is huge.
Capital has been rewarding crypto aggressively, with ETH and BTC separating themselves from nearly every major asset on this chart.
If this relative strength continues, the next phase of the crypto market could get very interesting.
CRYPTO IS CRUSHING EVERY OTHER MAJOR ASSET SINCE JUNE.
Ethereum leads the charge with an explosive +74%, while Bitcoin has delivered a massive +42.6% move.
Oil is up +33.8%, but traditional safe havens are far behind — Silver +10.4% and Gold +5.9%.
Even equities haven’t come close. Nasdaq sits at +5.4%, the S&P 500 at +5.3%, while Small Caps are actually down -5.7%.
The performance gap is huge.
Capital has been rewarding crypto aggressively, with ETH and BTC separating themselves from nearly every major asset on this chart.
If this relative strength continues, the next phase of the crypto market could get very interesting.
Ethereum leads the charge with an explosive +74%, while Bitcoin has delivered a massive +42.6% move.
Oil is up +33.8%, but traditional safe havens are far behind — Silver +10.4% and Gold +5.9%.
Even equities haven’t come close. Nasdaq sits at +5.4%, the S&P 500 at +5.3%, while Small Caps are actually down -5.7%.
The performance gap is huge.
Capital has been rewarding crypto aggressively, with ETH and BTC separating themselves from nearly every major asset on this chart.
If this relative strength continues, the next phase of the crypto market could get very interesting.
8
10
1.5k
·
--
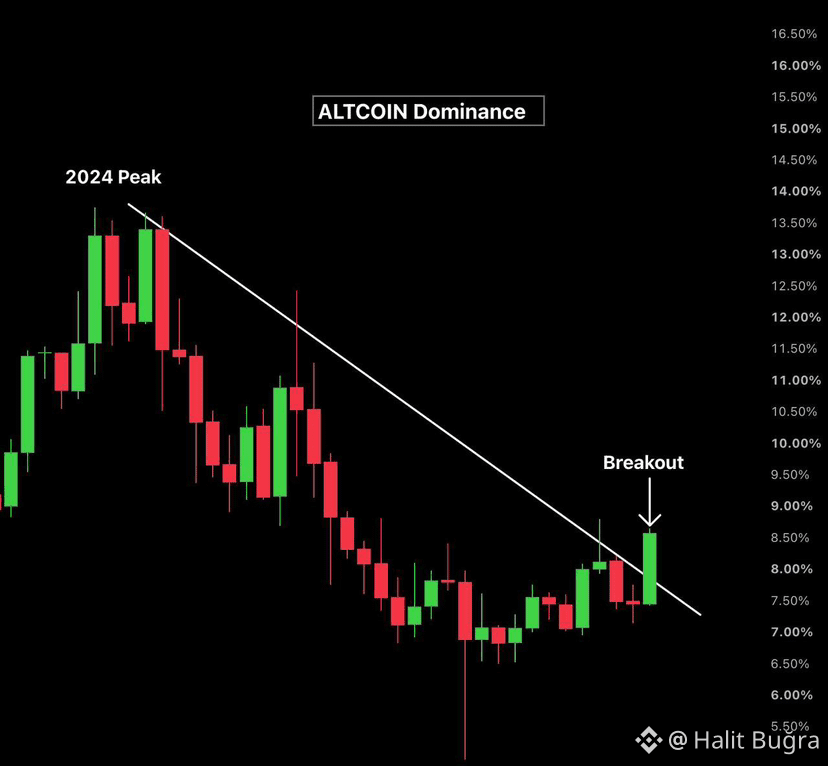
ALTCOIN DOMINANCE HAS OFFICIALLY BROKEN A NEARLY 2-YEAR DOWNTREND.
The chart makes the shift clear.
After peaking around 13.5% in 2024, altcoin dominance spent almost two years forming lower highs and repeatedly getting rejected by the same descending trendline.
That structure has now been broken.
Dominance has pushed to roughly 8.5%, moving decisively above the long-term resistance that controlled the entire decline.
This doesn’t automatically confirm a full altcoin season, but it is an important structural change.
The next test is whether dominance can stay above the broken trendline. Holding the breakout and forming a higher low would make the move much stronger, while falling back below could turn this into another failed breakout.
If altcoin dominance keeps expanding from here, it would signal that altcoins are capturing an increasing share of the crypto market.
The 2-year compression is finally breaking.
Now we find out whether this is just a breakout — or the beginning of the next major altcoin rotation.
ALTCOIN DOMINANCE HAS OFFICIALLY BROKEN A NEARLY 2-YEAR DOWNTREND.
The chart makes the shift clear.
After peaking around 13.5% in 2024, altcoin dominance spent almost two years forming lower highs and repeatedly getting rejected by the same descending trendline.
That structure has now been broken.
Dominance has pushed to roughly 8.5%, moving decisively above the long-term resistance that controlled the entire decline.
This doesn’t automatically confirm a full altcoin season, but it is an important structural change.
The next test is whether dominance can stay above the broken trendline. Holding the breakout and forming a higher low would make the move much stronger, while falling back below could turn this into another failed breakout.
If altcoin dominance keeps expanding from here, it would signal that altcoins are capturing an increasing share of the crypto market.
The 2-year compression is finally breaking.
Now we find out whether this is just a breakout — or the beginning of the next major altcoin rotation.
The chart makes the shift clear.
After peaking around 13.5% in 2024, altcoin dominance spent almost two years forming lower highs and repeatedly getting rejected by the same descending trendline.
That structure has now been broken.
Dominance has pushed to roughly 8.5%, moving decisively above the long-term resistance that controlled the entire decline.
This doesn’t automatically confirm a full altcoin season, but it is an important structural change.
The next test is whether dominance can stay above the broken trendline. Holding the breakout and forming a higher low would make the move much stronger, while falling back below could turn this into another failed breakout.
If altcoin dominance keeps expanding from here, it would signal that altcoins are capturing an increasing share of the crypto market.
The 2-year compression is finally breaking.
Now we find out whether this is just a breakout — or the beginning of the next major altcoin rotation.
8
9
209
·
--
𝗧𝗛𝗜𝗦 𝗜𝗦 𝗔𝗕𝗦𝗢𝗟𝗨𝗧𝗘𝗟𝗬 𝗜𝗡𝗦𝗔𝗡𝗘.
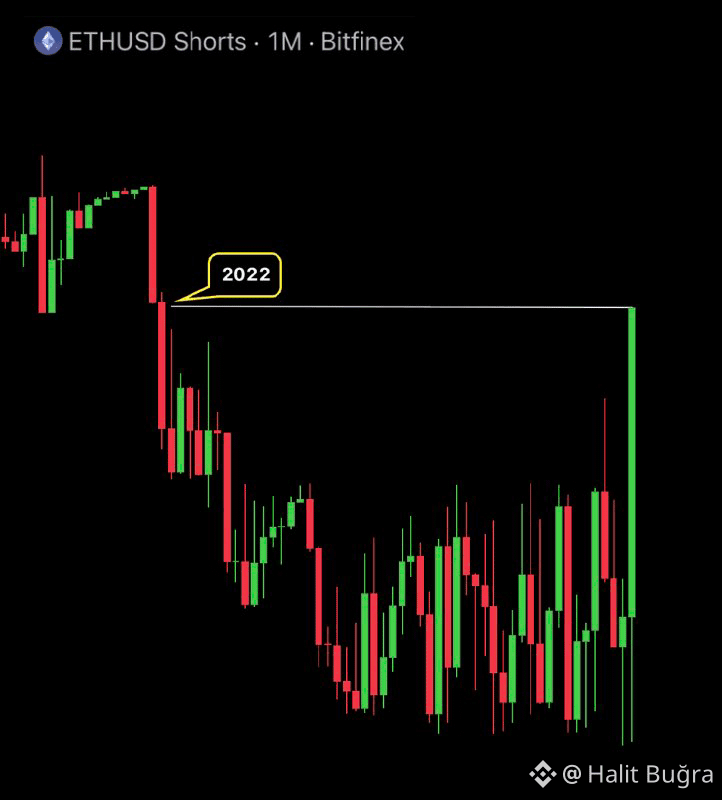
Huge $ETH short positions are piling up on Bitfinex.
ETH shorts have reportedly surged around 8,300% in just 2 weeks, reaching their highest level since June 2022.
That means a growing number of traders are positioning aggressively for Ethereum to move lower.
But here’s where things get interesting:
When short positioning becomes this crowded, it can create serious fuel for a short squeeze.
If $ETH starts pushing higher, shorts may be forced to buy ETH to close their positions. That buying can push the price even higher, potentially triggering more liquidations and creating a chain reaction.
So the market could be approaching a major inflection point:
Either these traders are positioned ahead of a significant downside move…
Or one violent move upward could catch an enormous amount of bearish positioning off guard.
The $ETH setup just got VERY interesting. 👀
𝗧𝗛𝗜𝗦 𝗜𝗦 𝗔𝗕𝗦𝗢𝗟𝗨𝗧𝗘𝗟𝗬 𝗜𝗡𝗦𝗔𝗡𝗘.
Huge $ETH short positions are piling up on Bitfinex.
ETH shorts have reportedly surged around 8,300% in just 2 weeks, reaching their highest level since June 2022.
That means a growing number of traders are positioning aggressively for Ethereum to move lower.
But here’s where things get interesting:
When short positioning becomes this crowded, it can create serious fuel for a short squeeze.
If $ETH starts pushing higher, shorts may be forced to buy ETH to close their positions. That buying can push the price even higher, potentially triggering more liquidations and creating a chain reaction.
So the market could be approaching a major inflection point:
Either these traders are positioned ahead of a significant downside move…
Or one violent move upward could catch an enormous amount of bearish positioning off guard.
The $ETH setup just got VERY interesting. 👀
Huge $ETH short positions are piling up on Bitfinex.
ETH shorts have reportedly surged around 8,300% in just 2 weeks, reaching their highest level since June 2022.
That means a growing number of traders are positioning aggressively for Ethereum to move lower.
But here’s where things get interesting:
When short positioning becomes this crowded, it can create serious fuel for a short squeeze.
If $ETH starts pushing higher, shorts may be forced to buy ETH to close their positions. That buying can push the price even higher, potentially triggering more liquidations and creating a chain reaction.
So the market could be approaching a major inflection point:
Either these traders are positioned ahead of a significant downside move…
Or one violent move upward could catch an enormous amount of bearish positioning off guard.
The $ETH setup just got VERY interesting. 👀
8
11
397
·
--
ALTCOINS ARE STARTING TO TAKE CONTROL.
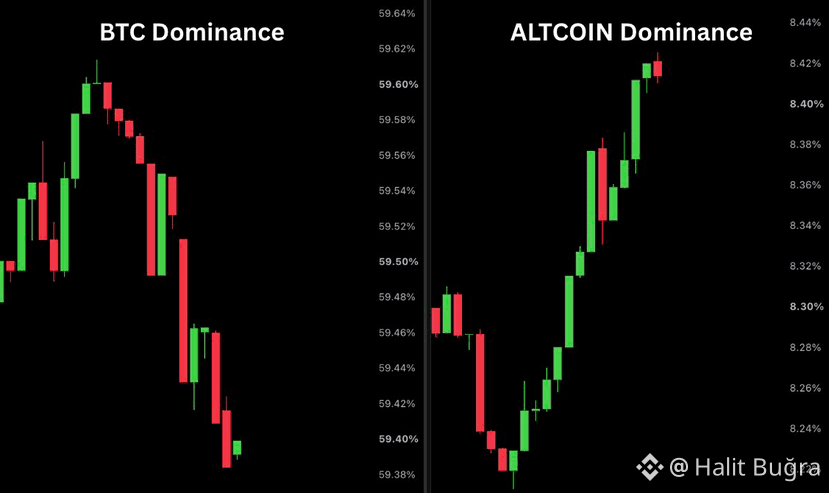
BTC Dominance is dropping sharply, falling from around 59.60% toward the 59.40% zone.
At the same time, Altcoin Dominance is moving in the opposite direction, climbing from roughly 8.22% toward 8.42%.
This divergence matters.
Capital appears to be rotating away from Bitcoin dominance and toward the broader altcoin market.
If BTC Dominance continues losing ground while Altcoin Dominance holds its upward momentum, altcoins could see stronger relative performance across the market.
The key is continuation.
BTC Dominance DOWN.
Altcoin Dominance UP.
If this trend keeps building, the next phase of the market could become much more interesting for altcoins.
ALTCOINS ARE STARTING TO TAKE CONTROL.
BTC Dominance is dropping sharply, falling from around 59.60% toward the 59.40% zone.
At the same time, Altcoin Dominance is moving in the opposite direction, climbing from roughly 8.22% toward 8.42%.
This divergence matters.
Capital appears to be rotating away from Bitcoin dominance and toward the broader altcoin market.
If BTC Dominance continues losing ground while Altcoin Dominance holds its upward momentum, altcoins could see stronger relative performance across the market.
The key is continuation.
BTC Dominance DOWN.
Altcoin Dominance UP.
If this trend keeps building, the next phase of the market could become much more interesting for altcoins.
BTC Dominance is dropping sharply, falling from around 59.60% toward the 59.40% zone.
At the same time, Altcoin Dominance is moving in the opposite direction, climbing from roughly 8.22% toward 8.42%.
This divergence matters.
Capital appears to be rotating away from Bitcoin dominance and toward the broader altcoin market.
If BTC Dominance continues losing ground while Altcoin Dominance holds its upward momentum, altcoins could see stronger relative performance across the market.
The key is continuation.
BTC Dominance DOWN.
Altcoin Dominance UP.
If this trend keeps building, the next phase of the market could become much more interesting for altcoins.
7
10
399
·
--
MARKETS JUST TOOK A MASSIVE HIT.
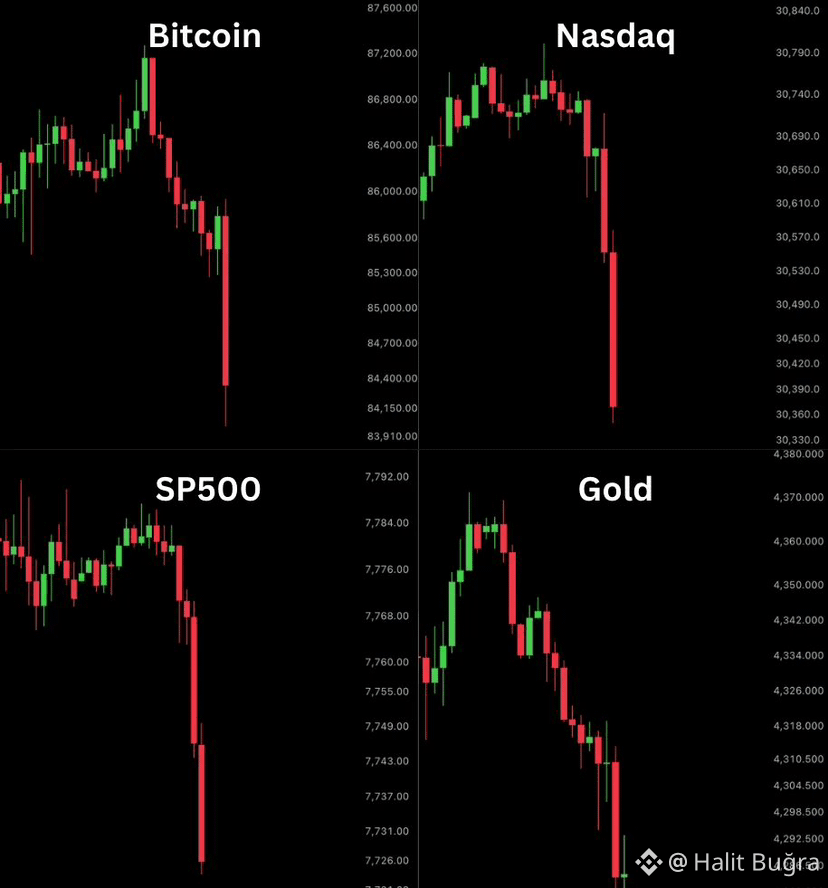
Around $900 billion was reportedly erased across stocks, crypto, and precious metals after the US market opened.
The sell-off accelerated as fresh tension around Iran shook investor confidence, with Iran saying it would not surrender.
Stocks started sliding, crypto followed, and precious metals also came under pressure as traders moved quickly to reduce risk.
This is what happens when geopolitical uncertainty hits an already nervous market. Positions get cut, leverage gets flushed, and volatility spreads across almost every major asset class.
For now, all eyes are on what comes next between the US and Iran.
One new headline could completely shift market sentiment again.
MARKETS JUST TOOK A MASSIVE HIT.
Around $900 billion was reportedly erased across stocks, crypto, and precious metals after the US market opened.
The sell-off accelerated as fresh tension around Iran shook investor confidence, with Iran saying it would not surrender.
Stocks started sliding, crypto followed, and precious metals also came under pressure as traders moved quickly to reduce risk.
This is what happens when geopolitical uncertainty hits an already nervous market. Positions get cut, leverage gets flushed, and volatility spreads across almost every major asset class.
For now, all eyes are on what comes next between the US and Iran.
One new headline could completely shift market sentiment again.
Around $900 billion was reportedly erased across stocks, crypto, and precious metals after the US market opened.
The sell-off accelerated as fresh tension around Iran shook investor confidence, with Iran saying it would not surrender.
Stocks started sliding, crypto followed, and precious metals also came under pressure as traders moved quickly to reduce risk.
This is what happens when geopolitical uncertainty hits an already nervous market. Positions get cut, leverage gets flushed, and volatility spreads across almost every major asset class.
For now, all eyes are on what comes next between the US and Iran.
One new headline could completely shift market sentiment again.
8
10
3.2k
·
--
BITCOIN YEAR-OVER-YEAR CHANGE IS ABOUT TO FLIP GREEN.
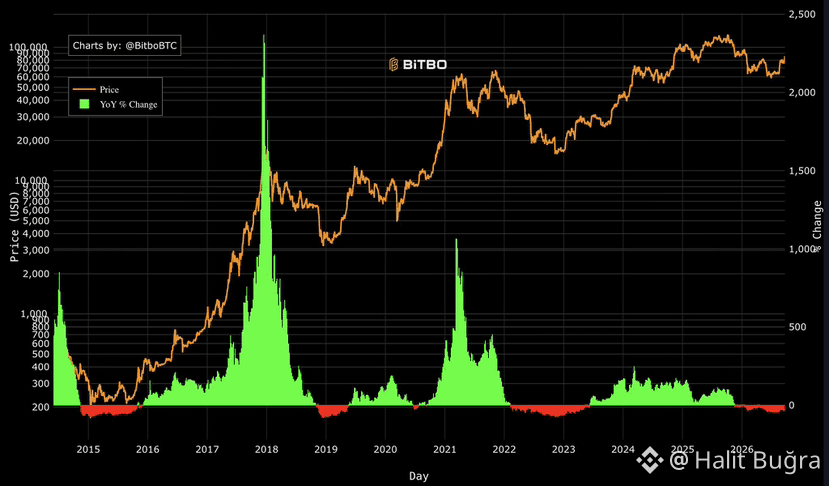
Bitcoin’s YoY % change is approaching positive territory, marking a major shift from the weakness we saw during the bear market.
Those who survived the fear, volatility, liquidations, and months of uncertainty are now watching momentum return.
A green YoY reading would mean Bitcoin is trading above where it was one year ago — another sign that the broader market structure has improved significantly.
The bear market tested everyone.
The next phase could reward patience.
If Bitcoin keeps building momentum from here, this bull market could become one for the history books.
Congratulations to everyone who survived another crypto winter.
BITCOIN YEAR-OVER-YEAR CHANGE IS ABOUT TO FLIP GREEN.
Bitcoin’s YoY % change is approaching positive territory, marking a major shift from the weakness we saw during the bear market.
Those who survived the fear, volatility, liquidations, and months of uncertainty are now watching momentum return.
A green YoY reading would mean Bitcoin is trading above where it was one year ago — another sign that the broader market structure has improved significantly.
The bear market tested everyone.
The next phase could reward patience.
If Bitcoin keeps building momentum from here, this bull market could become one for the history books.
Congratulations to everyone who survived another crypto winter.
Bitcoin’s YoY % change is approaching positive territory, marking a major shift from the weakness we saw during the bear market.
Those who survived the fear, volatility, liquidations, and months of uncertainty are now watching momentum return.
A green YoY reading would mean Bitcoin is trading above where it was one year ago — another sign that the broader market structure has improved significantly.
The bear market tested everyone.
The next phase could reward patience.
If Bitcoin keeps building momentum from here, this bull market could become one for the history books.
Congratulations to everyone who survived another crypto winter.
9
9
189
·
--
HUGE BITCOIN SELL WALLS ARE STACKING UP ALL THE WAY TO $90,000
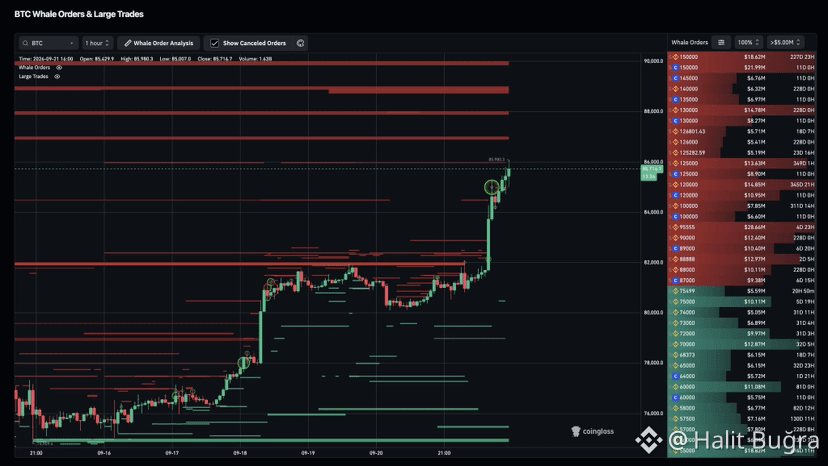
Bitcoin has made a powerful push toward $86K, but the whale order book shows serious overhead liquidity waiting above price.
According to the chart, large sell orders are concentrated around $87K–$90K, creating multiple potential resistance zones. The $88K–$90K region is especially important: BTC will need sustained buying pressure to absorb these walls and keep the breakout moving.
At the same time, sizeable buy liquidity remains below the market, particularly around $75K–$70K, which could become important support if momentum reverses.
The key battle now is simple: can buyers keep absorbing whale supply as BTC pushes higher?
If those sell walls get filled rather than repeatedly pulled, a move through $90K would signal that substantial overhead liquidity has been absorbed. But rejection from these levels could send BTC searching for liquidity lower down.
$86K → $90K is shaping up to be a major BTC battleground.
HUGE BITCOIN SELL WALLS ARE STACKING UP ALL THE WAY TO $90,000
Bitcoin has made a powerful push toward $86K, but the whale order book shows serious overhead liquidity waiting above price.
According to the chart, large sell orders are concentrated around $87K–$90K, creating multiple potential resistance zones. The $88K–$90K region is especially important: BTC will need sustained buying pressure to absorb these walls and keep the breakout moving.
At the same time, sizeable buy liquidity remains below the market, particularly around $75K–$70K, which could become important support if momentum reverses.
The key battle now is simple: can buyers keep absorbing whale supply as BTC pushes higher?
If those sell walls get filled rather than repeatedly pulled, a move through $90K would signal that substantial overhead liquidity has been absorbed. But rejection from these levels could send BTC searching for liquidity lower down.
$86K → $90K is shaping up to be a major BTC battleground.
Bitcoin has made a powerful push toward $86K, but the whale order book shows serious overhead liquidity waiting above price.
According to the chart, large sell orders are concentrated around $87K–$90K, creating multiple potential resistance zones. The $88K–$90K region is especially important: BTC will need sustained buying pressure to absorb these walls and keep the breakout moving.
At the same time, sizeable buy liquidity remains below the market, particularly around $75K–$70K, which could become important support if momentum reverses.
The key battle now is simple: can buyers keep absorbing whale supply as BTC pushes higher?
If those sell walls get filled rather than repeatedly pulled, a move through $90K would signal that substantial overhead liquidity has been absorbed. But rejection from these levels could send BTC searching for liquidity lower down.
$86K → $90K is shaping up to be a major BTC battleground.
7
30
32.6k
·
--
WHICH PRICE WILL BITCOIN HIT FIRST?
$75,000 or $83,000?
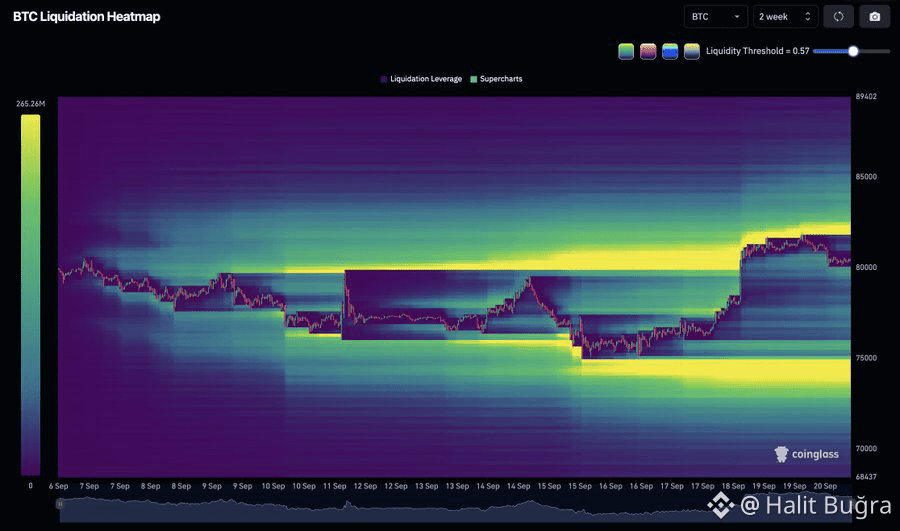
Bitcoin is sitting between two major levels, and the next decisive move could set the tone for the market.
A push toward $83K would signal buyers are regaining momentum and challenging higher resistance.
A drop toward $75K would put the lower support zone back under pressure and test whether bulls are ready to defend it.
Two levels. Two completely different directions.
The battle is on.
WHICH PRICE WILL BITCOIN HIT FIRST?
$75,000 or $83,000?
Bitcoin is sitting between two major levels, and the next decisive move could set the tone for the market.
A push toward $83K would signal buyers are regaining momentum and challenging higher resistance.
A drop toward $75K would put the lower support zone back under pressure and test whether bulls are ready to defend it.
Two levels. Two completely different directions.
The battle is on.
$75,000 or $83,000?
Bitcoin is sitting between two major levels, and the next decisive move could set the tone for the market.
A push toward $83K would signal buyers are regaining momentum and challenging higher resistance.
A drop toward $75K would put the lower support zone back under pressure and test whether bulls are ready to defend it.
Two levels. Two completely different directions.
The battle is on.
12
34
56k
·
--
THE CRYPTO MARKET JUST SENT A POWERFUL MESSAGE.
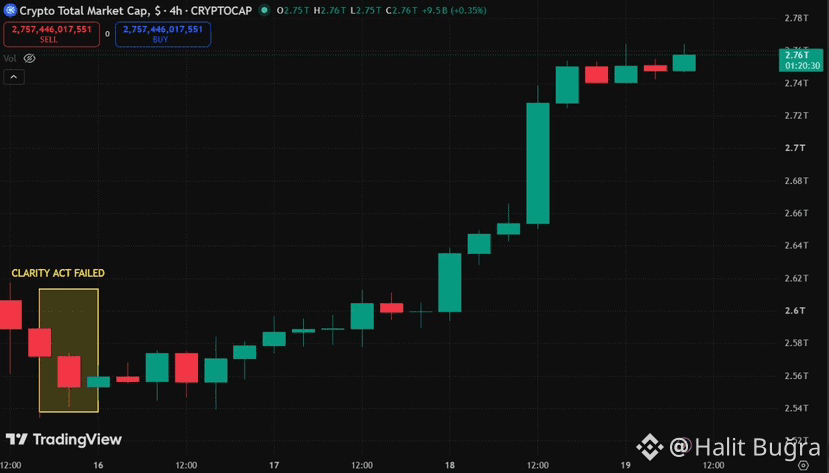
On September 15, the CLARITY Act failed to advance in the U.S. Senate, leaving major crypto market-structure legislation stalled.
The initial reaction brought uncertainty and selling pressure across the market.
But crypto quickly changed direction.
Since that failed vote, the total crypto market cap has surged from roughly $2.55 trillion to $2.76 trillion, adding more than $210 billion in market value.
That is a significant recovery in just a few days.
The move shows that despite regulatory uncertainty in Washington, capital has continued flowing back into crypto.
The CLARITY Act situation remains important, and the legislation could still return through the political process.
For now, the chart is sending a strong signal:
$210B+ has returned to the crypto market since the CLARITY Act failed.
THE CRYPTO MARKET JUST SENT A POWERFUL MESSAGE.
On September 15, the CLARITY Act failed to advance in the U.S. Senate, leaving major crypto market-structure legislation stalled.
The initial reaction brought uncertainty and selling pressure across the market.
But crypto quickly changed direction.
Since that failed vote, the total crypto market cap has surged from roughly $2.55 trillion to $2.76 trillion, adding more than $210 billion in market value.
That is a significant recovery in just a few days.
The move shows that despite regulatory uncertainty in Washington, capital has continued flowing back into crypto.
The CLARITY Act situation remains important, and the legislation could still return through the political process.
For now, the chart is sending a strong signal:
$210B+ has returned to the crypto market since the CLARITY Act failed.
On September 15, the CLARITY Act failed to advance in the U.S. Senate, leaving major crypto market-structure legislation stalled.
The initial reaction brought uncertainty and selling pressure across the market.
But crypto quickly changed direction.
Since that failed vote, the total crypto market cap has surged from roughly $2.55 trillion to $2.76 trillion, adding more than $210 billion in market value.
That is a significant recovery in just a few days.
The move shows that despite regulatory uncertainty in Washington, capital has continued flowing back into crypto.
The CLARITY Act situation remains important, and the legislation could still return through the political process.
For now, the chart is sending a strong signal:
$210B+ has returned to the crypto market since the CLARITY Act failed.
8
12
1.6k
·
--
THIS CAN’T BE A COINCIDENCE.
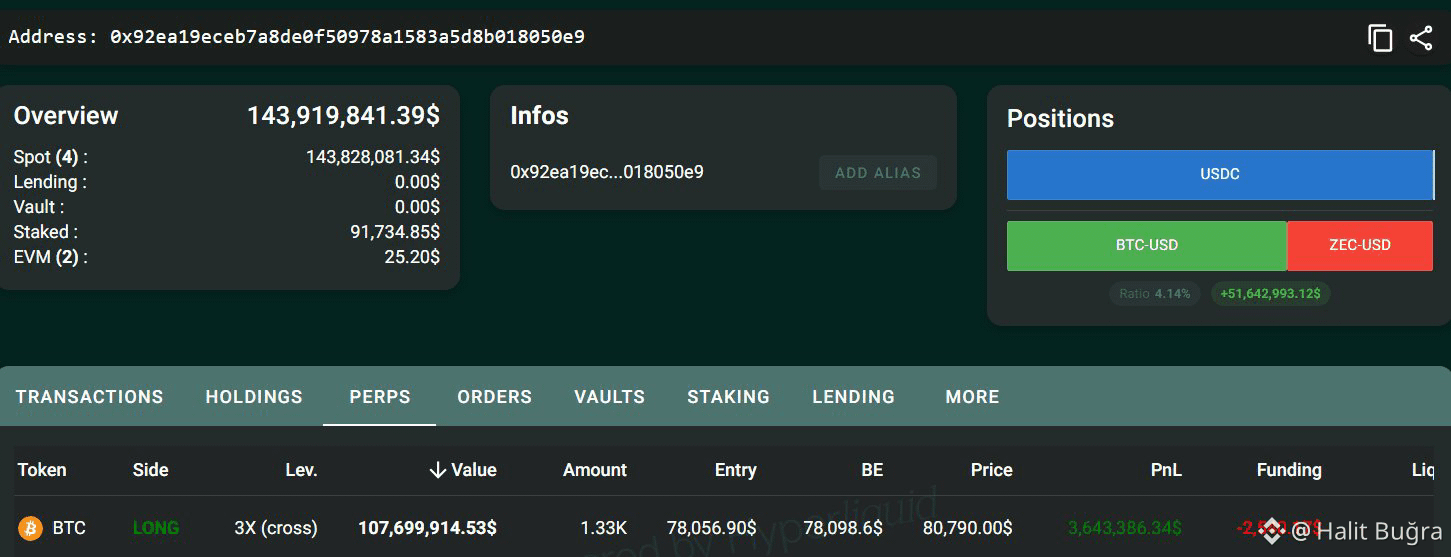
A whale reportedly opened a massive $107 MILLION Bitcoin long just 90 minutes before the CFTC news hit the market.
Then BTC exploded.
Bitcoin surged nearly $3,000, instantly putting that position deep into profit.
The whale is now reportedly sitting on around $3.6 MILLION in unrealised gains.
A nine-figure position placed right before a major catalyst, followed by an aggressive BTC move.
The timing is getting serious attention.
Whether it was conviction, perfect timing, or something else, this is one whale position worth tracking closely.
THIS CAN’T BE A COINCIDENCE.
A whale reportedly opened a massive $107 MILLION Bitcoin long just 90 minutes before the CFTC news hit the market.
Then BTC exploded.
Bitcoin surged nearly $3,000, instantly putting that position deep into profit.
The whale is now reportedly sitting on around $3.6 MILLION in unrealised gains.
A nine-figure position placed right before a major catalyst, followed by an aggressive BTC move.
The timing is getting serious attention.
Whether it was conviction, perfect timing, or something else, this is one whale position worth tracking closely.
A whale reportedly opened a massive $107 MILLION Bitcoin long just 90 minutes before the CFTC news hit the market.
Then BTC exploded.
Bitcoin surged nearly $3,000, instantly putting that position deep into profit.
The whale is now reportedly sitting on around $3.6 MILLION in unrealised gains.
A nine-figure position placed right before a major catalyst, followed by an aggressive BTC move.
The timing is getting serious attention.
Whether it was conviction, perfect timing, or something else, this is one whale position worth tracking closely.
8
11
239
·
--
Verified
WALL STREET JUST WOKE UP — AND THE MONEY IS POURING BACK IN.
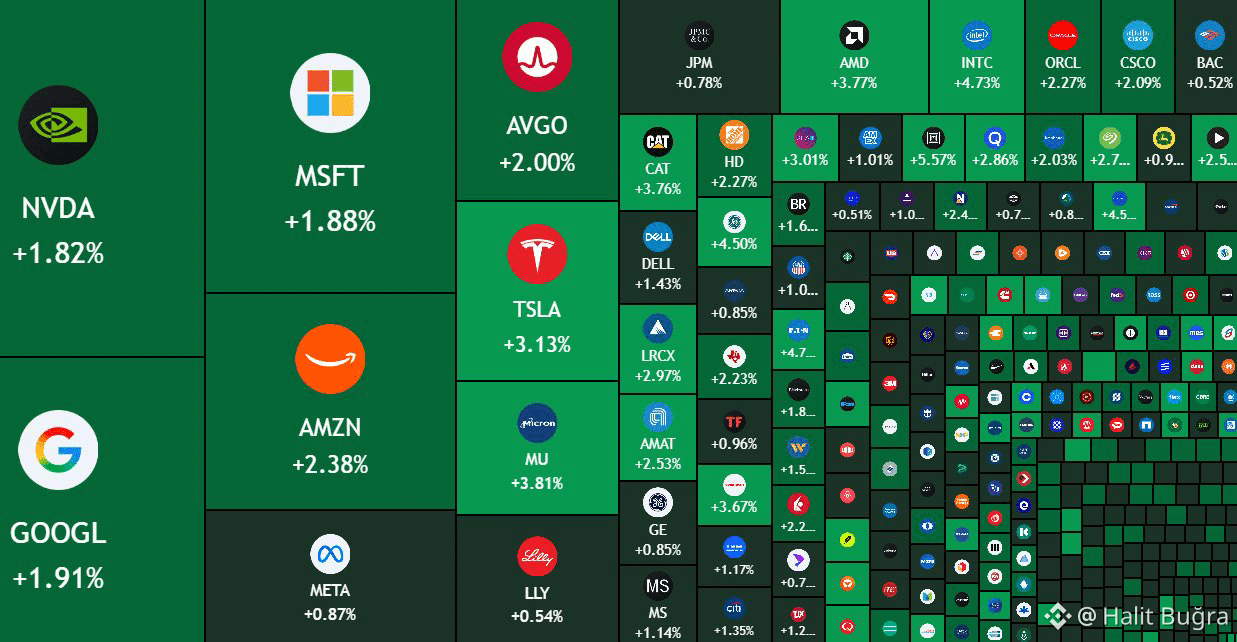
$930 BILLION was reportedly added to the U.S. stock market at the open as investors rushed back into risk assets.
The catalyst? President Trump said the Iran war could be nearing its end, immediately fueling hopes of geopolitical de-escalation.
Stocks pushed higher while oil prices cooled as markets began pricing in the possibility of reduced tensions.
That combination matters.
Lower geopolitical risk can ease pressure on energy prices, calm inflation fears, and give investors more confidence to move capital back into equities.
Tech and other risk-sensitive stocks were among the early beneficiaries as sentiment flipped from caution to aggressive buying.
But the next move depends on what happens on the ground.
If tensions genuinely ease, markets could get another major boost.
For now, Wall Street is clearly reacting to one thing: HOPE…
WALL STREET JUST WOKE UP — AND THE MONEY IS POURING BACK IN.
$930 BILLION was reportedly added to the U.S. stock market at the open as investors rushed back into risk assets.
The catalyst? President Trump said the Iran war could be nearing its end, immediately fueling hopes of geopolitical de-escalation.
Stocks pushed higher while oil prices cooled as markets began pricing in the possibility of reduced tensions.
That combination matters.
Lower geopolitical risk can ease pressure on energy prices, calm inflation fears, and give investors more confidence to move capital back into equities.
Tech and other risk-sensitive stocks were among the early beneficiaries as sentiment flipped from caution to aggressive buying.
But the next move depends on what happens on the ground.
If tensions genuinely ease, markets could get another major boost.
For now, Wall Street is clearly reacting to one thing: HOPE…
$930 BILLION was reportedly added to the U.S. stock market at the open as investors rushed back into risk assets.
The catalyst? President Trump said the Iran war could be nearing its end, immediately fueling hopes of geopolitical de-escalation.
Stocks pushed higher while oil prices cooled as markets began pricing in the possibility of reduced tensions.
That combination matters.
Lower geopolitical risk can ease pressure on energy prices, calm inflation fears, and give investors more confidence to move capital back into equities.
Tech and other risk-sensitive stocks were among the early beneficiaries as sentiment flipped from caution to aggressive buying.
But the next move depends on what happens on the ground.
If tensions genuinely ease, markets could get another major boost.
For now, Wall Street is clearly reacting to one thing: HOPE…
7
10
686
·
--
THE FED DECISION IS HOURS AWAY, AND GLOBAL MARKETS ARE ALREADY BRACING FOR A MAJOR VOLATILITY EVENT.
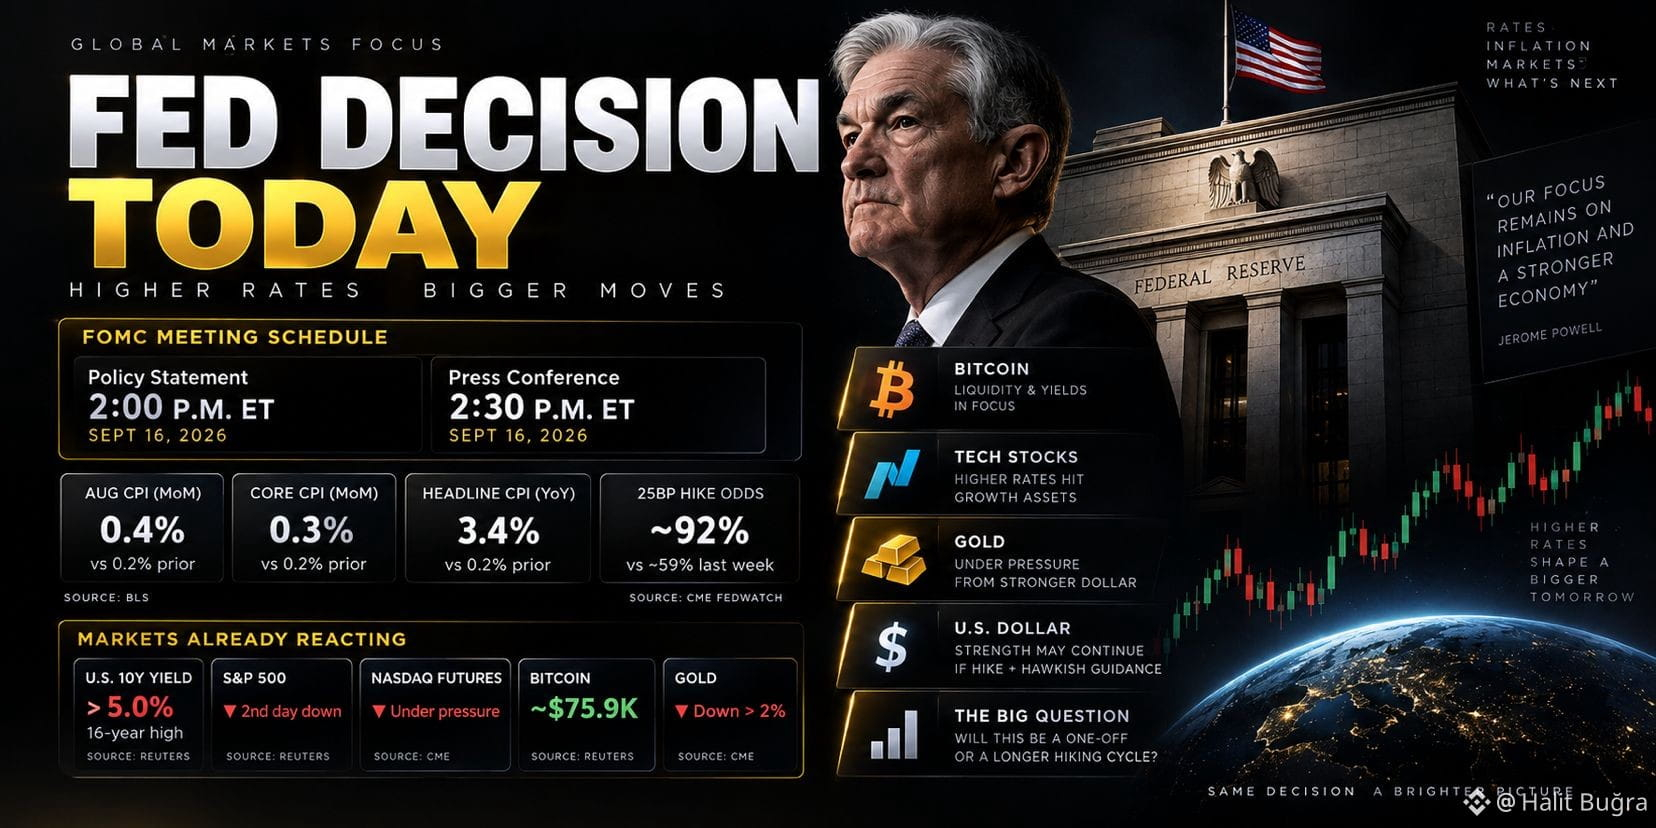
The September FOMC meeting concludes today, September 16. The policy statement is scheduled for 2:00 p.m. ET, followed by the Fed press conference at 2:30 p.m. ET.
Inflation has put the Fed back under pressure. Official BLS data shows headline CPI increased 0.4% month-over-month in August and 3.4% year-over-year. Core CPI, excluding food and energy, rose 0.3% for the month.
Market expectations have shifted aggressively. CME FedWatch pricing showed roughly a 92% implied probability of a 25-basis-point hike ahead of today’s decision, up sharply from around 59% one week earlier.
The pressure is already visible across markets. The U.S. 10-year Treasury yield briefly crossed 5% on Tuesday, while Wall Street fell for a second consecutive session. Bitcoin was trading around $75.9K during Wednesday’s Asian session.
For BTC, the immediate battle could come down to liquidity and yields. A hike combined with hawkish guidance could keep yields and the dollar elevated, creating another headwind for risk assets. A hike accompanied by softer guidance on additional increases could produce a very different reaction.
Tech stocks face a similar setup. Higher rates raise discount rates on future earnings, making long-duration growth assets particularly sensitive to the Fed’s message. Nasdaq futures had already been under pressure as Treasury yields climbed.
Gold is another market to watch closely. Recent dollar strength and rising rate expectations have pressured precious metals; CME reported gold and several other metals falling more than 2% as markets repriced toward a September hike.
The 25bp decision itself may not be the biggest surprise anymore. With markets heavily pricing it in, the real volatility trigger could be what the Fed signals about October, December and the possibility of a longer hiking cycle.
For my setup, I would avoid treating the first BTC move.
Today isn’t only about whether rates rise.
It’s about what comes next.
#FedRateWatch .
THE FED DECISION IS HOURS AWAY, AND GLOBAL MARKETS ARE ALREADY BRACING FOR A MAJOR VOLATILITY EVENT.
The September FOMC meeting concludes today, September 16. The policy statement is scheduled for 2:00 p.m. ET, followed by the Fed press conference at 2:30 p.m. ET.
Inflation has put the Fed back under pressure. Official BLS data shows headline CPI increased 0.4% month-over-month in August and 3.4% year-over-year. Core CPI, excluding food and energy, rose 0.3% for the month.
Market expectations have shifted aggressively. CME FedWatch pricing showed roughly a 92% implied probability of a 25-basis-point hike ahead of today’s decision, up sharply from around 59% one week earlier.
The pressure is already visible across markets. The U.S. 10-year Treasury yield briefly crossed 5% on Tuesday, while Wall Street fell for a second consecutive session. Bitcoin was trading around $75.9K during Wednesday’s Asian session.
For BTC, the immediate battle could come down to liquidity and yields. A hike combined with hawkish guidance could keep yields and the dollar elevated, creating another headwind for risk assets. A hike accompanied by softer guidance on additional increases could produce a very different reaction.
Tech stocks face a similar setup. Higher rates raise discount rates on future earnings, making long-duration growth assets particularly sensitive to the Fed’s message. Nasdaq futures had already been under pressure as Treasury yields climbed.
Gold is another market to watch closely. Recent dollar strength and rising rate expectations have pressured precious metals; CME reported gold and several other metals falling more than 2% as markets repriced toward a September hike.
The 25bp decision itself may not be the biggest surprise anymore. With markets heavily pricing it in, the real volatility trigger could be what the Fed signals about October, December and the possibility of a longer hiking cycle.
For my setup, I would avoid treating the first BTC move.
Today isn’t only about whether rates rise.
It’s about what comes next.
#FedRateWatch .
The September FOMC meeting concludes today, September 16. The policy statement is scheduled for 2:00 p.m. ET, followed by the Fed press conference at 2:30 p.m. ET.
Inflation has put the Fed back under pressure. Official BLS data shows headline CPI increased 0.4% month-over-month in August and 3.4% year-over-year. Core CPI, excluding food and energy, rose 0.3% for the month.
Market expectations have shifted aggressively. CME FedWatch pricing showed roughly a 92% implied probability of a 25-basis-point hike ahead of today’s decision, up sharply from around 59% one week earlier.
The pressure is already visible across markets. The U.S. 10-year Treasury yield briefly crossed 5% on Tuesday, while Wall Street fell for a second consecutive session. Bitcoin was trading around $75.9K during Wednesday’s Asian session.
For BTC, the immediate battle could come down to liquidity and yields. A hike combined with hawkish guidance could keep yields and the dollar elevated, creating another headwind for risk assets. A hike accompanied by softer guidance on additional increases could produce a very different reaction.
Tech stocks face a similar setup. Higher rates raise discount rates on future earnings, making long-duration growth assets particularly sensitive to the Fed’s message. Nasdaq futures had already been under pressure as Treasury yields climbed.
Gold is another market to watch closely. Recent dollar strength and rising rate expectations have pressured precious metals; CME reported gold and several other metals falling more than 2% as markets repriced toward a September hike.
The 25bp decision itself may not be the biggest surprise anymore. With markets heavily pricing it in, the real volatility trigger could be what the Fed signals about October, December and the possibility of a longer hiking cycle.
For my setup, I would avoid treating the first BTC move.
Today isn’t only about whether rates rise.
It’s about what comes next.
#FedRateWatch .
8
9
257
·
--
𝗦𝗢𝗠𝗘𝗢𝗡𝗘 𝗝𝗨𝗦𝗧 𝗢𝗣𝗘𝗡𝗘𝗗 𝗔 𝗠𝗔𝗦𝗦𝗜𝗩𝗘 $𝟳𝟯 𝗠𝗜𝗟𝗟𝗜𝗢𝗡 𝗦𝗛𝗢𝗥𝗧 𝗢𝗡 $𝗕𝗧𝗖 𝗔𝗡𝗗 $𝗘𝗧𝗛.
And the timing is impossible to ignore.
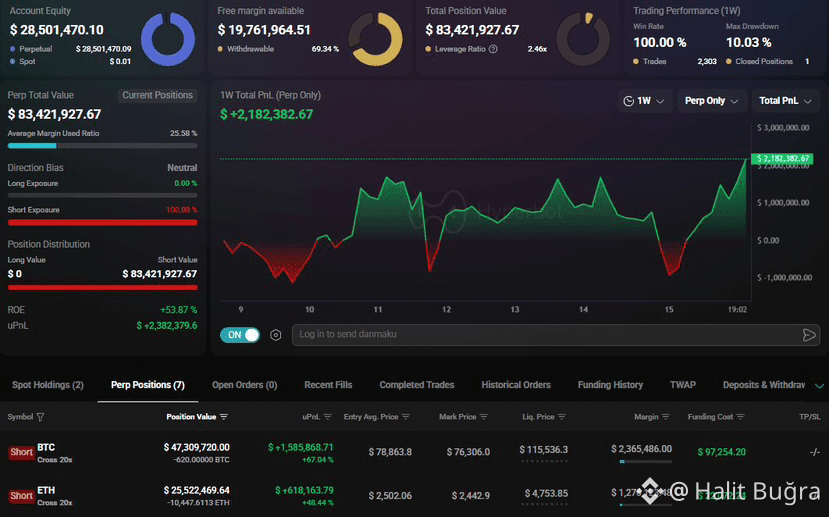
Ahead of today’s CLARITY vote, one trader is sitting on roughly $47.3M worth of BTC shorts and another $25.5M in ETH shorts.
That puts the combined position at nearly $73M, with the account heavily positioned toward the downside.
The screenshot shows a BTC short worth approximately $47.3M, entered around $78,864, alongside an ETH short worth approximately $25.5M, entered around $2,502.
The account currently shows around $28.5M in equity and more than $83M in total position value.
Even more interesting, the trader’s 1-week perp PnL is already around +$2.18M, with both the displayed BTC and ETH positions sitting firmly in profit.
Positions of this size around a major regulatory event are bound to attract attention. It could be a hedge against existing exposure or simply a high-conviction bearish trade.
Either way, nearly $73M positioned against $BTC and $ETH ahead of the CLARITY vote makes this a trade worth watching closely.
NFA. DYOR. This is for informational purposes only and not financial advice.
𝗦𝗢𝗠𝗘𝗢𝗡𝗘 𝗝𝗨𝗦𝗧 𝗢𝗣𝗘𝗡𝗘𝗗 𝗔 𝗠𝗔𝗦𝗦𝗜𝗩𝗘 $𝟳𝟯 𝗠𝗜𝗟𝗟𝗜𝗢𝗡 𝗦𝗛𝗢𝗥𝗧 𝗢𝗡 $𝗕𝗧𝗖 𝗔𝗡𝗗 $𝗘𝗧𝗛.
And the timing is impossible to ignore.
Ahead of today’s CLARITY vote, one trader is sitting on roughly $47.3M worth of BTC shorts and another $25.5M in ETH shorts.
That puts the combined position at nearly $73M, with the account heavily positioned toward the downside.
The screenshot shows a BTC short worth approximately $47.3M, entered around $78,864, alongside an ETH short worth approximately $25.5M, entered around $2,502.
The account currently shows around $28.5M in equity and more than $83M in total position value.
Even more interesting, the trader’s 1-week perp PnL is already around +$2.18M, with both the displayed BTC and ETH positions sitting firmly in profit.
Positions of this size around a major regulatory event are bound to attract attention. It could be a hedge against existing exposure or simply a high-conviction bearish trade.
Either way, nearly $73M positioned against $BTC and $ETH ahead of the CLARITY vote makes this a trade worth watching closely.
NFA. DYOR. This is for informational purposes only and not financial advice.
And the timing is impossible to ignore.
Ahead of today’s CLARITY vote, one trader is sitting on roughly $47.3M worth of BTC shorts and another $25.5M in ETH shorts.
That puts the combined position at nearly $73M, with the account heavily positioned toward the downside.
The screenshot shows a BTC short worth approximately $47.3M, entered around $78,864, alongside an ETH short worth approximately $25.5M, entered around $2,502.
The account currently shows around $28.5M in equity and more than $83M in total position value.
Even more interesting, the trader’s 1-week perp PnL is already around +$2.18M, with both the displayed BTC and ETH positions sitting firmly in profit.
Positions of this size around a major regulatory event are bound to attract attention. It could be a hedge against existing exposure or simply a high-conviction bearish trade.
Either way, nearly $73M positioned against $BTC and $ETH ahead of the CLARITY vote makes this a trade worth watching closely.
NFA. DYOR. This is for informational purposes only and not financial advice.
8
8
422
·
--
Disputed
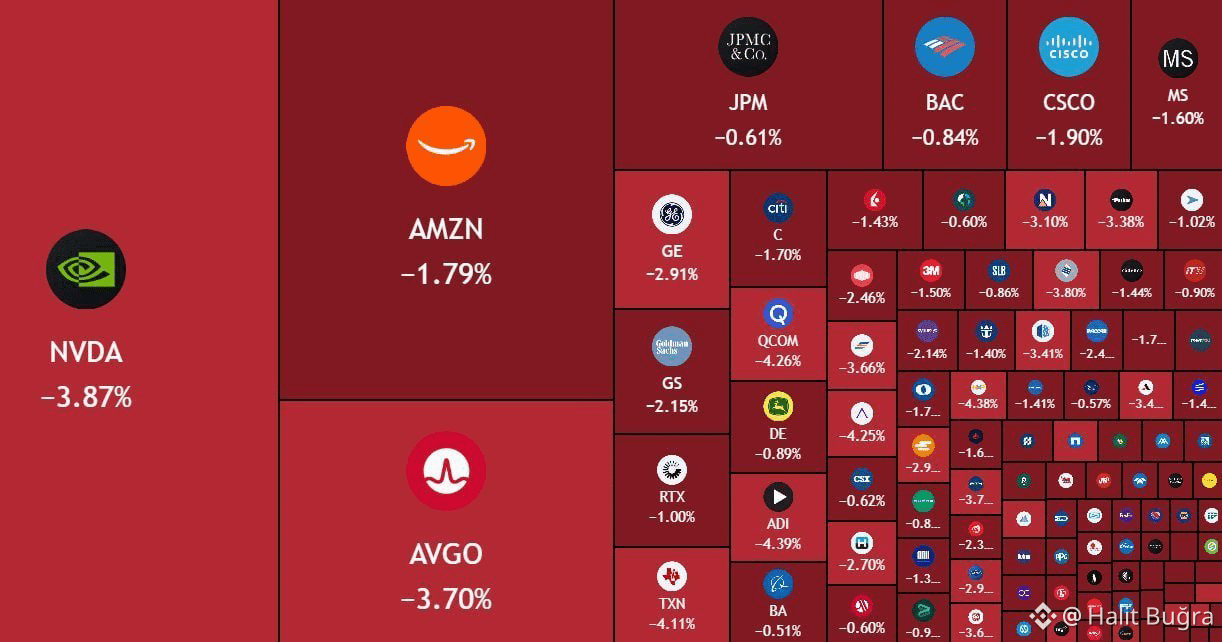
MASSIVE SELL-OFF HITS WALL STREET AS $595 BILLION IS WIPED OUT OF U.S. STOCKS AT THE OPEN.
Selling pressure came in fast, putting the market on the defensive from the opening bell.
Investors are pulling back from risk as uncertainty pushes traders to reassess their positions across major U.S. stocks.
A move of this size can quickly spill into other markets, with crypto, bonds, commodities, and the dollar potentially reacting to the shift in sentiment.
Volatility is heating up, and attention now turns to whether buyers can absorb the pressure or sellers remain in control.
The next move could set the tone for the broader market…
MASSIVE SELL-OFF HITS WALL STREET AS $595 BILLION IS WIPED OUT OF U.S. STOCKS AT THE OPEN.
Selling pressure came in fast, putting the market on the defensive from the opening bell.
Investors are pulling back from risk as uncertainty pushes traders to reassess their positions across major U.S. stocks.
A move of this size can quickly spill into other markets, with crypto, bonds, commodities, and the dollar potentially reacting to the shift in sentiment.
Volatility is heating up, and attention now turns to whether buyers can absorb the pressure or sellers remain in control.
The next move could set the tone for the broader market…
Selling pressure came in fast, putting the market on the defensive from the opening bell.
Investors are pulling back from risk as uncertainty pushes traders to reassess their positions across major U.S. stocks.
A move of this size can quickly spill into other markets, with crypto, bonds, commodities, and the dollar potentially reacting to the shift in sentiment.
Volatility is heating up, and attention now turns to whether buyers can absorb the pressure or sellers remain in control.
The next move could set the tone for the broader market…
8
9
742
·
--
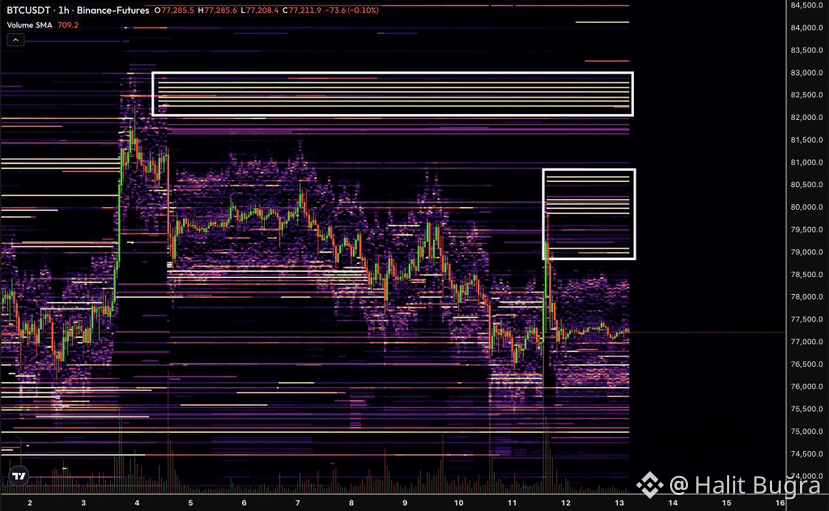
HUGE BITCOIN SELL WALLS ARE FORMING RIGHT NOW!
Massive sell orders are stacking up above the current price, creating a serious liquidity barrier for $BTC
These walls can temporarily cap upside momentum as buyers need significant volume to absorb the available supply.
If Bitcoin keeps pushing into these levels and the sell walls start getting absorbed, it could signal strong demand and potentially trigger an aggressive breakout.
But if buyers fail to absorb the supply, rejection could send BTC back toward lower liquidity and support zones.
The next move is all about liquidity.
SELL WALLS GET ABSORBED → BULLS TAKE CONTROL
SELL WALLS HOLD → REJECTION RISK INCREASES
Bitcoin is approaching a critical battle zone.
Watch the order flow closely — volatility could explode once one side gives way.
HUGE BITCOIN SELL WALLS ARE FORMING RIGHT NOW!
Massive sell orders are stacking up above the current price, creating a serious liquidity barrier for $BTC
These walls can temporarily cap upside momentum as buyers need significant volume to absorb the available supply.
If Bitcoin keeps pushing into these levels and the sell walls start getting absorbed, it could signal strong demand and potentially trigger an aggressive breakout.
But if buyers fail to absorb the supply, rejection could send BTC back toward lower liquidity and support zones.
The next move is all about liquidity.
SELL WALLS GET ABSORBED → BULLS TAKE CONTROL
SELL WALLS HOLD → REJECTION RISK INCREASES
Bitcoin is approaching a critical battle zone.
Watch the order flow closely — volatility could explode once one side gives way.
Massive sell orders are stacking up above the current price, creating a serious liquidity barrier for $BTC
These walls can temporarily cap upside momentum as buyers need significant volume to absorb the available supply.
If Bitcoin keeps pushing into these levels and the sell walls start getting absorbed, it could signal strong demand and potentially trigger an aggressive breakout.
But if buyers fail to absorb the supply, rejection could send BTC back toward lower liquidity and support zones.
The next move is all about liquidity.
SELL WALLS GET ABSORBED → BULLS TAKE CONTROL
SELL WALLS HOLD → REJECTION RISK INCREASES
Bitcoin is approaching a critical battle zone.
Watch the order flow closely — volatility could explode once one side gives way.
9
9
1.9k
·
--
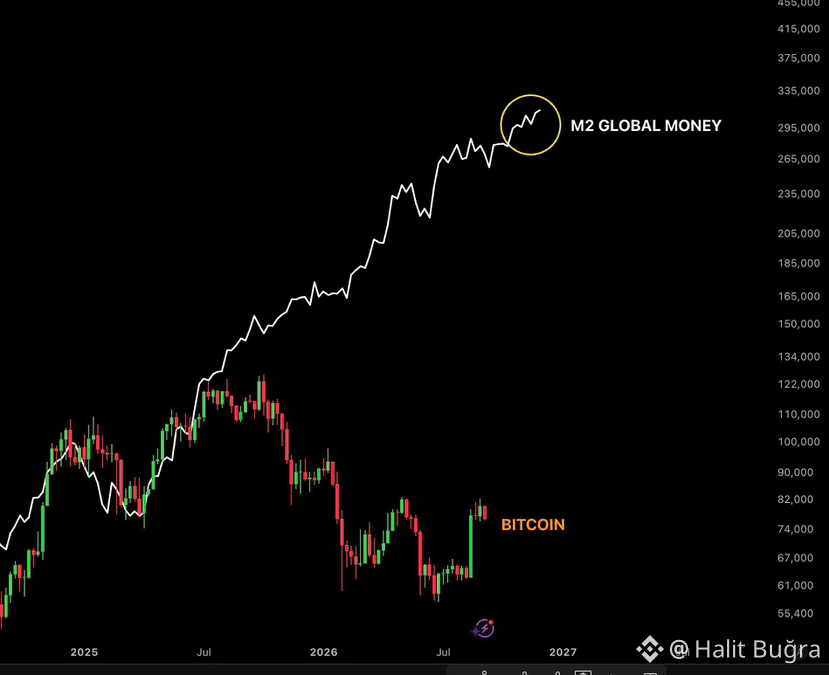
𝗕𝗜𝗧𝗖𝗢𝗜𝗡’𝗦 𝗖𝗔𝗧𝗖𝗛-𝗨𝗣 𝗥𝗔𝗟𝗟𝗬 𝗖𝗢𝗨𝗟𝗗 𝗕𝗘 𝗜𝗡𝗦𝗔𝗡𝗘.
Global M2 money supply is pushing toward fresh highs, while Bitcoin is still trading far below the trajectory shown by global liquidity.
That divergence is getting hard to ignore.
Historically, expanding global liquidity has been a powerful tailwind for risk assets, including Bitcoin. But liquidity and BTC don’t move in perfect lockstep, and timing can vary significantly.
If Bitcoin begins closing this gap while M2 keeps expanding, the catch-up move could become explosive.
Liquidity is already moving.
Now the big question is whether Bitcoin follows.
𝗕𝗜𝗧𝗖𝗢𝗜𝗡’𝗦 𝗖𝗔𝗧𝗖𝗛-𝗨𝗣 𝗥𝗔𝗟𝗟𝗬 𝗖𝗢𝗨𝗟𝗗 𝗕𝗘 𝗜𝗡𝗦𝗔𝗡𝗘.
Global M2 money supply is pushing toward fresh highs, while Bitcoin is still trading far below the trajectory shown by global liquidity.
That divergence is getting hard to ignore.
Historically, expanding global liquidity has been a powerful tailwind for risk assets, including Bitcoin. But liquidity and BTC don’t move in perfect lockstep, and timing can vary significantly.
If Bitcoin begins closing this gap while M2 keeps expanding, the catch-up move could become explosive.
Liquidity is already moving.
Now the big question is whether Bitcoin follows.
Global M2 money supply is pushing toward fresh highs, while Bitcoin is still trading far below the trajectory shown by global liquidity.
That divergence is getting hard to ignore.
Historically, expanding global liquidity has been a powerful tailwind for risk assets, including Bitcoin. But liquidity and BTC don’t move in perfect lockstep, and timing can vary significantly.
If Bitcoin begins closing this gap while M2 keeps expanding, the catch-up move could become explosive.
Liquidity is already moving.
Now the big question is whether Bitcoin follows.
8
18
4.3k
·
--
U.S. INFLATION IS BACK IN FOCUS, PUTTING THE FED, BITCOIN, STOCKS, BONDS AND THE DOLLAR ON HIGH ALERT.
August headline CPI rose 0.4% month-over-month and 3.4% year-over-year, while core CPI increased 0.3% monthly and 2.4% annually.
Energy remains a key pressure point, with gasoline prices rising sharply during August. Persistent energy costs could keep inflation elevated and complicate the Federal Reserve’s path toward its 2% inflation target.
Now the market’s attention shifts directly to the Fed.
Sticky inflation could strengthen expectations for tighter monetary policy, pushing Treasury yields and the U.S. dollar higher while creating pressure on liquidity-sensitive assets such as Bitcoin, altcoins and equities.
The key chain to watch:
CPI → Fed → Treasury Yields → Dollar → Liquidity → Bitcoin & Crypto
The headline number is only part of the story. Watch Fed expectations, yields and the dollar closely — they could determine whether the next major crypto move is bullish or bearish.
#CPIWatch .
U.S. INFLATION IS BACK IN FOCUS, PUTTING THE FED, BITCOIN, STOCKS, BONDS AND THE DOLLAR ON HIGH ALERT.
August headline CPI rose 0.4% month-over-month and 3.4% year-over-year, while core CPI increased 0.3% monthly and 2.4% annually.
Energy remains a key pressure point, with gasoline prices rising sharply during August. Persistent energy costs could keep inflation elevated and complicate the Federal Reserve’s path toward its 2% inflation target.
Now the market’s attention shifts directly to the Fed.
Sticky inflation could strengthen expectations for tighter monetary policy, pushing Treasury yields and the U.S. dollar higher while creating pressure on liquidity-sensitive assets such as Bitcoin, altcoins and equities.
The key chain to watch:
CPI → Fed → Treasury Yields → Dollar → Liquidity → Bitcoin & Crypto
The headline number is only part of the story. Watch Fed expectations, yields and the dollar closely — they could determine whether the next major crypto move is bullish or bearish.
#CPIWatch .
August headline CPI rose 0.4% month-over-month and 3.4% year-over-year, while core CPI increased 0.3% monthly and 2.4% annually.
Energy remains a key pressure point, with gasoline prices rising sharply during August. Persistent energy costs could keep inflation elevated and complicate the Federal Reserve’s path toward its 2% inflation target.
Now the market’s attention shifts directly to the Fed.
Sticky inflation could strengthen expectations for tighter monetary policy, pushing Treasury yields and the U.S. dollar higher while creating pressure on liquidity-sensitive assets such as Bitcoin, altcoins and equities.
The key chain to watch:
CPI → Fed → Treasury Yields → Dollar → Liquidity → Bitcoin & Crypto
The headline number is only part of the story. Watch Fed expectations, yields and the dollar closely — they could determine whether the next major crypto move is bullish or bearish.
#CPIWatch .

8
11
558
·
--
Partly True
MASSIVE SELL-OFF HITS WALL STREET AT THE OPEN.
$500 billion was erased from the US stock market as investors reacted aggressively to shifting Fed expectations.
Fed rate hike odds have now surged to 74%, raising fresh concerns about tighter financial conditions and liquidity.
Higher rates → tighter liquidity
Tighter liquidity → pressure on valuations
Pressure on valuations → capital moves toward safety
The reaction was immediate, with roughly $500 billion disappearing from US stocks at the opening bell.
Now the focus shifts to whether buyers step in to absorb the pressure or sellers push the market even lower.
Volatility is heating up fast.
MASSIVE SELL-OFF HITS WALL STREET AT THE OPEN.
$500 billion was erased from the US stock market as investors reacted aggressively to shifting Fed expectations.
Fed rate hike odds have now surged to 74%, raising fresh concerns about tighter financial conditions and liquidity.
Higher rates → tighter liquidity
Tighter liquidity → pressure on valuations
Pressure on valuations → capital moves toward safety
The reaction was immediate, with roughly $500 billion disappearing from US stocks at the opening bell.
Now the focus shifts to whether buyers step in to absorb the pressure or sellers push the market even lower.
Volatility is heating up fast.
$500 billion was erased from the US stock market as investors reacted aggressively to shifting Fed expectations.
Fed rate hike odds have now surged to 74%, raising fresh concerns about tighter financial conditions and liquidity.
Higher rates → tighter liquidity
Tighter liquidity → pressure on valuations
Pressure on valuations → capital moves toward safety
The reaction was immediate, with roughly $500 billion disappearing from US stocks at the opening bell.
Now the focus shifts to whether buyers step in to absorb the pressure or sellers push the market even lower.
Volatility is heating up fast.

9
9
3.7k
Log in to explore more content
Join global crypto users on Binance Square
⚡️ Get latest and useful information about crypto.
💬 Trusted by the world’s largest crypto exchange.
👍 Discover real insights from verified creators.
Email / Phone number
Trending Topics
UKFCAWinsCourtOrderToRecover851400Pounds
14,692 views
582 Discussing
🚨 CRYPTO REGULATION JUST ENTERED A NEW PHASE: THEY’RE NOT ONLY WRITING RULES — THEY’RE TAKING MONEY BACK.
The UK’s FCA has secured another court-backed asset recovery, reinforcing a broader enforcement push against unauthorized financial and crypto-related activity.
And look at what’s happening simultaneously:
🇬🇧 FCA → enforcement + asset recovery
🇺🇸 SEC → clearer rules for functional crypto assets
🇺🇸 Fed → formal stablecoin supervision under the GENIUS Act
That combination matters.
Regulators are no longer debating whether crypto belongs inside the financial system.
They’re increasingly deciding who gets access, what rules they follow, and what happens when those rules are broken.
The next crypto cycle may not be “regulation vs innovation.”
It may be regulated crypto vs everyone who can’t meet the standard. 👀
$COIN $CRCL $BTC
#ukfcawinscourtordertorecover851400pounds #ChainlinkLaunchesCCIP2WithEnterpriseVerification #GoldFallsTo$4144 #QNTFallsOver40%FromMorningHigh #USDTAdds845900HoldersInPast7Days
KimHotbae
·2 Likes
·4.2k views
ChainlinkLaunchesCCIP2WithEnterpriseVerification
28,721 views
785 Discussing
GoldFallsTo$4144
10,731 views
134 Discussing