



J Law was a secondary school teacher in Hong Kong. He began trading Hong Kong and U.S. stocks while teaching, then became a full-time trader. His returns over two years competing in the U.S. Investing Championship compounded to approximately +1,499%. At that rate of return, $1 million would grow to about $16 million in two years. Over the same period, the S&P 500 rose by approximately 47%.
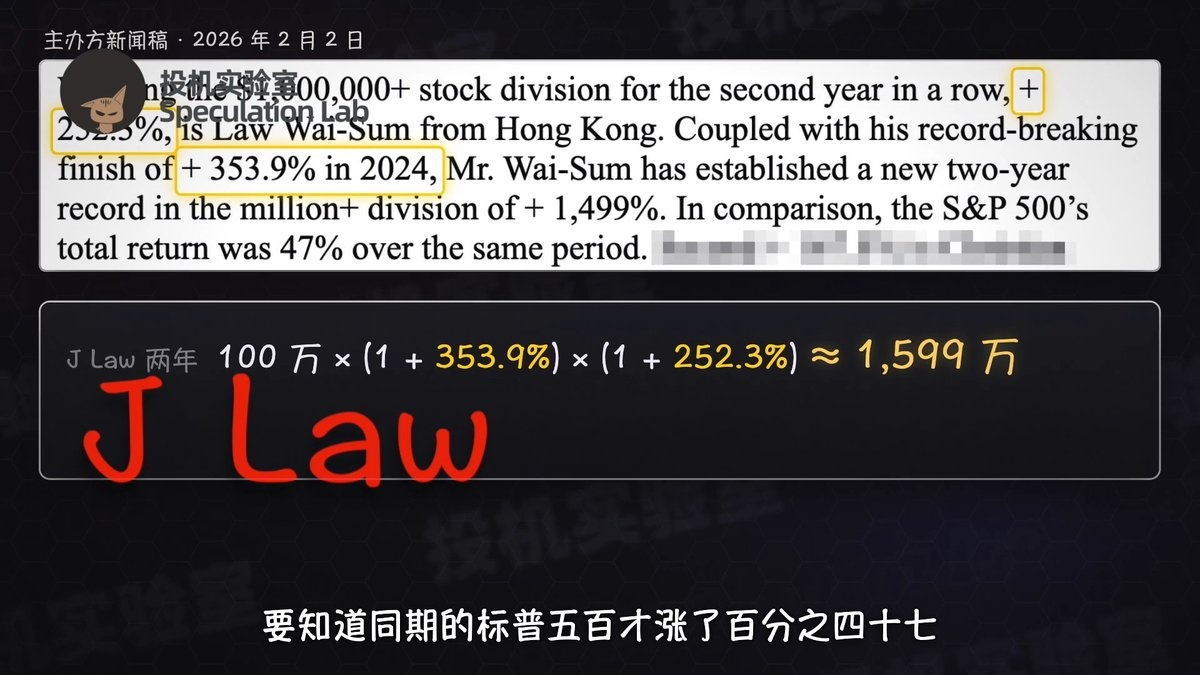
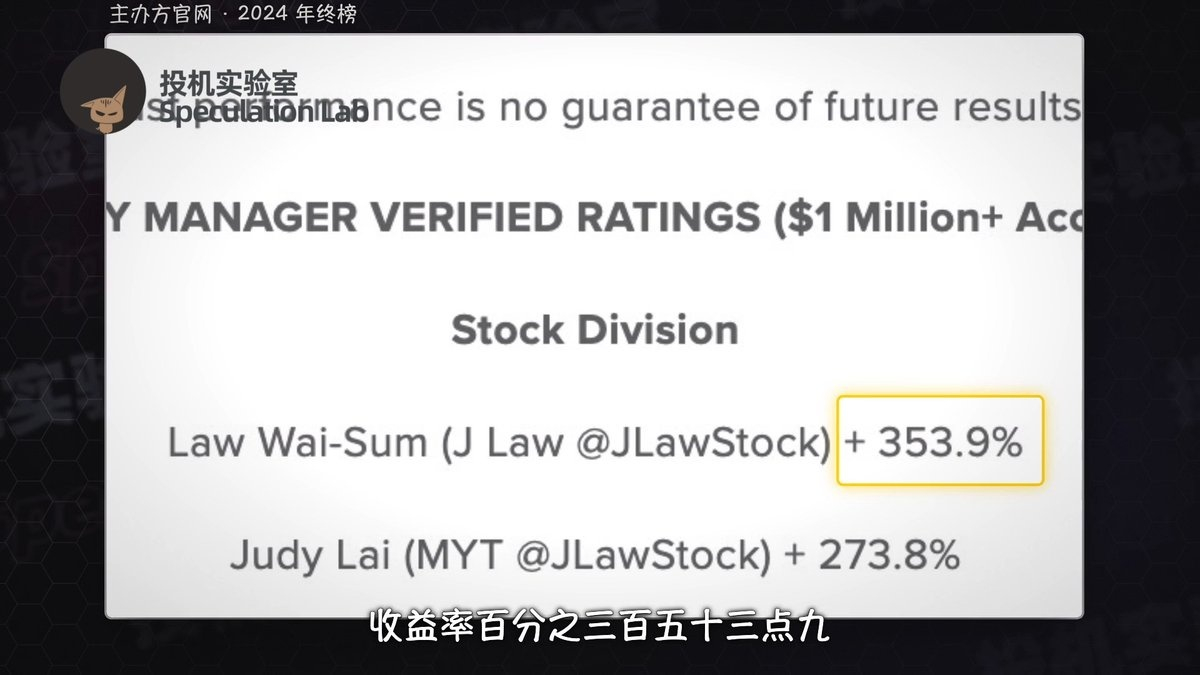
In 2024, he won the live stock division for accounts over $1 million with a return of +353.9%, breaking Mark Minervini’s division record. In 2025, he defended his title in the same division with a return of +252.3%. In 2024, his wife, Judy Lai, used the same system to take second place in the division.
J Law took Minervini’s course, then added his own stock-selection and entry criteria to Minervini’s VCP (Volatility Contraction Pattern). According to J Law’s statistics, his win rate is about 45%–50%, winning trades average a little over 10%, and losing trades average 4%–5%.

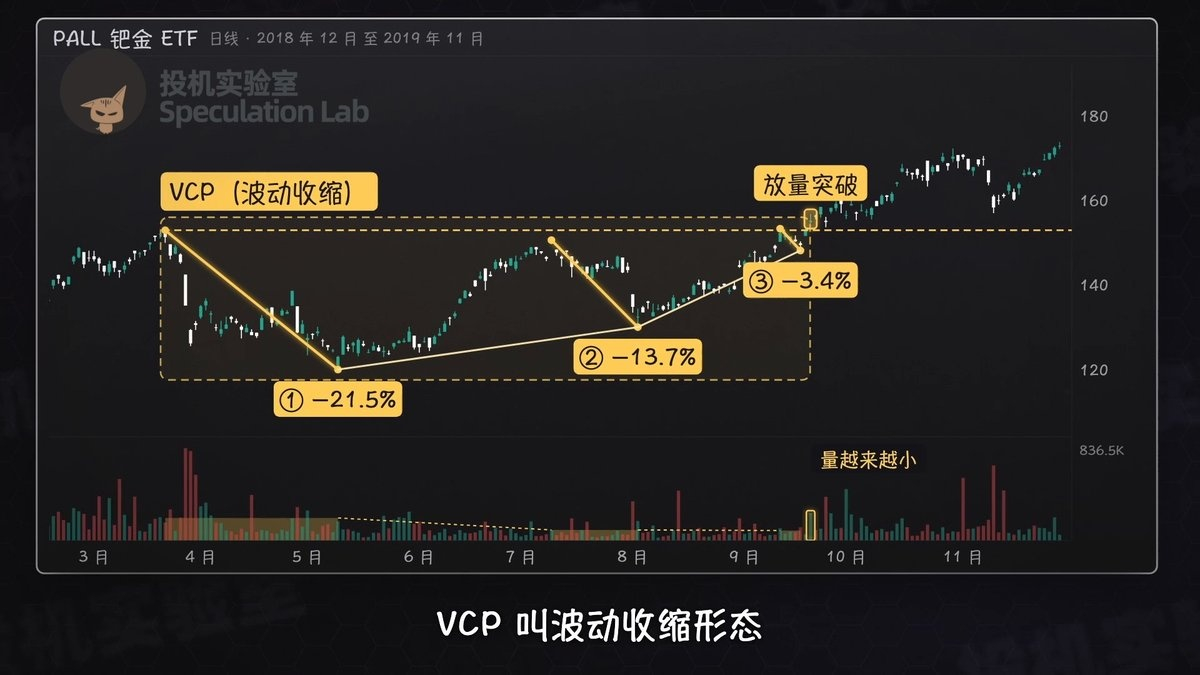
After a stock has risen substantially, people who bought at lower prices want to take profits, while those who bought near the highs want to sell once they break even. So the stock price pulls back repeatedly. As waves of selling are absorbed, each pullback becomes shallower and trading volume gets smaller. Once selling pressure eases, new buying can push the price higher more easily. The VCP looks for this contraction and the breakout that follows it.
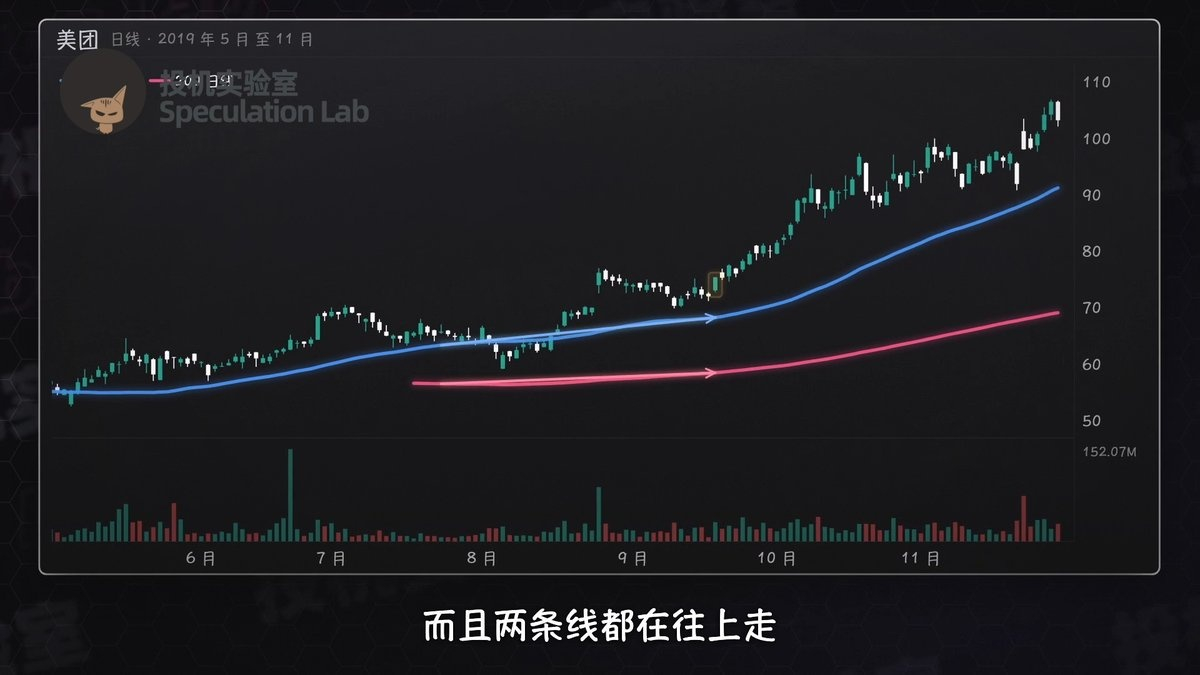
The first step is stock selection. The 50-day moving average is the average closing price over the past 50 trading days, and is used to assess the medium-term trend. The 200-day moving average is used to assess the long-term trend. He first looks for stocks whose prices are above the 50-day moving average, with the 50-day above the 200-day, and both averages trending upward. Under the stricter criteria he described in 2020, the stock price must be within 15% of its highest price over the past year, and its one-year gain must outperform about 89% of stocks.
At the time, he preferred companies with share prices above $12 and average daily trading volume of more than 25,000 shares over the past 50 trading days. If liquidity is too low, the bid-ask spread widens, and a stop-loss can result in an extra one or two percentage points of losses. At the company level, he looks for accelerating revenue growth, such as an increase from 8% in the previous quarter to 10% in the most recent quarter. This can also help identify software and biotech companies that are not yet profitable but whose revenue is growing rapidly.
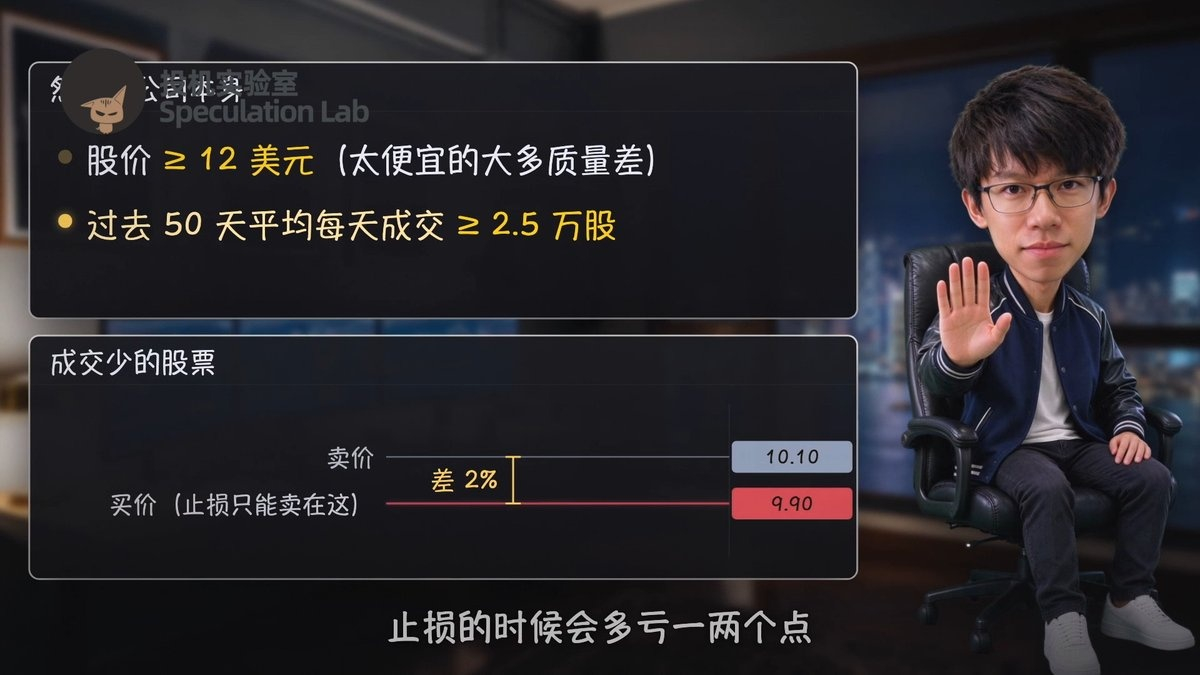
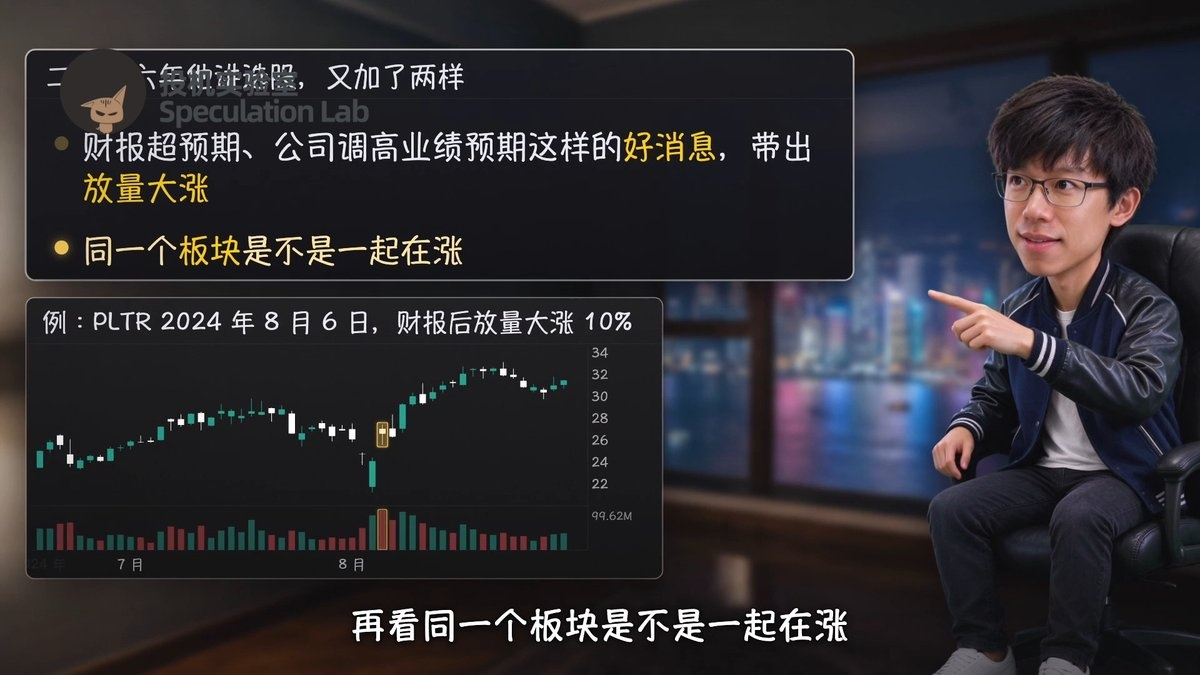
In the version he shared in 2026, he also looks at two things. First, whether news such as an earnings beat or an upward revision to company guidance has triggered a surge in volume and a sharp price increase. Second, whether stocks in the same sector are also rising.
The second step is to look at the chart pattern. The VCP appears during a consolidation within an uptrend and commonly has three or four pullbacks. Ideally, the first pullback is 20%–35%, with the deepest generally around 50%–60%. If the stock falls that far right from the start, it is best for the bottom to move sideways for six months to a year. When a stock recovers from a 50% decline back to its previous price, those who bought near the low have already doubled their money, making new selling pressure likely in the short term.
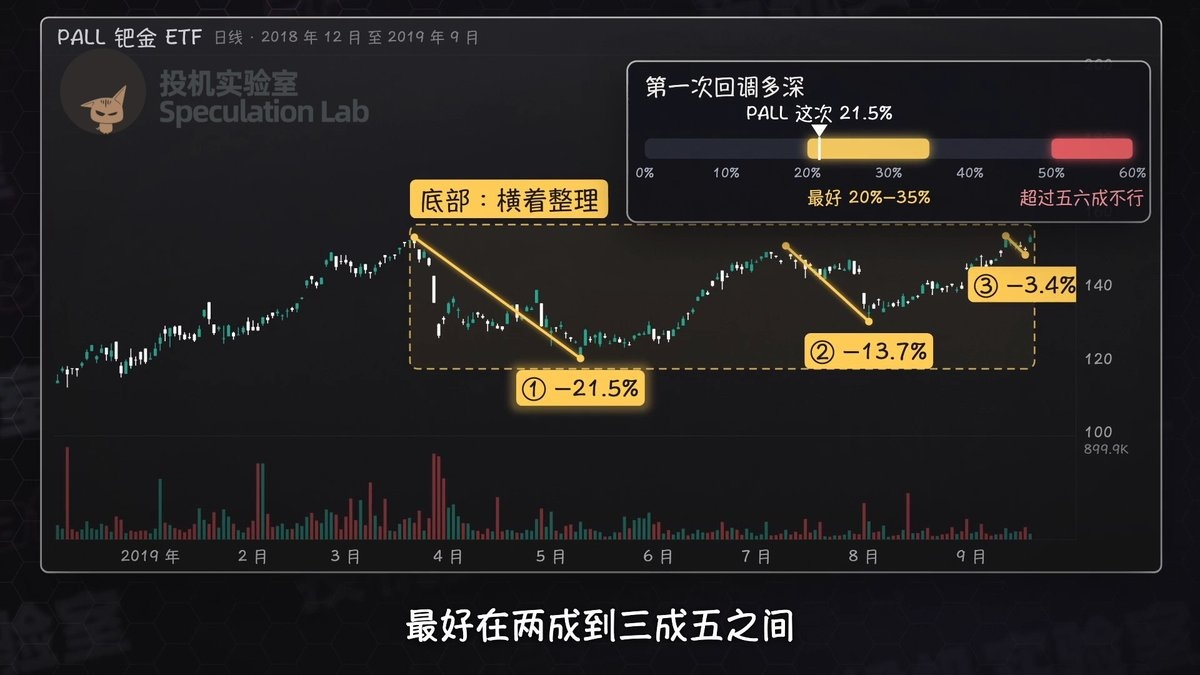
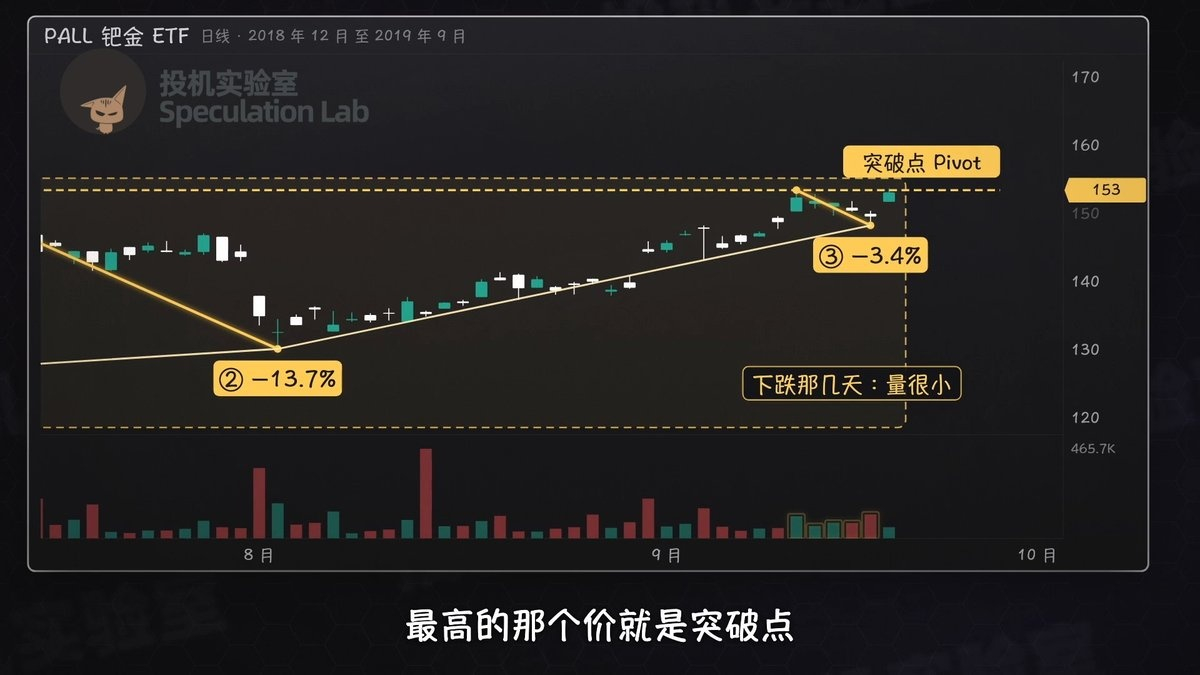
Each subsequent pullback should be shallower than the previous one. Use charting software to measure each move from its own high to its low. Once, J Law eyeballed a decline at about 20%, but the actual measurement was only 12%. Ideally, the final pullback is under 10%, with very low volume on the down days. The highest price within this tightest consolidation is the breakout point (Pivot).
The third step is to wait for an entry point. His early approach was to enter once the price broke above the Pivot. Trading volume had to be higher than the previous day and above average to confirm the breakout. If the actual price was already more than 2% above the ideal buy point, he would pass on the trade.
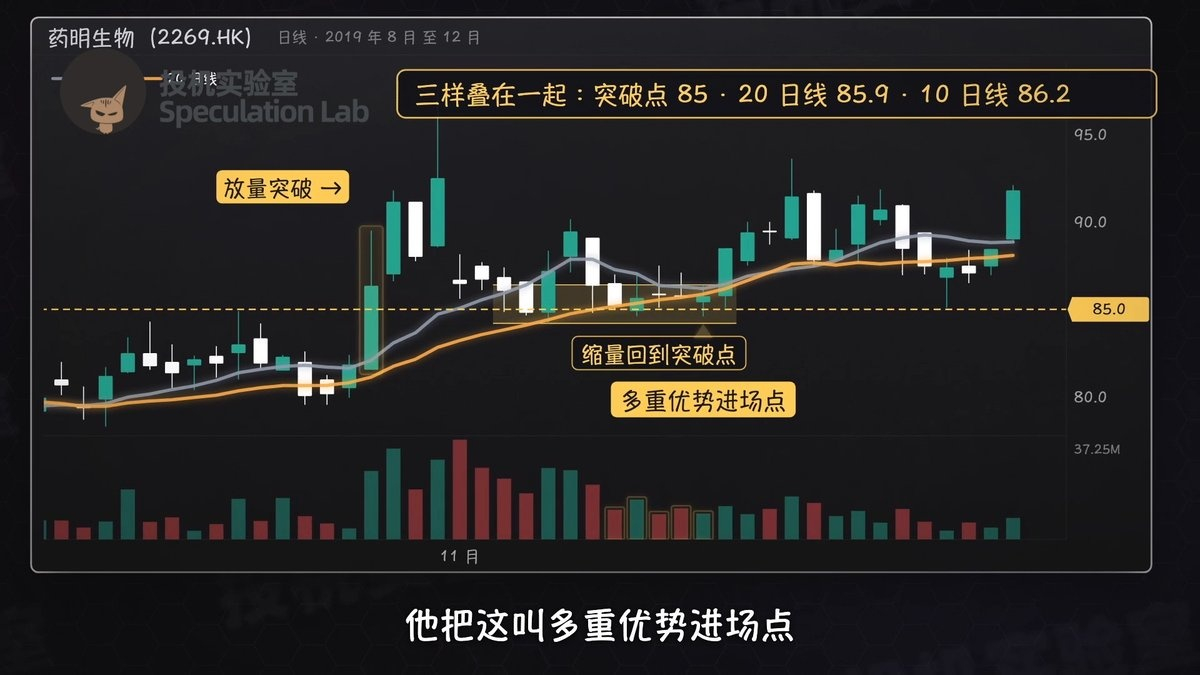
Later, he more often waited for the first pullback. In his observation, about half of VCP breakouts return to around the breakout point. After a breakout on high volume, if the price returns to the original breakout level on lower volume and also meets support such as the 10-day or 20-day moving average, he treats the price area where several forms of support overlap as a “multiple-confluence entry point.” He estimates that the win rate for entering on the breakout alone may be only around 20%, compared with about 40%–50% for this entry method.
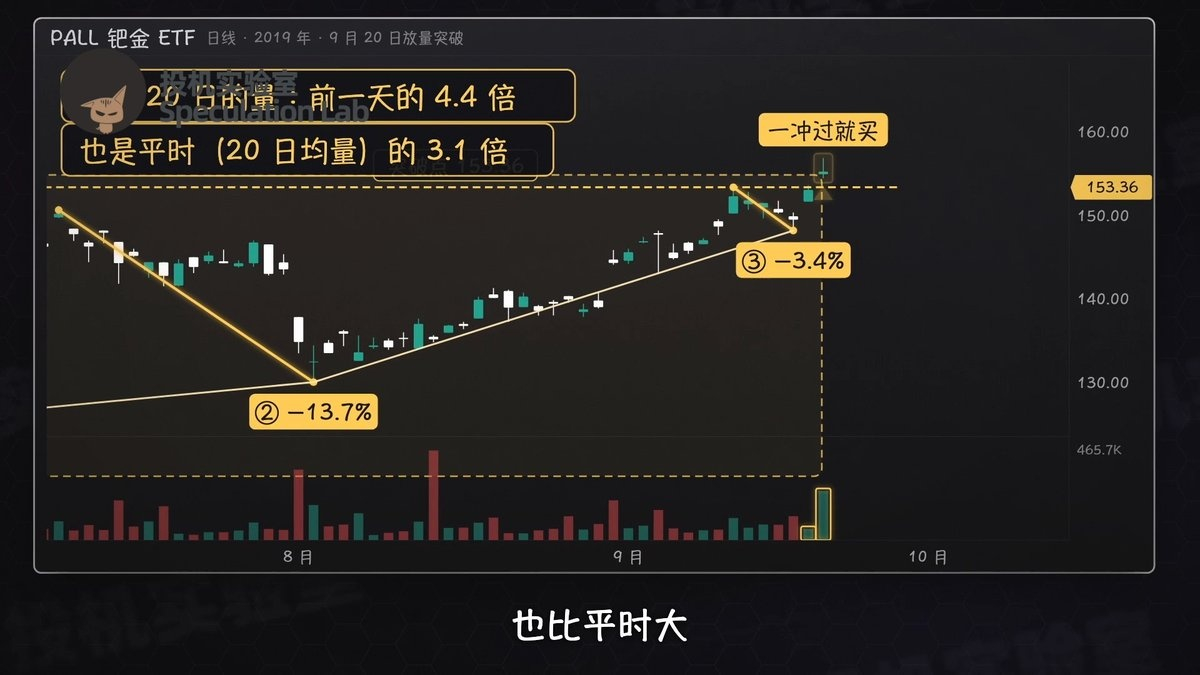
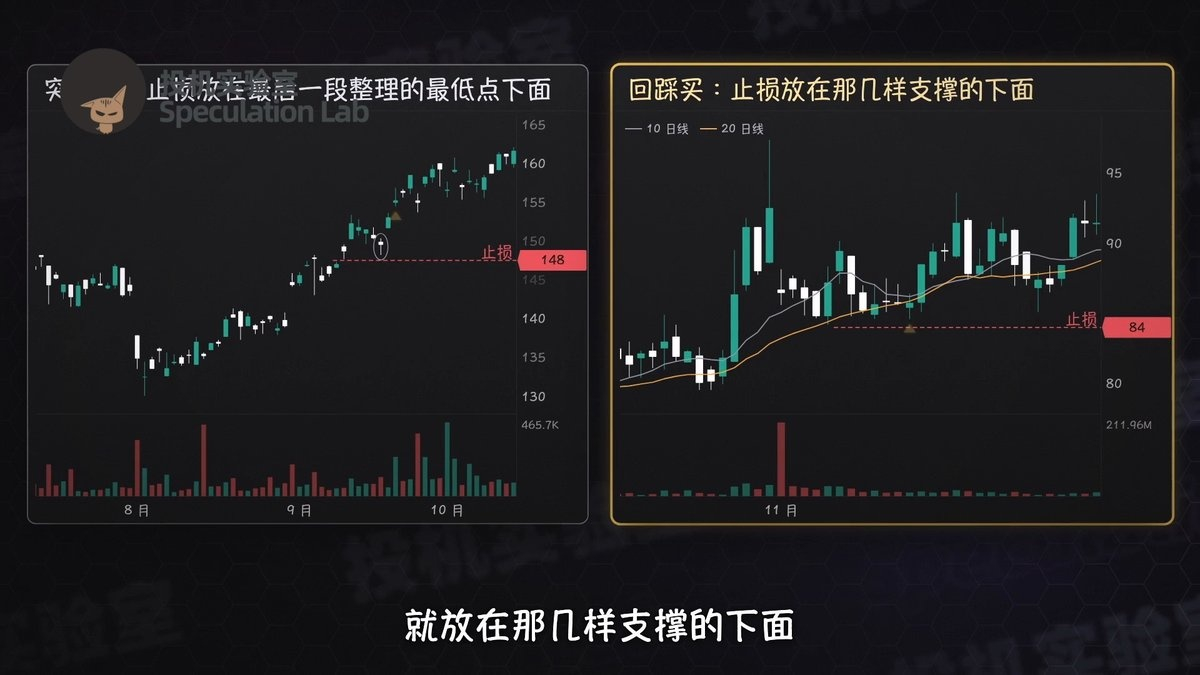
The fourth step is to set a stop-loss and position size. For a breakout entry, place the stop-loss below the low of the final consolidation. For a pullback entry, place it below the multiple support levels. With either approach, leave a little room below support to avoid being stopped out by a brief dip. J Law prefers a stop-loss distance of 3%–5%; 7%–8% is close to the upper limit. If stopped out, he will re-enter according to plan if the pattern is still valid.
He typically risks about 0.3% of his account on a single trade. For example, with a $100,000 account, if the maximum loss on the trade is $350 (0.35%), and he buys at $100 with a stop-loss at $95, the planned risk is $5 per share, so the position size is 350 ÷ 5 = 70 shares. If he sells at $125, the gross profit is $1,750, or five times the initial risk.
He has used leverage to increase his position size in competitions. Under normal circumstances, he considers an annual return of 30%–40% very good. Even when taking on more risk in a competition, he uses existing profits as a buffer. For example, if he is up 3% early in the year, he limits the total planned risk on new positions to that 3%. When trades are not going well, he immediately reduces his position size. He also advises beginners to build experience with small positions.
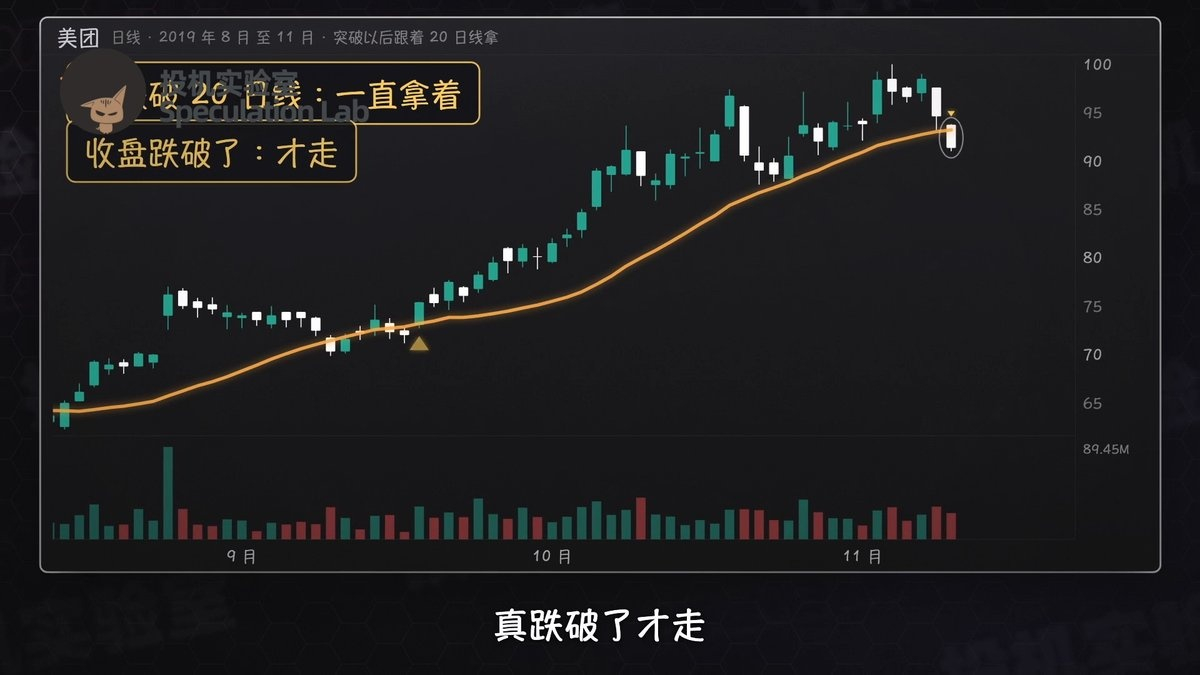
The fifth step is selling. After a stock has risen for a while—for example, when the unrealized gain exceeds 10%—he raises the stop-loss above the purchase price to lock in profits as much as possible. Selling into strength means selling all or part of the position at resistance ahead or when profits reach several times the initial risk. For example, with a 5% stop-loss distance, consider selling when the gain reaches 20%–25%. Selling into weakness means holding the position as long as it follows the 10-day or 20-day moving average, and exiting once a break below it is confirmed. J Law advises beginners to first master one of these approaches.
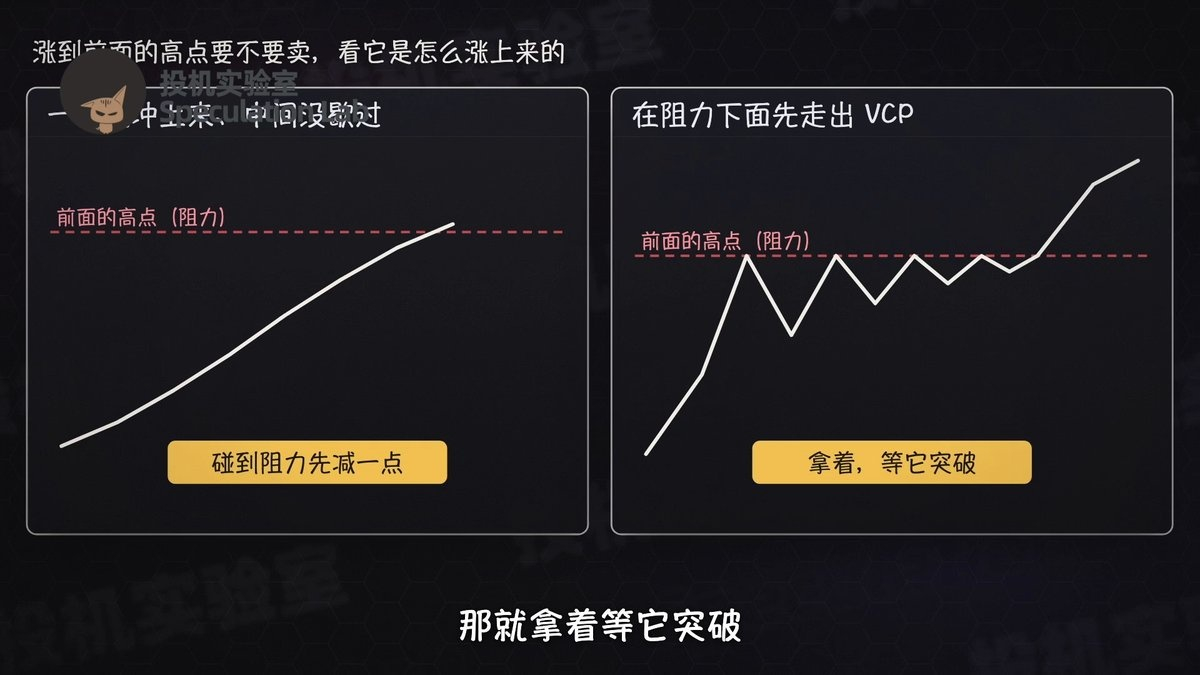
If the stock shoots straight up to resistance without consolidating along the way, he will first take some profits. If it forms a VCP below resistance, he may consider waiting for a breakout. When an uptrend gets steeper and steeper, it is difficult to sell at the exact top. He exits gradually; a sharp gap down or a break below the uptrend line is also a signal to scale out.
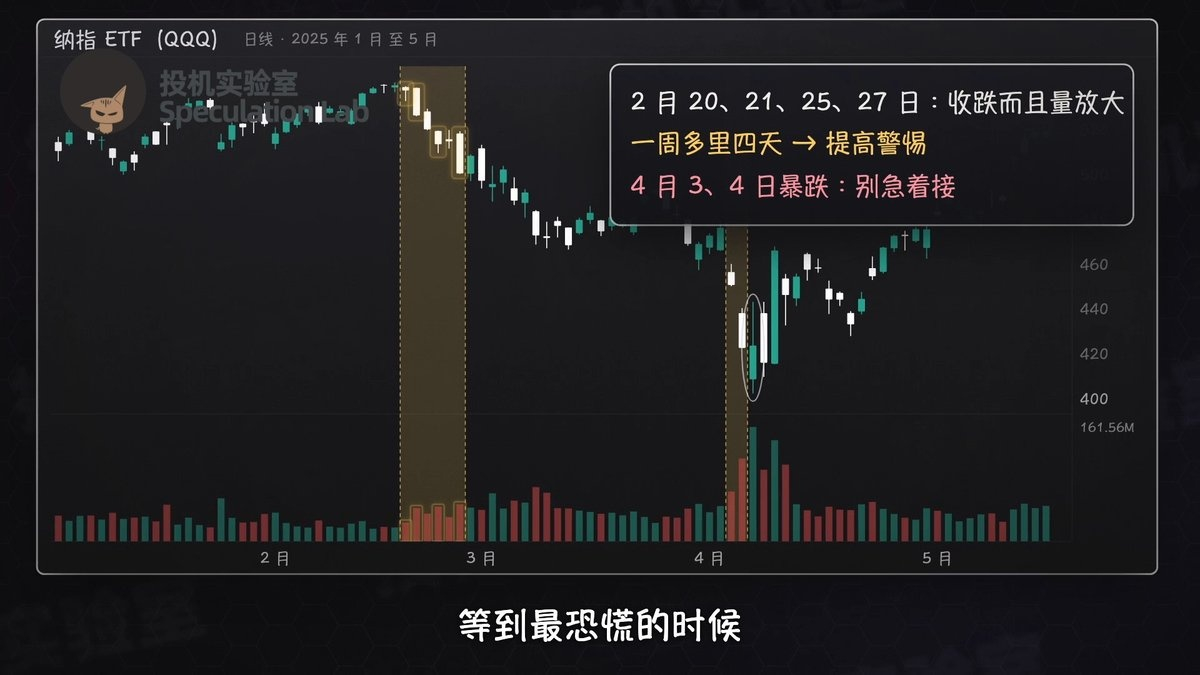
When deciding when to trade less, he first looks at his recent win rate. If his trades are not going well, he reduces trading, and only then looks at the broader market. If the market has four high-volume down days within two to four weeks, he becomes more cautious. During the first few days of a sharp sell-off, he usually waits, then looks for the most resilient stocks when market fear is at its peak.
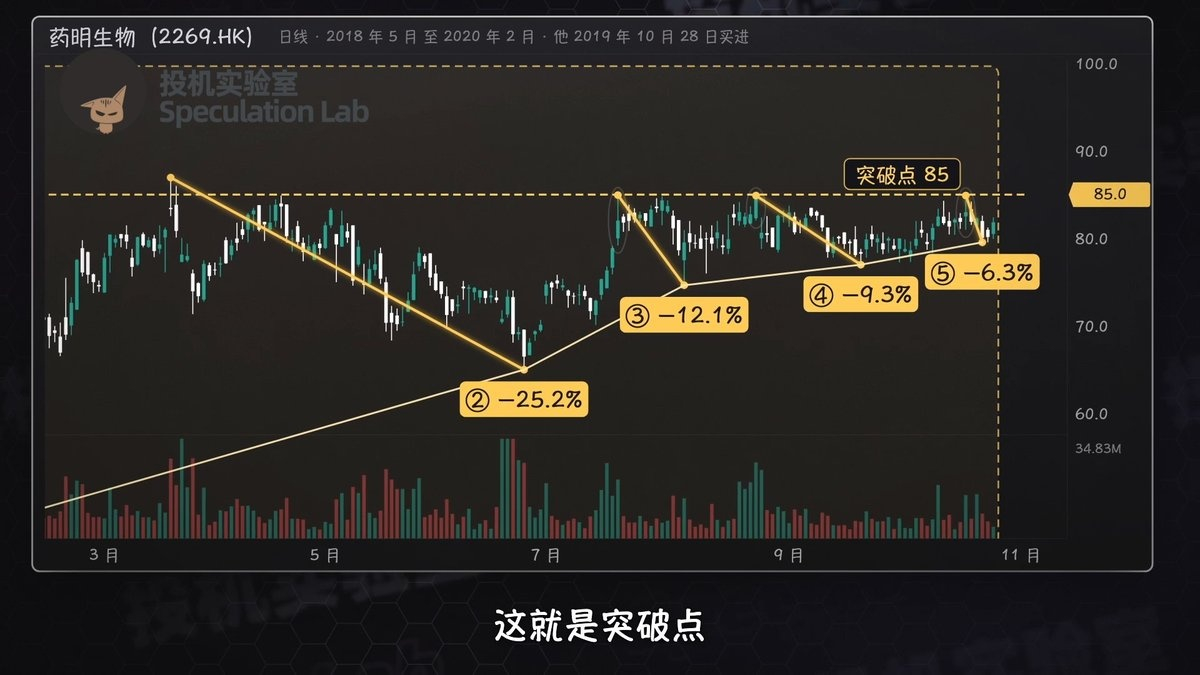
First, let’s look at the high-volume breakout in WuXi Biologics. The stock consolidated starting in June 2018. The first pullback took it from HK$98.50 to HK$44.50, a decline of more than 50%, and it then moved sideways at the bottom for over a year. Subsequent pullbacks narrowed one by one, from 25.2% to 12.1%, 9.3%, and finally 6.3%. The highs of the last few pullbacks clustered around HK$85, which was the breakout point.
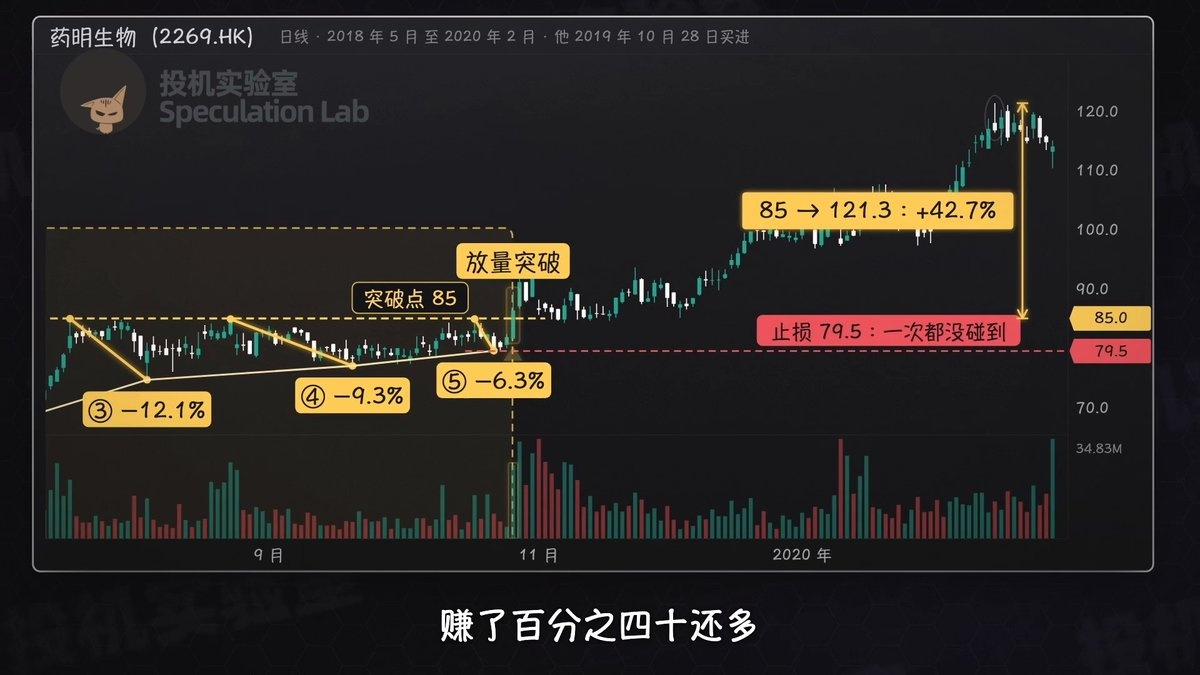
On October 28, 2019, the stock surged above HK$85 on high volume, and the moving averages also met the trend criteria. He entered at HK$85 and placed his stop-loss at HK$79.50, below the low of the final pullback, giving an initial stop-loss distance of about 6.5%. The stock never touched that stop-loss level. In less than four months, it reached a high of HK$121.30, about 42.7% above his entry price.
The second trade was a pullback entry in Super Micro Computer (SMCI). The stock had twice risen to around $306 before falling back, and it did not break out on high volume until early January 2024. J Law waited for a pullback. Horizontal support formed by the previous two highs, the 20-day moving average, and a broken downtrend line all converged in the same area. He entered at $306.47. After the market closed that day, the company announced earnings ahead of schedule that beat expectations, and the stock rose about 36% the next day.
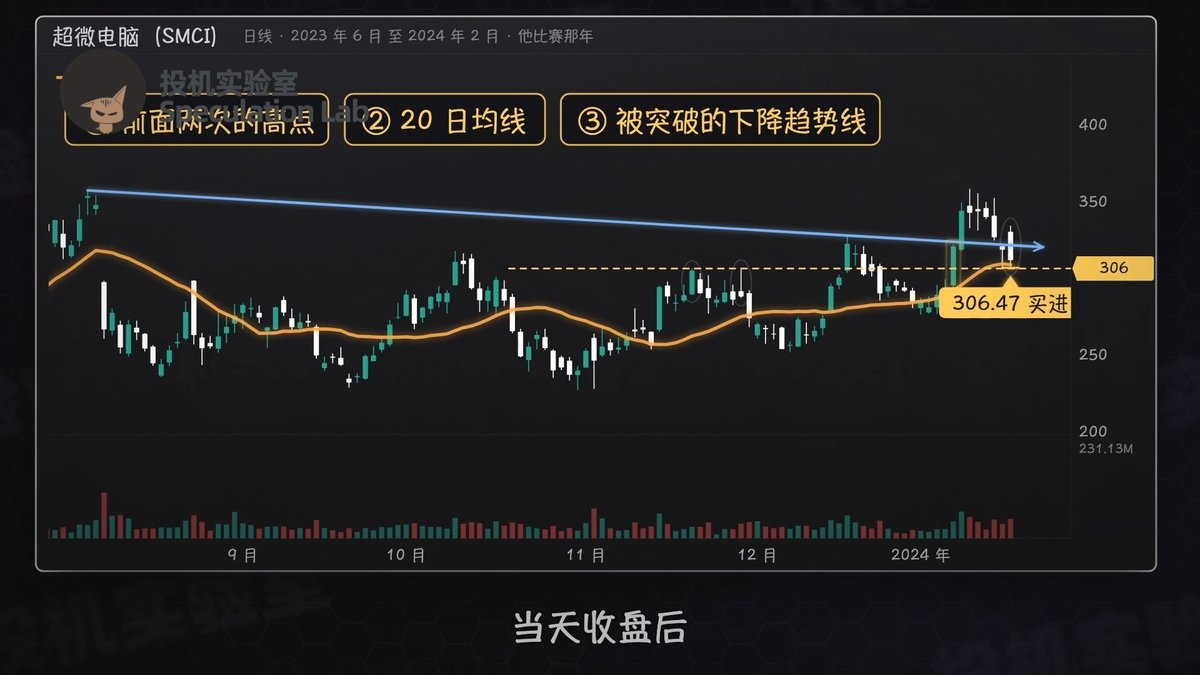
The stock later rose to resistance above, and J Law sold his entire position around $630 for a gain of about 106%, using the sell-into-strength approach. Judy Lai used the same system but chose to raise her stop in line with the 10-day moving average, holding the position longer and earning about 157%. In his review, J Law concluded that the system would have allowed him to keep holding, and that in this case he sold too early because of his subjective judgment.
For educational and informational purposes only; this is not investment advice.