

#tra100d
tra100d
11,606 views
76 Discussing
Hot
Latest

·
--
🐸 Yesterday we asked whether $PEPE would reach $0.00000524 before November… and it did a day later.
📊 The data (Binance, 07:49):
• Spot price: ~$0.00000526 (+6.9% in 24h), the only one of our meme coins in the green.
• Volume: $285M traded, more than 3 times the volume of $DOGE ($83M, −3.9%).
• On the 4h chart, it remains above its 20, 50, and 200 EMAs, with an RSI of 53: not overbought.
• Funding −0.137%: very negative. Shorts are paying longs to bet on a price drop.
• The 20-candle 4h high is around $0.00000569, about 8% away.
Meanwhile: FLOKI −0.4%, SHIB −2.9%, WIF −3.5%, BONK −3.6%.
⚠️ Keep in mind: its daily ATR is 9.5%. With funding this extreme, sharp moves could happen in either direction.
Thanks to everyone who commented yesterday 🙌 New round: will PEPE hit $0.00000569 before the rest of the meme coins turn green again? "YES" or "NO" 👇
#PEPE #Memecoins #DOGE #Cripto #Tra100d
⚠️ For informational and educational purposes only; this is not financial advice. Cryptocurrencies are volatile: do your own research and trade with caution.
92
·
--
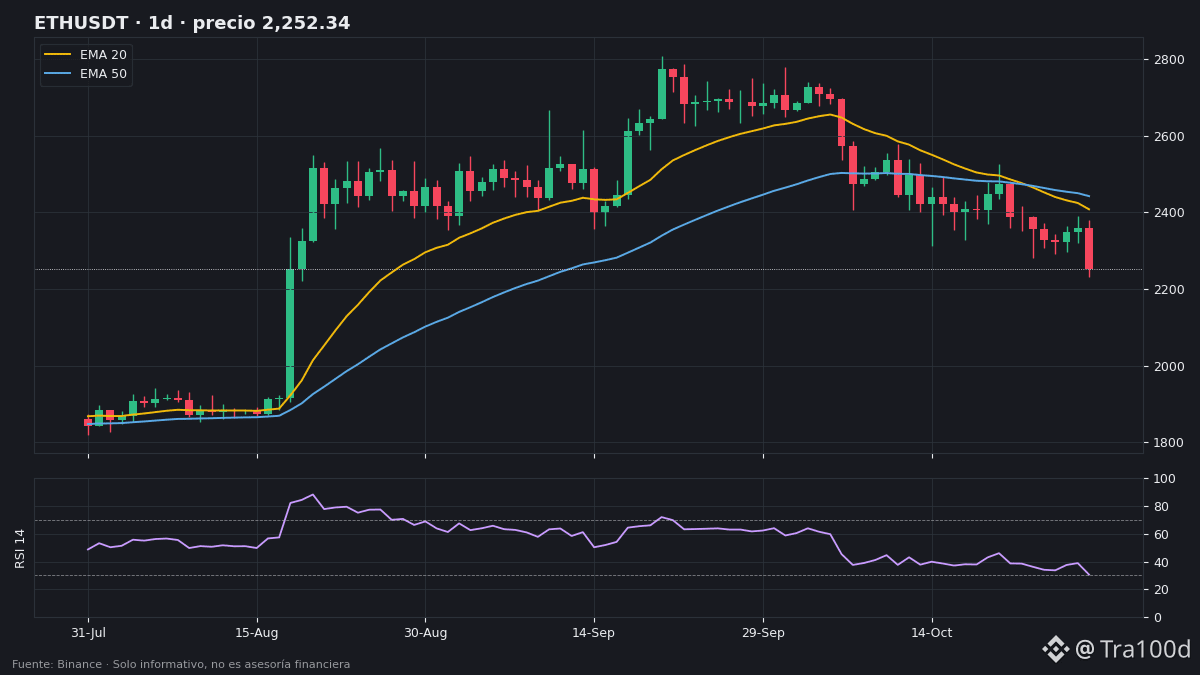
(Rewritten at 22:11 using Binance live prices; chart regenerated: ends at the closed daily candle for the 29th, $2,252.)
📉 $ETH lost both of its support levels: it closed on the 29th at $2,253, below the 20-day low ($2,281), and is now trading at ~$2,200 (−4.5% in 24 hours), also below its daily 200 EMA (~$2,232).
🔎 Context (Binance, 22:11): today's low is $2,174. The daily RSI is ~31, near oversold territory. $BTC is also falling, at ~$76,770.
📏 Levels:
• Resistance: 200 EMA at ~$2,232 (lost support), $2,281, and the 20 EMA at ~$2,389.
• Immediate support: today's low, $2,174.
🟢 Bullish scenario: recovering and closing the day above the 200 EMA (~$2,232) would turn the drop into a false breakdown.
🔴 Bearish scenario: if $2,232 becomes resistance and $2,174 breaks, weakness continues.
Will ETH recover the 200 EMA this week? Reply “YES” or “NO” 👇
#ETH #Ethereum #AnalisisTecnico #Cripto #Tra100d
⚠️ For informational and educational purposes only; this is not financial advice. Cryptocurrencies are volatile: do your own research and trade with caution.
99
·
--
🚨 $BTC broke through support: fell to ~$77,960 (−4.2% in 24 h) and lost $79,320 (low of the last 20 4-hour candles) and $79,180 (20-day low). Today's low is $77,910.
Is this a real breakdown or a bear trap? Reply "BREAKDOWN" or "TRAP" 👇
#BTC #bitcoin #cripto #Tra100d
⚠️ For informational and educational purposes only; this is not financial advice. Cryptocurrencies are volatile: do your own research and trade with caution.
Is this a real breakdown or a bear trap? Reply "BREAKDOWN" or "TRAP" 👇
#BTC #bitcoin #cripto #Tra100d
⚠️ For informational and educational purposes only; this is not financial advice. Cryptocurrencies are volatile: do your own research and trade with caution.
112
·
--
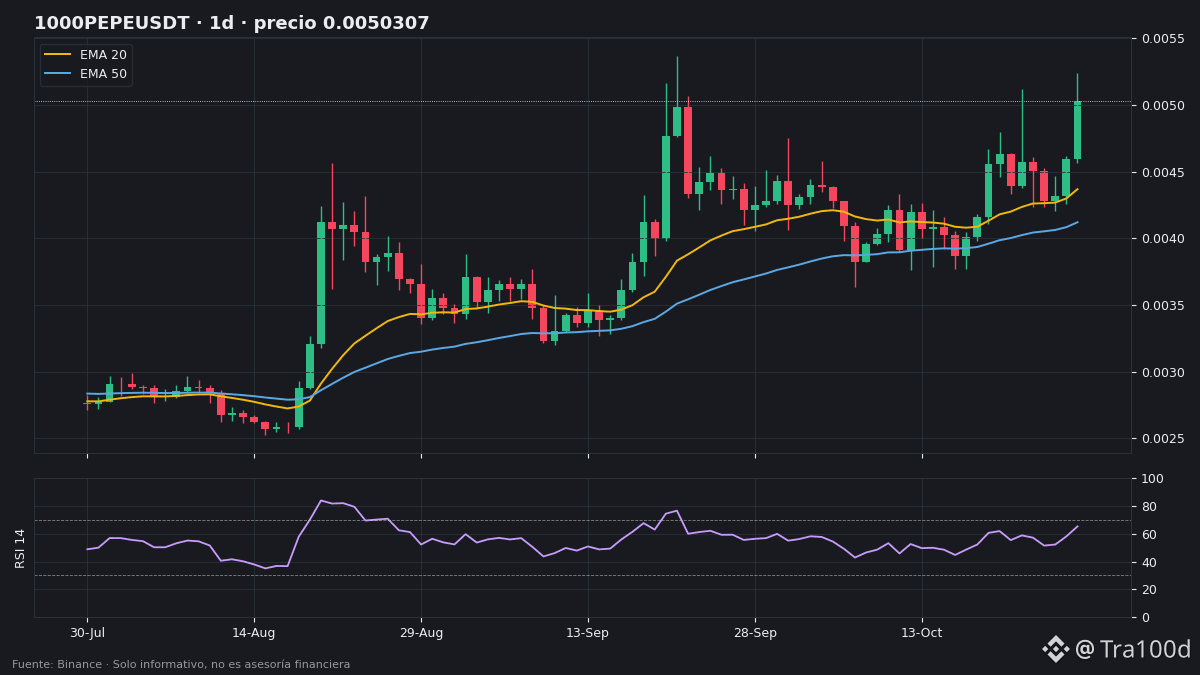
🐸 All the meme coins we follow are in the red today… but only one is still in an uptrend on the daily chart: $PEPE .
📊 The data (Binance, 07:23):
• Spot price: ~$0.00000487 (−1.6% in 24h) with $106M traded, 4 times more than $DOGE ($27M, −1.8%).
• Daily: +14.5% in 6 days, above its 20, 50, and 200 EMAs, with 2.4 times its average volume.
• Daily RSI at 65: strong, but not yet overbought.
• Open interest +8.7% and funding +0.01%: positions keep flowing in, and longs are paying.
• The 20-day high is at ~$0.00000524, about 7.7% away.
Meanwhile, BONK, WIF, SHIB, and FLOKI are down between 1% and 2.4% and remain in a downtrend on the daily chart.
⚠️ Keep in mind: its daily ATR is 7.3%. A −7% day is within the "normal" range for PEPE, even in an uptrend.
PEPE fans 🐸: will it reach $0.00000524 before November? Reply "YES" or "NO" 👇
#PEPE #Memecoins #DOGE #Cripto #Tra100d
⚠️ For informational and educational purposes only; this is not financial advice. Cryptocurrencies are volatile: do your research and trade with caution.
zyg2807944:
pepe疯了
1
195
·
--
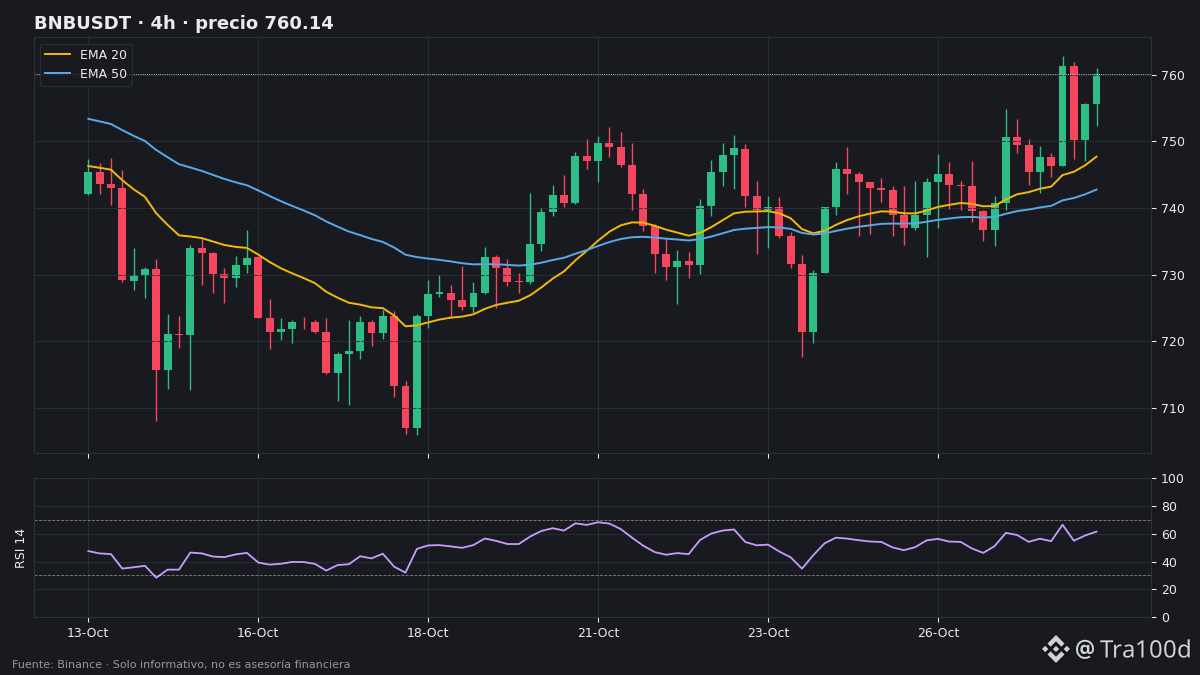
📈 $BNB is the large-cap looking strongest today: +1.1% in 24 hours, while $BTC, $ETH, $SOL and $XRP are in the red. It hit its 20-candle high on the 4-hour chart ($762.8) on double the usual volume.
📊 Context (Binance, 4-hour):
• Price: ~$753: it tried again near $762 and pulled back, about 1.2% below the high.
• Above the 20 EMA (~$748), 50 EMA (~$743) and 200 EMA (~$745): the $743–748 zone is the first support.
• RSI at 62: strong, but not overbought (70).
• Relative volume was 2.1x on the high candle; the latest closed candle was at 1.1x.
• Open interest +0.8% and funding near zero (+0.001%): positions are building without euphoria.
• On the daily chart: strong uptrend, above the daily 200 EMA (~$674). Daily ATR is 2.6%.
🟢 Bullish scenario: if it closes above $762.8, the next reference is the recent daily high (~$776.5).
🔴 Bearish scenario: if it loses the $743–748 zone, the low of the 20 4-hour candles (~$732.7) is the next level.
👀 What to watch: whether volume picks up again if there’s a third attempt at $762.8, and whether funding spikes (a sign of euphoria).
Will BNB hit $776 this week? Reply “YES” or “NO” 👇
#BNB #BNBChain #AnalisisTecnico #Cripto #Tra100d
⚠️ For informational and educational purposes only; this is not financial advice. Cryptocurrencies are volatile: do your own research and trade with caution.
76
·
--
🚨 $BTC touched $81,800 (a 20-candle 4-hour high) and was rejected; it’s approaching again: it’s now at ~$81,200, ~0.7% below that ceiling.
It’s already above the 4-hour EMA 20 (~$80,780) and EMA 50 (~$81,070); just below the ceiling sits the EMA 200 (~$81,760). Open interest +1%: leverage is gradually flowing back in.
Will it break $81,800 this week? Reply "YES" or "NO" 👇
#BTC #Bitcoin #Cripto #Tra100d
⚠️ For informational and educational purposes only; this is not financial advice. Cryptocurrencies are volatile: do your own research and trade with caution.
69
·
--
📚 Yesterday, $HAEDAL traded 40 times its normal volume. $BTC, just 0.8 times. What does that tell you?
🔍 The concept: relative volume compares a candle’s volume with the average of the previous 20.
• 1x = a normal day.
• More than 1.5–2x = there’s more interest than usual.
• Less than 1x = the market is watching, but not acting.
📊 Example using today’s data (Binance, closed candles):
• HAEDAL, daily: 40.3x → up +60% in 6 days. A move with massive participation.
• $PEPE , 4 h: 2.0x → its +16.8% rise comes with volume.
• $BNB, 4 h: 2.1x → hit the 20-candle high ($762.8) on double the volume.
• $BTC and $ETH, daily: 0.8x → below-normal days, with no conviction in either direction.
📌 Quick take:
• Price move + high volume = more participants behind the move.
• Price move + low volume = more likely to reverse.
❌ Common mistake: looking at the volume of a candle that hasn’t closed yet. Midway through the day, it always looks “low”; compare closed candles.
✅ In a nutshell: price tells you where the market is going; volume tells you how many people are going along with it.
Do you check volume before trading? Reply “YES” or “NO” 👇
#AnalisisTecnico #AprendeCripto #BTC #Trading #Tra100d
⚠️ For informational and educational purposes only; not financial advice. Cryptocurrencies are volatile: do your own research and trade with caution.
📚 Yesterday, $HAEDAL traded 40 times its normal volume. $BTC , just 0.8 times. What does that tell you?
🔍 The concept: relative volume compares a candle’s volume with the average of the previous 20.
• 1x = a normal day.
• More than 1.5–2x = there’s more interest than usual.
• Less than 1x = the market is watching, but not acting.
📊 Example using today’s data (Binance, closed candles):
• HAEDAL, daily: 40.3x → up +60% in 6 days. A move with massive participation.
• $PEPE , 4 h: 2.0x → its +16.8% rise comes with volume.
• $BNB, 4 h: 2.1x → hit the 20-candle high ($762.8) on double the volume.
• $BTC and $ETH, daily: 0.8x → below-normal days, with no conviction in either direction.
📌 Quick take:
• Price move + high volume = more participants behind the move.
• Price move + low volume = more likely to reverse.
❌ Common mistake: looking at the volume of a candle that hasn’t closed yet. Midway through the day, it always looks “low”; compare closed candles.
✅ In a nutshell: price tells you where the market is going; volume tells you how many people are going along with it.
Do you check volume before trading? Reply “YES” or “NO” 👇
#AnalisisTecnico #AprendeCripto #BTC #Trading #Tra100d
⚠️ For informational and educational purposes only; not financial advice. Cryptocurrencies are volatile: do your own research and trade with caution.
118
·
--
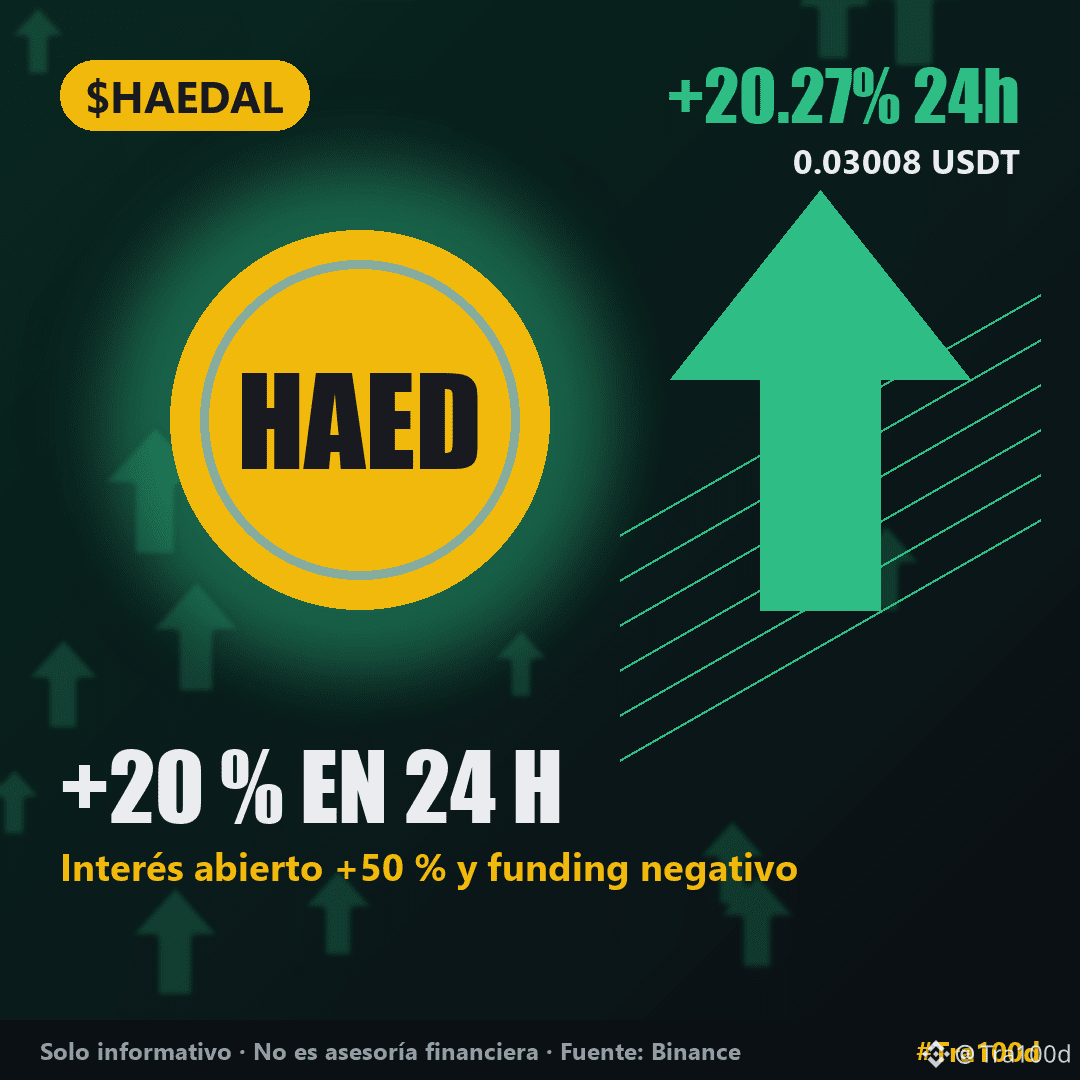
🗞️ +20% in one day, +60% in six… and yet many are betting it will fall.
1️⃣ $HAEDAL is the biggest gainer of the day: +20.3% (~$0.0301) with $27M in trading volume. Yesterday, its volume was 40 times its average daily volume.
2️⃣ Its open interest surged +50%, and funding is negative (−0.024%): lots of new positions are coming in, and shorts are paying longs. Daily RSI is at 82, in overbought territory.
3️⃣ The rest of the market is calm: $BTC +0.6% (~$80,780), $BNB +1.6% (~$754), and ENA is the biggest loser (−3.6%). The Fear and Greed Index rose from 48 to 51: neutral.
Why does it matter? When price and open interest rise at the same time while funding is negative, buyers and bears are locked in a tug-of-war. If shorts have to close their positions, they could push the price higher; if the rally runs out of steam, the drop could be just as fast (its 4-hour ATR is 8.6%). (Our data shows no confirmed news that explains the move.)
Who will win this battle? Reply "LONGS" or "SHORTS" 👇
#HAEDAL #Altcoins #BNB #Cripto #Tra100d
⚠️ For informational and educational purposes only; not financial advice. Cryptocurrencies are volatile: do your own research and trade with caution.
124
·
--
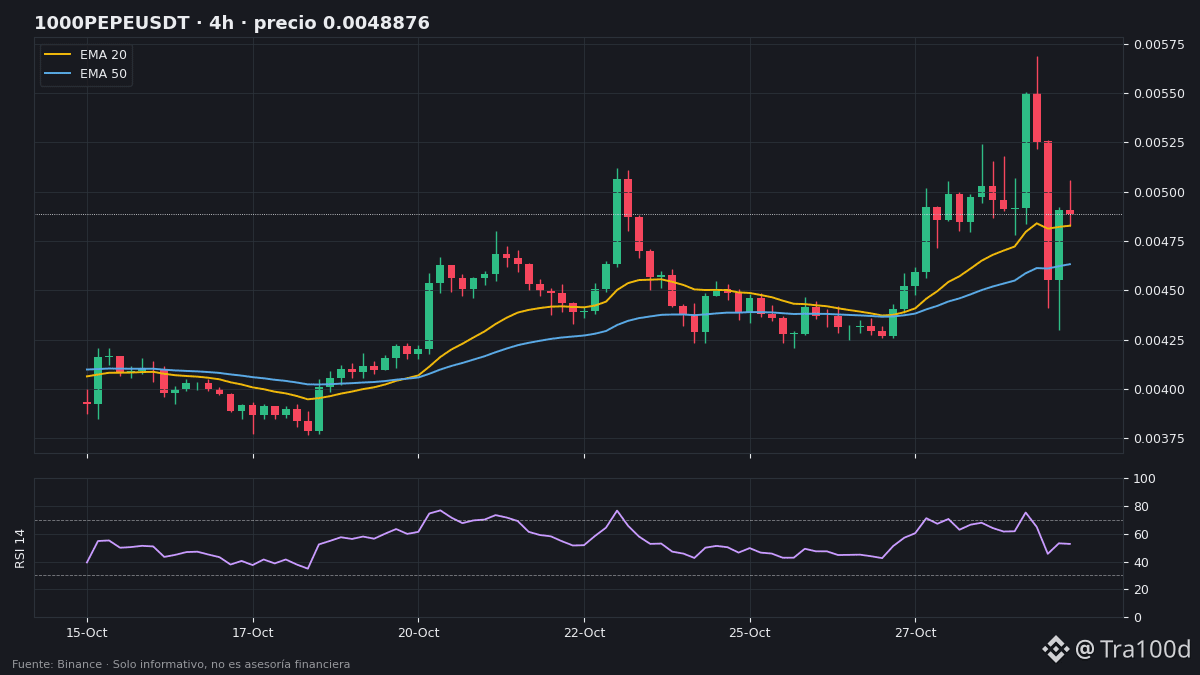
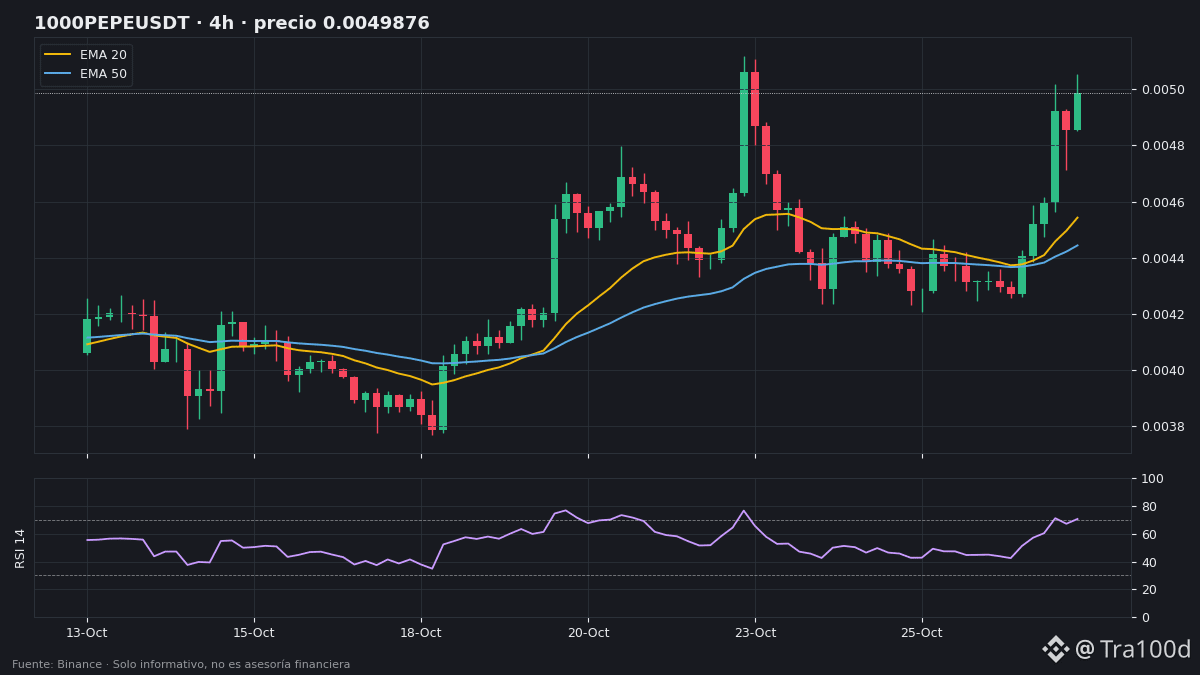
🐸 The frog has woken up: $PEPE is up +12.7% in 24 hours and is by far the strongest meme coin of the day.
📊 The data (Binance, 08:40):
• Spot price: ~$0.00000489, with $83M traded—more than double $DOGE ($36M, +2%).
• Over 4 hours: +16.8% across the last 6 candles, a strong uptrend, and the latest candle had 2 times the average volume.
• 4-hour RSI at 71: in overbought territory.
• Open interest +13.9% and funding +0.026%, the highest among the meme coins we track: new positions are coming in, and longs are paying to stay in.
• The 20-candle, 4-hour high is around $0.00000506, about 3.5% away.
⚠️ Heads up: its daily ATR is 7.5%. When a rally comes with overbought conditions and longs paying funding, sharp pullbacks are normal too.
Question for the PEPE community 🐸: Will it break above $0.00000506 this week? Reply only “YES” or “NO” 👇
#PEPE #Memecoins #DOGE #Cripto #Tra100d
⚠️ For informational and educational purposes only; this is not financial advice. Cryptocurrencies are volatile: do your own research and trade with caution.
73
·
--
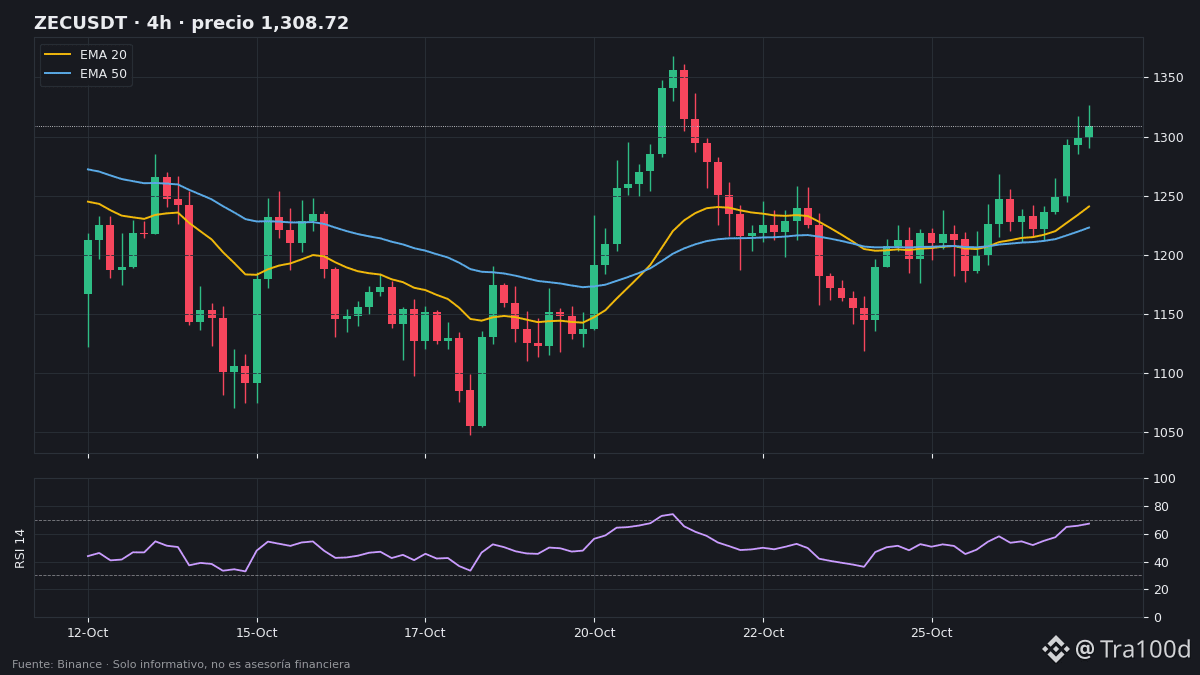
📈 $ZEC is up +6.2% over the last 6 4-hour candles: it broke above the EMA 200 and the morning range ceiling ($1.268).
📊 Context (Binance, 4 h):
• Price: ~$1.300–$1.309.
• Above the EMA 20 (~$1.241), EMA 50 (~$1.223), and EMA 200 (~$1.260), which is now the first support level.
• 20-candle high: $1.326,55, about 1.4% away.
• RSI at 67: approaching overbought territory (70).
• Relative volume 0.63: the rally is happening on lower volume than average.
• Open interest +7.4% and funding nearly neutral (+0.002%): positions are opening without euphoria.
• The daily trend remains strongly bullish (daily EMA 200 ~ $814) and daily ATR is 8.7%.
🟢 Bullish scenario: a break above $1.326,55 with volume, with the 20-day high (~$1.368) as the next reference point.
🔴 Bearish scenario: if RSI moves above 70 without volume and price loses the EMA 200 (~$1.260), a return to the EMA 20 (~$1.241).
👀 What to watch: volume on the next breakout and whether funding spikes as the price rises (a sign of euphoria).
Will ZEC break above $1.368 this week? Reply "YES" or "NO" 👇
#ZEC #Zcash #AnalisisTecnico #Cripto #Tra100d
⚠️ For informational and educational purposes only; this is not financial advice. Cryptocurrencies are volatile: do your own research and trade with caution.
112
·
--
🚨 $BTC is back above $80,000 (~$80,870) and has reclaimed the 4-hour EMA 20 (~$80,470). The 20-candle low held at $79,322.
Now resistance is close: EMA 50 (~$81,050) and the 20-candle high ($81,271). The 4-hour RSI is at 54 and open interest is down 0.8%: the rebound isn’t driven by new leverage.
Will it reclaim $81,300 this week? Reply “YES” or “NO” 👇
#BTC #Bitcoin #Cripto #Tra100d
⚠️ For informational and educational purposes only; this is not financial advice. Cryptocurrencies are volatile: do your own research and trade with caution.
60
·
--
📚 BTC, ETH, and SOL are in a “strong downtrend” today… and in an “uptrend” at the same time. Neither one is wrong.
🔍 The concept: each time frame (4 h, daily, weekly) tells a different story. The 4 h chart shows what happened over the last few days; the daily chart shows what happened over the last few months.
📊 Example using today’s data (Binance):
• $BTC on the 4 h chart: ~$79,800, below its 20, 50, and 200 EMAs ($80,430 / $81,140 / $81,750) → strong downtrend.
• $BTC on the daily chart: well above its daily 200 EMA (~$74,230) → the broader trend is still bullish/ranging.
• $ETH: same story. Bearish on the 4 h chart, but still above its 200 EMA on the daily chart (~$2,226).
• $SOL: bearish on the 4 h chart; above its 200 EMA on the daily chart (~$93).
📌 Quick read:
• The higher time frame sets the broader direction.
• The lower time frame shows the current momentum (whether there’s pressure right now).
• When they contradict each other, it’s usually a correction within a larger trend… until the higher time frame changes too.
❌ Common mistake: looking only at the 15-minute or 1-hour chart and thinking “the market is crashing,” or looking only at the daily chart and ignoring short-term selling pressure.
✅ In one line: look at the daily chart first to see where you are, then the 4 h chart to know when.
Which time frame do you look at first? Reply “4H” or “DAILY” 👇
#AnalisisTecnico #AprendeCripto #BTC #Trading #Tra100d
⚠️ For informational and educational purposes only; this is not financial advice. Cryptocurrencies are volatile: do your own research and trade with caution.
75
·
--
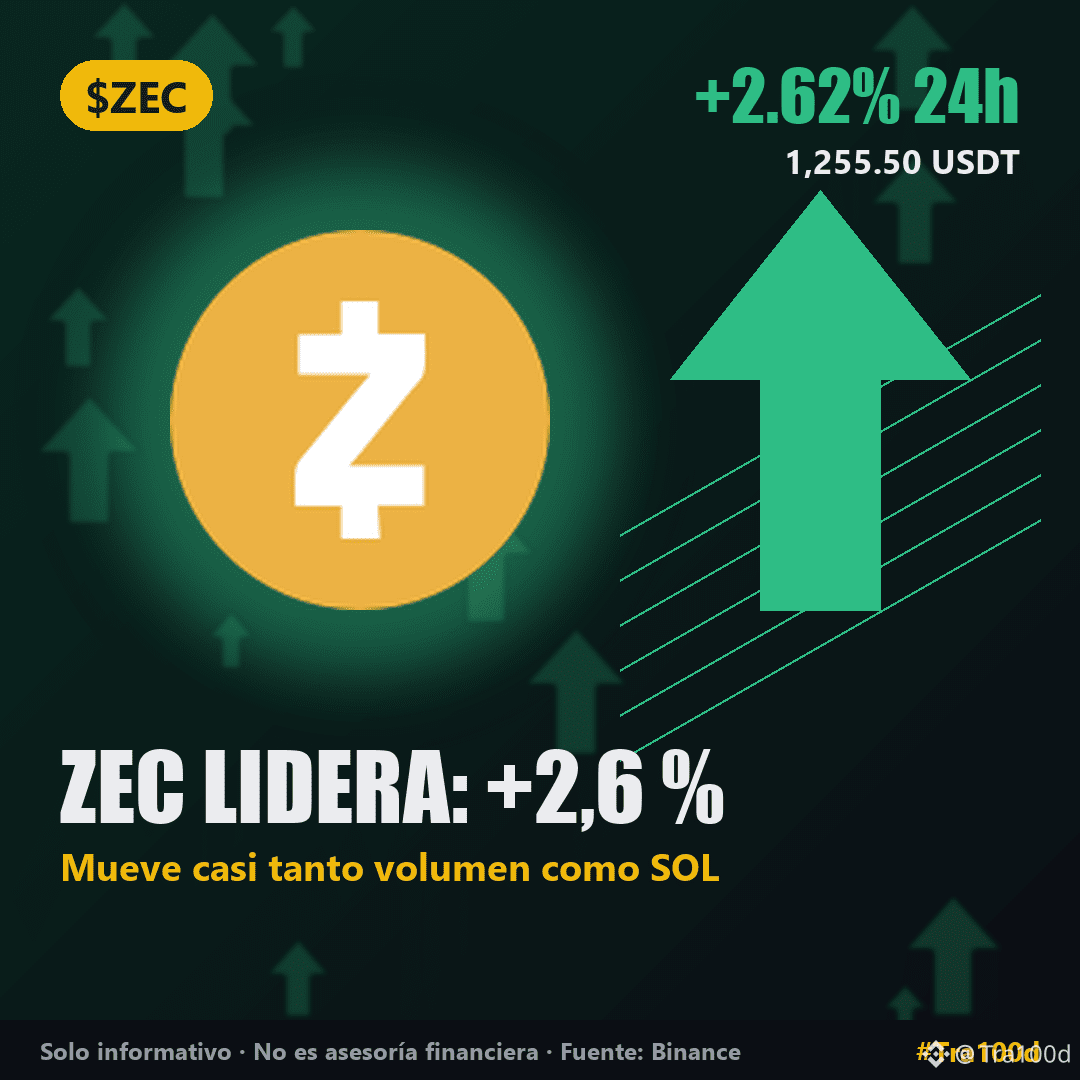
🗞️ Tuesday is slightly in the red… and a privacy coin is moving almost as much money as Solana.
1️⃣ $ZEC is the biggest gainer of the day: +2.6% (~$1,255) with $162M traded, practically the same as $SOL ($163M), which is down 1% and is battling to hold $100.
2️⃣ $QNT gives back some of yesterday’s +20%: −3.6% (~$204). Its open interest is up +8.4% and funding is negative (−0.02%): new positions are coming in, many betting on a decline.
3️⃣ BTC (−0.4%, ~$79,900) and ETH (−0.4%, ~$2,316) remain weak. The Fear and Greed Index falls from 50 to 48: neutral, but leaning toward fear.
Why does it matter? When a mid-cap coin sees the same trading volume as a top-10 coin, it’s on the market’s radar. And QNT shows the other side: after a sharp rise, traders start betting on a correction. (Our data has no confirmed news explaining either move.)
Which one will you be watching today? Reply “ZEC” or “QNT” 👇
#ZEC #SOL #QNT #Altcoins #Tra100d
⚠️ For informational and educational purposes only; this is not financial advice. Cryptocurrencies are volatile: do your own research and trade with caution.
197
·
--
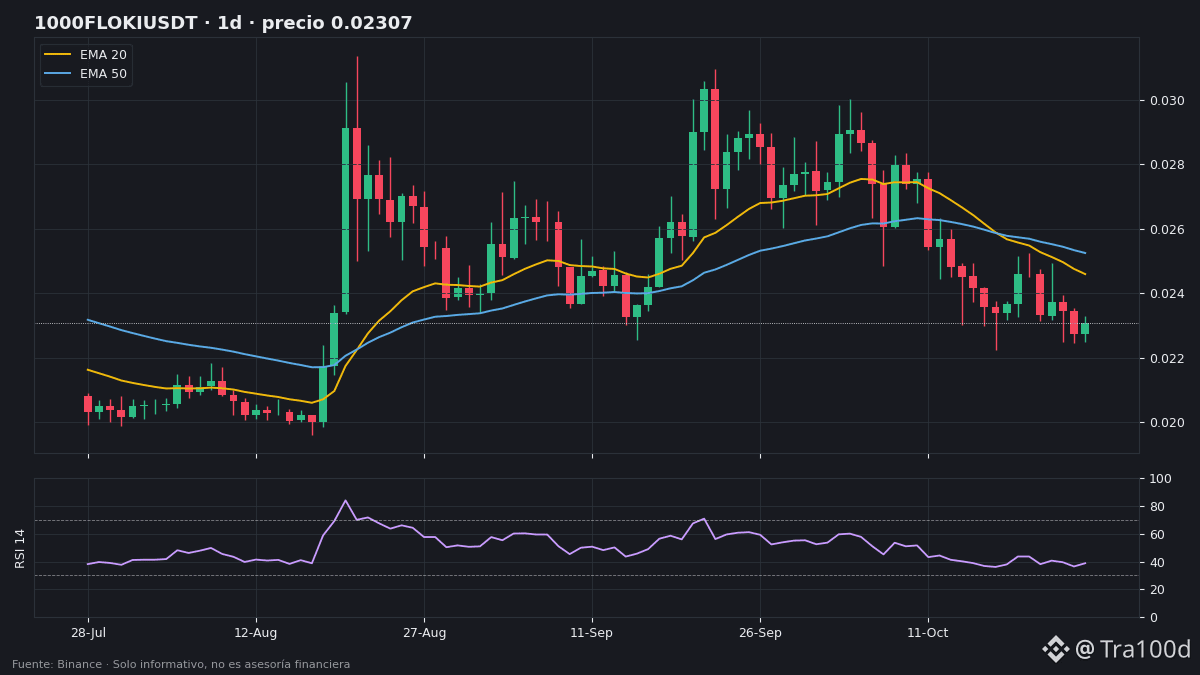
🐕🦺 Of the 6 memes we follow, only one has shorts paying: $FLOKI .
📊 The data (Binance, 07:14):
• Spot price: ~0.0000227 $ (−0.1 % in 24 h), with 0.7 M$ traded.
• Funding −0.003 %: it is the only meme in negative territory (DOGE, PEPE, SHIB, BONK and WIF are positive).
• Open interest +3.5 %: new positions are coming in while funding is negative → bearish bets are piling up.
• Strong daily downtrend: price below its 20, 50 and 200 EMA. Daily RSI at 39.
• It is down −6.2 % in 6 days and is ~2 % above the 20-day low (~0.0000222 $).
⚠️ Note: its daily ATR is 6.6 %. For FLOKI, moving ±6–7 % in a day is normal, in both directions. And when many shorts pile up, sharp moves can go either way.
Question for the Viking pack 🛡️: Will FLOKI hold the 20-day low this week? Reply only "YES" or "NO" 👇
#floki #Memecoins #DOGE #Cripto #Tra100d
⚠️ Informational and educational content only, not financial advice. Cryptocurrencies are volatile: do your own research and trade with caution.
61
·
--
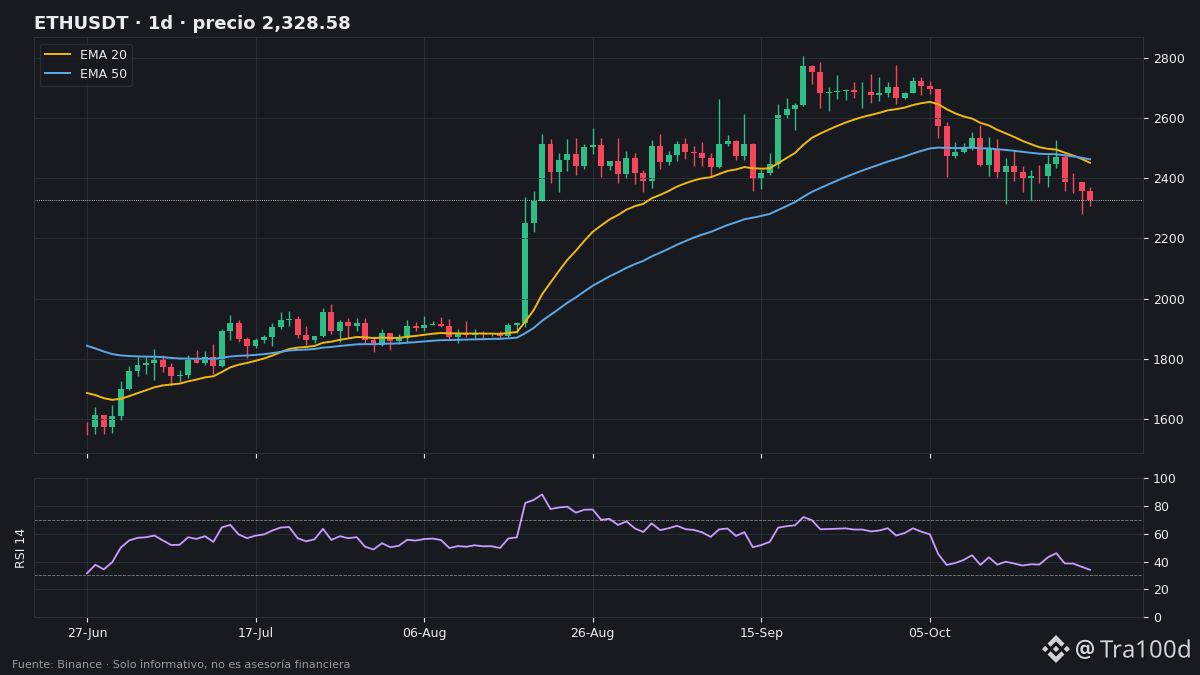
📉 $ETH is down 3.3% over 6 days, and its daily RSI has fallen to 34, near the oversold zone (30).
📊 Context (Binance, daily):
• Price: ~$2,330.
• Below the 20 EMA (~$2,452) and the 50 EMA (~$2,463), but still above the 200 EMA (~$2,224), the key long-term trend line.
• 20-day range: $2,281–$2,725. The price is ~2% from the bottom.
• Daily ATR: $94 (4%). A move of ±$94 in a day is typical.
• Open interest +2% and funding +0.006%: positions are coming in, but there’s no euphoria.
🟢 Bullish scenario: a bounce from the $2,281 zone and a daily close back above the 20 EMA (~$2,452).
🔴 Bearish scenario: a daily close below $2,281 opens the door toward the 200 EMA (~$2,224).
👀 What to watch: whether the RSI breaks below 30 and whether $2,281 holds on a daily close.
Where do you see ETH on Friday? Reply “2,200” or “2,450” 👇
#ETH #Ethereum #AnalisisTecnico #Cripto #Tra100d
⚠️ For informational and educational purposes only; this is not financial advice. Cryptocurrencies are volatile: do your own research and trade with caution.
66
·
--
🚨 $BTC at ~$80,330, just 1.4% above the low of the last 20 4-hour candles: $79,179.
On the 4-hour chart, it’s below its 20, 50, and 200 EMAs ($80,750 / $81,440 / $82,070), and the RSI is at 38. The first resistance level to reclaim is the 20 EMA (~$80,750).
Will $79,000 hold today? Reply “YES” or “NO” 👇
#BTC #Bitcoin #Cripto #Tra100d
⚠️ For informational and educational purposes only; this is not financial advice. Cryptocurrencies are volatile: do your own research and trade with caution.
120
·
--
📚 Two coins went up today. One had new money behind it and the other didn’t. How can you tell? By looking at open interest.
🔍 The concept: open interest (OI) is the number of futures contracts that are still open. If it rises, new positions are being opened; if it falls, positions are being closed.
📊 Example using today’s data (Binance):
• $ENA : price +6.8% and OI +12.3% → new money is coming in alongside the rise.
• $QNT : price +20.5% and OI −7.5% → the rise coincides with positions being closed (shorts covering or people taking profits).
• $WLD : price −1.7%, OI +5.9% and negative funding (−0.014%) → positions are being opened as the price falls, with shorts paying.
📌 Quick guide:
• Price ↑ + OI ↑ → a trend with fresh fuel.
• Price ↑ + OI ↓ → a rise driven by positions closing; it may lose momentum once they run out.
• Price ↓ + OI ↑ → bets are building up, often short positions.
❌ Common mistake: thinking high OI = bullish. OI doesn’t indicate direction, only how many people are betting. You need to look at it alongside price and funding.
✅ In a nutshell: price tells you what happened; open interest tells you whether there’s new money behind it.
Did you already check open interest before trading? Reply “YES” or “NO” 👇
#Futuros #InteresAbierto #AprendeCripto #Trading #Tra100d
⚠️ For informational and educational purposes only; this is not financial advice. Cryptocurrencies are volatile: do your own research and trade with caution.
1
185
·
--
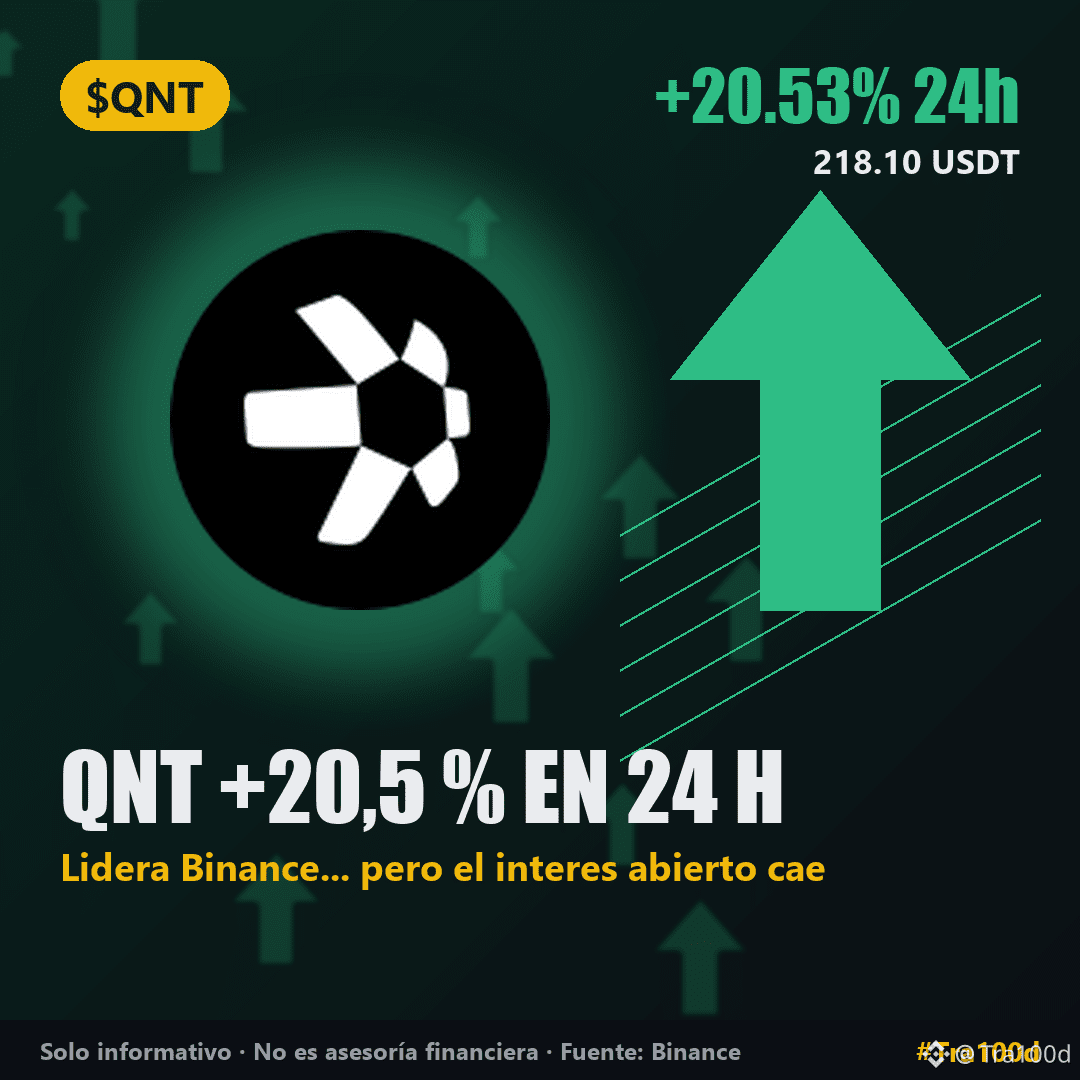
🗞️ A quiet Monday for the majors… except for one coin that surged +20%.
1️⃣ $QNT is the biggest gainer of the day: +20.5% (~$218) on $23.1M in trading volume. Curiously, its futures open interest **fell** by 7.5%. The price is rising, but positions are being closed.
2️⃣ $ENA is up +6.8% (~$0.205) on $42M in volume, and its open interest grew by +12.3%: here, new money is indeed flowing into futures.
3️⃣ BTC (−0.07%, ~$80,360) and ETH (−0.02%, ~$2,331) are practically unchanged. The Fear and Greed Index fell from 54 to 50: firmly neutral.
Why does it matter? Two gains, two different stories. When the price rises while open interest falls, it usually means short positions are being closed or profits are being taken; when both rise, new positions are behind the move. (Our data shows no confirmed news explaining QNT's jump.)
Which of the two gains seems more solid to you? Reply "QNT" or "ENA" 👇
#QNT #ENA #Altcoins #Cripto #Tra100d
⚠️ For informational and educational purposes only; this is not financial advice. Cryptocurrencies are volatile: do your research and trade with caution.
102
·
--
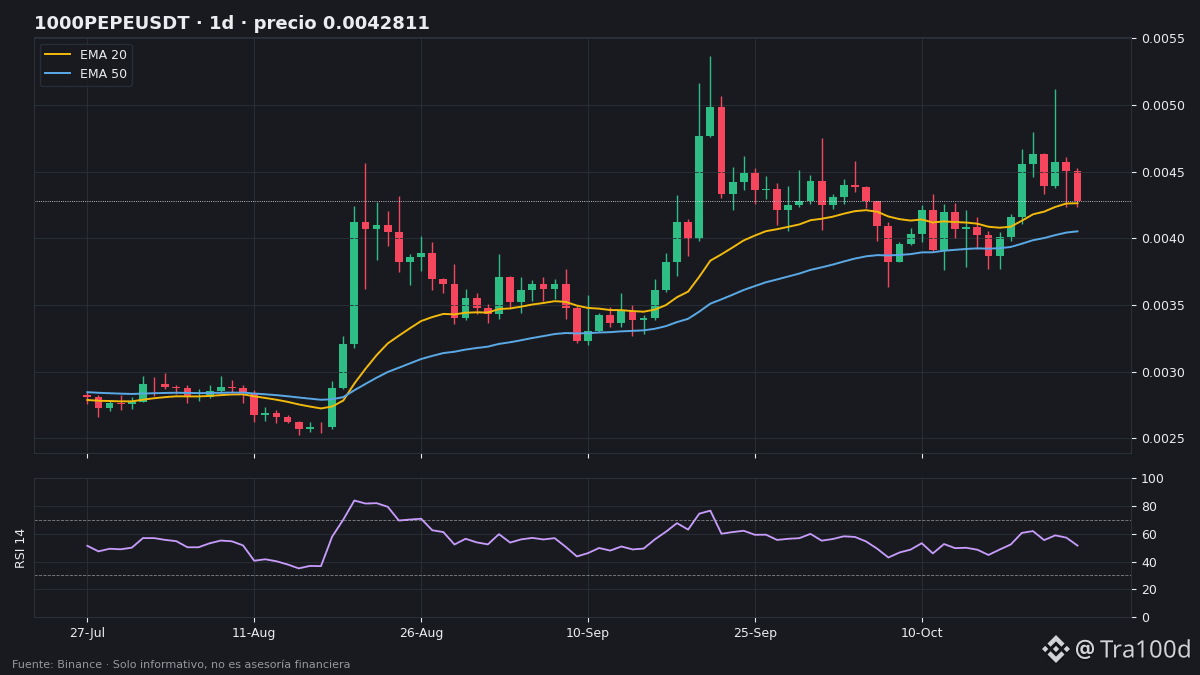
🐸 Today the frog is moving more money than the dog: $PEPE traded $24.8M in spot volume, beating $DOGE ($22.5M).
📊 The data (Binance, 08:40):
• Spot price: ~$0.00000435 (−2.2% in 24 hours).
• It’s the only one of the 6 meme coins we track with a bullish daily trend: the price remains above its daily 20, 50, and 200 EMAs.
• DOGE, SHIB, BONK, and FLOKI are in a strong downtrend; WIF is down 10.9% in 6 days.
• Daily RSI at 53: neither overbought nor oversold.
• Funding at +0.01% and open interest down 2.2%: some traders are closing positions, not opening new ones.
• 20-day high: ~$0.00000512 (≈18% above the current price).
⚠️ Keep in mind: its daily ATR is 7.9%. A move of ±8% in a day is normal for PEPE, in either direction.
Quick question for the frog community 🐸: Will PEPE return to its 20-day high this month? Reply only “YES” or “NO” 👇
#PEPE #Memecoins #DOGE #Cripto #Tra100d
⚠️ For informational and educational purposes only; not financial advice. Cryptocurrencies are volatile: do your research and trade with caution.
69
·
--
🚨 $ETH falls −0.9% (~$2,335), putting it ~2.3% above the 20-day low of $2,281.
Daily RSI is at 34, and open interest is up +1.2% while the price falls → new leveraged positions are entering near support.
If it loses $2,281, the next key level is the 200-day EMA (~$2,224).
Will $2,281 hold this week? Yes or no 👇
#Ethereum #ETH #Cripto #Tra100d
⚠️ For informational and educational purposes only; this is not financial advice. Cryptocurrencies are volatile: do your own research and trade with caution.
475
Log in to explore more content
Join global crypto users on Binance Square
⚡️ Get latest and useful information about crypto.
💬 Trusted by the world’s largest crypto exchange.
👍 Discover real insights from verified creators.
Email / Phone number
Trending Topics
1
#UniswapA16zSeekDeFiExemptionFromIllinoisCryptoTax
4,152 views
295 Discussing
2
#HKDollarStablecoinHKDAPToLaunchOnSolana
1,394 views
145 Discussing
3
#$1.5BInLeveragedCryptoBetsLiquidated
14,949 views
182 Discussing
4
#TrezorSaysCryptoBilisSoldWalletMayContainMaliciousComponents
445 views
31 Discussing
5
#KOSPIFalls3.53%BackBelow6000
38,814 views
827 Discussing
6
#AmazonSharesFallAbout7%InPremarketTrading
14,766 views
415 Discussing
7
#USMidtermElections
177,626 views
2,074 Discussing
8
#StrategySTRCReaches$99.95ForFirstTimeIn165Days
7,810 views
90 Discussing
9
#BinanceWillListPredictPREDICT
60,461 views
1,160 Discussing
10
#SwitzerlandFirstSpotBitcoinETFExpectedToTradeInNovember
1,948 views
96 Discussing