rsi:

41,802 views
92 Discussing
Dacia Phanthanouvon uYTV
·
--
Bullish
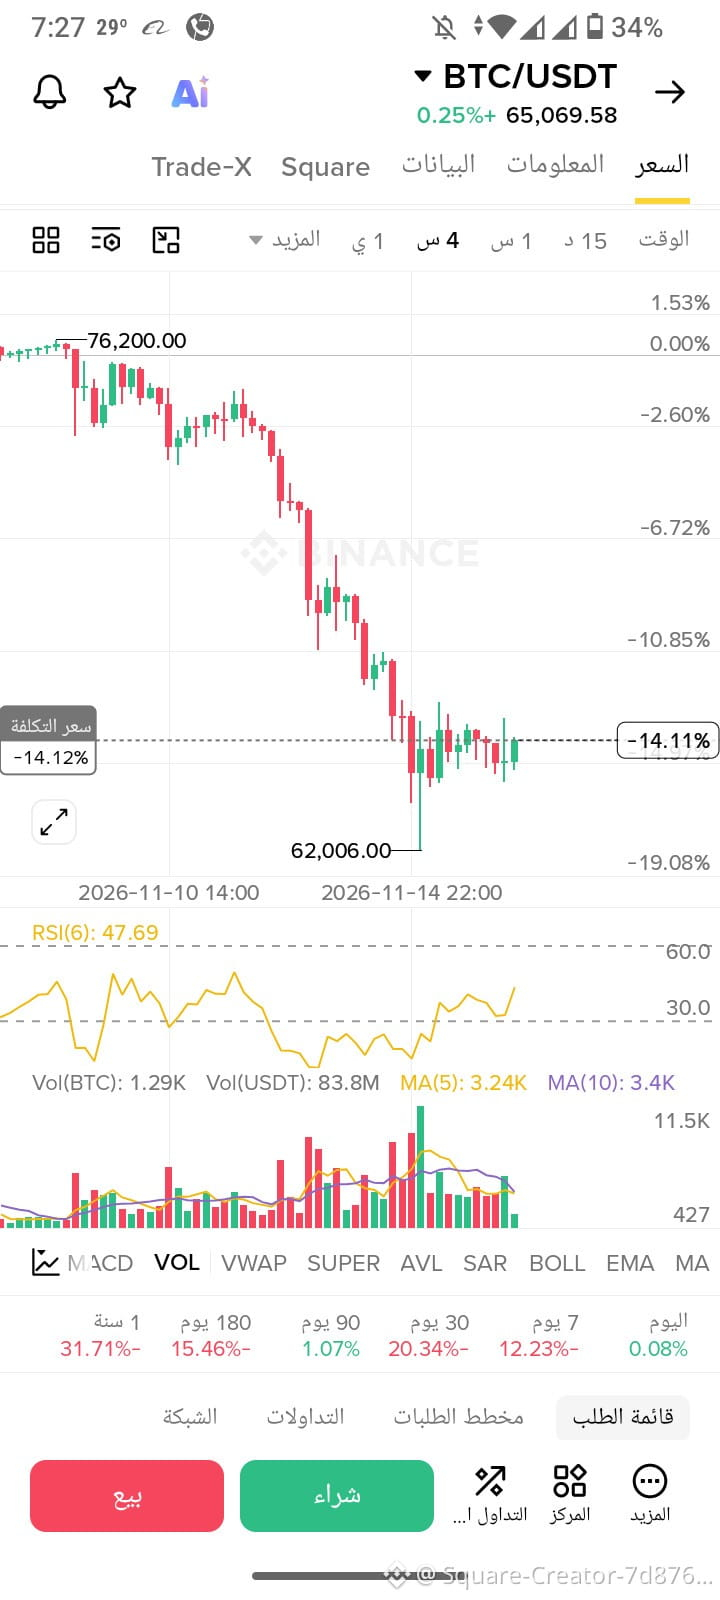
📊 Do you know when a coin is in the overbought or oversold zone? There’s an important indicator traders use called RSI. 🔹 RSI above 70: The coin may be in the overbought zone, and its price could fall. 🔹 RSI below 30: The coin may be in the oversold zone, and a rebound could occur. For example, coin $BTC currently has an RSI above 45. But be careful! These levels don’t mean the price will reverse immediately; it may continue to rise or fall. Don’t rely on RSI alone. Use it alongside trend, support, and resistance analysis. Buy coin $BTC and see how much it reaches tomorrow. Note: This is not financial advice. I am not your money manager; I’m just alerting you to this coin, which is about to rebound. A question for you: If you found a coin with an RSI of 25, would you buy immediately or wait for confirmation of a rebound? #cryptoeducation #RSI: #trading
📊 Do you know when a coin is in the overbought or oversold zone?

There’s an important indicator traders use called RSI.
🔹 RSI above 70: The coin may be in the overbought zone, and its price could fall.
🔹 RSI below 30: The coin may be in the oversold zone, and a rebound could occur.
For example, coin $BTC currently has an RSI above 45.
But be careful! These levels don’t mean the price will reverse immediately; it may continue to rise or fall.

Don’t rely on RSI alone. Use it alongside trend, support, and resistance analysis.
Buy coin $BTC and see how much it reaches tomorrow.
Note: This is not financial advice. I am not your money manager; I’m just alerting you to this coin, which is about to rebound.
A question for you:
If you found a coin with an RSI of 25, would you buy immediately or wait for confirmation of a rebound?

#cryptoeducation #RSI: #trading
💹 Best Indicators for Crypto Trading on TradingView The Relative Strength Index (RSI) is widely considered the best foundational and most popular indicator for crypto trading on 🔎💴💴 Because cryptocurrencies experience high velocity and price fluctuations, single indicators can generate false signals. Professional traders combine momentum, volume, and trend tools on TradingView for confirmation. 17 TradingView +2 $BTC $AAPLB #TradingViewTips #RSI: {spot}(BTCUSDT)
💹 Best Indicators for Crypto Trading on TradingView

The Relative Strength Index (RSI) is widely considered the best foundational and most popular indicator for crypto trading on

🔎💴💴
Because cryptocurrencies experience high velocity and price fluctuations, single indicators can generate false signals. Professional traders combine momentum, volume, and trend tools on TradingView for

confirmation. 17 TradingView +2
$BTC $AAPLB #TradingViewTips #RSI:
Vlad_strategy
·
--
Trading tactics for those who don’t want to get too deep into trading 🙏
BlockchainBaller
·
--
relatable $AGT l $ZEC l $IDOL holders ‼️❓🥹
·
--
Bearish
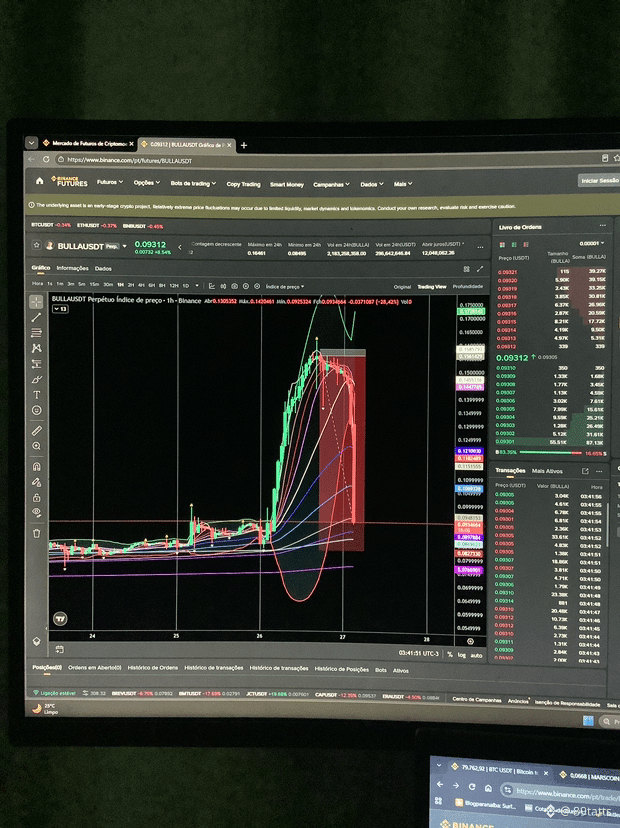
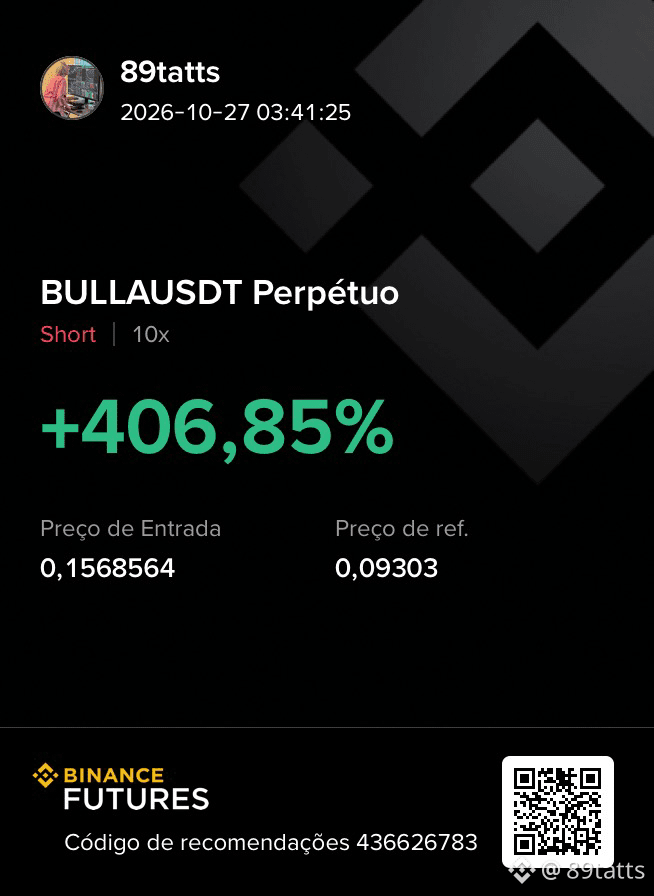
A big short on $BULLA , a coin that reached 60 cents at the beginning of the year. There was a large influx of long positions for two days, while sellers made a major whale sell-off, potentially bringing it down to 6 cents in less than an hour. The crypto market is no joke. $BTC $ZEC #short #short #BinancePick #liquidate #RSI:
A big short on $BULLA , a coin that reached 60 cents at the beginning of the year.
There was a large influx of long positions for two days, while sellers made a major whale sell-off, potentially bringing it down to 6 cents in less than an hour.

The crypto market is no joke.

$BTC $ZEC
#short #short #BinancePick #liquidate #RSI:
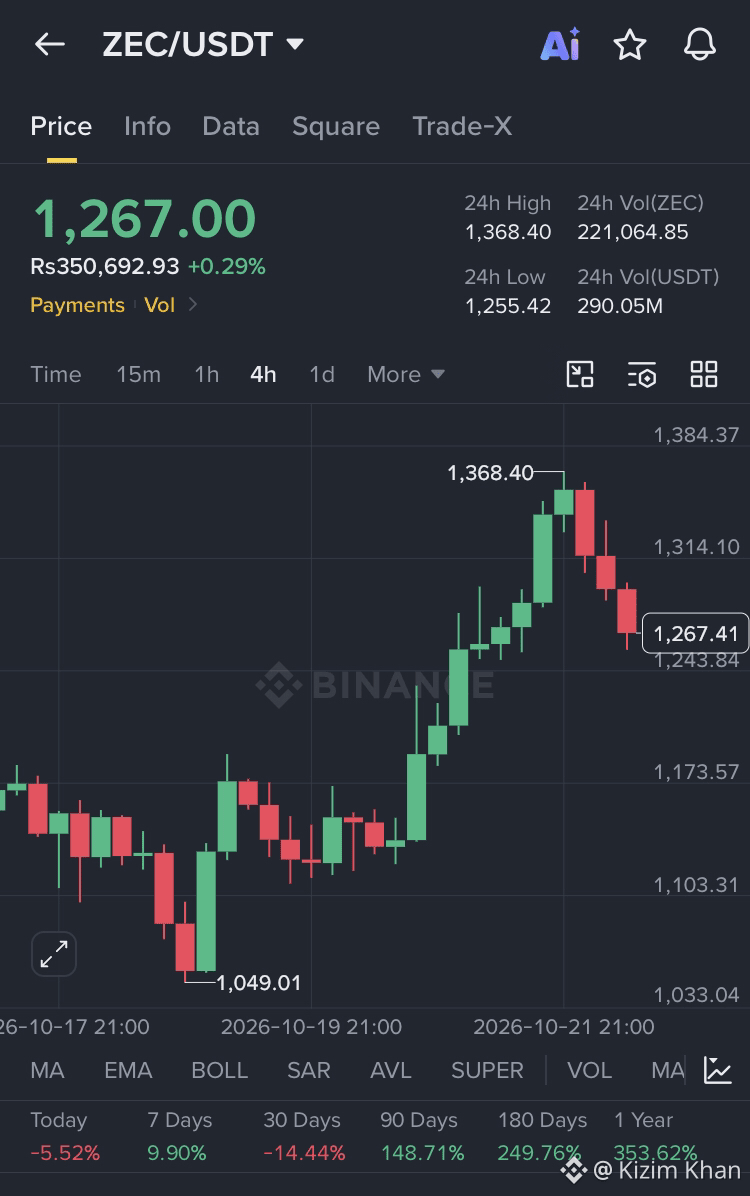
Bullish RSI Divergence Explained in 30 Seconds 📈 Price makes a lower low but RSI makes a higher low. That’s divergence. It means selling pressure is weakening even though price keeps dropping. Often leads to a reversal. I spotted this on ZEC today on the 4H chart. Price dropped to new lows, RSI didn’t. Then boom — bounce started. Key rule: Don’t blindly buy divergence. Wait for confirmation like a break above resistance or volume spike. Have you spotted this pattern before? Drop your chart in comments 👇 #cryptoeducation #RSI: #TechnicalAnalysiss #TradingTips" #BinanceSquare
Bullish RSI Divergence Explained in 30 Seconds 📈

Price makes a lower low but RSI makes a higher low. That’s divergence.

It means selling pressure is weakening even though price keeps dropping. Often leads to a reversal.

I spotted this on ZEC today on the 4H chart. Price dropped to new lows, RSI didn’t. Then boom — bounce started.

Key rule: Don’t blindly buy divergence. Wait for confirmation like a break above resistance or volume spike.

Have you spotted this pattern before? Drop your chart in comments 👇

#cryptoeducation #RSI: #TechnicalAnalysiss #TradingTips" #BinanceSquare
·
--
Relative Strength Index (RSI).. Your compass in the chaos 🧭Are you entering trades randomly? Try keeping an eye on the RSI indicator. If the indicator exceeds the 70 line: the market is in a "buying frenzy" and the price may drop soon. If it drops below the 30 line: the market is in a "selling frenzy" and there could be a bounce opportunity. Don't rely on it alone, but it's an excellent tool to confirm your decisions. #TechnicalAnalysis

Relative Strength Index (RSI).. Your compass in the chaos 🧭

Are you entering trades randomly? Try keeping an eye on the RSI indicator.
If the indicator exceeds the 70 line: the market is in a "buying frenzy" and the price may drop soon.
If it drops below the 30 line: the market is in a "selling frenzy" and there could be a bounce opportunity.
Don't rely on it alone, but it's an excellent tool to confirm your decisions.
#TechnicalAnalysis
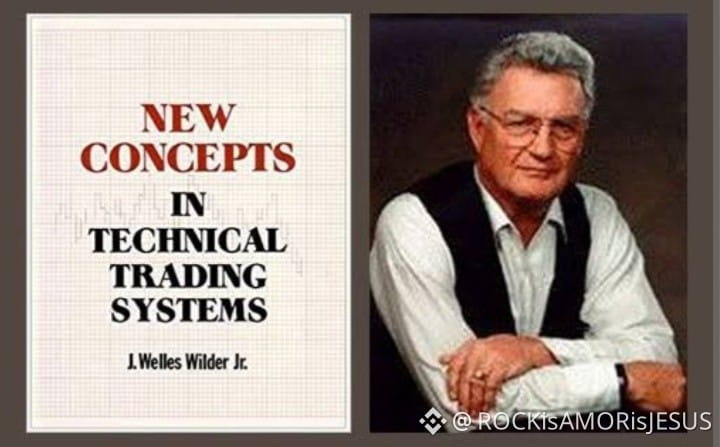
IF YOU ARE A TRADER, YOU MUST KNOW SUCH A PERSONALITY, THE DESIGNER OF ALMOST ALL THE INDICATORS USED FOR ANALYSIS.#BNBToken J.WELLES WiILDER Jr. Creator of the RSI (Relative Strength Index) and its derivatives; ADX, Parabolic SAR, and ATR Born on June 11, 1935, in Norris, Tennessee, USA. Former Navy mechanic; Wilder would later pursue a career as a mechanical engineer. After a few years devoted to trading commodities, Wilder focused his efforts on the study of technical analysis. In 1978, he published New Concepts in Technical Trading Systems. This work marked the debut of his new momentum oscillator, the Relative Strength Index, better known as RSI.I#ADX #RSI: #ATRIndicator
IF YOU ARE A TRADER, YOU MUST KNOW SUCH A PERSONALITY, THE DESIGNER OF ALMOST ALL THE INDICATORS USED FOR ANALYSIS.#BNBToken
J.WELLES WiILDER Jr.
Creator of the RSI (Relative Strength Index) and its derivatives; ADX, Parabolic SAR, and ATR
Born on June 11, 1935, in Norris, Tennessee, USA.
Former Navy mechanic; Wilder would later pursue a career as a mechanical engineer.
After a few years devoted to trading commodities, Wilder focused his efforts on the study of technical analysis.
In 1978, he published New Concepts in Technical Trading Systems. This work marked the debut of his new momentum oscillator, the Relative Strength Index, better known as RSI.I#ADX #RSI: #ATRIndicator
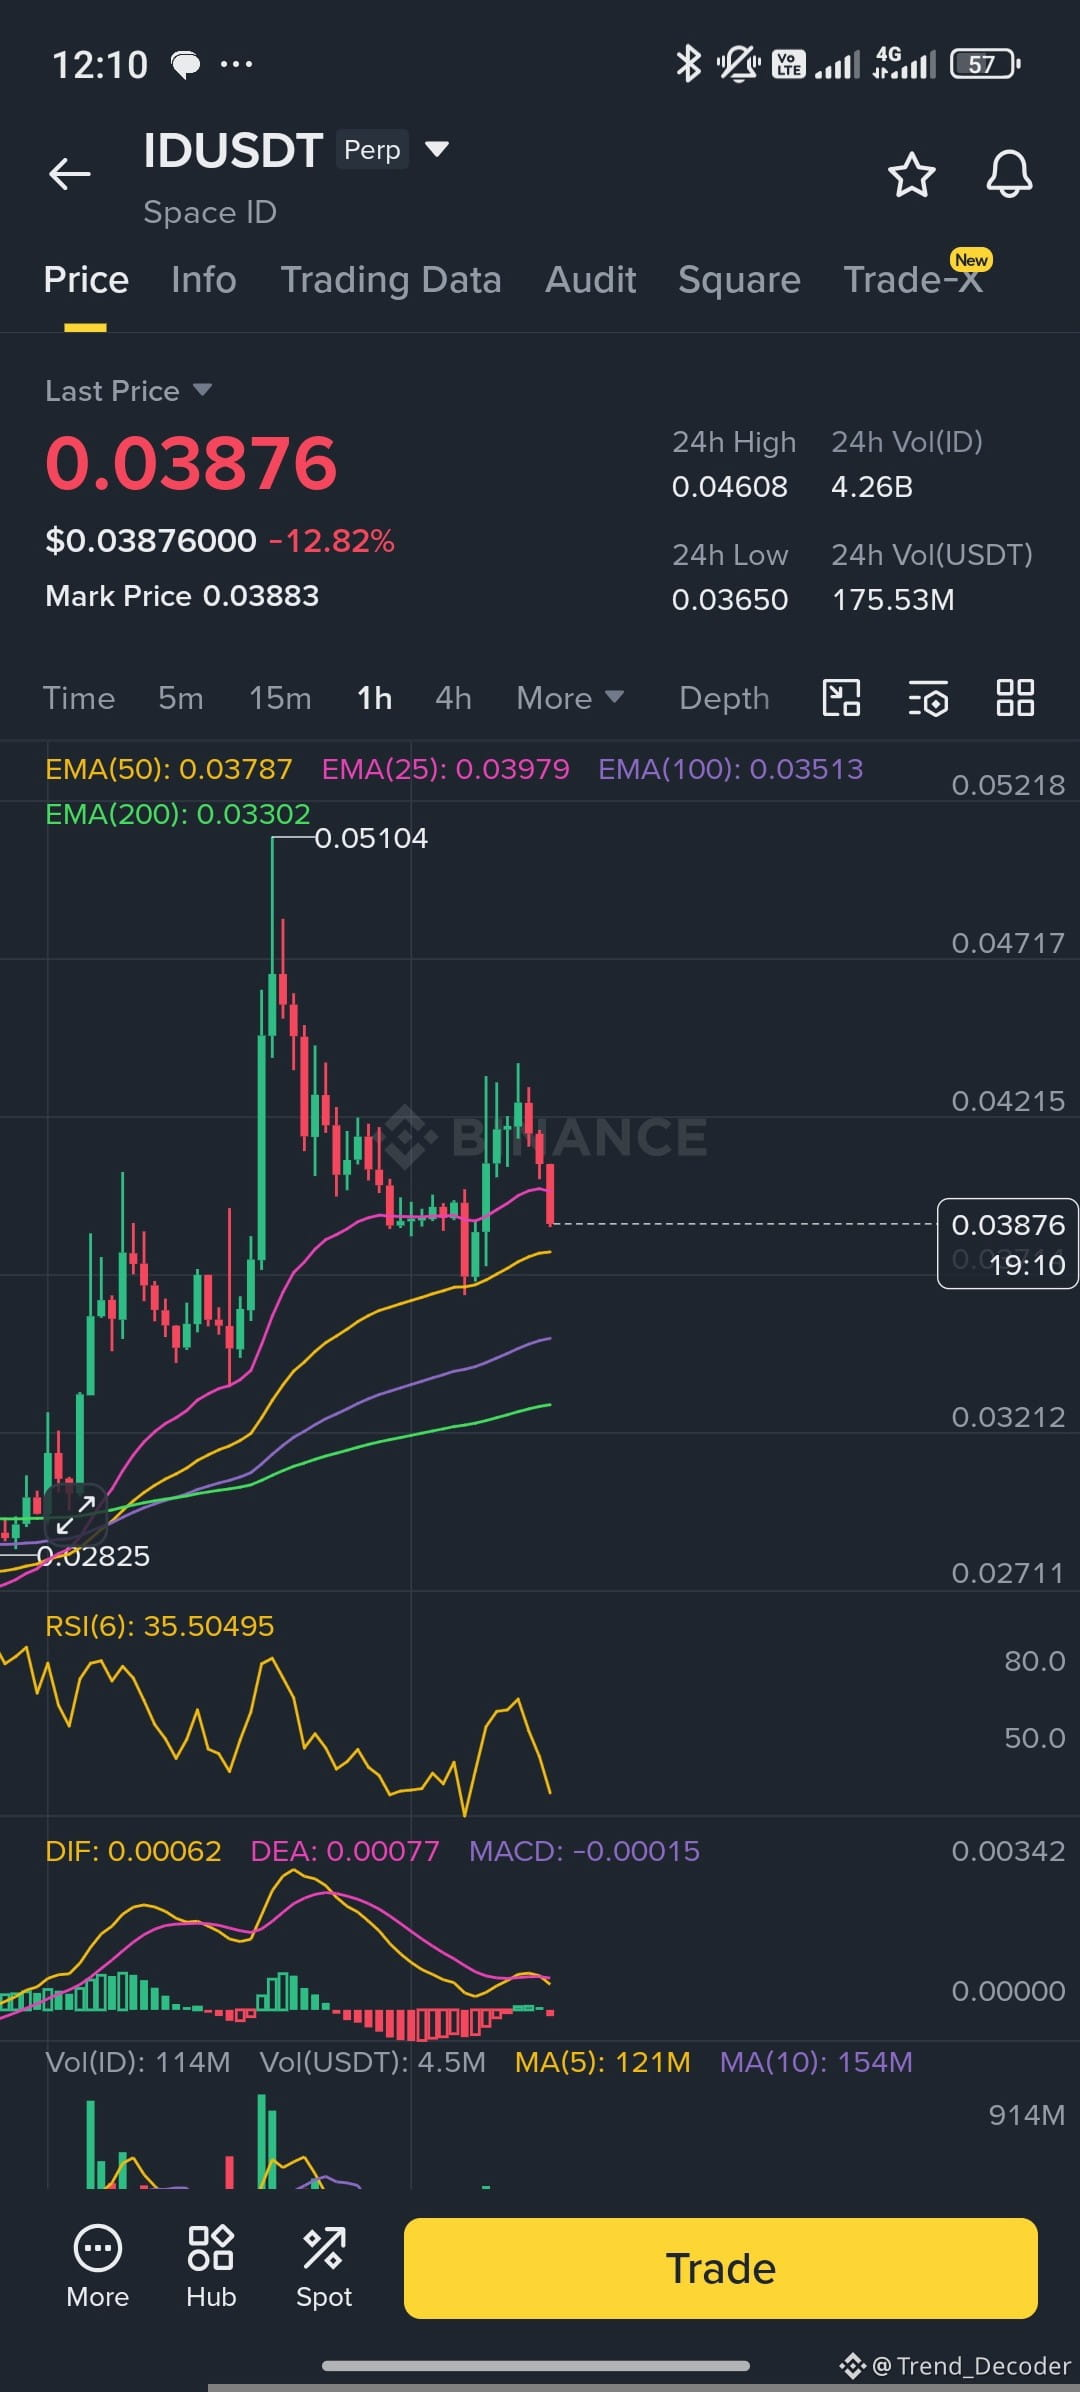
​📉 $ID Market Check-In ​Space ID ($ID) is currently pulling back, sitting at 0.03876 (down roughly -12.82%). ​After that aggressive parabolic push up to 0.05104, we're seeing some healthy cooling off on the 1-hour chart. The price is currently testing the #ema (50) around 0.03787 for support. Meanwhile, the #RSI: (6) is sitting at 35.5, inching closer to that oversold territory. ​Are the bulls going to step up and defend this EMA level, or are we heading lower to test the 0.035 macro support? 👀👇 ​#idusdt #SpaceID #CryptoTrading #Binance #altcoins
​📉 $ID Market Check-In

​Space ID ($ID ) is currently pulling back, sitting at 0.03876 (down roughly -12.82%).
​After that aggressive parabolic push up to 0.05104, we're seeing some healthy cooling off on the 1-hour chart. The price is currently testing the #ema (50) around 0.03787 for support. Meanwhile, the #RSI: (6) is sitting at 35.5, inching closer to that oversold territory.
​Are the bulls going to step up and defend this EMA level, or are we heading lower to test the 0.035 macro support? 👀👇
​#idusdt #SpaceID #CryptoTrading #Binance #altcoins
·
--
Bullish
Breakout in the token volume and a sharp upward momentum! Coin $JASMY ignites again 🔥🚀 The coin is currently breaking above important technical resistance levels supported by positive momentum indicators (#MACD #RSI: ), opening the door to targeting higher price levels if trading volume keeps this strength {future}(JASMYUSDT)
Breakout in the token volume and a sharp upward momentum! Coin $JASMY ignites again 🔥🚀
The coin is currently breaking above important technical resistance levels supported by positive momentum indicators (#MACD #RSI: ), opening the door to targeting higher price levels if trading volume keeps this strength
Democratic Presidential Nominee 2028

Democratic Presidential Nominee 2028

Chris Van Hollen99%Mitch Landrieu99%Raphael Warnock78%
Volume $199.22
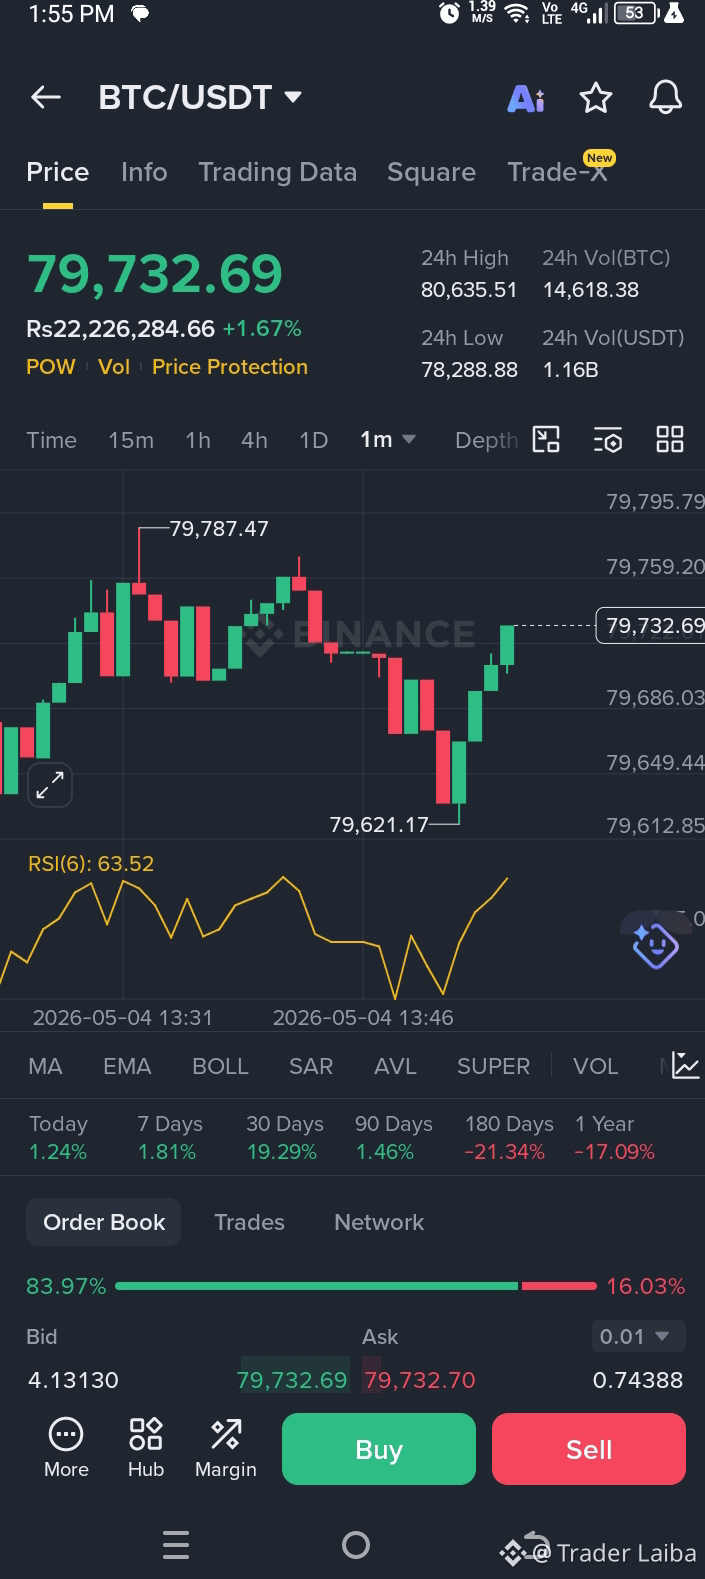
Title: BTC Analysis: What Do RSI and Market Dominance Say? 📊 Guys, $BTC is currently consolidating around the $79,700 zone. I checked the 1-minute chart and the RSI (6) is almost at 63. This indicates that the bulls are still active, but the $80,000 level is a major psychological resistance. Another interesting point is that Bitcoin Dominance has risen above 60%. This means that all the money is currently flowing into BTC. If the price holds from here, we could see the next big jump. Are you guys waiting for a breakout or thinking of selling (shorting) from here? Share your thoughts in the comments below! 👇 #BTC #BitcoinAnalysis #CryptoUpdate #RSI: #TradingSignals #Write2Earn
Title: BTC Analysis: What Do RSI and Market Dominance Say? 📊

Guys, $BTC is currently consolidating around the $79,700 zone.

I checked the 1-minute chart and the RSI (6) is almost at 63. This indicates that the bulls are still active, but the $80,000 level is a major psychological resistance.

Another interesting point is that Bitcoin Dominance has risen above 60%. This means that all the money is currently flowing into BTC. If the price holds from here, we could see the next big jump.

Are you guys waiting for a breakout or thinking of selling (shorting) from here? Share your thoughts in the comments below! 👇

#BTC #BitcoinAnalysis #CryptoUpdate #RSI: #TradingSignals #Write2Earn
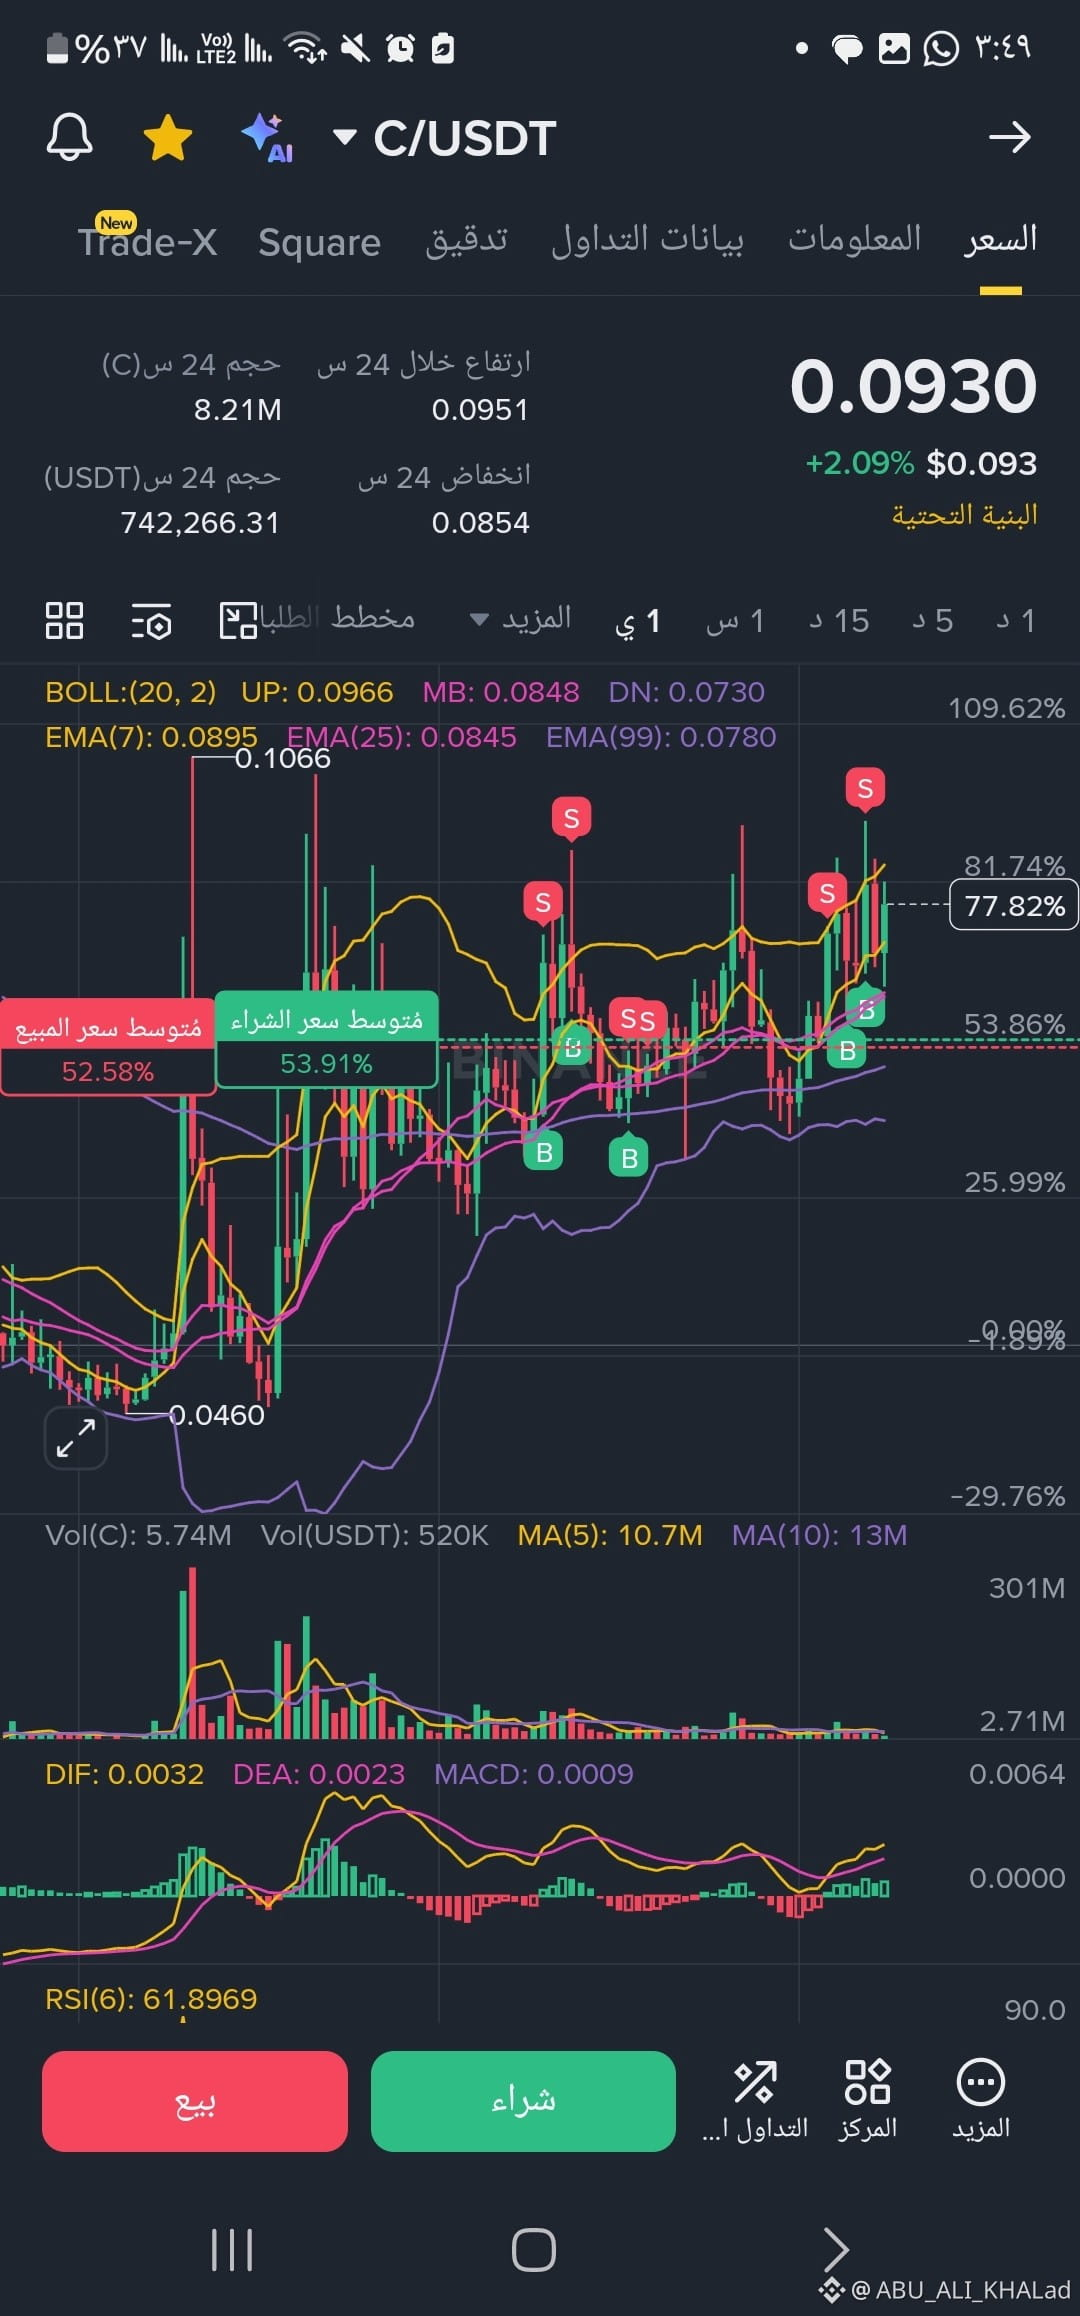
> C/USDT is catching attention again 👀 Current technical analysis: ✅ Price is above EMA7 and EMA25 ✅ Positive crossover on MACD ✅ RSI in strength zones without dangerous overbought ✅ Holding above 0.090 is considered bullish Key area right now: 🔥 Breaking 0.0966 Could open the door for a stronger bull run. However, a breakdown below 0.088 – 0.084 Could bring selling pressure back. What's clear right now: The market is starting to watch the coin, and liquidity is gradually improving. Are we on the verge of a new breakout? 👀 #CryptoPatience #memecoin🚀🚀🚀 #RSI: #BullRunBonanza
> C/USDT is catching attention again 👀

Current technical analysis:

✅ Price is above EMA7 and EMA25
✅ Positive crossover on MACD
✅ RSI in strength zones without dangerous overbought
✅ Holding above 0.090 is considered bullish

Key area right now:

🔥 Breaking 0.0966
Could open the door for a stronger bull run.

However, a breakdown below 0.088 – 0.084
Could bring selling pressure back.

What's clear right now: The market is starting to watch the coin, and liquidity is gradually improving.

Are we on the verge of a new breakout? 👀

#CryptoPatience #memecoin🚀🚀🚀 #RSI: #BullRunBonanza
·
--
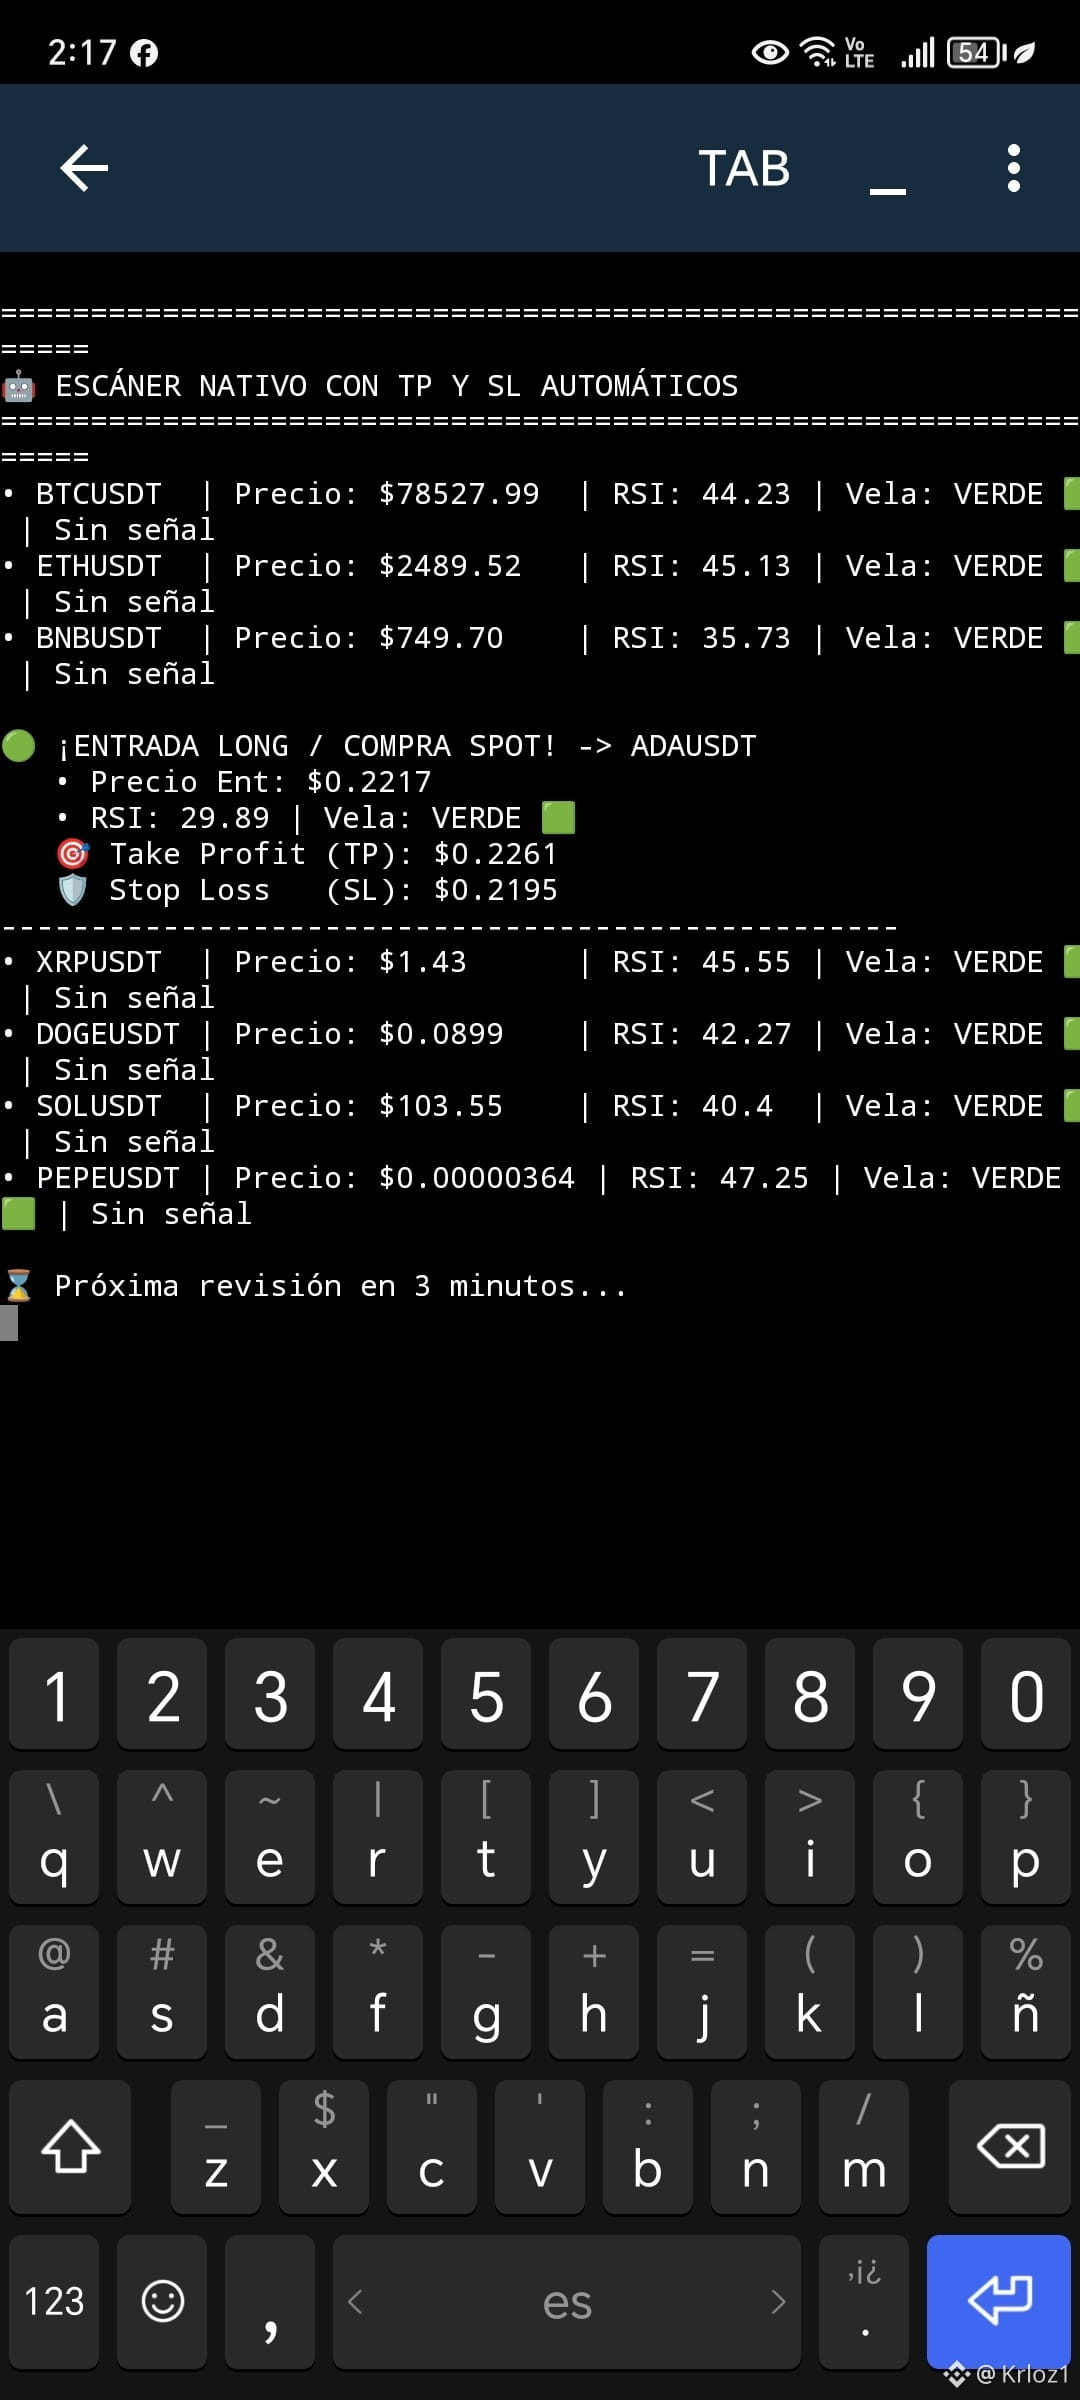
​🤖 Creating my own trading signal bot in Python for Spot and Futures ​Today I was developing a lightweight market scanner in Python that detects opportunities in real time using the RSI indicator and price-action confirmation by candle color. ​💡 Tool features: ​Dual Scan: Scans pairs in Spot and perpetual contracts in Futures. ​Entry Triggers: ​🟢 LONG / SPOT: Oversold RSI (\le 30) + confirmation green candle. ​🔻 SHORT: Overbought RSI (\ge 70) + confirmation red candle. ​Integrated Risk Management: Automatically calculates Take Profit (TP) and Stop Loss (SL) levels when the alert is triggered. ​Zero dependencies: Built only with native Python libraries to run fast from any environment. ​🎯 Today it gave me a perfect signal on $ADA in an oversold zone, executing the order with its TP/SL targets programmed instantly. ​Do you prefer trading with automated alerts, or do you do all the analysis 100% manually? I’m reading your comments! 👇 ​#TradingBots #PythonTradingBot #BinanceFutures #RSI: #cryptotrading
​🤖 Creating my own trading signal bot in Python for Spot and Futures
​Today I was developing a lightweight market scanner in Python that detects opportunities in real time using the RSI indicator and price-action confirmation by candle color.
​💡 Tool features:
​Dual Scan: Scans pairs in Spot and perpetual contracts in Futures.
​Entry Triggers:
​🟢 LONG / SPOT: Oversold RSI (\le 30) + confirmation green candle.
​🔻 SHORT: Overbought RSI (\ge 70) + confirmation red candle.
​Integrated Risk Management: Automatically calculates Take Profit (TP) and Stop Loss (SL) levels when the alert is triggered.
​Zero dependencies: Built only with native Python libraries to run fast from any environment.
​🎯 Today it gave me a perfect signal on $ADA in an oversold zone, executing the order with its TP/SL targets programmed instantly.
​Do you prefer trading with automated alerts, or do you do all the analysis 100% manually? I’m reading your comments! 👇
​#TradingBots #PythonTradingBot #BinanceFutures #RSI: #cryptotrading
·
--
Bullish
🔍 TECHNICAL ANALYSIS: $BTC What do the indicators in the 4-hour chart tell us? 📉📈 {spot}(BTCUSDT) By analyzing the recent price structure, we can extract several key data points for our trading strategy: 1️⃣ Moving Averages (EMA): The price remains trading above the EMA(25) at 690.65 and the EMA(200) at 621.17, which supports the main bullish structure. However, the EMA(7) at 701.86 is now acting as immediate resistance after the recent cross and correction. 2️⃣ Volume: Trading volume in the latest section of the chart shows a steady decline, which usually precedes an imminent volatile move (breakout or a sharp drop). 3️⃣ RSI: RSI(6) is at 44.24, indicating cooling from the prior overbought condition, while the 14- and 24-period lines remain stable near the neutral zone of 55–60. There is no extreme oversold yet. 4️⃣ MACD: The histogram has moved into negative territory with a value of -2.77, and the DIF line (10.83) crosses below the DEA (13.60), confirming a bearish or corrective momentum in the short term. 💡 Conclusion: Price is in a consolidation/correction phase within a larger bullish macro trend. Keep an eye on support around 690,000–697,000 to look for entries or confirmation of a bounce. #TechnicalAnalysis #TradingTips" #RSI: #MACD #BinanceSquare
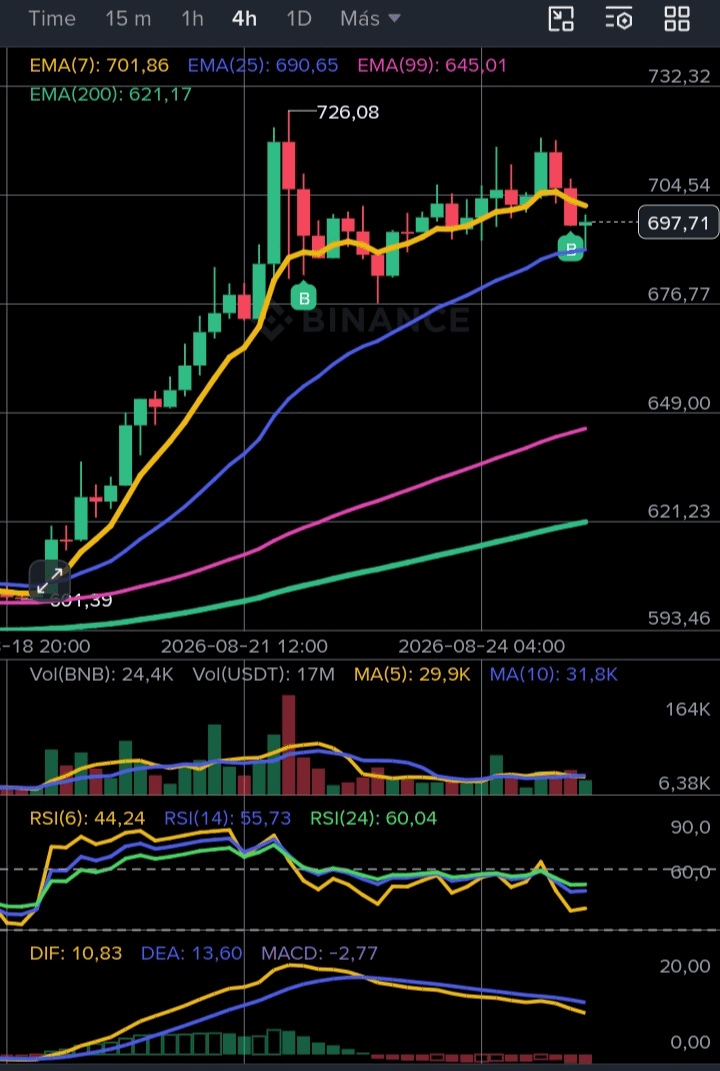
🔍 TECHNICAL ANALYSIS: $BTC What do the indicators in the 4-hour chart tell us? 📉📈

By analyzing the recent price structure, we can extract several key data points for our trading strategy:

1️⃣ Moving Averages (EMA): The price remains trading above the EMA(25) at 690.65 and the EMA(200) at 621.17, which supports the main bullish structure. However, the EMA(7) at 701.86 is now acting as immediate resistance after the recent cross and correction.
2️⃣ Volume: Trading volume in the latest section of the chart shows a steady decline, which usually precedes an imminent volatile move (breakout or a sharp drop).
3️⃣ RSI: RSI(6) is at 44.24, indicating cooling from the prior overbought condition, while the 14- and 24-period lines remain stable near the neutral zone of 55–60. There is no extreme oversold yet.
4️⃣ MACD: The histogram has moved into negative territory with a value of -2.77, and the DIF line (10.83) crosses below the DEA (13.60), confirming a bearish or corrective momentum in the short term.

💡 Conclusion: Price is in a consolidation/correction phase within a larger bullish macro trend. Keep an eye on support around 690,000–697,000 to look for entries or confirmation of a bounce.

#TechnicalAnalysis #TradingTips" #RSI: #MACD #BinanceSquare
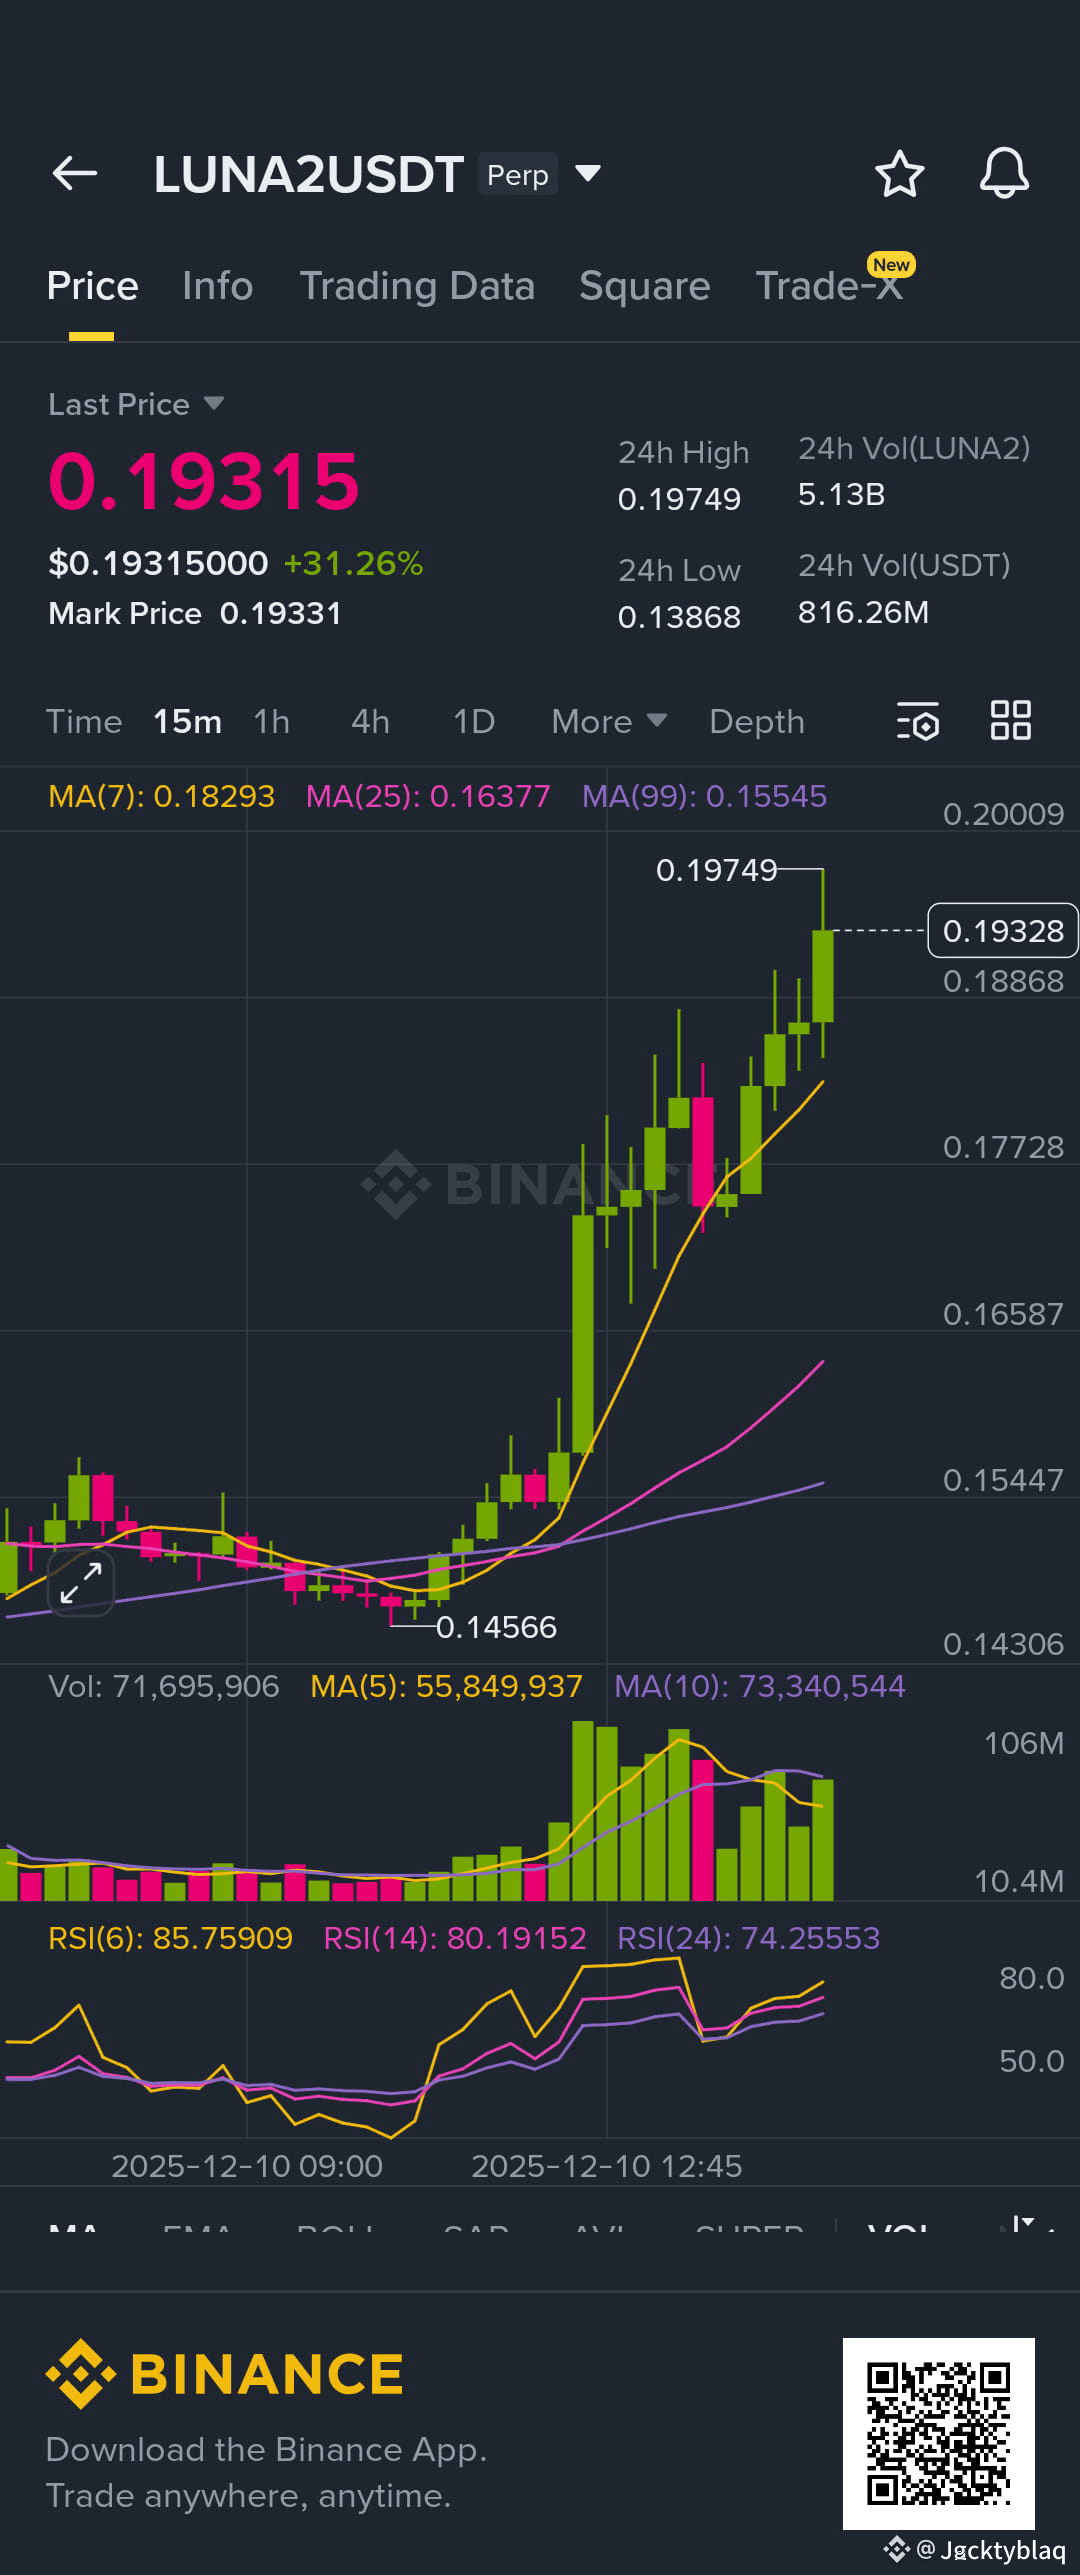
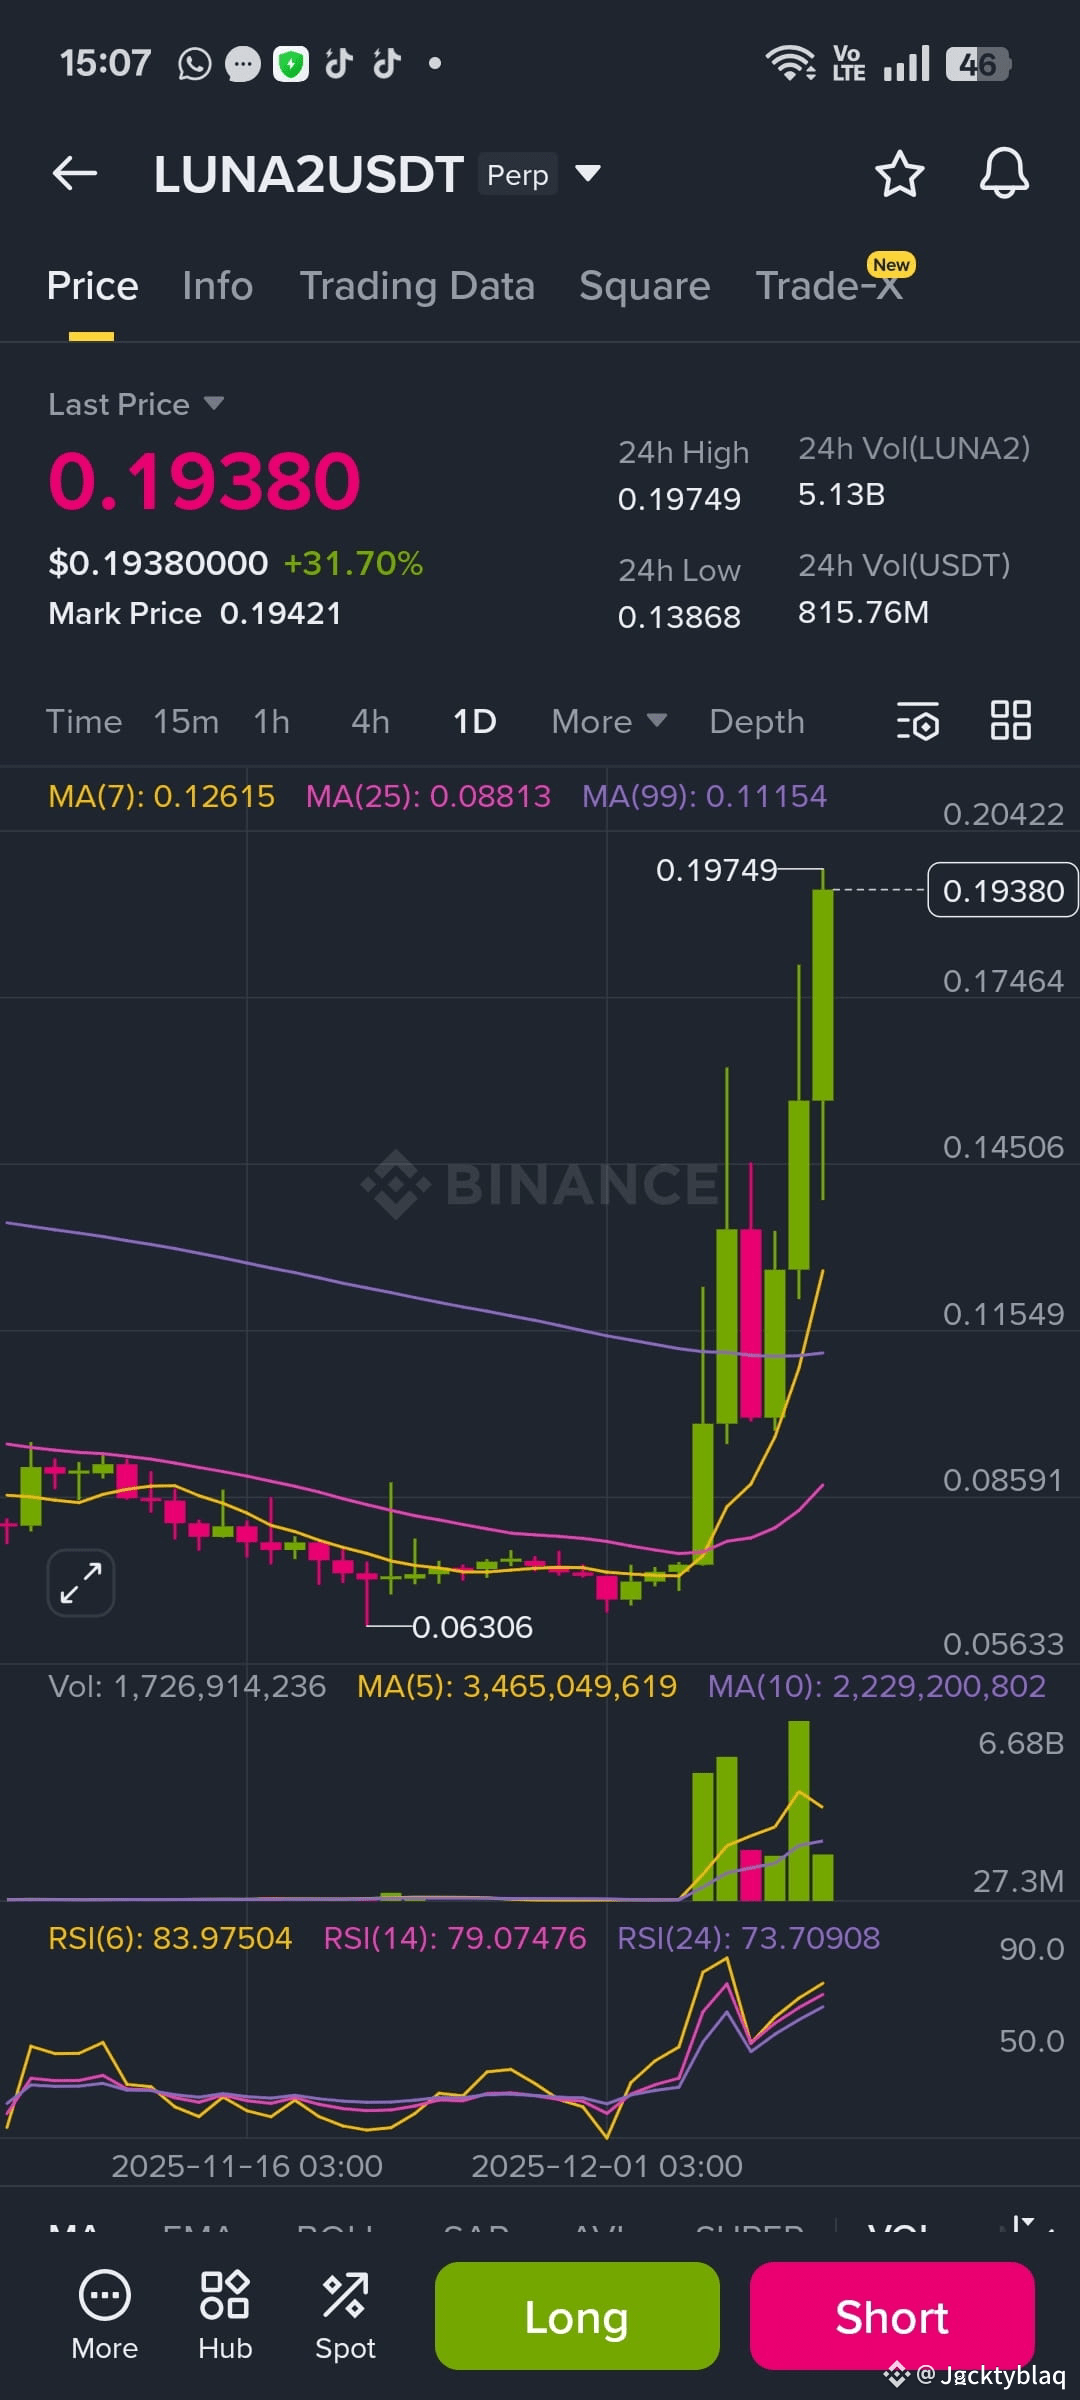
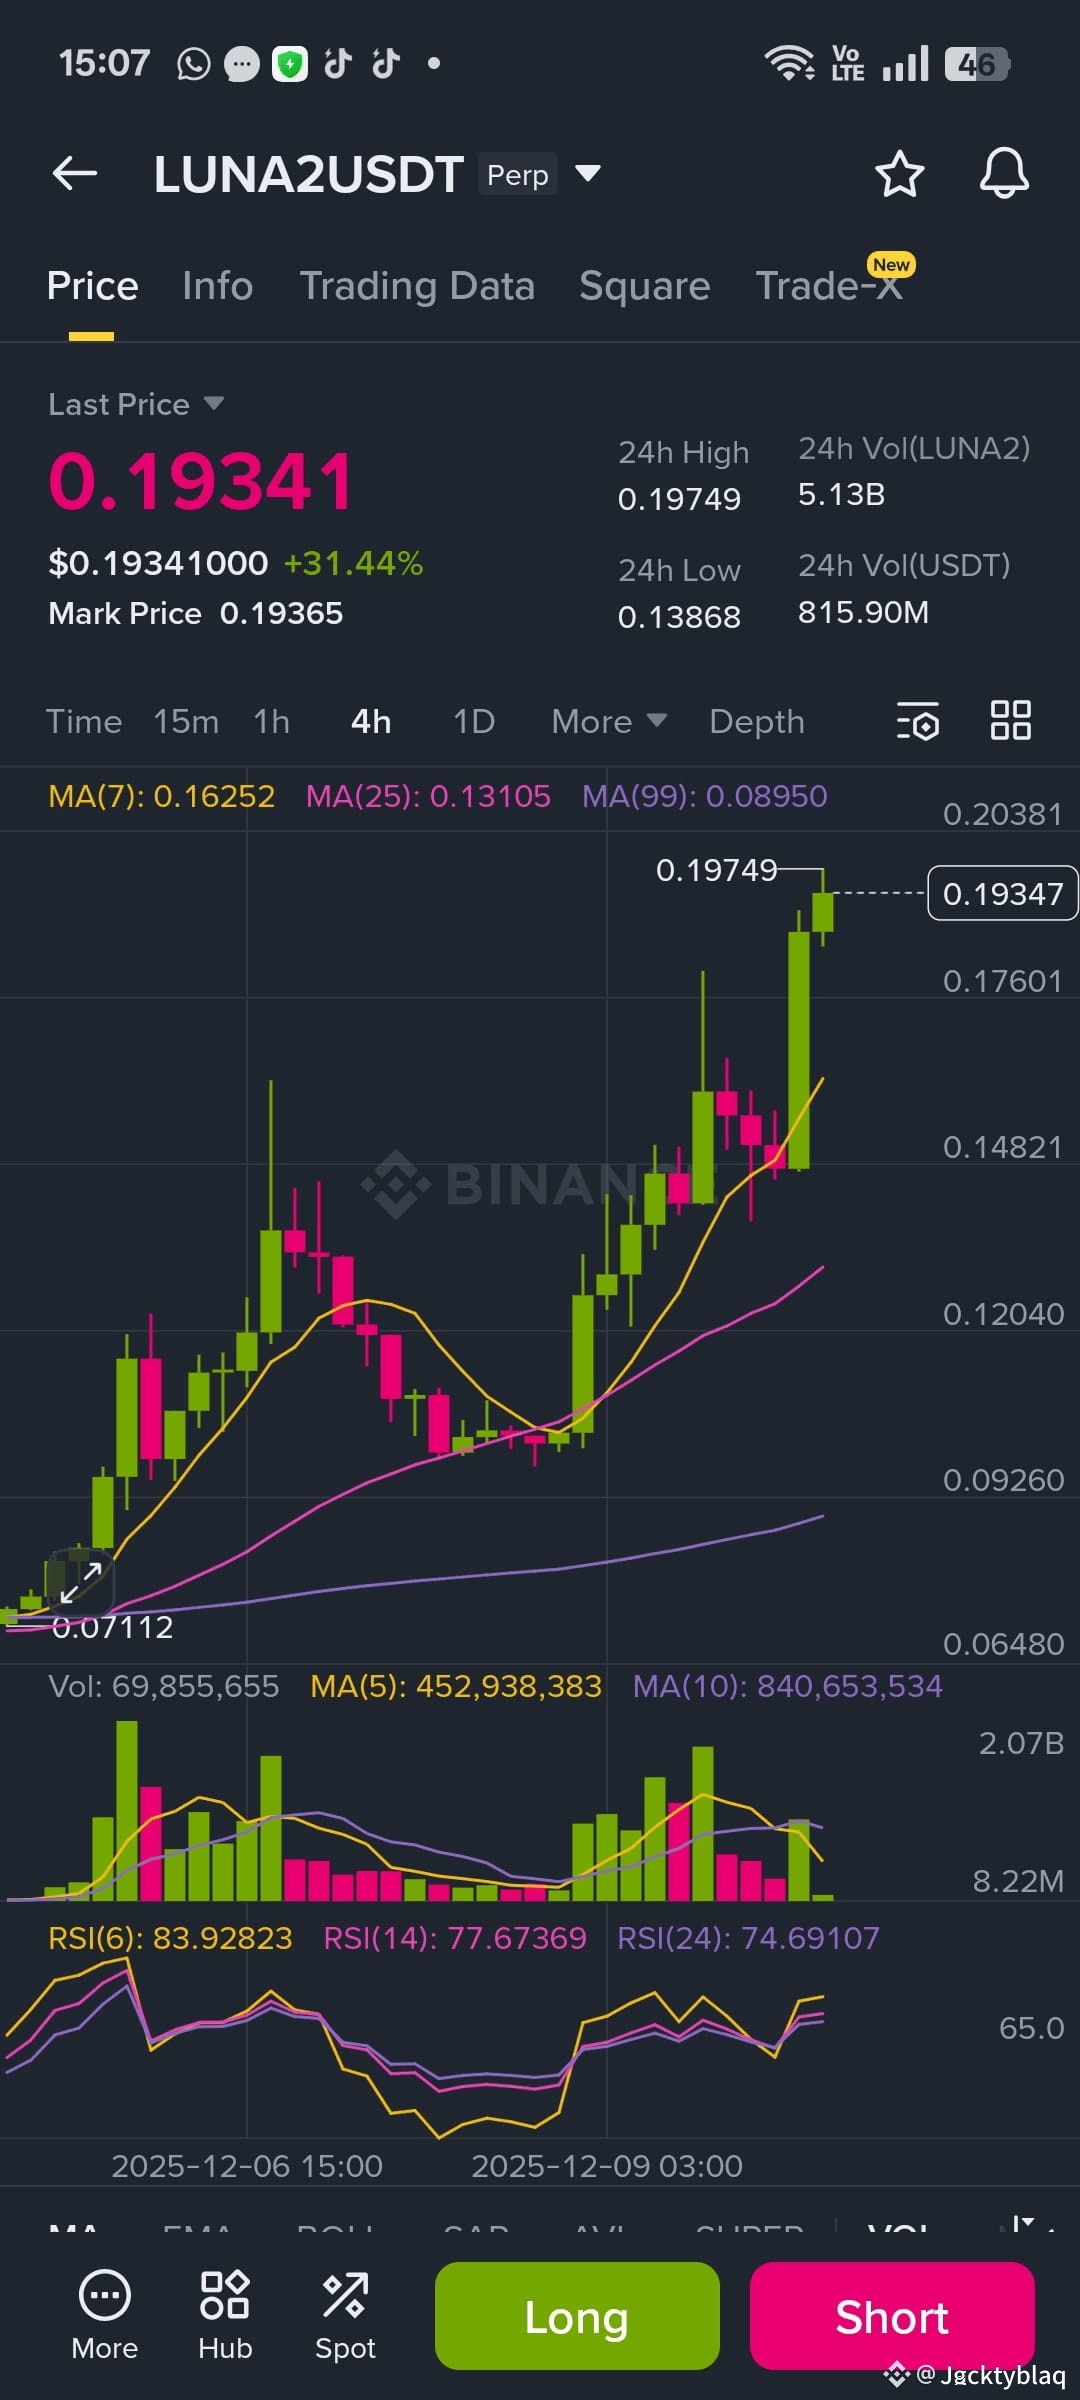
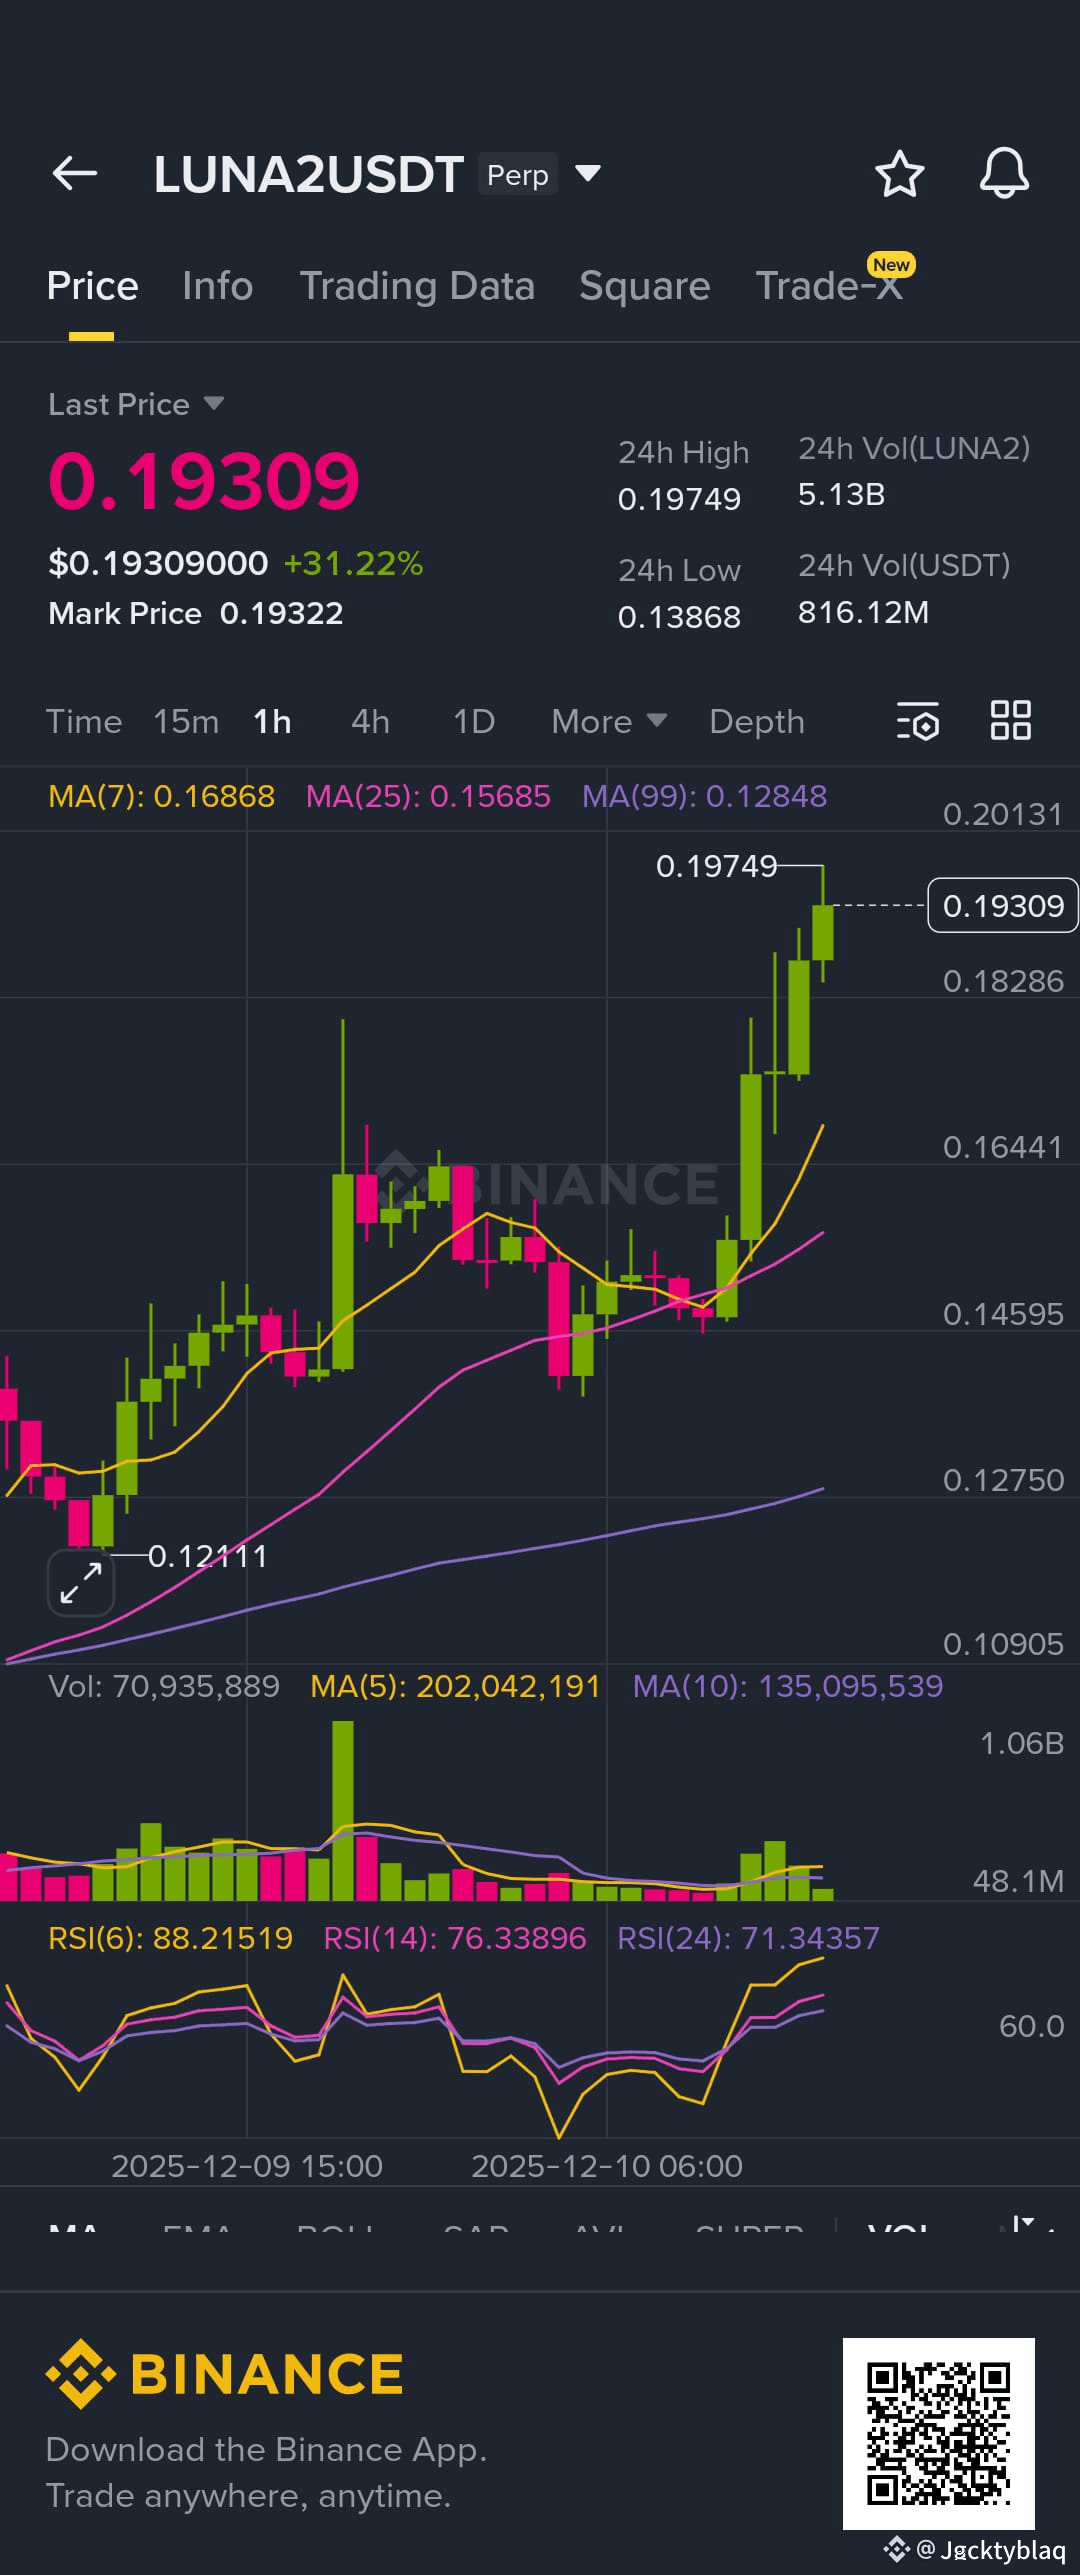
what do you guys look for when entering a short market, The $LUNA2 has already broken the #RSI: limit of 70 which literally shows an overbought position, why should it keep me in this state of heart pain and chest racer. I'm literally worried now. $LUNA2 let's be real here.
Log in to explore more content
Join global crypto users on Binance Square
⚡️ Get latest and useful information about crypto.
💬 Trusted by the world’s largest crypto exchange.
👍 Discover real insights from verified creators.
Email / Phone number