
#rlcusdt
rlcusdt
95,196 views
557 Discussing
Hot
Latest

📊 RLCUSDT – BULLISH REVERSAL POTENTIAL? 🚀
RLCUSDT is beginning to show rebound potential after experiencing a prolonged period of selling pressure.
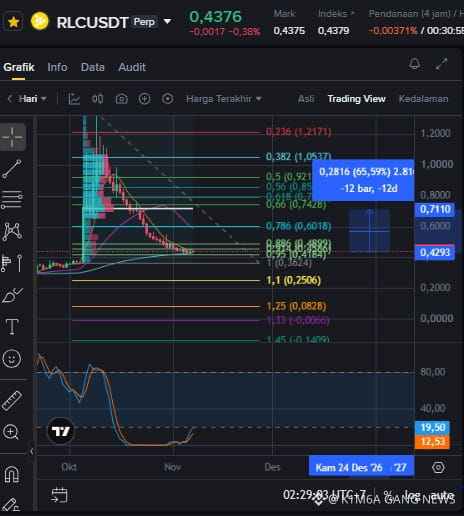
On the 1D timeframe, the price is around 0.4376. The Stochastic RSI appears to be in oversold territory and is starting to turn upward. This could be an early signal of a potential price recovery.
However, confirmation of a trend reversal is still needed, as the overall price structure remains bearish.
🎯 TRADING PLAN – LONG
Entry Area: 0.410 – 0.440
Stop Loss: 0.385
Take Profit 1: 0.500
Take Profit 2: 0.600
Take Profit 3: 0.711
📌 KEY LEVELS
Support: 0.410 – 0.390
Resistance 1: 0.480 – 0.500
Resistance 2: 0.600
Major Target: 0.711
Entry Strategy:
Wait for confirmation from a bullish candle in the entry area before opening a LONG position. If the price manages to break through the 0.500 resistance, the potential for a move toward 0.600 will increase.
⚠️ Risk Management:
Don't enter using your entire capital. Use leverage wisely and always set a Stop Loss. If the price breaks down below support, cancel the bullish scenario.
🔥 Conclusion:
RLCUSDT has the potential for a technical rebound. The 0.410–0.440 area is a zone to watch for LONG opportunities, with staggered targets up to 0.711.
DYOR – Trade smart, manage your risk!
#RLCUSDT #Binance #CryptoAnalysis #Altcoin #TradingSignal $RLC
{spot}(RLCUSDT)
{future}(RLCUSDT)
📊 RLCUSDT – BULLISH REVERSAL POTENTIAL? 🚀
RLCUSDT is beginning to show rebound potential after experiencing a prolonged period of selling pressure.
On the 1D timeframe, the price is around 0.4376. The Stochastic RSI appears to be in oversold territory and is starting to turn upward. This could be an early signal of a potential price recovery.
However, confirmation of a trend reversal is still needed, as the overall price structure remains bearish.
🎯 TRADING PLAN – LONG
Entry Area: 0.410 – 0.440
Stop Loss: 0.385
Take Profit 1: 0.500
Take Profit 2: 0.600
Take Profit 3: 0.711
📌 KEY LEVELS
Support: 0.410 – 0.390
Resistance 1: 0.480 – 0.500
Resistance 2: 0.600
Major Target: 0.711
Entry Strategy:
Wait for confirmation from a bullish candle in the entry area before opening a LONG position. If the price manages to break through the 0.500 resistance, the potential for a move toward 0.600 will increase.
⚠️ Risk Management:
Don't enter using your entire capital. Use leverage wisely and always set a Stop Loss. If the price breaks down below support, cancel the bullish scenario.
🔥 Conclusion:
RLCUSDT has the potential for a technical rebound. The 0.410–0.440 area is a zone to watch for LONG opportunities, with staggered targets up to 0.711.
DYOR – Trade smart, manage your risk!
#RLCUSDT #Binance #CryptoAnalysis #Altcoin #TradingSignal $RLC
RLCUSDT is beginning to show rebound potential after experiencing a prolonged period of selling pressure.
On the 1D timeframe, the price is around 0.4376. The Stochastic RSI appears to be in oversold territory and is starting to turn upward. This could be an early signal of a potential price recovery.
However, confirmation of a trend reversal is still needed, as the overall price structure remains bearish.
🎯 TRADING PLAN – LONG
Entry Area: 0.410 – 0.440
Stop Loss: 0.385
Take Profit 1: 0.500
Take Profit 2: 0.600
Take Profit 3: 0.711
📌 KEY LEVELS
Support: 0.410 – 0.390
Resistance 1: 0.480 – 0.500
Resistance 2: 0.600
Major Target: 0.711
Entry Strategy:
Wait for confirmation from a bullish candle in the entry area before opening a LONG position. If the price manages to break through the 0.500 resistance, the potential for a move toward 0.600 will increase.
⚠️ Risk Management:
Don't enter using your entire capital. Use leverage wisely and always set a Stop Loss. If the price breaks down below support, cancel the bullish scenario.
🔥 Conclusion:
RLCUSDT has the potential for a technical rebound. The 0.410–0.440 area is a zone to watch for LONG opportunities, with staggered targets up to 0.711.
DYOR – Trade smart, manage your risk!
#RLCUSDT #Binance #CryptoAnalysis #Altcoin #TradingSignal $RLC
302


RLC is sliding beneath the 1.00 mark as sellers dominate, and the market is eyeing the 0.92-0.94 band for the next swing.
🔴 $RLC SHORT 📉
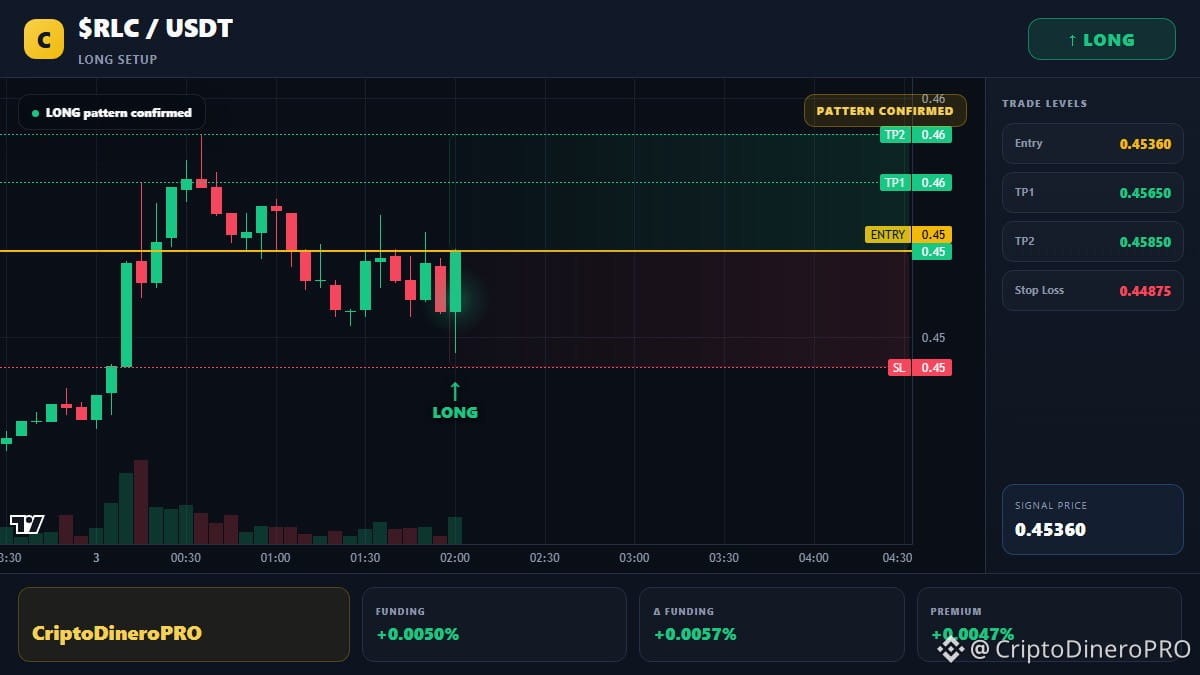
Entry $0.450749-$0.451651 | SL $0.464736 (-3.0%) | TP1 $0.444432 (+1.5%) | TP2 $0.428640 (+5.0%) | R/R 1:1.7 | Conf 64%
The latest CHoCH broke the bullish swing and the CVD turned sharply negative, confirming the shift. A fresh FVG sits right above the broken order block, creating a POI where the OB and FVG overlap, while a liquidity sweep erased the last buy stop. All signs point to a short bias with a 1:1.7 reward-to-risk.
A 3% stop is relatively tight on a volatile coin, so keep leverage around 5-7× to stay safe.
Consider taking half profit once price hits the first target around 0.86.
As always: manage your risk, this is not financial advice 🙏
$RLC #RLCUSDT #THORChain #TradingSignals #Write2Earn
RLC is sliding beneath the 1.00 mark as sellers dominate, and the market is eyeing the 0.92-0.94 band for the next swing.
🔴 $RLC SHORT 📉
Entry $0.450749-$0.451651 | SL $0.464736 (-3.0%) | TP1 $0.444432 (+1.5%) | TP2 $0.428640 (+5.0%) | R/R 1:1.7 | Conf 64%
The latest CHoCH broke the bullish swing and the CVD turned sharply negative, confirming the shift. A fresh FVG sits right above the broken order block, creating a POI where the OB and FVG overlap, while a liquidity sweep erased the last buy stop. All signs point to a short bias with a 1:1.7 reward-to-risk.
A 3% stop is relatively tight on a volatile coin, so keep leverage around 5-7× to stay safe.
Consider taking half profit once price hits the first target around 0.86.
As always: manage your risk, this is not financial advice 🙏
$RLC #RLCUSDT #THORChain #TradingSignals #Write2Earn
🔴 $RLC SHORT 📉
Entry $0.450749-$0.451651 | SL $0.464736 (-3.0%) | TP1 $0.444432 (+1.5%) | TP2 $0.428640 (+5.0%) | R/R 1:1.7 | Conf 64%
The latest CHoCH broke the bullish swing and the CVD turned sharply negative, confirming the shift. A fresh FVG sits right above the broken order block, creating a POI where the OB and FVG overlap, while a liquidity sweep erased the last buy stop. All signs point to a short bias with a 1:1.7 reward-to-risk.
A 3% stop is relatively tight on a volatile coin, so keep leverage around 5-7× to stay safe.
Consider taking half profit once price hits the first target around 0.86.
As always: manage your risk, this is not financial advice 🙏
$RLC #RLCUSDT #THORChain #TradingSignals #Write2Earn
6
·
--
🍅 Panic-red candles and flames engulfing accounts are blazing across the exchange.
💰 SHORT $RLC
Entry: 0.459
TP: 0.436 | SL: 0.505
👓 A long-term view of capital flows helps the market weather volatility.
📈 A green Marubozu candle has appeared, showing buyers' immediate decisiveness.
🧠 May you always stay steadfast and conquer every market high.
💎 May you always be a confident investor who makes strategic moves.
#RLCUSDT $RLCUSDT
🍅 Panic-red candles and flames engulfing accounts are blazing across the exchange.
💰 SHORT $RLC
Entry: 0.459
TP: 0.436 | SL: 0.505
👓 A long-term view of capital flows helps the market weather volatility.
📈 A green Marubozu candle has appeared, showing buyers' immediate decisiveness.
🧠 May you always stay steadfast and conquer every market high.
💎 May you always be a confident investor who makes strategic moves.
#RLCUSDT $RLCUSDT
💰 SHORT $RLC
Entry: 0.459
TP: 0.436 | SL: 0.505
👓 A long-term view of capital flows helps the market weather volatility.
📈 A green Marubozu candle has appeared, showing buyers' immediate decisiveness.
🧠 May you always stay steadfast and conquer every market high.
💎 May you always be a confident investor who makes strategic moves.
#RLCUSDT $RLCUSDT
42
RLC is hovering around 6.45 after a tight range, eyeing the next bullish swing. Volume spikes hint at renewed buying pressure.
━━━━━━━━━━━━━━━━━━━━━
🟢 $RLC LONG 📈
━━━━━━━━━━━━━━━━━━━━━
📍 Entry Range: $0.480219 – $0.481181
🛑 Stop Loss: $0.466279 (-3.0%)
🎯 TP1: $0.487910 (+1.5%)
🏆 TP2: $0.504735 (+5.0%)
⚡ R/R Ratio: 1:1.7
📊 Confidence: 64%
━━━━━━━━━━━━━━━━━━━━━
The market broke a CHoCH on the 1‑hour chart and CVD turned positive, confirming the direction. An order block sits just below the break, overlapping a fresh fair value gap. A liquidity sweep cleared lower stops, creating a POI confluence of OB and FVG.
A 3.0% stop is relatively tight on this volatility, so a 3‑5x leverage range keeps risk in check.
Take half profit at the first target around 7.10 before letting the remainder run.
DYOR — this isn't financial advice, size your risk accordingly 🙏
$RLC #RLCUSDT #FedWatch #TradingSignals #Write2Earn
RLC is hovering around 6.45 after a tight range, eyeing the next bullish swing. Volume spikes hint at renewed buying pressure.
━━━━━━━━━━━━━━━━━━━━━
🟢 $RLC LONG 📈
━━━━━━━━━━━━━━━━━━━━━
📍 Entry Range: $0.480219 – $0.481181
🛑 Stop Loss: $0.466279 (-3.0%)
🎯 TP1: $0.487910 (+1.5%)
🏆 TP2: $0.504735 (+5.0%)
⚡ R/R Ratio: 1:1.7
📊 Confidence: 64%
━━━━━━━━━━━━━━━━━━━━━
The market broke a CHoCH on the 1‑hour chart and CVD turned positive, confirming the direction. An order block sits just below the break, overlapping a fresh fair value gap. A liquidity sweep cleared lower stops, creating a POI confluence of OB and FVG.
A 3.0% stop is relatively tight on this volatility, so a 3‑5x leverage range keeps risk in check.
Take half profit at the first target around 7.10 before letting the remainder run.
DYOR — this isn't financial advice, size your risk accordingly 🙏
$RLC #RLCUSDT #FedWatch #TradingSignals #Write2Earn
━━━━━━━━━━━━━━━━━━━━━
🟢 $RLC LONG 📈
━━━━━━━━━━━━━━━━━━━━━
📍 Entry Range: $0.480219 – $0.481181
🛑 Stop Loss: $0.466279 (-3.0%)
🎯 TP1: $0.487910 (+1.5%)
🏆 TP2: $0.504735 (+5.0%)
⚡ R/R Ratio: 1:1.7
📊 Confidence: 64%
━━━━━━━━━━━━━━━━━━━━━
The market broke a CHoCH on the 1‑hour chart and CVD turned positive, confirming the direction. An order block sits just below the break, overlapping a fresh fair value gap. A liquidity sweep cleared lower stops, creating a POI confluence of OB and FVG.
A 3.0% stop is relatively tight on this volatility, so a 3‑5x leverage range keeps risk in check.
Take half profit at the first target around 7.10 before letting the remainder run.
DYOR — this isn't financial advice, size your risk accordingly 🙏
$RLC #RLCUSDT #FedWatch #TradingSignals #Write2Earn
15


·
--
Bullish
🌊 $RLC is coiled like a spring at rock-bottom and ready to rip! 💎
📍 Trade Setup:
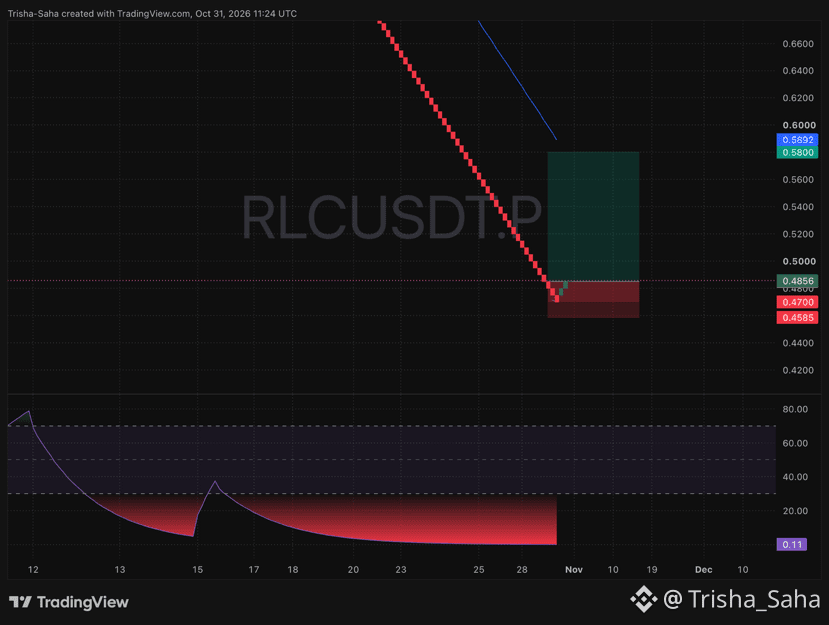
• Entry Zone: $0.4800 –$0.4860
• Stop Loss: $0.4585
• Target: $0.5800
📌 Chart Analysis:
• Sellers are completely drained after a nonstop bleed, with bottom momentum buried at an extreme 0.11 level.
• Two fresh green candles just popped off the $0.4700 floor, showing smart buyers are stepping in to scoop the dip.
• Clear skies ahead with zero heavy resistance until the blue trendline sitting right at $0.5800.
🛡️ Secure your bag by moving your Stop Loss to Break-Even the moment this position hits +3% to +4% in profit.
I've already punched my ticket. Who is riding this reversal up with me? Drop a 🔥 below! 👇
#RLC #RLCUSDT #CryptoGems #TradingSignals
{future}(RLCUSDT)
🌊 $RLC is coiled like a spring at rock-bottom and ready to rip! 💎
📍 Trade Setup:
• Entry Zone: $0.4800 –$0.4860
• Stop Loss: $0.4585
• Target: $0.5800
📌 Chart Analysis:
• Sellers are completely drained after a nonstop bleed, with bottom momentum buried at an extreme 0.11 level.
• Two fresh green candles just popped off the $0.4700 floor, showing smart buyers are stepping in to scoop the dip.
• Clear skies ahead with zero heavy resistance until the blue trendline sitting right at $0.5800.
🛡️ Secure your bag by moving your Stop Loss to Break-Even the moment this position hits +3% to +4% in profit.
I've already punched my ticket. Who is riding this reversal up with me? Drop a 🔥 below! 👇
#RLC #RLCUSDT #CryptoGems #TradingSignals
📍 Trade Setup:
• Entry Zone: $0.4800 –$0.4860
• Stop Loss: $0.4585
• Target: $0.5800
📌 Chart Analysis:
• Sellers are completely drained after a nonstop bleed, with bottom momentum buried at an extreme 0.11 level.
• Two fresh green candles just popped off the $0.4700 floor, showing smart buyers are stepping in to scoop the dip.
• Clear skies ahead with zero heavy resistance until the blue trendline sitting right at $0.5800.
🛡️ Secure your bag by moving your Stop Loss to Break-Even the moment this position hits +3% to +4% in profit.
I've already punched my ticket. Who is riding this reversal up with me? Drop a 🔥 below! 👇
#RLC #RLCUSDT #CryptoGems #TradingSignals
287
RLC is sliding beneath the 1.2k mark as the bullish push fizzles, and the order flow is turning aggressively bearish. Every tick is feeding the short side, leaving little upside.
🔴 $RLC SHORT 📉
Entry $0.499700-$0.500700 | SL $0.515206 (-3.0%) | TP1 $0.492697 (+1.5%) | TP2 $0.475190 (+5.0%) | R/R 1:1.7 | Conf 64%
The market broke its higher low (CHoCH) and the CVD turned sharply negative, confirming the downshift. A fresh fair value gap sits right under the current price, overlapped by a strong order block that also acted as a liquidity sweep. The POI confluence of the OB and FVG makes the short bias crystal clear.
A 3.0% stop is fairly tight on this volatility, so a max of 5‑6x leverage keeps risk in check.
Take half profit at the first target to lock in gains before the next swing.
As always: manage your risk, this is not financial advice 🙏
$RLC #RLCUSDT #earningsseason #TradingSignals #Write2Earn
RLC is sliding beneath the 1.2k mark as the bullish push fizzles, and the order flow is turning aggressively bearish. Every tick is feeding the short side, leaving little upside.
🔴 $RLC SHORT 📉
Entry $0.499700-$0.500700 | SL $0.515206 (-3.0%) | TP1 $0.492697 (+1.5%) | TP2 $0.475190 (+5.0%) | R/R 1:1.7 | Conf 64%
The market broke its higher low (CHoCH) and the CVD turned sharply negative, confirming the downshift. A fresh fair value gap sits right under the current price, overlapped by a strong order block that also acted as a liquidity sweep. The POI confluence of the OB and FVG makes the short bias crystal clear.
A 3.0% stop is fairly tight on this volatility, so a max of 5‑6x leverage keeps risk in check.
Take half profit at the first target to lock in gains before the next swing.
As always: manage your risk, this is not financial advice 🙏
$RLC #RLCUSDT #earningsseason #TradingSignals #Write2Earn
🔴 $RLC SHORT 📉
Entry $0.499700-$0.500700 | SL $0.515206 (-3.0%) | TP1 $0.492697 (+1.5%) | TP2 $0.475190 (+5.0%) | R/R 1:1.7 | Conf 64%
The market broke its higher low (CHoCH) and the CVD turned sharply negative, confirming the downshift. A fresh fair value gap sits right under the current price, overlapped by a strong order block that also acted as a liquidity sweep. The POI confluence of the OB and FVG makes the short bias crystal clear.
A 3.0% stop is fairly tight on this volatility, so a max of 5‑6x leverage keeps risk in check.
Take half profit at the first target to lock in gains before the next swing.
As always: manage your risk, this is not financial advice 🙏
$RLC #RLCUSDT #earningsseason #TradingSignals #Write2Earn
5

·
--
Bullish
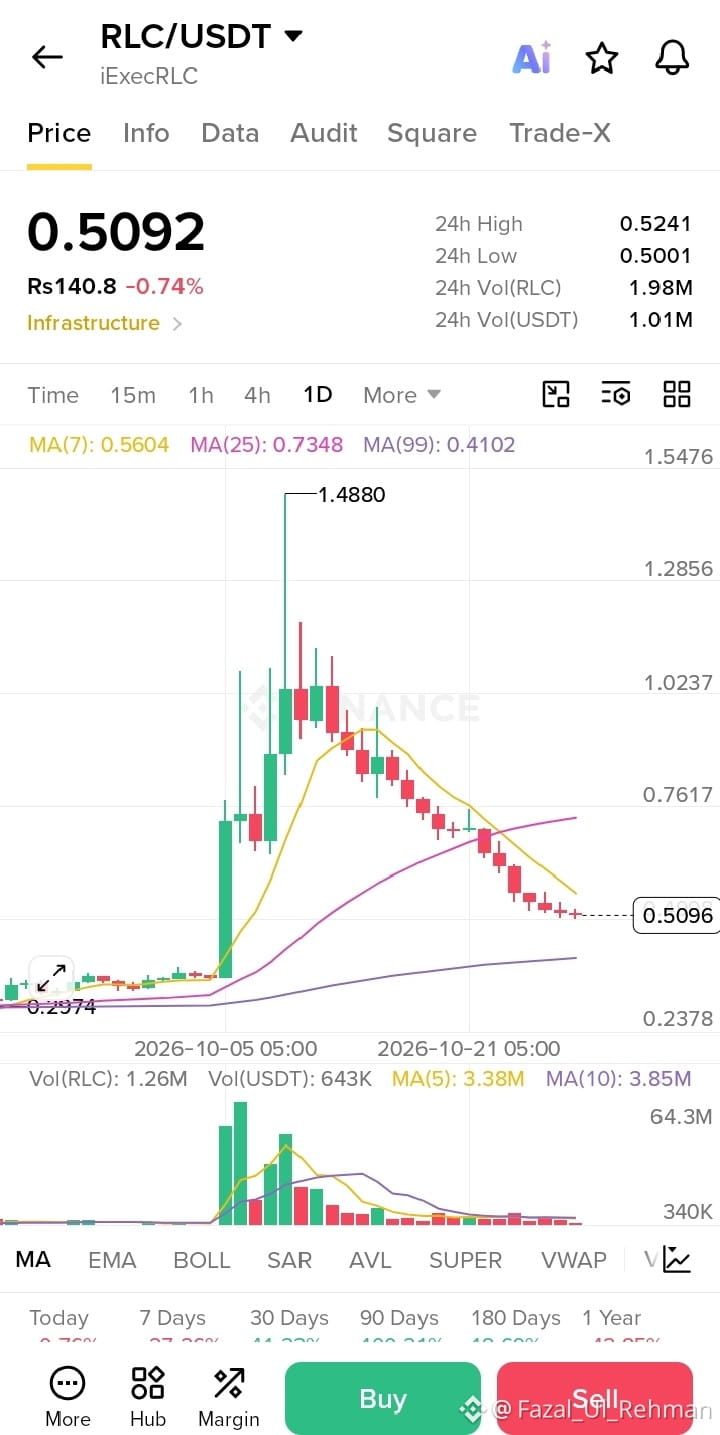
Why I'm buying $RLC in spot👇
RLC is sitting around 0.508, right on a demand zone. Here's why it looks interesting to me:
Price is holding 0.50-0.51 with solid volume support
Structure looks like early accumulation, not a late-trend exhaustion move
What I'm watching:
🟢 Hold and reclaim 0.5146 → room to 0.52 and higher
🔴 Close below 0.5044 → I stop adding
I'm scaling in slowly, not going all in.
Are you accumulating here or waiting for the breakout? 👇
Not financial advice. DYOR.
#RLC #RLCUSDT
{spot}(RLCUSDT)
Why I'm buying $RLC in spot👇
RLC is sitting around 0.508, right on a demand zone. Here's why it looks interesting to me:
Price is holding 0.50-0.51 with solid volume support
Structure looks like early accumulation, not a late-trend exhaustion move
What I'm watching:
🟢 Hold and reclaim 0.5146 → room to 0.52 and higher
🔴 Close below 0.5044 → I stop adding
I'm scaling in slowly, not going all in.
Are you accumulating here or waiting for the breakout? 👇
Not financial advice. DYOR.
#RLC #RLCUSDT
RLC is sitting around 0.508, right on a demand zone. Here's why it looks interesting to me:
Price is holding 0.50-0.51 with solid volume support
Structure looks like early accumulation, not a late-trend exhaustion move
What I'm watching:
🟢 Hold and reclaim 0.5146 → room to 0.52 and higher
🔴 Close below 0.5044 → I stop adding
I'm scaling in slowly, not going all in.
Are you accumulating here or waiting for the breakout? 👇
Not financial advice. DYOR.
#RLC #RLCUSDT
2
1.2k

·
--
$RLCUSDT
$RLC
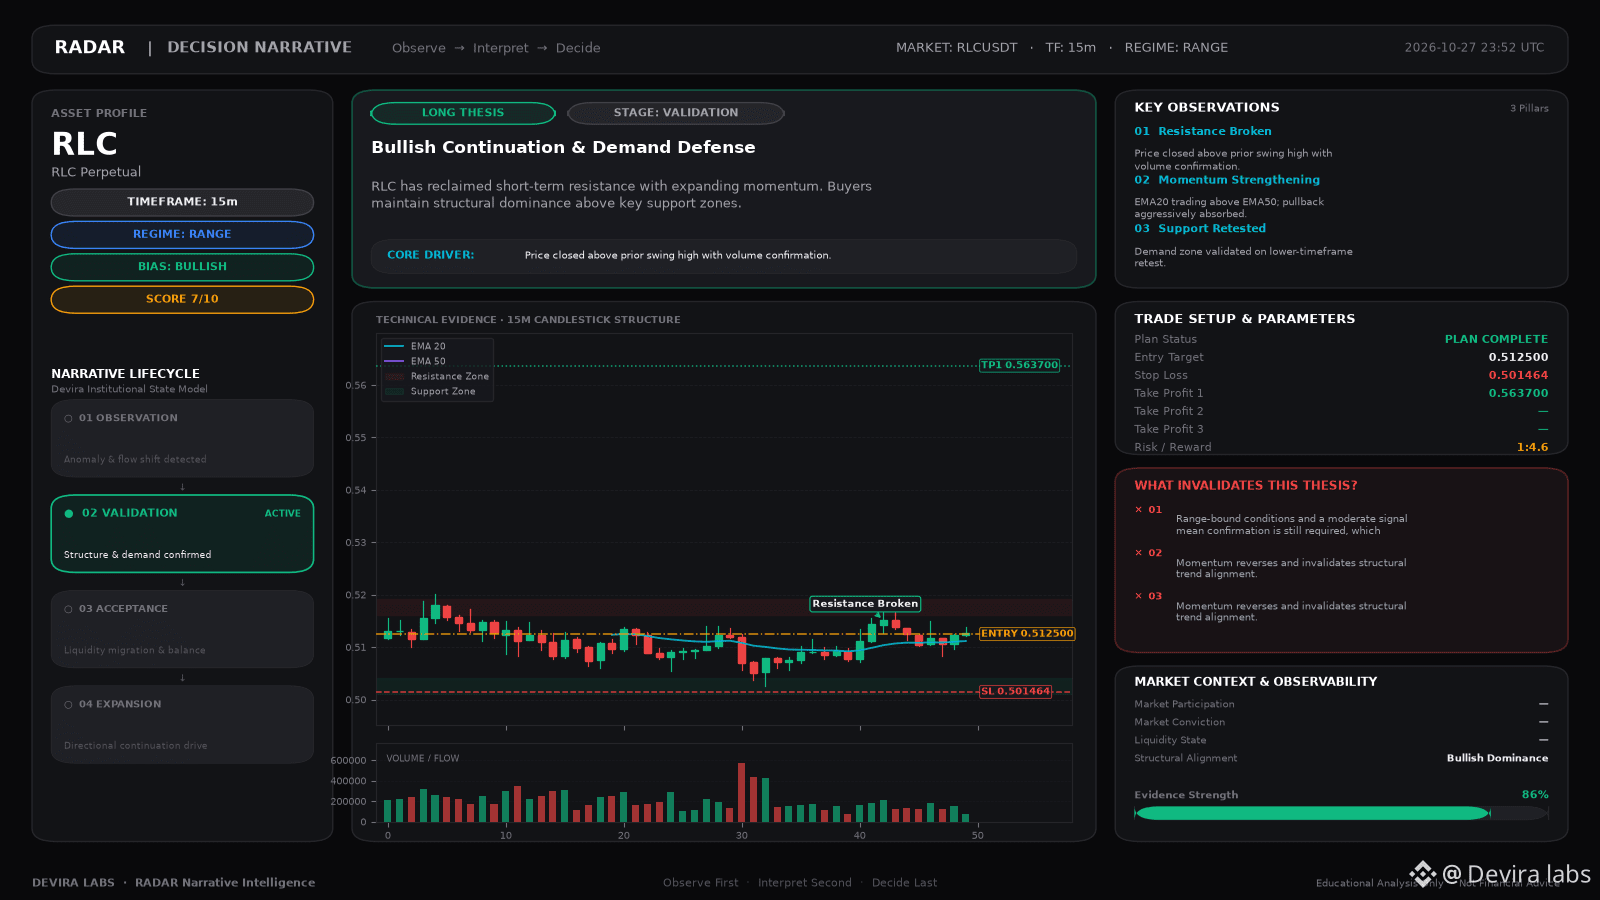
RLC is setting up an interesting long opportunity as technical readings point to moderate upside potential from current levels.
With price moving within an established range, buyers may attempt to build momentum here if support continues to hold.
Entry: 0.5125
SL: 0.501464
TP: 0.5637
Risk:
• Range-bound conditions and a moderate signal mean confirmation is still required, which could limit upside.
Do you expect RLC to break out of this range or stay compressed?
This is my personal trading plan, not financial advice. Risk management comes first.
#RADAR #Crypto #RLCUSDT
$RLCUSDT
$RLC
RLC is setting up an interesting long opportunity as technical readings point to moderate upside potential from current levels.
With price moving within an established range, buyers may attempt to build momentum here if support continues to hold.
Entry: 0.5125
SL: 0.501464
TP: 0.5637
Risk:
• Range-bound conditions and a moderate signal mean confirmation is still required, which could limit upside.
Do you expect RLC to break out of this range or stay compressed?
This is my personal trading plan, not financial advice. Risk management comes first.
#RADAR #Crypto #RLCUSDT
$RLC
RLC is setting up an interesting long opportunity as technical readings point to moderate upside potential from current levels.
With price moving within an established range, buyers may attempt to build momentum here if support continues to hold.
Entry: 0.5125
SL: 0.501464
TP: 0.5637
Risk:
• Range-bound conditions and a moderate signal mean confirmation is still required, which could limit upside.
Do you expect RLC to break out of this range or stay compressed?
This is my personal trading plan, not financial advice. Risk management comes first.
#RADAR #Crypto #RLCUSDT
13
·
--
🍪 Gathering all the FUD info led me to make the terribly harmful decision of buying the bottom and holding the top.
💎 SHORT $RLC
Entry: 0.515
TP: 0.49 | SL: 0.567
🧬 The genetic code of crypto capital flows is freedom and decentralization.
📊 The resistance zone that was broken is now becoming solid support for the price.
🚀 Profit is the reward for those who know how to manage their emotions.
🌞 May you always have an optimistic and promising view of the future.
#RLCUSDT $RLCUSDT
🍪 Gathering all the FUD info led me to make the terribly harmful decision of buying the bottom and holding the top.
💎 SHORT $RLC
Entry: 0.515
TP: 0.49 | SL: 0.567
🧬 The genetic code of crypto capital flows is freedom and decentralization.
📊 The resistance zone that was broken is now becoming solid support for the price.
🚀 Profit is the reward for those who know how to manage their emotions.
🌞 May you always have an optimistic and promising view of the future.
#RLCUSDT $RLCUSDT
💎 SHORT $RLC
Entry: 0.515
TP: 0.49 | SL: 0.567
🧬 The genetic code of crypto capital flows is freedom and decentralization.
📊 The resistance zone that was broken is now becoming solid support for the price.
🚀 Profit is the reward for those who know how to manage their emotions.
🌞 May you always have an optimistic and promising view of the future.
#RLCUSDT $RLCUSDT
27
RLC is perched at a fragile peak, its price hugging the 1.2% upside swing that just fizzed out.
━━━━━━━━━━━━━━━━━━━━━
🔴 $RLC SHORT 📉
━━━━━━━━━━━━━━━━━━━━━
📍 Entry Range: $0.526773 – $0.527827
🛑 Stop Loss: $0.543119 (-3.0%)
🎯 TP1: $0.519390 (+1.5%)
🏆 TP2: $0.500935 (+5.0%)
⚡ R/R Ratio: 1:1.7
📊 Confidence: 65%
━━━━━━━━━━━━━━━━━━━━━
A clear change of character broke the higher highs, and the cumulative volume delta turned sharply bearish, while a fresh fair value gap sits right under the broken order block – the confluence screams short.
A 3.0% stop is relatively tight on this swing; stay under 5x leverage to keep risk manageable.
Take partial profit around the first target as the price retraces the lower edge of the FVG.
As always: manage your risk, this is not financial advice 🙏
$RLC #RLCUSDT #BinancePick #TradingSignals #Write2Earn
RLC is perched at a fragile peak, its price hugging the 1.2% upside swing that just fizzed out.
━━━━━━━━━━━━━━━━━━━━━
🔴 $RLC SHORT 📉
━━━━━━━━━━━━━━━━━━━━━
📍 Entry Range: $0.526773 – $0.527827
🛑 Stop Loss: $0.543119 (-3.0%)
🎯 TP1: $0.519390 (+1.5%)
🏆 TP2: $0.500935 (+5.0%)
⚡ R/R Ratio: 1:1.7
📊 Confidence: 65%
━━━━━━━━━━━━━━━━━━━━━
A clear change of character broke the higher highs, and the cumulative volume delta turned sharply bearish, while a fresh fair value gap sits right under the broken order block – the confluence screams short.
A 3.0% stop is relatively tight on this swing; stay under 5x leverage to keep risk manageable.
Take partial profit around the first target as the price retraces the lower edge of the FVG.
As always: manage your risk, this is not financial advice 🙏
$RLC #RLCUSDT #BinancePick #TradingSignals #Write2Earn
━━━━━━━━━━━━━━━━━━━━━
🔴 $RLC SHORT 📉
━━━━━━━━━━━━━━━━━━━━━
📍 Entry Range: $0.526773 – $0.527827
🛑 Stop Loss: $0.543119 (-3.0%)
🎯 TP1: $0.519390 (+1.5%)
🏆 TP2: $0.500935 (+5.0%)
⚡ R/R Ratio: 1:1.7
📊 Confidence: 65%
━━━━━━━━━━━━━━━━━━━━━
A clear change of character broke the higher highs, and the cumulative volume delta turned sharply bearish, while a fresh fair value gap sits right under the broken order block – the confluence screams short.
A 3.0% stop is relatively tight on this swing; stay under 5x leverage to keep risk manageable.
Take partial profit around the first target as the price retraces the lower edge of the FVG.
As always: manage your risk, this is not financial advice 🙏
$RLC #RLCUSDT #BinancePick #TradingSignals #Write2Earn
19

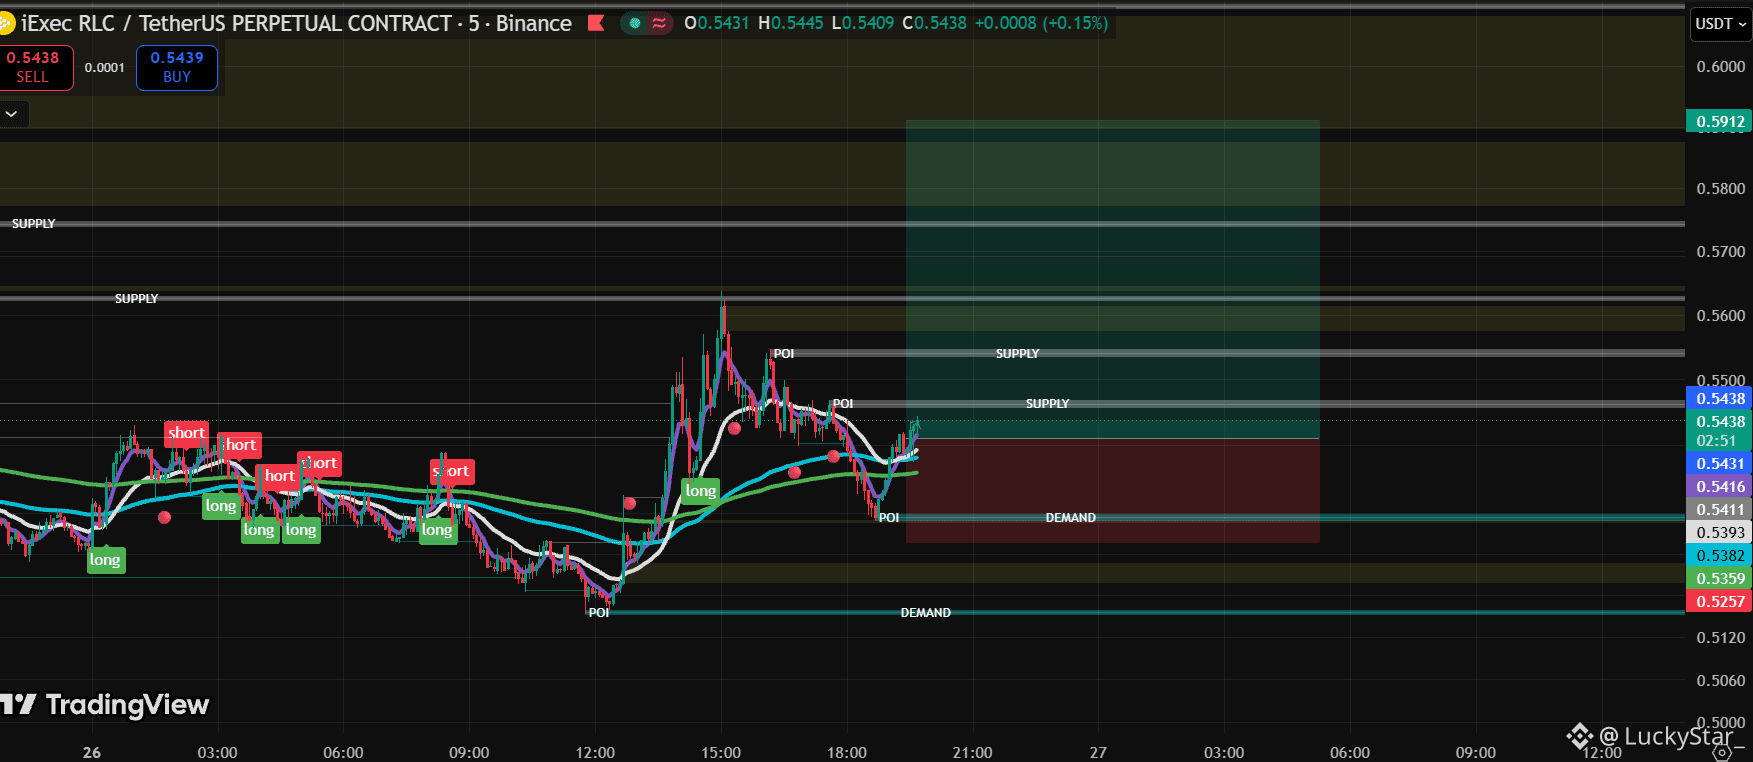
RLC is ripping higher on the 5‑minute, punching above the 50‑EMA with bullish pressure. The price is carving out a fresh swing low, primed for a breakout.
━━━━━━━━━━━━━━━━━━━━━
🟢 $RLC LONG 📈
━━━━━━━━━━━━━━━━━━━━━
📍 Entry Range: $0.530469 – $0.531531
🛑 Stop Loss: $0.515070 (-3.0%)
🎯 TP1: $0.538965 (+1.5%)
🏆 TP2: $0.557550 (+5.0%)
⚡ R/R Ratio: 1:1.7
📊 Confidence: 64%
━━━━━━━━━━━━━━━━━━━━━
A clear CHoCH on the swing low paired with a bullish CVD spike confirms buying pressure. The FVG sits right inside a fresh order block, and a liquidity sweep cleared the short side. The POI confluence of the OB and FVG gives a high‑probability entry.
A 3.0% stop is fairly tight on this volatility, so stick to 5‑10x max leverage.
Take half profit at the first target around 1.7 R/R before letting the remainder run.
Not financial advice — trade only what you can afford to lose 🙏
$RLC #RLCUSDT #SMC #TradingSignals #Write2Earn
RLC is ripping higher on the 5‑minute, punching above the 50‑EMA with bullish pressure. The price is carving out a fresh swing low, primed for a breakout.
━━━━━━━━━━━━━━━━━━━━━
🟢 $RLC LONG 📈
━━━━━━━━━━━━━━━━━━━━━
📍 Entry Range: $0.530469 – $0.531531
🛑 Stop Loss: $0.515070 (-3.0%)
🎯 TP1: $0.538965 (+1.5%)
🏆 TP2: $0.557550 (+5.0%)
⚡ R/R Ratio: 1:1.7
📊 Confidence: 64%
━━━━━━━━━━━━━━━━━━━━━
A clear CHoCH on the swing low paired with a bullish CVD spike confirms buying pressure. The FVG sits right inside a fresh order block, and a liquidity sweep cleared the short side. The POI confluence of the OB and FVG gives a high‑probability entry.
A 3.0% stop is fairly tight on this volatility, so stick to 5‑10x max leverage.
Take half profit at the first target around 1.7 R/R before letting the remainder run.
Not financial advice — trade only what you can afford to lose 🙏
$RLC #RLCUSDT #SMC #TradingSignals #Write2Earn
━━━━━━━━━━━━━━━━━━━━━
🟢 $RLC LONG 📈
━━━━━━━━━━━━━━━━━━━━━
📍 Entry Range: $0.530469 – $0.531531
🛑 Stop Loss: $0.515070 (-3.0%)
🎯 TP1: $0.538965 (+1.5%)
🏆 TP2: $0.557550 (+5.0%)
⚡ R/R Ratio: 1:1.7
📊 Confidence: 64%
━━━━━━━━━━━━━━━━━━━━━
A clear CHoCH on the swing low paired with a bullish CVD spike confirms buying pressure. The FVG sits right inside a fresh order block, and a liquidity sweep cleared the short side. The POI confluence of the OB and FVG gives a high‑probability entry.
A 3.0% stop is fairly tight on this volatility, so stick to 5‑10x max leverage.
Take half profit at the first target around 1.7 R/R before letting the remainder run.
Not financial advice — trade only what you can afford to lose 🙏
$RLC #RLCUSDT #SMC #TradingSignals #Write2Earn
13
·
--
🍼 Neglecting proper portfolio management has led to a tragic outcome for me.
🌟 SHORT $RLC
Entry: 0.541
TP: 0.514 | SL: 0.596
📈 The number of wallets holding over 1 BTC has reached a new record.
📊 The MFI indicator suggests smart money is quietly flowing back in.
🧠 An open mind will help you embrace new opportunities more easily.
🍀 Wishing you a vibrant day and trades that hit the mark.
#RLCUSDT $RLCUSDT
🍼 Neglecting proper portfolio management has led to a tragic outcome for me.
🌟 SHORT $RLC
Entry: 0.541
TP: 0.514 | SL: 0.596
📈 The number of wallets holding over 1 BTC has reached a new record.
📊 The MFI indicator suggests smart money is quietly flowing back in.
🧠 An open mind will help you embrace new opportunities more easily.
🍀 Wishing you a vibrant day and trades that hit the mark.
#RLCUSDT $RLCUSDT
🌟 SHORT $RLC
Entry: 0.541
TP: 0.514 | SL: 0.596
📈 The number of wallets holding over 1 BTC has reached a new record.
📊 The MFI indicator suggests smart money is quietly flowing back in.
🧠 An open mind will help you embrace new opportunities more easily.
🍀 Wishing you a vibrant day and trades that hit the mark.
#RLCUSDT $RLCUSDT
23
·
--
🌋 The flames of margin calls are raging, wiping out all your hard-earned gains in just a few candles.
🔭 SHORT $RLC
Entry: 0.585
TP: 0.556 | SL: 0.644
💼 Funds from major tech corporations are continuously flowing into Web3.
📊 The AO indicator turning green above the zero line signals a trend.
💎 Act on data, not on false hopes.
🌈 I hope you always receive the very best value from the exchange.
#RLCUSDT $RLCUSDT
🌋 The flames of margin calls are raging, wiping out all your hard-earned gains in just a few candles.
🔭 SHORT $RLC
Entry: 0.585
TP: 0.556 | SL: 0.644
💼 Funds from major tech corporations are continuously flowing into Web3.
📊 The AO indicator turning green above the zero line signals a trend.
💎 Act on data, not on false hopes.
🌈 I hope you always receive the very best value from the exchange.
#RLCUSDT $RLCUSDT
🔭 SHORT $RLC
Entry: 0.585
TP: 0.556 | SL: 0.644
💼 Funds from major tech corporations are continuously flowing into Web3.
📊 The AO indicator turning green above the zero line signals a trend.
💎 Act on data, not on false hopes.
🌈 I hope you always receive the very best value from the exchange.
#RLCUSDT $RLCUSDT
38
RLC has broken below the recent swing low, snapping the bearish trendline and exposing fresh buying pressure. Volume spikes show the market is primed for a swing back up.
🟢 $RLC LONG 📈 — Trade Plan
• Entry: $0.660838 – $0.662161
• Stop: $0.641655 (-3.0%)
• Target 1: $0.671422 (+1.5%)
• Target 2: $0.694575 (+5.0%)
• R/R 1:1.7 | Confidence 64%
A clear change of character appeared as price pierced the order block and filled a fair value gap, while the liquidity sweep left a clean stop zone. CVD confirmed the influx of buying, and the POI formed where the OB and FVG overlap, reinforcing the bullish bias.
A 3.0% stop is relatively tight on a volatile asset, so 2-3x leverage keeps risk in check.
Take half profit around the first target to lock in gains before the next swing.
As always: manage your risk, this is not financial advice 🙏
$RLC #RLCUSDT #CPIWatch #TradingSignals #Write2Earn
RLC has broken below the recent swing low, snapping the bearish trendline and exposing fresh buying pressure. Volume spikes show the market is primed for a swing back up.
🟢 $RLC LONG 📈 — Trade Plan
• Entry: $0.660838 – $0.662161
• Stop: $0.641655 (-3.0%)
• Target 1: $0.671422 (+1.5%)
• Target 2: $0.694575 (+5.0%)
• R/R 1:1.7 | Confidence 64%
A clear change of character appeared as price pierced the order block and filled a fair value gap, while the liquidity sweep left a clean stop zone. CVD confirmed the influx of buying, and the POI formed where the OB and FVG overlap, reinforcing the bullish bias.
A 3.0% stop is relatively tight on a volatile asset, so 2-3x leverage keeps risk in check.
Take half profit around the first target to lock in gains before the next swing.
As always: manage your risk, this is not financial advice 🙏
$RLC #RLCUSDT #CPIWatch #TradingSignals #Write2Earn
🟢 $RLC LONG 📈 — Trade Plan
• Entry: $0.660838 – $0.662161
• Stop: $0.641655 (-3.0%)
• Target 1: $0.671422 (+1.5%)
• Target 2: $0.694575 (+5.0%)
• R/R 1:1.7 | Confidence 64%
A clear change of character appeared as price pierced the order block and filled a fair value gap, while the liquidity sweep left a clean stop zone. CVD confirmed the influx of buying, and the POI formed where the OB and FVG overlap, reinforcing the bullish bias.
A 3.0% stop is relatively tight on a volatile asset, so 2-3x leverage keeps risk in check.
Take half profit around the first target to lock in gains before the next swing.
As always: manage your risk, this is not financial advice 🙏
$RLC #RLCUSDT #CPIWatch #TradingSignals #Write2Earn
15

·
--
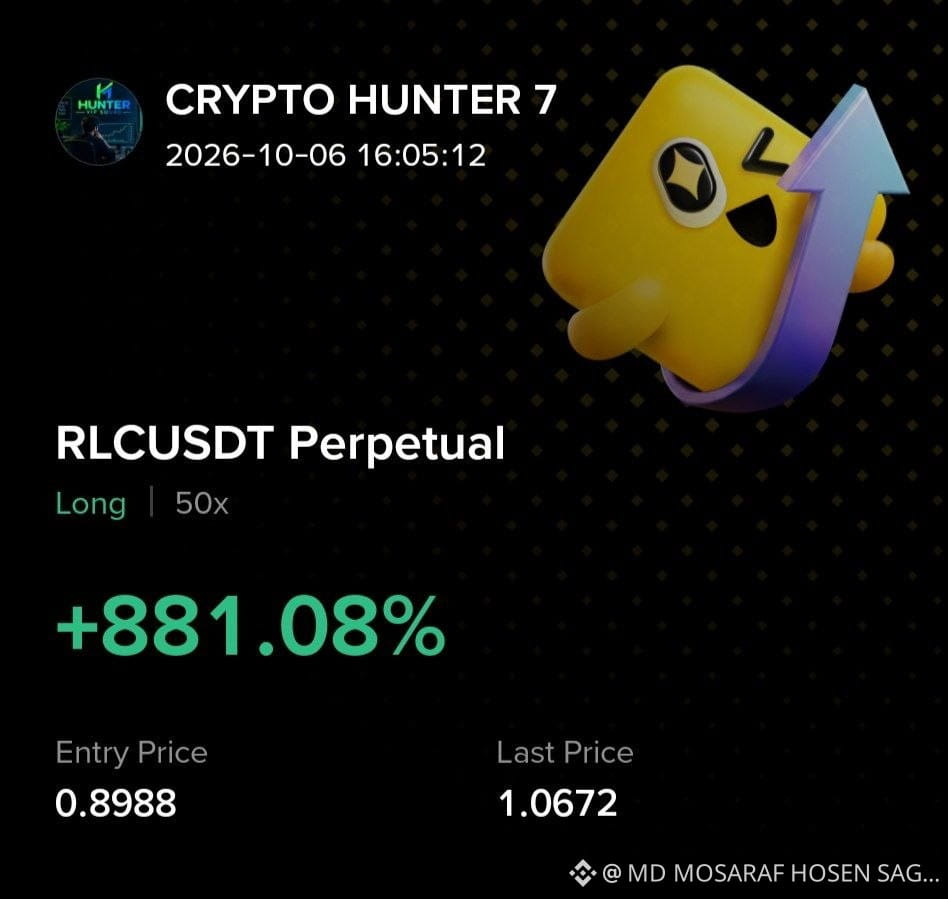
🚀 Massive Win on RLC/USDT! +881%+ Profit Realized 🔥
Proper market analysis and precise timing are the real keys to success in crypto trading! Here is a breakdown of our recent successful RLCUSDT Perpetual long trade.
📊 Trade Breakdown:
• Trading Pair: RLCUSDT Perpetual
• Position: Long (50x Leverage)
• Entry Price: 0.8988
• Last Price: 1.0672
• Total Return (PNL): +881.08% 🚀
Consistent gains like this are possible when combining technical analysis with strict risk management. Were you in on this trade? Let us know in the comments #BinanceSquare #rlcusdt #futures
🚀 Massive Win on RLC/USDT! +881%+ Profit Realized 🔥
Proper market analysis and precise timing are the real keys to success in crypto trading! Here is a breakdown of our recent successful RLCUSDT Perpetual long trade.
📊 Trade Breakdown:
• Trading Pair: RLCUSDT Perpetual
• Position: Long (50x Leverage)
• Entry Price: 0.8988
• Last Price: 1.0672
• Total Return (PNL): +881.08% 🚀
Consistent gains like this are possible when combining technical analysis with strict risk management. Were you in on this trade? Let us know in the comments #BinanceSquare #rlcusdt #futures
Proper market analysis and precise timing are the real keys to success in crypto trading! Here is a breakdown of our recent successful RLCUSDT Perpetual long trade.
📊 Trade Breakdown:
• Trading Pair: RLCUSDT Perpetual
• Position: Long (50x Leverage)
• Entry Price: 0.8988
• Last Price: 1.0672
• Total Return (PNL): +881.08% 🚀
Consistent gains like this are possible when combining technical analysis with strict risk management. Were you in on this trade? Let us know in the comments #BinanceSquare #rlcusdt #futures
1
1
781
RLC is carving a higher low after a clean break of the recent swing high, showing fresh bullish pressure.
━━━━━━━━━━━━━━━━━━━━━
🟢 $RLC LONG 📈
━━━━━━━━━━━━━━━━━━━━━
📍 Entry Range: $0.718980 – $0.720420
🛑 Stop Loss: $0.698109 (-3.0%)
🎯 TP1: $0.730495 (+1.5%)
🏆 TP2: $0.755685 (+5.0%)
⚡ R/R Ratio: 1:1.7
📊 Confidence: 64%
━━━━━━━━━━━━━━━━━━━━━
A change of character on the 4‑hour chart paired with a surge in cumulative volume confirmed the upside, while a fair‑value gap sits right under the breakout and an order block overlaps the gap, giving a tight POI.
A 3 % stop is relatively tight for this volatility, so keep leverage modest, around 2‑3×.
Take partial profit around the first target as price reaches the next resistance zone.
DYOR — this isn't financial advice, size your risk accordingly 🙏
$RLC #RLCUSDT #CPIWatch #TradingSignals #Write2Earn
RLC is carving a higher low after a clean break of the recent swing high, showing fresh bullish pressure.
━━━━━━━━━━━━━━━━━━━━━
🟢 $RLC LONG 📈
━━━━━━━━━━━━━━━━━━━━━
📍 Entry Range: $0.718980 – $0.720420
🛑 Stop Loss: $0.698109 (-3.0%)
🎯 TP1: $0.730495 (+1.5%)
🏆 TP2: $0.755685 (+5.0%)
⚡ R/R Ratio: 1:1.7
📊 Confidence: 64%
━━━━━━━━━━━━━━━━━━━━━
A change of character on the 4‑hour chart paired with a surge in cumulative volume confirmed the upside, while a fair‑value gap sits right under the breakout and an order block overlaps the gap, giving a tight POI.
A 3 % stop is relatively tight for this volatility, so keep leverage modest, around 2‑3×.
Take partial profit around the first target as price reaches the next resistance zone.
DYOR — this isn't financial advice, size your risk accordingly 🙏
$RLC #RLCUSDT #CPIWatch #TradingSignals #Write2Earn
━━━━━━━━━━━━━━━━━━━━━
🟢 $RLC LONG 📈
━━━━━━━━━━━━━━━━━━━━━
📍 Entry Range: $0.718980 – $0.720420
🛑 Stop Loss: $0.698109 (-3.0%)
🎯 TP1: $0.730495 (+1.5%)
🏆 TP2: $0.755685 (+5.0%)
⚡ R/R Ratio: 1:1.7
📊 Confidence: 64%
━━━━━━━━━━━━━━━━━━━━━
A change of character on the 4‑hour chart paired with a surge in cumulative volume confirmed the upside, while a fair‑value gap sits right under the breakout and an order block overlaps the gap, giving a tight POI.
A 3 % stop is relatively tight for this volatility, so keep leverage modest, around 2‑3×.
Take partial profit around the first target as price reaches the next resistance zone.
DYOR — this isn't financial advice, size your risk accordingly 🙏
$RLC #RLCUSDT #CPIWatch #TradingSignals #Write2Earn
20
·
--
📔 Don’t let greed blind you, only to pay dearly with your own future.
🌟 SHORT $RLC
Entry: 0.705
TP: 0.67 | SL: 0.776
👕 Widespread financial literacy creates a more informed flow of money.
📊 The ZigZag indicator clearly confirms that each successive low is higher than the previous one.
📚 Blockchain knowledge will open up a whole new world of possibilities for you.
🌈 May you always be filled with inspiration to explore new horizons.
#RLCUSDT $RLCUSDT
📔 Don’t let greed blind you, only to pay dearly with your own future.
🌟 SHORT $RLC
Entry: 0.705
TP: 0.67 | SL: 0.776
👕 Widespread financial literacy creates a more informed flow of money.
📊 The ZigZag indicator clearly confirms that each successive low is higher than the previous one.
📚 Blockchain knowledge will open up a whole new world of possibilities for you.
🌈 May you always be filled with inspiration to explore new horizons.
#RLCUSDT $RLCUSDT
🌟 SHORT $RLC
Entry: 0.705
TP: 0.67 | SL: 0.776
👕 Widespread financial literacy creates a more informed flow of money.
📊 The ZigZag indicator clearly confirms that each successive low is higher than the previous one.
📚 Blockchain knowledge will open up a whole new world of possibilities for you.
🌈 May you always be filled with inspiration to explore new horizons.
#RLCUSDT $RLCUSDT
85
RLC is carving a bearish path, price slipping below the 2‑hour swing low and eyeing the next supply zone. The momentum is screaming short.
━━━━━━━━━━━━━━━━━━━━━
🔴 $RLC SHORT 📉
━━━━━━━━━━━━━━━━━━━━━
📍 Entry Range: $0.741458 – $0.742942
🛑 Stop Loss: $0.764466 (-3.0%)
🎯 TP1: $0.731067 (+1.5%)
🏆 TP2: $0.705090 (+5.0%)
⚡ R/R Ratio: 1:1.7
📊 Confidence: 64%
━━━━━━━━━━━━━━━━━━━━━
A change of character broke market structure, and the CVD turned negative confirming the swing. The fair value gap lines up with a bullish order block turned bearish, creating a POI where the OB and FVG overlap. All signals line up for a short entry with a tight 1.7‑to‑1 reward‑to‑risk.
A 3 % stop is tight on this timeframe, so keep leverage modest – around 2‑3×.
Take half profit at the first target as the price hits the nearby resistance.
Not financial advice — always manage your own risk 🙏
$RLC #RLCUSDT #CPIWatch #TradingSignals #Write2Earn
RLC is carving a bearish path, price slipping below the 2‑hour swing low and eyeing the next supply zone. The momentum is screaming short.
━━━━━━━━━━━━━━━━━━━━━
🔴 $RLC SHORT 📉
━━━━━━━━━━━━━━━━━━━━━
📍 Entry Range: $0.741458 – $0.742942
🛑 Stop Loss: $0.764466 (-3.0%)
🎯 TP1: $0.731067 (+1.5%)
🏆 TP2: $0.705090 (+5.0%)
⚡ R/R Ratio: 1:1.7
📊 Confidence: 64%
━━━━━━━━━━━━━━━━━━━━━
A change of character broke market structure, and the CVD turned negative confirming the swing. The fair value gap lines up with a bullish order block turned bearish, creating a POI where the OB and FVG overlap. All signals line up for a short entry with a tight 1.7‑to‑1 reward‑to‑risk.
A 3 % stop is tight on this timeframe, so keep leverage modest – around 2‑3×.
Take half profit at the first target as the price hits the nearby resistance.
Not financial advice — always manage your own risk 🙏
$RLC #RLCUSDT #CPIWatch #TradingSignals #Write2Earn
━━━━━━━━━━━━━━━━━━━━━
🔴 $RLC SHORT 📉
━━━━━━━━━━━━━━━━━━━━━
📍 Entry Range: $0.741458 – $0.742942
🛑 Stop Loss: $0.764466 (-3.0%)
🎯 TP1: $0.731067 (+1.5%)
🏆 TP2: $0.705090 (+5.0%)
⚡ R/R Ratio: 1:1.7
📊 Confidence: 64%
━━━━━━━━━━━━━━━━━━━━━
A change of character broke market structure, and the CVD turned negative confirming the swing. The fair value gap lines up with a bullish order block turned bearish, creating a POI where the OB and FVG overlap. All signals line up for a short entry with a tight 1.7‑to‑1 reward‑to‑risk.
A 3 % stop is tight on this timeframe, so keep leverage modest – around 2‑3×.
Take half profit at the first target as the price hits the nearby resistance.
Not financial advice — always manage your own risk 🙏
$RLC #RLCUSDT #CPIWatch #TradingSignals #Write2Earn
12
Log in to explore more content
Join global crypto users on Binance Square
⚡️ Get latest and useful information about crypto.
💬 Trusted by the world’s largest crypto exchange.
👍 Discover real insights from verified creators.
Email / Phone number
Trending Topics
1
#BitcoinFiveWeeklyLosses
36 views
47 Discussing
2
#AIChipSlumpNasdaq
15 views
31 Discussing
3
#BinanceReopensWithdrawalsForHYPE&APT
129,630 views
1,097 Discussing
4
#SouthKoreaDraftLawTargets15To20%ShareholderCap
127,858 views
730 Discussing
5
#TradFiForBeginners
208,070 views
1,953 Discussing
6
#KeplrAdvisesSocialLoginUsersToTransferAssets
61,489 views
554 Discussing
7
#TetherPlans€28.8MForJuventusCapitalIncrease
47,359 views
423 Discussing
8
#JobsReportRaisesHikeOdds
933,283 views
4,512 Discussing
9
#CPITestsDecemberRateOutlook
402,535 views
1,937 Discussing
10
#US Data Center Rules May Constrain AI Expansion
142,891 views
259 Discussing