

#render
render
3.3M views
10,543 Discussing
Hot
Latest

·
--
#Render
Analytical & Structural Breakdown (Focus on Macro Trend & Path)
Best for establishing authority and showing a patient, multi-step market outlook.
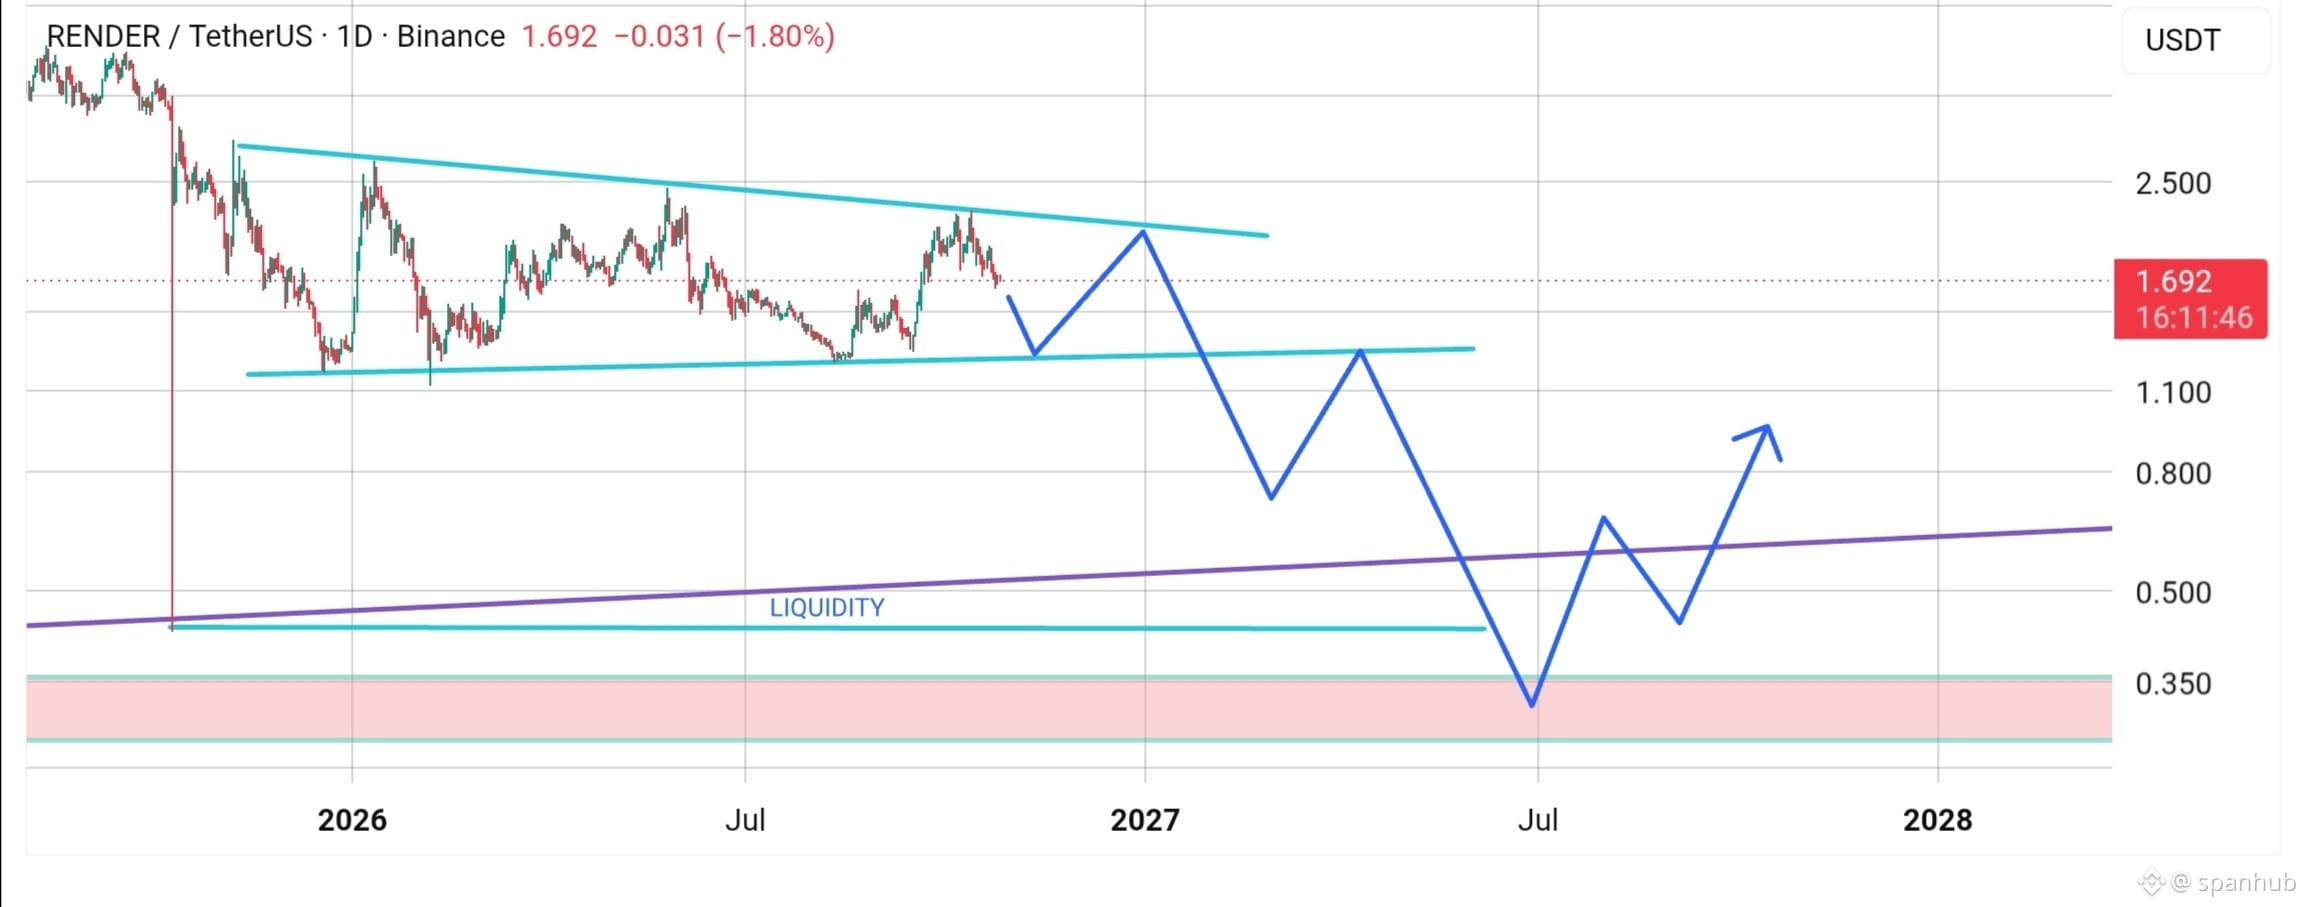
Title: RENDER Macro Roadmap: Navigating the Descending Channel & Liquidity Pools 📉🎯
Asset: RENDERUSDT (Daily Timeframe)
Bias: Structural Bearish / Macro Accumulation Watch
🔍 Technical Breakdown:
Channel Dynamics: RENDER continues to respect a macro descending channel structure on the daily timeframe, testing lower boundary levels while compression tightens.
Projected Path: The mapped price action outlines a potential series of lower corrective bounces before sweeping deeper liquidity zones.
Key Levels to Watch:
Immediate Overhead Resistance: ~$1.10 – $2.50 structural bands.
Major Liquidity Floor / Demand Zone: The lower red accumulation zone ($0.350 area) mapped out as the ultimate macro sweep target.
📈 Strategy & Insights:
Patience Over FOMO: Trying to catch falling knives early can burn portfolios. Waiting for price action to test structural liquidity lines offers a much safer risk-to-reward ratio.
The Long-Term Play: Macro structures like this require patience. Let the market complete its structural cycle and look for confirmation signals (like a major market structure shift or sweep of lows) before scaling into long-term spot bags.
Disclaimer: This is for educational and analytical purposes only. Always DYOR and manage your risk strictly.
$RENDER
{future}(RENDERUSDT)
Tags: #RENDER #CryptoAnalysis #BinanceSquare #TechnicalAnalysis #SmartMoney #Altcoins
#Render
Analytical & Structural Breakdown (Focus on Macro Trend & Path)
Best for establishing authority and showing a patient, multi-step market outlook.
Title: RENDER Macro Roadmap: Navigating the Descending Channel & Liquidity Pools 📉🎯
Asset: RENDERUSDT (Daily Timeframe)
Bias: Structural Bearish / Macro Accumulation Watch
🔍 Technical Breakdown:
Channel Dynamics: RENDER continues to respect a macro descending channel structure on the daily timeframe, testing lower boundary levels while compression tightens.
Projected Path: The mapped price action outlines a potential series of lower corrective bounces before sweeping deeper liquidity zones.
Key Levels to Watch:
Immediate Overhead Resistance: ~$1.10 – $2.50 structural bands.
Major Liquidity Floor / Demand Zone: The lower red accumulation zone ($0.350 area) mapped out as the ultimate macro sweep target.
📈 Strategy & Insights:
Patience Over FOMO: Trying to catch falling knives early can burn portfolios. Waiting for price action to test structural liquidity lines offers a much safer risk-to-reward ratio.
The Long-Term Play: Macro structures like this require patience. Let the market complete its structural cycle and look for confirmation signals (like a major market structure shift or sweep of lows) before scaling into long-term spot bags.
Disclaimer: This is for educational and analytical purposes only. Always DYOR and manage your risk strictly.
$RENDER
Tags: #RENDER #CryptoAnalysis #BinanceSquare #TechnicalAnalysis #SmartMoney #Altcoins
260

⚡ INSTITUTIONAL CAPITAL FLOODS HARDWARE TECH IPO AS GPU DEMAND DRIVES $RENDER NARRATIVE 💥
💡 Institutional hunger for high-performance GPU infrastructure is reaching a fever pitch, with retail listing allocations oversubscribed across major tech capital markets. 🏦 Smart money is aggressively hunting exposure to hardware compute capacity as next-gen processing becomes the ultimate market bottleneck.
📊 As traditional equity markets absorb massive clawback demand for specialized GPU makers, decentralized compute networks are positioned to capture the overflow liquidity. 🌊 Real-world processing scarcity continues to validate the long-term momentum thesis for decentralized GPU compute.
💬 Will traditional GPU supply constraints drive the next parabolic wave into decentralized compute tokens? 👇
⚠️ Not financial advice. Always manage your risk. 🛡️
🏷️ #RENDER #GPU #AI #Crypto #MarketInsight
🔥 💎
6

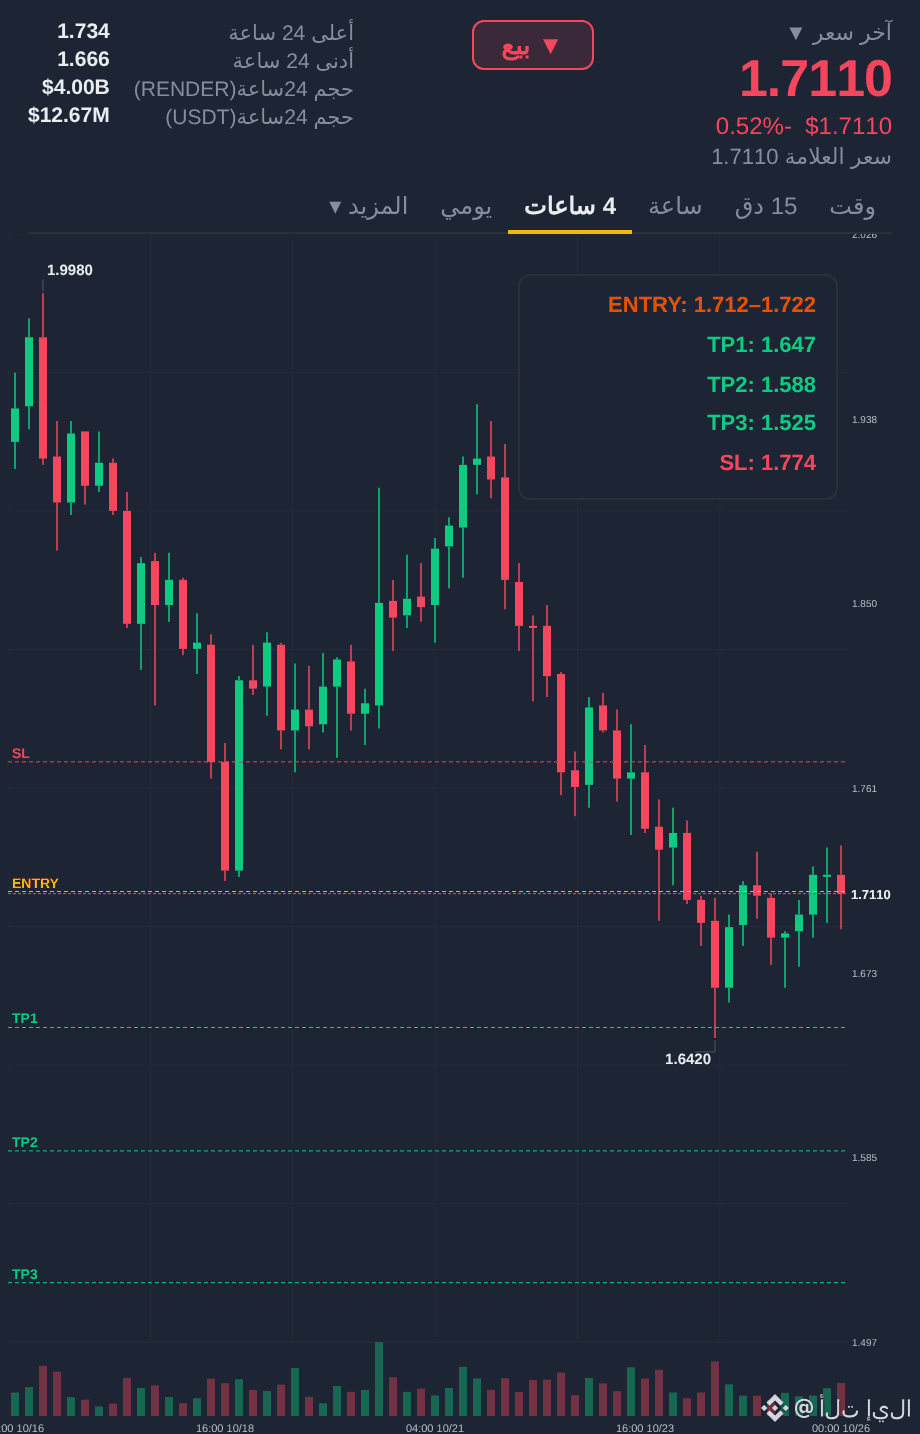
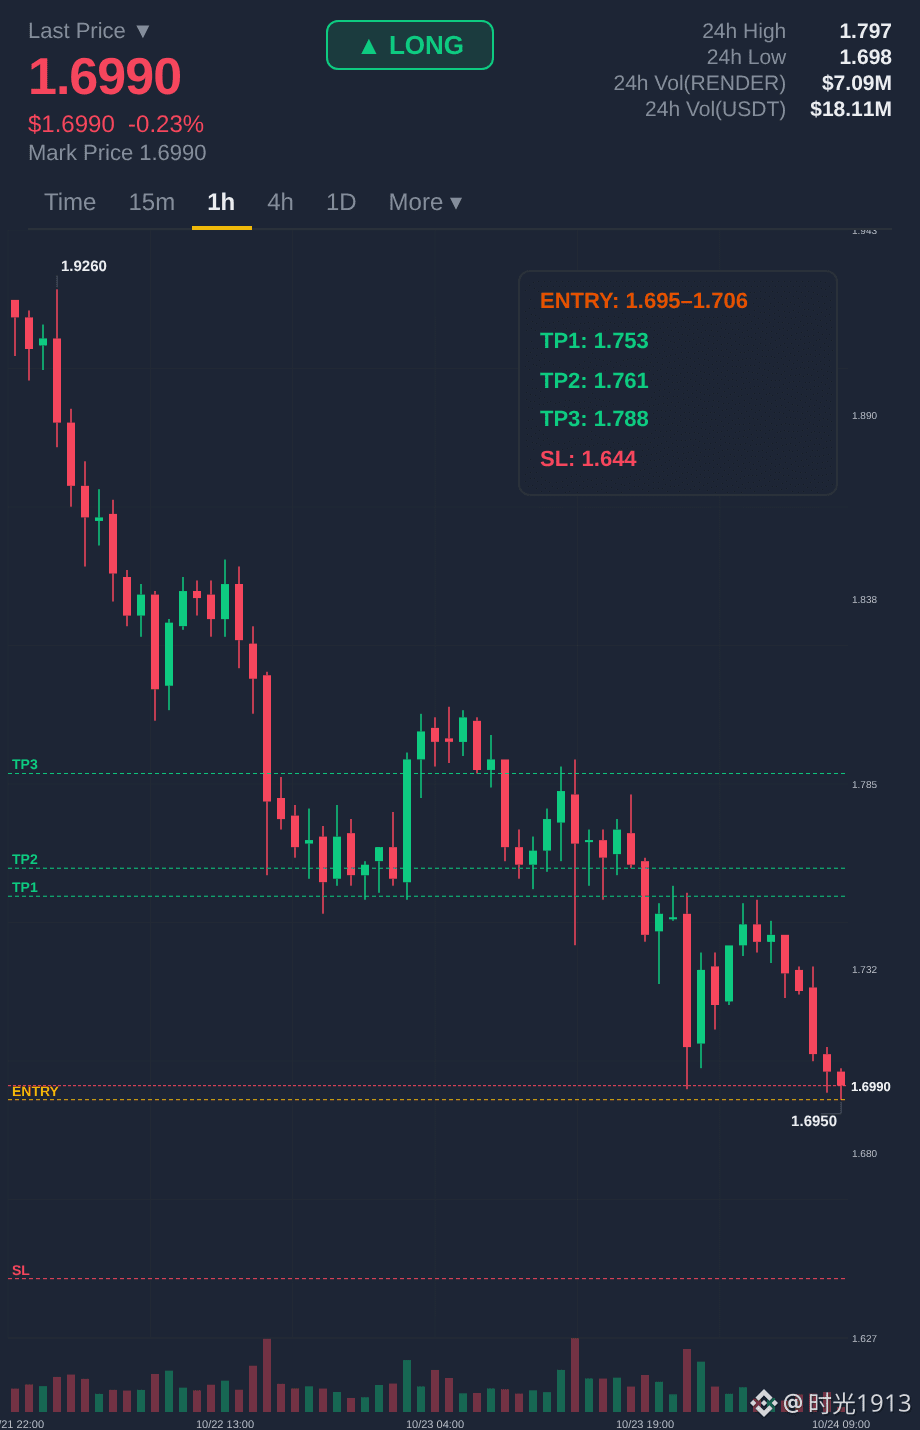
🔥 $RENDER /USDT: SUPPORT REBOUND OR ANOTHER BREAKDOWN?
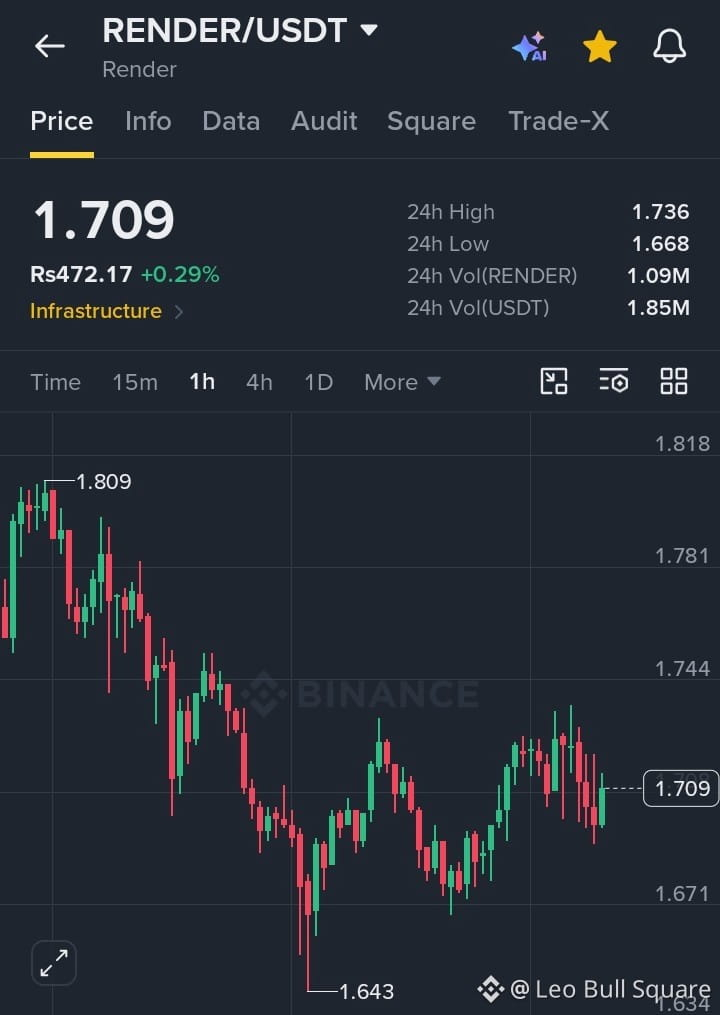
$RENDER is trading near $1.709 after a prolonged downtrend on the 1H chart. Price is attempting a recovery, but repeated rejection near $1.73–$1.74 suggests sellers remain active. Bulls need a strong reclaim to shift momentum.
📊 Technical Points: Bearish market structure • Potential liquidity sweep near $1.643 • Support zone around $1.67–$1.68 • Watch for a bullish BOS and confirmed pullback before entering long.
🟢 LONG SETUP (Conditional): Entry: $1.690–$1.710 | TP1: $1.735 | TP2: $1.765 | TP3: $1.800 | SL: $1.665
🔴 Bearish Trigger: A confirmed breakdown below $1.668 could expose the $1.643 swing low.
Trade Logic: Wait for buying volume and a confirmed bullish structure shift before taking a long. If support fails, avoid catching a falling knife. Manage risk carefully.
Follow for more clean chart analysis and high-probability trade setups.
#render
1
96

🤖AI + CRYPTO: THE NEXT BIG NARRATIVE?
Artificial Intelligence is growing fast, but AI needs computing power to grow. ⚡
That’s where Render Network ($RENDER) enters the conversation — connecting GPU computing with a decentralized network.
🚀 Can decentralized GPU computing become a bigger part of the AI future?
💬 What do you think: Is AI + Crypto a long-term trend or just hype?
Share your thoughts below! 👇
#RENDER #AI #BinanceSqu

125

·
--
Bullish
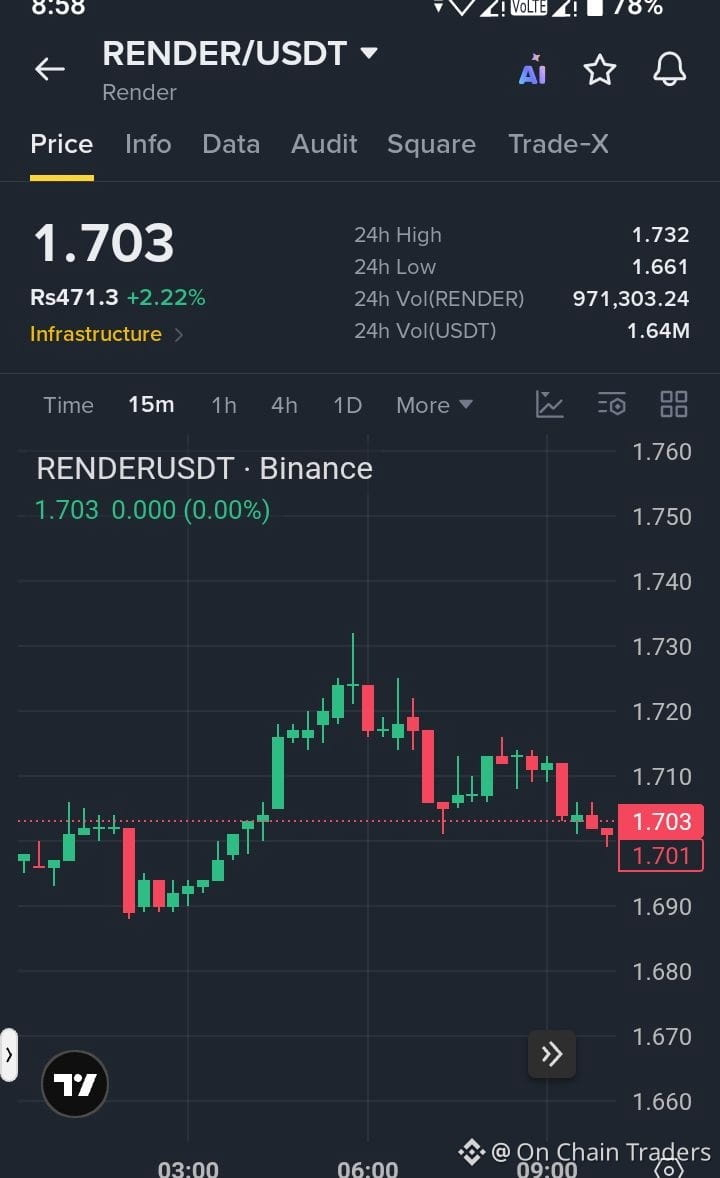
$RENDER is showing bullish momentum, up 2.22% and trading near $1.703. A breakout above $1.732 could open the door toward $1.78–$1.85, while $1.66 remains key support. Watch the volume before entering.
Entry: $1.69–$1.71
TP1: $1.75 | TP2: $1.80 | TP3: $1.85
SL: $1.65
#RENDER
{future}(RENDERUSDT)
$RENDER is showing bullish momentum, up 2.22% and trading near $1.703. A breakout above $1.732 could open the door toward $1.78–$1.85, while $1.66 remains key support. Watch the volume before entering.
Entry: $1.69–$1.71
TP1: $1.75 | TP2: $1.80 | TP3: $1.85
SL: $1.65
#RENDER
Entry: $1.69–$1.71
TP1: $1.75 | TP2: $1.80 | TP3: $1.85
SL: $1.65
#RENDER
1
31

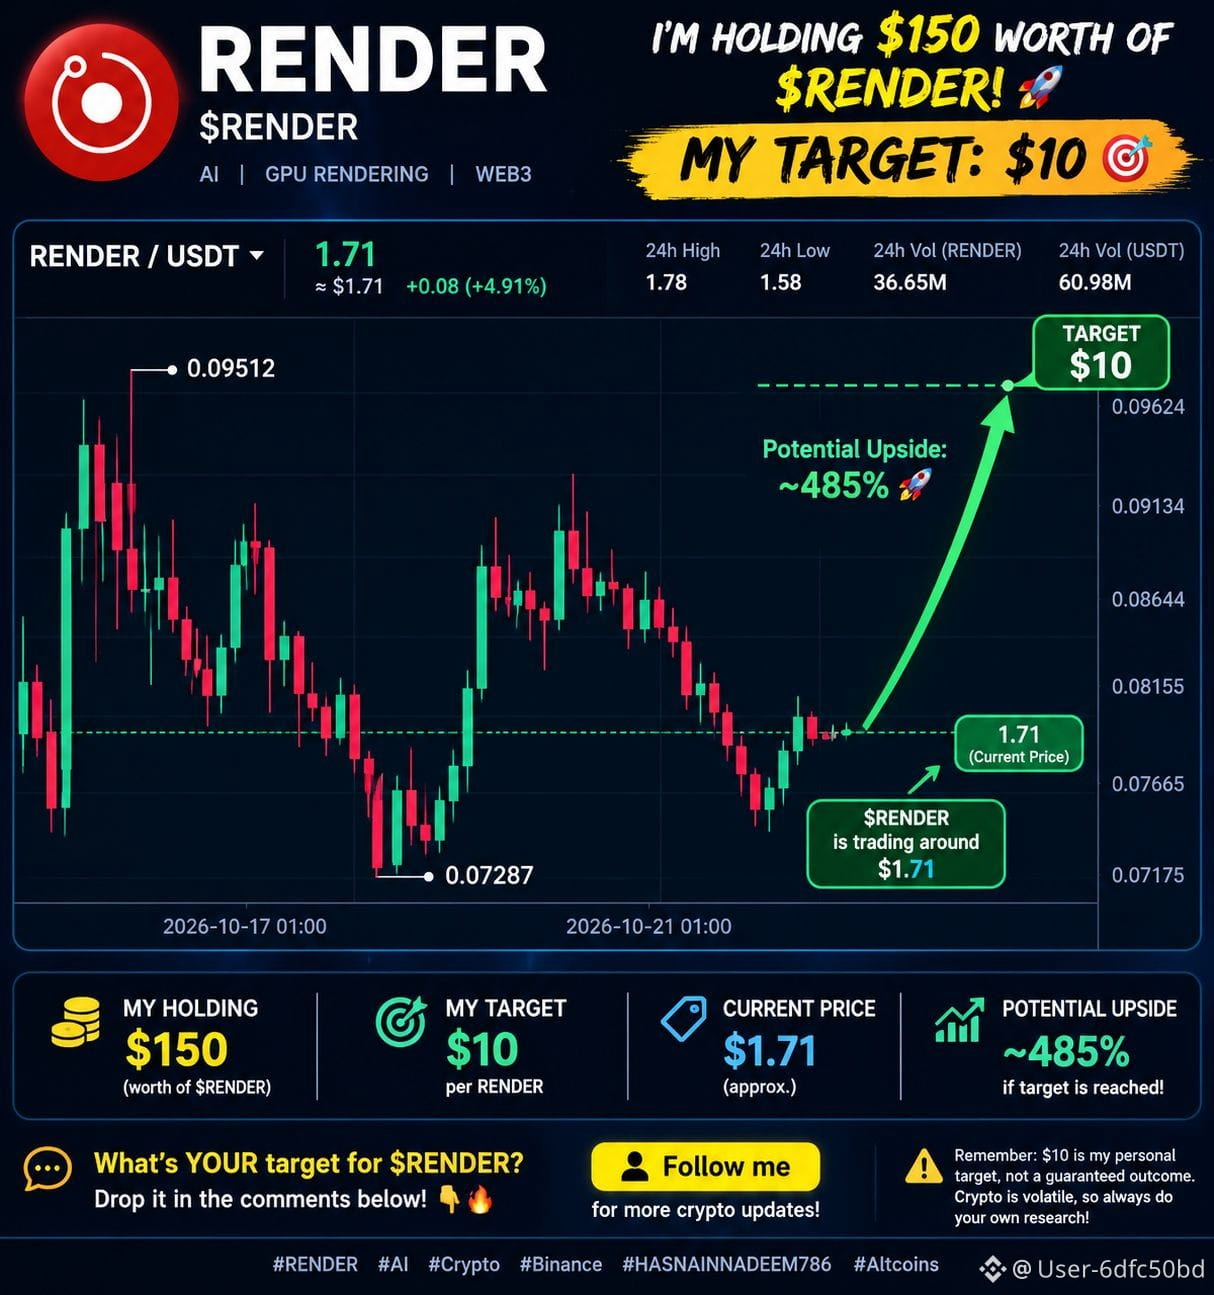
🚨🔥 $RENDER — CAN IT REACH $10?! 🤖🚀
💎 I'M HOLDING $150 WORTH OF $RENDER! 💰
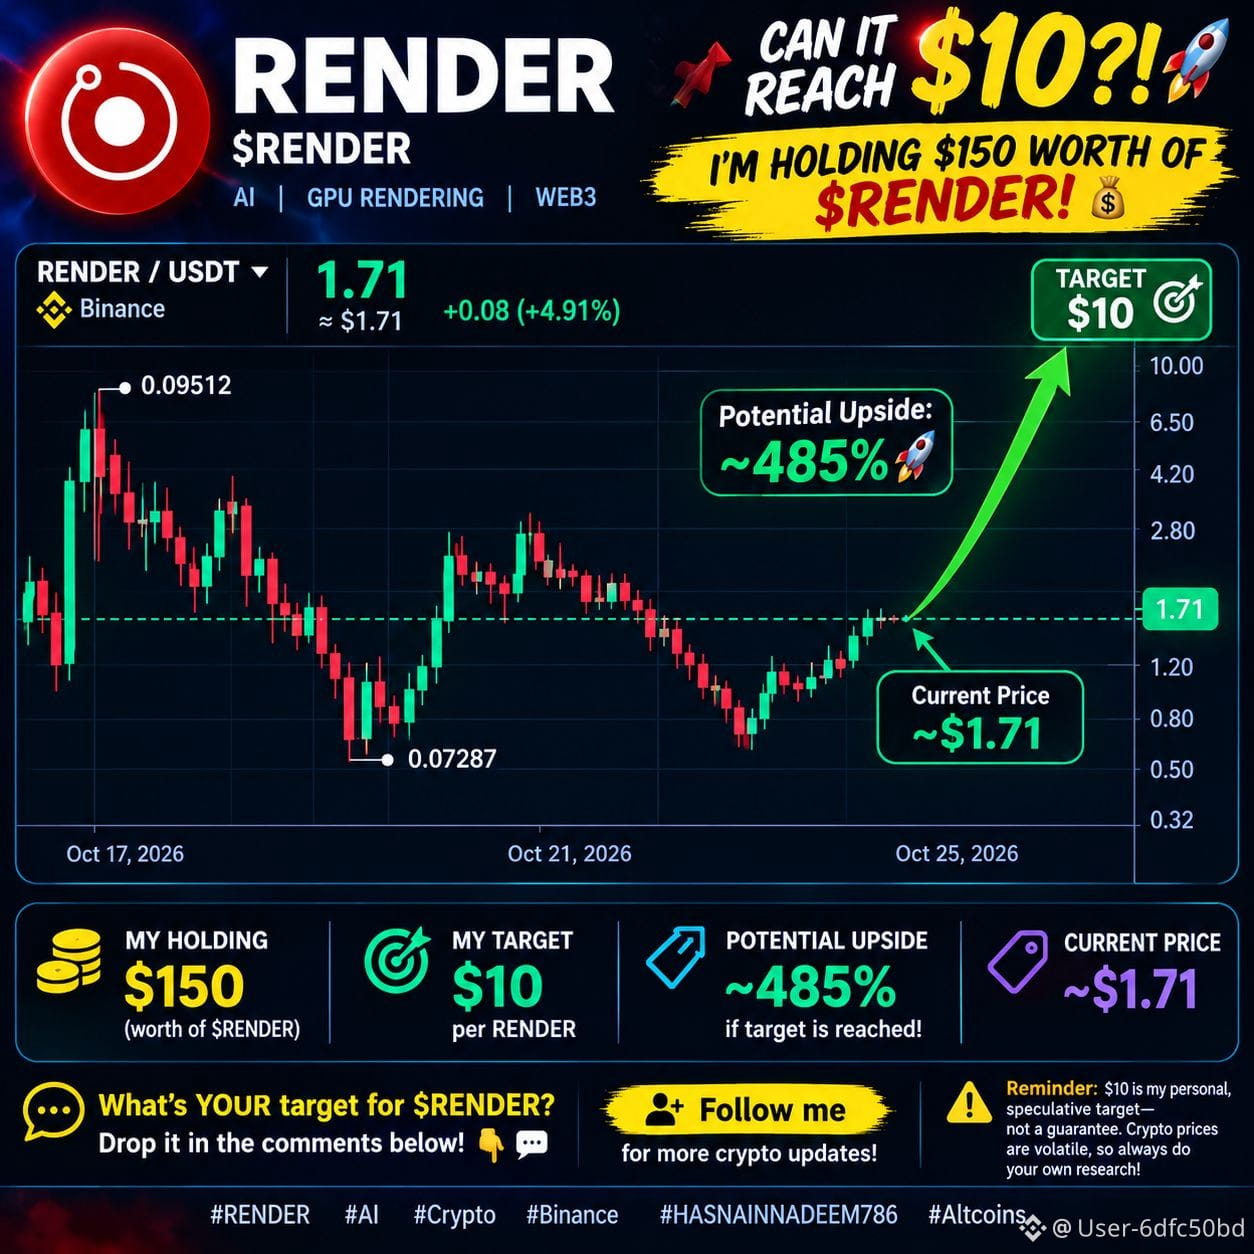
📊 CURRENT MARKET UPDATE: 💵 Current Price: ~$1.71 🎯 My Target: $10 📈 Potential Upside: ~485% if the target is reached!
🔥 I'm keeping an eye on $RENDER as the AI and GPU-rendering narrative continues to attract attention. Could we see a major recovery from here? 👀📈
💬 What's YOUR target for $RENDER? Drop it in the comments! 👇
🤝 Follow me for more crypto market updates!
⚠️ Reminder: $10 is my personal, speculative target—not a guarantee. Crypto prices are volatile, so always do your own research.
#RENDER #AI #Crypto #Binance
{future}(RENDERUSDT)
🚨🔥 $RENDER — CAN IT REACH $10?! 🤖🚀
💎 I'M HOLDING $150 WORTH OF $RENDER ! 💰
📊 CURRENT MARKET UPDATE: 💵 Current Price: ~$1.71 🎯 My Target: $10 📈 Potential Upside: ~485% if the target is reached!
🔥 I'm keeping an eye on $RENDER as the AI and GPU-rendering narrative continues to attract attention. Could we see a major recovery from here? 👀📈
💬 What's YOUR target for $RENDER ? Drop it in the comments! 👇
🤝 Follow me for more crypto market updates!
⚠️ Reminder: $10 is my personal, speculative target—not a guarantee. Crypto prices are volatile, so always do your own research.
#RENDER #AI #Crypto #Binance
Brunno Teixeira:
boa escolha 🚀🚀🚀
1
2
362

·
--
$RENDER moves 0.9 percent an hour. Most people size it like a stablecoin
Your hourly swing right now is 0.9 percent of price which is about 0.015 dollars
Suppose your account is 1000 dollars and you want to risk only 10 dollars on a trade
That is 1 percent of your total capital lost if your stop gets hit
Divide your 10 dollar risk by the 0.015 dollar hourly swing distance to find your size
You get roughly 666 shares of $RENDER to keep your risk fixed regardless of volatility
Never guess your size by gut feeling on the next trade
How do you calculate your risk per trade right now
#RENDER #TradingTips
7
🚀🔥 I’M HOLDING $150 WORTH OF $RENDER! 🤖📈
💎 MY TARGET: $10 PER RENDER! 💰
⚡ $RENDER is trading around $1.71, and I'm watching closely for a potential recovery! 👀🔥
🎯 My Target: $10
📊 Current Price: ~$1.71
🚀 Potential Upside: Approximately 485% if the target is reached!
💬 What’s YOUR target for $RENDER? Drop it in the comments below! 👇🔥
🤝 Follow me for more crypto updates!
⚠️ Remember: $10 is my personal target, not a guaranteed outcome. Crypto is volatile, so always do your own research!
#RENDER #AI #Crypto #Binance
{future}(RENDERUSDT)
🚀🔥 I’M HOLDING $150 WORTH OF $RENDER ! 🤖📈
💎 MY TARGET: $10 PER RENDER! 💰
⚡ $RENDER is trading around $1.71, and I'm watching closely for a potential recovery! 👀🔥
🎯 My Target: $10
📊 Current Price: ~$1.71
🚀 Potential Upside: Approximately 485% if the target is reached!
💬 What’s YOUR target for $RENDER ? Drop it in the comments below! 👇🔥
🤝 Follow me for more crypto updates!
⚠️ Remember: $10 is my personal target, not a guaranteed outcome. Crypto is volatile, so always do your own research!
#RENDER #AI #Crypto #Binance
2
300

·
--
🟢 Buy the dip $RENDER | RENDER/USDT
Signals: 1h · bottom fractal, 1h · reclaimed the middle band, 4h · reclaimed the middle band
Trade: 8.55 @ 1.753 (≈15 U)
Account maximum LTV 82.2%|Spot dip-buying; collateral only goes up, never down
#RENDER #QuantitativeTrading
Automated copy-trading record, not investment advice.
Signals: 1h · bottom fractal, 1h · reclaimed the middle band, 4h · reclaimed the middle band
Trade: 8.55 @ 1.753 (≈15 U)
Account maximum LTV 82.2%|Spot dip-buying; collateral only goes up, never down
#RENDER #QuantitativeTrading
Automated copy-trading record, not investment advice.
23


·
--
Bearish
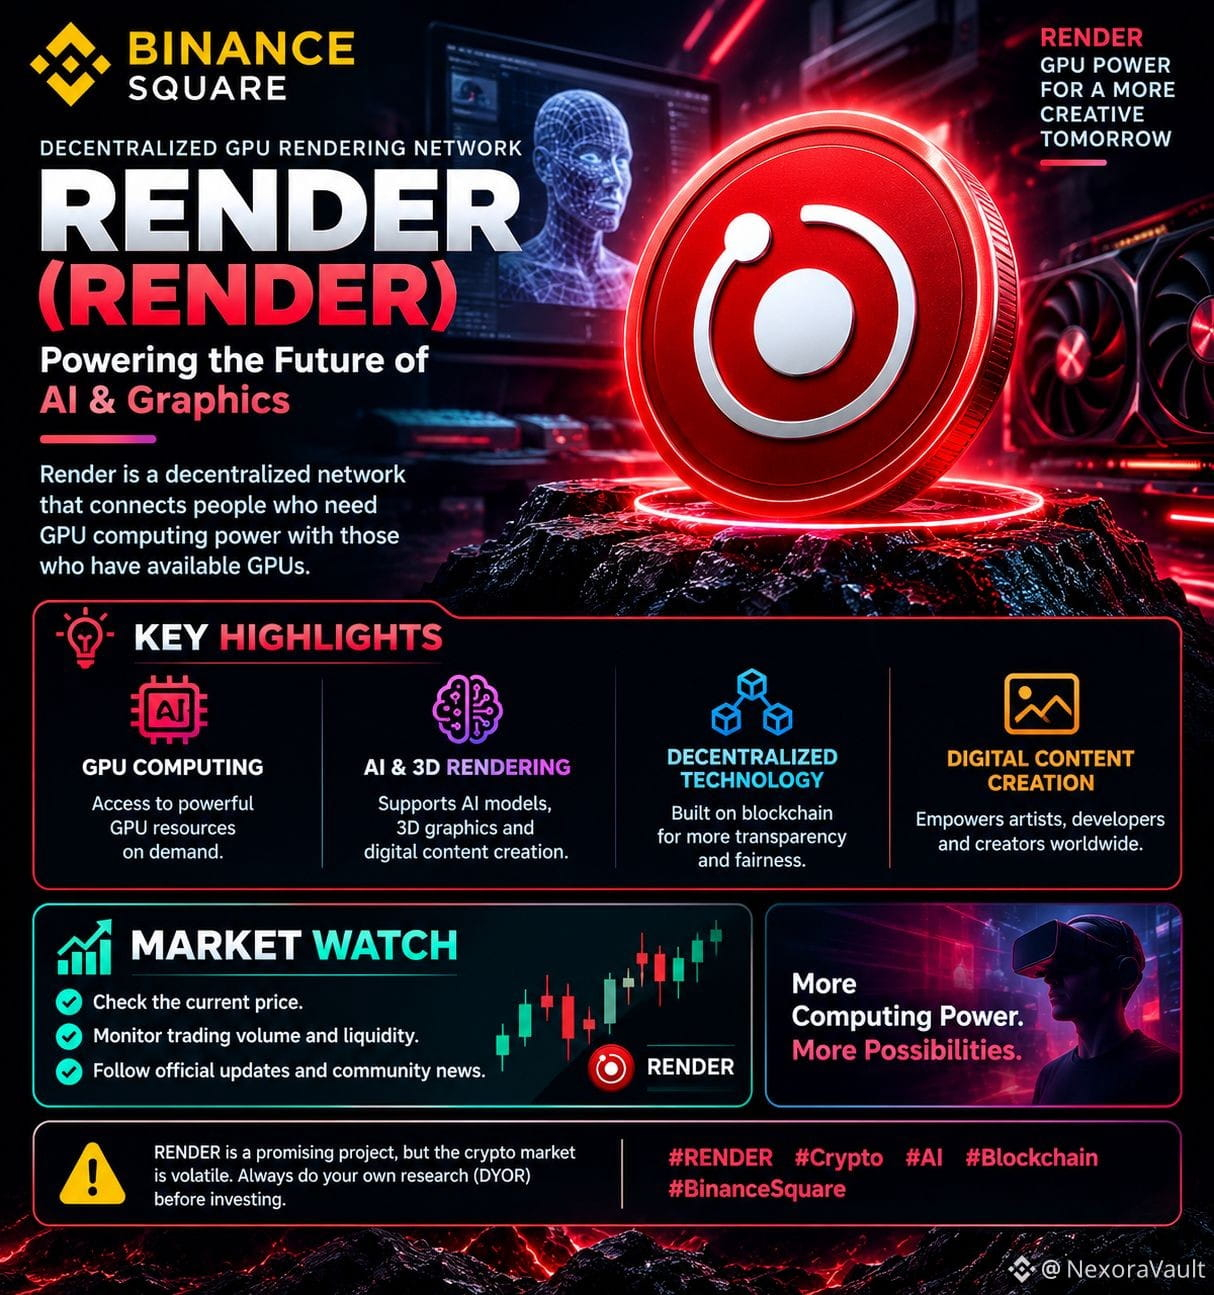
🚀 Render ($RENDER ) — Powering the Future of AI & Graphics!
🔥 Render is a decentralized network that connects people who need GPU computing power with those who have available GPUs.
💎 Key Highlights 🔹 GPU computing 🔹 AI and 3D rendering 🔹 Decentralized technology 🔹 Digital content creation
📈 AI and GPU computing are growing technology sectors, but RENDER's future price is uncertain.
⚠️ Always do your own research before investing.
#RENDER #Crypto #AI #blockchain #BinanceSquare
{spot}(RENDERUSDT)
🚀 Render ($RENDER ) — Powering the Future of AI & Graphics!
🔥 Render is a decentralized network that connects people who need GPU computing power with those who have available GPUs.
💎 Key Highlights 🔹 GPU computing 🔹 AI and 3D rendering 🔹 Decentralized technology 🔹 Digital content creation
📈 AI and GPU computing are growing technology sectors, but RENDER's future price is uncertain.
⚠️ Always do your own research before investing.
#RENDER #Crypto #AI #blockchain #BinanceSquare
2
309

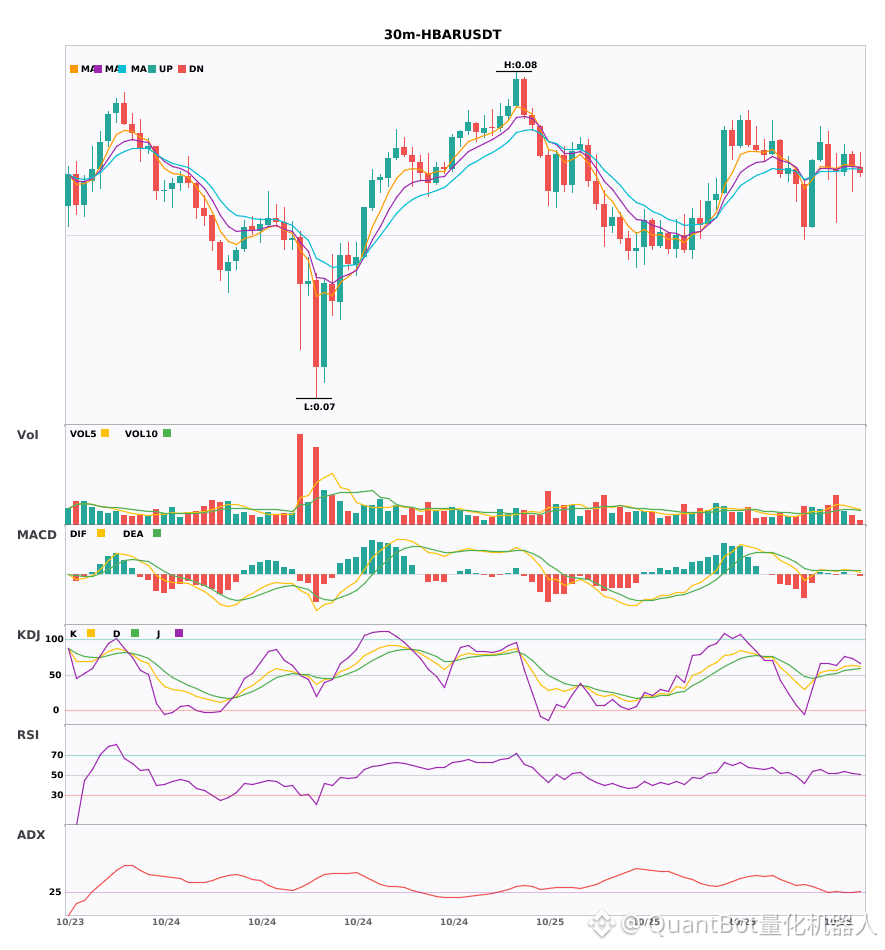
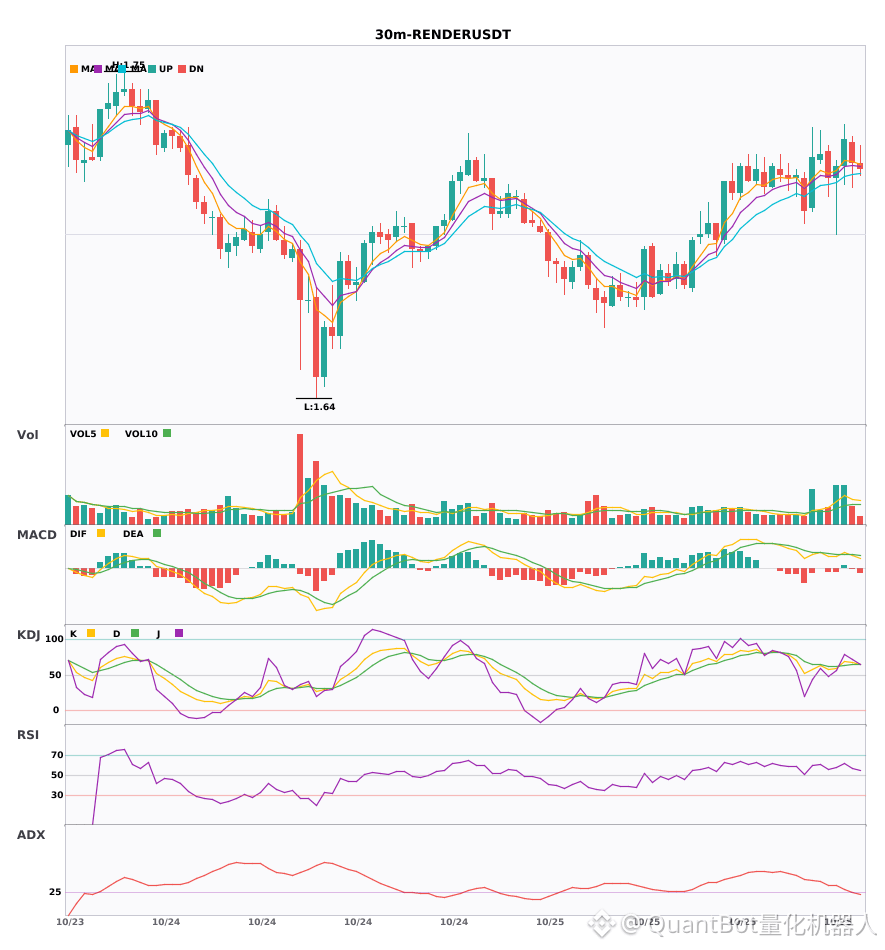
$Niu Lai / $HBAR / $RENDER 30-minute technicals are strengthening in sync. Which has greater explosive potential?
📈 $Niu Lai | 30-minute bullish signal
━━━━━━━━━━━━━━━━━━
Technical analysis: ADX(27) Trend is forming; entry is possible | MACD golden cross above zero, bullish momentum emerging | EMA5 crosses above EMA8, short-term trend turns bullish | Volume surge (2.7x)
Price change: 1.1900%
📈 $HBAR | 30-minute bullish signal
━━━━━━━━━━━━━━━━━━
Technical analysis: ADX(26) Trend is forming; entry is possible | MACD golden cross above zero, bullish momentum emerging | EMA5 > EMA8 > EMA13, bullish alignment | KDJ moving strongly, bulls have the advantage (K is 62.5, D is 55.8) | Volume increase (2.0x)
Price change: 0.2500%
📈 $RENDER | 30-minute bullish signal
━━━━━━━━━━━━━━━━━━
Technical analysis: ADX(29) Trend is forming; entry is possible | MACD golden cross above zero, bullish momentum emerging | EMA5 > EMA8 > EMA13, bullish alignment | KDJ golden cross, short-term outlook is bullish (K is 68.5, D is 63.6) | Volume increase (2.4x)
Price change: 0.5200%
━━━━━━━━━━━━━━━━━━
#技术分析 #牛来 #HBAR #RENDER
📌 The content above is for reference only and does not constitute investment advice
46

·
--
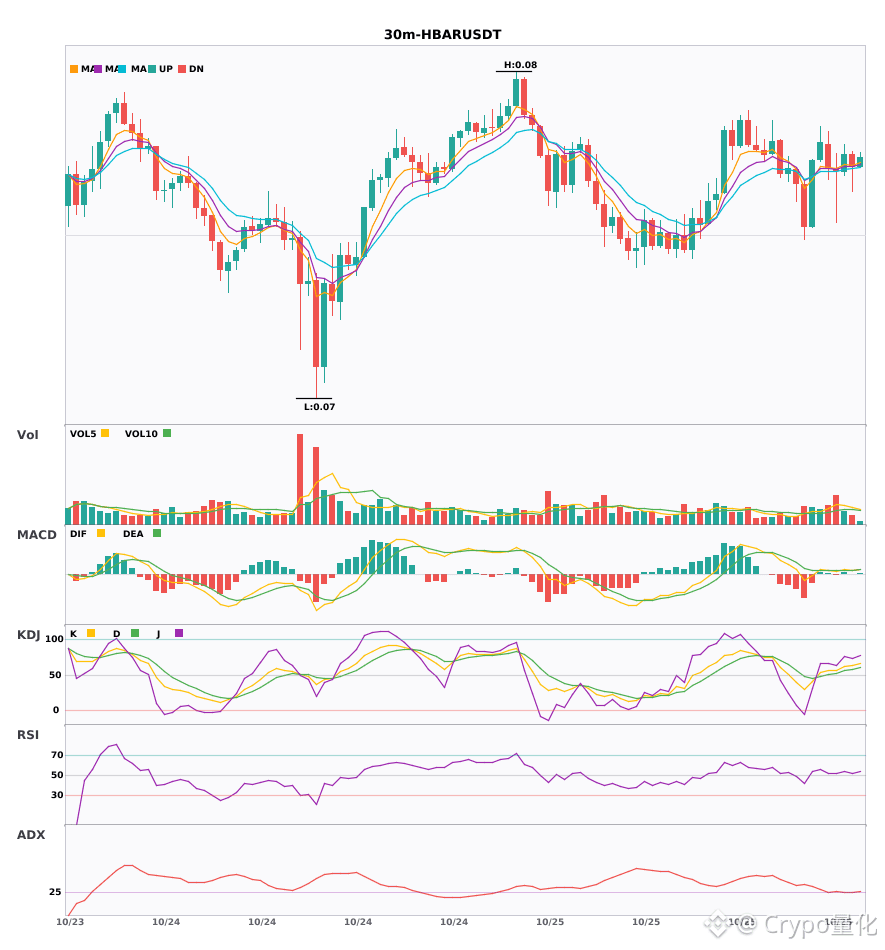
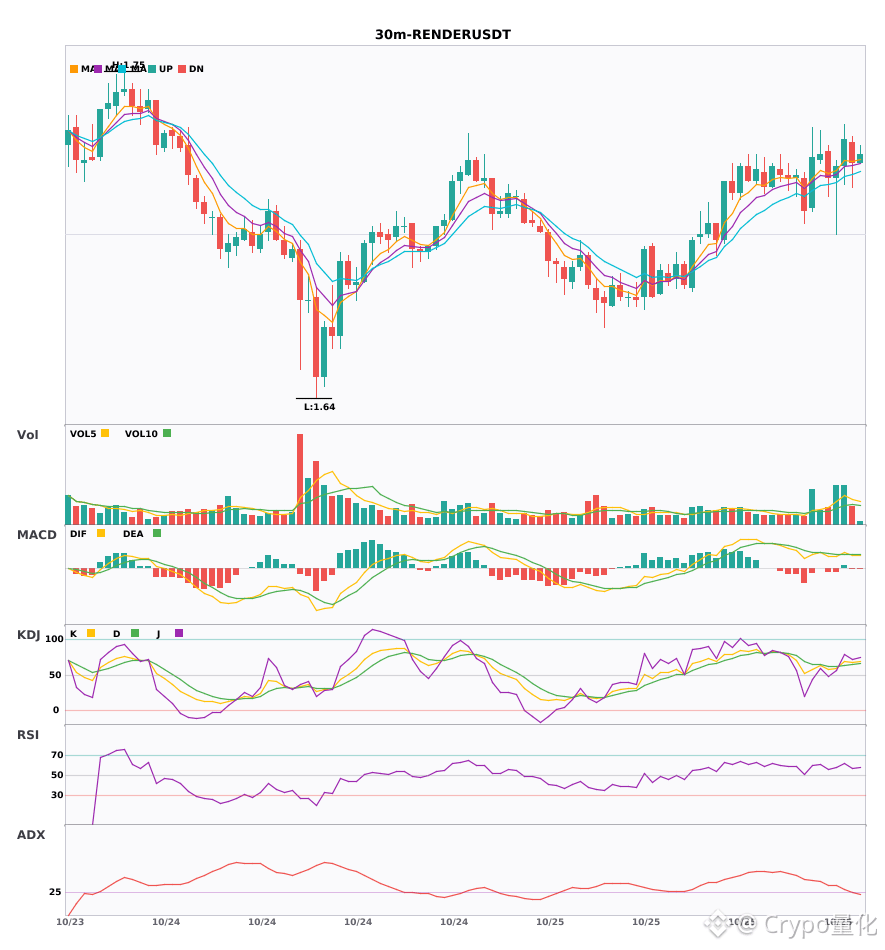
$Bull Comes / $HBAR / $RENDER 30-minute confluence turns bullish, with bullish signals appearing simultaneously 🔥
════════════════════
🔴 $Bull Comes 30-minute bullish signal
⚠️Technical analysis: ADX(27): Trend is forming; entry is possible | MACD golden cross above zero, bullish momentum released | EMA5 crosses above EMA8, short-term outlook turns bullish | Volume surge (2.7x)
════════════════════
🔴 $HBAR 30-minute bullish signal
⚠️Technical analysis: ADX(26): Trend is forming; entry is possible | MACD golden cross above zero, bullish momentum released | EMA5 > EMA8 > EMA13, bullish alignment | KDJ strong, bulls in control (K: 62.5, D: 55.8) | Volume increase (2.0x)
════════════════════
🔴 $RENDER 30-minute bullish signal
⚠️Technical analysis: ADX(29): Trend is forming; entry is possible | MACD golden cross above zero, bullish momentum released | EMA5 > EMA8 > EMA13, bullish alignment | KDJ golden cross, short-term outlook bullish (K: 68.5, D: 63.6) | Volume increase (2.4x)
════════════════════
🔔 Follow for first-hand market alerts 🔔
#技术分析 #牛来 #HBAR #RENDER
📌 When trading, check whether the candlestick pattern confirms the signal
════════════════════
🔴 $Bull Comes 30-minute bullish signal
⚠️Technical analysis: ADX(27): Trend is forming; entry is possible | MACD golden cross above zero, bullish momentum released | EMA5 crosses above EMA8, short-term outlook turns bullish | Volume surge (2.7x)
════════════════════
🔴 $HBAR 30-minute bullish signal
⚠️Technical analysis: ADX(26): Trend is forming; entry is possible | MACD golden cross above zero, bullish momentum released | EMA5 > EMA8 > EMA13, bullish alignment | KDJ strong, bulls in control (K: 62.5, D: 55.8) | Volume increase (2.0x)
════════════════════
🔴 $RENDER 30-minute bullish signal
⚠️Technical analysis: ADX(29): Trend is forming; entry is possible | MACD golden cross above zero, bullish momentum released | EMA5 > EMA8 > EMA13, bullish alignment | KDJ golden cross, short-term outlook bullish (K: 68.5, D: 63.6) | Volume increase (2.4x)
════════════════════
🔔 Follow for first-hand market alerts 🔔
#技术分析 #牛来 #HBAR #RENDER
📌 When trading, check whether the candlestick pattern confirms the signal
49

·
--
Are you buying the bounce at $RENDER or waiting for a lower price?
The big players are long and the crowd is selling RENDER
The price is below its 4h EMA50 ($1.7918) and the RSI reads 54.0: neither euphoria nor panic, just a level that calls for confirmation.
Accounts are 58.3% short, but top traders’ positions are 59.7% long: the crowd and the big players aren’t on the same side.
Taker flow over the last hour shows just 43.8% buys, and the ±2% order book is nearly even ($1.01M versus $0.96M).
Outside the market, DEX volume fell 18.1% in 24h, according to DefiLlama: money is moving cautiously today.
Save this: the zone is right at the current price, and this setup is valid once it’s confirmed.
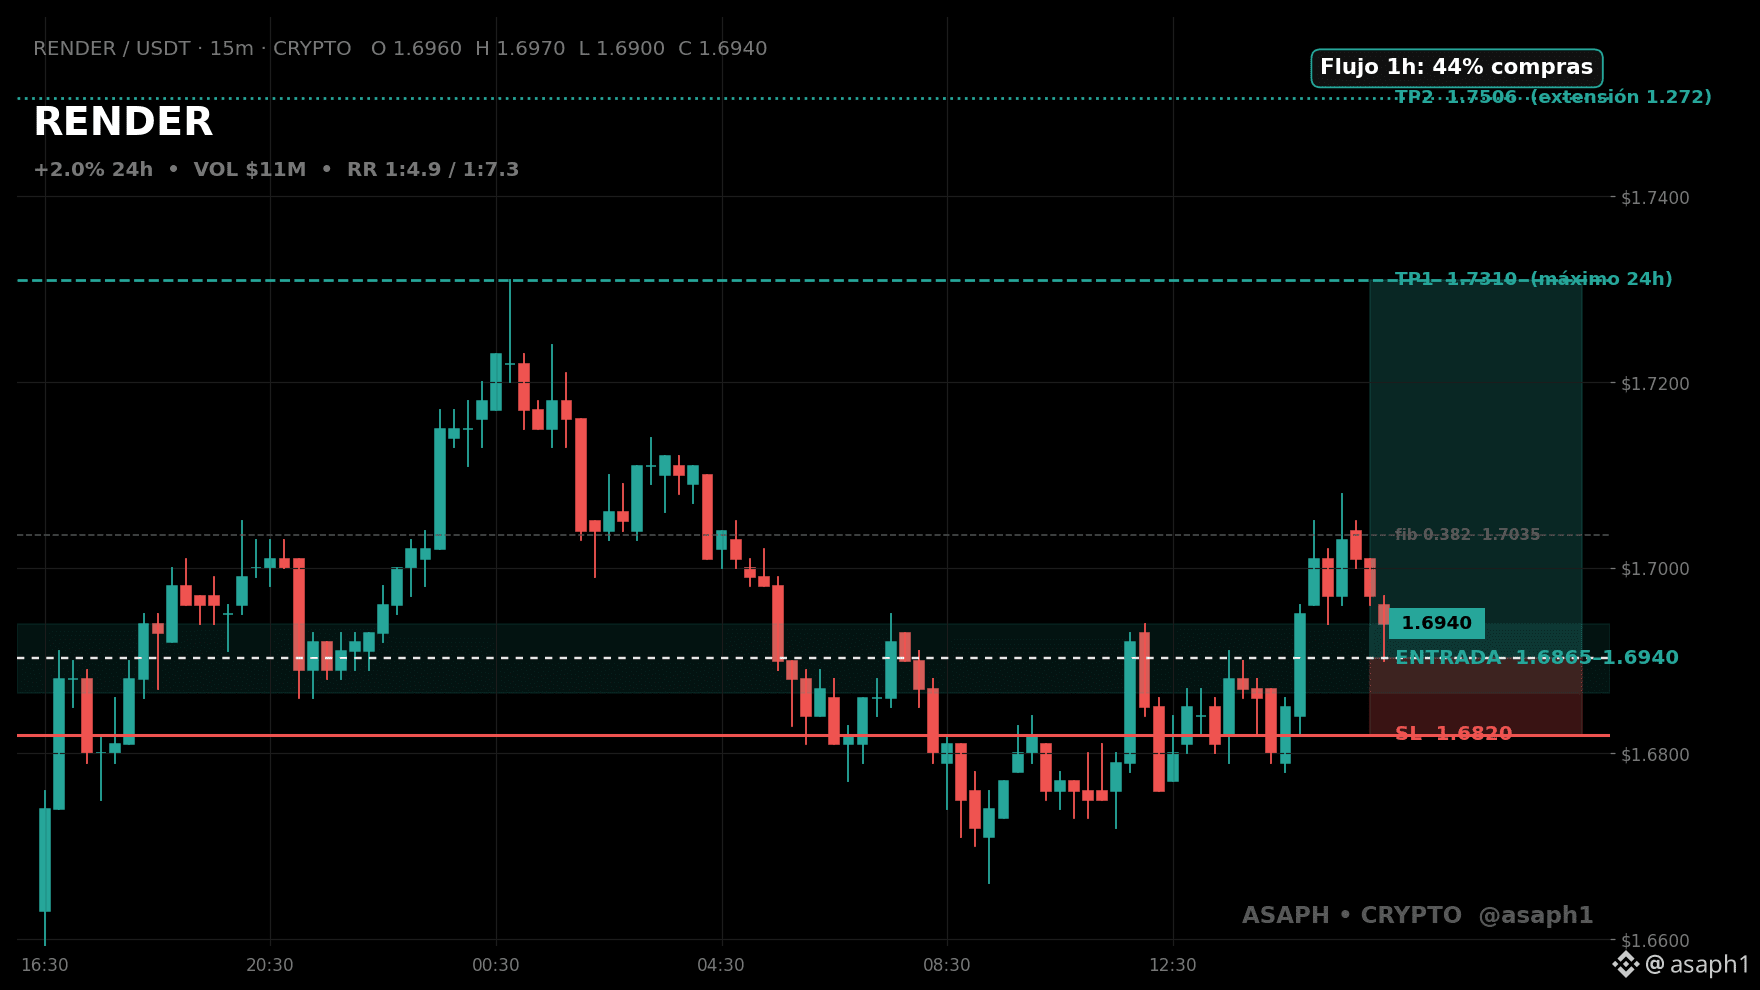
📍 Current price: $1.694
🎯 Zone: $1.6865–$1.694
Entry: limit order in the zone, average $1.69025.
🛑 Stop: $1.682 (−0.49% from the average), confirmed BEFORE entering.
Risk per trade: 2% of capital.
✅ TP1: $1.731, take profit on 50% and move the stop to my entry.
🏁 TP2: $1.750584, the 1.272 extension that closes the move.
R/R: 1:4.94 · 1:7.31.
⏳ Valid: next 4h or as long as it doesn’t lose $1.682.
Live price here 👇 RENDER
RENDER #Render #Largo #Crypto
This is a plan, not financial advice.
1
94
·
--
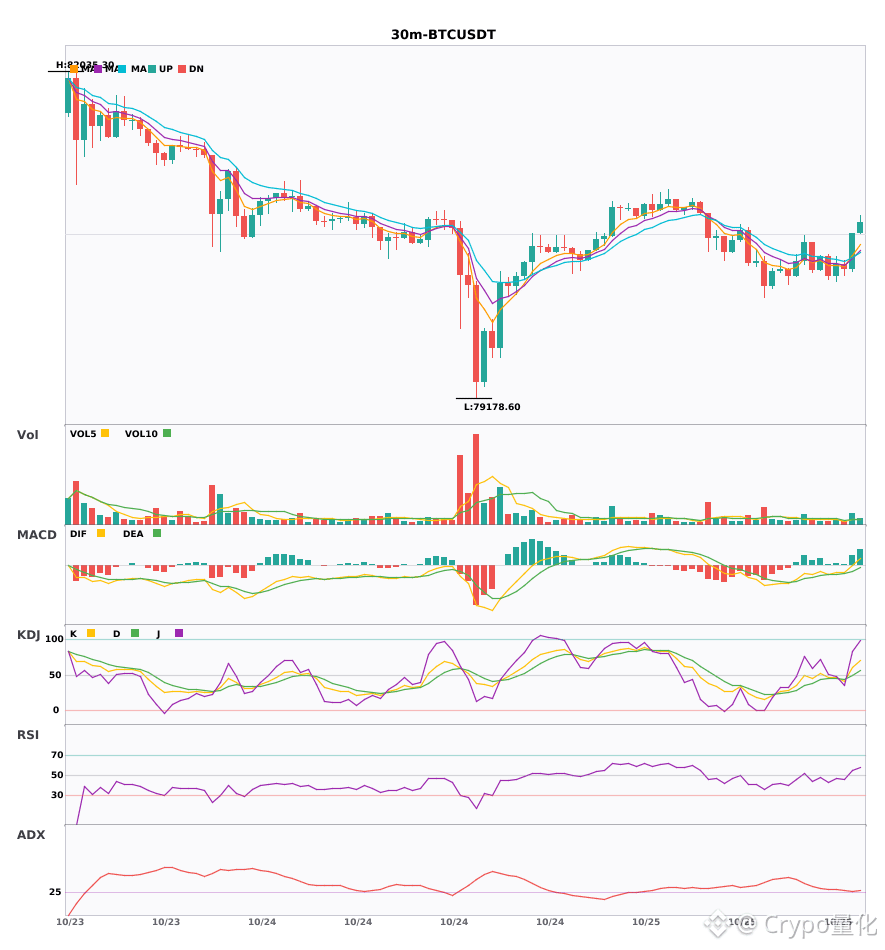
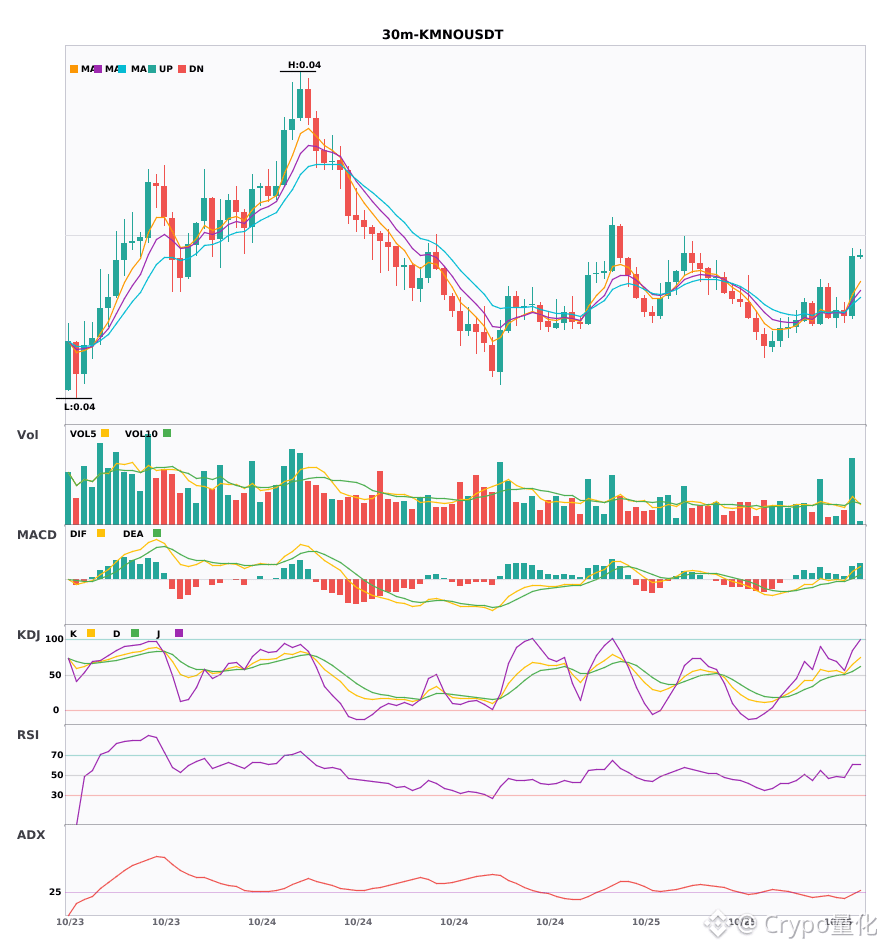
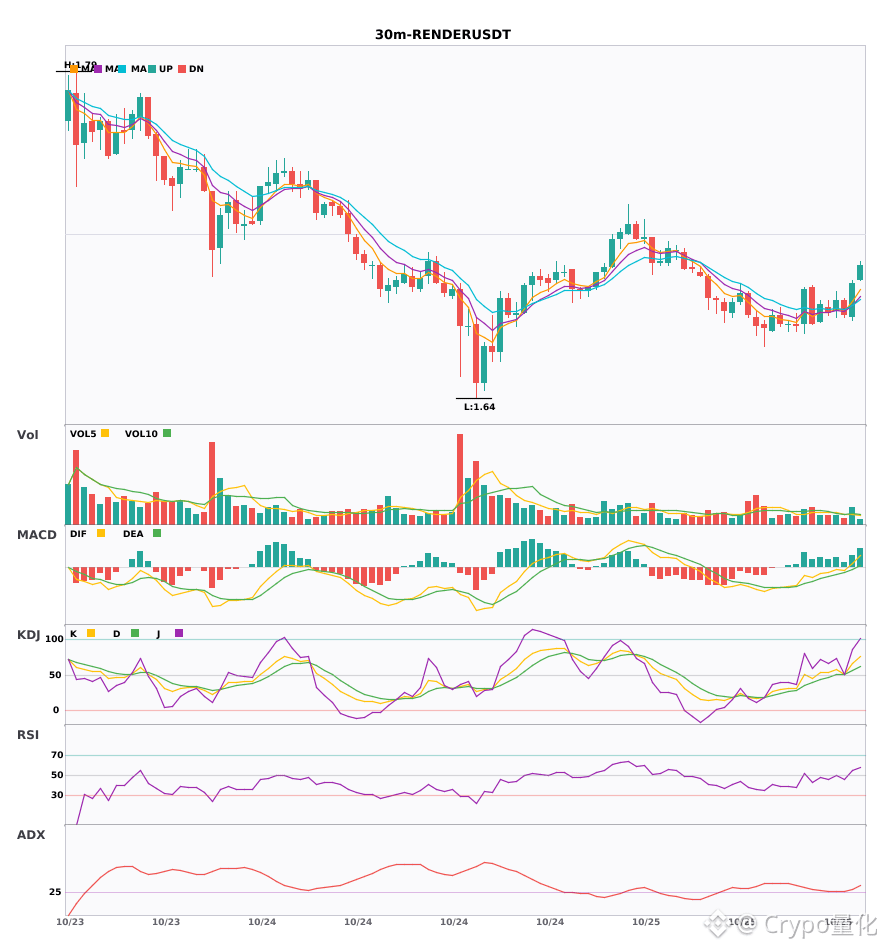
$BTC / $KMNO / $RENDER 30-minute technical indicators are strengthening in sync—which has greater breakout potential? 🔥
════════════════════
🔴 $BTC 30-minute bullish signal
⚠️Technical indicators: ADX(26): Trend is forming; participation is possible | MACDDIF breaks above the zero line, signaling a bullish trend | EMA5 crosses above EMA8, turning bullish in the short term | KDJ golden cross, bullish in the short term (K: 60.6, D: 49.3) | Trading volume increases (2.1x)
════════════════════
🔴 $KMNO 30-minute bullish signal
⚠️Technical indicators: ADX(26): Trend is forming; participation is possible | MACDDIF breaks above the zero line, signaling a bullish trend | EMA5 > EMA8 > EMA13, bullish alignment | KDJ is running strong, with bulls in control (K: 65.4, D: 55.6) | Trading volume surges (2.8x)
════════════════════
🔴 $RENDER 30-minute bullish signal
⚠️Technical indicators: ADX(33): Clear trending market | MACDDIF breaks above the zero line, signaling a bullish trend | EMA5 > EMA8 > EMA13, bullish alignment | KDJ is running strong, with bulls in control (K: 65.9, D: 55.8) | Trading volume increases (1.5x)
════════════════════
🔔 Follow us for real-time market updates 🔔
#技术分析 #BTC #KMNO #RENDER
📌 When trading, pay attention to whether the candlestick pattern confirms the setup
════════════════════
🔴 $BTC 30-minute bullish signal
⚠️Technical indicators: ADX(26): Trend is forming; participation is possible | MACDDIF breaks above the zero line, signaling a bullish trend | EMA5 crosses above EMA8, turning bullish in the short term | KDJ golden cross, bullish in the short term (K: 60.6, D: 49.3) | Trading volume increases (2.1x)
════════════════════
🔴 $KMNO 30-minute bullish signal
⚠️Technical indicators: ADX(26): Trend is forming; participation is possible | MACDDIF breaks above the zero line, signaling a bullish trend | EMA5 > EMA8 > EMA13, bullish alignment | KDJ is running strong, with bulls in control (K: 65.4, D: 55.6) | Trading volume surges (2.8x)
════════════════════
🔴 $RENDER 30-minute bullish signal
⚠️Technical indicators: ADX(33): Clear trending market | MACDDIF breaks above the zero line, signaling a bullish trend | EMA5 > EMA8 > EMA13, bullish alignment | KDJ is running strong, with bulls in control (K: 65.9, D: 55.8) | Trading volume increases (1.5x)
════════════════════
🔔 Follow us for real-time market updates 🔔
#技术分析 #BTC #KMNO #RENDER
📌 When trading, pay attention to whether the candlestick pattern confirms the setup
26

·
--
Article
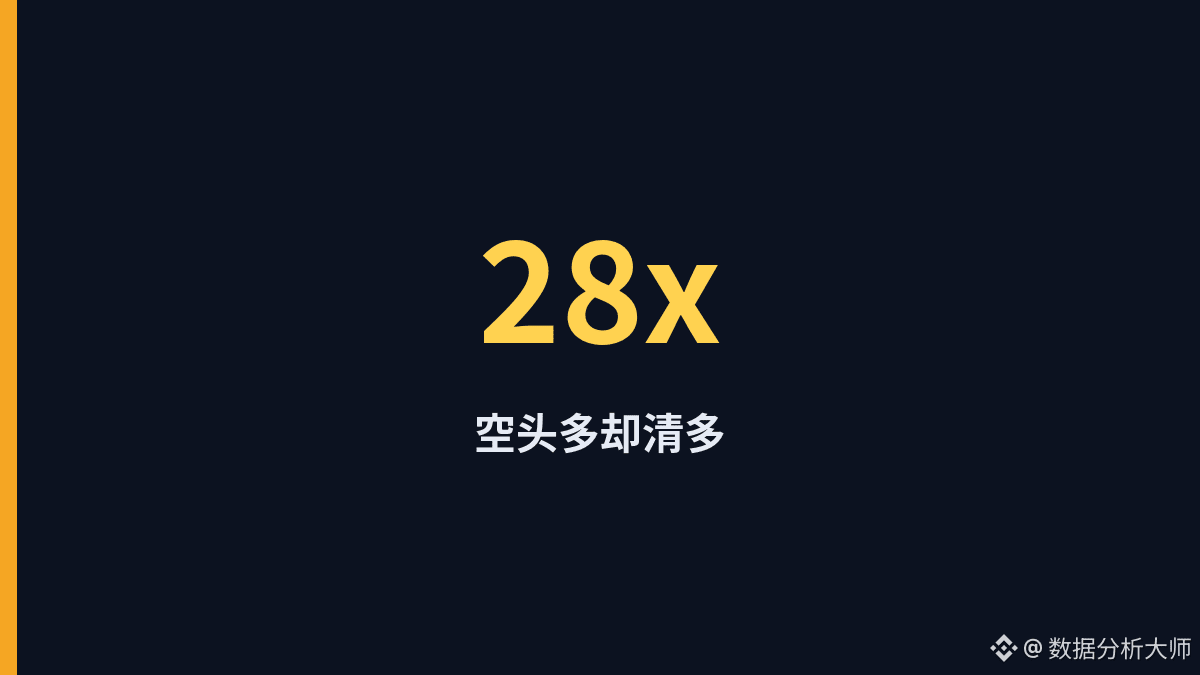
Why were RENDER long liquidations nearly 28 times higher when short accounts made up nearly 60%?RENDER prices barely moved on either side, falling less than 1%, while short accounts made up nearly 60%. Over the 24-hour period, however, about $167,500 in long positions were liquidated, compared with only about $6,000 in shorts—a roughly 27.9-to-1 imbalance. In a slight downturn, liquidations almost entirely hit long positions.
Binance: about $1.67900000 (-0.5920%); OKX: about $1.67800000 (-0.6513%). Over 24 hours, about $167,500 in long positions and $6,000 in short positions were liquidated, for a total of about $173,500 across 198 liquidations. Open interest: about 11.46 million on Binance and 2.49 million on OKX; funding rates were slightly positive on both exchanges. Long/short account ratio: about 40.7%/59.3%.
Prices barely moved, and short accounts still significantly outnumbered longs, yet liquidations were nearly 28-to-1, overwhelmingly hitting longs—more like highly leveraged long positions being flushed out during a slight dip.
Why were RENDER long liquidations nearly 28 times higher when short accounts made up nearly 60%?
RENDER prices barely moved on either side, falling less than 1%, while short accounts made up nearly 60%. Over the 24-hour period, however, about $167,500 in long positions were liquidated, compared with only about $6,000 in shorts—a roughly 27.9-to-1 imbalance. In a slight downturn, liquidations almost entirely hit long positions.
Binance: about $1.67900000 (-0.5920%); OKX: about $1.67800000 (-0.6513%). Over 24 hours, about $167,500 in long positions and $6,000 in short positions were liquidated, for a total of about $173,500 across 198 liquidations. Open interest: about 11.46 million on Binance and 2.49 million on OKX; funding rates were slightly positive on both exchanges. Long/short account ratio: about 40.7%/59.3%.
Prices barely moved, and short accounts still significantly outnumbered longs, yet liquidations were nearly 28-to-1, overwhelmingly hitting longs—more like highly leveraged long positions being flushed out during a slight dip.
5

·
--
🚨 INSTITUTIONAL TRAP DETECTED: $RENDERUSDT
MASSIVE order flow imbalance just hit the tape. We are seeing aggressive distribution as CVD diverges sharply from price action. Smart money is dumping into retail FOMO.
Liquidity is being swept to the upside to fuel a VIOLENT reversal. This is a classic stop-hunt before the collapse. The window to enter the SHORT is closing FAST.
EXECUTION:
ENTRY: 1.694 $RENDER
SL: 1.785
TP1: 1.550
TP2: 1.420
RR: 1:3.5+
Is $RENDER hitting a hard supply wall or is this just a deep pullback before a breakout? Drop your bias below.
#RENDER #BinanceSquare #SlowSclap #TradingAnalysis
10



·
--
Bearish
$RENDER Under Pressure: Can Buyers Defend the $1.70 Zone?
is trading at $1.701, down 4.60% in the screenshot. Sellers are clearly in control of the displayed move. A recovery needs stronger buying pressure, while a failure to hold support could invite further downside. Watch volume before considering any entry.
#RENDER #Altcoins #cryptotrading $RENDER
{future}(RENDERUSDT)
$RENDER Under Pressure: Can Buyers Defend the $1.70 Zone?
is trading at $1.701, down 4.60% in the screenshot. Sellers are clearly in control of the displayed move. A recovery needs stronger buying pressure, while a failure to hold support could invite further downside. Watch volume before considering any entry.
#RENDER #Altcoins #cryptotrading $RENDER
is trading at $1.701, down 4.60% in the screenshot. Sellers are clearly in control of the displayed move. A recovery needs stronger buying pressure, while a failure to hold support could invite further downside. Watch volume before considering any entry.
#RENDER #Altcoins #cryptotrading $RENDER
1
197
·
--
$RENDER sits 10.5 percent off the 7 day high sitting down here at 1.7410
Volume matches the week average exactly at 3.5M with the 1h RSI cooling to 42
This zone tests patience while the range tightens up between 1.7000 and 1.8090
Fade or follow?
#RENDER #MarketUpdate
$RENDER sits 10.5 percent off the 7 day high sitting down here at 1.7410
Volume matches the week average exactly at 3.5M with the 1h RSI cooling to 42
This zone tests patience while the range tightens up between 1.7000 and 1.8090
Fade or follow?
#RENDER #MarketUpdate
Volume matches the week average exactly at 3.5M with the 1h RSI cooling to 42
This zone tests patience while the range tightens up between 1.7000 and 1.8090
Fade or follow?
#RENDER #MarketUpdate
10
Log in to explore more content
Join global crypto users on Binance Square
⚡️ Get latest and useful information about crypto.
💬 Trusted by the world’s largest crypto exchange.
👍 Discover real insights from verified creators.
Email / Phone number
Trending Topics
1
#BinancePick
3M views
152,117 Discussing
2
#EarningsSeason
5.2M views
25,849 Discussing
3
#AnthropicTTMRevenueGrewAbout1200%
23,009 views
356 Discussing
4
#AnthropicS1ExpectedToday
22,864 views
304 Discussing
5
#SouthKoreaReportedlyWeighsFourthCryptoTaxDelay
27,540 views
428 Discussing
6
#FranklinTempletonFilesForTwoDividendToBitcoinETFs
36,045 views
518 Discussing
7
#StrategyMSTRSurpassesNasdaqInMarketCap
27,283 views
375 Discussing
8
#CanadaProposesStablecoinRedemptionWithin3BusinessDays
1,235 views
35 Discussing
9
#ElectrumWalletBugLetRogueServersStealFunds
28,761 views
452 Discussing
10
#ArgentineCourtDismissesLIBRACaseAgainstMilei
43,558 views
559 Discussing