
#pltr
pltr
78,868 views
841 Discussing
Hot
Latest

·
--
$BMNR, $BTC, $PLTR 4-hour moving averages in a bearish alignment; the short-term is clearly under pressure🔥
════════════════════
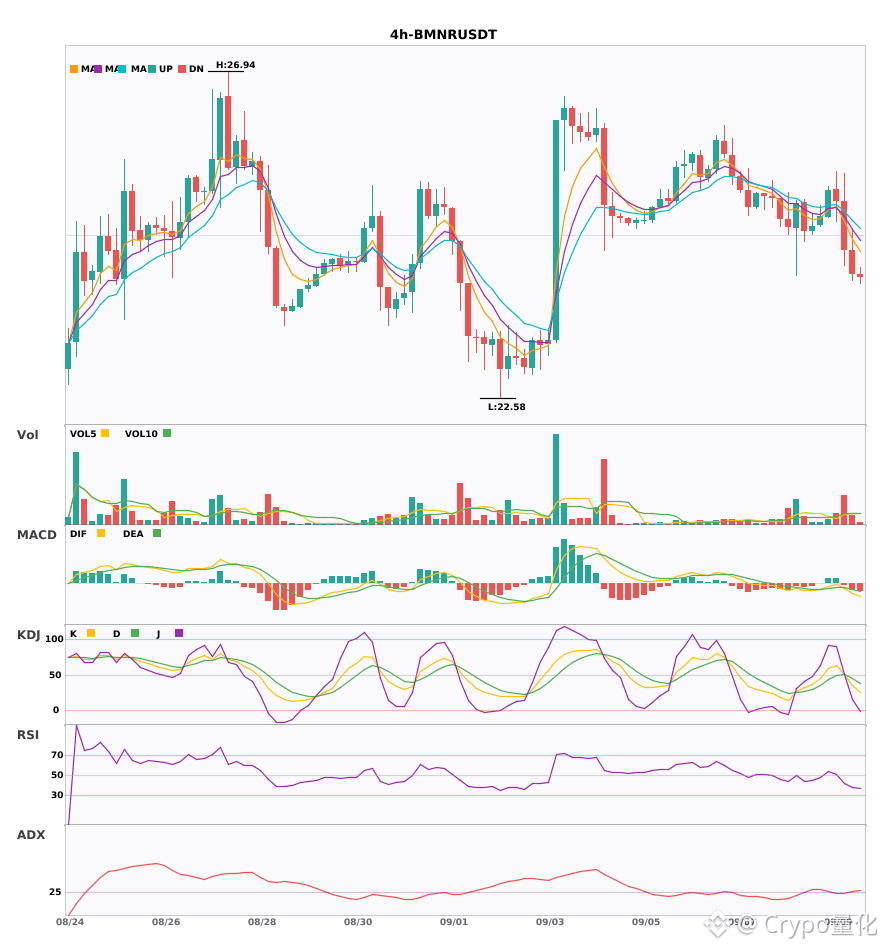
🟢 $BMNR 4-hour Bearish Signal
⚠️ Technicals: ADX 27 indicates the trend is taking shape and you can participate. However, the MACD has a dead cross below the zero line—bears are accelerating. EMA5 has also fallen below EMA8, turning the short-term bearish. KDJ is still relatively strong with K crossing above D (K50.2, D50.0), so the bulls haven’t fully given up. Trading volume surged by 2.6x.
════════════════════
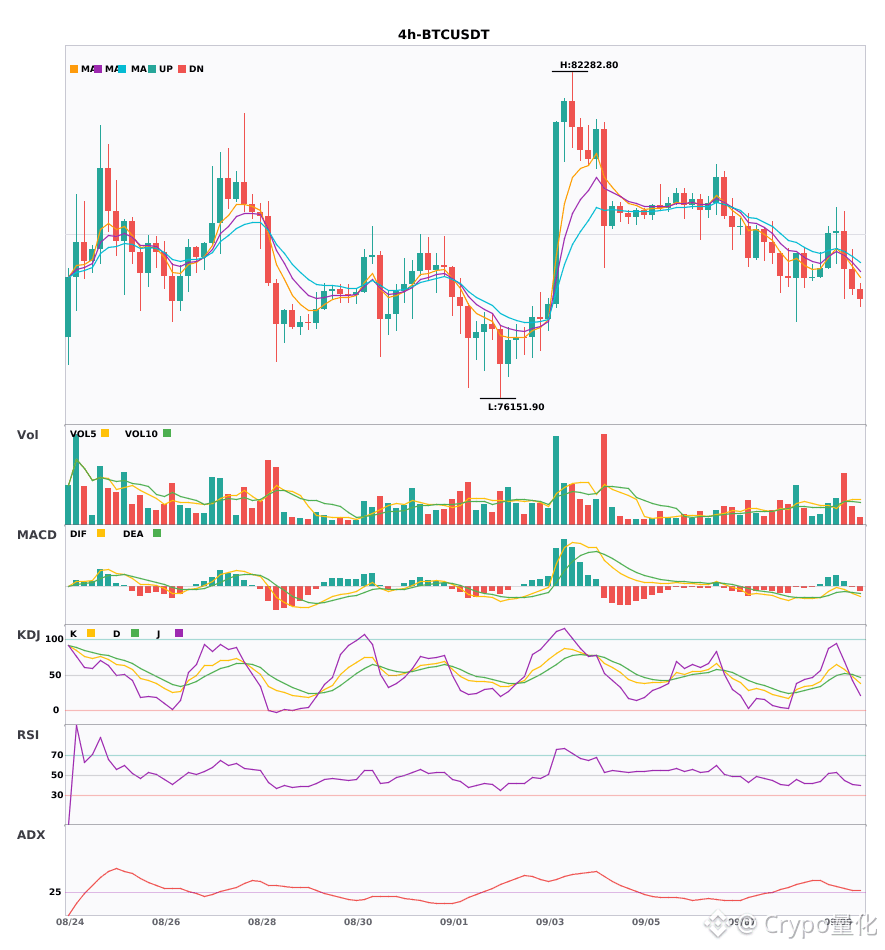
🟢 $BTC 4-hour Bearish Signal
⚠️ Technicals: ADX 29 suggests the trend is forming—follow it. MACD has a dead cross below the zero line, and bears are accelerating. EMA5, EMA8, and EMA13 are aligned bearish from top to bottom. KDJ has also formed a dead cross; K47.9 is below D50.8, so the short-term is slightly bearish. Volume expanded another 2.2x.
════════════════════
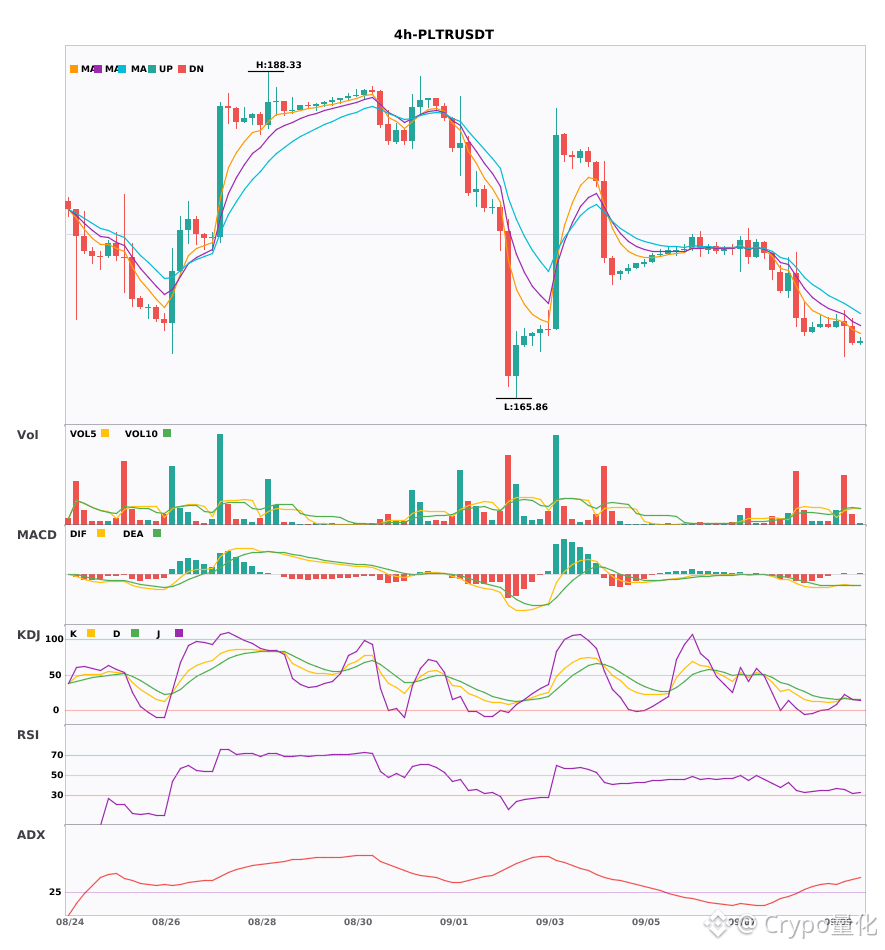
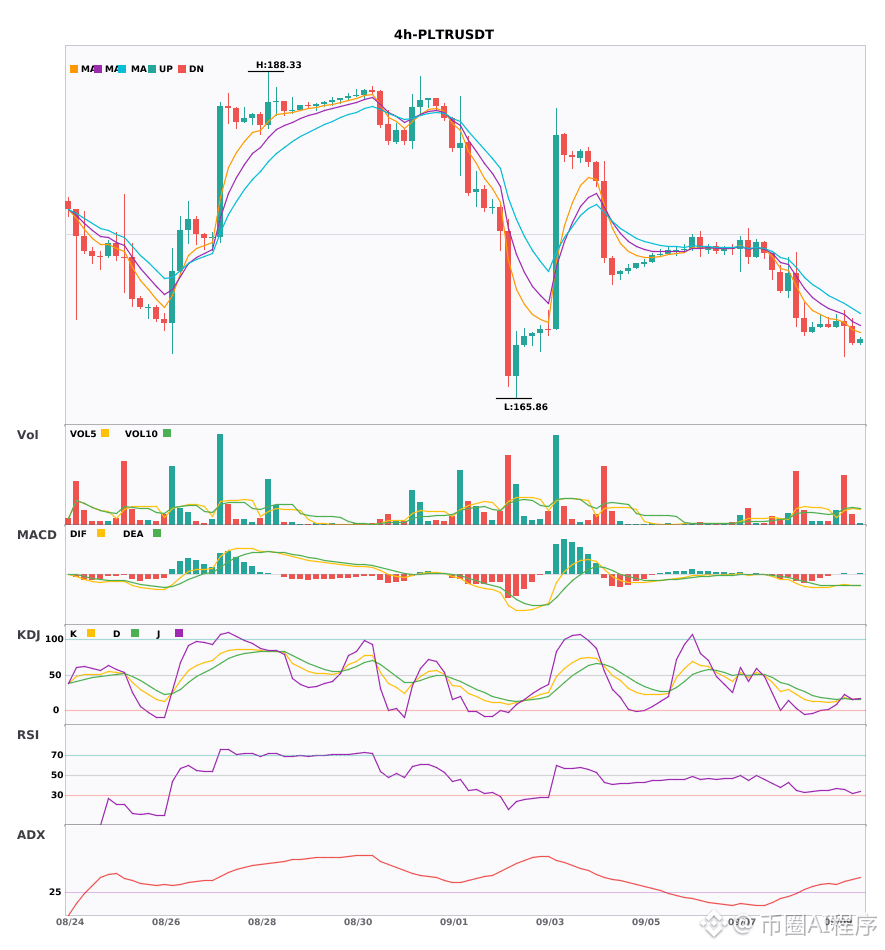
🟢 $PLTR 4-hour Bearish Signal
⚠️ Technicals: ADX 44 shows the trend is very strong. MACD has a dead cross below the zero line—bears are accelerating. EMA5, EMA8, and EMA13 are spread out from top to bottom, a textbook bearish alignment. KDJ also formed a dead cross; K=16.3 and D=16.4, suggesting a bearish short-term outlook. Volume is also up by 3x.
════════════════════
🔔 Watch for first-hand updates on sudden market moves 🔔
#技术分析 #BMNR #BTC #PLTR
📌 During trading, pay attention to whether the candlestick pattern matches
$BMNR , $BTC , $PLTR 4-hour moving averages in a bearish alignment; the short-term is clearly under pressure🔥
════════════════════
🟢 $BMNR 4-hour Bearish Signal
⚠️ Technicals: ADX 27 indicates the trend is taking shape and you can participate. However, the MACD has a dead cross below the zero line—bears are accelerating. EMA5 has also fallen below EMA8, turning the short-term bearish. KDJ is still relatively strong with K crossing above D (K50.2, D50.0), so the bulls haven’t fully given up. Trading volume surged by 2.6x.
════════════════════
🟢 $BTC 4-hour Bearish Signal
⚠️ Technicals: ADX 29 suggests the trend is forming—follow it. MACD has a dead cross below the zero line, and bears are accelerating. EMA5, EMA8, and EMA13 are aligned bearish from top to bottom. KDJ has also formed a dead cross; K47.9 is below D50.8, so the short-term is slightly bearish. Volume expanded another 2.2x.
════════════════════
🟢 $PLTR 4-hour Bearish Signal
⚠️ Technicals: ADX 44 shows the trend is very strong. MACD has a dead cross below the zero line—bears are accelerating. EMA5, EMA8, and EMA13 are spread out from top to bottom, a textbook bearish alignment. KDJ also formed a dead cross; K=16.3 and D=16.4, suggesting a bearish short-term outlook. Volume is also up by 3x.
════════════════════
🔔 Watch for first-hand updates on sudden market moves 🔔
#技术分析 #BMNR #BTC #PLTR
📌 During trading, pay attention to whether the candlestick pattern matches
════════════════════
🟢 $BMNR 4-hour Bearish Signal
⚠️ Technicals: ADX 27 indicates the trend is taking shape and you can participate. However, the MACD has a dead cross below the zero line—bears are accelerating. EMA5 has also fallen below EMA8, turning the short-term bearish. KDJ is still relatively strong with K crossing above D (K50.2, D50.0), so the bulls haven’t fully given up. Trading volume surged by 2.6x.
════════════════════
🟢 $BTC 4-hour Bearish Signal
⚠️ Technicals: ADX 29 suggests the trend is forming—follow it. MACD has a dead cross below the zero line, and bears are accelerating. EMA5, EMA8, and EMA13 are aligned bearish from top to bottom. KDJ has also formed a dead cross; K47.9 is below D50.8, so the short-term is slightly bearish. Volume expanded another 2.2x.
════════════════════
🟢 $PLTR 4-hour Bearish Signal
⚠️ Technicals: ADX 44 shows the trend is very strong. MACD has a dead cross below the zero line—bears are accelerating. EMA5, EMA8, and EMA13 are spread out from top to bottom, a textbook bearish alignment. KDJ also formed a dead cross; K=16.3 and D=16.4, suggesting a bearish short-term outlook. Volume is also up by 3x.
════════════════════
🔔 Watch for first-hand updates on sudden market moves 🔔
#技术分析 #BMNR #BTC #PLTR
📌 During trading, pay attention to whether the candlestick pattern matches
120

·
--
$TRIA / $PLTR 4 hour moving averages are in a bearish arrangement, and the divergence is dispersing downward. The downtrend on the daily chart has been confirmed🔥
════════════════════
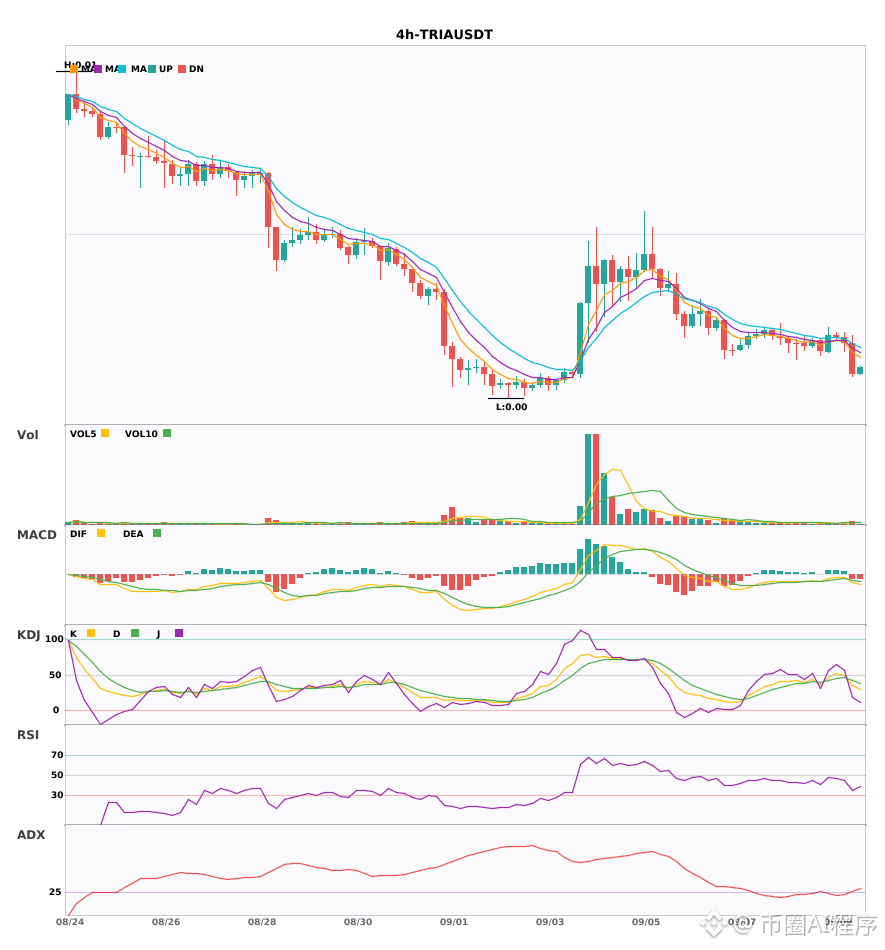
🟢 $TRIA 4 hour Bearish Signal
⚠️ Technicals: Daily chart bearish + 4-hour chart bearish resonance confirms! The 4-hour MACD is below the zero line and has a dead cross; the bears are accelerating. EMA5, 8, and 13 are arranged bearishly and diverging downward. KDJ has a dead cross, with the K value dropping to 34.8 below the D value at 42.7; it’s not yet oversold. Volume has increased by 1.6x, and the selloff has strong momentum.
════════════════════
🟢 $PLTR 4 hour Bearish Signal
⚠️ Technicals: Daily chart bearish + 4-hour chart bearish resonance; direction is consistent. The 4-hour MACD is below the zero line and has a dead cross, with green histogram bars expanding. Moving averages (EMA5, 8, 13) are bearishly arranged and pointing downward. KDJ has a dead cross (K16.3, D16.4), and volume has expanded 3x, accelerating the decline.
════════════════════
🔔 Watch for the first-hand market action/abnormal moves 🔔
#多周期共振 #TRIA #PLTR
📌 When trading, pay attention to whether the candlestick patterns match
$TRIA / $PLTR 4 hour moving averages are in a bearish arrangement, and the divergence is dispersing downward. The downtrend on the daily chart has been confirmed🔥
════════════════════
🟢 $TRIA 4 hour Bearish Signal
⚠️ Technicals: Daily chart bearish + 4-hour chart bearish resonance confirms! The 4-hour MACD is below the zero line and has a dead cross; the bears are accelerating. EMA5, 8, and 13 are arranged bearishly and diverging downward. KDJ has a dead cross, with the K value dropping to 34.8 below the D value at 42.7; it’s not yet oversold. Volume has increased by 1.6x, and the selloff has strong momentum.
════════════════════
🟢 $PLTR 4 hour Bearish Signal
⚠️ Technicals: Daily chart bearish + 4-hour chart bearish resonance; direction is consistent. The 4-hour MACD is below the zero line and has a dead cross, with green histogram bars expanding. Moving averages (EMA5, 8, 13) are bearishly arranged and pointing downward. KDJ has a dead cross (K16.3, D16.4), and volume has expanded 3x, accelerating the decline.
════════════════════
🔔 Watch for the first-hand market action/abnormal moves 🔔
#多周期共振 #TRIA #PLTR
📌 When trading, pay attention to whether the candlestick patterns match
════════════════════
🟢 $TRIA 4 hour Bearish Signal
⚠️ Technicals: Daily chart bearish + 4-hour chart bearish resonance confirms! The 4-hour MACD is below the zero line and has a dead cross; the bears are accelerating. EMA5, 8, and 13 are arranged bearishly and diverging downward. KDJ has a dead cross, with the K value dropping to 34.8 below the D value at 42.7; it’s not yet oversold. Volume has increased by 1.6x, and the selloff has strong momentum.
════════════════════
🟢 $PLTR 4 hour Bearish Signal
⚠️ Technicals: Daily chart bearish + 4-hour chart bearish resonance; direction is consistent. The 4-hour MACD is below the zero line and has a dead cross, with green histogram bars expanding. Moving averages (EMA5, 8, 13) are bearishly arranged and pointing downward. KDJ has a dead cross (K16.3, D16.4), and volume has expanded 3x, accelerating the decline.
════════════════════
🔔 Watch for the first-hand market action/abnormal moves 🔔
#多周期共振 #TRIA #PLTR
📌 When trading, pay attention to whether the candlestick patterns match
125

5-minute trend scan, 2 clear opportunities.
Short $PLTR . With a three-cycle resonance bearish drop: 5-minute downtrend, 15-minute downtrend, and 1-hour downtrend. A 2.93x volume breakout to the downside confirmed the move. Structure score: 92. Set to A+ level. Current price: 170.80. Entry: 170.30-171.00. Stop loss: 172.80. Target: 167.50. Risk-reward ratio: 1.8:1.
Conclusion: You can short. Three-cycle bearish resonance, volume breakout confirmation, extremely high structure score.
Short $1000BONK. Breakout and retest to the downside of the ranging area: 5-minute range, 15-minute range, 1-hour range. Volume increased 1.14x. Entry score: 80, Grade A. Current price: 0.003083. Entry: 0.003060-0.003100. Stop loss: 0.003180. Target: 0.002900. Risk-reward ratio: 2.0:1.
Conclusion: You can short. Breakout from the range to the downside with a confirmed retest, with a high entry score.
Recommended position size: no more than 10% per coin.
#PLTR #1000BONK #做空 #放量 #contract
5-minute trend scan, 2 clear opportunities.
Short $PLTR . With a three-cycle resonance bearish drop: 5-minute downtrend, 15-minute downtrend, and 1-hour downtrend. A 2.93x volume breakout to the downside confirmed the move. Structure score: 92. Set to A+ level. Current price: 170.80. Entry: 170.30-171.00. Stop loss: 172.80. Target: 167.50. Risk-reward ratio: 1.8:1.
Conclusion: You can short. Three-cycle bearish resonance, volume breakout confirmation, extremely high structure score.
Short $1000BONK. Breakout and retest to the downside of the ranging area: 5-minute range, 15-minute range, 1-hour range. Volume increased 1.14x. Entry score: 80, Grade A. Current price: 0.003083. Entry: 0.003060-0.003100. Stop loss: 0.003180. Target: 0.002900. Risk-reward ratio: 2.0:1.
Conclusion: You can short. Breakout from the range to the downside with a confirmed retest, with a high entry score.
Recommended position size: no more than 10% per coin.
#PLTR #1000BONK #做空 #放量 #contract
Short $PLTR . With a three-cycle resonance bearish drop: 5-minute downtrend, 15-minute downtrend, and 1-hour downtrend. A 2.93x volume breakout to the downside confirmed the move. Structure score: 92. Set to A+ level. Current price: 170.80. Entry: 170.30-171.00. Stop loss: 172.80. Target: 167.50. Risk-reward ratio: 1.8:1.
Conclusion: You can short. Three-cycle bearish resonance, volume breakout confirmation, extremely high structure score.
Short $1000BONK. Breakout and retest to the downside of the ranging area: 5-minute range, 15-minute range, 1-hour range. Volume increased 1.14x. Entry score: 80, Grade A. Current price: 0.003083. Entry: 0.003060-0.003100. Stop loss: 0.003180. Target: 0.002900. Risk-reward ratio: 2.0:1.
Conclusion: You can short. Breakout from the range to the downside with a confirmed retest, with a high entry score.
Recommended position size: no more than 10% per coin.
#PLTR #1000BONK #做空 #放量 #contract
2

·
--
Article
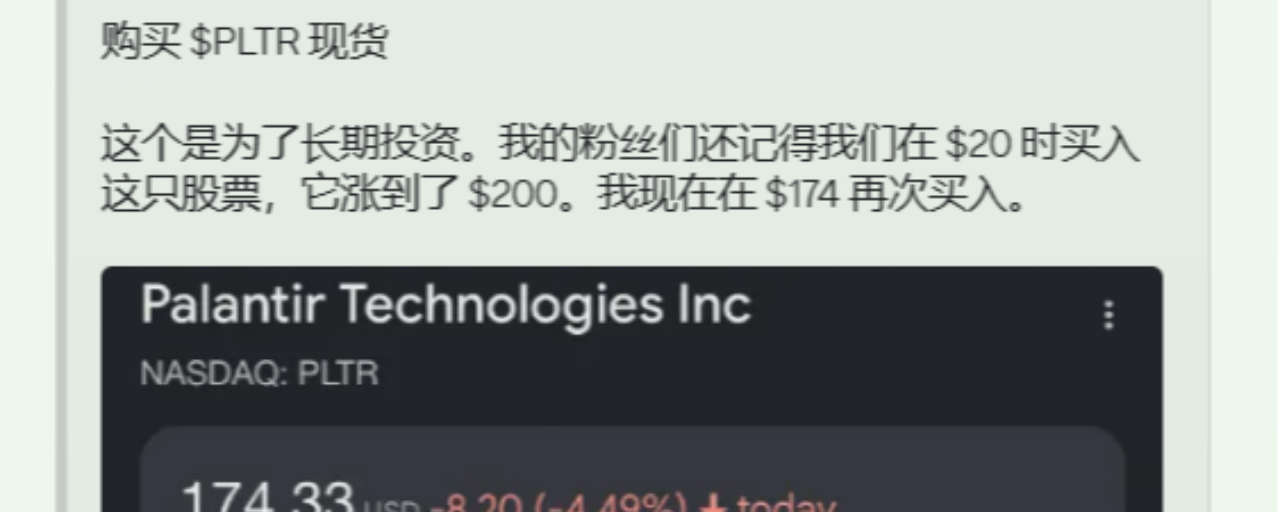
【U.S. Tech Blue Chips and Long-Term Value】A Ten-Bagger Legend from $20 to $200! The Long-Term Logic Behind Analyst Blogger $174 Adding More to PLTR SpotDuring periods of market consolidation and adjustment, deep pullbacks in high-quality tech giants are often the best windows for long-term funds to establish spot positions. According to a well-known analyst’s most recently disclosed U.S. stock spot allocation, he/she again executed a buy order when Palantir ($PLTR) fell to around $174, clearly positioning it as a long-term investment for the bigger cycle.
📊 Breakdown of Trading Logic and Intraday/Chart Details:
Historical Performance and Cycle Verification: The analyst earlier guided fans to build positions aggressively near $20, buying $PLTR at the bottom. With the surge in demand for AI large models and big-data analytics, the stock eventually surged to around $200, perfectly delivering a ten-times level of long-term appreciation.
【U.S. Tech Blue Chips and Long-Term Value】A Ten-Bagger Legend from $20 to $200! The Long-Term Logic Behind Analyst Blogger $174 Adding More to PLTR Spot
During periods of market consolidation and adjustment, deep pullbacks in high-quality tech giants are often the best windows for long-term funds to establish spot positions. According to a well-known analyst’s most recently disclosed U.S. stock spot allocation, he/she again executed a buy order when Palantir ($PLTR) fell to around $174, clearly positioning it as a long-term investment for the bigger cycle.
📊 Breakdown of Trading Logic and Intraday/Chart Details:
Historical Performance and Cycle Verification: The analyst earlier guided fans to build positions aggressively near $20, buying $PLTR at the bottom. With the surge in demand for AI large models and big-data analytics, the stock eventually surged to around $200, perfectly delivering a ten-times level of long-term appreciation.
📊 Breakdown of Trading Logic and Intraday/Chart Details:
Historical Performance and Cycle Verification: The analyst earlier guided fans to build positions aggressively near $20, buying $PLTR at the bottom. With the surge in demand for AI large models and big-data analytics, the stock eventually surged to around $200, perfectly delivering a ten-times level of long-term appreciation.
111

·
--
Article
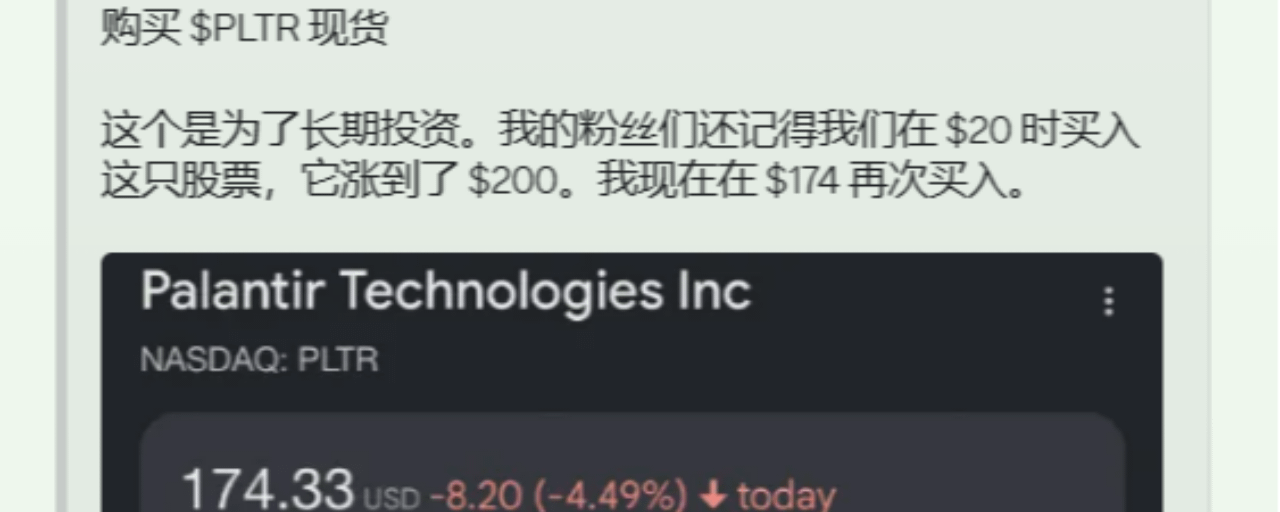
【Risk Control & Timing】 How to truly invest long-term? The investing philosophy of going from a blogger’s $20 to $200, and adding again at $174 in US spot marketsMany traders frequently chase short-term gains and sell to cut losses in US stock or crypto markets, yet their ultimate returns fall far behind spot traders who buy and firmly hold core assets. Analysts demonstrated this valuable spot-investing lesson on $PLTR with “$20 entry -> $200兑现 -> $174 加仓,” offering a clear example.
🛡️ Three key rules for long-term core-asset investing:
Select leading companies in the chosen sectors: pick targets (e.g., $PLTR) that have absolute moat-like dominance in leading tracks such as big data and enterprise AI applications.
Firmly reject leverage: for long-cycle targets, use spot buys and hold, completely severing the risk of liquidity liquidation, and exchange patience for valuation premium.
【Risk Control & Timing】 How to truly invest long-term? The investing philosophy of going from a blogger’s $20 to $200, and adding again at $174 in US spot markets
Many traders frequently chase short-term gains and sell to cut losses in US stock or crypto markets, yet their ultimate returns fall far behind spot traders who buy and firmly hold core assets. Analysts demonstrated this valuable spot-investing lesson on $PLTR with “$20 entry -> $200兑现 -> $174 加仓,” offering a clear example.
🛡️ Three key rules for long-term core-asset investing:
Select leading companies in the chosen sectors: pick targets (e.g., $PLTR) that have absolute moat-like dominance in leading tracks such as big data and enterprise AI applications.
Firmly reject leverage: for long-cycle targets, use spot buys and hold, completely severing the risk of liquidity liquidation, and exchange patience for valuation premium.
🛡️ Three key rules for long-term core-asset investing:
Select leading companies in the chosen sectors: pick targets (e.g., $PLTR) that have absolute moat-like dominance in leading tracks such as big data and enterprise AI applications.
Firmly reject leverage: for long-cycle targets, use spot buys and hold, completely severing the risk of liquidity liquidation, and exchange patience for valuation premium.
125
·
--
$TRIA/$CRCL/$PLTR 30 minutes moving averages bearish alignment, the 4-hour trend is also going downward 🔥
════════════════════
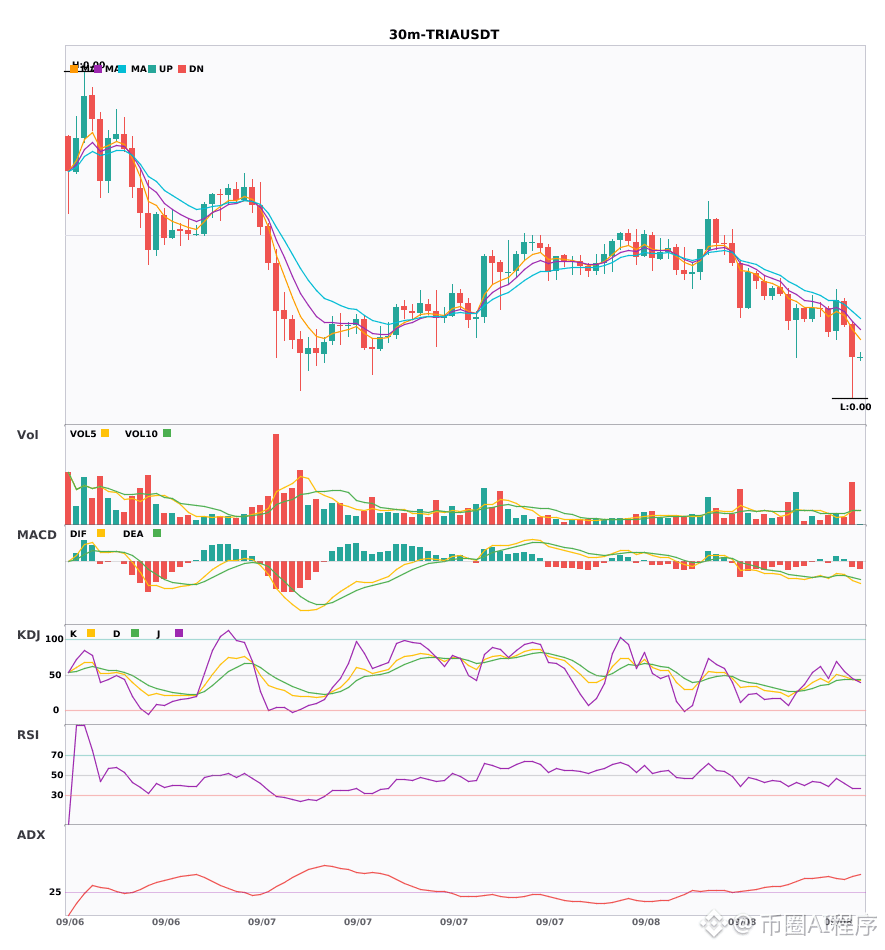
🟢 $TRIA 30 minutes Bearish signal
⚠️ Technicals: SOL bearish multi-period resonance! The 4-hour major direction is bearish; the 30-minute chart also sends a signal: MACD forms a dead cross below the zero line, green histogram expands, and bearish momentum accelerates. EMA5, 8, and 13 are arranged bearishly from top to bottom with divergence spreading. KDJ is weak: K at 44.1 is slightly higher than D at 43.9, but bears are still in control; volume expands by 2.8x. Higher and lower timeframes move in the same direction—strong follow-down sentiment.
════════════════════
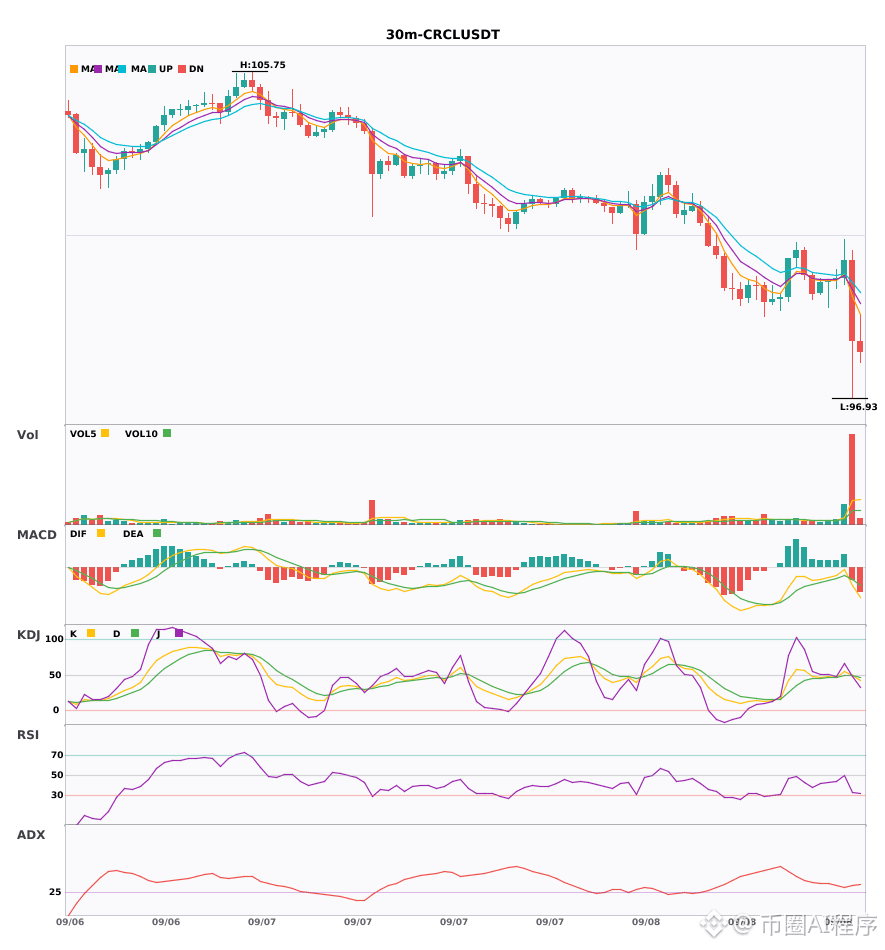
🟢 $CRCL 30 minutes Bearish signal
⚠️ Technicals: 4-hour bearish + 30-minute entry, multi-period resonance turning downward! MACD dead cross below the zero line with green histogram expanding; EMA5 crosses below EMA8 and turns bearish in the short term. KDJ’s K crosses below D (48.6/49.1), and volume also surges by 6.2x.
════════════════════
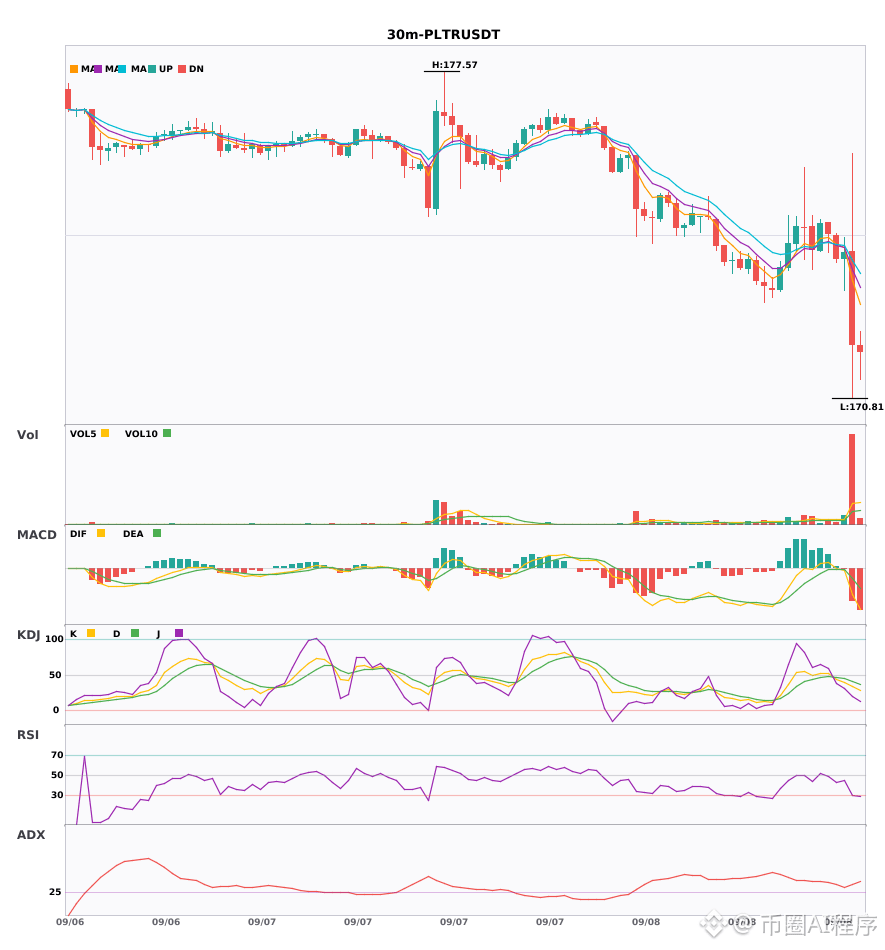
🟢 $PLTR 30 minutes Bearish signal
⚠️ Technicals: BTC 4-hour and 30-minute bearish resonance—same direction. On the 30-minute chart, MACD forms a dead cross below the zero line, green histogram expands, and bearish momentum accelerates. EMA5 crosses below EMA8 to turn bearish short-term. KDJ’s K (39.8) is running weakly below D (44.4). Volume expands by 1.9x, with the bears clearly prevailing.
════════════════════
🔔 Watch for first-hand market fluctuations 🔔
#多周期共振 #TRIA #CRCL #PLTR
📌 When trading, pay attention to whether the candlestick pattern matches
$TRIA /$CRCL /$PLTR 30 minutes moving averages bearish alignment, the 4-hour trend is also going downward 🔥
════════════════════
🟢 $TRIA 30 minutes Bearish signal
⚠️ Technicals: SOL bearish multi-period resonance! The 4-hour major direction is bearish; the 30-minute chart also sends a signal: MACD forms a dead cross below the zero line, green histogram expands, and bearish momentum accelerates. EMA5, 8, and 13 are arranged bearishly from top to bottom with divergence spreading. KDJ is weak: K at 44.1 is slightly higher than D at 43.9, but bears are still in control; volume expands by 2.8x. Higher and lower timeframes move in the same direction—strong follow-down sentiment.
════════════════════
🟢 $CRCL 30 minutes Bearish signal
⚠️ Technicals: 4-hour bearish + 30-minute entry, multi-period resonance turning downward! MACD dead cross below the zero line with green histogram expanding; EMA5 crosses below EMA8 and turns bearish in the short term. KDJ’s K crosses below D (48.6/49.1), and volume also surges by 6.2x.
════════════════════
🟢 $PLTR 30 minutes Bearish signal
⚠️ Technicals: BTC 4-hour and 30-minute bearish resonance—same direction. On the 30-minute chart, MACD forms a dead cross below the zero line, green histogram expands, and bearish momentum accelerates. EMA5 crosses below EMA8 to turn bearish short-term. KDJ’s K (39.8) is running weakly below D (44.4). Volume expands by 1.9x, with the bears clearly prevailing.
════════════════════
🔔 Watch for first-hand market fluctuations 🔔
#多周期共振 #TRIA #CRCL #PLTR
📌 When trading, pay attention to whether the candlestick pattern matches
════════════════════
🟢 $TRIA 30 minutes Bearish signal
⚠️ Technicals: SOL bearish multi-period resonance! The 4-hour major direction is bearish; the 30-minute chart also sends a signal: MACD forms a dead cross below the zero line, green histogram expands, and bearish momentum accelerates. EMA5, 8, and 13 are arranged bearishly from top to bottom with divergence spreading. KDJ is weak: K at 44.1 is slightly higher than D at 43.9, but bears are still in control; volume expands by 2.8x. Higher and lower timeframes move in the same direction—strong follow-down sentiment.
════════════════════
🟢 $CRCL 30 minutes Bearish signal
⚠️ Technicals: 4-hour bearish + 30-minute entry, multi-period resonance turning downward! MACD dead cross below the zero line with green histogram expanding; EMA5 crosses below EMA8 and turns bearish in the short term. KDJ’s K crosses below D (48.6/49.1), and volume also surges by 6.2x.
════════════════════
🟢 $PLTR 30 minutes Bearish signal
⚠️ Technicals: BTC 4-hour and 30-minute bearish resonance—same direction. On the 30-minute chart, MACD forms a dead cross below the zero line, green histogram expands, and bearish momentum accelerates. EMA5 crosses below EMA8 to turn bearish short-term. KDJ’s K (39.8) is running weakly below D (44.4). Volume expands by 1.9x, with the bears clearly prevailing.
════════════════════
🔔 Watch for first-hand market fluctuations 🔔
#多周期共振 #TRIA #CRCL #PLTR
📌 When trading, pay attention to whether the candlestick pattern matches
418
·
--
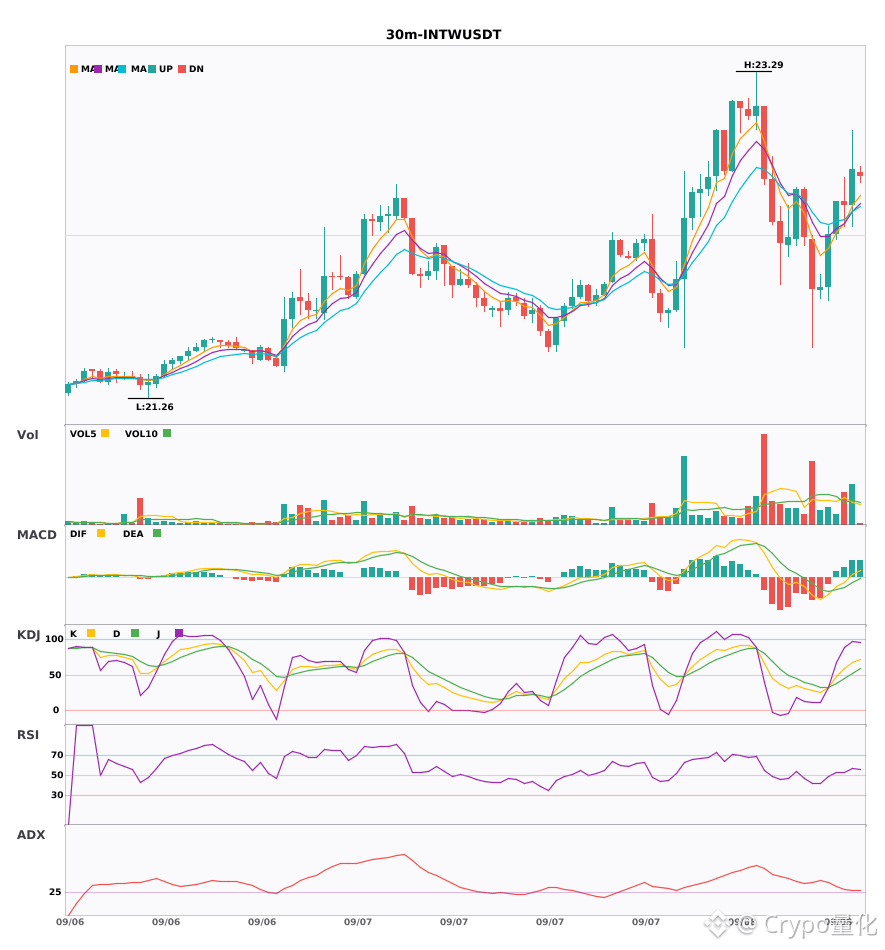
INTC, PLTR, and INTW—three stocks collectively surge with heavy volume on the 30-minute line. The MACD golden cross turns the red histogram larger—who has the best chance to lead the main upswing?🔥
════════════════════
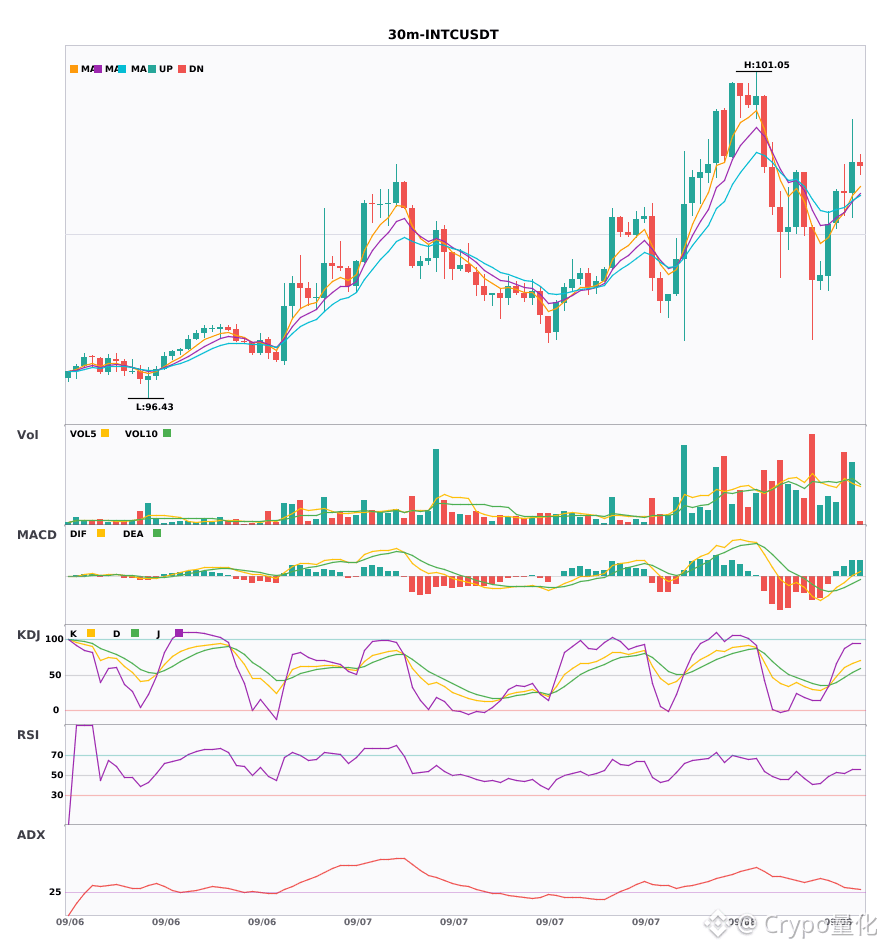
🔴 $INTC 30-minute bullish signal
⚠️ Technicals: ADX (31) shows a clear trending market. The MACD DIF has broken above the zero line and turned red. Moving averages are in a bullish alignment, and the 5-day line has just crossed above the 8-day line. The KDJ golden cross is trending upward, and it hasn’t entered the overbought zone. Trading volume surged 1.6x—bulls are in control.
════════════════════
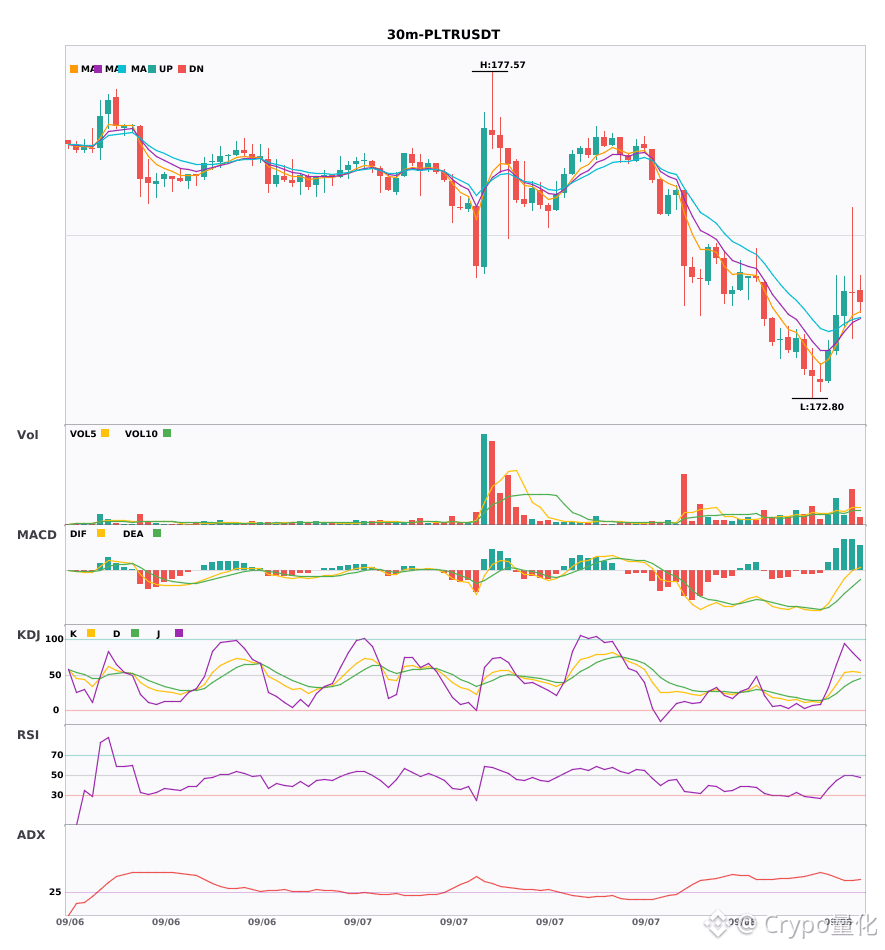
🔴 $PLTR 30-minute bullish signal
⚠️ Technicals: ADX has spiked to 41, making the trend unmistakable. The MACD DIF has just climbed above the zero line, the red bars are starting to lengthen, and a bullish signal has appeared. The moving averages are tightly intertwined—about to choose a direction. Trading volume has expanded directly by 2.4x, and capital is clearly moving.
════════════════════
🔴 $INTW 30-minute bullish signal
⚠️ Technicals: ADX 29 indicates the trend is emerging—now may be a good time to enter. The MACD DIF has already moved above the zero line, and the bullish trend has taken shape. The 5-day moving average has just crossed above the 8-day moving average, and the short-term bias is bullish. The KDJ is currently relatively strong: K is at 67, not yet overbought, and bulls have the advantage. Volume has also expanded to 1.7x of normal.
════════════════════
🔔 Follow to get the first-hand news of unusual price moves 🔔
#技术分析 #INTC #PLTR #INTW
📌 When trading, pay attention to whether the candlestick patterns match
INTC, PLTR, and INTW—three stocks collectively surge with heavy volume on the 30-minute line. The MACD golden cross turns the red histogram larger—who has the best chance to lead the main upswing?🔥
════════════════════
🔴 $INTC 30-minute bullish signal
⚠️ Technicals: ADX (31) shows a clear trending market. The MACD DIF has broken above the zero line and turned red. Moving averages are in a bullish alignment, and the 5-day line has just crossed above the 8-day line. The KDJ golden cross is trending upward, and it hasn’t entered the overbought zone. Trading volume surged 1.6x—bulls are in control.
════════════════════
🔴 $PLTR 30-minute bullish signal
⚠️ Technicals: ADX has spiked to 41, making the trend unmistakable. The MACD DIF has just climbed above the zero line, the red bars are starting to lengthen, and a bullish signal has appeared. The moving averages are tightly intertwined—about to choose a direction. Trading volume has expanded directly by 2.4x, and capital is clearly moving.
════════════════════
🔴 $INTW 30-minute bullish signal
⚠️ Technicals: ADX 29 indicates the trend is emerging—now may be a good time to enter. The MACD DIF has already moved above the zero line, and the bullish trend has taken shape. The 5-day moving average has just crossed above the 8-day moving average, and the short-term bias is bullish. The KDJ is currently relatively strong: K is at 67, not yet overbought, and bulls have the advantage. Volume has also expanded to 1.7x of normal.
════════════════════
🔔 Follow to get the first-hand news of unusual price moves 🔔
#技术分析 #INTC #PLTR #INTW
📌 When trading, pay attention to whether the candlestick patterns match
════════════════════
🔴 $INTC 30-minute bullish signal
⚠️ Technicals: ADX (31) shows a clear trending market. The MACD DIF has broken above the zero line and turned red. Moving averages are in a bullish alignment, and the 5-day line has just crossed above the 8-day line. The KDJ golden cross is trending upward, and it hasn’t entered the overbought zone. Trading volume surged 1.6x—bulls are in control.
════════════════════
🔴 $PLTR 30-minute bullish signal
⚠️ Technicals: ADX has spiked to 41, making the trend unmistakable. The MACD DIF has just climbed above the zero line, the red bars are starting to lengthen, and a bullish signal has appeared. The moving averages are tightly intertwined—about to choose a direction. Trading volume has expanded directly by 2.4x, and capital is clearly moving.
════════════════════
🔴 $INTW 30-minute bullish signal
⚠️ Technicals: ADX 29 indicates the trend is emerging—now may be a good time to enter. The MACD DIF has already moved above the zero line, and the bullish trend has taken shape. The 5-day moving average has just crossed above the 8-day moving average, and the short-term bias is bullish. The KDJ is currently relatively strong: K is at 67, not yet overbought, and bulls have the advantage. Volume has also expanded to 1.7x of normal.
════════════════════
🔔 Follow to get the first-hand news of unusual price moves 🔔
#技术分析 #INTC #PLTR #INTW
📌 When trading, pay attention to whether the candlestick patterns match
75

·
--
Palantir’s share price fell to $173.06, down 1.74% over the past 24 hours. But if you look up the headlines of any mainstream financial media outlet, there’s a complete void of specific news about this company. That’s the core contradiction facing $PLTR in the on-chain contract market today: an AI defense giant that relies on grand narratives—during a news drought, what sustains its richly valued price?
The market is voting with its feet. The funding rate is positive at 0.00016, meaning longs are continuously paying shorts, so bullish sentiment remains. But the price is still falling. This is a classic setup: longs trapped and adding positions. They’re paying real money in funding fees to maintain long positions, but the downward move has already put them into floating losses. A single price-drop signal might not mean much on its own, but combined with this still-running positive funding rate, the conclusion is clear: a group of leveraged longs is bleeding, and the market is draining their patience and capital.
The strongest counterevidence is very direct. Palantir’s business is fundamentally about the deep integration of AI and defense data. Any major contract news coming from government or military circles would instantly ignite market sentiment and re-anchor the current valuation logic. And a news vacuum is precisely the longs’ biggest enemy—because there’s nothing to trade.
The next likely forced action will come from these longs, who are paying funding fees but losing money. If the price remains weak, their margin pressure will increase—either they choose to actively reduce exposure and cut losses, or the exchange will liquidate them. Either way, it will add sell pressure to the market. Liquidity may temporarily withdraw from these overvalued narrative-driven stocks and shift toward assets with more short-term catalysts.
My current view is that the combination of a news lull and high valuation will lead to a period of downward consolidation. The condition that would invalidate this view is if Palantir’s share price breaks out with volume and holds above $185, accompanied by fresh, substantive positive news—showing that the market’s belief in AI defense is strong enough to ignore the temporary silence.
So my plan is to wait. The aggressive approach would be to wait until the funding rate turns negative (shorts start paying), and then, when the price finds support at a key level, go lightly long and bet on the next news cycle. The more conservative approach is not to touch it now, because the directional risk of volatility is temporarily to the downside, and there’s a lack of reversal signals.
Trading tag: #TradFi #链上美股 #PLTR
Where do you think this thesis is most likely to be wrong?
Palantir’s share price fell to $173.06, down 1.74% over the past 24 hours. But if you look up the headlines of any mainstream financial media outlet, there’s a complete void of specific news about this company. That’s the core contradiction facing $PLTR in the on-chain contract market today: an AI defense giant that relies on grand narratives—during a news drought, what sustains its richly valued price?
The market is voting with its feet. The funding rate is positive at 0.00016, meaning longs are continuously paying shorts, so bullish sentiment remains. But the price is still falling. This is a classic setup: longs trapped and adding positions. They’re paying real money in funding fees to maintain long positions, but the downward move has already put them into floating losses. A single price-drop signal might not mean much on its own, but combined with this still-running positive funding rate, the conclusion is clear: a group of leveraged longs is bleeding, and the market is draining their patience and capital.
The strongest counterevidence is very direct. Palantir’s business is fundamentally about the deep integration of AI and defense data. Any major contract news coming from government or military circles would instantly ignite market sentiment and re-anchor the current valuation logic. And a news vacuum is precisely the longs’ biggest enemy—because there’s nothing to trade.
The next likely forced action will come from these longs, who are paying funding fees but losing money. If the price remains weak, their margin pressure will increase—either they choose to actively reduce exposure and cut losses, or the exchange will liquidate them. Either way, it will add sell pressure to the market. Liquidity may temporarily withdraw from these overvalued narrative-driven stocks and shift toward assets with more short-term catalysts.
My current view is that the combination of a news lull and high valuation will lead to a period of downward consolidation. The condition that would invalidate this view is if Palantir’s share price breaks out with volume and holds above $185, accompanied by fresh, substantive positive news—showing that the market’s belief in AI defense is strong enough to ignore the temporary silence.
So my plan is to wait. The aggressive approach would be to wait until the funding rate turns negative (shorts start paying), and then, when the price finds support at a key level, go lightly long and bet on the next news cycle. The more conservative approach is not to touch it now, because the directional risk of volatility is temporarily to the downside, and there’s a lack of reversal signals.
Trading tag: #TradFi #链上美股 #PLTR
Where do you think this thesis is most likely to be wrong?
The market is voting with its feet. The funding rate is positive at 0.00016, meaning longs are continuously paying shorts, so bullish sentiment remains. But the price is still falling. This is a classic setup: longs trapped and adding positions. They’re paying real money in funding fees to maintain long positions, but the downward move has already put them into floating losses. A single price-drop signal might not mean much on its own, but combined with this still-running positive funding rate, the conclusion is clear: a group of leveraged longs is bleeding, and the market is draining their patience and capital.
The strongest counterevidence is very direct. Palantir’s business is fundamentally about the deep integration of AI and defense data. Any major contract news coming from government or military circles would instantly ignite market sentiment and re-anchor the current valuation logic. And a news vacuum is precisely the longs’ biggest enemy—because there’s nothing to trade.
The next likely forced action will come from these longs, who are paying funding fees but losing money. If the price remains weak, their margin pressure will increase—either they choose to actively reduce exposure and cut losses, or the exchange will liquidate them. Either way, it will add sell pressure to the market. Liquidity may temporarily withdraw from these overvalued narrative-driven stocks and shift toward assets with more short-term catalysts.
My current view is that the combination of a news lull and high valuation will lead to a period of downward consolidation. The condition that would invalidate this view is if Palantir’s share price breaks out with volume and holds above $185, accompanied by fresh, substantive positive news—showing that the market’s belief in AI defense is strong enough to ignore the temporary silence.
So my plan is to wait. The aggressive approach would be to wait until the funding rate turns negative (shorts start paying), and then, when the price finds support at a key level, go lightly long and bet on the next news cycle. The more conservative approach is not to touch it now, because the directional risk of volatility is temporarily to the downside, and there’s a lack of reversal signals.
Trading tag: #TradFi #链上美股 #PLTR
Where do you think this thesis is most likely to be wrong?
27
·
--
$PLTR In the past 24 hours, it has fallen by 1.74%, with a quote of 173.06. On the trading screen, there is a signal worth noting: the funding rate is positive, at 0.00016337.
While the price is dropping, longs are still paying shorts. This usually has only one explanation: a significant portion of long positions was built when the price was higher. They haven’t exited—and may even be adding to thin out their costs. A positive funding rate means the market sentiment between longs and shorts isn’t extremely bearish; more likely it reflects longs stubbornly holding on. Open interest is 49748.20, and it hasn’t fallen notably alongside the price decline, which supports the idea that longs haven’t broadly left the market.
Where is the danger in this structure? When longs use a positive funding rate to maintain positions, they pay a funding cost every day. If the price keeps drifting lower, these costs will continuously erode their margin until a certain threshold is reached, triggering a cascade of liquidations. Right now, the market hasn’t provided strong news catalysts to reverse the downtrend, and longs’ patience is being consumed.
The strongest counterpoint is this: if long-side capital is strong enough to withstand the entire decline cycle and wait for a turnaround in fundamentals or macro sentiment, then the current positive funding rate could actually become a foundation for a subsequent rebound. Sometimes the market relies on this group of “dead-long” holders to hold up the bottom.
But the second-order effects are clear. If the price keeps probing lower while the funding rate remains positive, these longs will face dual pressure: unrealized losses on top of paying the daily funding rate. They will eventually be forced to cut positions or close, releasing sell pressure and accelerating the move toward the lows. During this process, shorts can collect funding while also enjoying the profits from falling prices.
When would this thesis fail? There are two things to watch: first, the funding rate turns negative quickly, which suggests shorts are becoming crowded and short-term squeeze risk is rising; second, open interest shrinks sharply during the price decline, indicating longs have started exiting at a loss and downside momentum may be fading. Neither of these has appeared yet.
So in terms of action, I’m not going to catch this falling knife right now. I’ll wait—either for a clear inflection in the funding rate, or for signs that price has stabilized after panic-style heavy sell-off volume. $PLTR The current on-chain structure is a model of longs holding on with steadily increasing costs; going long against this trend carries extremely high risk.
For the more aggressive among you, if you believe in the long term, at least wait until there is a significant rebound in price and the funding-rate structure is healthy before considering new longs—rather than averaging down during the downtrend. The prudent approach is to observe how open interest and funding rates evolve next.
Trading tag: #TradFi #链上美股 #PLTR
Where do you think this view is most likely to be wrong?
$PLTR In the past 24 hours, it has fallen by 1.74%, with a quote of 173.06. On the trading screen, there is a signal worth noting: the funding rate is positive, at 0.00016337.
While the price is dropping, longs are still paying shorts. This usually has only one explanation: a significant portion of long positions was built when the price was higher. They haven’t exited—and may even be adding to thin out their costs. A positive funding rate means the market sentiment between longs and shorts isn’t extremely bearish; more likely it reflects longs stubbornly holding on. Open interest is 49748.20, and it hasn’t fallen notably alongside the price decline, which supports the idea that longs haven’t broadly left the market.
Where is the danger in this structure? When longs use a positive funding rate to maintain positions, they pay a funding cost every day. If the price keeps drifting lower, these costs will continuously erode their margin until a certain threshold is reached, triggering a cascade of liquidations. Right now, the market hasn’t provided strong news catalysts to reverse the downtrend, and longs’ patience is being consumed.
The strongest counterpoint is this: if long-side capital is strong enough to withstand the entire decline cycle and wait for a turnaround in fundamentals or macro sentiment, then the current positive funding rate could actually become a foundation for a subsequent rebound. Sometimes the market relies on this group of “dead-long” holders to hold up the bottom.
But the second-order effects are clear. If the price keeps probing lower while the funding rate remains positive, these longs will face dual pressure: unrealized losses on top of paying the daily funding rate. They will eventually be forced to cut positions or close, releasing sell pressure and accelerating the move toward the lows. During this process, shorts can collect funding while also enjoying the profits from falling prices.
When would this thesis fail? There are two things to watch: first, the funding rate turns negative quickly, which suggests shorts are becoming crowded and short-term squeeze risk is rising; second, open interest shrinks sharply during the price decline, indicating longs have started exiting at a loss and downside momentum may be fading. Neither of these has appeared yet.
So in terms of action, I’m not going to catch this falling knife right now. I’ll wait—either for a clear inflection in the funding rate, or for signs that price has stabilized after panic-style heavy sell-off volume. $PLTR The current on-chain structure is a model of longs holding on with steadily increasing costs; going long against this trend carries extremely high risk.
For the more aggressive among you, if you believe in the long term, at least wait until there is a significant rebound in price and the funding-rate structure is healthy before considering new longs—rather than averaging down during the downtrend. The prudent approach is to observe how open interest and funding rates evolve next.
Trading tag: #TradFi #链上美股 #PLTR
Where do you think this view is most likely to be wrong?
While the price is dropping, longs are still paying shorts. This usually has only one explanation: a significant portion of long positions was built when the price was higher. They haven’t exited—and may even be adding to thin out their costs. A positive funding rate means the market sentiment between longs and shorts isn’t extremely bearish; more likely it reflects longs stubbornly holding on. Open interest is 49748.20, and it hasn’t fallen notably alongside the price decline, which supports the idea that longs haven’t broadly left the market.
Where is the danger in this structure? When longs use a positive funding rate to maintain positions, they pay a funding cost every day. If the price keeps drifting lower, these costs will continuously erode their margin until a certain threshold is reached, triggering a cascade of liquidations. Right now, the market hasn’t provided strong news catalysts to reverse the downtrend, and longs’ patience is being consumed.
The strongest counterpoint is this: if long-side capital is strong enough to withstand the entire decline cycle and wait for a turnaround in fundamentals or macro sentiment, then the current positive funding rate could actually become a foundation for a subsequent rebound. Sometimes the market relies on this group of “dead-long” holders to hold up the bottom.
But the second-order effects are clear. If the price keeps probing lower while the funding rate remains positive, these longs will face dual pressure: unrealized losses on top of paying the daily funding rate. They will eventually be forced to cut positions or close, releasing sell pressure and accelerating the move toward the lows. During this process, shorts can collect funding while also enjoying the profits from falling prices.
When would this thesis fail? There are two things to watch: first, the funding rate turns negative quickly, which suggests shorts are becoming crowded and short-term squeeze risk is rising; second, open interest shrinks sharply during the price decline, indicating longs have started exiting at a loss and downside momentum may be fading. Neither of these has appeared yet.
So in terms of action, I’m not going to catch this falling knife right now. I’ll wait—either for a clear inflection in the funding rate, or for signs that price has stabilized after panic-style heavy sell-off volume. $PLTR The current on-chain structure is a model of longs holding on with steadily increasing costs; going long against this trend carries extremely high risk.
For the more aggressive among you, if you believe in the long term, at least wait until there is a significant rebound in price and the funding-rate structure is healthy before considering new longs—rather than averaging down during the downtrend. The prudent approach is to observe how open interest and funding rates evolve next.
Trading tag: #TradFi #链上美股 #PLTR
Where do you think this view is most likely to be wrong?
13
·
--
In the $PLTR 24-hour period, the price fell by 1.743%, touching 173.06. Meanwhile, the funding rate for its perpetual contract is 0.00016337%, and open interest remains around 49,748.20. Looking at price alone, it’s a bearish candle; however, since the funding rate is positive and there’s no obvious liquidation collapse in open interest, this combination forms the baseline for today’s observation: on days without clear global news catalysts, on-chain long and short forces seem to be quietly fighting for control.
My core judgment is: this calm is an illusion—the $PLTR contract market is stockpiling energy for the next directional choice, and the positive funding rate is the longs’ timed cost.
The data supports two facts. First, the price is down while funding remains positive, indicating that even though prices have fallen, the bullish side (longs) in the contract market is still paying the bearish side (shorts). In a typical interpretation, this means bullish sentiment is still intact and longs are willing to pay to maintain their positions. But when combined with falling prices, this more often suggests that longs are adding exposure against the price downtrend or stubbornly holding through it, with the funding rate continuing to accumulate their position costs. Second, open interest of 49,748.20 is relatively stable; there has been no large-scale position closing in response to the price drop, showing that neither longs nor shorts have conceded or exited en masse at this level—an obvious standoff.
The key contradiction here is that a price drop is usually accompanied by pessimism and falling open interest, yet we see open interest holding steady while longs keep paying. Behind this are two possible mechanisms. One possibility is that some capital believes the current decline is noise and is using the downturn to build positions slowly; they’re willing to pay funding to buy time. The other possibility is that the market collectively misjudges the direction—if prices continue to drift lower with sustained bearish momentum, the positive funding rate will keep draining longs’ margin, leading to even more passive liquidation later. Public data cannot distinguish between these two mechanisms, but the outcome is the same: liquidity is locked at the current price level, waiting for a trigger.
The strongest counter-evidence comes from a global shift in risk appetite. If global macro news turns extremely risk-off—for example, geopolitical tensions escalate or the Fed issues even more hawkish signals—high-beta tech and growth stocks could be indiscriminately sold off. If $PLTR is among them, the stability of its options/open contract positioning could instantly turn into fuel for a steep drop, because the longs would be forced to absorb both price losses and funding outflows during the decline.
The second-order effects are straightforward.
Trading tag: #TradFi #链上美股 #PLTR
Where do you think this outlook is most likely to be wrong?
In the $PLTR 24-hour period, the price fell by 1.743%, touching 173.06. Meanwhile, the funding rate for its perpetual contract is 0.00016337%, and open interest remains around 49,748.20. Looking at price alone, it’s a bearish candle; however, since the funding rate is positive and there’s no obvious liquidation collapse in open interest, this combination forms the baseline for today’s observation: on days without clear global news catalysts, on-chain long and short forces seem to be quietly fighting for control.
My core judgment is: this calm is an illusion—the $PLTR contract market is stockpiling energy for the next directional choice, and the positive funding rate is the longs’ timed cost.
The data supports two facts. First, the price is down while funding remains positive, indicating that even though prices have fallen, the bullish side (longs) in the contract market is still paying the bearish side (shorts). In a typical interpretation, this means bullish sentiment is still intact and longs are willing to pay to maintain their positions. But when combined with falling prices, this more often suggests that longs are adding exposure against the price downtrend or stubbornly holding through it, with the funding rate continuing to accumulate their position costs. Second, open interest of 49,748.20 is relatively stable; there has been no large-scale position closing in response to the price drop, showing that neither longs nor shorts have conceded or exited en masse at this level—an obvious standoff.
The key contradiction here is that a price drop is usually accompanied by pessimism and falling open interest, yet we see open interest holding steady while longs keep paying. Behind this are two possible mechanisms. One possibility is that some capital believes the current decline is noise and is using the downturn to build positions slowly; they’re willing to pay funding to buy time. The other possibility is that the market collectively misjudges the direction—if prices continue to drift lower with sustained bearish momentum, the positive funding rate will keep draining longs’ margin, leading to even more passive liquidation later. Public data cannot distinguish between these two mechanisms, but the outcome is the same: liquidity is locked at the current price level, waiting for a trigger.
The strongest counter-evidence comes from a global shift in risk appetite. If global macro news turns extremely risk-off—for example, geopolitical tensions escalate or the Fed issues even more hawkish signals—high-beta tech and growth stocks could be indiscriminately sold off. If $PLTR is among them, the stability of its options/open contract positioning could instantly turn into fuel for a steep drop, because the longs would be forced to absorb both price losses and funding outflows during the decline.
The second-order effects are straightforward.
Trading tag: #TradFi #链上美股 #PLTR
Where do you think this outlook is most likely to be wrong?
My core judgment is: this calm is an illusion—the $PLTR contract market is stockpiling energy for the next directional choice, and the positive funding rate is the longs’ timed cost.
The data supports two facts. First, the price is down while funding remains positive, indicating that even though prices have fallen, the bullish side (longs) in the contract market is still paying the bearish side (shorts). In a typical interpretation, this means bullish sentiment is still intact and longs are willing to pay to maintain their positions. But when combined with falling prices, this more often suggests that longs are adding exposure against the price downtrend or stubbornly holding through it, with the funding rate continuing to accumulate their position costs. Second, open interest of 49,748.20 is relatively stable; there has been no large-scale position closing in response to the price drop, showing that neither longs nor shorts have conceded or exited en masse at this level—an obvious standoff.
The key contradiction here is that a price drop is usually accompanied by pessimism and falling open interest, yet we see open interest holding steady while longs keep paying. Behind this are two possible mechanisms. One possibility is that some capital believes the current decline is noise and is using the downturn to build positions slowly; they’re willing to pay funding to buy time. The other possibility is that the market collectively misjudges the direction—if prices continue to drift lower with sustained bearish momentum, the positive funding rate will keep draining longs’ margin, leading to even more passive liquidation later. Public data cannot distinguish between these two mechanisms, but the outcome is the same: liquidity is locked at the current price level, waiting for a trigger.
The strongest counter-evidence comes from a global shift in risk appetite. If global macro news turns extremely risk-off—for example, geopolitical tensions escalate or the Fed issues even more hawkish signals—high-beta tech and growth stocks could be indiscriminately sold off. If $PLTR is among them, the stability of its options/open contract positioning could instantly turn into fuel for a steep drop, because the longs would be forced to absorb both price losses and funding outflows during the decline.
The second-order effects are straightforward.
Trading tag: #TradFi #链上美股 #PLTR
Where do you think this outlook is most likely to be wrong?
11
·
--
In the market news vacuum period, on-chain data is often more honest than any headline.
Over the past 24 hours, $PLTR has fallen by 1.743%, with a quoted price of $173.06. At the same time, its perpetual contract funding rate has stayed positive at 0.00016337. Prices are dropping, yet longs are continuously paying funding to shorts—this combination is quite striking. The open interest is reported at 49,748.20, with no clear signs of a mass exit.
Judging solely from these two signals, the structure doesn’t look healthy. Price declines combined with a positive funding rate is a classic situation where longs are trapped and still passively pay fees. Although shorts are temporarily winning on price direction, they also receive funding fee cash flow as compensation, which may make their positioning steadier. Meanwhile, longs face double loss: unrealized losses on positions plus daily “bloodletting” via funding. If this divergence persists, it may force some leveraged longs to collectively exit at a certain critical point, creating a downward liquidity break.
However, the strongest counterargument comes from the theme itself. Palantir, as a benchmark company for AI and data, has a narrative with strong independence and resilience. Once the global news flow brings any positive updates regarding AI applications, government procurement, or technological breakthroughs, it could instantly reverse near-term sentiment, ignite buy-side momentum, and push both the price and funding rate upward in sync. A single trading day of structural divergence alone is far from enough to conclude that a trend reversal is underway.
What I see as the next step is: if the decline continues, the positive funding rate will accelerate the longs’ loss and force them to reduce exposure; if a rebound occurs, the first to close likely will be the shorts that have built up positive cash flow so far. At present, open interest is flat, suggesting both sides in the major battle are still in a standoff, but the endurance of longs who are paying is being tested.
My judgment is based on today’s combination of a news vacuum and data divergence. When does the view become invalid? As long as the $PLTR price holds steady in the $173 region, and the funding rate starts moving toward the zero line or into negative territory, it would mean easing long pressure; shorts may begin to retreat, and the current short thesis about the structure would be invalid.
In terms of specific actions, I will reduce my position and observe. Aggressive traders can use the $173 area to attempt a small exploratory short, but the stop-loss must be set strictly above the recent volatility high. Conservative traders should wait for a right-side signal—either a clear break below $170 or the funding rate turning negative. For those looking to avoid risk, it’s best to do nothing for now and wait until the funding rate and price return to a synchronized state.
The global news lull is not a safety net—it’s precisely the window when on-chain structural problems are exposed.
Trading tag: #TradFi #链上美股 #PLTR
Where do you think this set of assumptions is most likely to be wrong?
In the market news vacuum period, on-chain data is often more honest than any headline.
Over the past 24 hours, $PLTR has fallen by 1.743%, with a quoted price of $173.06. At the same time, its perpetual contract funding rate has stayed positive at 0.00016337. Prices are dropping, yet longs are continuously paying funding to shorts—this combination is quite striking. The open interest is reported at 49,748.20, with no clear signs of a mass exit.
Judging solely from these two signals, the structure doesn’t look healthy. Price declines combined with a positive funding rate is a classic situation where longs are trapped and still passively pay fees. Although shorts are temporarily winning on price direction, they also receive funding fee cash flow as compensation, which may make their positioning steadier. Meanwhile, longs face double loss: unrealized losses on positions plus daily “bloodletting” via funding. If this divergence persists, it may force some leveraged longs to collectively exit at a certain critical point, creating a downward liquidity break.
However, the strongest counterargument comes from the theme itself. Palantir, as a benchmark company for AI and data, has a narrative with strong independence and resilience. Once the global news flow brings any positive updates regarding AI applications, government procurement, or technological breakthroughs, it could instantly reverse near-term sentiment, ignite buy-side momentum, and push both the price and funding rate upward in sync. A single trading day of structural divergence alone is far from enough to conclude that a trend reversal is underway.
What I see as the next step is: if the decline continues, the positive funding rate will accelerate the longs’ loss and force them to reduce exposure; if a rebound occurs, the first to close likely will be the shorts that have built up positive cash flow so far. At present, open interest is flat, suggesting both sides in the major battle are still in a standoff, but the endurance of longs who are paying is being tested.
My judgment is based on today’s combination of a news vacuum and data divergence. When does the view become invalid? As long as the $PLTR price holds steady in the $173 region, and the funding rate starts moving toward the zero line or into negative territory, it would mean easing long pressure; shorts may begin to retreat, and the current short thesis about the structure would be invalid.
In terms of specific actions, I will reduce my position and observe. Aggressive traders can use the $173 area to attempt a small exploratory short, but the stop-loss must be set strictly above the recent volatility high. Conservative traders should wait for a right-side signal—either a clear break below $170 or the funding rate turning negative. For those looking to avoid risk, it’s best to do nothing for now and wait until the funding rate and price return to a synchronized state.
The global news lull is not a safety net—it’s precisely the window when on-chain structural problems are exposed.
Trading tag: #TradFi #链上美股 #PLTR
Where do you think this set of assumptions is most likely to be wrong?
Over the past 24 hours, $PLTR has fallen by 1.743%, with a quoted price of $173.06. At the same time, its perpetual contract funding rate has stayed positive at 0.00016337. Prices are dropping, yet longs are continuously paying funding to shorts—this combination is quite striking. The open interest is reported at 49,748.20, with no clear signs of a mass exit.
Judging solely from these two signals, the structure doesn’t look healthy. Price declines combined with a positive funding rate is a classic situation where longs are trapped and still passively pay fees. Although shorts are temporarily winning on price direction, they also receive funding fee cash flow as compensation, which may make their positioning steadier. Meanwhile, longs face double loss: unrealized losses on positions plus daily “bloodletting” via funding. If this divergence persists, it may force some leveraged longs to collectively exit at a certain critical point, creating a downward liquidity break.
However, the strongest counterargument comes from the theme itself. Palantir, as a benchmark company for AI and data, has a narrative with strong independence and resilience. Once the global news flow brings any positive updates regarding AI applications, government procurement, or technological breakthroughs, it could instantly reverse near-term sentiment, ignite buy-side momentum, and push both the price and funding rate upward in sync. A single trading day of structural divergence alone is far from enough to conclude that a trend reversal is underway.
What I see as the next step is: if the decline continues, the positive funding rate will accelerate the longs’ loss and force them to reduce exposure; if a rebound occurs, the first to close likely will be the shorts that have built up positive cash flow so far. At present, open interest is flat, suggesting both sides in the major battle are still in a standoff, but the endurance of longs who are paying is being tested.
My judgment is based on today’s combination of a news vacuum and data divergence. When does the view become invalid? As long as the $PLTR price holds steady in the $173 region, and the funding rate starts moving toward the zero line or into negative territory, it would mean easing long pressure; shorts may begin to retreat, and the current short thesis about the structure would be invalid.
In terms of specific actions, I will reduce my position and observe. Aggressive traders can use the $173 area to attempt a small exploratory short, but the stop-loss must be set strictly above the recent volatility high. Conservative traders should wait for a right-side signal—either a clear break below $170 or the funding rate turning negative. For those looking to avoid risk, it’s best to do nothing for now and wait until the funding rate and price return to a synchronized state.
The global news lull is not a safety net—it’s precisely the window when on-chain structural problems are exposed.
Trading tag: #TradFi #链上美股 #PLTR
Where do you think this set of assumptions is most likely to be wrong?
10

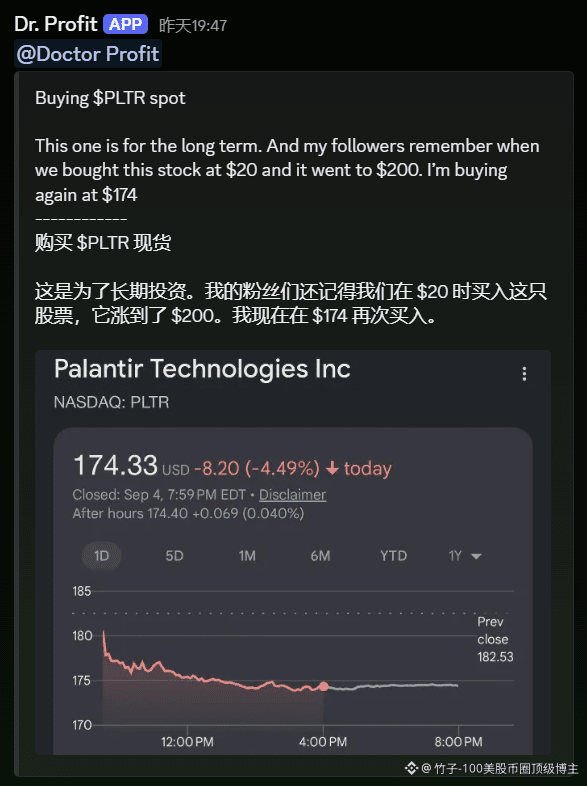
Dr. Profit is back again showing off his U.S. stock picks. This time, he bought PLTR spot at $174.
Back when he led everyone from $20 to $200—that move was truly impressive. This time, after PLTR pulled back nearly 4.5% in a single day, he went ahead and started accumulating again at 174 bucks.
For the big leaders in the AI and big data sector, buying spot in multiple batches on dips is indeed much safer than chasing after a surge. Also, he clearly said it’s a long-term play—no short-term leveraged futures contracts. That makes the position-related psychological pressure much lower too.
U.S. tech stocks have had quite a few pullbacks recently. I wonder whether this $174 could become a new stage bottom for PLTR.
Do you have PLTR in your U.S. stock watchlist? Would you consider following this old hand to bottom-fish spot?
#PLTR #美股 #美股抄底 $PLTR
{future}(PLTRUSDT)
Dr. Profit is back again showing off his U.S. stock picks. This time, he bought PLTR spot at $174.
Back when he led everyone from $20 to $200—that move was truly impressive. This time, after PLTR pulled back nearly 4.5% in a single day, he went ahead and started accumulating again at 174 bucks.
For the big leaders in the AI and big data sector, buying spot in multiple batches on dips is indeed much safer than chasing after a surge. Also, he clearly said it’s a long-term play—no short-term leveraged futures contracts. That makes the position-related psychological pressure much lower too.
U.S. tech stocks have had quite a few pullbacks recently. I wonder whether this $174 could become a new stage bottom for PLTR.
Do you have PLTR in your U.S. stock watchlist? Would you consider following this old hand to bottom-fish spot?
#PLTR #美股 #美股抄底 $PLTR
Back when he led everyone from $20 to $200—that move was truly impressive. This time, after PLTR pulled back nearly 4.5% in a single day, he went ahead and started accumulating again at 174 bucks.
For the big leaders in the AI and big data sector, buying spot in multiple batches on dips is indeed much safer than chasing after a surge. Also, he clearly said it’s a long-term play—no short-term leveraged futures contracts. That makes the position-related psychological pressure much lower too.
U.S. tech stocks have had quite a few pullbacks recently. I wonder whether this $174 could become a new stage bottom for PLTR.
Do you have PLTR in your U.S. stock watchlist? Would you consider following this old hand to bottom-fish spot?
#PLTR #美股 #美股抄底 $PLTR
76
·
--
$PLTR In the past 24 hours, it has fallen by 1.743%. The price is $173.06. The funding rate is 0.00016337, and the open interest is 49,748.20. The price is down, but the funding is positive—this is a typical structure where long positions get trapped and add more. The lack of global news amplifies this fragility.
My view: Short-term bearish. Bulls are moving forward while carrying a heavy load. A positive funding rate means longs pay shorts every day. 0.00016337 isn’t extreme, but the combination of a 1.743% price drop and this funding indicates that the bullish side is still hardening through it, with positions’ cost accumulating. Open interest stays at 49,748.20 with no major decrease, meaning longs haven’t pulled out, and shorts haven’t aggressively attacked—both sides are stalemated. This kind of stalemate is most afraid of external shocks. If global news turns negative—such as rumors of tech-stock regulation or weakness in the U.S. stock market index—$PLTR could accelerate downward, because longs would have to absorb both mark-to-market losses and funding fees.
The counterargument: If global news suddenly turns constructive—for example, AI-related policy tailwinds or unexpected positive company news—the price could rebound. At that time, the funding rate would be pushed higher to absorb the move, easing pressure on longs. But current data doesn’t show any such signs; I can only judge based on existing signals.
Second-order effects: If the price continues to drift lower, longs will be forced to close positions with stop-losses, increasing sell pressure. Shorts will take the opportunity to add, creating a positive feedback loop on the decline. The cost is borne by longs; liquidity may flow out of on-chain contracts and move to stronger assets.
When this judgment fails: two conditions—(1) the funding rate turns negative, indicating power between longs and shorts has reversed; or (2) the price strongly rebounds and regains the $175 level. (That $175 level isn’t provided in the input, so I won’t state a specific level as a hard number—just that the price strongly rebounds.) More practically, if open interest drops sharply, it suggests positions are being cleared and the trend may reverse.
My actions: Reduce the long position size and keep 30% as a core holding. The condition to add is that the funding rate turns negative and the price stabilizes. The condition to fully close is that the price continues falling and the positive funding value expands. I won’t chase shorts, because with funding positive, shorting also comes with a cost.
Three scenarios: Aggressive—if the price breaks below 172 and funding is still positive, add to hedging short positions. Conservative—cut the position by half and wait for a signal that funding turns negative. Avoidance—don’t touch it until the trend becomes clear. What the market ignores is the slow “knife” effect of accumulated funding. A dull knife still cuts—bulls can’t afford it.
Trading tag: #TradFi #链上美股 #PLTR
Where do you think this set of judgments is most likely to be wrong?
$PLTR In the past 24 hours, it has fallen by 1.743%. The price is $173.06. The funding rate is 0.00016337, and the open interest is 49,748.20. The price is down, but the funding is positive—this is a typical structure where long positions get trapped and add more. The lack of global news amplifies this fragility.
My view: Short-term bearish. Bulls are moving forward while carrying a heavy load. A positive funding rate means longs pay shorts every day. 0.00016337 isn’t extreme, but the combination of a 1.743% price drop and this funding indicates that the bullish side is still hardening through it, with positions’ cost accumulating. Open interest stays at 49,748.20 with no major decrease, meaning longs haven’t pulled out, and shorts haven’t aggressively attacked—both sides are stalemated. This kind of stalemate is most afraid of external shocks. If global news turns negative—such as rumors of tech-stock regulation or weakness in the U.S. stock market index—$PLTR could accelerate downward, because longs would have to absorb both mark-to-market losses and funding fees.
The counterargument: If global news suddenly turns constructive—for example, AI-related policy tailwinds or unexpected positive company news—the price could rebound. At that time, the funding rate would be pushed higher to absorb the move, easing pressure on longs. But current data doesn’t show any such signs; I can only judge based on existing signals.
Second-order effects: If the price continues to drift lower, longs will be forced to close positions with stop-losses, increasing sell pressure. Shorts will take the opportunity to add, creating a positive feedback loop on the decline. The cost is borne by longs; liquidity may flow out of on-chain contracts and move to stronger assets.
When this judgment fails: two conditions—(1) the funding rate turns negative, indicating power between longs and shorts has reversed; or (2) the price strongly rebounds and regains the $175 level. (That $175 level isn’t provided in the input, so I won’t state a specific level as a hard number—just that the price strongly rebounds.) More practically, if open interest drops sharply, it suggests positions are being cleared and the trend may reverse.
My actions: Reduce the long position size and keep 30% as a core holding. The condition to add is that the funding rate turns negative and the price stabilizes. The condition to fully close is that the price continues falling and the positive funding value expands. I won’t chase shorts, because with funding positive, shorting also comes with a cost.
Three scenarios: Aggressive—if the price breaks below 172 and funding is still positive, add to hedging short positions. Conservative—cut the position by half and wait for a signal that funding turns negative. Avoidance—don’t touch it until the trend becomes clear. What the market ignores is the slow “knife” effect of accumulated funding. A dull knife still cuts—bulls can’t afford it.
Trading tag: #TradFi #链上美股 #PLTR
Where do you think this set of judgments is most likely to be wrong?
My view: Short-term bearish. Bulls are moving forward while carrying a heavy load. A positive funding rate means longs pay shorts every day. 0.00016337 isn’t extreme, but the combination of a 1.743% price drop and this funding indicates that the bullish side is still hardening through it, with positions’ cost accumulating. Open interest stays at 49,748.20 with no major decrease, meaning longs haven’t pulled out, and shorts haven’t aggressively attacked—both sides are stalemated. This kind of stalemate is most afraid of external shocks. If global news turns negative—such as rumors of tech-stock regulation or weakness in the U.S. stock market index—$PLTR could accelerate downward, because longs would have to absorb both mark-to-market losses and funding fees.
The counterargument: If global news suddenly turns constructive—for example, AI-related policy tailwinds or unexpected positive company news—the price could rebound. At that time, the funding rate would be pushed higher to absorb the move, easing pressure on longs. But current data doesn’t show any such signs; I can only judge based on existing signals.
Second-order effects: If the price continues to drift lower, longs will be forced to close positions with stop-losses, increasing sell pressure. Shorts will take the opportunity to add, creating a positive feedback loop on the decline. The cost is borne by longs; liquidity may flow out of on-chain contracts and move to stronger assets.
When this judgment fails: two conditions—(1) the funding rate turns negative, indicating power between longs and shorts has reversed; or (2) the price strongly rebounds and regains the $175 level. (That $175 level isn’t provided in the input, so I won’t state a specific level as a hard number—just that the price strongly rebounds.) More practically, if open interest drops sharply, it suggests positions are being cleared and the trend may reverse.
My actions: Reduce the long position size and keep 30% as a core holding. The condition to add is that the funding rate turns negative and the price stabilizes. The condition to fully close is that the price continues falling and the positive funding value expands. I won’t chase shorts, because with funding positive, shorting also comes with a cost.
Three scenarios: Aggressive—if the price breaks below 172 and funding is still positive, add to hedging short positions. Conservative—cut the position by half and wait for a signal that funding turns negative. Avoidance—don’t touch it until the trend becomes clear. What the market ignores is the slow “knife” effect of accumulated funding. A dull knife still cuts—bulls can’t afford it.
Trading tag: #TradFi #链上美股 #PLTR
Where do you think this set of judgments is most likely to be wrong?
12
·
--
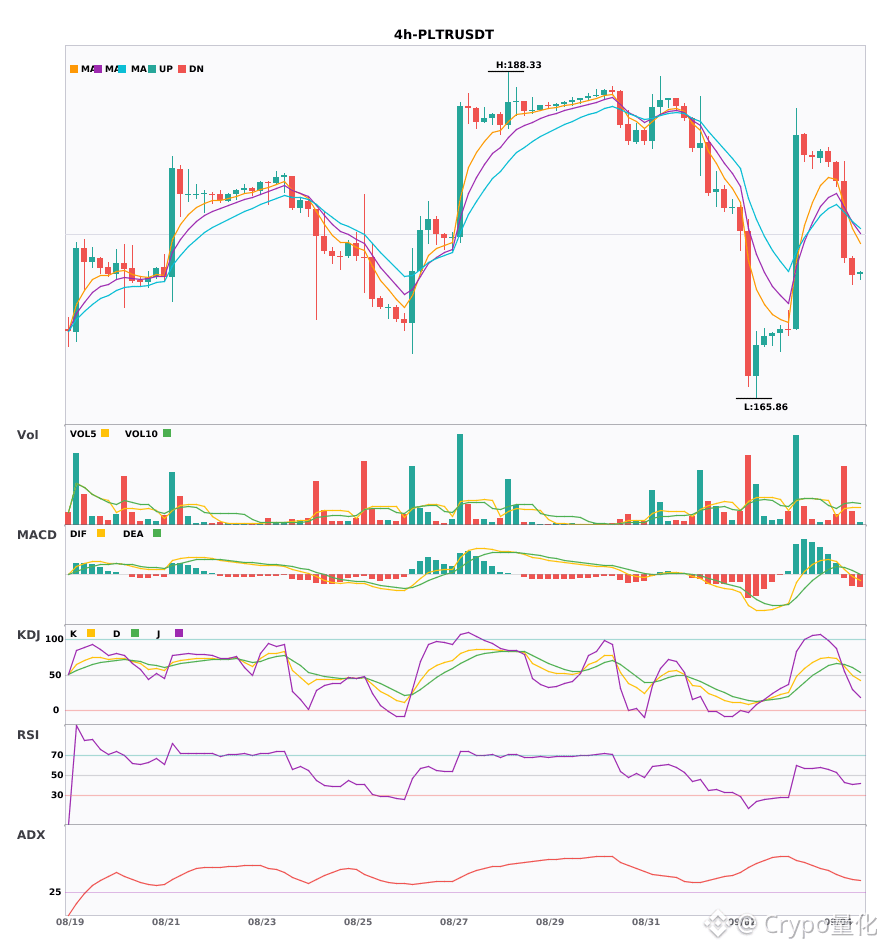
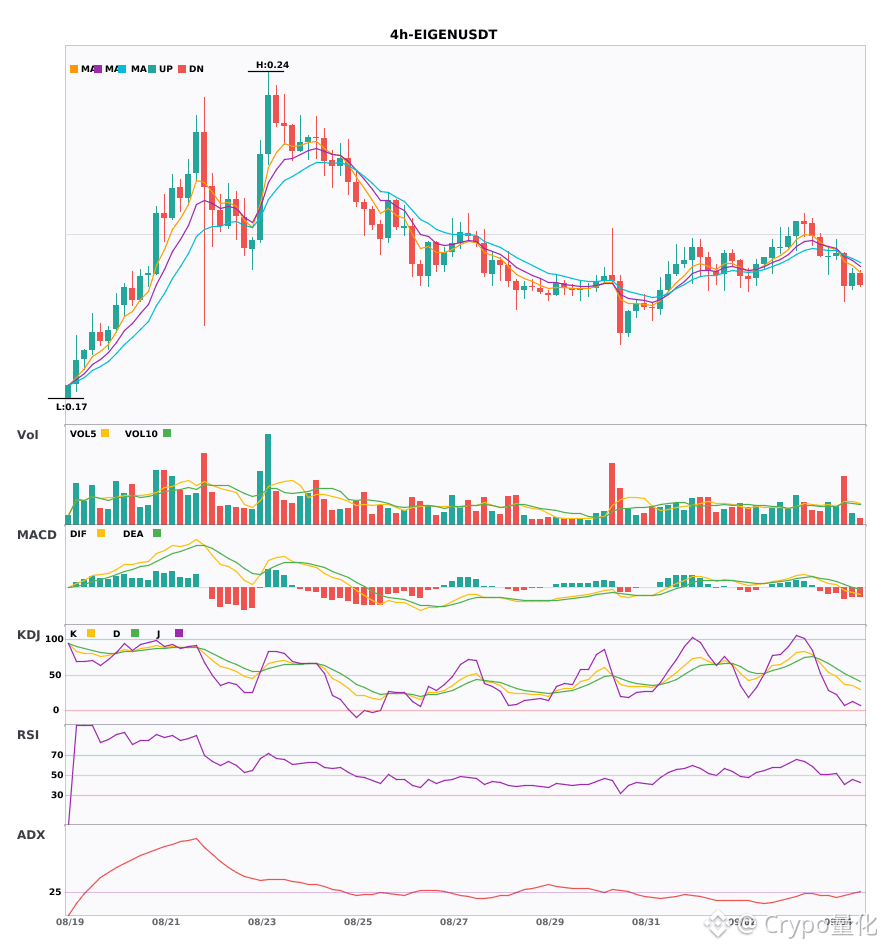
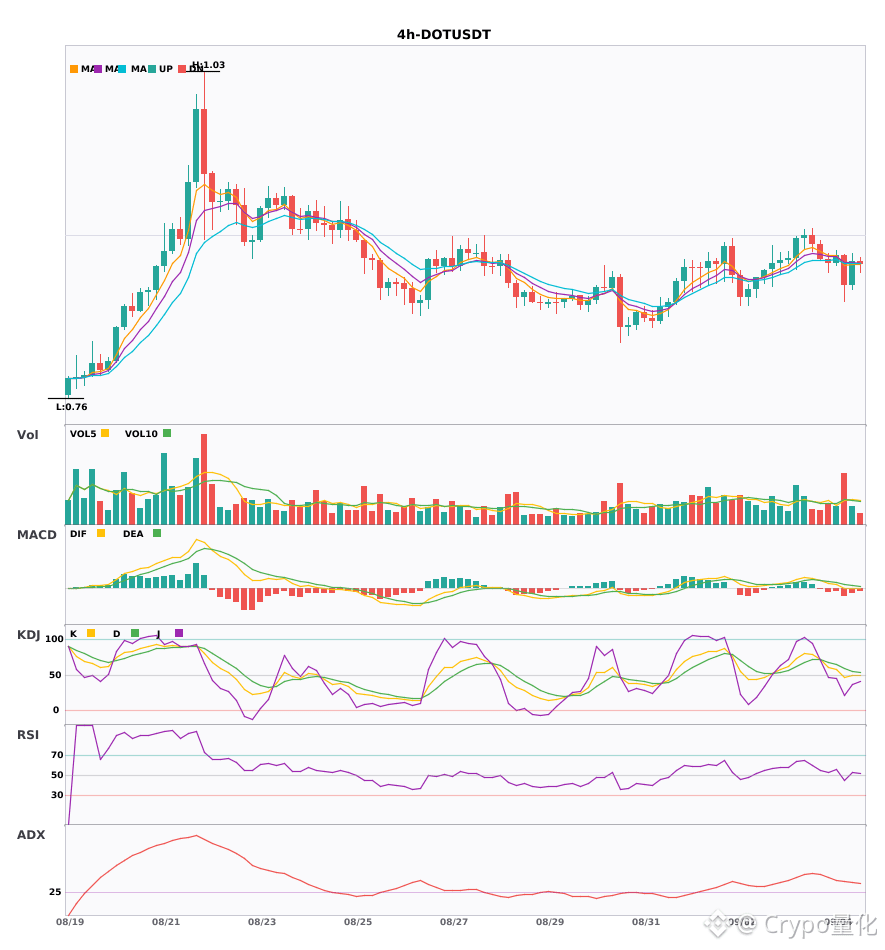
$PLTR/$EIGEN/$DOT 4-hour bearish trend, short-term continued pressure 🔥
════════════════════
🟢 $PLTR 4-hour bearish signal
⚠️Technical: ADX is at 41, so the trend is quite strong. However, MACD DIF has already fallen below the zero line, turning bearish. The 5-day moving average has also crossed below the 8-day moving average, which is not great in the short term. Trading volume has increased by 2.7x, so be careful.
════════════════════
🟢 $EIGEN 4-hour bearish signal
⚠️Technical: ADX 25, the trend is forming and you can enter. MACD DIF has dropped below the zero line, bearish. The 5-day, 8-day, and 13-day moving averages are in a bearish alignment and moving down. Trading volume has increased by 2.2x.
════════════════════
🟢 $DOT 4-hour bearish signal
⚠️Technical: ADX is as high as 38, and the trend is very strong. The MACD fast line has fallen below the zero line, and a bearish signal has appeared. The 5-day line has dropped below the 8-day line, so it may fall in the short term. Volume has doubled, and everyone is running.
════════════════════
🔔 Follow for the latest market moves 🔔
#技术分析 #PLTR #EIGEN #DOT
📌 When trading, pay attention to whether the candlestick pattern is confirmed
$PLTR /$EIGEN /$DOT 4-hour bearish trend, short-term continued pressure 🔥
════════════════════
🟢 $PLTR 4-hour bearish signal
⚠️Technical: ADX is at 41, so the trend is quite strong. However, MACD DIF has already fallen below the zero line, turning bearish. The 5-day moving average has also crossed below the 8-day moving average, which is not great in the short term. Trading volume has increased by 2.7x, so be careful.
════════════════════
🟢 $EIGEN 4-hour bearish signal
⚠️Technical: ADX 25, the trend is forming and you can enter. MACD DIF has dropped below the zero line, bearish. The 5-day, 8-day, and 13-day moving averages are in a bearish alignment and moving down. Trading volume has increased by 2.2x.
════════════════════
🟢 $DOT 4-hour bearish signal
⚠️Technical: ADX is as high as 38, and the trend is very strong. The MACD fast line has fallen below the zero line, and a bearish signal has appeared. The 5-day line has dropped below the 8-day line, so it may fall in the short term. Volume has doubled, and everyone is running.
════════════════════
🔔 Follow for the latest market moves 🔔
#技术分析 #PLTR #EIGEN #DOT
📌 When trading, pay attention to whether the candlestick pattern is confirmed
════════════════════
🟢 $PLTR 4-hour bearish signal
⚠️Technical: ADX is at 41, so the trend is quite strong. However, MACD DIF has already fallen below the zero line, turning bearish. The 5-day moving average has also crossed below the 8-day moving average, which is not great in the short term. Trading volume has increased by 2.7x, so be careful.
════════════════════
🟢 $EIGEN 4-hour bearish signal
⚠️Technical: ADX 25, the trend is forming and you can enter. MACD DIF has dropped below the zero line, bearish. The 5-day, 8-day, and 13-day moving averages are in a bearish alignment and moving down. Trading volume has increased by 2.2x.
════════════════════
🟢 $DOT 4-hour bearish signal
⚠️Technical: ADX is as high as 38, and the trend is very strong. The MACD fast line has fallen below the zero line, and a bearish signal has appeared. The 5-day line has dropped below the 8-day line, so it may fall in the short term. Volume has doubled, and everyone is running.
════════════════════
🔔 Follow for the latest market moves 🔔
#技术分析 #PLTR #EIGEN #DOT
📌 When trading, pay attention to whether the candlestick pattern is confirmed
178

·
--
$PLTR rose 7.365% over the past 24 hours, and the funding rate is at zero. Not bad—up is up—but neither the bulls nor the bears have paid for it. This structure is more interesting than a simple pump.
Trump’s moves in the tech sector have always been a market nerve. The more he calls for action against tech giants, the more capital wants to find substitute tickers—ones that can capture US equities beta without getting the axe first. The $PLTR positions on Binance Chain futures sit right in this gap. The price surged to 182.52, but the funding rate didn’t budge, suggesting this rally didn’t trigger a panic-driven squeeze from the longs, and the shorts weren’t forced to pay high prices to maintain their positions. This is a balancing point—both sides are waiting.
The strongest contrary evidence is Trump suddenly shifting course. If he signals support for traditional tech giants, or loosens regulation on data security, the premium the market assigns to $PLTR as an anti-establishment tech stock would instantly shrink. The market’s political valuation can flip faster than its fundamentals-based valuation.
The second-order impact is repricing of positioning. If price holds around 182 and the funding rate turns positive, it would mean the shorts can’t hold out anymore—passive liquidations would trigger a second wave. Conversely, if it drops immediately from here, in a zero-fee-rate state the longs have no even interest-cost drag, so they can run very decisively. The next support will depend on where the volume-dense zone is.
The invalidation condition comes down to the current price at 182.52. If two consecutive daily closes fall below this level, and the funding rate remains positive, then the premise of the bull-bear balance you’re betting on fails—meaning the upmove was just a brief flurry from short covering.
In terms of action: the aggressive can try small long positions near the current price, keeping leverage within 3x, with a strict stop-loss set below 180—betting that the Trump narrative continues to build momentum. The more steady approach is to wait for the funding rate to show a clear direction; for example, follow once it breaks above 0.01%. Don’t touch it for now—zero funding rates mean there’s no trend inertia, and both sides are likely to get slapped.
The Trump trade is fundamentally a bet on his unpredictability. The $PLTR on-chain futures have become an immediate barometer for this gamble. A zero funding rate means the dealer has temporarily cleared the table, but everyone hasn’t left.
Trading tag: #TradFi #链上美股 #PLTR
Where do you think this thesis is most likely to be wrong?
$PLTR rose 7.365% over the past 24 hours, and the funding rate is at zero. Not bad—up is up—but neither the bulls nor the bears have paid for it. This structure is more interesting than a simple pump.
Trump’s moves in the tech sector have always been a market nerve. The more he calls for action against tech giants, the more capital wants to find substitute tickers—ones that can capture US equities beta without getting the axe first. The $PLTR positions on Binance Chain futures sit right in this gap. The price surged to 182.52, but the funding rate didn’t budge, suggesting this rally didn’t trigger a panic-driven squeeze from the longs, and the shorts weren’t forced to pay high prices to maintain their positions. This is a balancing point—both sides are waiting.
The strongest contrary evidence is Trump suddenly shifting course. If he signals support for traditional tech giants, or loosens regulation on data security, the premium the market assigns to $PLTR as an anti-establishment tech stock would instantly shrink. The market’s political valuation can flip faster than its fundamentals-based valuation.
The second-order impact is repricing of positioning. If price holds around 182 and the funding rate turns positive, it would mean the shorts can’t hold out anymore—passive liquidations would trigger a second wave. Conversely, if it drops immediately from here, in a zero-fee-rate state the longs have no even interest-cost drag, so they can run very decisively. The next support will depend on where the volume-dense zone is.
The invalidation condition comes down to the current price at 182.52. If two consecutive daily closes fall below this level, and the funding rate remains positive, then the premise of the bull-bear balance you’re betting on fails—meaning the upmove was just a brief flurry from short covering.
In terms of action: the aggressive can try small long positions near the current price, keeping leverage within 3x, with a strict stop-loss set below 180—betting that the Trump narrative continues to build momentum. The more steady approach is to wait for the funding rate to show a clear direction; for example, follow once it breaks above 0.01%. Don’t touch it for now—zero funding rates mean there’s no trend inertia, and both sides are likely to get slapped.
The Trump trade is fundamentally a bet on his unpredictability. The $PLTR on-chain futures have become an immediate barometer for this gamble. A zero funding rate means the dealer has temporarily cleared the table, but everyone hasn’t left.
Trading tag: #TradFi #链上美股 #PLTR
Where do you think this thesis is most likely to be wrong?
Trump’s moves in the tech sector have always been a market nerve. The more he calls for action against tech giants, the more capital wants to find substitute tickers—ones that can capture US equities beta without getting the axe first. The $PLTR positions on Binance Chain futures sit right in this gap. The price surged to 182.52, but the funding rate didn’t budge, suggesting this rally didn’t trigger a panic-driven squeeze from the longs, and the shorts weren’t forced to pay high prices to maintain their positions. This is a balancing point—both sides are waiting.
The strongest contrary evidence is Trump suddenly shifting course. If he signals support for traditional tech giants, or loosens regulation on data security, the premium the market assigns to $PLTR as an anti-establishment tech stock would instantly shrink. The market’s political valuation can flip faster than its fundamentals-based valuation.
The second-order impact is repricing of positioning. If price holds around 182 and the funding rate turns positive, it would mean the shorts can’t hold out anymore—passive liquidations would trigger a second wave. Conversely, if it drops immediately from here, in a zero-fee-rate state the longs have no even interest-cost drag, so they can run very decisively. The next support will depend on where the volume-dense zone is.
The invalidation condition comes down to the current price at 182.52. If two consecutive daily closes fall below this level, and the funding rate remains positive, then the premise of the bull-bear balance you’re betting on fails—meaning the upmove was just a brief flurry from short covering.
In terms of action: the aggressive can try small long positions near the current price, keeping leverage within 3x, with a strict stop-loss set below 180—betting that the Trump narrative continues to build momentum. The more steady approach is to wait for the funding rate to show a clear direction; for example, follow once it breaks above 0.01%. Don’t touch it for now—zero funding rates mean there’s no trend inertia, and both sides are likely to get slapped.
The Trump trade is fundamentally a bet on his unpredictability. The $PLTR on-chain futures have become an immediate barometer for this gamble. A zero funding rate means the dealer has temporarily cleared the table, but everyone hasn’t left.
Trading tag: #TradFi #链上美股 #PLTR
Where do you think this thesis is most likely to be wrong?
27
·
--
PLTR rises 7.365% to 182.52, funding rate is 0, and the open position is 45,000 shares. The price pushed higher, but the funding rate didn’t move at all—this is a clean structure.
The core of the “Trump trade” is the market pricing uncertainty in the policies after he takes office. Palantir is one of the AI companies most deeply tied to the U.S. government, with a large number of intelligence and defense contracts. What the market is betting on now is not the company itself, but how Trump’s return to the White House will affect defense and intelligence spending. A single price signal shows that capital is voting with its feet, setting up this logic in advance.
The strongest counter-evidence is that the policy direction can change at any time. If, after Trump takes office, his stance on AI regulation is stricter than expected, or if he cuts spending in certain areas, then this early push higher could turn into a trap. Price up + funding at zero indicates the longs are advancing cautiously, without a large-scale leveraged bet. That’s both a healthy sign—and it also suggests there aren’t crowded shorts that need to be squeezed, so momentum may be insufficient.
If my view is correct, the next forced rebalancing will likely be among hedge funds that underweighted the Trump theme. They’ll need to cover these kinds of assets. Liquidity could shift from pure tech stocks toward companies with government backing.
My invalidation condition is simple: if the price breaks below 180, this integer level, it means market consensus around this logic is starting to loosen, and I’ll close the position and wait. Conversely, if it can hold above 180 and the funding rate turns positive, it suggests long sentiment has really caught fire—and only then would the trend be more likely to continue.
Action: Don’t chase at the current price. Wait for a pullback to around 180, then consider opening a long position. Use 10x leverage, place a stop-loss at 175, and take profit at the first target of 200. This is based on the single price signal view; if the funding rate begins to fluctuate violently, the plan needs adjustment.
Three scenarios:
Aggressive: Open a 5x long position right at the current price, betting that Trump-related news flow keeps intensifying, with a strict stop-loss at 175.
Conservative: Wait for the price to retest 180 support, then enter with 10x leverage after confirmation; targets unchanged.
Avoid: If the price breaks through 180 and the funding rate turns negative, it means the logic is falsified—stay out of the market and watch.
Right now, everyone says Trump taking office is bullish for tech stocks, and I disagree.
Trading tag: #TradFi #链上美股 #PLTR
Where do you think this view is most likely to be wrong?
PLTR rises 7.365% to 182.52, funding rate is 0, and the open position is 45,000 shares. The price pushed higher, but the funding rate didn’t move at all—this is a clean structure.
The core of the “Trump trade” is the market pricing uncertainty in the policies after he takes office. Palantir is one of the AI companies most deeply tied to the U.S. government, with a large number of intelligence and defense contracts. What the market is betting on now is not the company itself, but how Trump’s return to the White House will affect defense and intelligence spending. A single price signal shows that capital is voting with its feet, setting up this logic in advance.
The strongest counter-evidence is that the policy direction can change at any time. If, after Trump takes office, his stance on AI regulation is stricter than expected, or if he cuts spending in certain areas, then this early push higher could turn into a trap. Price up + funding at zero indicates the longs are advancing cautiously, without a large-scale leveraged bet. That’s both a healthy sign—and it also suggests there aren’t crowded shorts that need to be squeezed, so momentum may be insufficient.
If my view is correct, the next forced rebalancing will likely be among hedge funds that underweighted the Trump theme. They’ll need to cover these kinds of assets. Liquidity could shift from pure tech stocks toward companies with government backing.
My invalidation condition is simple: if the price breaks below 180, this integer level, it means market consensus around this logic is starting to loosen, and I’ll close the position and wait. Conversely, if it can hold above 180 and the funding rate turns positive, it suggests long sentiment has really caught fire—and only then would the trend be more likely to continue.
Action: Don’t chase at the current price. Wait for a pullback to around 180, then consider opening a long position. Use 10x leverage, place a stop-loss at 175, and take profit at the first target of 200. This is based on the single price signal view; if the funding rate begins to fluctuate violently, the plan needs adjustment.
Three scenarios:
Aggressive: Open a 5x long position right at the current price, betting that Trump-related news flow keeps intensifying, with a strict stop-loss at 175.
Conservative: Wait for the price to retest 180 support, then enter with 10x leverage after confirmation; targets unchanged.
Avoid: If the price breaks through 180 and the funding rate turns negative, it means the logic is falsified—stay out of the market and watch.
Right now, everyone says Trump taking office is bullish for tech stocks, and I disagree.
Trading tag: #TradFi #链上美股 #PLTR
Where do you think this view is most likely to be wrong?
The core of the “Trump trade” is the market pricing uncertainty in the policies after he takes office. Palantir is one of the AI companies most deeply tied to the U.S. government, with a large number of intelligence and defense contracts. What the market is betting on now is not the company itself, but how Trump’s return to the White House will affect defense and intelligence spending. A single price signal shows that capital is voting with its feet, setting up this logic in advance.
The strongest counter-evidence is that the policy direction can change at any time. If, after Trump takes office, his stance on AI regulation is stricter than expected, or if he cuts spending in certain areas, then this early push higher could turn into a trap. Price up + funding at zero indicates the longs are advancing cautiously, without a large-scale leveraged bet. That’s both a healthy sign—and it also suggests there aren’t crowded shorts that need to be squeezed, so momentum may be insufficient.
If my view is correct, the next forced rebalancing will likely be among hedge funds that underweighted the Trump theme. They’ll need to cover these kinds of assets. Liquidity could shift from pure tech stocks toward companies with government backing.
My invalidation condition is simple: if the price breaks below 180, this integer level, it means market consensus around this logic is starting to loosen, and I’ll close the position and wait. Conversely, if it can hold above 180 and the funding rate turns positive, it suggests long sentiment has really caught fire—and only then would the trend be more likely to continue.
Action: Don’t chase at the current price. Wait for a pullback to around 180, then consider opening a long position. Use 10x leverage, place a stop-loss at 175, and take profit at the first target of 200. This is based on the single price signal view; if the funding rate begins to fluctuate violently, the plan needs adjustment.
Three scenarios:
Aggressive: Open a 5x long position right at the current price, betting that Trump-related news flow keeps intensifying, with a strict stop-loss at 175.
Conservative: Wait for the price to retest 180 support, then enter with 10x leverage after confirmation; targets unchanged.
Avoid: If the price breaks through 180 and the funding rate turns negative, it means the logic is falsified—stay out of the market and watch.
Right now, everyone says Trump taking office is bullish for tech stocks, and I disagree.
Trading tag: #TradFi #链上美股 #PLTR
Where do you think this view is most likely to be wrong?
2

·
--
$PLTR current price 182.38. In the past 24 hours it’s surged 7.25%—that kind of spike is pretty brutal for US equity futures contracts. But funding is zero, open interest is 45,210 lots. The market still hasn’t gone crazy enough for both longs and shorts to get squeezed together.
I’ll go straight to the orders: go long with 5x leverage. Set stop-loss at 175.00 and take-profit at 200.00. Use 15% of total capital for the position. The logic is simple: price momentum is strong, but the funding rate is neutral. That suggests people chasing longs haven’t been疯狂 (overly) piling into the trade yet, so there’s still room to move up. Palantir’s business is essentially feeding on US government and defense contracts. Whenever geopolitics tightens, the market always pulls up this kind of ticker first—that’s an old playbook.
The strongest counterargument is here: a 7.25% one-day jump by itself creates built-in pullback pressure. If the broader US market turns weak, or if Trump suddenly tweets that he wants to cut the defense budget, PLTR will be the first to drop. The invalidation is clear: if price breaks below 175 and funding turns negative, it means shorts are starting to take control and long momentum is gone—I’ll撤 (pull out) immediately.
The second-order effect: if the price manages to hold steady above 185, those who opened shorts around 180 may be forced to close, pushing liquidity upward for a bit. But open interest of 45,210 isn’t that high—there isn’t enough fuel for a real squeeze. So this trade can only be eaten for a segment; don’t get greedy.
My view is a bullish single-signal setup, driven by a price breakout without funding confirmation. If next week funding spikes above 0.001, I’ll have to reduce position size—too many longs would be too crowded, making a stampede risk.
Aggressive traders can chase the long now, but the stop-loss must be nailed; conservative traders should wait for a pullback to around 180 before entering; the cautious should just watch—this volatility, you can’t really hold through it comfortably. Everyone online says PLTR is an AI concept stock and should be held long-term, but I disagree. This ticker is fundamentally a contract-driven asset driven by political events; make a swing and run.
Trading tag: #TradFi #链上美股 #PLTR
Where do you think this thesis is most likely to be wrong?
$PLTR current price 182.38. In the past 24 hours it’s surged 7.25%—that kind of spike is pretty brutal for US equity futures contracts. But funding is zero, open interest is 45,210 lots. The market still hasn’t gone crazy enough for both longs and shorts to get squeezed together.
I’ll go straight to the orders: go long with 5x leverage. Set stop-loss at 175.00 and take-profit at 200.00. Use 15% of total capital for the position. The logic is simple: price momentum is strong, but the funding rate is neutral. That suggests people chasing longs haven’t been疯狂 (overly) piling into the trade yet, so there’s still room to move up. Palantir’s business is essentially feeding on US government and defense contracts. Whenever geopolitics tightens, the market always pulls up this kind of ticker first—that’s an old playbook.
The strongest counterargument is here: a 7.25% one-day jump by itself creates built-in pullback pressure. If the broader US market turns weak, or if Trump suddenly tweets that he wants to cut the defense budget, PLTR will be the first to drop. The invalidation is clear: if price breaks below 175 and funding turns negative, it means shorts are starting to take control and long momentum is gone—I’ll撤 (pull out) immediately.
The second-order effect: if the price manages to hold steady above 185, those who opened shorts around 180 may be forced to close, pushing liquidity upward for a bit. But open interest of 45,210 isn’t that high—there isn’t enough fuel for a real squeeze. So this trade can only be eaten for a segment; don’t get greedy.
My view is a bullish single-signal setup, driven by a price breakout without funding confirmation. If next week funding spikes above 0.001, I’ll have to reduce position size—too many longs would be too crowded, making a stampede risk.
Aggressive traders can chase the long now, but the stop-loss must be nailed; conservative traders should wait for a pullback to around 180 before entering; the cautious should just watch—this volatility, you can’t really hold through it comfortably. Everyone online says PLTR is an AI concept stock and should be held long-term, but I disagree. This ticker is fundamentally a contract-driven asset driven by political events; make a swing and run.
Trading tag: #TradFi #链上美股 #PLTR
Where do you think this thesis is most likely to be wrong?
I’ll go straight to the orders: go long with 5x leverage. Set stop-loss at 175.00 and take-profit at 200.00. Use 15% of total capital for the position. The logic is simple: price momentum is strong, but the funding rate is neutral. That suggests people chasing longs haven’t been疯狂 (overly) piling into the trade yet, so there’s still room to move up. Palantir’s business is essentially feeding on US government and defense contracts. Whenever geopolitics tightens, the market always pulls up this kind of ticker first—that’s an old playbook.
The strongest counterargument is here: a 7.25% one-day jump by itself creates built-in pullback pressure. If the broader US market turns weak, or if Trump suddenly tweets that he wants to cut the defense budget, PLTR will be the first to drop. The invalidation is clear: if price breaks below 175 and funding turns negative, it means shorts are starting to take control and long momentum is gone—I’ll撤 (pull out) immediately.
The second-order effect: if the price manages to hold steady above 185, those who opened shorts around 180 may be forced to close, pushing liquidity upward for a bit. But open interest of 45,210 isn’t that high—there isn’t enough fuel for a real squeeze. So this trade can only be eaten for a segment; don’t get greedy.
My view is a bullish single-signal setup, driven by a price breakout without funding confirmation. If next week funding spikes above 0.001, I’ll have to reduce position size—too many longs would be too crowded, making a stampede risk.
Aggressive traders can chase the long now, but the stop-loss must be nailed; conservative traders should wait for a pullback to around 180 before entering; the cautious should just watch—this volatility, you can’t really hold through it comfortably. Everyone online says PLTR is an AI concept stock and should be held long-term, but I disagree. This ticker is fundamentally a contract-driven asset driven by political events; make a swing and run.
Trading tag: #TradFi #链上美股 #PLTR
Where do you think this thesis is most likely to be wrong?
10
·
--
$PLTR In the past 24 hours, it surged by 7.25 points, and the price is stuck at 182.38. On the on-chain contracts side, the funding rate is 0, and the open interest is roughly 45,200 of the underlying. Price is rising, but the funding rate hasn’t followed—this combo is kind of interesting.
Price breaks upward, yet the perpetual contract’s funding rate stays steady on the zero line. This suggests the chasing-long funds aren’t overly aggressive; they haven’t created a downside negative funding-rate squeeze (shorts paying), nor have they generated an upside positive funding-rate burden (longs paying). This is a relatively healthy state for a one-way rally. The move up is driven by spot or proactive buy orders, not by leverage from perpetual long positions forcing the market higher. Open interest isn’t exploding—markets are waiting for direction; it’s not yet the stage where positioning is heavily against each other.
Right now, my judgment is bullish. This tech earnings season is carrying decent sentiment. As a representative AI-theme stock, $PLTR has a theme premium. With the on-chain contract funding rate neutral, it leaves room for longs to add without having accumulated high costs. If the price can hold above 180, the next target is around the prior high near 190.
What’s the strongest counter-argument? If Trump suddenly posts and calls for a review of all government AI contracts, or if geopolitical tensions escalate and cause a sharp drop in market risk appetite, it could directly pin down $PLTR. This kind of headline risk can’t be calculated in advance—you can only react intraday.
So my move is very clear: go long $PLTR on the on-chain contracts. Parameters are as follows: Direction: Long. Leverage: 5x. Stop loss: 178.00 (below the prior small base). Take profit: 190.50 (near the prior high resistance zone). Position size: 20% of my total contract margin.
If the price doesn’t reach 190 and instead turns downward, and breaks below 178, I will stop out unconditionally. If it rockets toward 190, I’ll close half at 188 to lock in profit; then I’ll pull the remaining position’s cost basis down to zero and bet on a breakout. The market thinks AI stocks are overvalued, but the contract structure tells me the shorts haven’t dared to go in with real force—this is the longs’ opportunity.
Trading tag: #TradFi #链上美股 #PLTR
Where do you think this thesis is most likely to be wrong?
$PLTR In the past 24 hours, it surged by 7.25 points, and the price is stuck at 182.38. On the on-chain contracts side, the funding rate is 0, and the open interest is roughly 45,200 of the underlying. Price is rising, but the funding rate hasn’t followed—this combo is kind of interesting.
Price breaks upward, yet the perpetual contract’s funding rate stays steady on the zero line. This suggests the chasing-long funds aren’t overly aggressive; they haven’t created a downside negative funding-rate squeeze (shorts paying), nor have they generated an upside positive funding-rate burden (longs paying). This is a relatively healthy state for a one-way rally. The move up is driven by spot or proactive buy orders, not by leverage from perpetual long positions forcing the market higher. Open interest isn’t exploding—markets are waiting for direction; it’s not yet the stage where positioning is heavily against each other.
Right now, my judgment is bullish. This tech earnings season is carrying decent sentiment. As a representative AI-theme stock, $PLTR has a theme premium. With the on-chain contract funding rate neutral, it leaves room for longs to add without having accumulated high costs. If the price can hold above 180, the next target is around the prior high near 190.
What’s the strongest counter-argument? If Trump suddenly posts and calls for a review of all government AI contracts, or if geopolitical tensions escalate and cause a sharp drop in market risk appetite, it could directly pin down $PLTR . This kind of headline risk can’t be calculated in advance—you can only react intraday.
So my move is very clear: go long $PLTR on the on-chain contracts. Parameters are as follows: Direction: Long. Leverage: 5x. Stop loss: 178.00 (below the prior small base). Take profit: 190.50 (near the prior high resistance zone). Position size: 20% of my total contract margin.
If the price doesn’t reach 190 and instead turns downward, and breaks below 178, I will stop out unconditionally. If it rockets toward 190, I’ll close half at 188 to lock in profit; then I’ll pull the remaining position’s cost basis down to zero and bet on a breakout. The market thinks AI stocks are overvalued, but the contract structure tells me the shorts haven’t dared to go in with real force—this is the longs’ opportunity.
Trading tag: #TradFi #链上美股 #PLTR
Where do you think this thesis is most likely to be wrong?
Price breaks upward, yet the perpetual contract’s funding rate stays steady on the zero line. This suggests the chasing-long funds aren’t overly aggressive; they haven’t created a downside negative funding-rate squeeze (shorts paying), nor have they generated an upside positive funding-rate burden (longs paying). This is a relatively healthy state for a one-way rally. The move up is driven by spot or proactive buy orders, not by leverage from perpetual long positions forcing the market higher. Open interest isn’t exploding—markets are waiting for direction; it’s not yet the stage where positioning is heavily against each other.
Right now, my judgment is bullish. This tech earnings season is carrying decent sentiment. As a representative AI-theme stock, $PLTR has a theme premium. With the on-chain contract funding rate neutral, it leaves room for longs to add without having accumulated high costs. If the price can hold above 180, the next target is around the prior high near 190.
What’s the strongest counter-argument? If Trump suddenly posts and calls for a review of all government AI contracts, or if geopolitical tensions escalate and cause a sharp drop in market risk appetite, it could directly pin down $PLTR . This kind of headline risk can’t be calculated in advance—you can only react intraday.
So my move is very clear: go long $PLTR on the on-chain contracts. Parameters are as follows: Direction: Long. Leverage: 5x. Stop loss: 178.00 (below the prior small base). Take profit: 190.50 (near the prior high resistance zone). Position size: 20% of my total contract margin.
If the price doesn’t reach 190 and instead turns downward, and breaks below 178, I will stop out unconditionally. If it rockets toward 190, I’ll close half at 188 to lock in profit; then I’ll pull the remaining position’s cost basis down to zero and bet on a breakout. The market thinks AI stocks are overvalued, but the contract structure tells me the shorts haven’t dared to go in with real force—this is the longs’ opportunity.
Trading tag: #TradFi #链上美股 #PLTR
Where do you think this thesis is most likely to be wrong?
12
·
--
$PLTR 24 hours, it surged 7.251%, and the price broke above $182. On the order book, the funding rate is 0, and the open interest is 45,200 contracts.
The price is moving, but the long/short cost battle on the contract side is zero. This doesn’t look like a typical contract-driven rally—longs aren’t paying shorts, and shorts aren’t paying longs. The upside momentum is likely not coming from internal liquidation pressure in the contracts, but from new external capital buying. It could be spillover from earnings season sentiment in tech stocks, or another round of speculation driven by AI policy expectations. Judging from a single signal, this appears to be a one-sided move driven by spot or macro sentiment.
In this kind of structure, longs rely on conviction rather than funding income, and shorts haven’t been forced to pay a premium yet. Current open interest isn’t low. With price rising and OI increasing, it suggests new long positions are being established. If this rally is truly driven by external sentiment, then the price’s persistence depends on when that sentiment cools off. Conversely, shorts are sitting on 0-cost positions right now—they’re not in a hurry. If they believe the move is too large, they have every ability to add shorts at the current level to snipe. The strongest counter-evidence is here: shorts think $182 is already the sentiment peak, so they start placing short orders; they expect a quick pullback.
Who would be forced to rebalance? If sentiment keeps running hot and price pushes up another leg, the shorts that are currently watching from the sidelines may be forced to cut losses, which could push the price higher. But funding rate being 0 means no one is currently being squeezed. This process won’t happen automatically—it requires incremental buy pressure to ignite. If the buy pressure stops and the price falls back, then longs become the trapped side—they’re the ones who would potentially be forced to cut.
So my view is: a one-way sentiment market. Going long relies on external catalysts, but the structure doesn’t support a big squeeze of shorts. I’ll go long in a small position following the trend, but with strict stop-loss. I’m waiting for the moment when the sentiment abruptly fades.
Action: Go long $PLTR. 5x leverage. Stop-loss at 178 (about 2.4% below). Take-profit at 190 (about 4.2% above). Position size 20%. If price breaks below 178, I’ll admit it was wrong and exit immediately—this would indicate the sentiment-driven phase is over, and the market shifts back to long/short competition on the contract side. In a 0-funding environment, that’s unfavorable for longs. If it immediately surges to 190, I’ll close half the position and move the stop-loss on the remainder to break-even.
Three scenarios: 1) Aggressive chase long at the current price, betting on the final rush of sentiment; 2) Cautious wait for a pullback around 180 and then enter—better risk/reward; 3) Staying sidelined is also fine, since in a 0-funding market the pace is slower, so wait for the funding rate to show abnormal movement before entering.
Trading tag: #TradFi #链上美股 #PLTR
Where do you think this assessment is most likely to be wrong?
$PLTR 24 hours, it surged 7.251%, and the price broke above $182. On the order book, the funding rate is 0, and the open interest is 45,200 contracts.
The price is moving, but the long/short cost battle on the contract side is zero. This doesn’t look like a typical contract-driven rally—longs aren’t paying shorts, and shorts aren’t paying longs. The upside momentum is likely not coming from internal liquidation pressure in the contracts, but from new external capital buying. It could be spillover from earnings season sentiment in tech stocks, or another round of speculation driven by AI policy expectations. Judging from a single signal, this appears to be a one-sided move driven by spot or macro sentiment.
In this kind of structure, longs rely on conviction rather than funding income, and shorts haven’t been forced to pay a premium yet. Current open interest isn’t low. With price rising and OI increasing, it suggests new long positions are being established. If this rally is truly driven by external sentiment, then the price’s persistence depends on when that sentiment cools off. Conversely, shorts are sitting on 0-cost positions right now—they’re not in a hurry. If they believe the move is too large, they have every ability to add shorts at the current level to snipe. The strongest counter-evidence is here: shorts think $182 is already the sentiment peak, so they start placing short orders; they expect a quick pullback.
Who would be forced to rebalance? If sentiment keeps running hot and price pushes up another leg, the shorts that are currently watching from the sidelines may be forced to cut losses, which could push the price higher. But funding rate being 0 means no one is currently being squeezed. This process won’t happen automatically—it requires incremental buy pressure to ignite. If the buy pressure stops and the price falls back, then longs become the trapped side—they’re the ones who would potentially be forced to cut.
So my view is: a one-way sentiment market. Going long relies on external catalysts, but the structure doesn’t support a big squeeze of shorts. I’ll go long in a small position following the trend, but with strict stop-loss. I’m waiting for the moment when the sentiment abruptly fades.
Action: Go long $PLTR . 5x leverage. Stop-loss at 178 (about 2.4% below). Take-profit at 190 (about 4.2% above). Position size 20%. If price breaks below 178, I’ll admit it was wrong and exit immediately—this would indicate the sentiment-driven phase is over, and the market shifts back to long/short competition on the contract side. In a 0-funding environment, that’s unfavorable for longs. If it immediately surges to 190, I’ll close half the position and move the stop-loss on the remainder to break-even.
Three scenarios: 1) Aggressive chase long at the current price, betting on the final rush of sentiment; 2) Cautious wait for a pullback around 180 and then enter—better risk/reward; 3) Staying sidelined is also fine, since in a 0-funding market the pace is slower, so wait for the funding rate to show abnormal movement before entering.
Trading tag: #TradFi #链上美股 #PLTR
Where do you think this assessment is most likely to be wrong?
The price is moving, but the long/short cost battle on the contract side is zero. This doesn’t look like a typical contract-driven rally—longs aren’t paying shorts, and shorts aren’t paying longs. The upside momentum is likely not coming from internal liquidation pressure in the contracts, but from new external capital buying. It could be spillover from earnings season sentiment in tech stocks, or another round of speculation driven by AI policy expectations. Judging from a single signal, this appears to be a one-sided move driven by spot or macro sentiment.
In this kind of structure, longs rely on conviction rather than funding income, and shorts haven’t been forced to pay a premium yet. Current open interest isn’t low. With price rising and OI increasing, it suggests new long positions are being established. If this rally is truly driven by external sentiment, then the price’s persistence depends on when that sentiment cools off. Conversely, shorts are sitting on 0-cost positions right now—they’re not in a hurry. If they believe the move is too large, they have every ability to add shorts at the current level to snipe. The strongest counter-evidence is here: shorts think $182 is already the sentiment peak, so they start placing short orders; they expect a quick pullback.
Who would be forced to rebalance? If sentiment keeps running hot and price pushes up another leg, the shorts that are currently watching from the sidelines may be forced to cut losses, which could push the price higher. But funding rate being 0 means no one is currently being squeezed. This process won’t happen automatically—it requires incremental buy pressure to ignite. If the buy pressure stops and the price falls back, then longs become the trapped side—they’re the ones who would potentially be forced to cut.
So my view is: a one-way sentiment market. Going long relies on external catalysts, but the structure doesn’t support a big squeeze of shorts. I’ll go long in a small position following the trend, but with strict stop-loss. I’m waiting for the moment when the sentiment abruptly fades.
Action: Go long $PLTR . 5x leverage. Stop-loss at 178 (about 2.4% below). Take-profit at 190 (about 4.2% above). Position size 20%. If price breaks below 178, I’ll admit it was wrong and exit immediately—this would indicate the sentiment-driven phase is over, and the market shifts back to long/short competition on the contract side. In a 0-funding environment, that’s unfavorable for longs. If it immediately surges to 190, I’ll close half the position and move the stop-loss on the remainder to break-even.
Three scenarios: 1) Aggressive chase long at the current price, betting on the final rush of sentiment; 2) Cautious wait for a pullback around 180 and then enter—better risk/reward; 3) Staying sidelined is also fine, since in a 0-funding market the pace is slower, so wait for the funding rate to show abnormal movement before entering.
Trading tag: #TradFi #链上美股 #PLTR
Where do you think this assessment is most likely to be wrong?
6

·
--
Bullish
🔥 PLTR tech-perp shorts got totally obliterated! Over $5.2K in short positions wiped out clean at $180.15! 🤦♂️ Shorting strong tech assets during a bullish macro run is pure madness. Whales just grabbed all that upside liquidity! 🚀
$PLTR
{future}(PLTRUSDT)
🟢 LIQUIDITY ZONE HIT 🟢
Short liquidation spotted 🧨 $5.28K cleared at $180.15 Upside liquidity swept — strong momentum favoring continuous upside price action 👀
🎯 Targets: $185.00 | $192.00
#PLTR #CryptoPerps #TradingSignals
🔥 PLTR tech-perp shorts got totally obliterated! Over $5.2K in short positions wiped out clean at $180.15! 🤦♂️ Shorting strong tech assets during a bullish macro run is pure madness. Whales just grabbed all that upside liquidity! 🚀
$PLTR
🟢 LIQUIDITY ZONE HIT 🟢
Short liquidation spotted 🧨 $5.28K cleared at $180.15 Upside liquidity swept — strong momentum favoring continuous upside price action 👀
🎯 Targets: $185.00 | $192.00
#PLTR #CryptoPerps #TradingSignals
$PLTR
🟢 LIQUIDITY ZONE HIT 🟢
Short liquidation spotted 🧨 $5.28K cleared at $180.15 Upside liquidity swept — strong momentum favoring continuous upside price action 👀
🎯 Targets: $185.00 | $192.00
#PLTR #CryptoPerps #TradingSignals
2
72
Log in to explore more content
Join global crypto users on Binance Square
⚡️ Get latest and useful information about crypto.
💬 Trusted by the world’s largest crypto exchange.
👍 Discover real insights from verified creators.
Email / Phone number
Trending Topics
1
#AppleDebutsFoldablePhone
1,870 views
90 Discussing
2
#US10YTreasuryYieldHitsHighestSinceNov2023
6,515 views
145 Discussing
3
#USTreasuryToBuyBackUpTo$6BLongDatedDebt
9,200 views
129 Discussing
4
#BitcoinSurpasses$79K
55,315 views
249 Discussing
5
#BrentCrudeTops$100
110,885 views
378 Discussing
6
#USADPWeeklyEmploymentRises12000
84,632 views
1,066 Discussing
7
#BankOfAmericaGroupPilotsUSBDCStablecoin
64,060 views
852 Discussing
8
#RippleLobbiesToAdvanceCLARITYActVote
96,911 views
1,115 Discussing
9
#GrayscaleZcashETFTops$500M
14,374 views
123 Discussing
10
#LAPTOPFoundationXAccountSuspended
4,418 views
81 Discussing