

#ibm
ibm
171,307 views
598 Discussing
Hot
Latest

#股票财报季
#IBM
Business assessment: IBM’s software-led transformation has made tangible progress, and growth in software revenue and profits has a solid basis. However, a rebound in transactional business and contributions from acquisitions temper expectations for sustained growth. Operating quality is improving, but whether growth can continue to accelerate remains to be seen.
Investment assessment: The current valuation has some support from cash flow, but already reflects some expectations of improvement in the software business. The available evidence is insufficient to conclude that IBM is significantly undervalued, or to establish that it merits the valuation of a technology company capable of sustained high growth.
{stock_us}(IBM.US)
#股票财报季
#IBM
Business assessment: IBM’s software-led transformation has made tangible progress, and growth in software revenue and profits has a solid basis. However, a rebound in transactional business and contributions from acquisitions temper expectations for sustained growth. Operating quality is improving, but whether growth can continue to accelerate remains to be seen.
Investment assessment: The current valuation has some support from cash flow, but already reflects some expectations of improvement in the software business. The available evidence is insufficient to conclude that IBM is significantly undervalued, or to establish that it merits the valuation of a technology company capable of sustained high growth.
IBMUS+0.05%
64

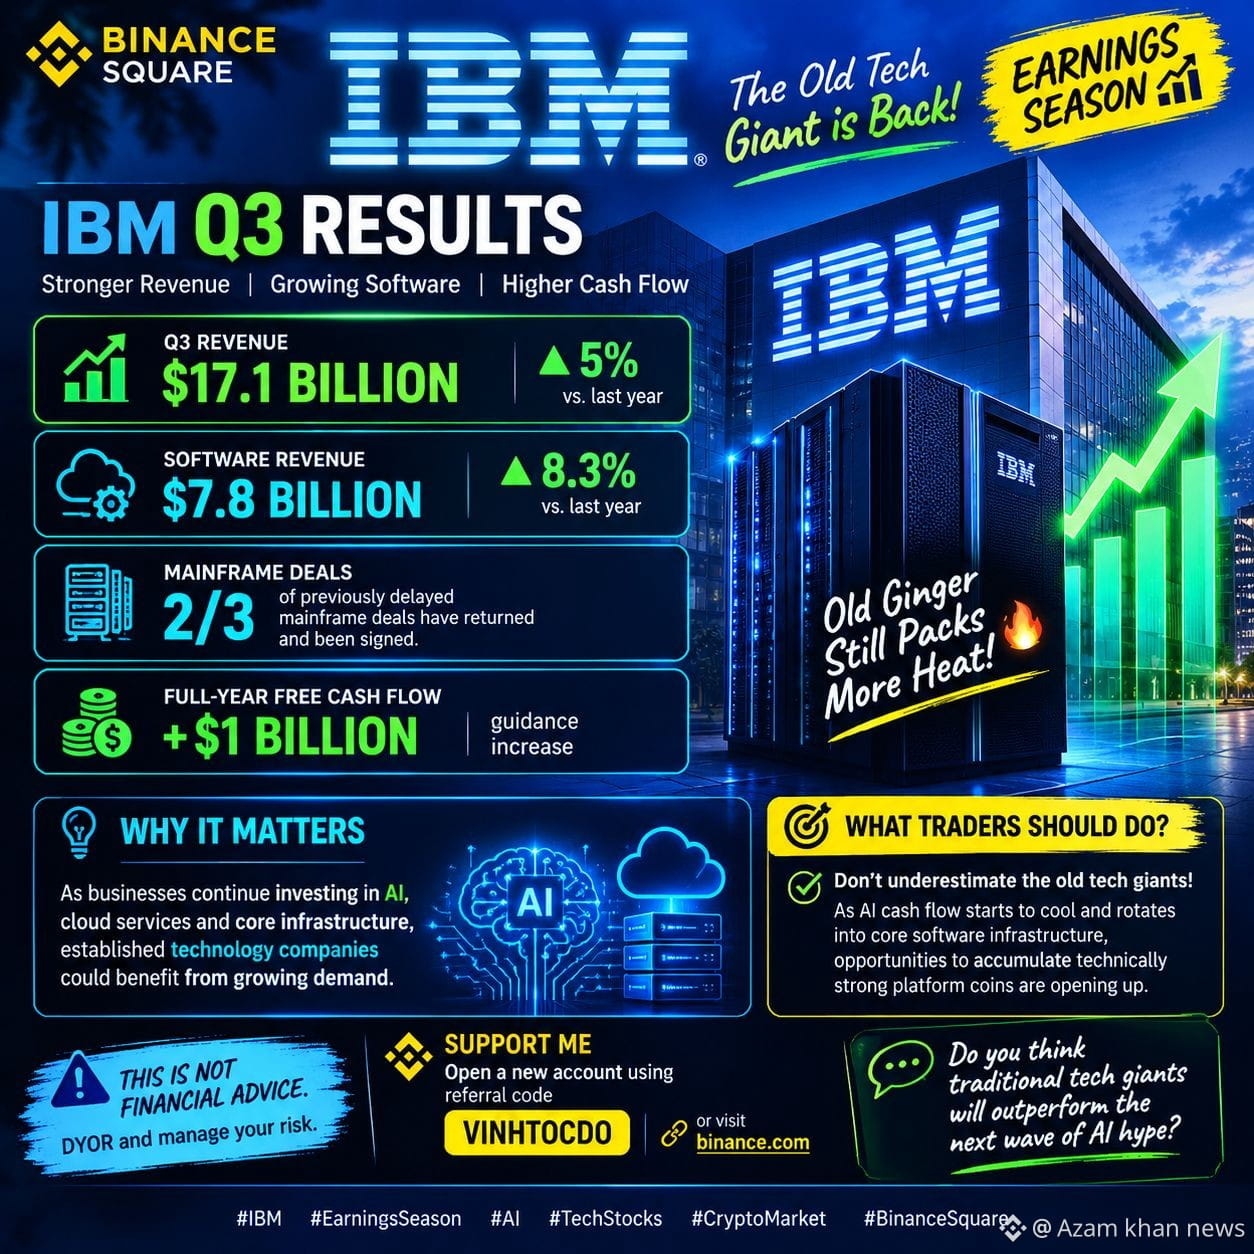
🚨 IBM’S COMEBACK: THE OLD TECH GIANT IS BACK! 🦾💚
IBM is showing that established tech companies still have plenty of power this earnings season!
📊 Q3 HIGHLIGHTS
🔹 Revenue climbed 5% to $17.1 billion
🔹 Software revenue increased 8.3% to $7.8 billion
🔹 Around two-thirds of previously delayed mainframe deals reportedly returned and were signed
🔹 Full-year free cash flow guidance increased by more than $1 billion
🔥 WHY IT MATTERS
As businesses continue investing in AI, cloud services, and core infrastructure, established technology companies could benefit from growing demand.
For crypto traders, the bigger lesson is to watch where capital is flowing—but remember, IBM’s performance does not automatically mean platform tokens will rise.
👀 MY TAKE: Don’t overlook established tech giants while chasing the latest AI narrative. Follow earnings, cash flow, and market trends before making investment decisions.
⚠️ This is not financial advice. Always DYOR and manage your risk.
💬 Do you think traditional tech giants will outperform the next wave of AI hype?$LINK
$FIL
$ICP
#ibm #EarningsSeason #AI #TechStocks #CryptoMarket #BinanceSquare
79

·
--
🚨 $IBM SMASHES REVENUE GUIDANCE, BUT STOCK SINKS 5% 📉
📊 IBM posted Q3 FY26 revenue of $17.1 bn, a solid 5% YoY lift, while EPS hit $2.95—both outpacing forecasts. 🦈 The firm lifted full‑year software revenue growth outlook to 7‑8% and nudged free‑cash‑flow guidance past $1 bn, reflecting a resurgence in delayed mainframe and data‑center deals. 💡 Yet the after‑hours market shrugged, dragging the share to $239.02, down 4.95%, as traders weigh short‑term profit‑taking against the longer‑term cash‑flow tailwind.
💬 Are you betting the price will rebound as the free‑cash‑flow narrative sinks in? 👇
⚠️ Not financial advice. Always manage your risk. 🛡️
🏷️ #IBM #EarningsBeat #SoftwareGrowth #FreeCashFlow #MarketReaction
🔥 🦈
13

🚀 $IBM BREAKS THROUGH REVENUE BARRIERS, BUT PRICE SINKS 5% AFTER HOURS 🔴
Entry: 239.02 ⚡
🦈 IBM posted Q3 revenue of $17.1 B, up 5% YoY, and EPS of $2.95, both beating estimates. The delayed software and mainframe deals finally inked, pushing full‑year software growth guidance to 7‑8% and free‑cash‑flow outlook above $1 B. 📊
📉 Despite the earnings beat, the stock slipped 4.95% to $239.02 in after‑hours, hinting at a potential liquidity sweep. With free cash flow already at a nine‑month record $8 B, the dip could set the stage for a strategic rebound. 💡
💬 Are you eyeing a rebound entry at $239 or waiting for a deeper pull?
⚠️ Not financial advice. Always manage your risk. 🛡️
🏷️ #IBM #Earnings #SoftwareGrowth #MarketMove #Crypto
🔥 💎
必备小神器888:
营收超预期还跌5%,说明市场不买一次性补单的账,239追高容易被埋。
1
7

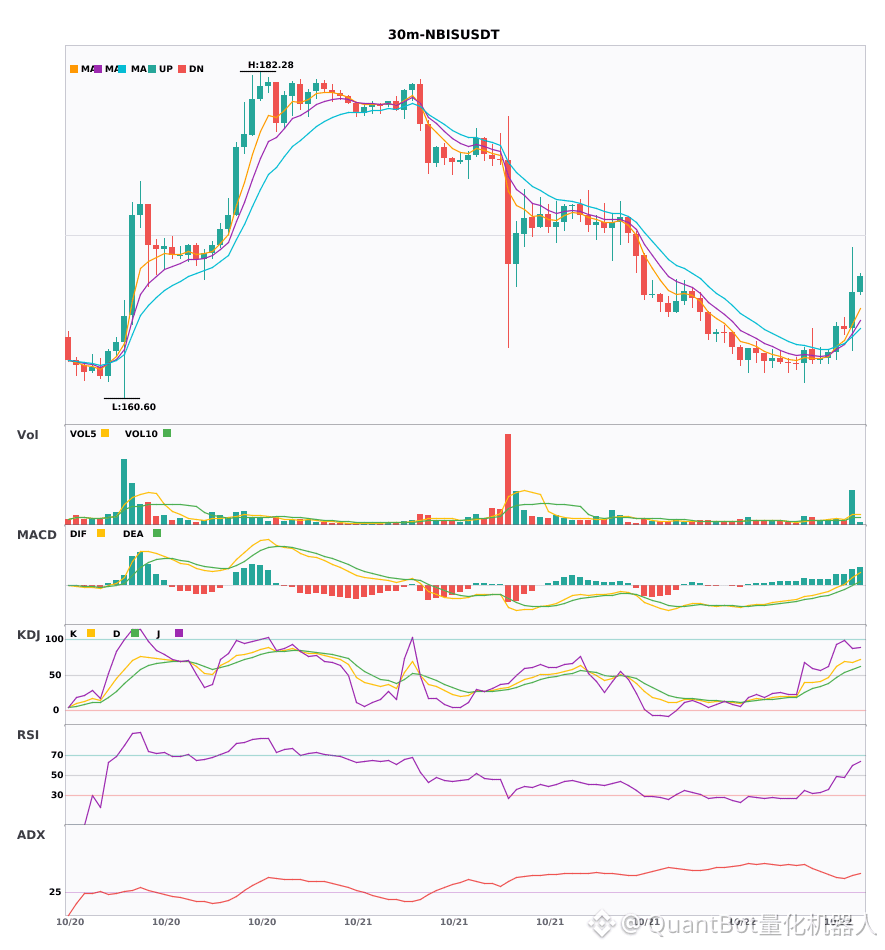
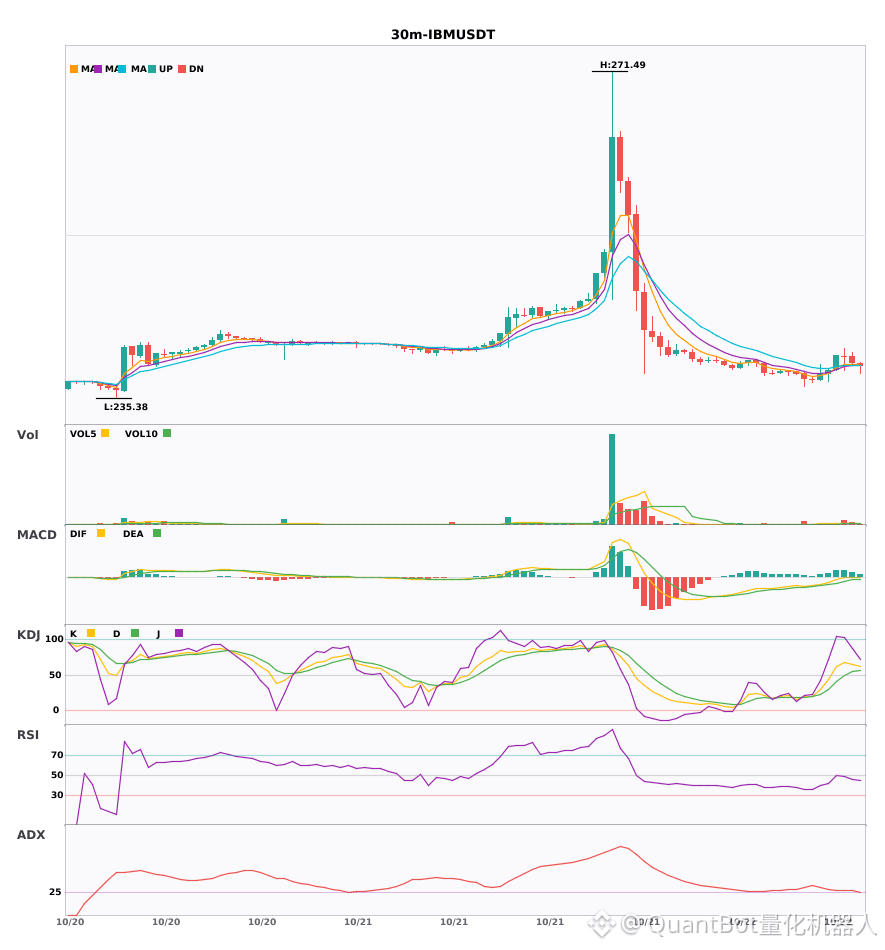
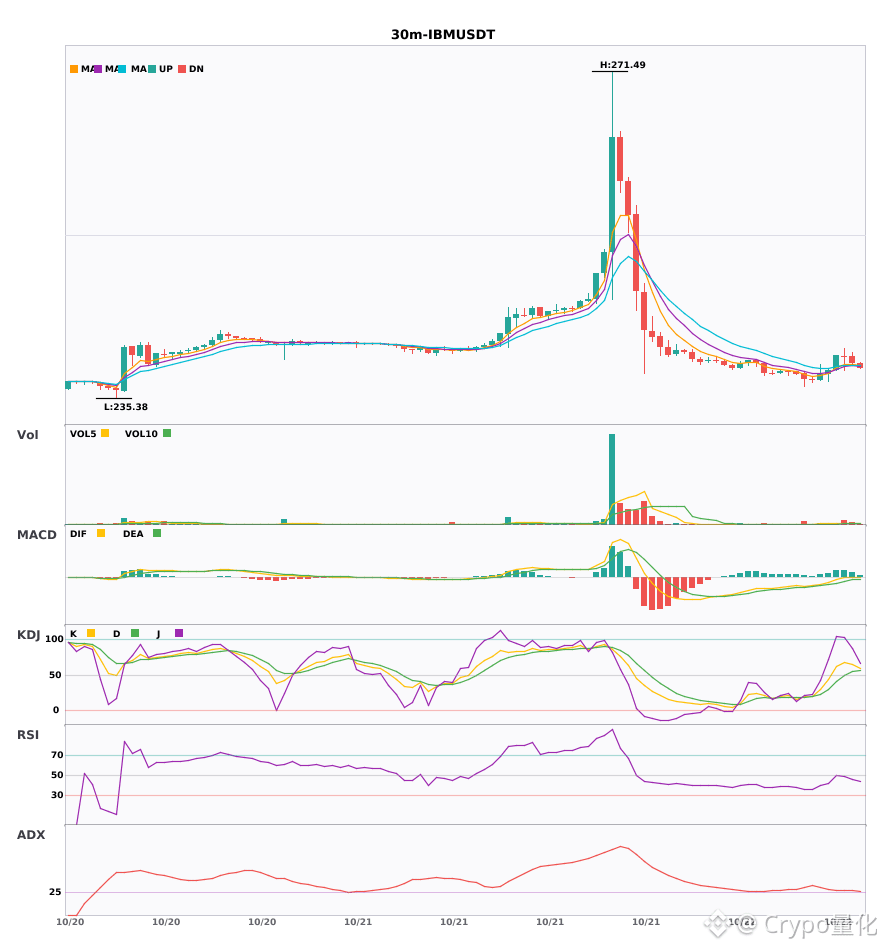
Two bullish signals on the 30-minute timeframe appeared simultaneously: $NBIS / $IBM
📈 $NBIS | 30-minute bullish signal
━━━━━━━━━━━━━━━━━━
Technical analysis: ADX(44): clear trending market | MACD is bullish, with a strong trend and increasing momentum | EMA5 > EMA8 > EMA13: bullish alignment | KDJ is strong, with bulls in control (K: 67.8, D: 58.2) | Volume surge (4.6x)
Price change: 1.4800%
📈 $IBM | 30-minute bullish signal
━━━━━━━━━━━━━━━━━━
Technical analysis: ADX(31): clear trending market | MACD DIF crossed above the zero line, signaling a bullish trend reversal | Moving averages are converging as momentum builds; a directional move is imminent | Volume surge (3.4x)
Price change: -0.0600%
━━━━━━━━━━━━━━━━━━
#技术分析 #NBIS #IBM
📌 The above is for reference only and does not constitute investment advice
4

·
--
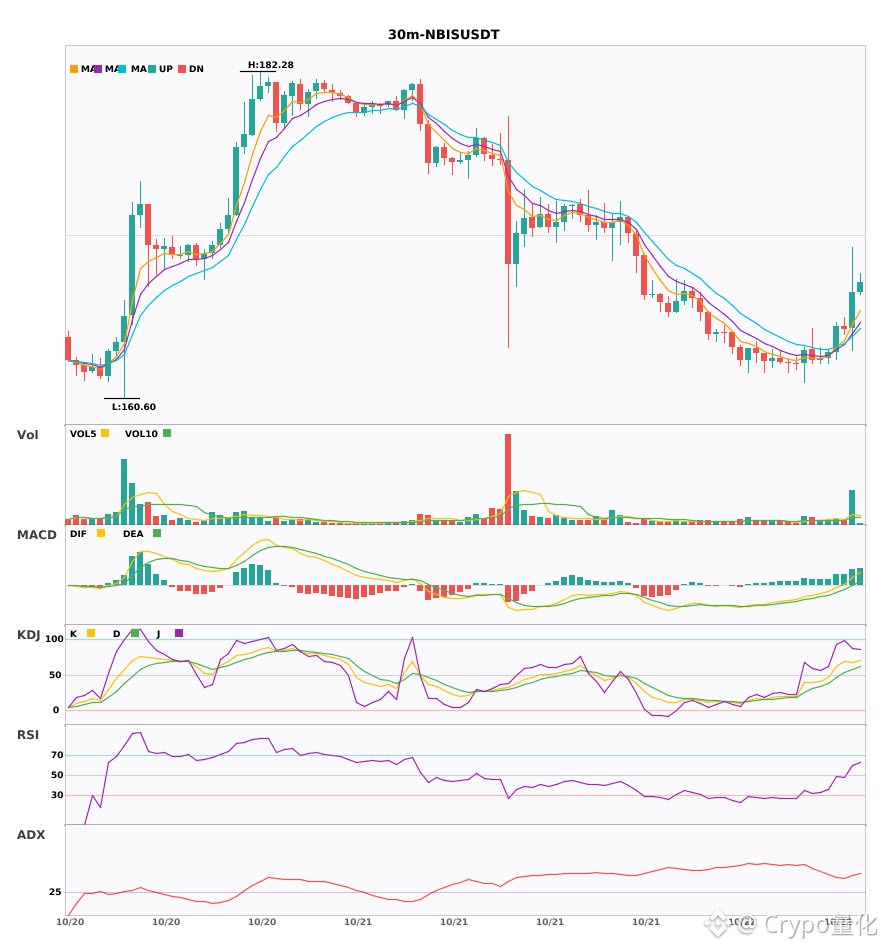
$NBIS / $IBM 30-minute timeframe is leaning bullish; a short-term confluence opportunity 🔥
════════════════════
🔴 $NBIS 30-minute bullish signal
⚠️Technical analysis: ADX(44) indicates a clear trending market | MACD is bullish, with a strong trend and increasing momentum | EMA5 > EMA8 > EMA13, a bullish alignment | KDJ is running strong, with bulls in control (K: 67.8, D: 58.2) | Volume surge (4.6x)
════════════════════
🔴 $IBM 30-minute bullish signal
⚠️Technical analysis: ADX(31) indicates a clear trending market | MACD DIF has crossed above the zero line, signaling a bullish trend reversal | Moving averages are converging and building momentum, with a directional move imminent | Volume surge (3.4x)
════════════════════
🔔 Follow for firsthand market updates 🔔
#技术分析 #NBIS #IBM
📌 When trading, pay attention to whether the candlestick pattern confirms the signal
════════════════════
🔴 $NBIS 30-minute bullish signal
⚠️Technical analysis: ADX(44) indicates a clear trending market | MACD is bullish, with a strong trend and increasing momentum | EMA5 > EMA8 > EMA13, a bullish alignment | KDJ is running strong, with bulls in control (K: 67.8, D: 58.2) | Volume surge (4.6x)
════════════════════
🔴 $IBM 30-minute bullish signal
⚠️Technical analysis: ADX(31) indicates a clear trending market | MACD DIF has crossed above the zero line, signaling a bullish trend reversal | Moving averages are converging and building momentum, with a directional move imminent | Volume surge (3.4x)
════════════════════
🔔 Follow for firsthand market updates 🔔
#技术分析 #NBIS #IBM
📌 When trading, pay attention to whether the candlestick pattern confirms the signal
10

·
--
Verified
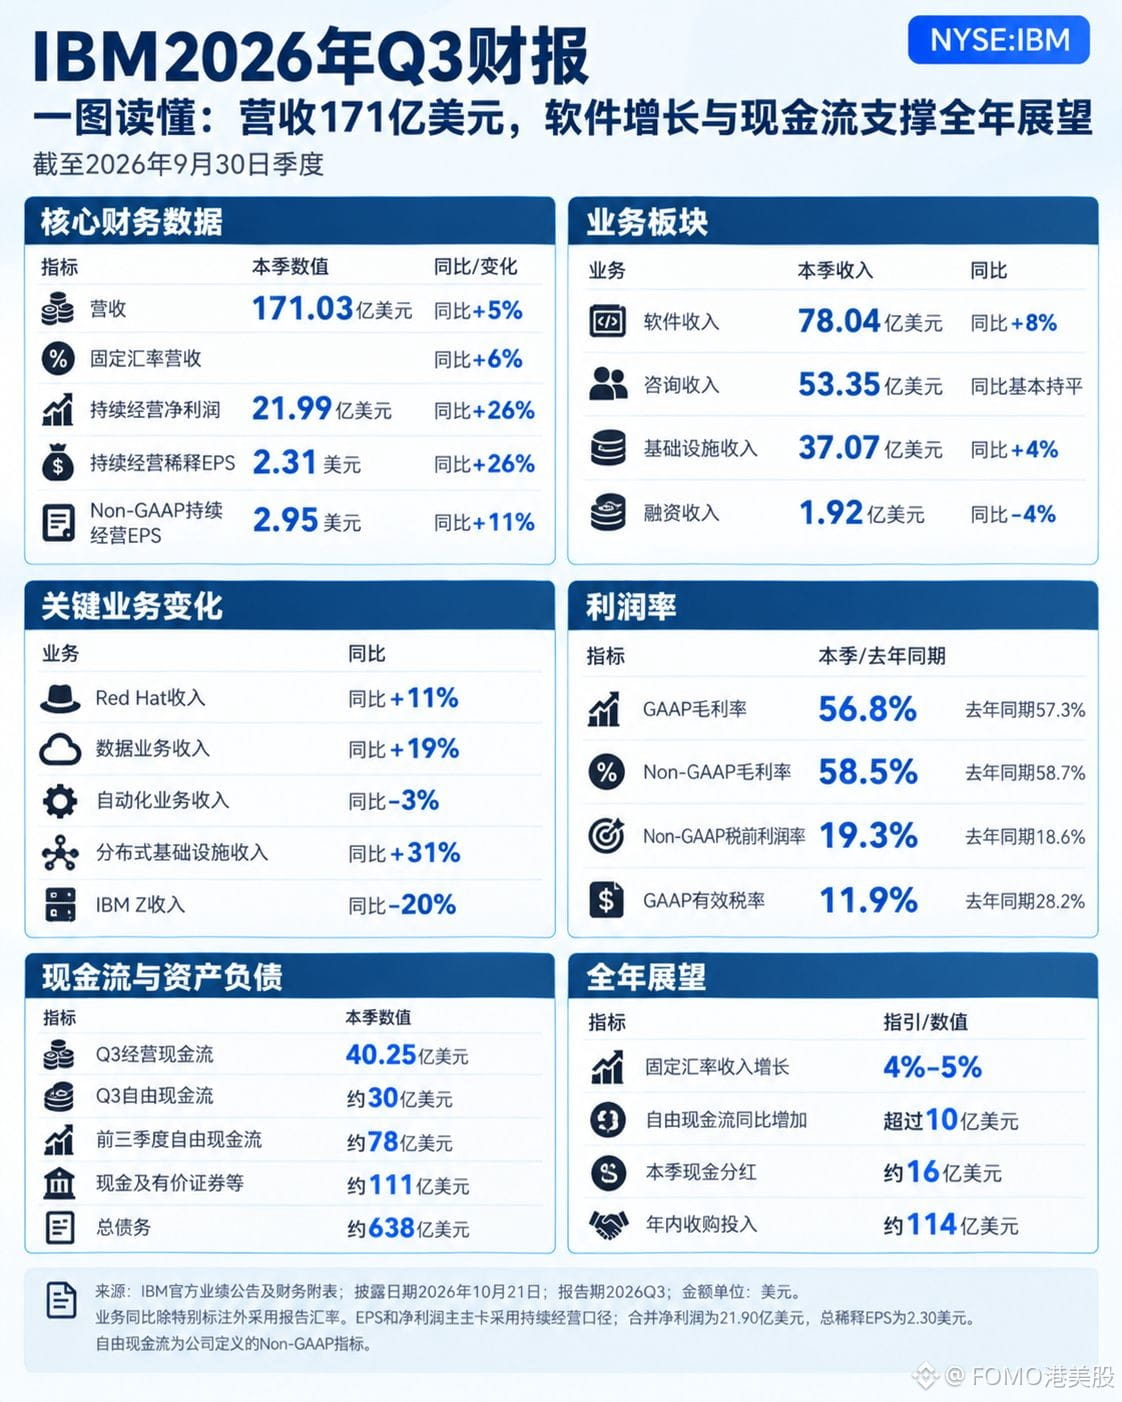
IBM $IBMB posted third-quarter net income of $2.199 billion, up 26%, while pretax income rose just 3%. Shares fell 4.63% after hours to $239.81.
Revenue was $17.103 billion, up 5%. Software revenue was $7.804 billion, up 8%, with data up 19%, Red Hat up 11%, and automation down 3%. The software profit margin rose from 32.9% to 35.0%. Consulting revenue was $5.335 billion, flat, while its margin fell from 12.9% to 12.2%. Infrastructure revenue was $3.707 billion, up 4%; distributed infrastructure grew 31%, offsetting a 20% decline in IBM Z.
Net income needs a closer look. The effective tax rate fell from 28.2% to 11.9%. At last year’s tax rate, this year’s net income would have been just $1.793 billion, up 2.7% year over year—not 26%. The software segment added $354 million in profit, while the company’s pretax income increased by only $73 million.
The free cash flow forecast was raised to reflect an additional $1 billion in growth. Third-quarter free cash flow was $3.03 billion, up 27.8%. But in the first three quarters, cash flow totaled $7.8 billion, while acquisitions cost $11.4 billion—cash fell by $3.4 billion and debt rose by $2.6 billion. The improvement is real. Whether it can close the gap is the key question going forward.
#IBM #BStocks #股票财报季
心赚:
@BiBi 总结此内容
3
13
23.5k


> IBM 3Q OPER EPS $2.95, EST.
> $2.86
> IBM 3Q SOFTWARE REV.
> $7.80B, EST.
> $7.64B
> $IBM
#IBM
> IBM 3Q OPER EPS $2.95, EST.
> $2.86
> IBM 3Q SOFTWARE REV.
> $7.80B, EST.
> $7.64B
> $IBM
#IBM
> $2.86
> IBM 3Q SOFTWARE REV.
> $7.80B, EST.
> $7.64B
> $IBM
#IBM
90


$IBM LONG
🔹Entry zone: 233.06
🎯Take profit 1: 233.48689032 (+0.18%)
🎯Take profit 2: 234.08378065 (+0.44%)
🎯Take profit 3: 234.97911614 (+0.82%)
🛡Protection: 231.99466451 (-0.46%)
The short-term momentum indicator is at moderate levels, reflecting the current balance of forces without signaling future reversals. The sequence of levels sets the direction of movement, with each threshold serving as a logical step in the development of a bullish scenario. If buyers maintain the initiative after breaking through the first step, prices will gradually move higher. Risk is limited by the protective level below, safeguarding the position against an adverse break in the structure.
⚠️ This is not financial advice. Trade at your own risk. DYOR.
#IBM #AKE #ZEC 📈
$IBM
18
$IBM SHORT
1. At the outset of the position, it is important to assess whether the market is ready for a gradual decline in prices toward the planned stepwise targets.
2. If the resistance barrier remains unbroken, the downward scenario will have room to implement the plan in stages.
3. Strict risk management makes it possible to rule out unfavorable scenarios in advance as market conditions change.
🔹Entry zone: 230.24
💰Target 1: 229.60257462 (+0.28%)
💰Target 2: 228.74514923 (+0.65%)
💰Target 3: 227.45901116 (+1.21%)
🛡Protection: 231.74613808 (-0.65%)
⚠️ This is not financial advice. Trade at your own risk. DYOR.
#IBM #Trade #bStocksCIS 📈
$IBM
20
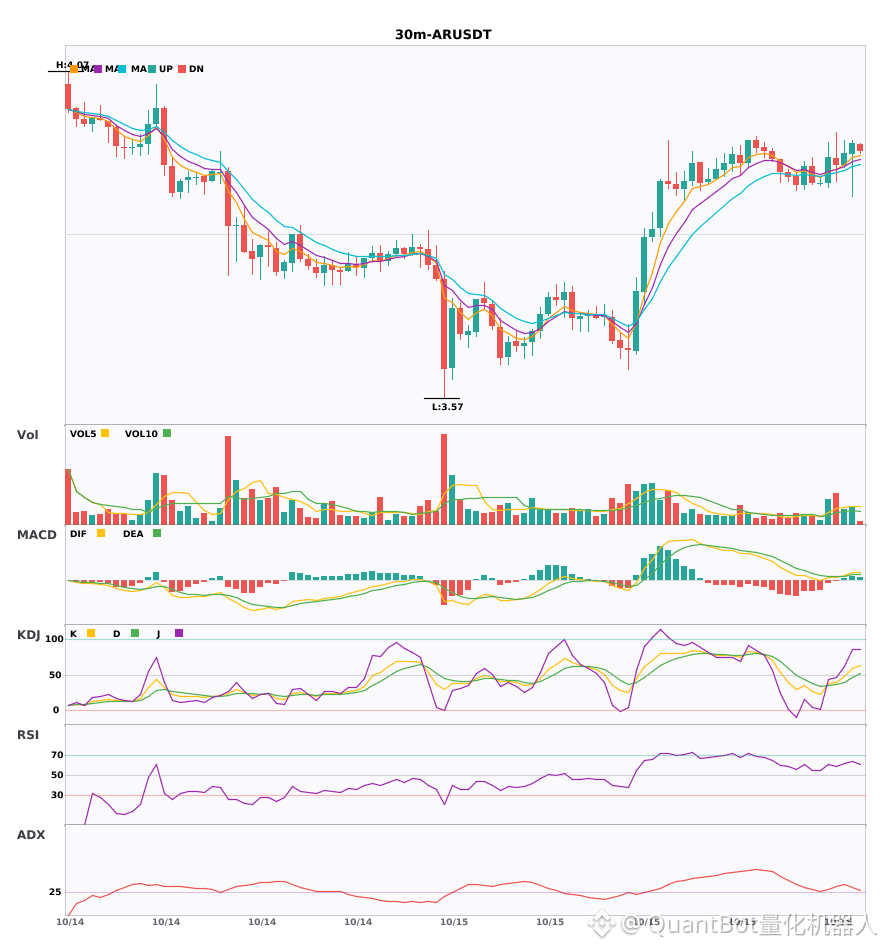
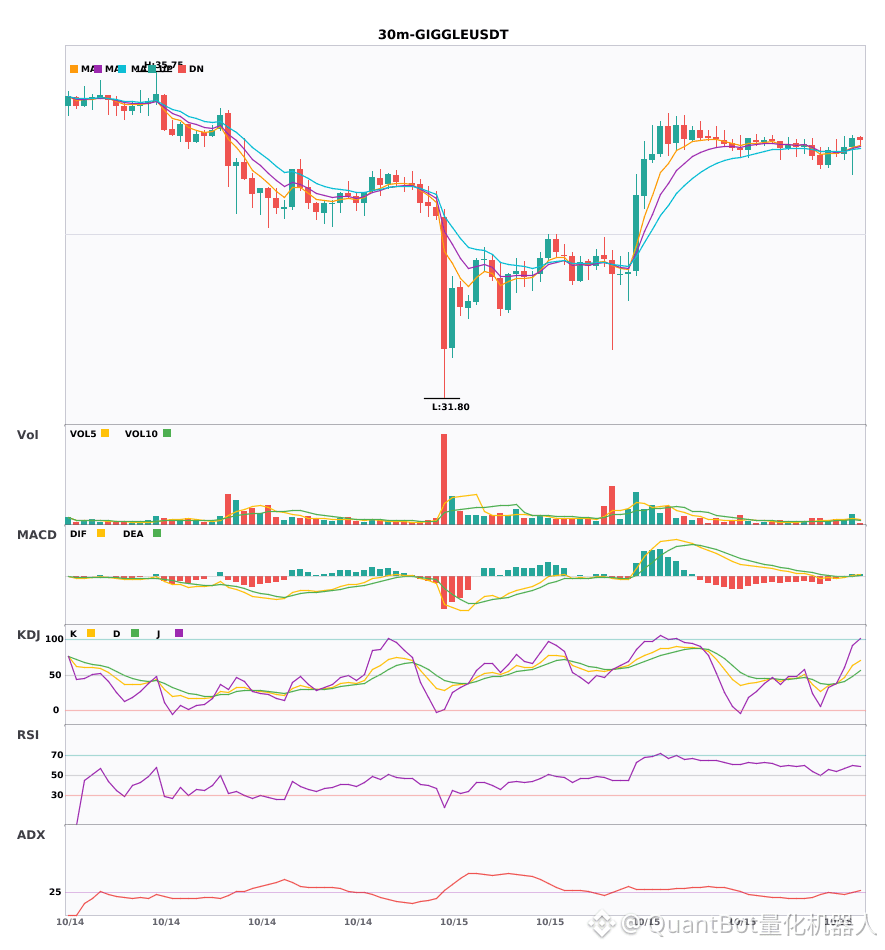
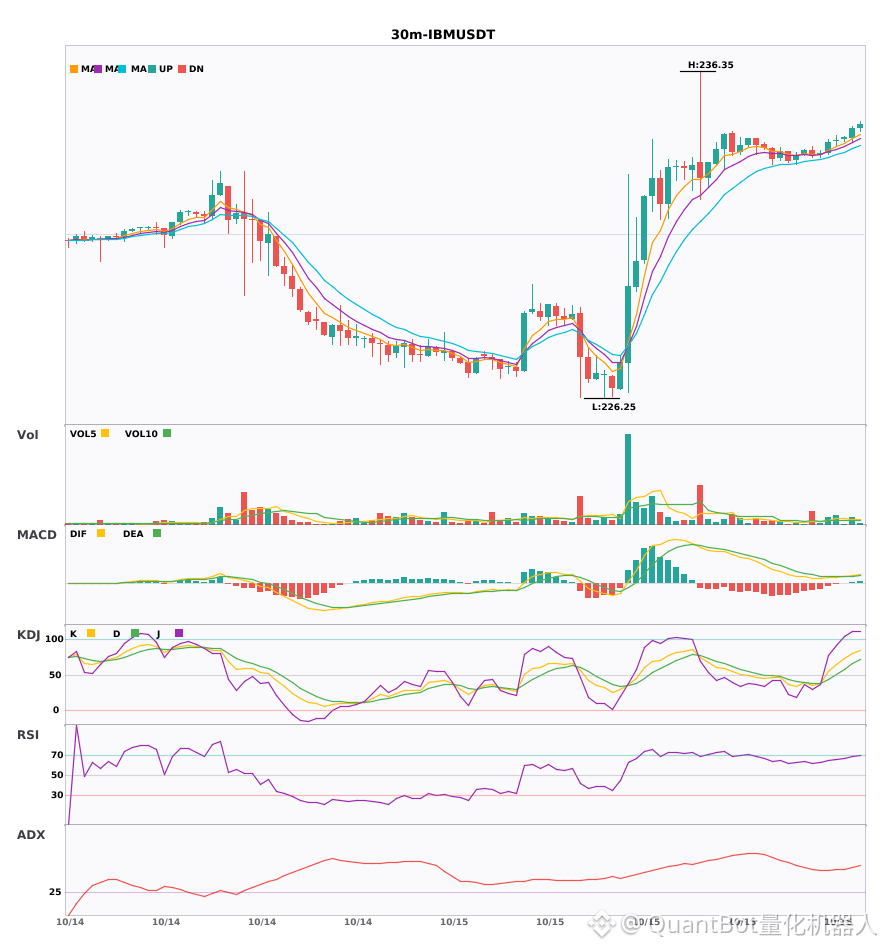
Three bullish signals on the 30-minute timeframe appeared simultaneously: $AR / $GIGGLE / $IBM
📈 $AR | 30-minute bullish signal
━━━━━━━━━━━━━━━━━━
Technical analysis: ADX(35) indicates a clear trending market | MACD bullish crossover above zero, bullish momentum is building | EMA5 > EMA8 > EMA13, bullish alignment | KDJ is moving weakly, with bears in control (K: 47.4, D: 40.0) | Volume surge (2.5x)
Price change: 0.4300%
📈 $GIGGLE | 30-minute bullish signal
━━━━━━━━━━━━━━━━━━
Technical analysis: ADX(30) indicates a trend is forming; entry may be considered | MACD bullish crossover above zero, bullish momentum is building | EMA5 crossed above EMA8, short-term outlook turns bullish | Volume increased (1.9x)
Price change: 0.3200%
📈 $IBM | 30-minute bullish signal
━━━━━━━━━━━━━━━━━━
Technical analysis: ADX(48) indicates a very strong trend (beware of a possible overbought pullback) | MACD bullish crossover above zero, bullish momentum is building | EMA5 > EMA8 > EMA13, bullish alignment | KDJ is moving strongly, with bulls in control (K: 73.6, D: 58.3) | Volume increased (2.1x)
Price change: 0.0300%
━━━━━━━━━━━━━━━━━━
#技术分析 #AR #GIGGLE #IBM
📌 The above content is for reference only and does not constitute investment advice
5

·
--
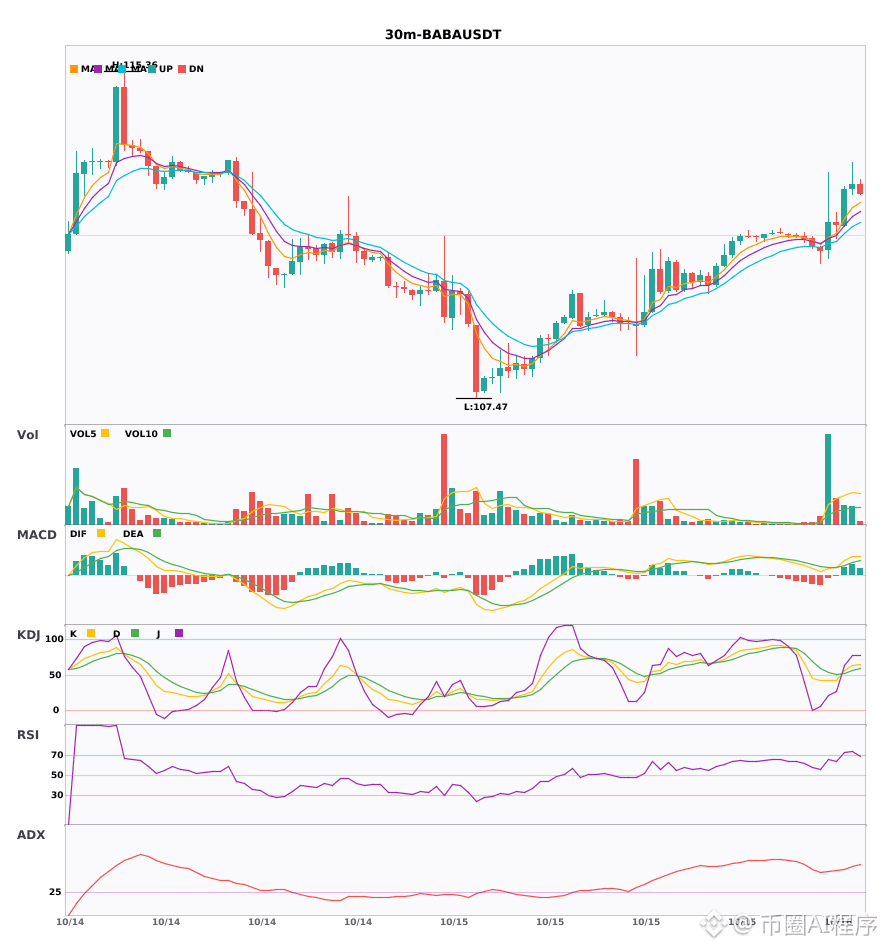
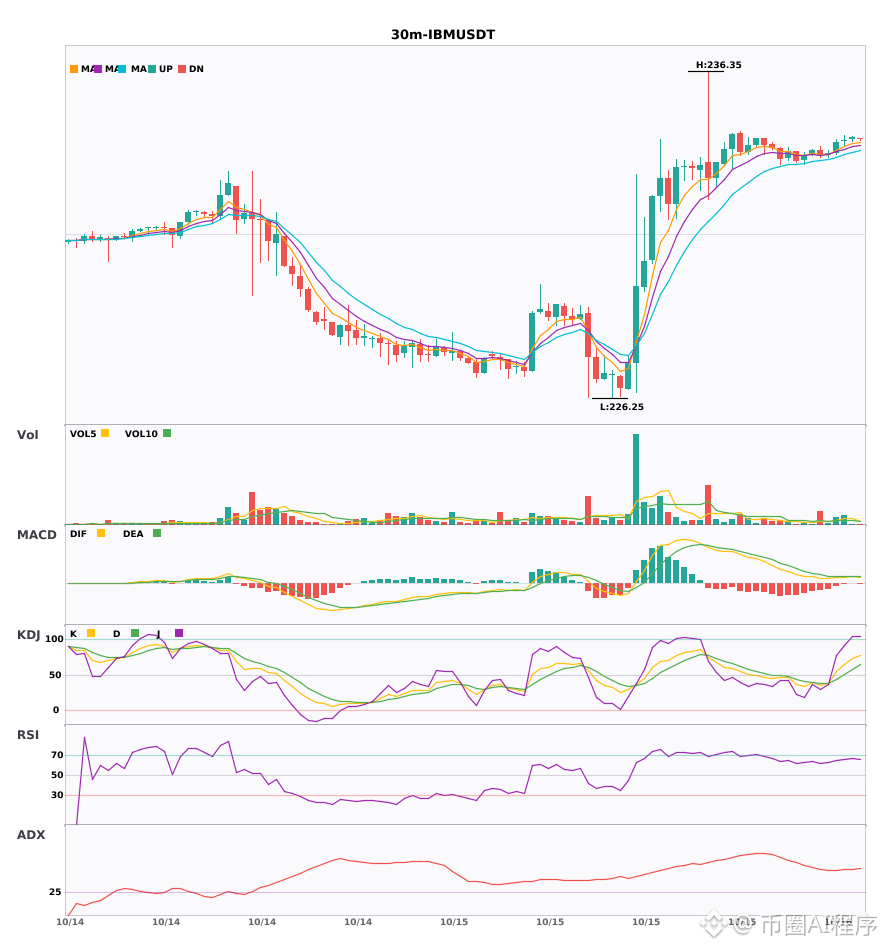
$BABA / $IBM 30-minute bullish + 4-hour bullish alignment, multi-timeframe confluence turns bullish 🔥
════════════════════
🔴 $BABA 30-minute bullish signal
⚠️Technical analysis: 4-hour bullish confluence confirmed | 30-minute entry: MACD golden cross above zero, bullish momentum emerging | EMA5 > EMA8 > EMA13 bullish alignment | KDJ golden cross, short-term bullish (K: 55.7, D: 52.0) | Volume increased (1.9x)
════════════════════
🔴 $IBM 30-minute bullish signal
⚠️Technical analysis: 4-hour bullish confluence confirmed | 30-minute entry: MACD golden cross above zero, bullish momentum emerging | EMA5 > EMA8 > EMA13 bullish alignment | KDJ showing strength, bulls in control (K: 73.6, D: 58.3) | Volume increased (2.1x)
════════════════════
🔔 Follow for real-time market updates 🔔
#多周期共振 #BABA #IBM
📌 When trading, pay attention to whether the candlestick pattern confirms the setup
════════════════════
🔴 $BABA 30-minute bullish signal
⚠️Technical analysis: 4-hour bullish confluence confirmed | 30-minute entry: MACD golden cross above zero, bullish momentum emerging | EMA5 > EMA8 > EMA13 bullish alignment | KDJ golden cross, short-term bullish (K: 55.7, D: 52.0) | Volume increased (1.9x)
════════════════════
🔴 $IBM 30-minute bullish signal
⚠️Technical analysis: 4-hour bullish confluence confirmed | 30-minute entry: MACD golden cross above zero, bullish momentum emerging | EMA5 > EMA8 > EMA13 bullish alignment | KDJ showing strength, bulls in control (K: 73.6, D: 58.3) | Volume increased (2.1x)
════════════════════
🔔 Follow for real-time market updates 🔔
#多周期共振 #BABA #IBM
📌 When trading, pay attention to whether the candlestick pattern confirms the setup
9
·
--
Bullish signal on the $IBM 4 hourly timeframe 🔥
════════════════════
🔴 $IBM 4-hour bullish signal
⚠️ Technical analysis: ADX(28): Trend is forming; consider participating | MACD golden cross above zero, bullish momentum released | EMA5 crossed above EMA8, short-term trend turned bullish | KDJ golden cross, short-term outlook bullish (K: 39.6, D: 34.7) | Volume surge (3.2x)
════════════════════
🔔 Follow for the latest market movements 🔔
#技术分析 #IBM
📌 When trading, pay attention to whether the candlestick pattern confirms the signal
════════════════════
🔴 $IBM 4-hour bullish signal
⚠️ Technical analysis: ADX(28): Trend is forming; consider participating | MACD golden cross above zero, bullish momentum released | EMA5 crossed above EMA8, short-term trend turned bullish | KDJ golden cross, short-term outlook bullish (K: 39.6, D: 34.7) | Volume surge (3.2x)
════════════════════
🔔 Follow for the latest market movements 🔔
#技术分析 #IBM
📌 When trading, pay attention to whether the candlestick pattern confirms the signal
11
·
--
$IBM 4-hour bullish signal + daily bullish trend confirmed; multi-timeframe confluence turns bullish 🔥
════════════════════
🔴 $IBM 4-hour bullish signal
⚠️ Technical analysis: Daily bullish confluence confirmed | 4-hour entry: MACD golden cross above zero, bullish momentum emerging | EMA5 crosses above EMA8, short-term outlook turns bullish | KDJ golden cross, short-term outlook bullish (K: 39.6, D: 34.7) | Volume surge (3.2x)
════════════════════
🔔 Follow for first-hand market movement alerts 🔔
#多周期共振 #IBM
📌 When trading, check whether the candlestick pattern meets the criteria
════════════════════
🔴 $IBM 4-hour bullish signal
⚠️ Technical analysis: Daily bullish confluence confirmed | 4-hour entry: MACD golden cross above zero, bullish momentum emerging | EMA5 crosses above EMA8, short-term outlook turns bullish | KDJ golden cross, short-term outlook bullish (K: 39.6, D: 34.7) | Volume surge (3.2x)
════════════════════
🔔 Follow for first-hand market movement alerts 🔔
#多周期共振 #IBM
📌 When trading, check whether the candlestick pattern meets the criteria
14

·
--
Bearish
IBM cleared $1.0249K in long liquidations at $228.77.
Longs are taking pressure, and I’m watching for any continuation lower.
$IBM
{future}(IBMUSDT)
$BSP
{future}(BSPUSDT)
$WAL
{future}(WALUSDT)
🔴 LIQUIDITY ZONE HIT 🔴
Long liquidation spotted 🧨
$1.0249K cleared at $228.77
Downside liquidity swept — watch reaction 👀
🎯 TP Targets:
TP1: ~$228.40
TP2: ~$228.00
TP3: ~$227.60
#ibm
IBM cleared $1.0249K in long liquidations at $228.77.
Longs are taking pressure, and I’m watching for any continuation lower.
$IBM
$BSP
$WAL
🔴 LIQUIDITY ZONE HIT 🔴
Long liquidation spotted 🧨
$1.0249K cleared at $228.77
Downside liquidity swept — watch reaction 👀
🎯 TP Targets:
TP1: ~$228.40
TP2: ~$228.00
TP3: ~$227.60
#ibm
Longs are taking pressure, and I’m watching for any continuation lower.
$IBM
$BSP
$WAL
🔴 LIQUIDITY ZONE HIT 🔴
Long liquidation spotted 🧨
$1.0249K cleared at $228.77
Downside liquidity swept — watch reaction 👀
🎯 TP Targets:
TP1: ~$228.40
TP2: ~$228.00
TP3: ~$227.60
#ibm
22

·
--
Bearish
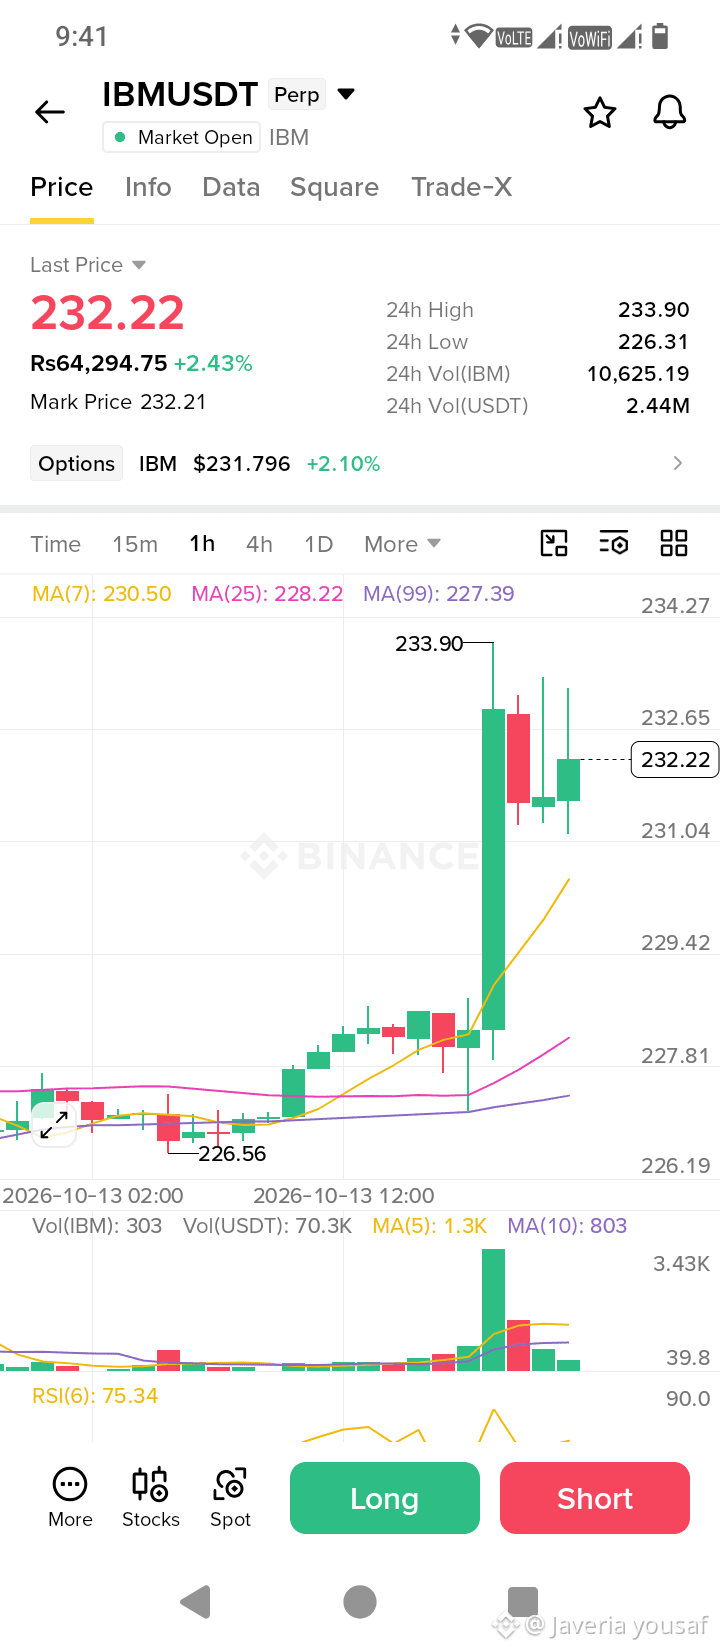
🚨 TRADE SIGNAL: $IBM / USDT 🔴
📊 Pair: IBMUSDT Perpetual
💰 Current Price: $232.23 (+2.48%)
📉 Action: SELL / SHORT
⚙️ Leverage: 10x
🎯 Entry: Around $232.23
✅ Take Profit: $230.15
🛑 Stop Loss: $239.92
⏳ Valid Until: 16 October 2026
⚠️ High leverage carries significant risk. Manage your position carefully and DYOR.
#IBM #TradingSignal #cryptotrading
{future}(IBMUSDT)
🚨 TRADE SIGNAL: $IBM / USDT 🔴
📊 Pair: IBMUSDT Perpetual
💰 Current Price: $232.23 (+2.48%)
📉 Action: SELL / SHORT
⚙️ Leverage: 10x
🎯 Entry: Around $232.23
✅ Take Profit: $230.15
🛑 Stop Loss: $239.92
⏳ Valid Until: 16 October 2026
⚠️ High leverage carries significant risk. Manage your position carefully and DYOR.
#IBM #TradingSignal #cryptotrading
45

·
--
Bullish
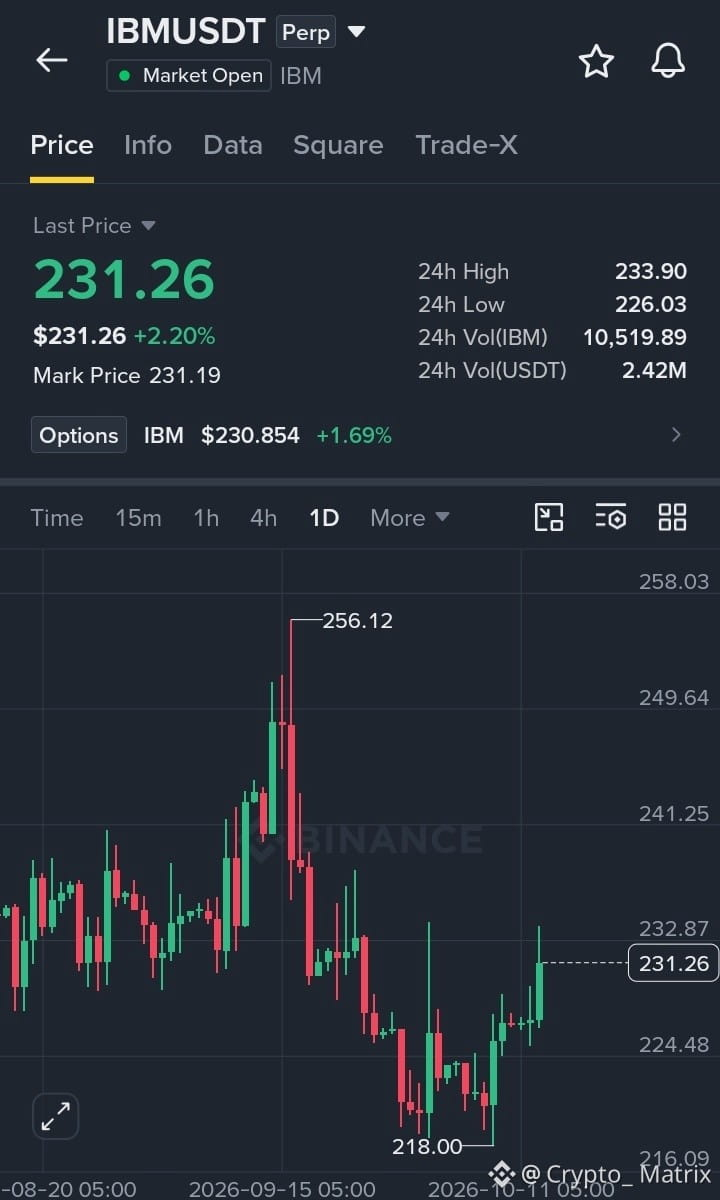
$IBM USDT Bulls Are Eyeing a Breakout! Price is pushing toward $233.90 resistance, and a clean breakout could trigger the next move toward $241.25 and $249.64. Buyers have momentum, but rejection could send price back toward support. Watch the breakout before entering.
Entry: $230.00–$231.30
TP1: $233.90
TP2: $241.25
TP3: $249.64
SL: $226.00
Buy and trade #IBM USDT
{future}(IBMUSDT)
$BAT
{spot}(BATUSDT)
$MAGMA
{future}(MAGMAUSDT)
$IBM USDT Bulls Are Eyeing a Breakout! Price is pushing toward $233.90 resistance, and a clean breakout could trigger the next move toward $241.25 and $249.64. Buyers have momentum, but rejection could send price back toward support. Watch the breakout before entering.
Entry: $230.00–$231.30
TP1: $233.90
TP2: $241.25
TP3: $249.64
SL: $226.00
Buy and trade #IBM USDT
$BAT
$MAGMA
Entry: $230.00–$231.30
TP1: $233.90
TP2: $241.25
TP3: $249.64
SL: $226.00
Buy and trade #IBM USDT
$BAT
$MAGMA
1
21

·
--
Bearish
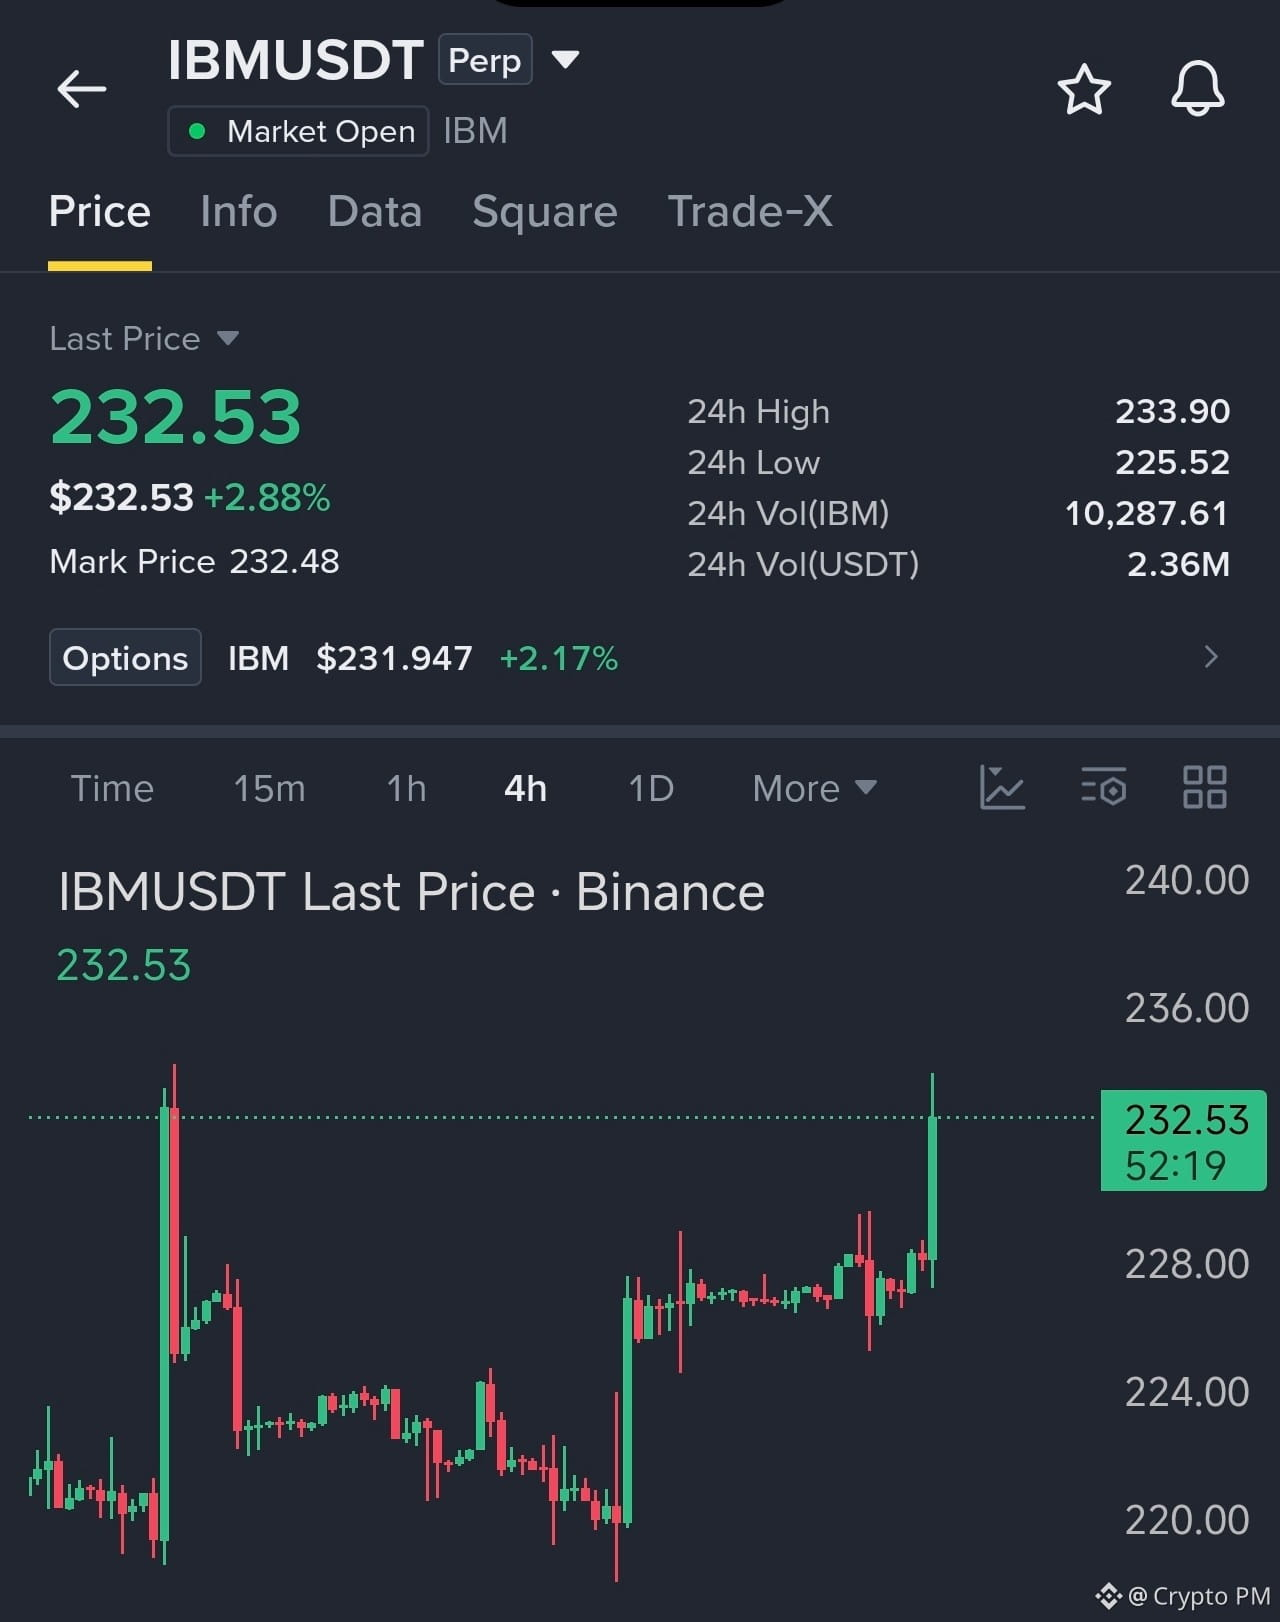
TRADE SIGNAL: $IBM
{future}(IBMUSDT)
Action: SELL / SHORT
Leverage: 10x
Entry Range: Current Price
Take Profit: 230.15
Stop Loss: 239.92
Expected Profit: +8%
Valid Until: 16 Oct '26
#IBM
TRADE SIGNAL: $IBM
Action: SELL / SHORT
Leverage: 10x
Entry Range: Current Price
Take Profit: 230.15
Stop Loss: 239.92
Expected Profit: +8%
Valid Until: 16 Oct '26
#IBM
Action: SELL / SHORT
Leverage: 10x
Entry Range: Current Price
Take Profit: 230.15
Stop Loss: 239.92
Expected Profit: +8%
Valid Until: 16 Oct '26
#IBM
1
10
1.1k
$IBM LONG
🔹Entry zone: 227.54
✅Take profit 1: 227.74037027 (+0.09%)
✅Take profit 2: 228.03074055 (+0.22%)
✅Take profit 3: 228.46629596 (+0.41%)
🛡Protection: 227.01444459 (-0.23%)
The potential growth scenario is oriented upward. The strategy involves reaching the targets sequentially: the first target listed, followed by the subsequent targets, while the specified trade boundary will limit risk.
⚠️ This is not financial advice. Trade at your own risk. DYOR.
#IBM #BTC #XRP 📈
$IBM
13
Log in to explore more content
Join global crypto users on Binance Square
⚡️ Get latest and useful information about crypto.
💬 Trusted by the world’s largest crypto exchange.
👍 Discover real insights from verified creators.
Email / Phone number
Trending Topics
1
#BinancePick
2.5M views
136,552 Discussing
2
#EarningsSeason
4.9M views
23,745 Discussing
3
#ElectrumWalletBugLetRogueServersStealFunds
724 views
73 Discussing
4
#ArgentineCourtDismissesLIBRACaseAgainstMilei
8,057 views
190 Discussing
5
#SKHynixReportedlyPlansSpecialDividendFromKioxiaStakeSale
1,918 views
27 Discussing
6
#KeystoneWebsiteBreachExposesBuyersShippingAddresses
897 views
15 Discussing
7
#USQ3GDPAndSeptemberPCEDueNextWeek
79,180 views
1,005 Discussing
8
#SouthKoreaDelaysCryptoIncomeTax
147,401 views
1,056 Discussing
9
#ElectrumFixesHighRiskExploitInVersionsBefore4.8.3
65,484 views
762 Discussing
10
#SouthKoreaPlansToRegulateStablecoinsUnderFXLaw
63,355 views
677 Discussing