
#arm
arm
94,934 views
616 Discussing
Hot
Latest

·
--
$KAT / $ARM / $CRDO 30 minutes and 4 hours at the same time flipping to short; multi-cycle resonance downward 🔥
════════════════════
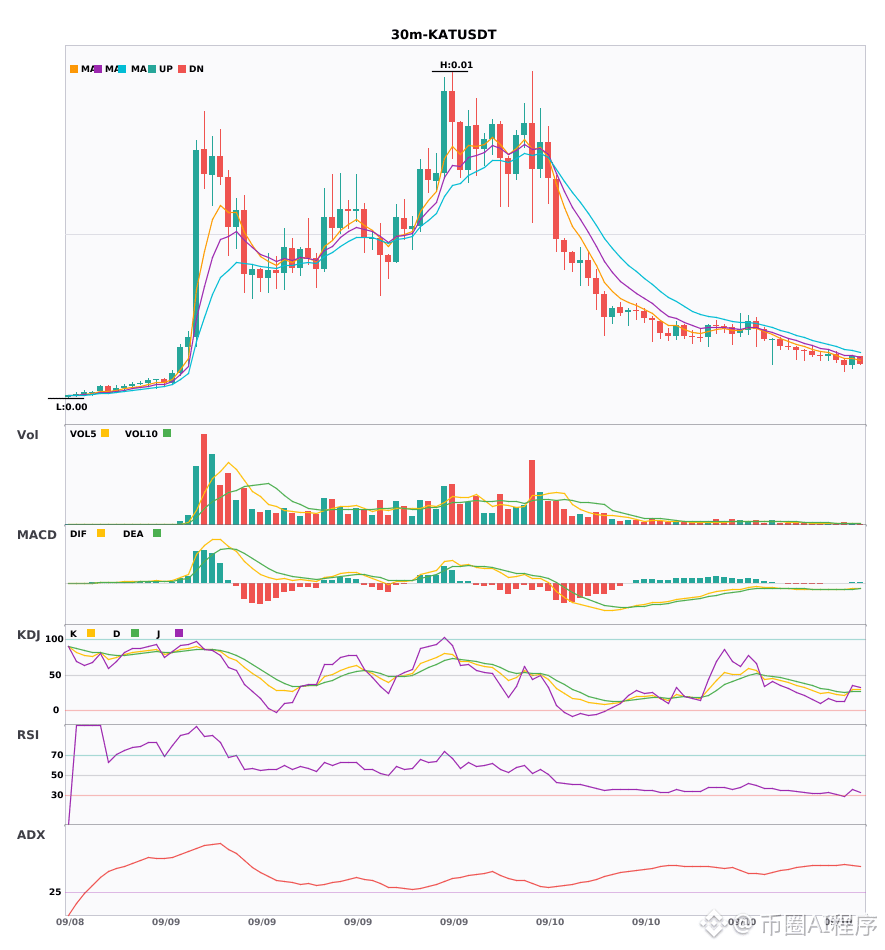
🟢 $KAT 30 minutes Bearish signal
⚠️ Technicals: 4-hour and 30-minute bearish resonance in the same direction! The 30-minute MACD is below the zero axis with a dead cross, and the green histogram is expanding—bearish momentum accelerating. EMA5<8<13 are arranged bearishly and trending downward. The KDJ K line at 20.9 is below the D line at 25.0, showing weakness, with volume at 1.4× in support.
════════════════════
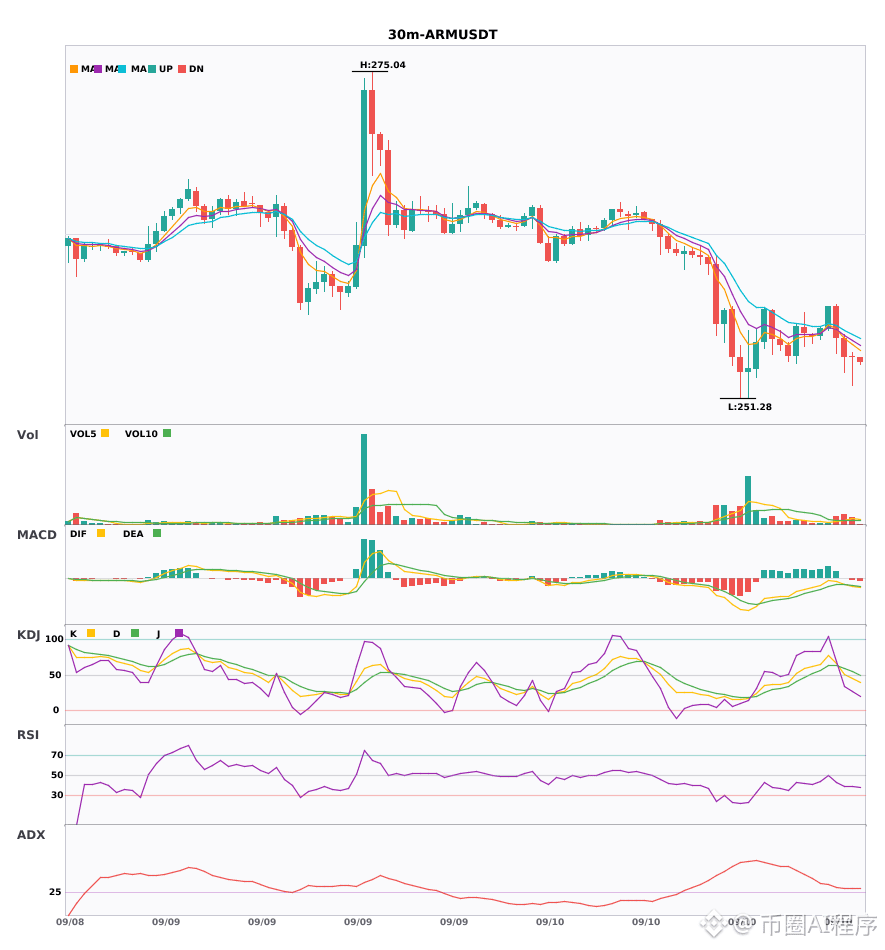
🟢 $ARM 30 minutes Bearish signal
⚠️ Technicals: 30-minute and 4-hour bearish resonance, same direction! The 30-minute MACD is below the zero axis with a dead cross, and the green histogram expands—bearish momentum accelerates. EMA5, 8, and 13 are arranged bearishly and diverging downward. Volume expands to 2.2×, and selling pressure is明显.
════════════════════
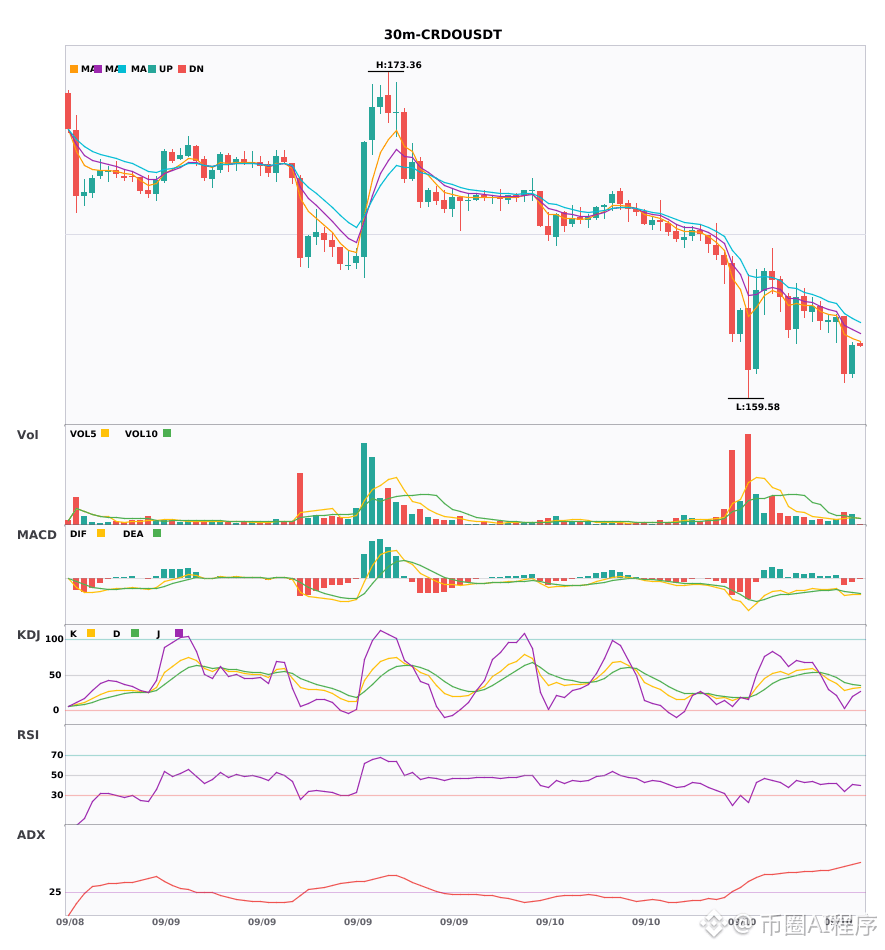
🟢 $CRDO 30 minutes Bearish signal
⚠️ Technicals: 4-hour is bearish, and the 30-minute also follows—two cycles are resonating. The 30-minute MACD is below the zero axis with a dead cross, and the bearish move is accelerating. EMA5, 8, and 13 are arranged bearishly and diverging downward. KDJ’s K value at 27.9 is below D at 40.1, trading weakly. Volume at 1.3× is normal.
════════════════════
🔔 Watch out for first-hand market fluctuations 🔔
#多周期共振 #KAT #ARM #CRDO
📌 When trading, be sure to check whether the candlestick patterns match
$KAT / $ARM / $CRDO 30 minutes and 4 hours at the same time flipping to short; multi-cycle resonance downward 🔥
════════════════════
🟢 $KAT 30 minutes Bearish signal
⚠️ Technicals: 4-hour and 30-minute bearish resonance in the same direction! The 30-minute MACD is below the zero axis with a dead cross, and the green histogram is expanding—bearish momentum accelerating. EMA5<8<13 are arranged bearishly and trending downward. The KDJ K line at 20.9 is below the D line at 25.0, showing weakness, with volume at 1.4× in support.
════════════════════
🟢 $ARM 30 minutes Bearish signal
⚠️ Technicals: 30-minute and 4-hour bearish resonance, same direction! The 30-minute MACD is below the zero axis with a dead cross, and the green histogram expands—bearish momentum accelerates. EMA5, 8, and 13 are arranged bearishly and diverging downward. Volume expands to 2.2×, and selling pressure is明显.
════════════════════
🟢 $CRDO 30 minutes Bearish signal
⚠️ Technicals: 4-hour is bearish, and the 30-minute also follows—two cycles are resonating. The 30-minute MACD is below the zero axis with a dead cross, and the bearish move is accelerating. EMA5, 8, and 13 are arranged bearishly and diverging downward. KDJ’s K value at 27.9 is below D at 40.1, trading weakly. Volume at 1.3× is normal.
════════════════════
🔔 Watch out for first-hand market fluctuations 🔔
#多周期共振 #KAT #ARM #CRDO
📌 When trading, be sure to check whether the candlestick patterns match
════════════════════
🟢 $KAT 30 minutes Bearish signal
⚠️ Technicals: 4-hour and 30-minute bearish resonance in the same direction! The 30-minute MACD is below the zero axis with a dead cross, and the green histogram is expanding—bearish momentum accelerating. EMA5<8<13 are arranged bearishly and trending downward. The KDJ K line at 20.9 is below the D line at 25.0, showing weakness, with volume at 1.4× in support.
════════════════════
🟢 $ARM 30 minutes Bearish signal
⚠️ Technicals: 30-minute and 4-hour bearish resonance, same direction! The 30-minute MACD is below the zero axis with a dead cross, and the green histogram expands—bearish momentum accelerates. EMA5, 8, and 13 are arranged bearishly and diverging downward. Volume expands to 2.2×, and selling pressure is明显.
════════════════════
🟢 $CRDO 30 minutes Bearish signal
⚠️ Technicals: 4-hour is bearish, and the 30-minute also follows—two cycles are resonating. The 30-minute MACD is below the zero axis with a dead cross, and the bearish move is accelerating. EMA5, 8, and 13 are arranged bearishly and diverging downward. KDJ’s K value at 27.9 is below D at 40.1, trading weakly. Volume at 1.3× is normal.
════════════════════
🔔 Watch out for first-hand market fluctuations 🔔
#多周期共振 #KAT #ARM #CRDO
📌 When trading, be sure to check whether the candlestick patterns match
22

·
--
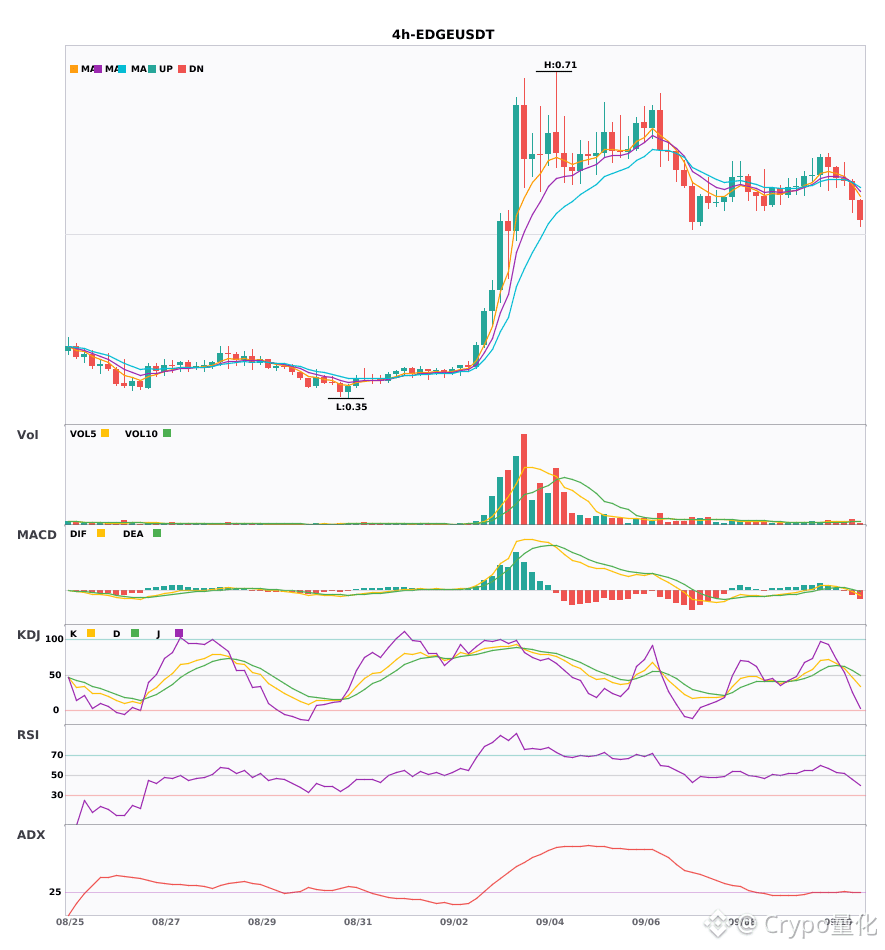
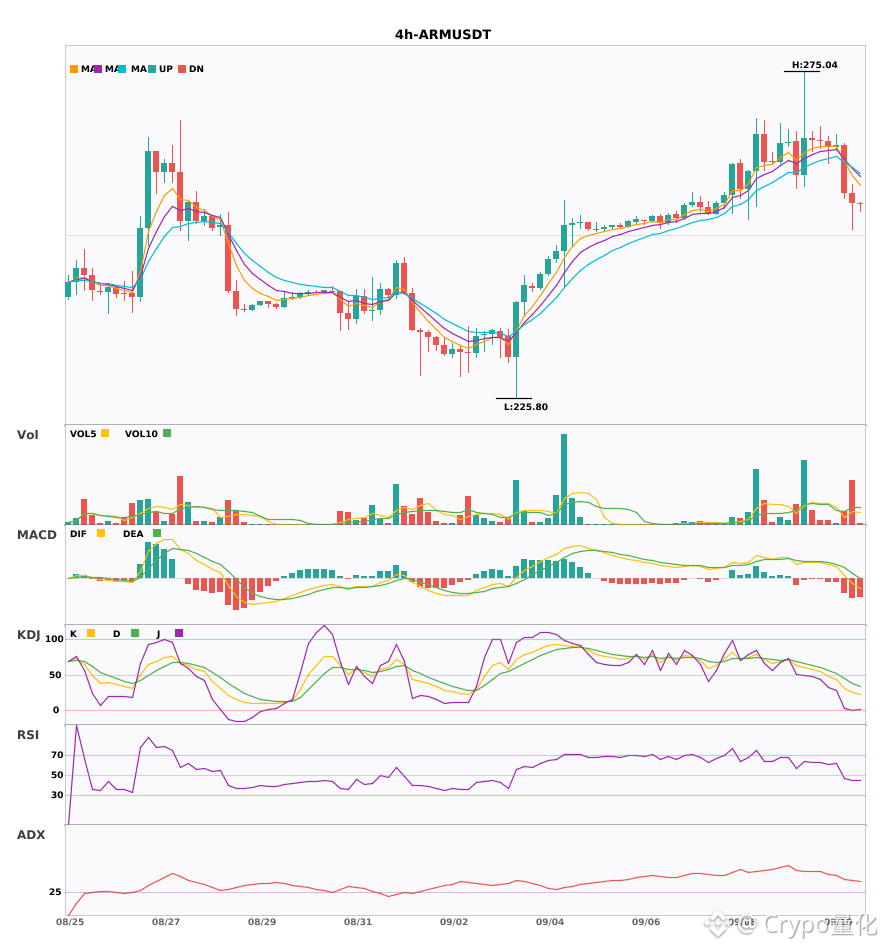
3 four-hour short-selling alerts: $XAG, $EDGE, $ARM — the moving averages have just turned downward 🔥
════════════════════
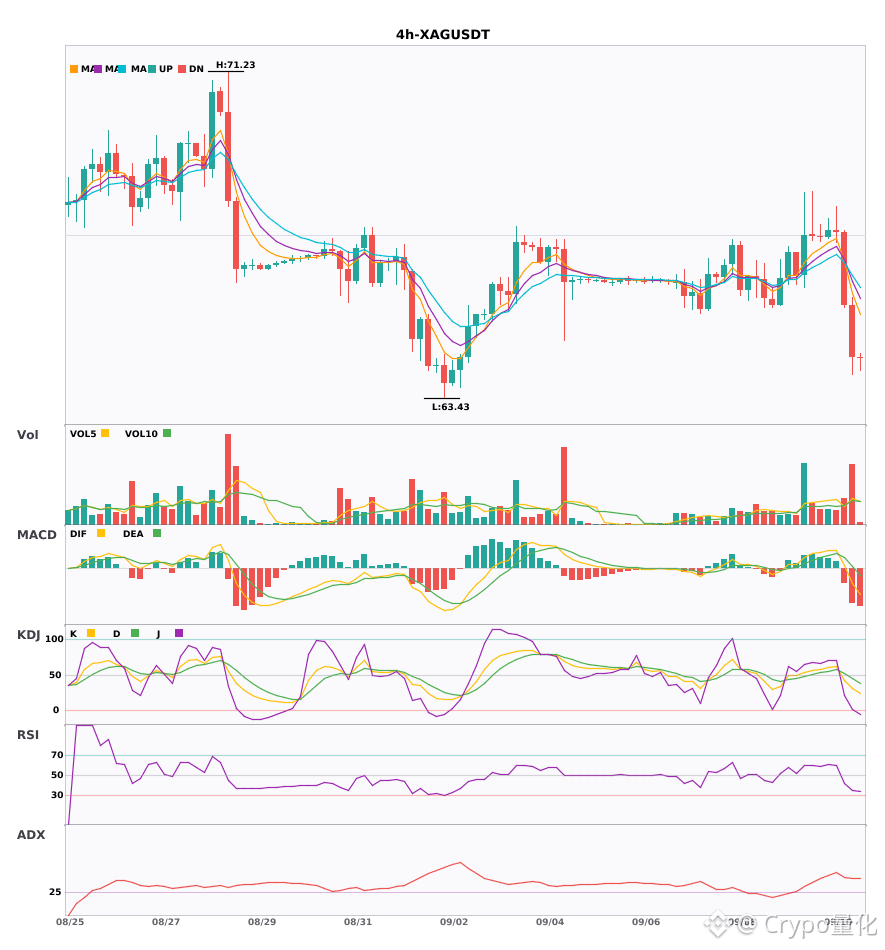
🟢 $XAG 4-hour short signal
⚠️ Technicals: ADX 45— the trend is strong and solid. The MACD DIF has already fallen below the zero line and the direction turns bearish; EMA5, 8, and 13 are in a bearish arrangement, spreading downward; KDJ’s K (30.9) is below D (45.2), showing weakness. Trading volume has also expanded by 2.4x, and the bears are in control.
════════════════════
🟢 $EDGE 4-hour short signal
⚠️ Technicals: ADX 26— the trend is forming. You may consider entering|MACD’s DIF has fallen below the zero line and turned bearish|EMA5 has crossed below EMA8, and the short-term is weak|Trading volume has increased to 1.8x
════════════════════
🟢 $ARM 4-hour short signal
⚠️ Technicals: ADX 38— the trend is very strong | The MACD fast line has dropped below the zero line and turned bearish | The moving averages (5, 8, 13) are in a bearish alignment and spreading downward | KDJ’s K is below D (26.1 vs 38.8)—the bears are speaking | Trading volume is up 2.5x
════════════════════
🔔 Follow to get the first-hand market volatility updates 🔔
#技术分析 #XAG #EDGE #ARM
📌 When trading, pay attention to whether the candlestick patterns match
3 four-hour short-selling alerts: $XAG , $EDGE , $ARM — the moving averages have just turned downward 🔥
════════════════════
🟢 $XAG 4-hour short signal
⚠️ Technicals: ADX 45— the trend is strong and solid. The MACD DIF has already fallen below the zero line and the direction turns bearish; EMA5, 8, and 13 are in a bearish arrangement, spreading downward; KDJ’s K (30.9) is below D (45.2), showing weakness. Trading volume has also expanded by 2.4x, and the bears are in control.
════════════════════
🟢 $EDGE 4-hour short signal
⚠️ Technicals: ADX 26— the trend is forming. You may consider entering|MACD’s DIF has fallen below the zero line and turned bearish|EMA5 has crossed below EMA8, and the short-term is weak|Trading volume has increased to 1.8x
════════════════════
🟢 $ARM 4-hour short signal
⚠️ Technicals: ADX 38— the trend is very strong | The MACD fast line has dropped below the zero line and turned bearish | The moving averages (5, 8, 13) are in a bearish alignment and spreading downward | KDJ’s K is below D (26.1 vs 38.8)—the bears are speaking | Trading volume is up 2.5x
════════════════════
🔔 Follow to get the first-hand market volatility updates 🔔
#技术分析 #XAG #EDGE #ARM
📌 When trading, pay attention to whether the candlestick patterns match
════════════════════
🟢 $XAG 4-hour short signal
⚠️ Technicals: ADX 45— the trend is strong and solid. The MACD DIF has already fallen below the zero line and the direction turns bearish; EMA5, 8, and 13 are in a bearish arrangement, spreading downward; KDJ’s K (30.9) is below D (45.2), showing weakness. Trading volume has also expanded by 2.4x, and the bears are in control.
════════════════════
🟢 $EDGE 4-hour short signal
⚠️ Technicals: ADX 26— the trend is forming. You may consider entering|MACD’s DIF has fallen below the zero line and turned bearish|EMA5 has crossed below EMA8, and the short-term is weak|Trading volume has increased to 1.8x
════════════════════
🟢 $ARM 4-hour short signal
⚠️ Technicals: ADX 38— the trend is very strong | The MACD fast line has dropped below the zero line and turned bearish | The moving averages (5, 8, 13) are in a bearish alignment and spreading downward | KDJ’s K is below D (26.1 vs 38.8)—the bears are speaking | Trading volume is up 2.5x
════════════════════
🔔 Follow to get the first-hand market volatility updates 🔔
#技术分析 #XAG #EDGE #ARM
📌 When trading, pay attention to whether the candlestick patterns match
87

·
--
$ARM’s current price is 269.27; over the past 24 hours it’s up 3.66%, with trading volume of about $31.72 million. From the perspective of “the Trump trade,” the key point in this data isn’t the move higher itself, but that the funding rate is staying at zero.
A zero funding rate means that, at this moment, longs and shorts are not paying each other any fees. When prices rise, it’s usually accompanied by long crowding, and the funding rate tends to be positive. But $ARM has skipped that phase. The market isn’t adding any sentiment premium to its pricing—or, in other words, the capital currently involved hasn’t yet formed a crowd consensus that would need to be balanced through funding.
My take is that this reflects a particular stage of the Trump trade as mapped from on-chain activity to U.S.-stock proxies: ideas first, but the positioning structure isn’t yet euphoric. Traders may be pre-positioning for the potential impact of Trump’s policies on technology and manufacturing. As a leading semiconductor design name, $ARM naturally gets pulled into the narrative. Yet with both open interest at 30,310 contracts and the funding rate staying at zero alongside the price rising, it suggests this isn’t a FOMO-style chase. It looks more like deliberate position building. The funds aren’t paying extra costs to maintain direction, and the base for the rise is relatively “clean.”
The counterargument is straightforward: if market expectations for Trump’s specific industry policies cool off, or if the semiconductor sector faces independent negative news, this positioning structure lacking a “sentiment cushion” could loosen easily. A zero funding rate also means longs have no safety net from collecting funding—leaving them fully exposed to price volatility.
The second-order effect is that, if price continues higher while the funding rate never turns positive, it may suppress follow-on long chasing momentum. Trend-following funds will hesitate because they don’t see crowded counterparty positioning that would validate the strength of the trend. Conversely, once profits start to be taken, with no funding-rate “stickiness” buffer, the pullback could happen quickly.
Invalidation conditions are clear: if price turns down and the funding rate simultaneously flips negative, it would indicate shorts are gaining traction and the current rational pricing logic has been broken. Another invalidation condition is that when price pulls back, trading volume expands significantly, showing large capital is exiting.
In terms of execution, I would hold a long position based on expectations for Trump’s policies, but I’ll set a strict stop-loss just below the recent consolidation platform. If the price retraces to that level, regardless of the funding rate, I will exit and observe first.
Aggressive scenario: if the price holds above 270 and trading volume increases moderately, then you can hold and wait for the next leg higher.
Trading tag: #TradFi #链上美股 #ARM
Where do you think this thesis is most likely to be wrong?
$ARM ’s current price is 269.27; over the past 24 hours it’s up 3.66%, with trading volume of about $31.72 million. From the perspective of “the Trump trade,” the key point in this data isn’t the move higher itself, but that the funding rate is staying at zero.
A zero funding rate means that, at this moment, longs and shorts are not paying each other any fees. When prices rise, it’s usually accompanied by long crowding, and the funding rate tends to be positive. But $ARM has skipped that phase. The market isn’t adding any sentiment premium to its pricing—or, in other words, the capital currently involved hasn’t yet formed a crowd consensus that would need to be balanced through funding.
My take is that this reflects a particular stage of the Trump trade as mapped from on-chain activity to U.S.-stock proxies: ideas first, but the positioning structure isn’t yet euphoric. Traders may be pre-positioning for the potential impact of Trump’s policies on technology and manufacturing. As a leading semiconductor design name, $ARM naturally gets pulled into the narrative. Yet with both open interest at 30,310 contracts and the funding rate staying at zero alongside the price rising, it suggests this isn’t a FOMO-style chase. It looks more like deliberate position building. The funds aren’t paying extra costs to maintain direction, and the base for the rise is relatively “clean.”
The counterargument is straightforward: if market expectations for Trump’s specific industry policies cool off, or if the semiconductor sector faces independent negative news, this positioning structure lacking a “sentiment cushion” could loosen easily. A zero funding rate also means longs have no safety net from collecting funding—leaving them fully exposed to price volatility.
The second-order effect is that, if price continues higher while the funding rate never turns positive, it may suppress follow-on long chasing momentum. Trend-following funds will hesitate because they don’t see crowded counterparty positioning that would validate the strength of the trend. Conversely, once profits start to be taken, with no funding-rate “stickiness” buffer, the pullback could happen quickly.
Invalidation conditions are clear: if price turns down and the funding rate simultaneously flips negative, it would indicate shorts are gaining traction and the current rational pricing logic has been broken. Another invalidation condition is that when price pulls back, trading volume expands significantly, showing large capital is exiting.
In terms of execution, I would hold a long position based on expectations for Trump’s policies, but I’ll set a strict stop-loss just below the recent consolidation platform. If the price retraces to that level, regardless of the funding rate, I will exit and observe first.
Aggressive scenario: if the price holds above 270 and trading volume increases moderately, then you can hold and wait for the next leg higher.
Trading tag: #TradFi #链上美股 #ARM
Where do you think this thesis is most likely to be wrong?
A zero funding rate means that, at this moment, longs and shorts are not paying each other any fees. When prices rise, it’s usually accompanied by long crowding, and the funding rate tends to be positive. But $ARM has skipped that phase. The market isn’t adding any sentiment premium to its pricing—or, in other words, the capital currently involved hasn’t yet formed a crowd consensus that would need to be balanced through funding.
My take is that this reflects a particular stage of the Trump trade as mapped from on-chain activity to U.S.-stock proxies: ideas first, but the positioning structure isn’t yet euphoric. Traders may be pre-positioning for the potential impact of Trump’s policies on technology and manufacturing. As a leading semiconductor design name, $ARM naturally gets pulled into the narrative. Yet with both open interest at 30,310 contracts and the funding rate staying at zero alongside the price rising, it suggests this isn’t a FOMO-style chase. It looks more like deliberate position building. The funds aren’t paying extra costs to maintain direction, and the base for the rise is relatively “clean.”
The counterargument is straightforward: if market expectations for Trump’s specific industry policies cool off, or if the semiconductor sector faces independent negative news, this positioning structure lacking a “sentiment cushion” could loosen easily. A zero funding rate also means longs have no safety net from collecting funding—leaving them fully exposed to price volatility.
The second-order effect is that, if price continues higher while the funding rate never turns positive, it may suppress follow-on long chasing momentum. Trend-following funds will hesitate because they don’t see crowded counterparty positioning that would validate the strength of the trend. Conversely, once profits start to be taken, with no funding-rate “stickiness” buffer, the pullback could happen quickly.
Invalidation conditions are clear: if price turns down and the funding rate simultaneously flips negative, it would indicate shorts are gaining traction and the current rational pricing logic has been broken. Another invalidation condition is that when price pulls back, trading volume expands significantly, showing large capital is exiting.
In terms of execution, I would hold a long position based on expectations for Trump’s policies, but I’ll set a strict stop-loss just below the recent consolidation platform. If the price retraces to that level, regardless of the funding rate, I will exit and observe first.
Aggressive scenario: if the price holds above 270 and trading volume increases moderately, then you can hold and wait for the next leg higher.
Trading tag: #TradFi #链上美股 #ARM
Where do you think this thesis is most likely to be wrong?
16

🚀 $ARM SURGES BEYOND KEY RESISTANCE – BULLISH MOMENTUM RISING! 📈
Entry: 261.96‑263.54 ⚡
Target: 266.24 🚀
Target: 268.56 🚀
Target: 271.47 🚀
Stop Loss: 258.68 ⚠️
The price is ripping through the EMA‑aligned demand zone, confirming a smart‑money accumulation pattern. 📊 The break above recent resistance is reinforced by a bullish RSI divergence, signaling fresh buying pressure.
Liquidity pools sit just above the 266‑271 band; each upward thrust will likely consume pending sell orders, feeding the climb toward the listed targets. 🦈 Watch volume spikes for the next order‑block retest that could lock in the swing.
💬 Do you see the next liquidity sweep primed to push $ARM past 270? 👇
⚠️ Not financial advice. Always manage your risk. 🛡️
🏷️ #ARM #LongSetup #EMA #Breakout #Crypto
🔥 💎
🚀 $ARM SURGES BEYOND KEY RESISTANCE – BULLISH MOMENTUM RISING! 📈
Entry: 261.96‑263.54 ⚡
Target: 266.24 🚀
Target: 268.56 🚀
Target: 271.47 🚀
Stop Loss: 258.68 ⚠️
The price is ripping through the EMA‑aligned demand zone, confirming a smart‑money accumulation pattern. 📊 The break above recent resistance is reinforced by a bullish RSI divergence, signaling fresh buying pressure.
Liquidity pools sit just above the 266‑271 band; each upward thrust will likely consume pending sell orders, feeding the climb toward the listed targets. 🦈 Watch volume spikes for the next order‑block retest that could lock in the swing.
💬 Do you see the next liquidity sweep primed to push $ARM past 270? 👇
⚠️ Not financial advice. Always manage your risk. 🛡️
🏷️ #ARM #LongSetup #EMA #Breakout #Crypto
🔥 💎
Entry: 261.96‑263.54 ⚡
Target: 266.24 🚀
Target: 268.56 🚀
Target: 271.47 🚀
Stop Loss: 258.68 ⚠️
The price is ripping through the EMA‑aligned demand zone, confirming a smart‑money accumulation pattern. 📊 The break above recent resistance is reinforced by a bullish RSI divergence, signaling fresh buying pressure.
Liquidity pools sit just above the 266‑271 band; each upward thrust will likely consume pending sell orders, feeding the climb toward the listed targets. 🦈 Watch volume spikes for the next order‑block retest that could lock in the swing.
💬 Do you see the next liquidity sweep primed to push $ARM past 270? 👇
⚠️ Not financial advice. Always manage your risk. 🛡️
🏷️ #ARM #LongSetup #EMA #Breakout #Crypto
🔥 💎

63

🚀 $ARM SURGES INTO BULLISH ZONE – READY TO ROCKET! 📈
Entry: 261.96‑263.54 ⚡
Target: 266.24‑271.47 🚀
Stop Loss: 258.68 ⚠️
The EMA stack is screaming bullish, carving a clean path above the recent resistance. 📊 RSI is locked in the upper zone, confirming the momentum surge.
With price holding the entry corridor, smart money is likely loading liquidity for a push toward the 266‑271 cluster. 🌊 Volume spikes on the 4H are feeding the engine, and each tick above the block adds fire to the rally. ⚡
💬 Are you ready to ride this wave or waiting for the next liquidity sweep? 👇
⚠️ Not financial advice. Always manage your risk. 🛡️
🏷️ #ARM #LongSetup #Breakout #Crypto
🔥 💎
🚀 $ARM SURGES INTO BULLISH ZONE – READY TO ROCKET! 📈
Entry: 261.96‑263.54 ⚡
Target: 266.24‑271.47 🚀
Stop Loss: 258.68 ⚠️
The EMA stack is screaming bullish, carving a clean path above the recent resistance. 📊 RSI is locked in the upper zone, confirming the momentum surge.
With price holding the entry corridor, smart money is likely loading liquidity for a push toward the 266‑271 cluster. 🌊 Volume spikes on the 4H are feeding the engine, and each tick above the block adds fire to the rally. ⚡
💬 Are you ready to ride this wave or waiting for the next liquidity sweep? 👇
⚠️ Not financial advice. Always manage your risk. 🛡️
🏷️ #ARM #LongSetup #Breakout #Crypto
🔥 💎
Entry: 261.96‑263.54 ⚡
Target: 266.24‑271.47 🚀
Stop Loss: 258.68 ⚠️
The EMA stack is screaming bullish, carving a clean path above the recent resistance. 📊 RSI is locked in the upper zone, confirming the momentum surge.
With price holding the entry corridor, smart money is likely loading liquidity for a push toward the 266‑271 cluster. 🌊 Volume spikes on the 4H are feeding the engine, and each tick above the block adds fire to the rally. ⚡
💬 Are you ready to ride this wave or waiting for the next liquidity sweep? 👇
⚠️ Not financial advice. Always manage your risk. 🛡️
🏷️ #ARM #LongSetup #Breakout #Crypto
🔥 💎

45

·
--
$ARM funding rate goes to zero—no one pays either side. Over the past 24 hours it’s up 2.3% to 259.64, with open positions staying steady at around 36,000 contracts.
This doesn’t look like a directional market. A funding rate of 0 within the contracts is rare, which suggests both longs and shorts are waiting—nobody wants to be first to pay the opposing side. The market is waiting, waiting for Trump’s policy to be implemented and for the real impact it will have on U.S. stocks in the semiconductor sector. Either the good news is fully priced and then stocks break down, or it exceeds expectations and pushes tech stocks to surge again. $ARM, as a leading chip designer, can’t escape being pulled in on either side.
In the trading room right now, no one dares to make a big bet. Open interest hasn’t expanded; the price is inching forward—classic sideways action during a policy vacuum. Anti-consensus view: the market thinks Trump’s crackdown on tech is a negative, but what if, for votes, he instead gives semiconductors a green light with subsidies? Then the shorts could get instantly squeezed.
Second-order effect: there are too many hunters waiting for news, and once the policy lands, regardless of direction, implied volatility will spike immediately. The funding rate 0 state won’t last more than a few days.
Invalidation conditions: if the price breaks below 240, or if Trump explicitly names and limits chip exports, then the bullish thesis should be re-evaluated. For now, we just wait. Either wait for the policy news and see the price react within 15 minutes, or wait for the funding rate to flip back positive and bring back bullish sentiment. Don’t mess around in the middle zone.
Trading tag: #TradFi #链上美股 #ARM
Where do you think this setup is most likely to be wrong?
$ARM funding rate goes to zero—no one pays either side. Over the past 24 hours it’s up 2.3% to 259.64, with open positions staying steady at around 36,000 contracts.
This doesn’t look like a directional market. A funding rate of 0 within the contracts is rare, which suggests both longs and shorts are waiting—nobody wants to be first to pay the opposing side. The market is waiting, waiting for Trump’s policy to be implemented and for the real impact it will have on U.S. stocks in the semiconductor sector. Either the good news is fully priced and then stocks break down, or it exceeds expectations and pushes tech stocks to surge again. $ARM , as a leading chip designer, can’t escape being pulled in on either side.
In the trading room right now, no one dares to make a big bet. Open interest hasn’t expanded; the price is inching forward—classic sideways action during a policy vacuum. Anti-consensus view: the market thinks Trump’s crackdown on tech is a negative, but what if, for votes, he instead gives semiconductors a green light with subsidies? Then the shorts could get instantly squeezed.
Second-order effect: there are too many hunters waiting for news, and once the policy lands, regardless of direction, implied volatility will spike immediately. The funding rate 0 state won’t last more than a few days.
Invalidation conditions: if the price breaks below 240, or if Trump explicitly names and limits chip exports, then the bullish thesis should be re-evaluated. For now, we just wait. Either wait for the policy news and see the price react within 15 minutes, or wait for the funding rate to flip back positive and bring back bullish sentiment. Don’t mess around in the middle zone.
Trading tag: #TradFi #链上美股 #ARM
Where do you think this setup is most likely to be wrong?
This doesn’t look like a directional market. A funding rate of 0 within the contracts is rare, which suggests both longs and shorts are waiting—nobody wants to be first to pay the opposing side. The market is waiting, waiting for Trump’s policy to be implemented and for the real impact it will have on U.S. stocks in the semiconductor sector. Either the good news is fully priced and then stocks break down, or it exceeds expectations and pushes tech stocks to surge again. $ARM , as a leading chip designer, can’t escape being pulled in on either side.
In the trading room right now, no one dares to make a big bet. Open interest hasn’t expanded; the price is inching forward—classic sideways action during a policy vacuum. Anti-consensus view: the market thinks Trump’s crackdown on tech is a negative, but what if, for votes, he instead gives semiconductors a green light with subsidies? Then the shorts could get instantly squeezed.
Second-order effect: there are too many hunters waiting for news, and once the policy lands, regardless of direction, implied volatility will spike immediately. The funding rate 0 state won’t last more than a few days.
Invalidation conditions: if the price breaks below 240, or if Trump explicitly names and limits chip exports, then the bullish thesis should be re-evaluated. For now, we just wait. Either wait for the policy news and see the price react within 15 minutes, or wait for the funding rate to flip back positive and bring back bullish sentiment. Don’t mess around in the middle zone.
Trading tag: #TradFi #链上美股 #ARM
Where do you think this setup is most likely to be wrong?
24
·
--
ARM up 2.305% in 24 hours, price at 259.64, but the funding rate is 0. A momentum mover with the funding rate staying perfectly flat is not very common.
Mechanism explained: a funding rate of zero means long and short sides are roughly balanced at this moment—bullish sentiment isn’t clearly overpowering bearish sentiment despite the price rise. Against the backdrop of Trump’s trading, market expectations for traditional tech stocks are highly split. Some capital bets on policy tailwinds may flow into hard tech like semiconductors, while other capital may be hedging against uncertainty. This split sentiment is directly reflected in the funding rate, keeping it pinned at the zero line.
This is usually calm before the storm. While the price is moving, the longs’ cost basis hasn’t been pushed higher, suggesting that the newly added bullish force isn’t decisive enough—or that shorts have continued resistance around 260. If the price keeps rising but the funding rate still can’t turn positive, early long positions may take profit early because there’s no positive funding subsidy, and the rally structure will become fragile.
The strongest counterargument is: as a key AI compute infrastructure name, ARM’s value logic is independent of short-term contract sentiment. The funding rate being stuck around the zero line is only because the derivatives contract market’s liquidity isn’t deep enough, and it can’t truly reflect overall bullishness.
My take: this apparent calm, yet actually divided, structure won’t last for long.
Trading tag: #TradFi #链上美股 #ARM
Where do you think this set of judgment is most likely to be wrong?
ARM up 2.305% in 24 hours, price at 259.64, but the funding rate is 0. A momentum mover with the funding rate staying perfectly flat is not very common.
Mechanism explained: a funding rate of zero means long and short sides are roughly balanced at this moment—bullish sentiment isn’t clearly overpowering bearish sentiment despite the price rise. Against the backdrop of Trump’s trading, market expectations for traditional tech stocks are highly split. Some capital bets on policy tailwinds may flow into hard tech like semiconductors, while other capital may be hedging against uncertainty. This split sentiment is directly reflected in the funding rate, keeping it pinned at the zero line.
This is usually calm before the storm. While the price is moving, the longs’ cost basis hasn’t been pushed higher, suggesting that the newly added bullish force isn’t decisive enough—or that shorts have continued resistance around 260. If the price keeps rising but the funding rate still can’t turn positive, early long positions may take profit early because there’s no positive funding subsidy, and the rally structure will become fragile.
The strongest counterargument is: as a key AI compute infrastructure name, ARM’s value logic is independent of short-term contract sentiment. The funding rate being stuck around the zero line is only because the derivatives contract market’s liquidity isn’t deep enough, and it can’t truly reflect overall bullishness.
My take: this apparent calm, yet actually divided, structure won’t last for long.
Trading tag: #TradFi #链上美股 #ARM
Where do you think this set of judgment is most likely to be wrong?
Mechanism explained: a funding rate of zero means long and short sides are roughly balanced at this moment—bullish sentiment isn’t clearly overpowering bearish sentiment despite the price rise. Against the backdrop of Trump’s trading, market expectations for traditional tech stocks are highly split. Some capital bets on policy tailwinds may flow into hard tech like semiconductors, while other capital may be hedging against uncertainty. This split sentiment is directly reflected in the funding rate, keeping it pinned at the zero line.
This is usually calm before the storm. While the price is moving, the longs’ cost basis hasn’t been pushed higher, suggesting that the newly added bullish force isn’t decisive enough—or that shorts have continued resistance around 260. If the price keeps rising but the funding rate still can’t turn positive, early long positions may take profit early because there’s no positive funding subsidy, and the rally structure will become fragile.
The strongest counterargument is: as a key AI compute infrastructure name, ARM’s value logic is independent of short-term contract sentiment. The funding rate being stuck around the zero line is only because the derivatives contract market’s liquidity isn’t deep enough, and it can’t truly reflect overall bullishness.
My take: this apparent calm, yet actually divided, structure won’t last for long.
Trading tag: #TradFi #链上美股 #ARM
Where do you think this set of judgment is most likely to be wrong?
16

·
--
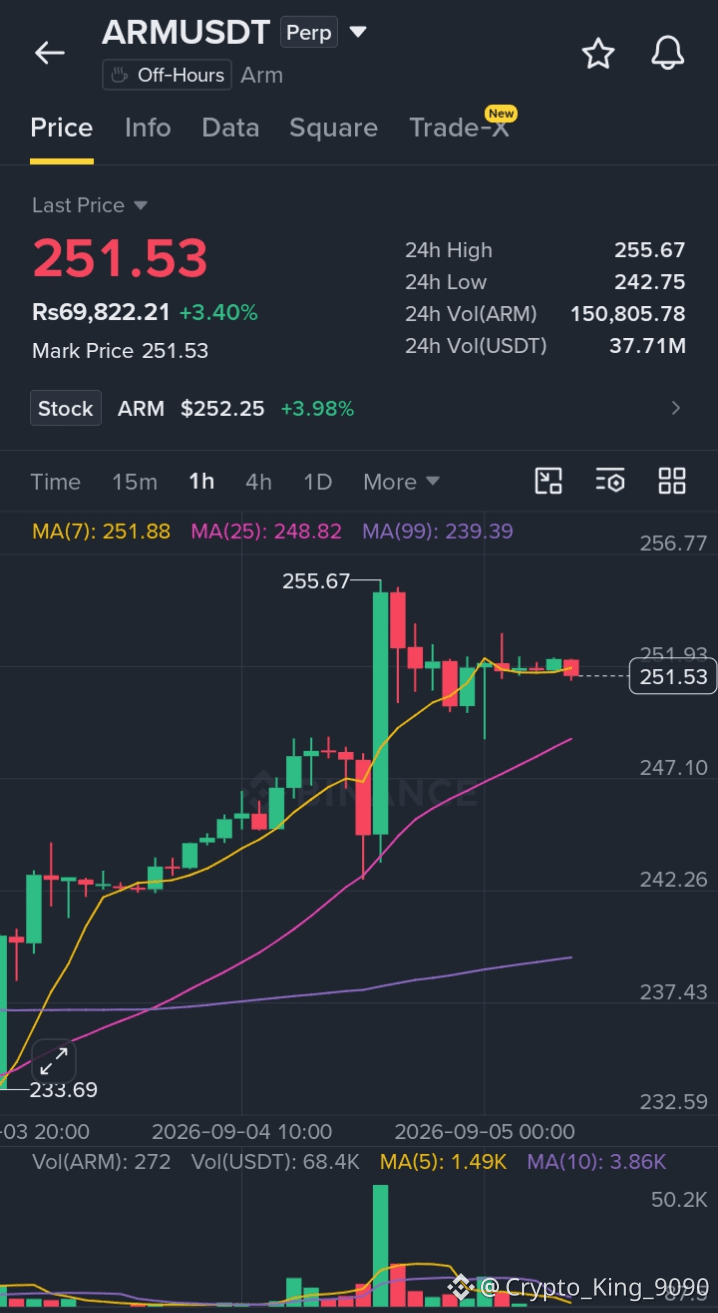
Bullish
$ARM testing key resistance after a strong recovery.
Resistance: $255–$256
A clean breakout and hold above $256 could open the way toward $260 and $265. If sellers reject this area, a pullback toward $248–$245 may offer a healthier retest before another attempt higher.
Momentum remains bullish, but wait for confirmation above the recent high before entering.
click here to trade 👇
#ARM
{future}(ARMUSDT)
$ARMB
{spot}(ARMBUSDT)
$SKHY
{future}(SKHYUSDT)
$ARM testing key resistance after a strong recovery.
Resistance: $255–$256
A clean breakout and hold above $256 could open the way toward $260 and $265. If sellers reject this area, a pullback toward $248–$245 may offer a healthier retest before another attempt higher.
Momentum remains bullish, but wait for confirmation above the recent high before entering.
click here to trade 👇
#ARM
$ARMB
$SKHY
Resistance: $255–$256
A clean breakout and hold above $256 could open the way toward $260 and $265. If sellers reject this area, a pullback toward $248–$245 may offer a healthier retest before another attempt higher.
Momentum remains bullish, but wait for confirmation above the recent high before entering.
click here to trade 👇
#ARM
$ARMB
$SKHY
1
103

5-minute trend scan, 2 clear opportunities.
$ARM long. Upward continuation within a consolidating structure, volume increased 5.23x, and after the breakout price has continued to hold firmly in the high area. 5-minute consolidation, 15-minute consolidation, 1-hour uptrend. Entry score 67, structure score 70. Higher-timeframe room 0.13%.
Current price 252.00. Entry 251.00-252.50, stop loss 248.00, target 257.50, risk-reward ratio 2.5:1.
Conclusion: Buyable. Volume-confirmed continuation, supported by the 1-hour uptrend, with no conflict across timeframes.
$MINIMAX long. Volume breakout above the previous high within a range-bound zone, trading volume 2.79x, and price is moving close to the resistance level. 5-minute consolidation, 15-minute consolidation, 1-hour consolidation. Entry score 58, structure score 84. Higher-timeframe room 0.02%.
Current price 46.39. Entry 46.00-46.50, stop loss 45.20, target 48.10, risk-reward ratio 2.4:1.
Conclusion: Buyable. Structure score is very high, the volume breakout is confirmed, but the 1-hour chart is still consolidating, so position sizing should be controlled.
Suggested position size: no more than 10% per coin.
#ARM #MINIMAX #做多 #contract
5-minute trend scan, 2 clear opportunities.
$ARM long. Upward continuation within a consolidating structure, volume increased 5.23x, and after the breakout price has continued to hold firmly in the high area. 5-minute consolidation, 15-minute consolidation, 1-hour uptrend. Entry score 67, structure score 70. Higher-timeframe room 0.13%.
Current price 252.00. Entry 251.00-252.50, stop loss 248.00, target 257.50, risk-reward ratio 2.5:1.
Conclusion: Buyable. Volume-confirmed continuation, supported by the 1-hour uptrend, with no conflict across timeframes.
$MINIMAX long. Volume breakout above the previous high within a range-bound zone, trading volume 2.79x, and price is moving close to the resistance level. 5-minute consolidation, 15-minute consolidation, 1-hour consolidation. Entry score 58, structure score 84. Higher-timeframe room 0.02%.
Current price 46.39. Entry 46.00-46.50, stop loss 45.20, target 48.10, risk-reward ratio 2.4:1.
Conclusion: Buyable. Structure score is very high, the volume breakout is confirmed, but the 1-hour chart is still consolidating, so position sizing should be controlled.
Suggested position size: no more than 10% per coin.
#ARM #MINIMAX #做多 #contract
$ARM long. Upward continuation within a consolidating structure, volume increased 5.23x, and after the breakout price has continued to hold firmly in the high area. 5-minute consolidation, 15-minute consolidation, 1-hour uptrend. Entry score 67, structure score 70. Higher-timeframe room 0.13%.
Current price 252.00. Entry 251.00-252.50, stop loss 248.00, target 257.50, risk-reward ratio 2.5:1.
Conclusion: Buyable. Volume-confirmed continuation, supported by the 1-hour uptrend, with no conflict across timeframes.
$MINIMAX long. Volume breakout above the previous high within a range-bound zone, trading volume 2.79x, and price is moving close to the resistance level. 5-minute consolidation, 15-minute consolidation, 1-hour consolidation. Entry score 58, structure score 84. Higher-timeframe room 0.02%.
Current price 46.39. Entry 46.00-46.50, stop loss 45.20, target 48.10, risk-reward ratio 2.4:1.
Conclusion: Buyable. Structure score is very high, the volume breakout is confirmed, but the 1-hour chart is still consolidating, so position sizing should be controlled.
Suggested position size: no more than 10% per coin.
#ARM #MINIMAX #做多 #contract
2


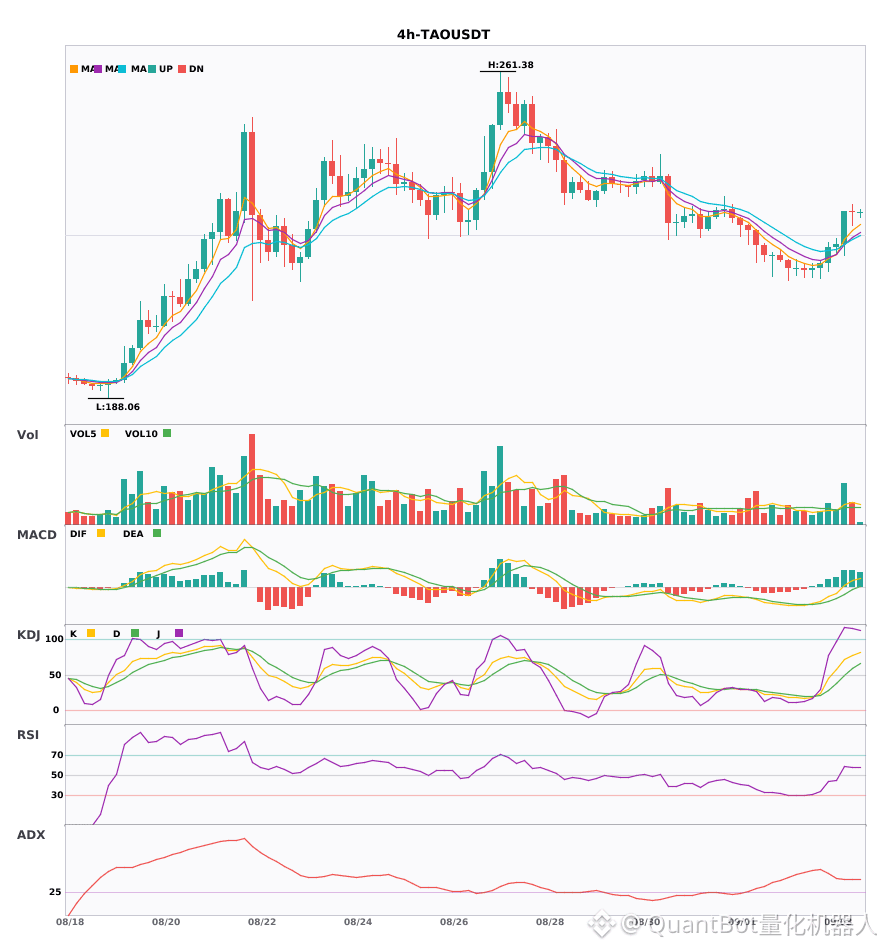
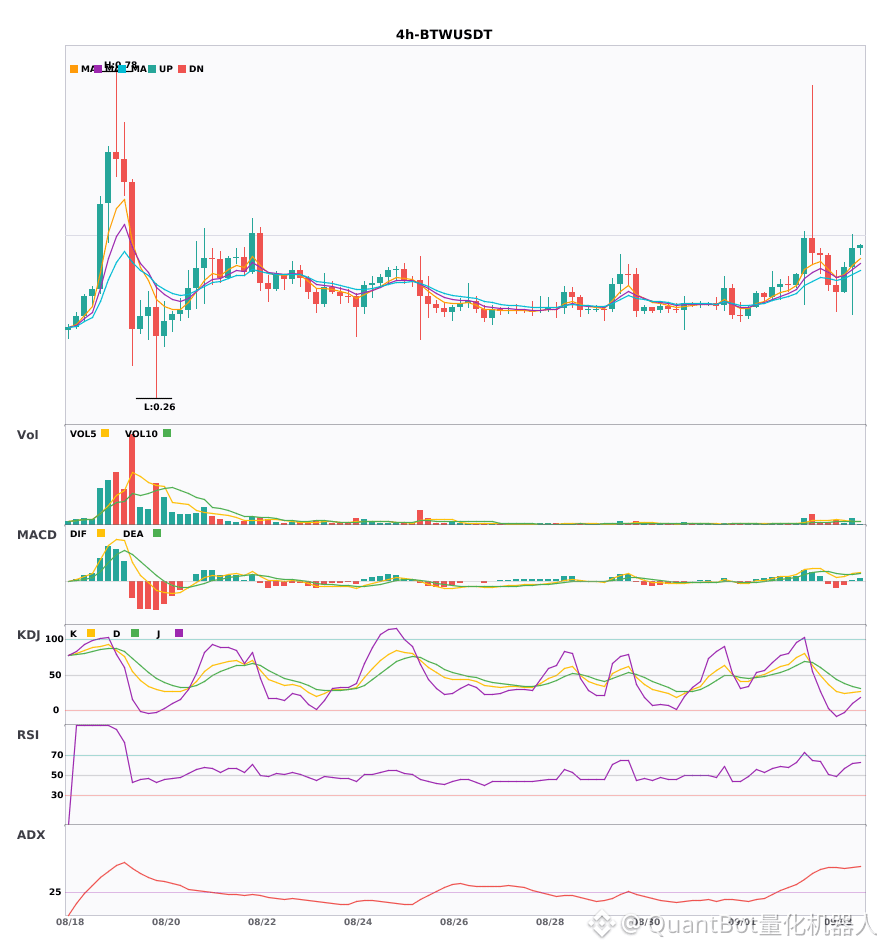
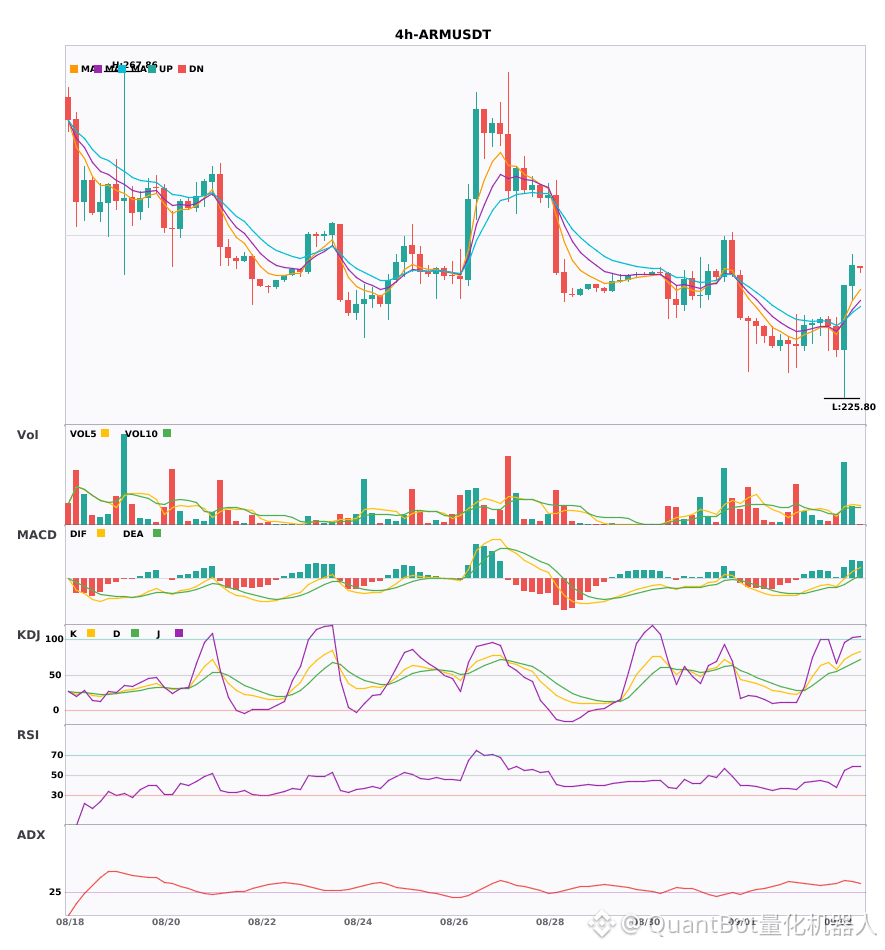
$TAO $BTW $ARM synchronized trigger 4H-level bullish resonance signal
📈 $TAO | 4-hour bullish signal
━━━━━━━━━━━━━━━━━━
Technical analysis: ADX(42) indicates a strong trend; the MACD is running bullishly, with the MACD histogram expanding and upward momentum strengthening; EMA5>EMA8>EMA13 forms a bullish alignment; KDJ operates in a strong zone, with K at 77.8 and D at 59.1; volume is significantly increased to 2.3 times the average volume. Multiple indicators resonate and confirm that the trend is relatively strong.
Price change: -0.0900%
📈 $BTW | 4-hour bullish signal
━━━━━━━━━━━━━━━━━━
Technical analysis: ADX(56) shows a strong trend—watch for the risk of a hot/crowded pullback; a MACD bullish cross above the zero line confirms bullish momentum; EMA5/8/13 are in bullish alignment; KDJ is weak, with K at 25.8 and D at 33.6; volume is expanded to 1.8 times, with volume and price acting in tandem.
Price change: 6.6800%
📈 $ARM | 4-hour bullish signal
━━━━━━━━━━━━━━━━━━
Technical analysis: ADX reaches 40, indicating a clear trend; MACD-DIF crosses above the zero axis, enhancing bullish momentum; EMA5 crosses above EMA8, and the short-term moving averages form a golden cross; KDJ remains strong (K 71.9, D 60.1); volume is significantly increased to 3.8 times. Overall assessment: the bullish structure is established.
Price change: 3.5800%
━━━━━━━━━━━━━━━━━━
#技术分析 #TAO #BTW #ARM
📌 The above content is for reference only and does not constitute investment advice
$TAO $BTW $ARM synchronized trigger 4H-level bullish resonance signal
📈 $TAO | 4-hour bullish signal
━━━━━━━━━━━━━━━━━━
Technical analysis: ADX(42) indicates a strong trend; the MACD is running bullishly, with the MACD histogram expanding and upward momentum strengthening; EMA5>EMA8>EMA13 forms a bullish alignment; KDJ operates in a strong zone, with K at 77.8 and D at 59.1; volume is significantly increased to 2.3 times the average volume. Multiple indicators resonate and confirm that the trend is relatively strong.
Price change: -0.0900%
📈 $BTW | 4-hour bullish signal
━━━━━━━━━━━━━━━━━━
Technical analysis: ADX(56) shows a strong trend—watch for the risk of a hot/crowded pullback; a MACD bullish cross above the zero line confirms bullish momentum; EMA5/8/13 are in bullish alignment; KDJ is weak, with K at 25.8 and D at 33.6; volume is expanded to 1.8 times, with volume and price acting in tandem.
Price change: 6.6800%
📈 $ARM | 4-hour bullish signal
━━━━━━━━━━━━━━━━━━
Technical analysis: ADX reaches 40, indicating a clear trend; MACD-DIF crosses above the zero axis, enhancing bullish momentum; EMA5 crosses above EMA8, and the short-term moving averages form a golden cross; KDJ remains strong (K 71.9, D 60.1); volume is significantly increased to 3.8 times. Overall assessment: the bullish structure is established.
Price change: 3.5800%
━━━━━━━━━━━━━━━━━━
#技术分析 #TAO #BTW #ARM
📌 The above content is for reference only and does not constitute investment advice
📈 $TAO | 4-hour bullish signal
━━━━━━━━━━━━━━━━━━
Technical analysis: ADX(42) indicates a strong trend; the MACD is running bullishly, with the MACD histogram expanding and upward momentum strengthening; EMA5>EMA8>EMA13 forms a bullish alignment; KDJ operates in a strong zone, with K at 77.8 and D at 59.1; volume is significantly increased to 2.3 times the average volume. Multiple indicators resonate and confirm that the trend is relatively strong.
Price change: -0.0900%
📈 $BTW | 4-hour bullish signal
━━━━━━━━━━━━━━━━━━
Technical analysis: ADX(56) shows a strong trend—watch for the risk of a hot/crowded pullback; a MACD bullish cross above the zero line confirms bullish momentum; EMA5/8/13 are in bullish alignment; KDJ is weak, with K at 25.8 and D at 33.6; volume is expanded to 1.8 times, with volume and price acting in tandem.
Price change: 6.6800%
📈 $ARM | 4-hour bullish signal
━━━━━━━━━━━━━━━━━━
Technical analysis: ADX reaches 40, indicating a clear trend; MACD-DIF crosses above the zero axis, enhancing bullish momentum; EMA5 crosses above EMA8, and the short-term moving averages form a golden cross; KDJ remains strong (K 71.9, D 60.1); volume is significantly increased to 3.8 times. Overall assessment: the bullish structure is established.
Price change: 3.5800%
━━━━━━━━━━━━━━━━━━
#技术分析 #TAO #BTW #ARM
📌 The above content is for reference only and does not constitute investment advice
247
·
--
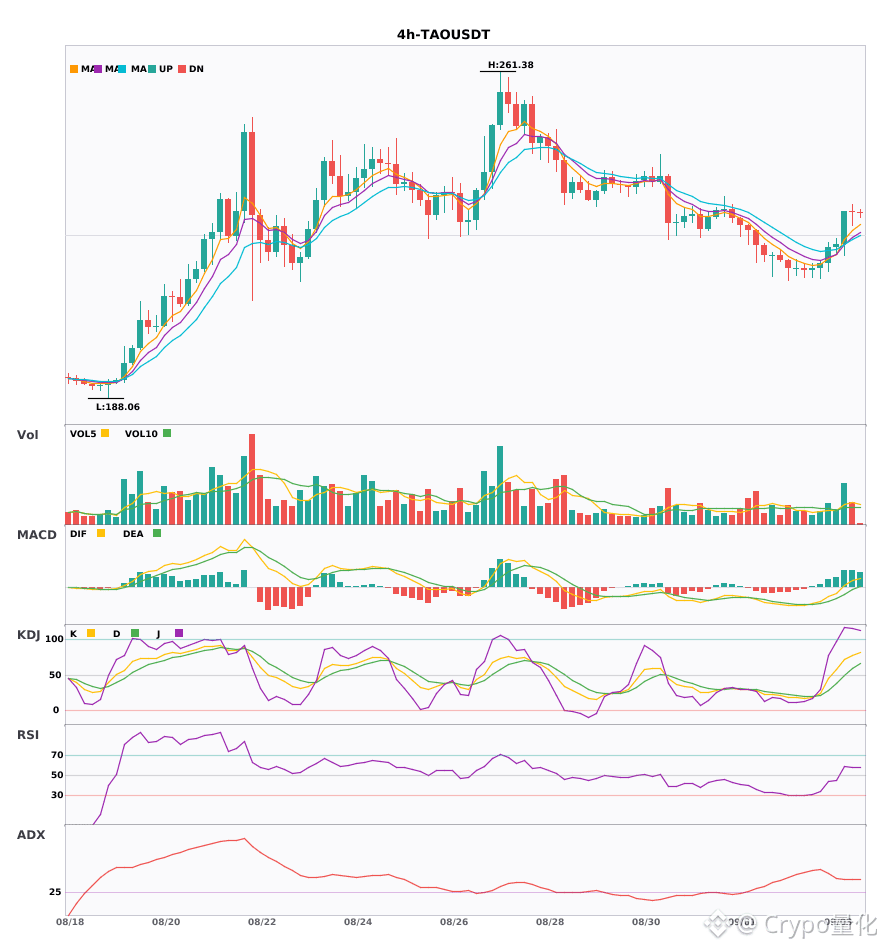
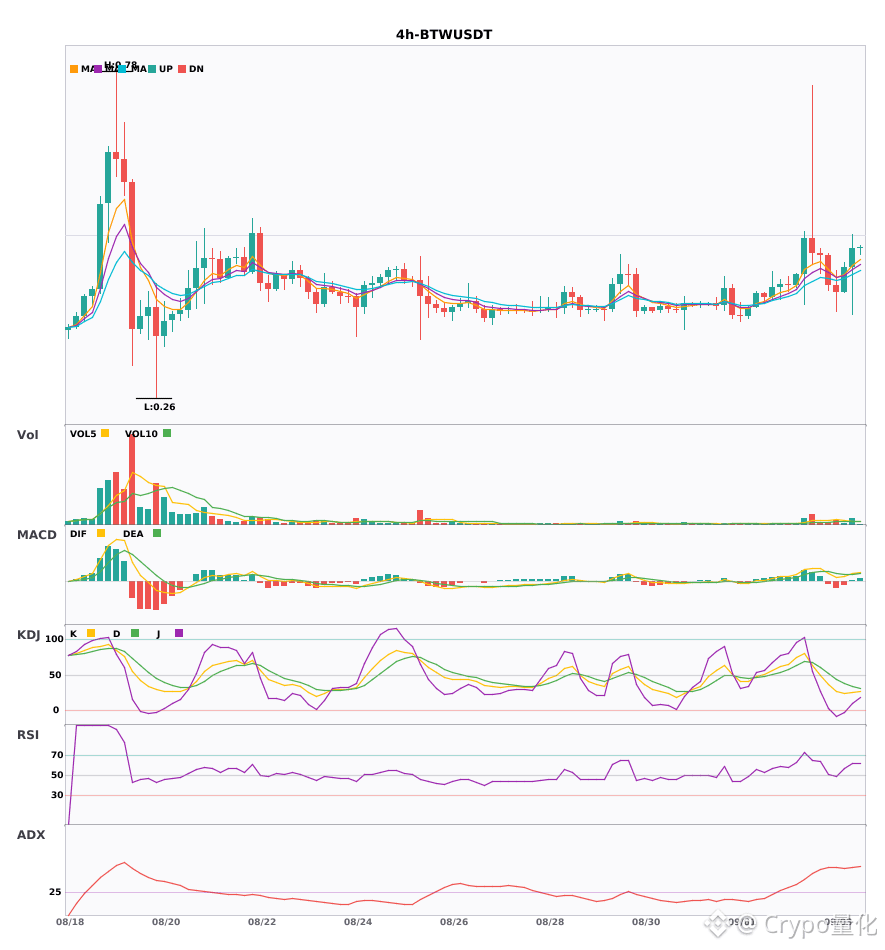
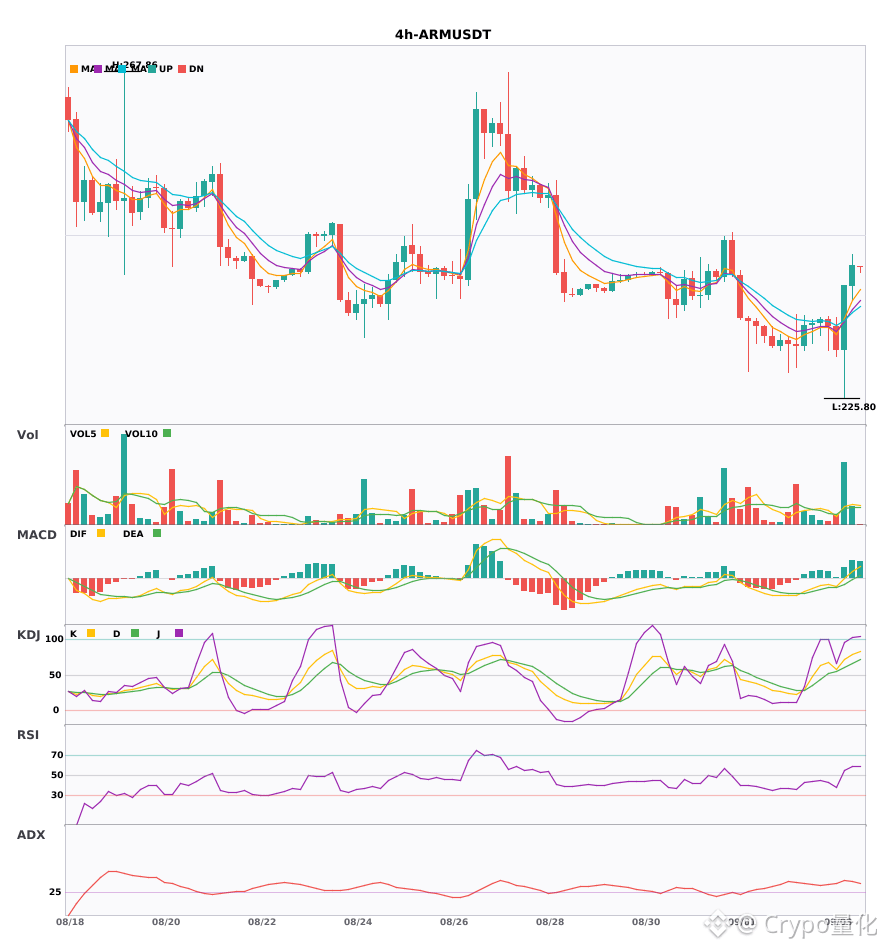
$TAO $BTW $ARM 4 hours moving average bullish alignment. Golden cross with increased volume and expanding red bars 🔥
════════════════════
🔴 $TAO 4 hours bullish signal
⚠️ Technicals: ADX42 is strengthening, the trend is clear. After the MACD golden cross, the red histogram bars lengthen. The 5/8/13-day moving averages have just formed a bullish alignment. KDJ’s K line has crossed above the D line at 77.8, but it hasn’t reached overbought yet. Volume has expanded 2.3x, and the overall bias remains bullish—still worth holding.
════════════════════
🔴 $BTW 4 hours bullish signal
⚠️ Technicals: ADX spikes to 56—very strong trend. Watch out for a pullback. MACD has a bullish (above-zero) golden cross, and the bulls are gaining momentum. MA lines 5 through 8 through 13 are all crossed upward, with bullish alignment. KDJ is still in a weak zone, with bears still dominant. Trading volume has expanded 1.8x.
════════════════════
🔴 $ARM 4 hours bullish signal
⚠️ Technicals: ADX reaches 40—this move is strong. MACD has just flipped above the zero line; the red histogram bars are starting to expand. The moving averages have just formed bullish alignment and are beginning to fan upward. In KDJ, K has crossed above D, but it hasn’t entered the overbought zone yet. Volume surged 3.8x directly—bulls are fully in control.
════════════════════
🔔 Watch for first-hand market moves and anomalies 🔔
#技术分析 #TAO #BTW #ARM
📌 When trading, pay attention to whether the candlestick pattern matches
$TAO $BTW $ARM 4 hours moving average bullish alignment. Golden cross with increased volume and expanding red bars 🔥
════════════════════
🔴 $TAO 4 hours bullish signal
⚠️ Technicals: ADX42 is strengthening, the trend is clear. After the MACD golden cross, the red histogram bars lengthen. The 5/8/13-day moving averages have just formed a bullish alignment. KDJ’s K line has crossed above the D line at 77.8, but it hasn’t reached overbought yet. Volume has expanded 2.3x, and the overall bias remains bullish—still worth holding.
════════════════════
🔴 $BTW 4 hours bullish signal
⚠️ Technicals: ADX spikes to 56—very strong trend. Watch out for a pullback. MACD has a bullish (above-zero) golden cross, and the bulls are gaining momentum. MA lines 5 through 8 through 13 are all crossed upward, with bullish alignment. KDJ is still in a weak zone, with bears still dominant. Trading volume has expanded 1.8x.
════════════════════
🔴 $ARM 4 hours bullish signal
⚠️ Technicals: ADX reaches 40—this move is strong. MACD has just flipped above the zero line; the red histogram bars are starting to expand. The moving averages have just formed bullish alignment and are beginning to fan upward. In KDJ, K has crossed above D, but it hasn’t entered the overbought zone yet. Volume surged 3.8x directly—bulls are fully in control.
════════════════════
🔔 Watch for first-hand market moves and anomalies 🔔
#技术分析 #TAO #BTW #ARM
📌 When trading, pay attention to whether the candlestick pattern matches
════════════════════
🔴 $TAO 4 hours bullish signal
⚠️ Technicals: ADX42 is strengthening, the trend is clear. After the MACD golden cross, the red histogram bars lengthen. The 5/8/13-day moving averages have just formed a bullish alignment. KDJ’s K line has crossed above the D line at 77.8, but it hasn’t reached overbought yet. Volume has expanded 2.3x, and the overall bias remains bullish—still worth holding.
════════════════════
🔴 $BTW 4 hours bullish signal
⚠️ Technicals: ADX spikes to 56—very strong trend. Watch out for a pullback. MACD has a bullish (above-zero) golden cross, and the bulls are gaining momentum. MA lines 5 through 8 through 13 are all crossed upward, with bullish alignment. KDJ is still in a weak zone, with bears still dominant. Trading volume has expanded 1.8x.
════════════════════
🔴 $ARM 4 hours bullish signal
⚠️ Technicals: ADX reaches 40—this move is strong. MACD has just flipped above the zero line; the red histogram bars are starting to expand. The moving averages have just formed bullish alignment and are beginning to fan upward. In KDJ, K has crossed above D, but it hasn’t entered the overbought zone yet. Volume surged 3.8x directly—bulls are fully in control.
════════════════════
🔔 Watch for first-hand market moves and anomalies 🔔
#技术分析 #TAO #BTW #ARM
📌 When trading, pay attention to whether the candlestick pattern matches
190
·
--
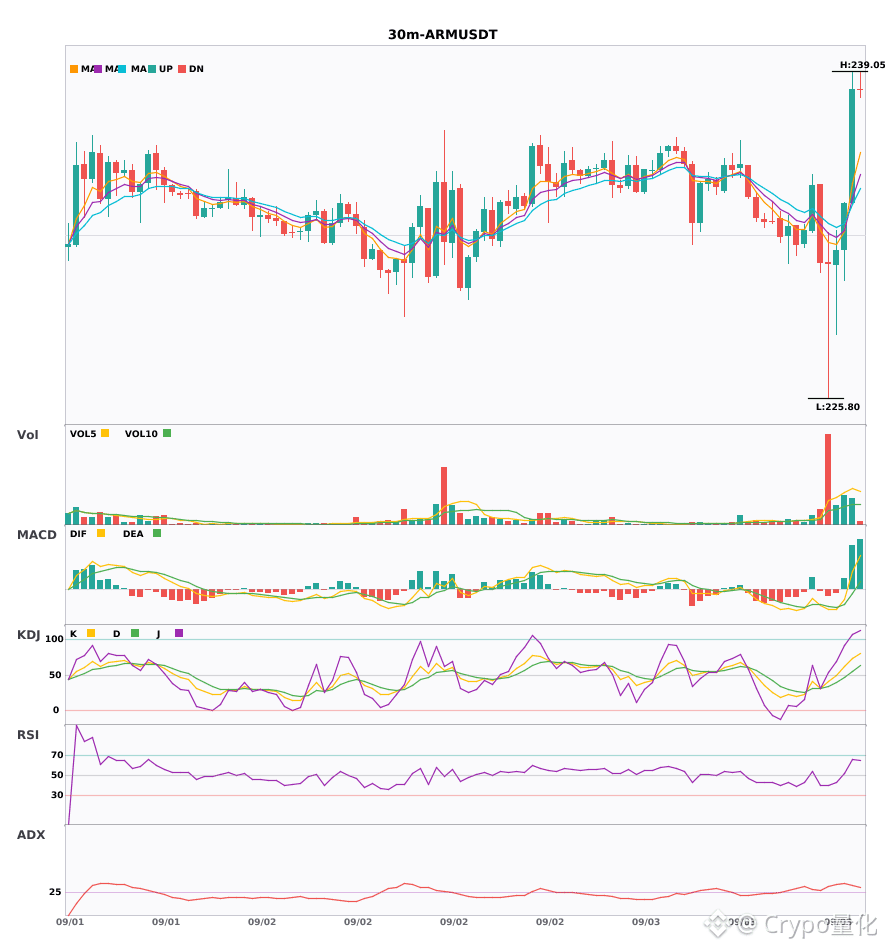
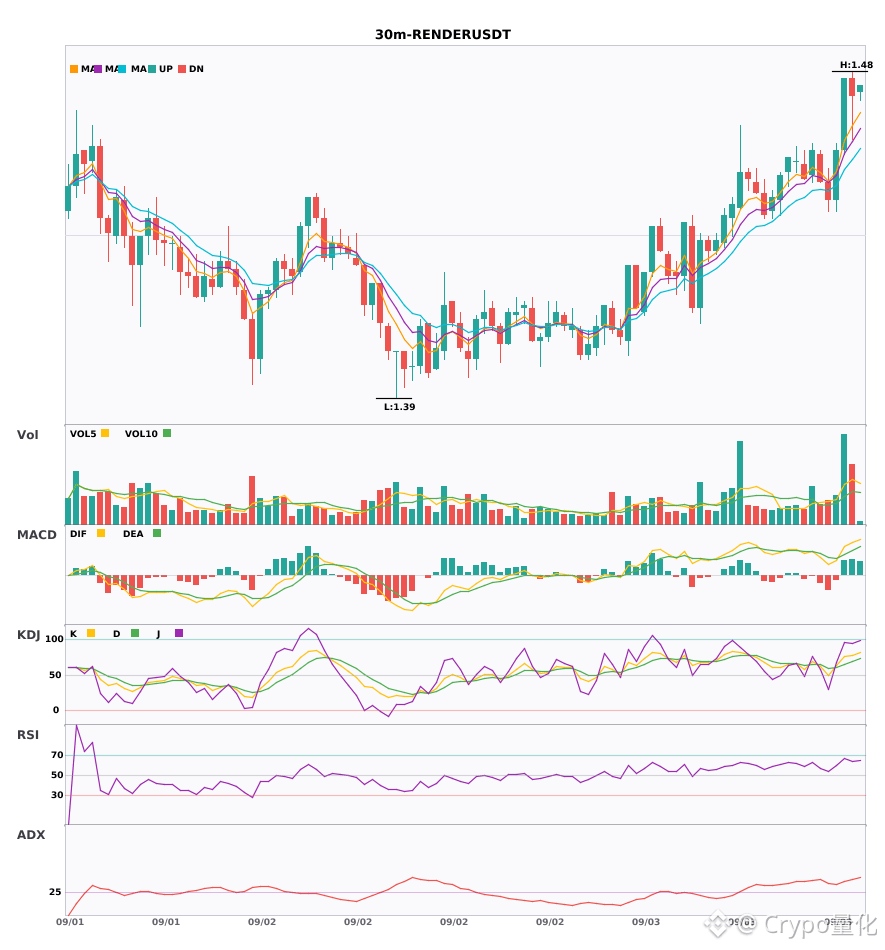
$4 $ARM $RENDER Three Swordsmen burst simultaneously in 30 minutes—who’s the toughest?🔥
════════════════════
🔴 $4 30-minute bullish signal
⚠️ Technicals: ADX has risen to 27 and the trend is forming—go for it. MACD has crossed above zero with a golden cross, and the bulls are starting to push. The short-term moving averages have just formed a bullish alignment and are heading upward. KDJ has just generated a golden cross but hasn’t reached overbought yet, and volume is up more than 2x.
════════════════════
🔴 $ARM 30-minute bullish signal
⚠️ Technicals: ADX surged to 35—trend strength is clearly increasing. After the MACD golden cross, volume expanded, and the red histogram bars keep getting bigger. The moving averages have just formed a bullish alignment, dispersing upward. In KDJ, K crosses above D at 72—still not in the overbought zone, and volume is also up to 1.6x, giving the bulls the edge.
════════════════════
🔴 $RENDER 30-minute bullish signal
⚠️ Technicals: ADX (37) indicates a very strong trend. MACD has a golden cross above the zero line—red bars continue to expand, and upward momentum remains strong. The 5-day, 8-day, and 13-day moving averages are all in bullish alignment and dispersing upward. KDJ is strong: K at 75 still hasn’t reached overbought. Volume is up 3.2x—funds are moving in.
════════════════════
🔔 Follow to get first-hand alerts on market anomalies 🔔
#技术分析 #4 #ARM #RENDER
📌 When trading, pay attention to whether the candlestick patterns match
$4 $ARM $RENDER Three Swordsmen burst simultaneously in 30 minutes—who’s the toughest?🔥
════════════════════
🔴 $4 30-minute bullish signal
⚠️ Technicals: ADX has risen to 27 and the trend is forming—go for it. MACD has crossed above zero with a golden cross, and the bulls are starting to push. The short-term moving averages have just formed a bullish alignment and are heading upward. KDJ has just generated a golden cross but hasn’t reached overbought yet, and volume is up more than 2x.
════════════════════
🔴 $ARM 30-minute bullish signal
⚠️ Technicals: ADX surged to 35—trend strength is clearly increasing. After the MACD golden cross, volume expanded, and the red histogram bars keep getting bigger. The moving averages have just formed a bullish alignment, dispersing upward. In KDJ, K crosses above D at 72—still not in the overbought zone, and volume is also up to 1.6x, giving the bulls the edge.
════════════════════
🔴 $RENDER 30-minute bullish signal
⚠️ Technicals: ADX (37) indicates a very strong trend. MACD has a golden cross above the zero line—red bars continue to expand, and upward momentum remains strong. The 5-day, 8-day, and 13-day moving averages are all in bullish alignment and dispersing upward. KDJ is strong: K at 75 still hasn’t reached overbought. Volume is up 3.2x—funds are moving in.
════════════════════
🔔 Follow to get first-hand alerts on market anomalies 🔔
#技术分析 #4 #ARM #RENDER
📌 When trading, pay attention to whether the candlestick patterns match
════════════════════
🔴 $4 30-minute bullish signal
⚠️ Technicals: ADX has risen to 27 and the trend is forming—go for it. MACD has crossed above zero with a golden cross, and the bulls are starting to push. The short-term moving averages have just formed a bullish alignment and are heading upward. KDJ has just generated a golden cross but hasn’t reached overbought yet, and volume is up more than 2x.
════════════════════
🔴 $ARM 30-minute bullish signal
⚠️ Technicals: ADX surged to 35—trend strength is clearly increasing. After the MACD golden cross, volume expanded, and the red histogram bars keep getting bigger. The moving averages have just formed a bullish alignment, dispersing upward. In KDJ, K crosses above D at 72—still not in the overbought zone, and volume is also up to 1.6x, giving the bulls the edge.
════════════════════
🔴 $RENDER 30-minute bullish signal
⚠️ Technicals: ADX (37) indicates a very strong trend. MACD has a golden cross above the zero line—red bars continue to expand, and upward momentum remains strong. The 5-day, 8-day, and 13-day moving averages are all in bullish alignment and dispersing upward. KDJ is strong: K at 75 still hasn’t reached overbought. Volume is up 3.2x—funds are moving in.
════════════════════
🔔 Follow to get first-hand alerts on market anomalies 🔔
#技术分析 #4 #ARM #RENDER
📌 When trading, pay attention to whether the candlestick patterns match
366
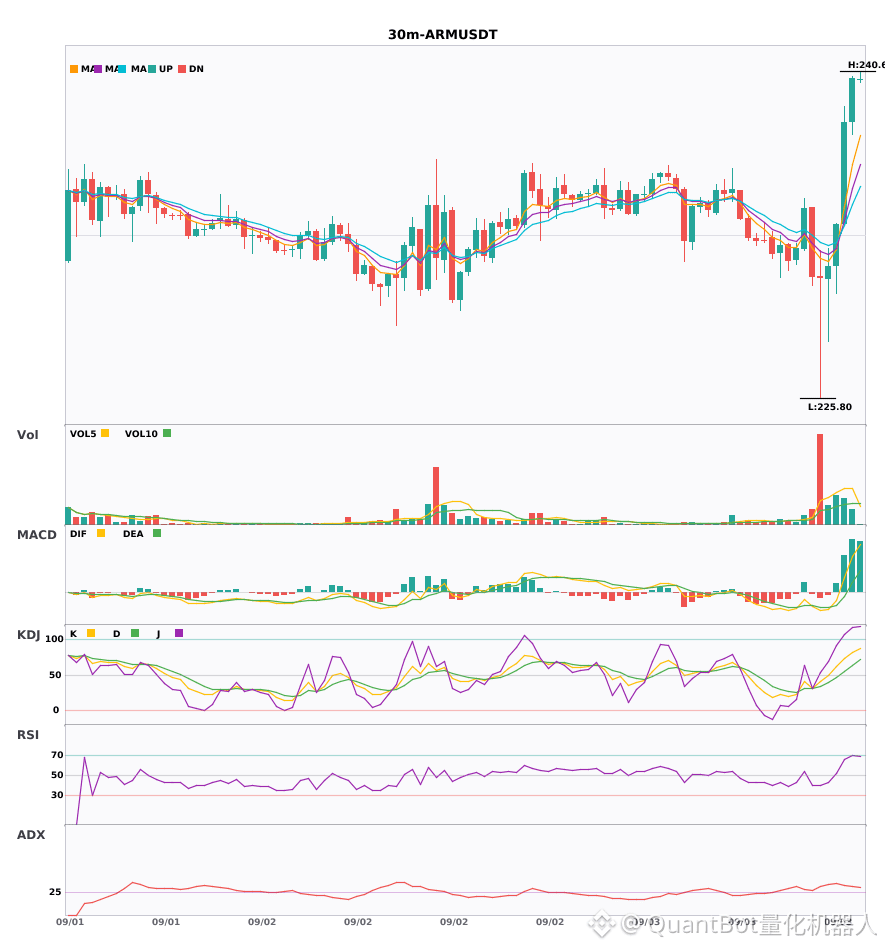
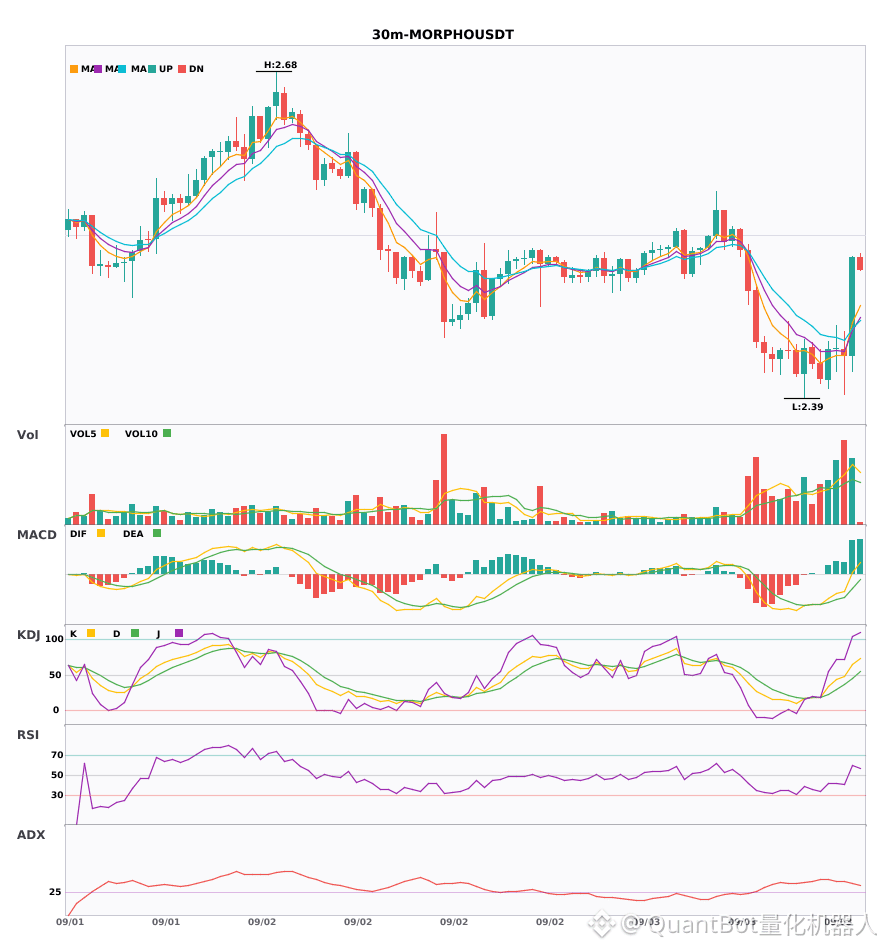
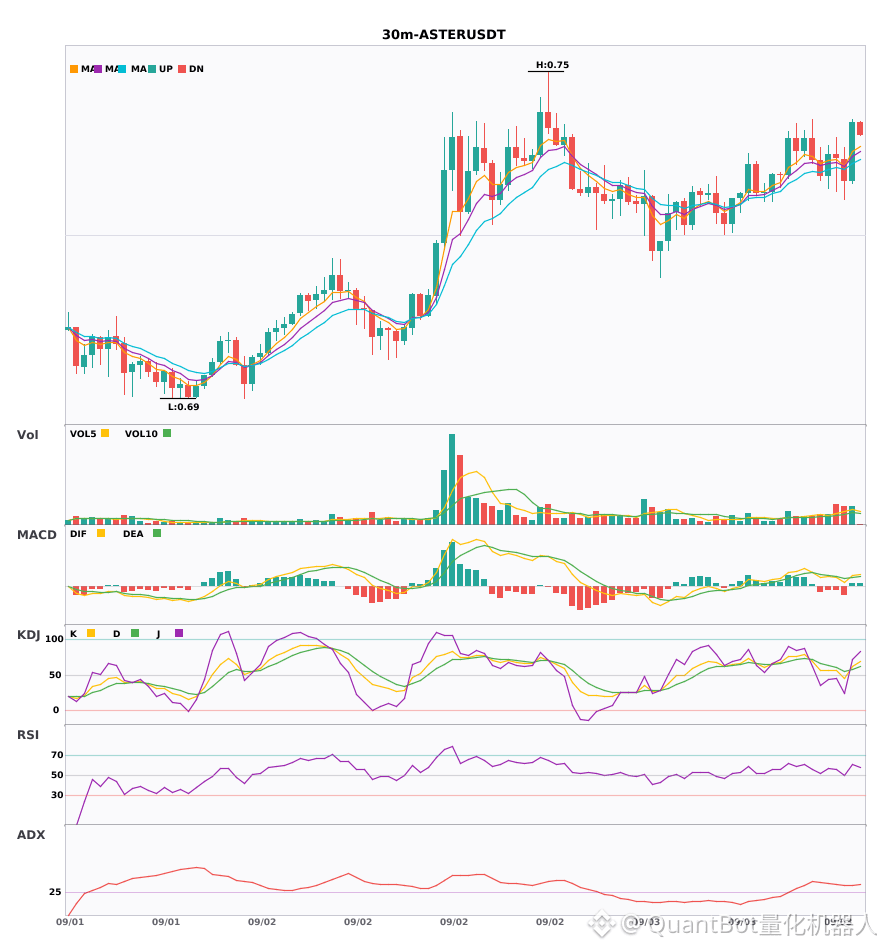
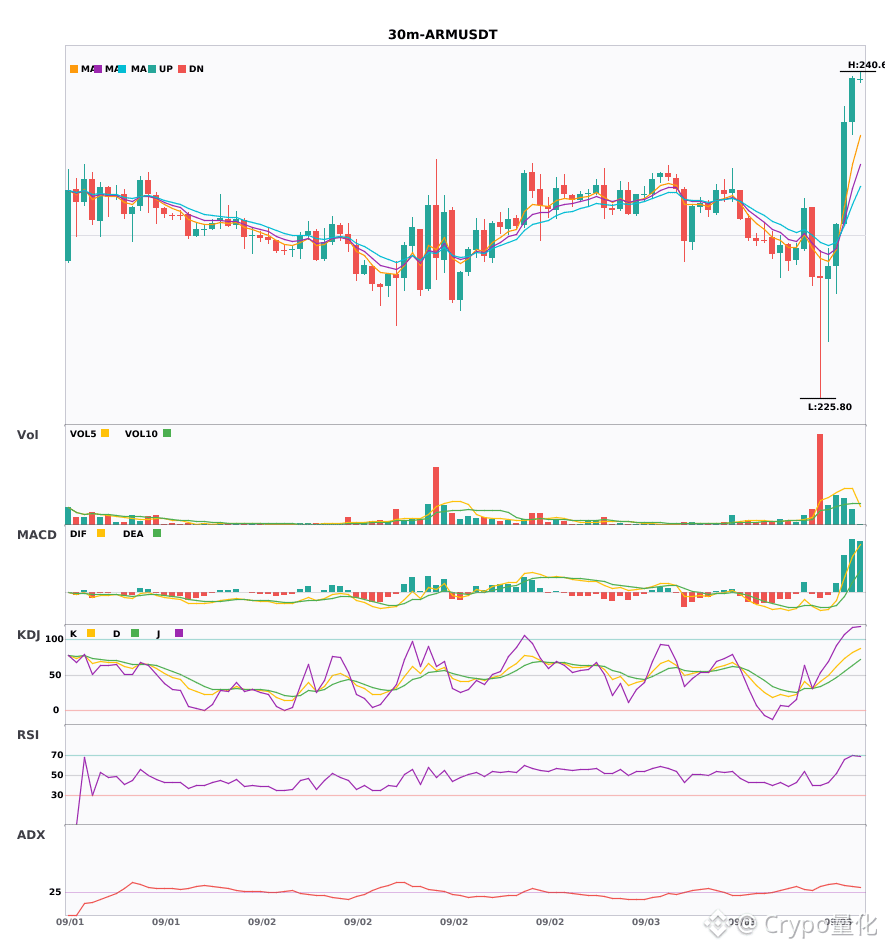
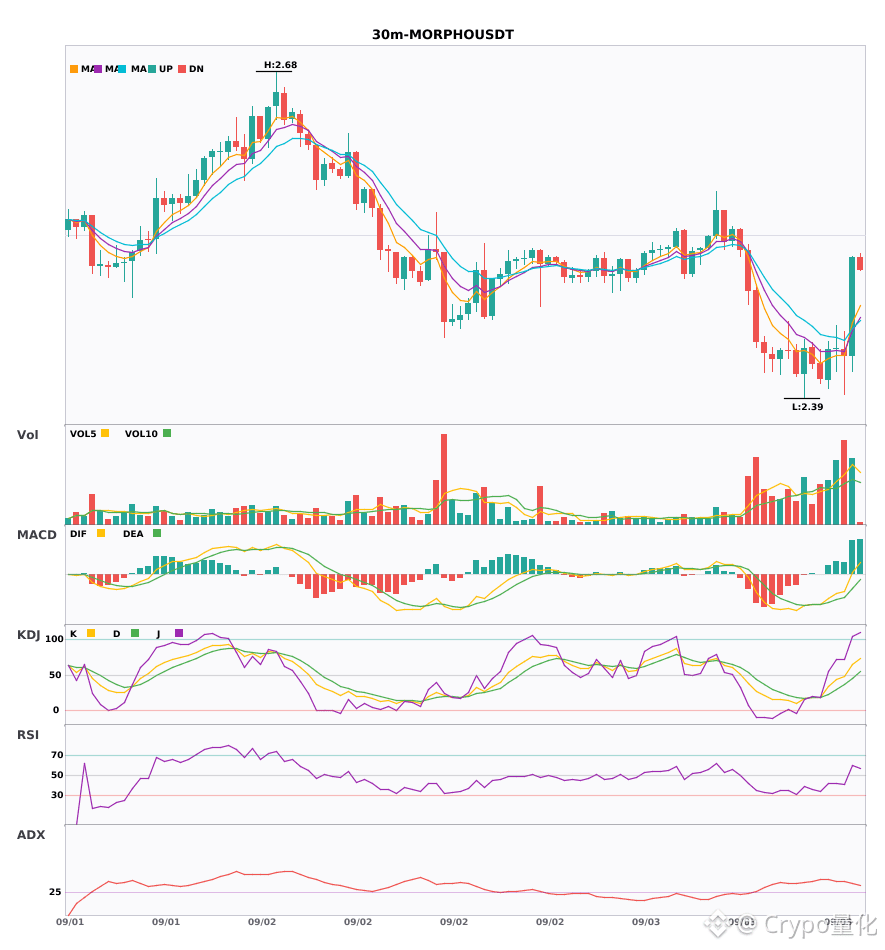
30-minute level: three varieties co-occurring bullish resonance signals: $ARM/$MORPHO/$ASTER
📈 $ARM | 30-minute bullish signal
━━━━━━━━━━━━━━━━━━
Technical analysis: ADX (35) indicates the trend is established; MACD DIF breaks above the zero axis, bullish momentum strengthens; EMA5 crosses above EMA8, turning the short-term trend bullish; KDJ remains strong (K72.6/D55.2); trading volume expands by 1.6x versus the earlier period, with active trading—overall bullish bias.
Price movement: 1.9800%
📈 $MORPHO | 30-minute bullish signal
━━━━━━━━━━━━━━━━━━
Technical analysis: ADX reaches 37, confirming that the trend strength is increasing; MACD DIF breaks above the zero axis, switching to a bullish structure; EMA5 crosses through EMA8, with short-term momentum turning bullish; volume expands to 2.0x, validating the move.
Price movement: 3.6100%
📈 $ASTER | 30-minute bullish signal
━━━━━━━━━━━━━━━━━━
Technical analysis: ADX reading 35 confirms a trending market; a golden cross above the MACD zero axis shows bullish momentum strengthening; EMA5 crossing above EMA8 triggers a short-term long signal; KDJ has a golden cross and the K value (62.3) is higher than the D value (57.8), reinforcing short-term upside expectations; volume is 1.7x higher than the prior period, providing price-volume alignment.
Price movement: 1.4900%
━━━━━━━━━━━━━━━━━━
#技术分析 #ARM #MORPHO #ASTER
📌 The above content is for reference only and does not constitute investment advice
30-minute level: three varieties co-occurring bullish resonance signals: $ARM /$MORPHO /$ASTER
📈 $ARM | 30-minute bullish signal
━━━━━━━━━━━━━━━━━━
Technical analysis: ADX (35) indicates the trend is established; MACD DIF breaks above the zero axis, bullish momentum strengthens; EMA5 crosses above EMA8, turning the short-term trend bullish; KDJ remains strong (K72.6/D55.2); trading volume expands by 1.6x versus the earlier period, with active trading—overall bullish bias.
Price movement: 1.9800%
📈 $MORPHO | 30-minute bullish signal
━━━━━━━━━━━━━━━━━━
Technical analysis: ADX reaches 37, confirming that the trend strength is increasing; MACD DIF breaks above the zero axis, switching to a bullish structure; EMA5 crosses through EMA8, with short-term momentum turning bullish; volume expands to 2.0x, validating the move.
Price movement: 3.6100%
📈 $ASTER | 30-minute bullish signal
━━━━━━━━━━━━━━━━━━
Technical analysis: ADX reading 35 confirms a trending market; a golden cross above the MACD zero axis shows bullish momentum strengthening; EMA5 crossing above EMA8 triggers a short-term long signal; KDJ has a golden cross and the K value (62.3) is higher than the D value (57.8), reinforcing short-term upside expectations; volume is 1.7x higher than the prior period, providing price-volume alignment.
Price movement: 1.4900%
━━━━━━━━━━━━━━━━━━
#技术分析 #ARM #MORPHO #ASTER
📌 The above content is for reference only and does not constitute investment advice
📈 $ARM | 30-minute bullish signal
━━━━━━━━━━━━━━━━━━
Technical analysis: ADX (35) indicates the trend is established; MACD DIF breaks above the zero axis, bullish momentum strengthens; EMA5 crosses above EMA8, turning the short-term trend bullish; KDJ remains strong (K72.6/D55.2); trading volume expands by 1.6x versus the earlier period, with active trading—overall bullish bias.
Price movement: 1.9800%
📈 $MORPHO | 30-minute bullish signal
━━━━━━━━━━━━━━━━━━
Technical analysis: ADX reaches 37, confirming that the trend strength is increasing; MACD DIF breaks above the zero axis, switching to a bullish structure; EMA5 crosses through EMA8, with short-term momentum turning bullish; volume expands to 2.0x, validating the move.
Price movement: 3.6100%
📈 $ASTER | 30-minute bullish signal
━━━━━━━━━━━━━━━━━━
Technical analysis: ADX reading 35 confirms a trending market; a golden cross above the MACD zero axis shows bullish momentum strengthening; EMA5 crossing above EMA8 triggers a short-term long signal; KDJ has a golden cross and the K value (62.3) is higher than the D value (57.8), reinforcing short-term upside expectations; volume is 1.7x higher than the prior period, providing price-volume alignment.
Price movement: 1.4900%
━━━━━━━━━━━━━━━━━━
#技术分析 #ARM #MORPHO #ASTER
📌 The above content is for reference only and does not constitute investment advice
234
·
--
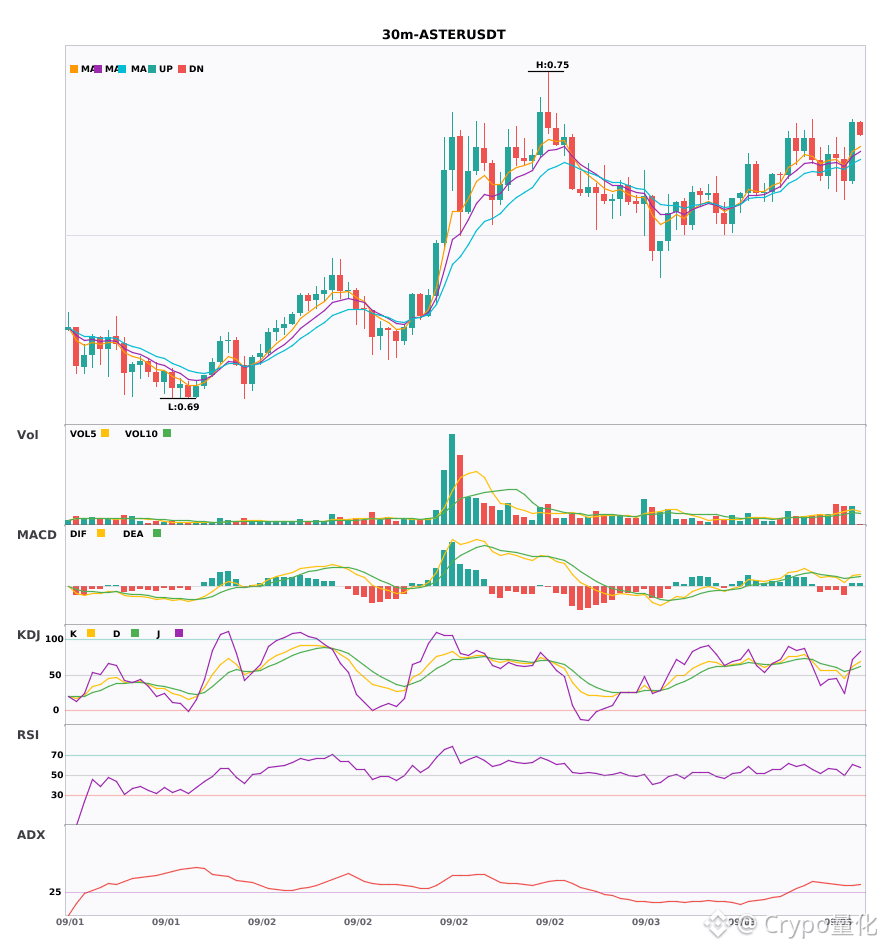
ARM MORPHO ASTER 30-minute triple burst, who is most likely to skyrocket🔥
════════════════════
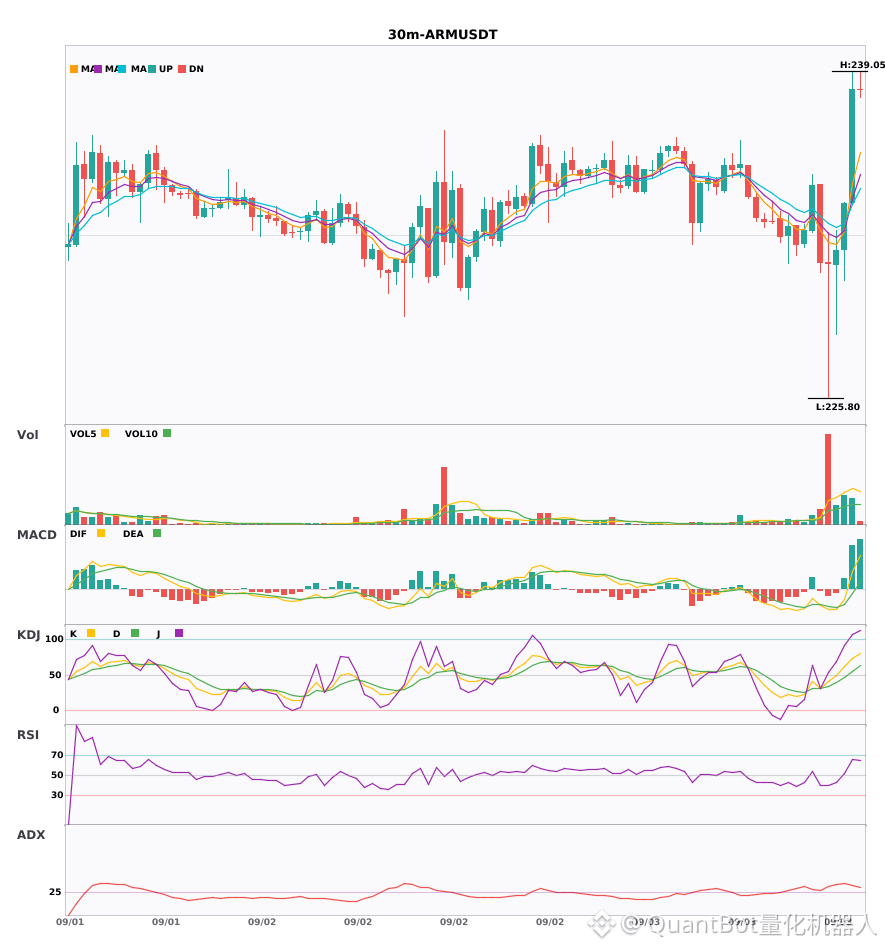
🔴 $ARM 30 minutes Bullish signal
⚠️ Technicals: ADX value is 35, the price action is strong and the trend is clear. The MACD DIF line has crossed above the zero axis and has started turning bullish. The 5-day MA has crossed above the 8-day MA—short-term outlook is bullish. KDJ shows K=72.6 and D=55.2, bulls have the advantage and it’s not overbought yet. Volume is also up by 1.6x, staying in sync.
════════════════════
🔴 $MORPHO 30 minutes Bullish signal
⚠️ Technicals: ADX has surged to 37, with a clearly trending market. MACD golden cross with expanding volume and longer red histogram bars; the moving averages have just formed a bullish alignment. The 5-day MA has crossed above the 8-day MA, and volume has doubled—bullish in the short term.
════════════════════
🔴 $ASTER 30 minutes Bullish signal
⚠️ Technicals: ADX has surged to 35—this trend has been confirmed! MACD bullish cross above zero; bulls are gaining momentum. The 5-day MA has crossed above the 8-day MA, turning stronger short-term. KDJ has a golden cross but is not overbought, so it’s safer. Trading volume is up by 1.7x—everything looks steady. Go long!
════════════════════
🔔 Follow to get first-hand alerts on market swings 🔔
#技术分析 #ARM #MORPHO #ASTER
📌 When trading, pay attention to whether the candlestick pattern matches
ARM MORPHO ASTER 30-minute triple burst, who is most likely to skyrocket🔥
════════════════════
🔴 $ARM 30 minutes Bullish signal
⚠️ Technicals: ADX value is 35, the price action is strong and the trend is clear. The MACD DIF line has crossed above the zero axis and has started turning bullish. The 5-day MA has crossed above the 8-day MA—short-term outlook is bullish. KDJ shows K=72.6 and D=55.2, bulls have the advantage and it’s not overbought yet. Volume is also up by 1.6x, staying in sync.
════════════════════
🔴 $MORPHO 30 minutes Bullish signal
⚠️ Technicals: ADX has surged to 37, with a clearly trending market. MACD golden cross with expanding volume and longer red histogram bars; the moving averages have just formed a bullish alignment. The 5-day MA has crossed above the 8-day MA, and volume has doubled—bullish in the short term.
════════════════════
🔴 $ASTER 30 minutes Bullish signal
⚠️ Technicals: ADX has surged to 35—this trend has been confirmed! MACD bullish cross above zero; bulls are gaining momentum. The 5-day MA has crossed above the 8-day MA, turning stronger short-term. KDJ has a golden cross but is not overbought, so it’s safer. Trading volume is up by 1.7x—everything looks steady. Go long!
════════════════════
🔔 Follow to get first-hand alerts on market swings 🔔
#技术分析 #ARM #MORPHO #ASTER
📌 When trading, pay attention to whether the candlestick pattern matches
════════════════════
🔴 $ARM 30 minutes Bullish signal
⚠️ Technicals: ADX value is 35, the price action is strong and the trend is clear. The MACD DIF line has crossed above the zero axis and has started turning bullish. The 5-day MA has crossed above the 8-day MA—short-term outlook is bullish. KDJ shows K=72.6 and D=55.2, bulls have the advantage and it’s not overbought yet. Volume is also up by 1.6x, staying in sync.
════════════════════
🔴 $MORPHO 30 minutes Bullish signal
⚠️ Technicals: ADX has surged to 37, with a clearly trending market. MACD golden cross with expanding volume and longer red histogram bars; the moving averages have just formed a bullish alignment. The 5-day MA has crossed above the 8-day MA, and volume has doubled—bullish in the short term.
════════════════════
🔴 $ASTER 30 minutes Bullish signal
⚠️ Technicals: ADX has surged to 35—this trend has been confirmed! MACD bullish cross above zero; bulls are gaining momentum. The 5-day MA has crossed above the 8-day MA, turning stronger short-term. KDJ has a golden cross but is not overbought, so it’s safer. Trading volume is up by 1.7x—everything looks steady. Go long!
════════════════════
🔔 Follow to get first-hand alerts on market swings 🔔
#技术分析 #ARM #MORPHO #ASTER
📌 When trading, pay attention to whether the candlestick pattern matches
180
$4 $ARM $RENDER 30 minute-level technical resonance, who will break through first?
📈 $4 | 30-minute long signal
━━━━━━━━━━━━━━━━━━
Technical analysis: ADX rises to 27, the trend is established, and a buy entry is recommended. MACD forms a bullish crossover above the zero line, and bullish momentum strengthens. EMA5 crosses above EMA8, turning the short-term structure bullish. KDJ shows a bullish crossover, with K=51.5 and D=47.3, indicating short-term bullish bias. Trading volume expands by 2.4x and coordination is good.
Price change: 4.0200%
📈 $ARM | 30-minute long signal
━━━━━━━━━━━━━━━━━━
Technical analysis: ADX reaches 35, confirming a trend-following market. MACD-DIF crosses above the zero line, and bullish momentum is enhanced. EMA5 crosses above EMA8, strengthening the short-term trend. KDJ maintains a strong pattern (K72.6/D55.2). Trading volume significantly increases to 1.6x.
Price change: 1.9800%
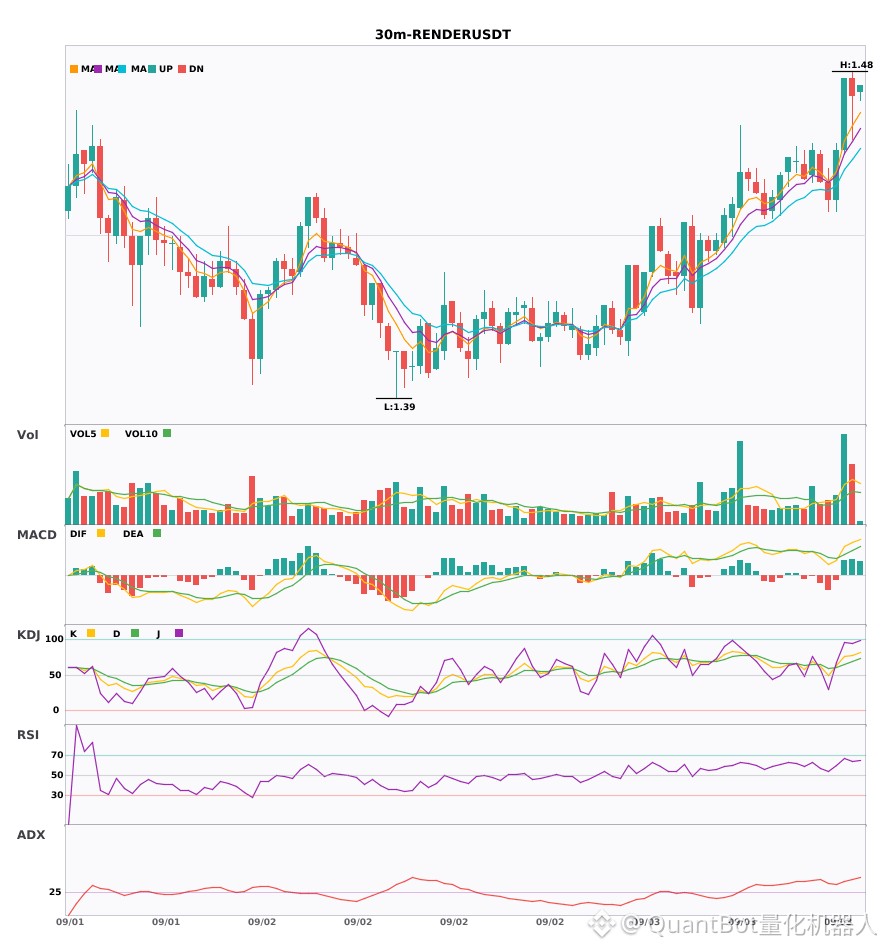
📈 $RENDER | 30-minute long signal
━━━━━━━━━━━━━━━━━━
Technical analysis: ADX(37) confirms a trend market. MACD forms a bullish crossover above the zero line, with bullish momentum continuously releasing. EMA5>8>13 forms a bullish alignment. KDJ operates in a strong zone (K 75.3/D 65.3). Trading volume expands to 3.2x, creating price-volume resonance.
Price change: 1.3800%
━━━━━━━━━━━━━━━━━━
#技术分析 #4 #ARM #RENDER
📌 The above content is for reference only and does not constitute investment advice
$4 $ARM $RENDER 30 minute-level technical resonance, who will break through first?
📈 $4 | 30-minute long signal
━━━━━━━━━━━━━━━━━━
Technical analysis: ADX rises to 27, the trend is established, and a buy entry is recommended. MACD forms a bullish crossover above the zero line, and bullish momentum strengthens. EMA5 crosses above EMA8, turning the short-term structure bullish. KDJ shows a bullish crossover, with K=51.5 and D=47.3, indicating short-term bullish bias. Trading volume expands by 2.4x and coordination is good.
Price change: 4.0200%
📈 $ARM | 30-minute long signal
━━━━━━━━━━━━━━━━━━
Technical analysis: ADX reaches 35, confirming a trend-following market. MACD-DIF crosses above the zero line, and bullish momentum is enhanced. EMA5 crosses above EMA8, strengthening the short-term trend. KDJ maintains a strong pattern (K72.6/D55.2). Trading volume significantly increases to 1.6x.
Price change: 1.9800%
📈 $RENDER | 30-minute long signal
━━━━━━━━━━━━━━━━━━
Technical analysis: ADX(37) confirms a trend market. MACD forms a bullish crossover above the zero line, with bullish momentum continuously releasing. EMA5>8>13 forms a bullish alignment. KDJ operates in a strong zone (K 75.3/D 65.3). Trading volume expands to 3.2x, creating price-volume resonance.
Price change: 1.3800%
━━━━━━━━━━━━━━━━━━
#技术分析 #4 #ARM #RENDER
📌 The above content is for reference only and does not constitute investment advice
📈 $4 | 30-minute long signal
━━━━━━━━━━━━━━━━━━
Technical analysis: ADX rises to 27, the trend is established, and a buy entry is recommended. MACD forms a bullish crossover above the zero line, and bullish momentum strengthens. EMA5 crosses above EMA8, turning the short-term structure bullish. KDJ shows a bullish crossover, with K=51.5 and D=47.3, indicating short-term bullish bias. Trading volume expands by 2.4x and coordination is good.
Price change: 4.0200%
📈 $ARM | 30-minute long signal
━━━━━━━━━━━━━━━━━━
Technical analysis: ADX reaches 35, confirming a trend-following market. MACD-DIF crosses above the zero line, and bullish momentum is enhanced. EMA5 crosses above EMA8, strengthening the short-term trend. KDJ maintains a strong pattern (K72.6/D55.2). Trading volume significantly increases to 1.6x.
Price change: 1.9800%
📈 $RENDER | 30-minute long signal
━━━━━━━━━━━━━━━━━━
Technical analysis: ADX(37) confirms a trend market. MACD forms a bullish crossover above the zero line, with bullish momentum continuously releasing. EMA5>8>13 forms a bullish alignment. KDJ operates in a strong zone (K 75.3/D 65.3). Trading volume expands to 3.2x, creating price-volume resonance.
Price change: 1.3800%
━━━━━━━━━━━━━━━━━━
#技术分析 #4 #ARM #RENDER
📌 The above content is for reference only and does not constitute investment advice
464
·
--
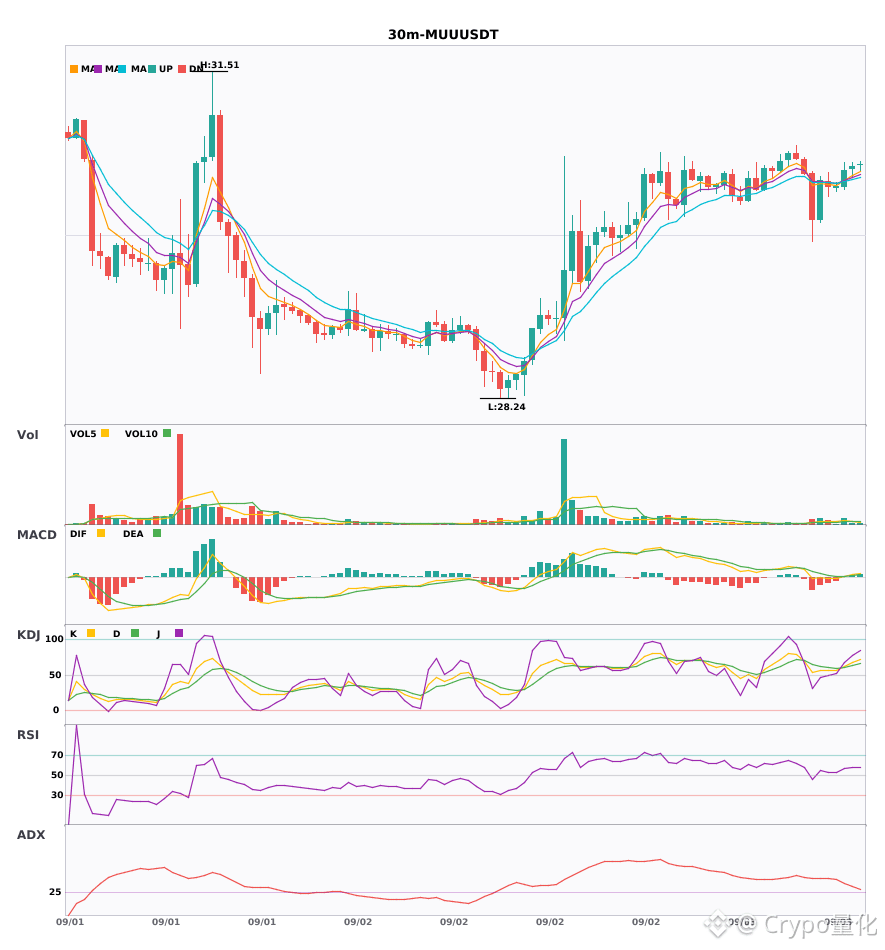
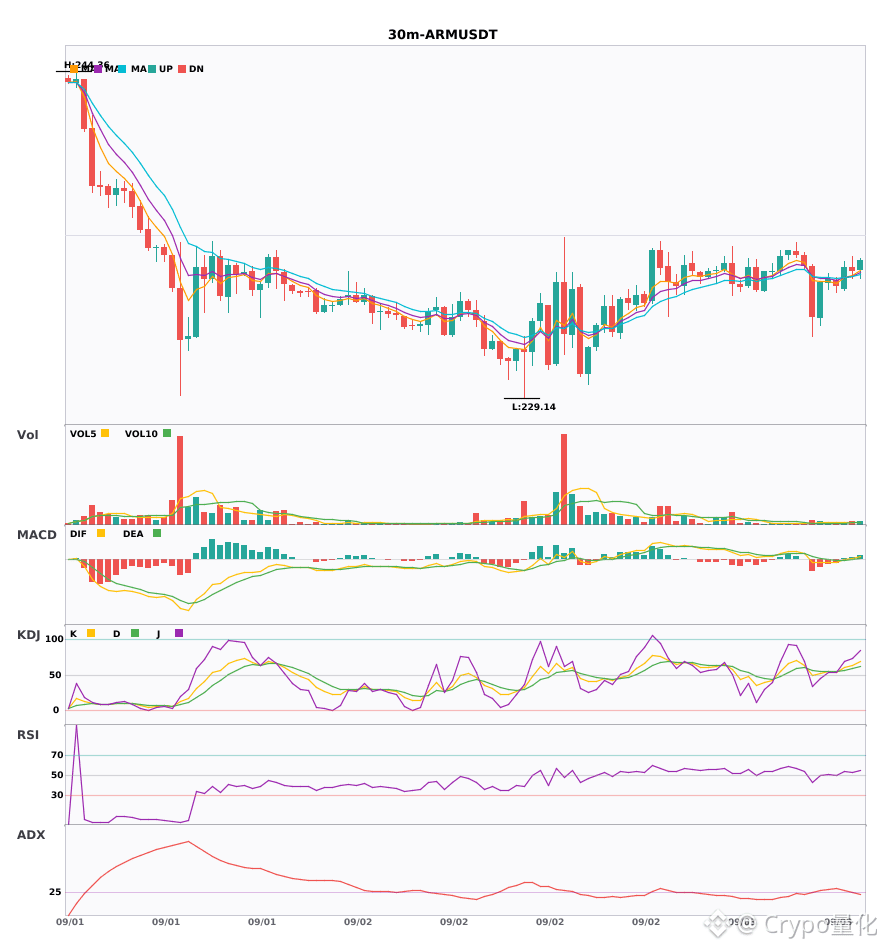
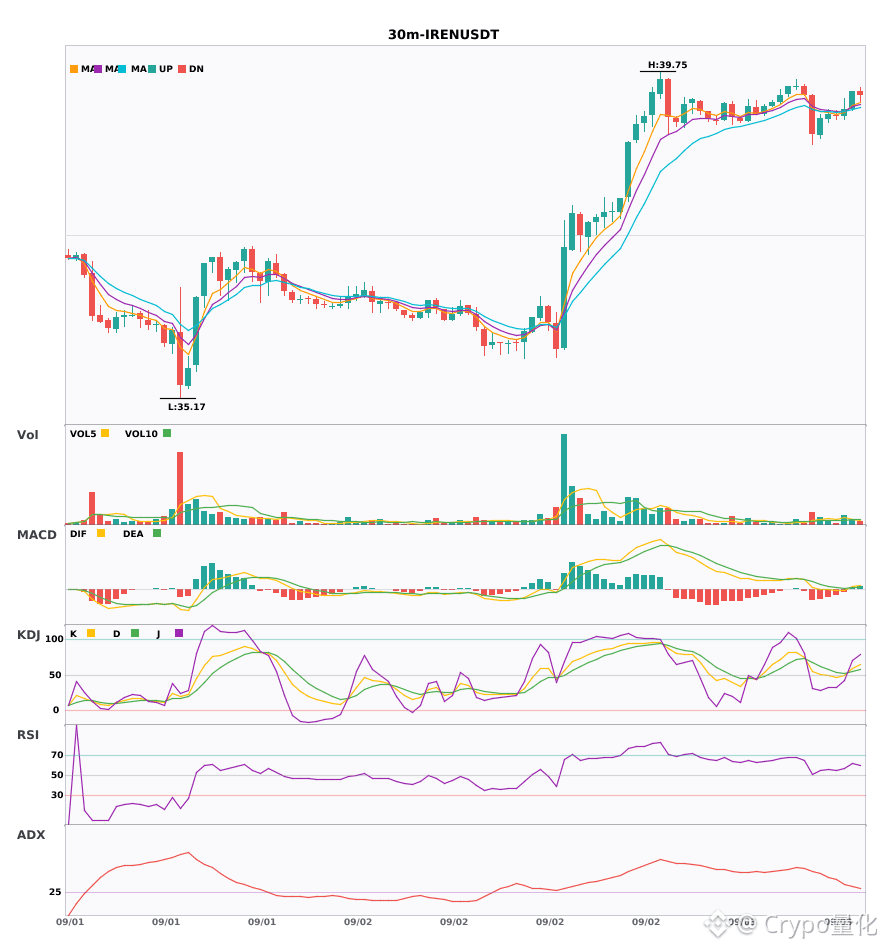
$MUU ARM IRE N 30-minute bullish alignment golden cross with increased volume—short-term resonance opportunities are here!🔥
════════════════════
🔴 $MUU 30-minute bullish signal
⚠️ Technicals: ADX shows 33, indicating the trend is strengthening clearly. MACD has just formed a golden cross above the zero line, and bullish momentum is starting to release. The moving averages (5, 8, 13) are bullishly aligned and diverging upward. KDJ is running strongly: K=67.8, not yet in the overbought zone. Volume has expanded by 2.1x, and the market can potentially move another leg.
════════════════════
🔴 $ARM 30-minute bullish signal
⚠️ Technicals: ADX is moving upward, suggesting the trend may be forming—worth keeping an eye on. MACD’s DIF has already pushed above the zero axis, showing bulls are gaining strength. The short-term moving average (5-day) has crossed above the 8-day line, and the near-term direction is also bullish. In KDJ, K=63 and D=59; it’s still trending up and hasn’t reached the overbought zone. Bullish strength is quite solid. Volume is also clearly expanding, up to 1.7x of normal, indicating capital is moving in.
════════════════════
🔴 $IREN 30-minute bullish signal
⚠️ Technicals: ADX=32, and the trend is clearly starting to show strength. MACD has a golden cross above the zero line; the red histogram is expanding, and bulls are beginning to push. The 5-day MA has crossed above the 8-day MA, with the short-term picture turning stronger. KDJ forms a golden cross: K=59.7, still not overbought. Volume has doubled to 2x, and volume-price action is cooperating well.
════════════════════
🔔 Follow to get first-hand updates on unusual market moves 🔔
#技术分析 #MUU #ARM #IREN
📌 When trading, pay attention to whether the candlestick patterns match
$MUU ARM IRE N 30-minute bullish alignment golden cross with increased volume—short-term resonance opportunities are here!🔥
════════════════════
🔴 $MUU 30-minute bullish signal
⚠️ Technicals: ADX shows 33, indicating the trend is strengthening clearly. MACD has just formed a golden cross above the zero line, and bullish momentum is starting to release. The moving averages (5, 8, 13) are bullishly aligned and diverging upward. KDJ is running strongly: K=67.8, not yet in the overbought zone. Volume has expanded by 2.1x, and the market can potentially move another leg.
════════════════════
🔴 $ARM 30-minute bullish signal
⚠️ Technicals: ADX is moving upward, suggesting the trend may be forming—worth keeping an eye on. MACD’s DIF has already pushed above the zero axis, showing bulls are gaining strength. The short-term moving average (5-day) has crossed above the 8-day line, and the near-term direction is also bullish. In KDJ, K=63 and D=59; it’s still trending up and hasn’t reached the overbought zone. Bullish strength is quite solid. Volume is also clearly expanding, up to 1.7x of normal, indicating capital is moving in.
════════════════════
🔴 $IREN 30-minute bullish signal
⚠️ Technicals: ADX=32, and the trend is clearly starting to show strength. MACD has a golden cross above the zero line; the red histogram is expanding, and bulls are beginning to push. The 5-day MA has crossed above the 8-day MA, with the short-term picture turning stronger. KDJ forms a golden cross: K=59.7, still not overbought. Volume has doubled to 2x, and volume-price action is cooperating well.
════════════════════
🔔 Follow to get first-hand updates on unusual market moves 🔔
#技术分析 #MUU #ARM #IREN
📌 When trading, pay attention to whether the candlestick patterns match
════════════════════
🔴 $MUU 30-minute bullish signal
⚠️ Technicals: ADX shows 33, indicating the trend is strengthening clearly. MACD has just formed a golden cross above the zero line, and bullish momentum is starting to release. The moving averages (5, 8, 13) are bullishly aligned and diverging upward. KDJ is running strongly: K=67.8, not yet in the overbought zone. Volume has expanded by 2.1x, and the market can potentially move another leg.
════════════════════
🔴 $ARM 30-minute bullish signal
⚠️ Technicals: ADX is moving upward, suggesting the trend may be forming—worth keeping an eye on. MACD’s DIF has already pushed above the zero axis, showing bulls are gaining strength. The short-term moving average (5-day) has crossed above the 8-day line, and the near-term direction is also bullish. In KDJ, K=63 and D=59; it’s still trending up and hasn’t reached the overbought zone. Bullish strength is quite solid. Volume is also clearly expanding, up to 1.7x of normal, indicating capital is moving in.
════════════════════
🔴 $IREN 30-minute bullish signal
⚠️ Technicals: ADX=32, and the trend is clearly starting to show strength. MACD has a golden cross above the zero line; the red histogram is expanding, and bulls are beginning to push. The 5-day MA has crossed above the 8-day MA, with the short-term picture turning stronger. KDJ forms a golden cross: K=59.7, still not overbought. Volume has doubled to 2x, and volume-price action is cooperating well.
════════════════════
🔔 Follow to get first-hand updates on unusual market moves 🔔
#技术分析 #MUU #ARM #IREN
📌 When trading, pay attention to whether the candlestick patterns match
54
·
--
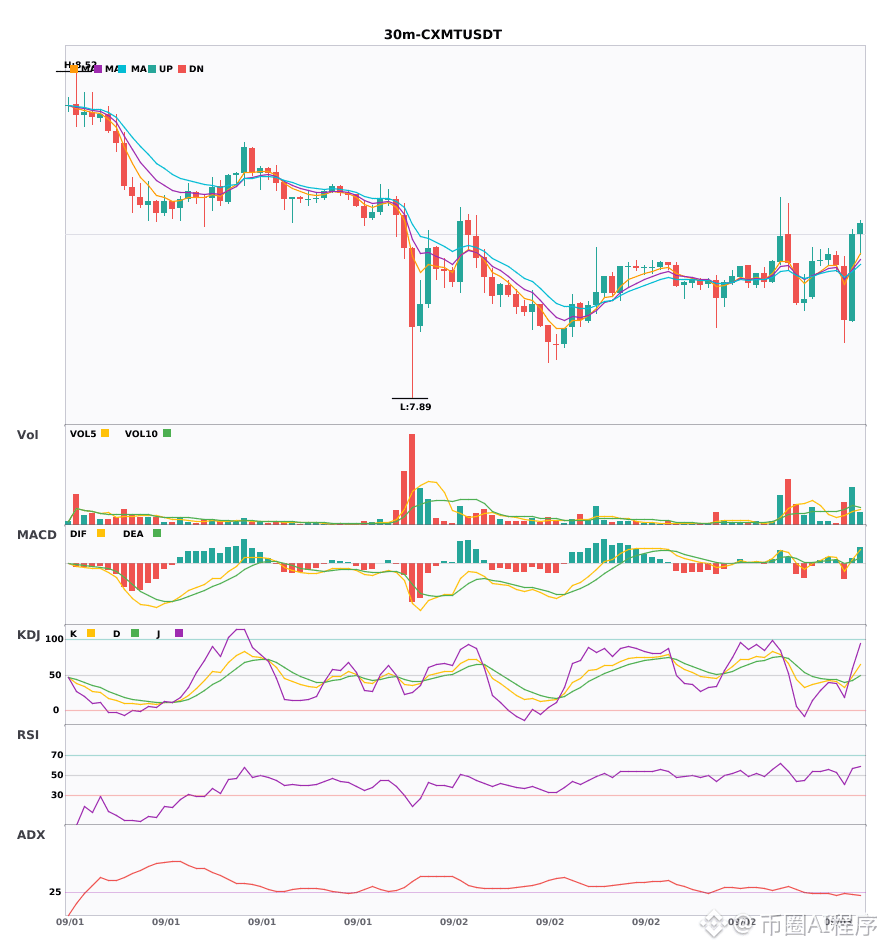
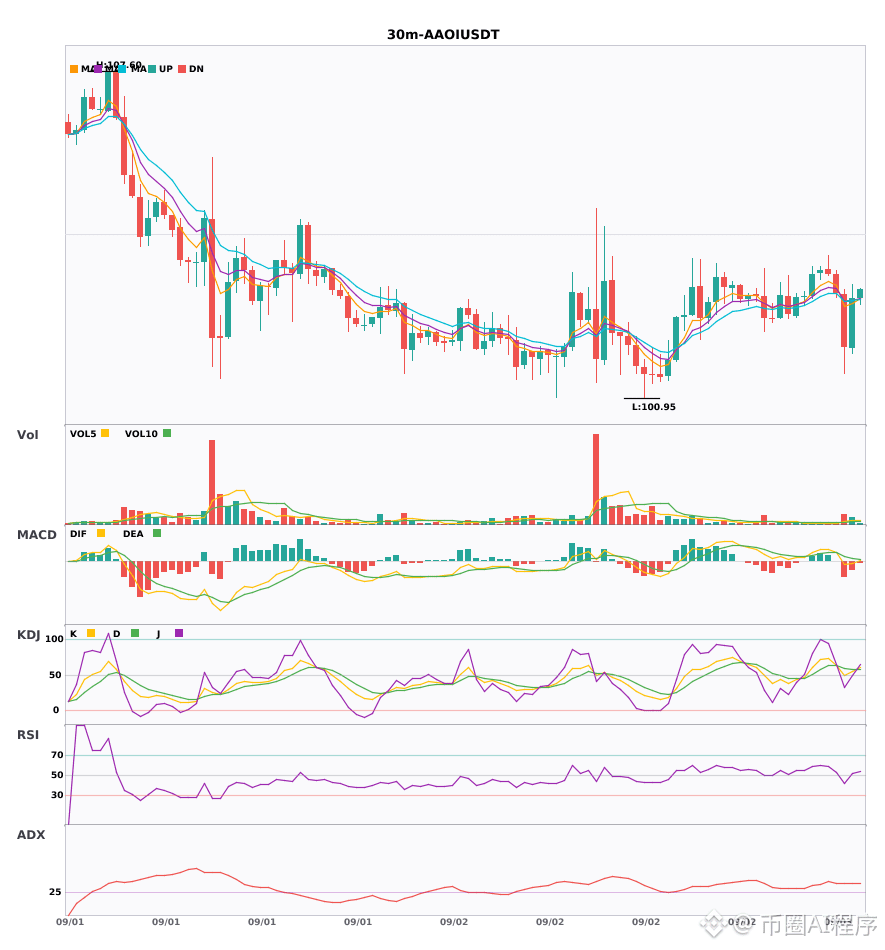
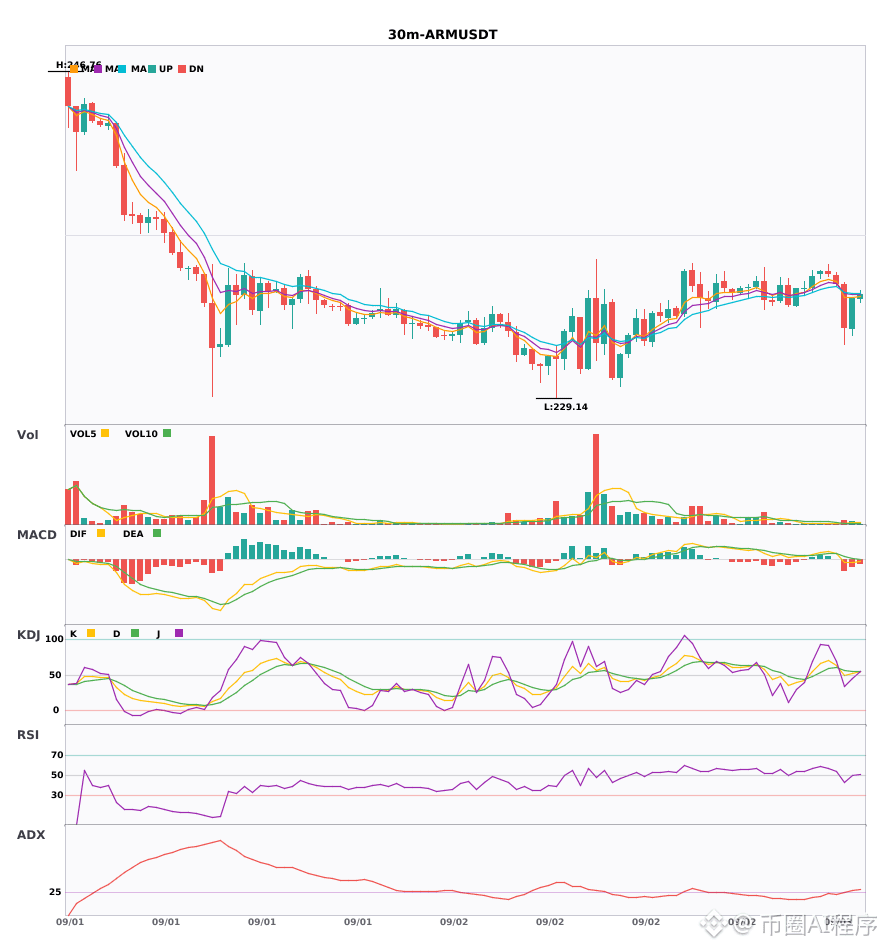
$CXMT and 30-minute MACD dead cross, 4-hour moving averages in bearish alignment🔥
════════════════════
🟢 $CXMT 30 minutes Bearish signal
⚠️ Technical analysis: The 4-hour trend is still bearish, and the 30-minute timeframe has followed as well. MACD is making a dead cross below zero, and the bearish momentum is accelerating. The short-term moving averages have already turned downward, and the KDJ is also weak—K is at 32 and hasn’t reclaimed above D. Multiple cycles are bearish at the same time; don’t rush to bottom-fish on any rebound.
════════════════════
🟢 $AAOI 30 minutes Bearish signal
⚠️ Technical analysis: The 4-hour bearish direction is confirmed, and the 30-minute has also dropped. MACD has broken below the zero line; the 5-day moving average has crossed below the 8-day moving average; KDJ is forming a dead cross. The volume on bearish candles has surged by more than 4x. Near-term outlook remains bearish.
════════════════════
🟢 $ARM 30 minutes Bearish signal
⚠️ Technical analysis: The 4-hour bearish trend is confirmed, and on the 30-minute chart the DIF has broken below the zero line. The 5-day moving average has crossed below the 8-day moving average. KDJ dead cross is around 49, and volume has increased by 2.5x. Short-term outlook remains bearish.
════════════════════
🔔 Pay attention to get real-time market anomalies first 🔔
#多周期共振 #CXMT #AAOI #ARM
📌 When trading, pay attention to whether the candlestick pattern matches
$CXMT and 30-minute MACD dead cross, 4-hour moving averages in bearish alignment🔥
════════════════════
🟢 $CXMT 30 minutes Bearish signal
⚠️ Technical analysis: The 4-hour trend is still bearish, and the 30-minute timeframe has followed as well. MACD is making a dead cross below zero, and the bearish momentum is accelerating. The short-term moving averages have already turned downward, and the KDJ is also weak—K is at 32 and hasn’t reclaimed above D. Multiple cycles are bearish at the same time; don’t rush to bottom-fish on any rebound.
════════════════════
🟢 $AAOI 30 minutes Bearish signal
⚠️ Technical analysis: The 4-hour bearish direction is confirmed, and the 30-minute has also dropped. MACD has broken below the zero line; the 5-day moving average has crossed below the 8-day moving average; KDJ is forming a dead cross. The volume on bearish candles has surged by more than 4x. Near-term outlook remains bearish.
════════════════════
🟢 $ARM 30 minutes Bearish signal
⚠️ Technical analysis: The 4-hour bearish trend is confirmed, and on the 30-minute chart the DIF has broken below the zero line. The 5-day moving average has crossed below the 8-day moving average. KDJ dead cross is around 49, and volume has increased by 2.5x. Short-term outlook remains bearish.
════════════════════
🔔 Pay attention to get real-time market anomalies first 🔔
#多周期共振 #CXMT #AAOI #ARM
📌 When trading, pay attention to whether the candlestick pattern matches
════════════════════
🟢 $CXMT 30 minutes Bearish signal
⚠️ Technical analysis: The 4-hour trend is still bearish, and the 30-minute timeframe has followed as well. MACD is making a dead cross below zero, and the bearish momentum is accelerating. The short-term moving averages have already turned downward, and the KDJ is also weak—K is at 32 and hasn’t reclaimed above D. Multiple cycles are bearish at the same time; don’t rush to bottom-fish on any rebound.
════════════════════
🟢 $AAOI 30 minutes Bearish signal
⚠️ Technical analysis: The 4-hour bearish direction is confirmed, and the 30-minute has also dropped. MACD has broken below the zero line; the 5-day moving average has crossed below the 8-day moving average; KDJ is forming a dead cross. The volume on bearish candles has surged by more than 4x. Near-term outlook remains bearish.
════════════════════
🟢 $ARM 30 minutes Bearish signal
⚠️ Technical analysis: The 4-hour bearish trend is confirmed, and on the 30-minute chart the DIF has broken below the zero line. The 5-day moving average has crossed below the 8-day moving average. KDJ dead cross is around 49, and volume has increased by 2.5x. Short-term outlook remains bearish.
════════════════════
🔔 Pay attention to get real-time market anomalies first 🔔
#多周期共振 #CXMT #AAOI #ARM
📌 When trading, pay attention to whether the candlestick pattern matches
11
·
--
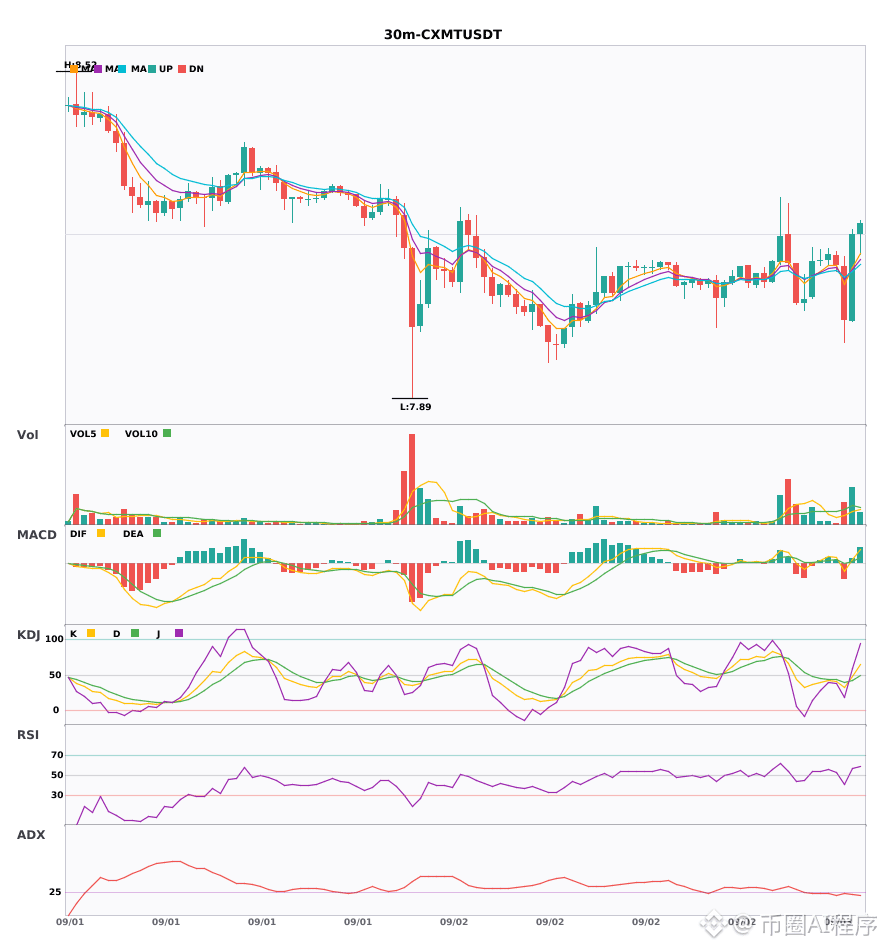
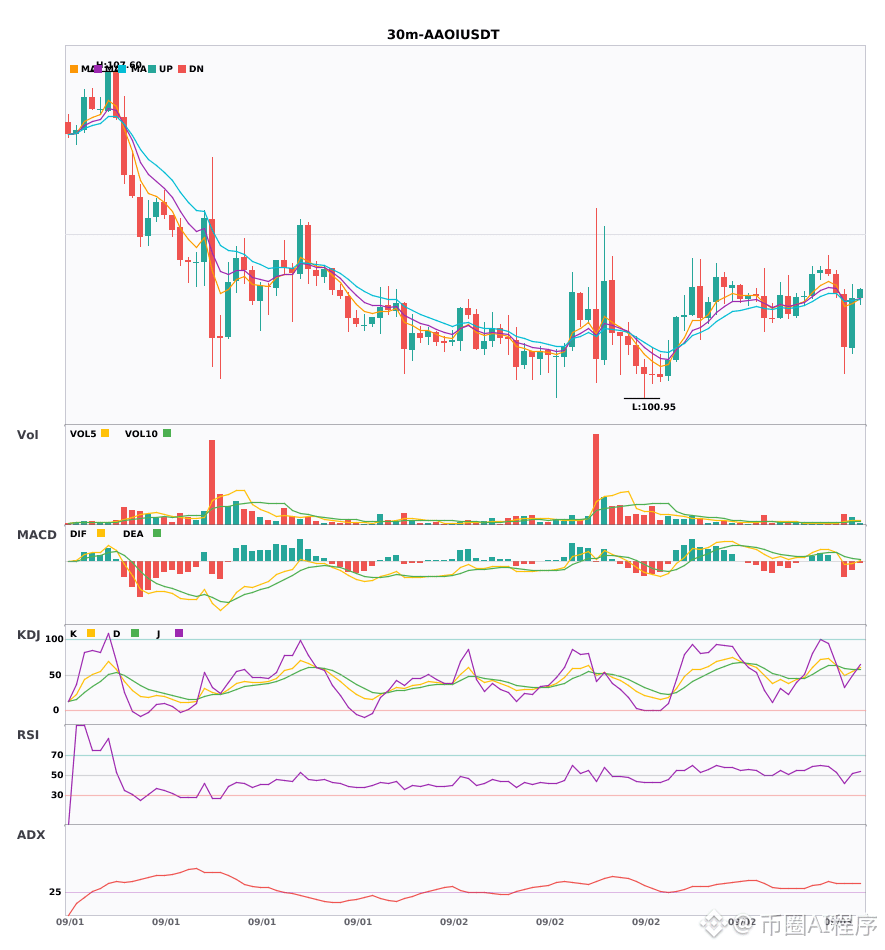
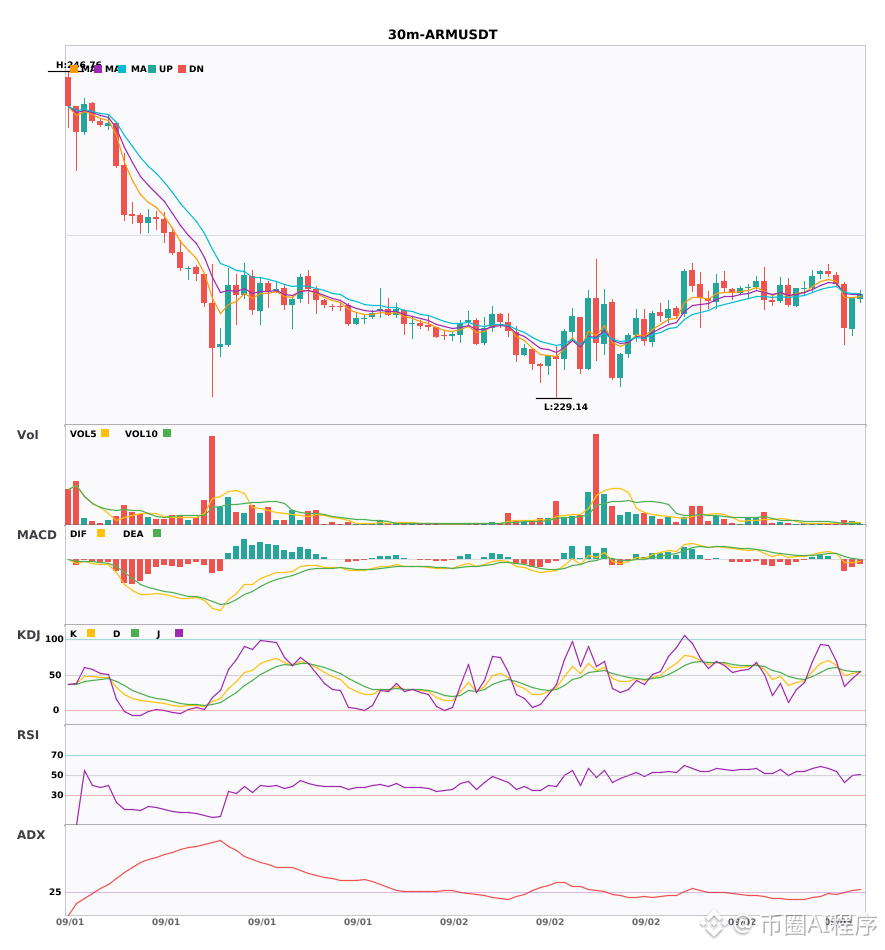
$CXMT $AAOI $ARM 30 minutes MACD bearish crossover, 4-hour moving averages in a bearish arrangement 🔥
════════════════════
🟢 $CXMT 30 minutes Bearish signal
⚠️ Technicals: The 4-hour trend is bearish; the 30-minute MACD is below zero with a high-volume death cross, and the green histogram has expanded. EMA5 has crossed below EMA8, indicating a bearish short-term move. KDJ is running in a weak range with bears holding the advantage. Volume is normal-to-slightly strong; multi-timeframe bearish resonance confirms.
════════════════════
🟢 $AAOI 30 minutes Bearish signal
⚠️ Technicals: Bearish confirmation on the 4-hour chart; the 30-minute MACD has broken below the zero line. The 5- and 8-period moving averages form a death cross, and the KDJ death cross is near 50. Volume expands by 4x, making the short-term bearish signal relatively strong.
════════════════════
🟢 $ARM 30 minutes Bearish signal
⚠️ Technicals: The 4-hour major direction is bearish confirmed, and the 30-minute timeframe is also resonating into bearishness. You can enter short: DIF has fallen below the zero line, moving averages are spreading downward after a death cross, and the KDJ death cross (K at 49) has not yet reached oversold. The move came with a 2.5x volume surge—price dropped hard. Follow the momentum and go short.
════════════════════
🔔 Watch for first-hand market moves and anomalies 🔔
#多周期共振 #CXMT #AAOI #ARM
📌 When trading, pay attention to whether the candlestick patterns match
$CXMT $AAOI $ARM 30 minutes MACD bearish crossover, 4-hour moving averages in a bearish arrangement 🔥
════════════════════
🟢 $CXMT 30 minutes Bearish signal
⚠️ Technicals: The 4-hour trend is bearish; the 30-minute MACD is below zero with a high-volume death cross, and the green histogram has expanded. EMA5 has crossed below EMA8, indicating a bearish short-term move. KDJ is running in a weak range with bears holding the advantage. Volume is normal-to-slightly strong; multi-timeframe bearish resonance confirms.
════════════════════
🟢 $AAOI 30 minutes Bearish signal
⚠️ Technicals: Bearish confirmation on the 4-hour chart; the 30-minute MACD has broken below the zero line. The 5- and 8-period moving averages form a death cross, and the KDJ death cross is near 50. Volume expands by 4x, making the short-term bearish signal relatively strong.
════════════════════
🟢 $ARM 30 minutes Bearish signal
⚠️ Technicals: The 4-hour major direction is bearish confirmed, and the 30-minute timeframe is also resonating into bearishness. You can enter short: DIF has fallen below the zero line, moving averages are spreading downward after a death cross, and the KDJ death cross (K at 49) has not yet reached oversold. The move came with a 2.5x volume surge—price dropped hard. Follow the momentum and go short.
════════════════════
🔔 Watch for first-hand market moves and anomalies 🔔
#多周期共振 #CXMT #AAOI #ARM
📌 When trading, pay attention to whether the candlestick patterns match
════════════════════
🟢 $CXMT 30 minutes Bearish signal
⚠️ Technicals: The 4-hour trend is bearish; the 30-minute MACD is below zero with a high-volume death cross, and the green histogram has expanded. EMA5 has crossed below EMA8, indicating a bearish short-term move. KDJ is running in a weak range with bears holding the advantage. Volume is normal-to-slightly strong; multi-timeframe bearish resonance confirms.
════════════════════
🟢 $AAOI 30 minutes Bearish signal
⚠️ Technicals: Bearish confirmation on the 4-hour chart; the 30-minute MACD has broken below the zero line. The 5- and 8-period moving averages form a death cross, and the KDJ death cross is near 50. Volume expands by 4x, making the short-term bearish signal relatively strong.
════════════════════
🟢 $ARM 30 minutes Bearish signal
⚠️ Technicals: The 4-hour major direction is bearish confirmed, and the 30-minute timeframe is also resonating into bearishness. You can enter short: DIF has fallen below the zero line, moving averages are spreading downward after a death cross, and the KDJ death cross (K at 49) has not yet reached oversold. The move came with a 2.5x volume surge—price dropped hard. Follow the momentum and go short.
════════════════════
🔔 Watch for first-hand market moves and anomalies 🔔
#多周期共振 #CXMT #AAOI #ARM
📌 When trading, pay attention to whether the candlestick patterns match
464
·
--
$ARM Over the past 24 hours, it has fallen nearly 5%, with a quoted price of 233.17. But the funding rate is still positive at 0.00002737, meaning longs are paying shorts.
This is a combination of a price drop with a positive funding rate—a typical structure of longs getting trapped and averaging down. From a Trump-trade perspective, the market may be pricing in in advance the potential policy risks to technology stocks and global supply chains if he takes office, especially the semiconductor sector. The open interest at 59963 has not fallen significantly, suggesting strong disagreement between longs and shorts: longs haven’t given up, but the funding rate continues to accumulate, adding to their costs.
The trigger conditions I’m watching are very clear: if the price breaks below the 233 level and open interest does not decline, I will short. That would mean the stubborn longs begin to buckle, potentially triggering a round of stop-loss selling. Conversely, if the price holds around here and rebounds, I would choose to stay on the sidelines and not participate in this long/short stalemate.
Trading tag: #TradFi #链上美股 #ARM
Where do you think this outlook is most likely to be wrong?
$ARM Over the past 24 hours, it has fallen nearly 5%, with a quoted price of 233.17. But the funding rate is still positive at 0.00002737, meaning longs are paying shorts.
This is a combination of a price drop with a positive funding rate—a typical structure of longs getting trapped and averaging down. From a Trump-trade perspective, the market may be pricing in in advance the potential policy risks to technology stocks and global supply chains if he takes office, especially the semiconductor sector. The open interest at 59963 has not fallen significantly, suggesting strong disagreement between longs and shorts: longs haven’t given up, but the funding rate continues to accumulate, adding to their costs.
The trigger conditions I’m watching are very clear: if the price breaks below the 233 level and open interest does not decline, I will short. That would mean the stubborn longs begin to buckle, potentially triggering a round of stop-loss selling. Conversely, if the price holds around here and rebounds, I would choose to stay on the sidelines and not participate in this long/short stalemate.
Trading tag: #TradFi #链上美股 #ARM
Where do you think this outlook is most likely to be wrong?
This is a combination of a price drop with a positive funding rate—a typical structure of longs getting trapped and averaging down. From a Trump-trade perspective, the market may be pricing in in advance the potential policy risks to technology stocks and global supply chains if he takes office, especially the semiconductor sector. The open interest at 59963 has not fallen significantly, suggesting strong disagreement between longs and shorts: longs haven’t given up, but the funding rate continues to accumulate, adding to their costs.
The trigger conditions I’m watching are very clear: if the price breaks below the 233 level and open interest does not decline, I will short. That would mean the stubborn longs begin to buckle, potentially triggering a round of stop-loss selling. Conversely, if the price holds around here and rebounds, I would choose to stay on the sidelines and not participate in this long/short stalemate.
Trading tag: #TradFi #链上美股 #ARM
Where do you think this outlook is most likely to be wrong?
44
Log in to explore more content
Join global crypto users on Binance Square
⚡️ Get latest and useful information about crypto.
💬 Trusted by the world’s largest crypto exchange.
👍 Discover real insights from verified creators.
Email / Phone number
Trending Topics
1
#USAugustPPIRisesLessThanExpected
43,450 views
768 Discussing
2
#SECApprovesNasdaqTexasCommodityTrustRule
24,739 views
560 Discussing
3
#ECBRaisesRatesSecondTimeTo2.5%
22,334 views
406 Discussing
4
#USContinuingJoblessClaims1.774M
29,067 views
501 Discussing
5
#USAugustPPIYoYRisesTo5.4%
29,667 views
387 Discussing
6
#AppleDebutsFoldablePhone
106,104 views
1,519 Discussing
7
#TSMCAugustRevenueUp53.3%YoY
26,158 views
551 Discussing
8
#IranSaysReadyToEscalateWarWithUS
37,485 views
534 Discussing
9
#EUExtendsCentralContactPointToCASPs
32,276 views
546 Discussing
10
#US10YTreasuryYieldHitsHighestSinceNov2023
69,234 views
849 Discussing