
#aave
aave
7.2M views
29,589 Discussing
Hot
Latest

AAVE is today's green coin in a red market 📈
$AAVE ~$112.60, up +4.4% today — the strongest DeFi name while BTC just sits flat near $64,600. It has bounced ~16% off its Nov 15 low of $96.60, and DeFi was the strongest sector today.
Levels: resistance $114.88, then $119.21. Support $104.51, then $96.60. RSI ~40 — recovering, not overheated yet.
Still down ~25% this month, so this is a bounce, not a trend flip. But for one day, the lenders are leading.
Not financial advice. DYOR.
#AAVE #DeFi #Crypto
AAVE is today's green coin in a red market 📈
$AAVE ~$112.60, up +4.4% today — the strongest DeFi name while BTC just sits flat near $64,600. It has bounced ~16% off its Nov 15 low of $96.60, and DeFi was the strongest sector today.
Levels: resistance $114.88, then $119.21. Support $104.51, then $96.60. RSI ~40 — recovering, not overheated yet.
Still down ~25% this month, so this is a bounce, not a trend flip. But for one day, the lenders are leading.
Not financial advice. DYOR.
#AAVE #DeFi #Crypto
$AAVE ~$112.60, up +4.4% today — the strongest DeFi name while BTC just sits flat near $64,600. It has bounced ~16% off its Nov 15 low of $96.60, and DeFi was the strongest sector today.
Levels: resistance $114.88, then $119.21. Support $104.51, then $96.60. RSI ~40 — recovering, not overheated yet.
Still down ~25% this month, so this is a bounce, not a trend flip. But for one day, the lenders are leading.
Not financial advice. DYOR.
#AAVE #DeFi #Crypto
6

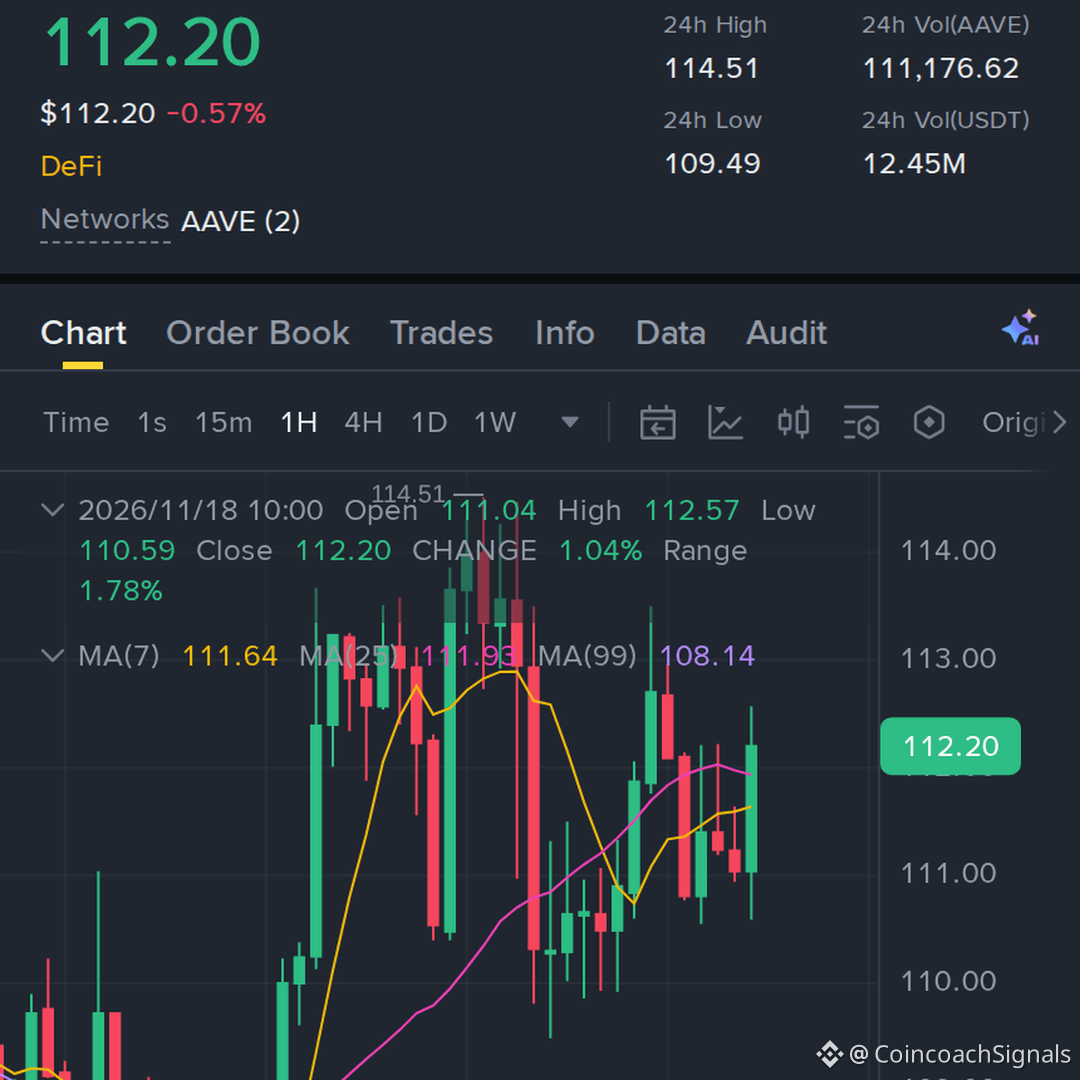

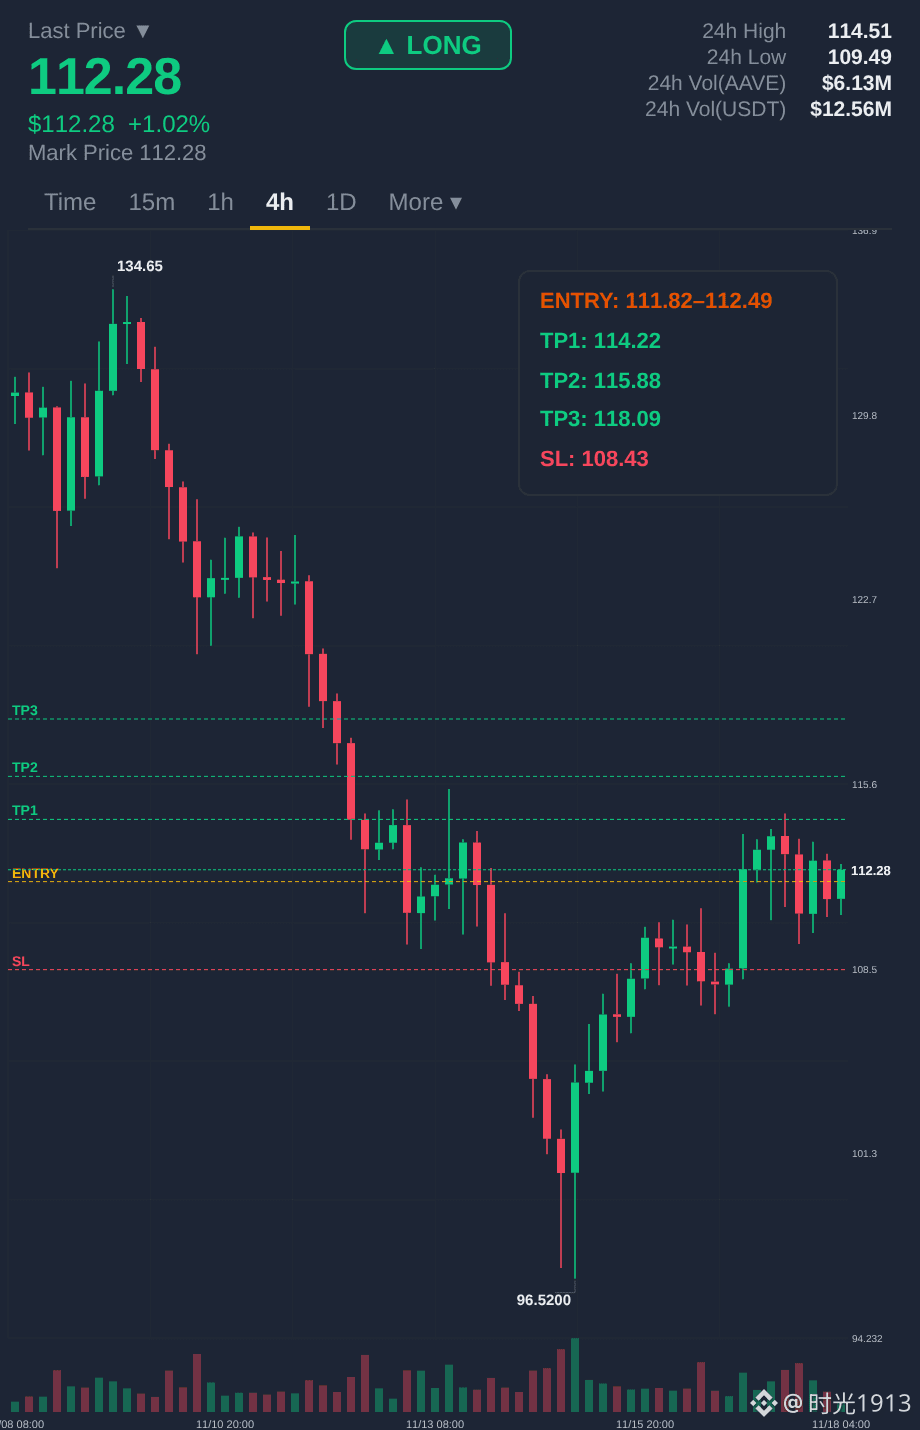
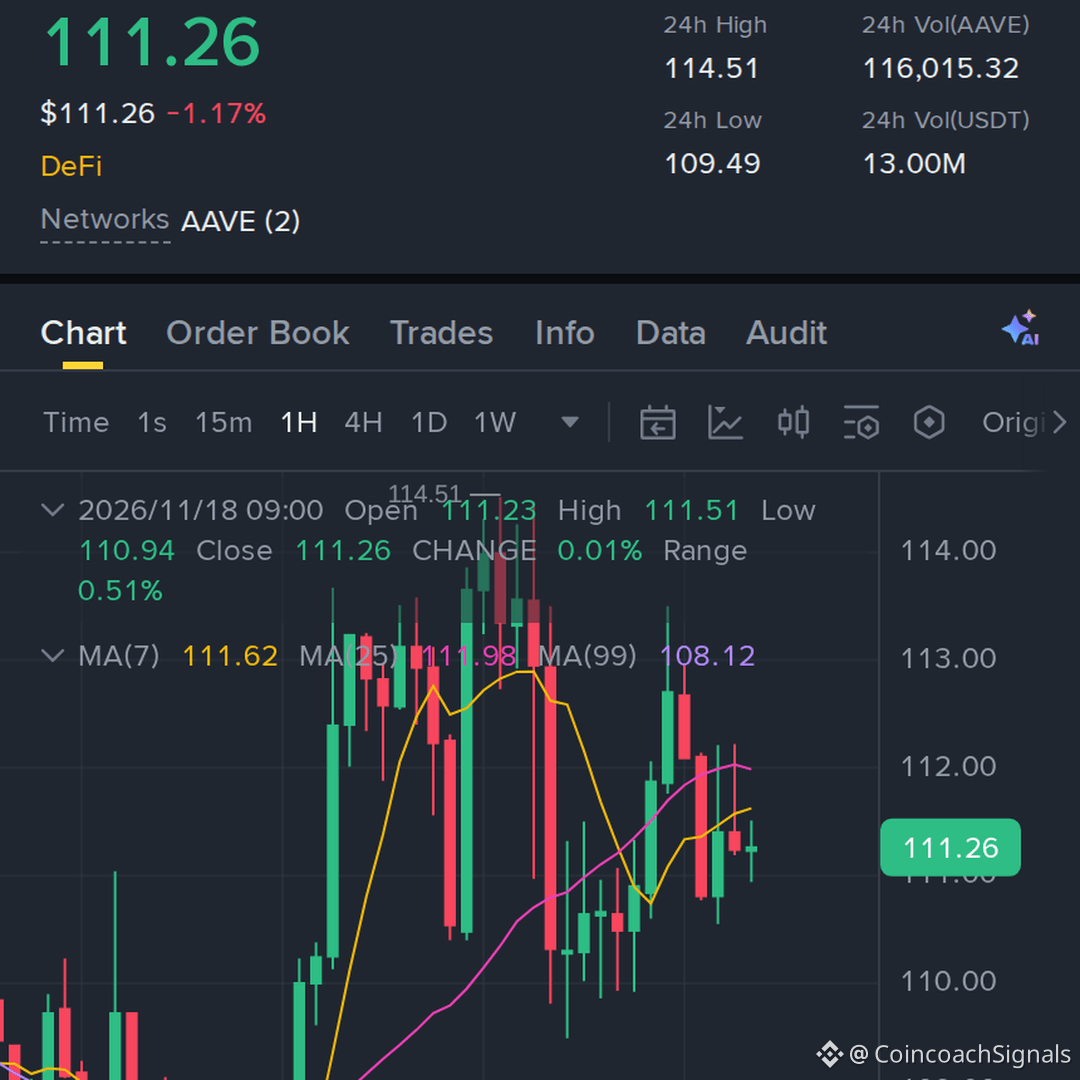

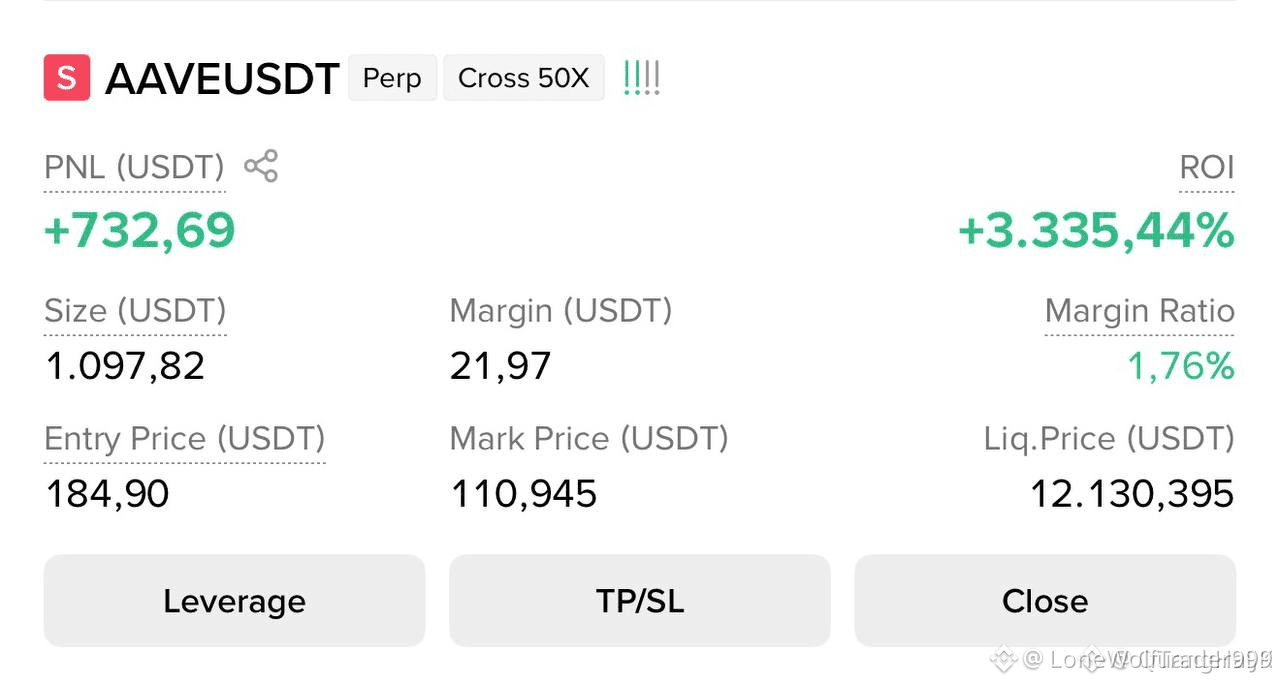
📉 $AAVE FUNDAMENTALS CRACK AS PROTOCOL REVENUE CONTRACTS HARD IN Q3! ⚠️
Entry: 113 - 136 ⚡
Target: 108, 98, 90 🚀
Stop Loss: 145 ⚠️
The lending spreads are tightening and protocol revenue just took a brutal 36.6% hit down to $17.29M in Q3. When underlying cash flows dry up like this, institutional bids evaporate and distribution takes over the order book. 📊
Sellers are leaning hard into every minor relief bounce, treating higher timeframes as prime inventory to unload heavy bags. Momentum indicators confirm the distribution phase is fully underway across major order blocks. ⚡
💬 Are you positioning for the deeper flush toward lower support or waiting for a retest of the upper boundary? 👇
⚠️ Not financial advice. Always manage your risk. 🛡️
🏷️ #AAVE #ShortSetup #DeFi #Bearish #Crypto
📉 🦈
📉 $AAVE FUNDAMENTALS CRACK AS PROTOCOL REVENUE CONTRACTS HARD IN Q3! ⚠️
Entry: 113 - 136 ⚡
Target: 108, 98, 90 🚀
Stop Loss: 145 ⚠️
The lending spreads are tightening and protocol revenue just took a brutal 36.6% hit down to $17.29M in Q3. When underlying cash flows dry up like this, institutional bids evaporate and distribution takes over the order book. 📊
Sellers are leaning hard into every minor relief bounce, treating higher timeframes as prime inventory to unload heavy bags. Momentum indicators confirm the distribution phase is fully underway across major order blocks. ⚡
💬 Are you positioning for the deeper flush toward lower support or waiting for a retest of the upper boundary? 👇
⚠️ Not financial advice. Always manage your risk. 🛡️
🏷️ #AAVE #ShortSetup #DeFi #Bearish #Crypto
📉 🦈
Entry: 113 - 136 ⚡
Target: 108, 98, 90 🚀
Stop Loss: 145 ⚠️
The lending spreads are tightening and protocol revenue just took a brutal 36.6% hit down to $17.29M in Q3. When underlying cash flows dry up like this, institutional bids evaporate and distribution takes over the order book. 📊
Sellers are leaning hard into every minor relief bounce, treating higher timeframes as prime inventory to unload heavy bags. Momentum indicators confirm the distribution phase is fully underway across major order blocks. ⚡
💬 Are you positioning for the deeper flush toward lower support or waiting for a retest of the upper boundary? 👇
⚠️ Not financial advice. Always manage your risk. 🛡️
🏷️ #AAVE #ShortSetup #DeFi #Bearish #Crypto
📉 🦈
3

🐻 $AAVE FACING HEAVY SELLING PRESSURE AS FUNDAMENTALS WEAKEN ACROSS LENDING MARKETS 📉
Entry: 113 - 136 ⚡
Target: 90 🚀
Stop Loss: 145 ⚠️
Smart money is capitalizing on structural weakness as Q3 protocol revenue plummeted 36.6% down to $17.29 million due to thinning lending spreads. 📊 This fundamental contraction exposes deteriorating underlying cash flows that fail to justify previous valuations. 📉
Price action is currently rejecting the upper distribution zone, setting up a clean institutional short continuation toward deeper liquidity pockets. ⚡ Are you scaling into this bearish retest or waiting for a confirmed breakdown below local support? 💬
⚠️ Not financial advice. Always manage your risk. 🛡️
🏷️ #AAVE #ShortSetup #DeFi #MarketStructure #Crypto
🦈 ⚖️
🐻 $AAVE FACING HEAVY SELLING PRESSURE AS FUNDAMENTALS WEAKEN ACROSS LENDING MARKETS 📉
Entry: 113 - 136 ⚡
Target: 90 🚀
Stop Loss: 145 ⚠️
Smart money is capitalizing on structural weakness as Q3 protocol revenue plummeted 36.6% down to $17.29 million due to thinning lending spreads. 📊 This fundamental contraction exposes deteriorating underlying cash flows that fail to justify previous valuations. 📉
Price action is currently rejecting the upper distribution zone, setting up a clean institutional short continuation toward deeper liquidity pockets. ⚡ Are you scaling into this bearish retest or waiting for a confirmed breakdown below local support? 💬
⚠️ Not financial advice. Always manage your risk. 🛡️
🏷️ #AAVE #ShortSetup #DeFi #MarketStructure #Crypto
🦈 ⚖️
Entry: 113 - 136 ⚡
Target: 90 🚀
Stop Loss: 145 ⚠️
Smart money is capitalizing on structural weakness as Q3 protocol revenue plummeted 36.6% down to $17.29 million due to thinning lending spreads. 📊 This fundamental contraction exposes deteriorating underlying cash flows that fail to justify previous valuations. 📉
Price action is currently rejecting the upper distribution zone, setting up a clean institutional short continuation toward deeper liquidity pockets. ⚡ Are you scaling into this bearish retest or waiting for a confirmed breakdown below local support? 💬
⚠️ Not financial advice. Always manage your risk. 🛡️
🏷️ #AAVE #ShortSetup #DeFi #MarketStructure #Crypto
🦈 ⚖️
7

·
--
Bullish
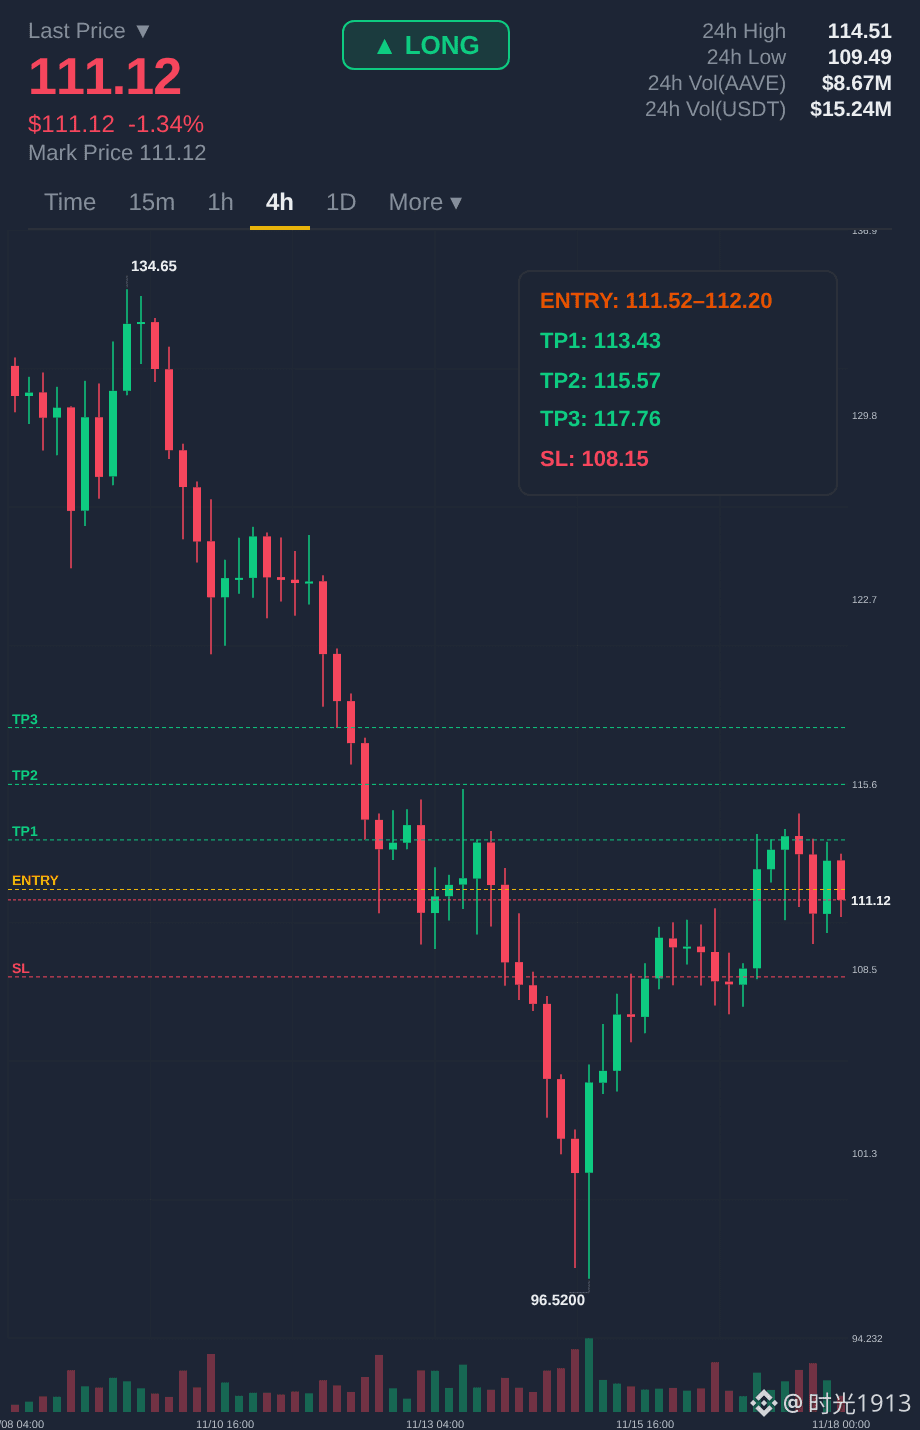
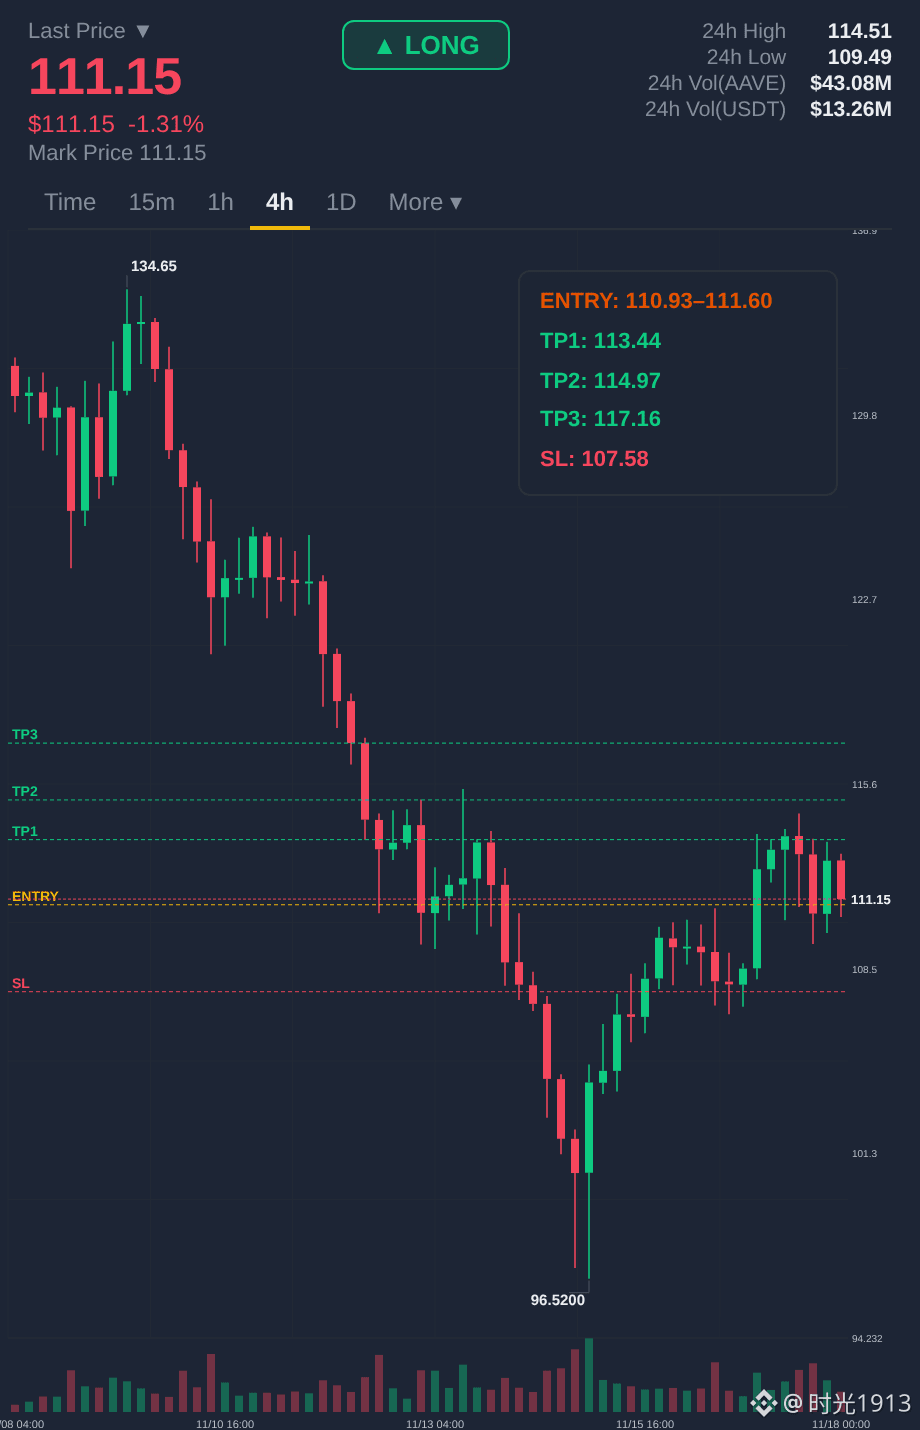
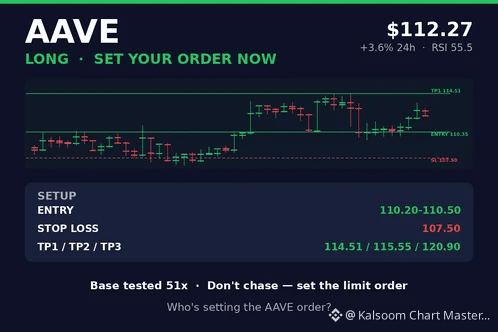
🔥 $AAVE is $112.27 — and the entry is $110.35. Set your order NOW.
AAVE is climbing with the market — $15.1M volume, RSI 55.5 (not hot yet), above both EMAs, and hourly closes rising all day: $110.49 → $112.70.
Why $110.35 is the entry: it's the EMA50 zone, sitting just above the $108.16 base that was tested 51 times in 48 hours. That base is the floor. A pullback there is a buy, not a breakdown.
Roadmap:
$108.16 base → $110.35 entry → $112.27 → $114.51 → $115.55 → $120.90
🟢 LONG — $AAVE (on pullback)
Entry: $110.20 – $110.50
SL: $107.50
TP1: $114.51 | TP2: $115.55 | TP3: $120.90
⚠️ Don't chase at $112.27 — set the limit order at $110.35 and let price come to you. If $108.16 breaks, the setup fails.
Receipts: our calls overnight — SOL TP2 $75, BREV TP2 $0.1200, MMT full TP3, ZEC TP1.
Who's setting the AAVE order? 🤔
#AAVE #DeFi
NFA — This is not financial advice, DYOR.
🔥 $AAVE is $112.27 — and the entry is $110.35. Set your order NOW.
AAVE is climbing with the market — $15.1M volume, RSI 55.5 (not hot yet), above both EMAs, and hourly closes rising all day: $110.49 → $112.70.
Why $110.35 is the entry: it's the EMA50 zone, sitting just above the $108.16 base that was tested 51 times in 48 hours. That base is the floor. A pullback there is a buy, not a breakdown.
Roadmap:
$108.16 base → $110.35 entry → $112.27 → $114.51 → $115.55 → $120.90
🟢 LONG — $AAVE (on pullback)
Entry: $110.20 – $110.50
SL: $107.50
TP1: $114.51 | TP2: $115.55 | TP3: $120.90
⚠️ Don't chase at $112.27 — set the limit order at $110.35 and let price come to you. If $108.16 breaks, the setup fails.
Receipts: our calls overnight — SOL TP2 $75, BREV TP2 $0.1200, MMT full TP3, ZEC TP1.
Who's setting the AAVE order? 🤔
#AAVE #DeFi
NFA — This is not financial advice, DYOR.
AAVE is climbing with the market — $15.1M volume, RSI 55.5 (not hot yet), above both EMAs, and hourly closes rising all day: $110.49 → $112.70.
Why $110.35 is the entry: it's the EMA50 zone, sitting just above the $108.16 base that was tested 51 times in 48 hours. That base is the floor. A pullback there is a buy, not a breakdown.
Roadmap:
$108.16 base → $110.35 entry → $112.27 → $114.51 → $115.55 → $120.90
🟢 LONG — $AAVE (on pullback)
Entry: $110.20 – $110.50
SL: $107.50
TP1: $114.51 | TP2: $115.55 | TP3: $120.90
⚠️ Don't chase at $112.27 — set the limit order at $110.35 and let price come to you. If $108.16 breaks, the setup fails.
Receipts: our calls overnight — SOL TP2 $75, BREV TP2 $0.1200, MMT full TP3, ZEC TP1.
Who's setting the AAVE order? 🤔
#AAVE #DeFi
NFA — This is not financial advice, DYOR.
43
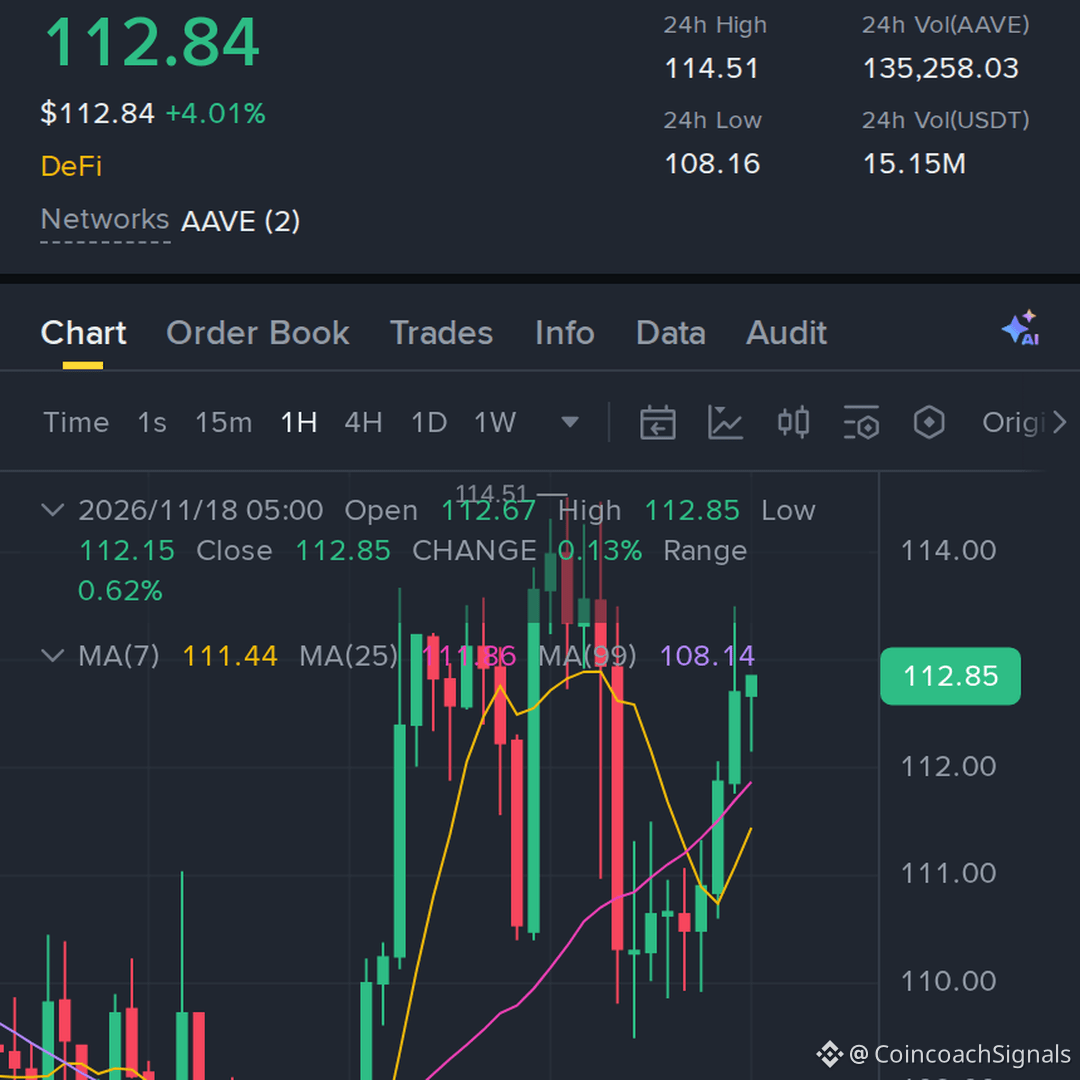

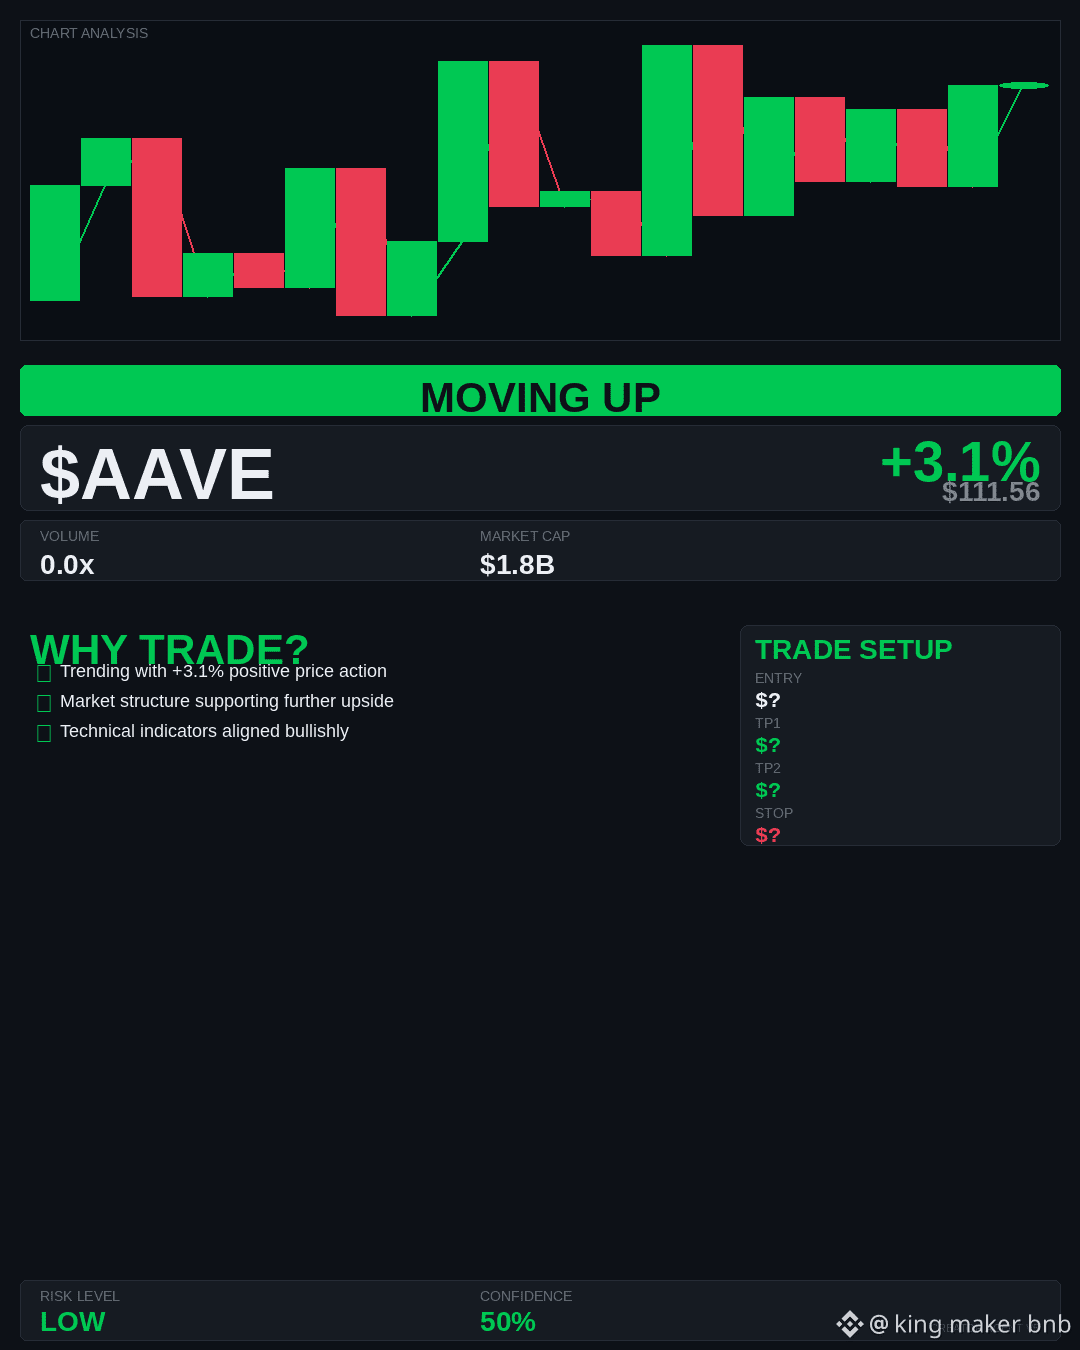
$AAVE is quietly pushing up, gaining 3.1% in 24 hours. 📈
This move on AAVE could be signaling a bigger play in the DeFi sector.
My eyes are on $AAVE for an entry around $110-$111. First target at $115, aiming for a second push to $120. Set your stop loss tight at $108 to manage risk. The timing is crucial here; the DeFi narrative is generating real buzz on Binance Square, making this a prime moment. Watch closely for volume confirmation to sustain this upward momentum.
#AAVE #Write2Earn #DeFi #Altcoins
$AAVE is quietly pushing up, gaining 3.1% in 24 hours. 📈
This move on AAVE could be signaling a bigger play in the DeFi sector.
My eyes are on $AAVE for an entry around $110-$111. First target at $115, aiming for a second push to $120. Set your stop loss tight at $108 to manage risk. The timing is crucial here; the DeFi narrative is generating real buzz on Binance Square, making this a prime moment. Watch closely for volume confirmation to sustain this upward momentum.
#AAVE #Write2Earn #DeFi #Altcoins
This move on AAVE could be signaling a bigger play in the DeFi sector.
My eyes are on $AAVE for an entry around $110-$111. First target at $115, aiming for a second push to $120. Set your stop loss tight at $108 to manage risk. The timing is crucial here; the DeFi narrative is generating real buzz on Binance Square, making this a prime moment. Watch closely for volume confirmation to sustain this upward momentum.
#AAVE #Write2Earn #DeFi #Altcoins
89

·
--
🚨 IS $AAVE THE NEXT BIG DEFI OPPORTUNITY? 👀🔥
While many traders are chasing short-term pumps, smart investors are watching projects with strong fundamentals. And $AAVE deserves attention!
{spot}(AAVEUSDT)
💎 Strong DeFi fundamentals
⚡ Continuous ecosystem development
🌍 Expanding DeFi utility
📈 Long-term potential worth watching
But here's the real question: Can AAVE surprise the market with its next major move?
I'm keeping $AAVE on my watchlist. No blind hype — fundamentals and execution matter! 🚀
👇 LET'S TALK!
Are you: 🔥 BULLISH on $AAVE
🐻 BEARISH on $AAVE
👀 WAITING for a better entry?
Drop your opinion below! Let's see how strong the AAVE community is!
#AAVE #DeFi #Crypto #Altcoins #BinanceSquare
🚨 IS $AAVE THE NEXT BIG DEFI OPPORTUNITY? 👀🔥
While many traders are chasing short-term pumps, smart investors are watching projects with strong fundamentals. And $AAVE deserves attention!
💎 Strong DeFi fundamentals
⚡ Continuous ecosystem development
🌍 Expanding DeFi utility
📈 Long-term potential worth watching
But here's the real question: Can AAVE surprise the market with its next major move?
I'm keeping $AAVE on my watchlist. No blind hype — fundamentals and execution matter! 🚀
👇 LET'S TALK!
Are you: 🔥 BULLISH on $AAVE
🐻 BEARISH on $AAVE
👀 WAITING for a better entry?
Drop your opinion below! Let's see how strong the AAVE community is!
#AAVE #DeFi #Crypto #Altcoins #BinanceSquare
While many traders are chasing short-term pumps, smart investors are watching projects with strong fundamentals. And $AAVE deserves attention!
💎 Strong DeFi fundamentals
⚡ Continuous ecosystem development
🌍 Expanding DeFi utility
📈 Long-term potential worth watching
But here's the real question: Can AAVE surprise the market with its next major move?
I'm keeping $AAVE on my watchlist. No blind hype — fundamentals and execution matter! 🚀
👇 LET'S TALK!
Are you: 🔥 BULLISH on $AAVE
🐻 BEARISH on $AAVE
👀 WAITING for a better entry?
Drop your opinion below! Let's see how strong the AAVE community is!
#AAVE #DeFi #Crypto #Altcoins #BinanceSquare
4


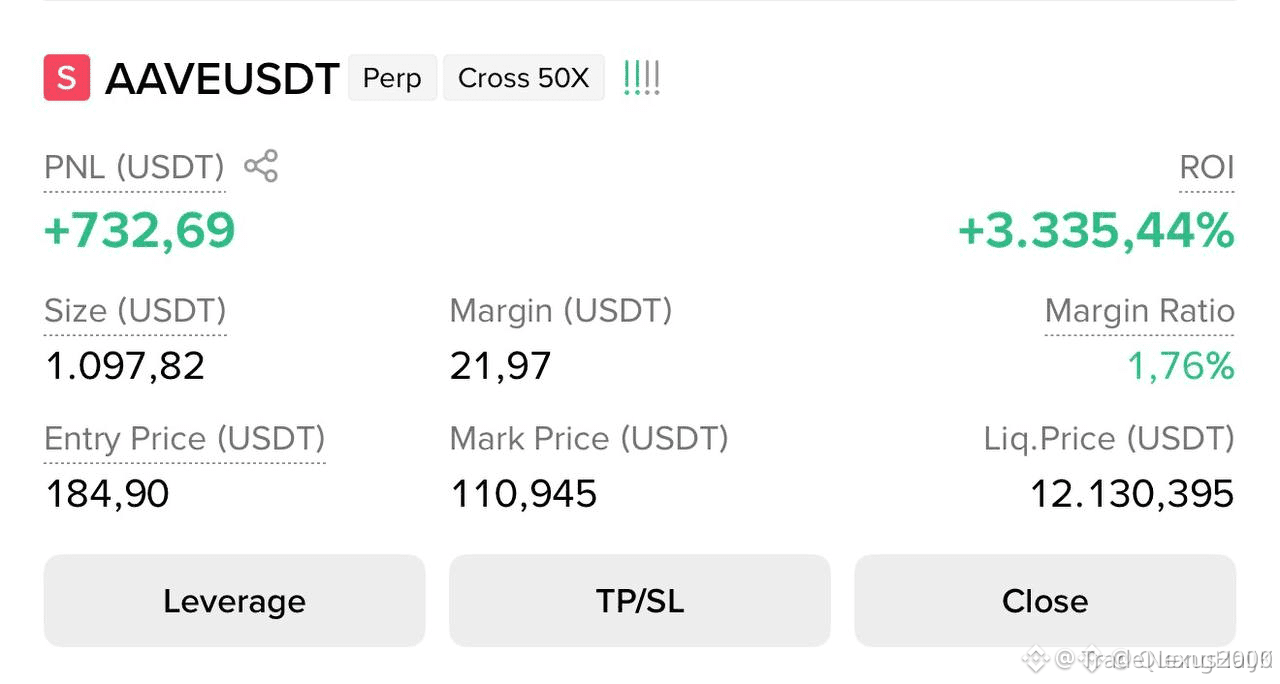
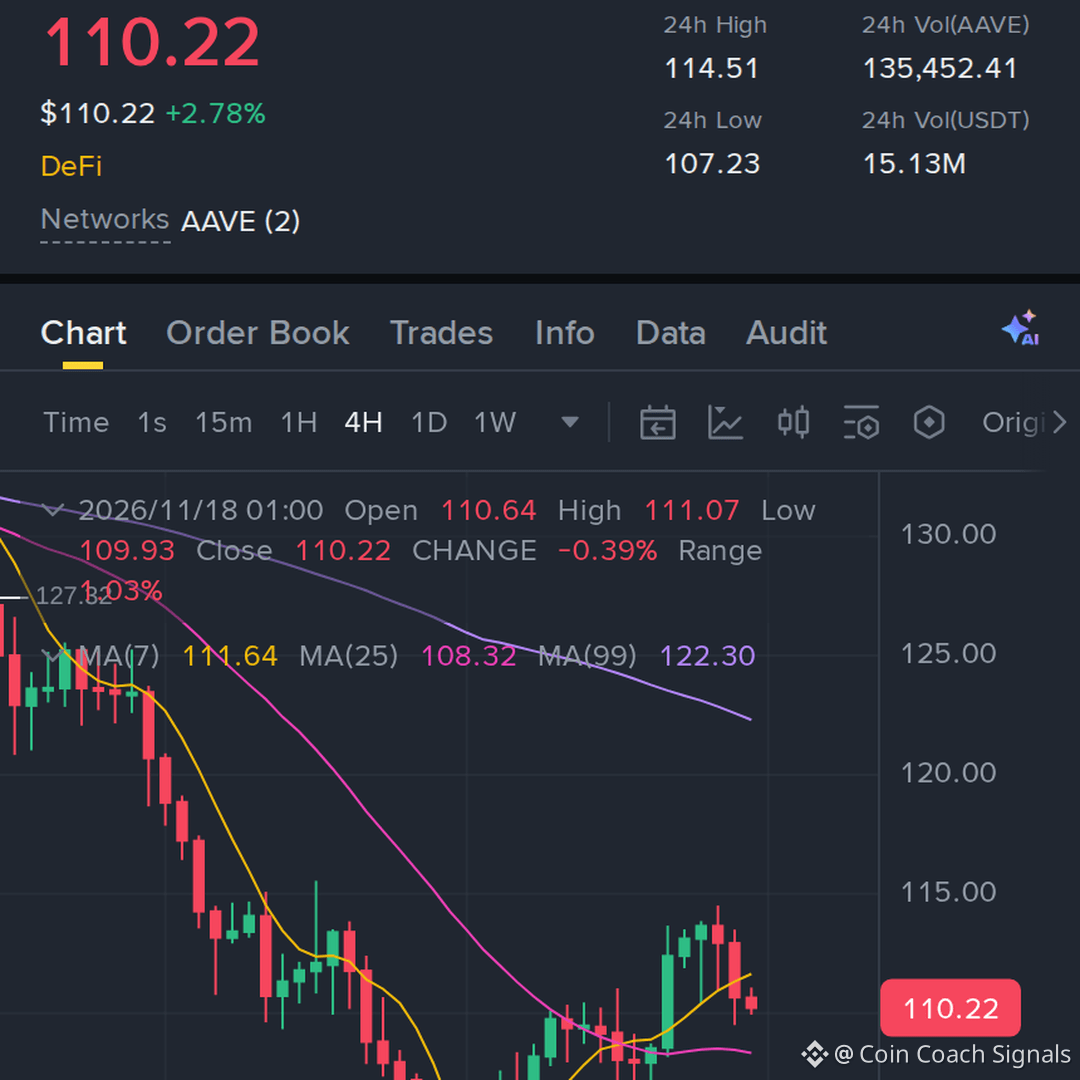
okay, $AAVE tried to recover but the bounce is losing energy again, keeping the setup around 39x
Entry: 110.07–110.96 • Stop Loss: 115.16
TP1: 104.99 | TP2: 100.02 | TP3: 95.04
#AAVE #crypto #Write2Earn #binance
okay, $AAVE tried to recover but the bounce is losing energy again, keeping the setup around 39x
Entry: 110.07–110.96 • Stop Loss: 115.16
TP1: 104.99 | TP2: 100.02 | TP3: 95.04
#AAVE #crypto #Write2Earn #binance
Entry: 110.07–110.96 • Stop Loss: 115.16
TP1: 104.99 | TP2: 100.02 | TP3: 95.04
#AAVE #crypto #Write2Earn #binance
138

·
--
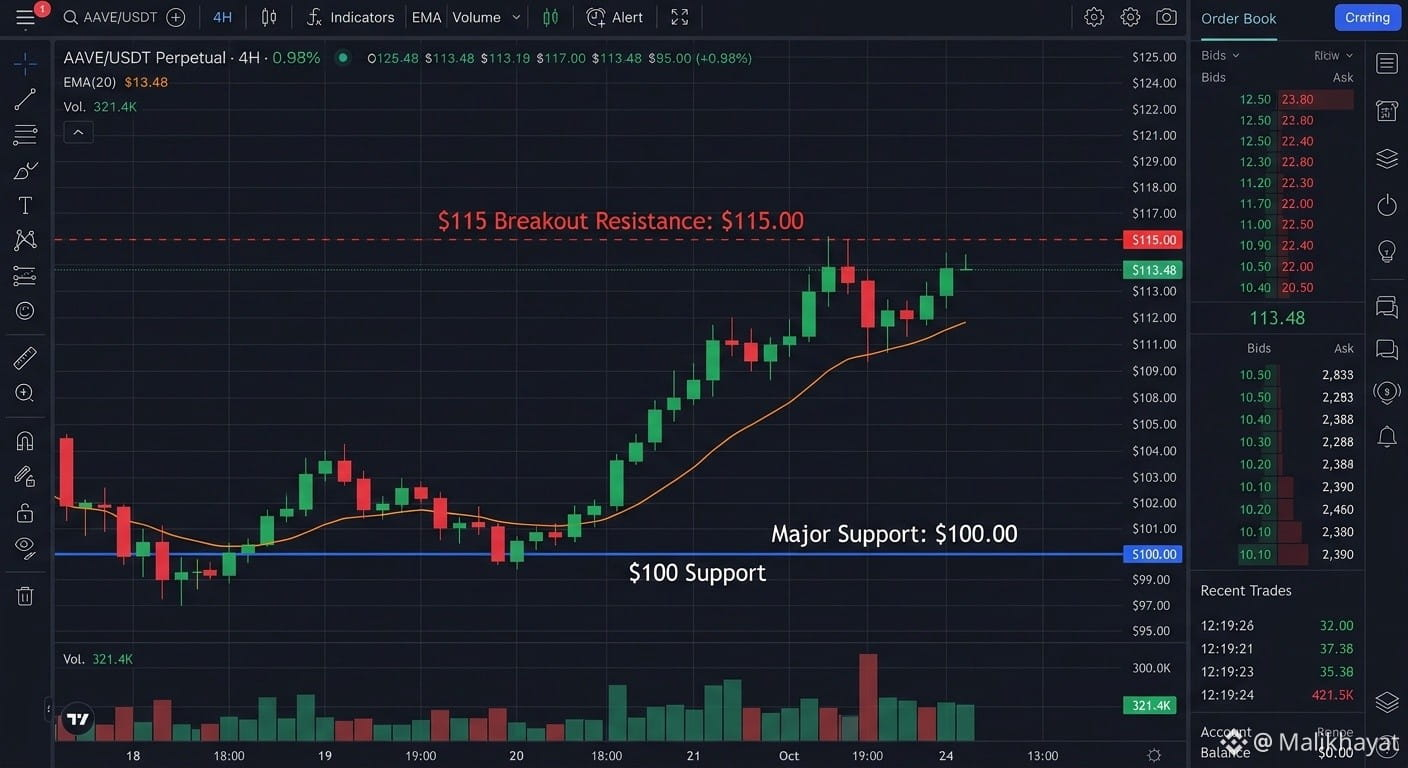
$AAVE is trading around $112.88–$113.51, gaining approximately 4.5%–5.4% over 24 hours. Global trading volume increased 25.5% to $218.8M, while protocol TVL stands at $17.75B. Following accumulation around the $100 psychological support area, traders are watching whether buying pressure can push price above the $115 range ceiling.
📈 Bias: Bullish | 🎯 Entry: Confirmed breakout above $115 | 🛡 Support: $100 | 🚧 Resistance: $115 | 🎯 Targets: Not specified | ❌ Invalidation: Loss of $100 support
Strategy: Wait for a confirmed breakout above $115 or monitor reactions around the established $100 support. Avoid entering before confirmation.
#AAVE #DeFi #CryptoTrading #Binance #Altcoins
{future}(AAVEUSDT)
$AAVE is trading around $112.88–$113.51, gaining approximately 4.5%–5.4% over 24 hours. Global trading volume increased 25.5% to $218.8M, while protocol TVL stands at $17.75B. Following accumulation around the $100 psychological support area, traders are watching whether buying pressure can push price above the $115 range ceiling.
📈 Bias: Bullish | 🎯 Entry: Confirmed breakout above $115 | 🛡 Support: $100 | 🚧 Resistance: $115 | 🎯 Targets: Not specified | ❌ Invalidation: Loss of $100 support
Strategy: Wait for a confirmed breakout above $115 or monitor reactions around the established $100 support. Avoid entering before confirmation.
#AAVE #DeFi #CryptoTrading #Binance #Altcoins
📈 Bias: Bullish | 🎯 Entry: Confirmed breakout above $115 | 🛡 Support: $100 | 🚧 Resistance: $115 | 🎯 Targets: Not specified | ❌ Invalidation: Loss of $100 support
Strategy: Wait for a confirmed breakout above $115 or monitor reactions around the established $100 support. Avoid entering before confirmation.
#AAVE #DeFi #CryptoTrading #Binance #Altcoins
37

·
--
🦈 $AAVE WHALES ABSORB THE FLOAT AS AGGRESSIVE FEE BURNS CREATE A NATURAL FLOOR 💥
Smart money is quietly draining the order books while retail chases shiny volatility across alternative networks. 🦈 The aggressive protocol fee burn mechanics and steady staking yields are forging an ironclad support level that completely ignores broader macro noise. 📊
With zero immediate unlock pressure weighing down the circulating supply, this fundamental powerhouse is cleanly decoupling from short-term market anxiety. ⚡ Protocol utility is finally driving price action as institutional hands accumulate position. 💡 💬 Are you positioning for this yield-heavy rotation, or waiting for the dust to settle? 👇
⚠️ Not financial advice. Always manage your risk. 🛡️
🏷️ #AAVE #DeFi #SmartMoney #Crypto #Binance
🔥 💎
🦈 $AAVE WHALES ABSORB THE FLOAT AS AGGRESSIVE FEE BURNS CREATE A NATURAL FLOOR 💥
Smart money is quietly draining the order books while retail chases shiny volatility across alternative networks. 🦈 The aggressive protocol fee burn mechanics and steady staking yields are forging an ironclad support level that completely ignores broader macro noise. 📊
With zero immediate unlock pressure weighing down the circulating supply, this fundamental powerhouse is cleanly decoupling from short-term market anxiety. ⚡ Protocol utility is finally driving price action as institutional hands accumulate position. 💡 💬 Are you positioning for this yield-heavy rotation, or waiting for the dust to settle? 👇
⚠️ Not financial advice. Always manage your risk. 🛡️
🏷️ #AAVE #DeFi #SmartMoney #Crypto #Binance
🔥 💎
Smart money is quietly draining the order books while retail chases shiny volatility across alternative networks. 🦈 The aggressive protocol fee burn mechanics and steady staking yields are forging an ironclad support level that completely ignores broader macro noise. 📊
With zero immediate unlock pressure weighing down the circulating supply, this fundamental powerhouse is cleanly decoupling from short-term market anxiety. ⚡ Protocol utility is finally driving price action as institutional hands accumulate position. 💡 💬 Are you positioning for this yield-heavy rotation, or waiting for the dust to settle? 👇
⚠️ Not financial advice. Always manage your risk. 🛡️
🏷️ #AAVE #DeFi #SmartMoney #Crypto #Binance
🔥 💎
1

Sentiment is 12 out of 100. $AAVE just put USDT deposits on TRON mobile, both iOS and Android.
$AAVE sits at $110.16, up 2.52%. $TRX is flat at $0.306800.
Extreme fear, yet DeFi keeps shipping. That gap is the whole story tonight, and it smells like early rotation.
I’m not calling a bottom. I want to see if deposit inflow turns into real volume on $AAVE and $TRX before I touch anything.
Your checklist: skim the $TRX futures campaign rules, track the new HYPE listing, then watch whether $TRX holds $0.30 into next week.
Will $AAVE momentum last past the weekend? 1 yes, 2 no.
#Write2Earn #BinanceSquare #AAVE #TRX #Futures
Sentiment is 12 out of 100. $AAVE just put USDT deposits on TRON mobile, both iOS and Android.
$AAVE sits at $110.16, up 2.52%. $TRX is flat at $0.306800.
Extreme fear, yet DeFi keeps shipping. That gap is the whole story tonight, and it smells like early rotation.
I’m not calling a bottom. I want to see if deposit inflow turns into real volume on $AAVE and $TRX before I touch anything.
Your checklist: skim the $TRX futures campaign rules, track the new HYPE listing, then watch whether $TRX holds $0.30 into next week.
Will $AAVE momentum last past the weekend? 1 yes, 2 no.
#Write2Earn #BinanceSquare #AAVE #TRX #Futures
$AAVE sits at $110.16, up 2.52%. $TRX is flat at $0.306800.
Extreme fear, yet DeFi keeps shipping. That gap is the whole story tonight, and it smells like early rotation.
I’m not calling a bottom. I want to see if deposit inflow turns into real volume on $AAVE and $TRX before I touch anything.
Your checklist: skim the $TRX futures campaign rules, track the new HYPE listing, then watch whether $TRX holds $0.30 into next week.
Will $AAVE momentum last past the weekend? 1 yes, 2 no.
#Write2Earn #BinanceSquare #AAVE #TRX #Futures

2

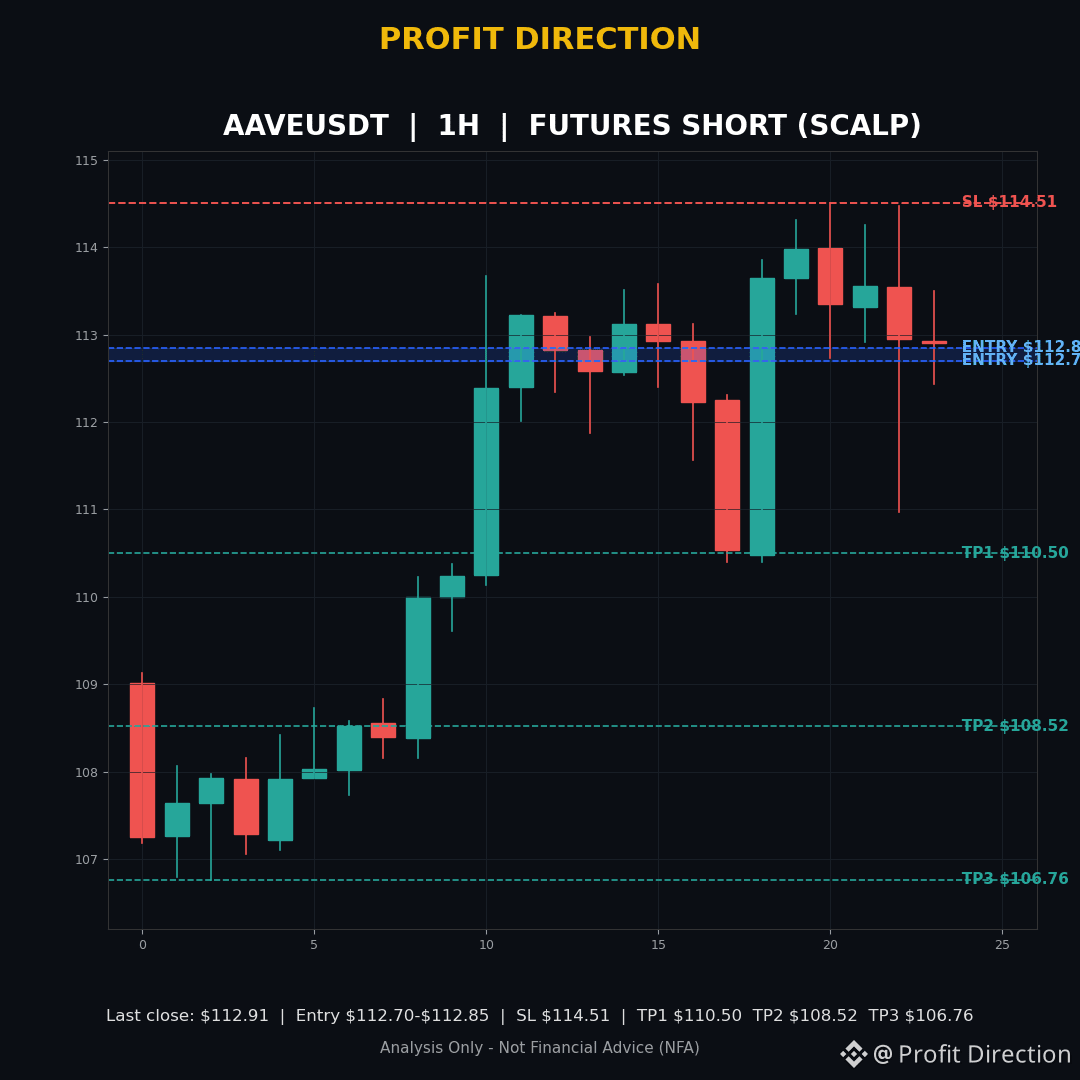
🔴 AAVEUSDT — FUTURES SHORT (SCALP)
📍 Entry Zone: $112.70 – $112.85
🛑 SL: 1H close above $114.51
🎯 TP1: $110.50 | TP2: $108.52 | TP3: $106.76
⚖️ R:R: 1:1.32 | 1:2.46 | 1:3.48
⏱️ TF: 1H
Sellers have defended $114.51 four times in four hours — every push up got sold, and the last rejection came on the biggest volume of the day. Closes are stepping down while the top holds, so I am taking this short scalp with a tight, clear risk.
Why I like this one: a defended top with real selling volume behind it, not just a wick — and a clean level to risk against.
Invalidation: a 1H close above $114.51 kills the idea.
$AAVE
Analysis Only — Not Financial Advice (NFA). Trading involves risk.
Follow Profit Direction for more signals, best signals and market updates. Share your opinion in the comments.
Do you think TP1 will hit first, or SL? Comment LONG or SHORT.
#AAVE #AAVEUSDT #CryptoTrading #FuturesTrading #TradingSignals
🔴 AAVEUSDT — FUTURES SHORT (SCALP)
📍 Entry Zone: $112.70 – $112.85
🛑 SL: 1H close above $114.51
🎯 TP1: $110.50 | TP2: $108.52 | TP3: $106.76
⚖️ R:R: 1:1.32 | 1:2.46 | 1:3.48
⏱️ TF: 1H
Sellers have defended $114.51 four times in four hours — every push up got sold, and the last rejection came on the biggest volume of the day. Closes are stepping down while the top holds, so I am taking this short scalp with a tight, clear risk.
Why I like this one: a defended top with real selling volume behind it, not just a wick — and a clean level to risk against.
Invalidation: a 1H close above $114.51 kills the idea.
$AAVE
Analysis Only — Not Financial Advice (NFA). Trading involves risk.
Follow Profit Direction for more signals, best signals and market updates. Share your opinion in the comments.
Do you think TP1 will hit first, or SL? Comment LONG or SHORT.
#AAVE #AAVEUSDT #CryptoTrading #FuturesTrading #TradingSignals
📍 Entry Zone: $112.70 – $112.85
🛑 SL: 1H close above $114.51
🎯 TP1: $110.50 | TP2: $108.52 | TP3: $106.76
⚖️ R:R: 1:1.32 | 1:2.46 | 1:3.48
⏱️ TF: 1H
Sellers have defended $114.51 four times in four hours — every push up got sold, and the last rejection came on the biggest volume of the day. Closes are stepping down while the top holds, so I am taking this short scalp with a tight, clear risk.
Why I like this one: a defended top with real selling volume behind it, not just a wick — and a clean level to risk against.
Invalidation: a 1H close above $114.51 kills the idea.
$AAVE
Analysis Only — Not Financial Advice (NFA). Trading involves risk.
Follow Profit Direction for more signals, best signals and market updates. Share your opinion in the comments.
Do you think TP1 will hit first, or SL? Comment LONG or SHORT.
#AAVE #AAVEUSDT #CryptoTrading #FuturesTrading #TradingSignals
24

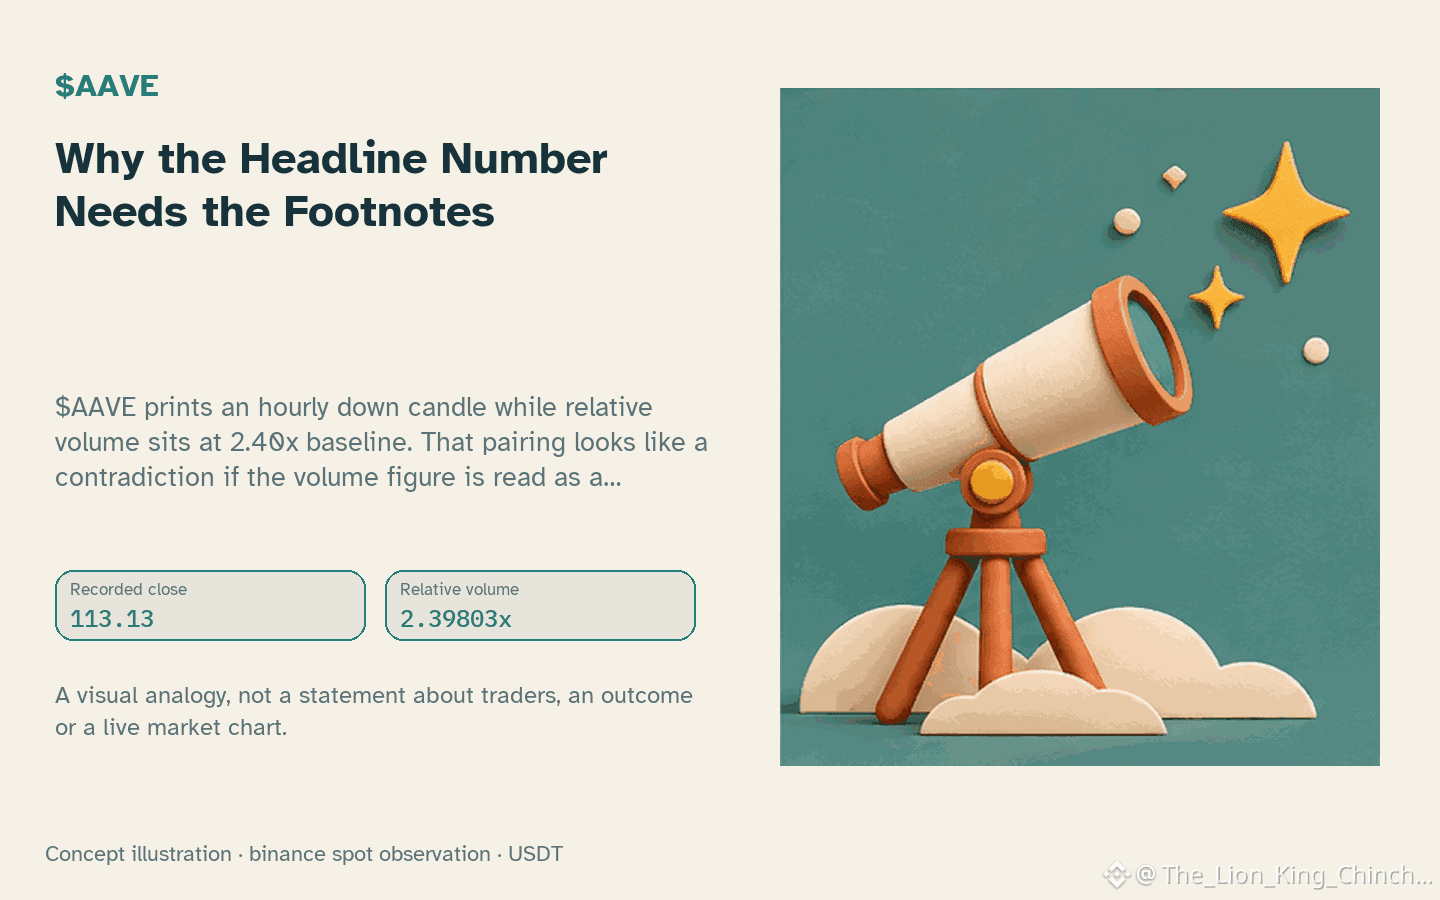
$AAVE: Why the Headline Number Needs the Footnotes
$AAVE prints an hourly down candle while relative volume sits at 2.40x baseline. That pairing looks like a contradiction if the volume figure is read as a standalone signal. In reality the baseline ratio only compares the most recent turnover to the average of preceding candles; it says nothing about whether buyers or sellers drove the prints, nor does it reveal the size of individual orders.
A conditional explanation: imagine a clinic reports a new drug cuts symptom scores by half. The headline sounds impressive until the footnote shows the trial enrolled twelve patients and the control group received a sugar pill. The relative volume metric plays a similar role; it flags that something unusual happened, but without the order‑book context, trade‑size distribution, or the spread at the time, the number cannot distinguish a single large market sell from a flurry of small limit orders.
The limits of the evidence: the current snapshot captures only one closed hourly candle, a local range between 110.4 and 114.51, and an RSI reading of 53.8. No data on market versus limit composition, depth changes, or subsequent candles exists in the supplied set. If the next few hourly candles return to baseline volume while price continues lower, the initial volume spike would look like a one‑off liquidation rather than sustained pressure. Conversely, if volume stays elevated and the candle body narrows, the interpretation shifts toward absorption. Either scenario remains hypothetical until future closed candles confirm or refute the pattern.
Probabilistic market research, not a recommendation or guaranteed return.
The label or the mechanism behind it?
#AAVE #CryptoEducation
$AAVE : Why the Headline Number Needs the Footnotes
$AAVE prints an hourly down candle while relative volume sits at 2.40x baseline. That pairing looks like a contradiction if the volume figure is read as a standalone signal. In reality the baseline ratio only compares the most recent turnover to the average of preceding candles; it says nothing about whether buyers or sellers drove the prints, nor does it reveal the size of individual orders.
A conditional explanation: imagine a clinic reports a new drug cuts symptom scores by half. The headline sounds impressive until the footnote shows the trial enrolled twelve patients and the control group received a sugar pill. The relative volume metric plays a similar role; it flags that something unusual happened, but without the order‑book context, trade‑size distribution, or the spread at the time, the number cannot distinguish a single large market sell from a flurry of small limit orders.
The limits of the evidence: the current snapshot captures only one closed hourly candle, a local range between 110.4 and 114.51, and an RSI reading of 53.8. No data on market versus limit composition, depth changes, or subsequent candles exists in the supplied set. If the next few hourly candles return to baseline volume while price continues lower, the initial volume spike would look like a one‑off liquidation rather than sustained pressure. Conversely, if volume stays elevated and the candle body narrows, the interpretation shifts toward absorption. Either scenario remains hypothetical until future closed candles confirm or refute the pattern.
Probabilistic market research, not a recommendation or guaranteed return.
The label or the mechanism behind it?
#AAVE #CryptoEducation
$AAVE prints an hourly down candle while relative volume sits at 2.40x baseline. That pairing looks like a contradiction if the volume figure is read as a standalone signal. In reality the baseline ratio only compares the most recent turnover to the average of preceding candles; it says nothing about whether buyers or sellers drove the prints, nor does it reveal the size of individual orders.
A conditional explanation: imagine a clinic reports a new drug cuts symptom scores by half. The headline sounds impressive until the footnote shows the trial enrolled twelve patients and the control group received a sugar pill. The relative volume metric plays a similar role; it flags that something unusual happened, but without the order‑book context, trade‑size distribution, or the spread at the time, the number cannot distinguish a single large market sell from a flurry of small limit orders.
The limits of the evidence: the current snapshot captures only one closed hourly candle, a local range between 110.4 and 114.51, and an RSI reading of 53.8. No data on market versus limit composition, depth changes, or subsequent candles exists in the supplied set. If the next few hourly candles return to baseline volume while price continues lower, the initial volume spike would look like a one‑off liquidation rather than sustained pressure. Conversely, if volume stays elevated and the candle body narrows, the interpretation shifts toward absorption. Either scenario remains hypothetical until future closed candles confirm or refute the pattern.
Probabilistic market research, not a recommendation or guaranteed return.
The label or the mechanism behind it?
#AAVE #CryptoEducation
26

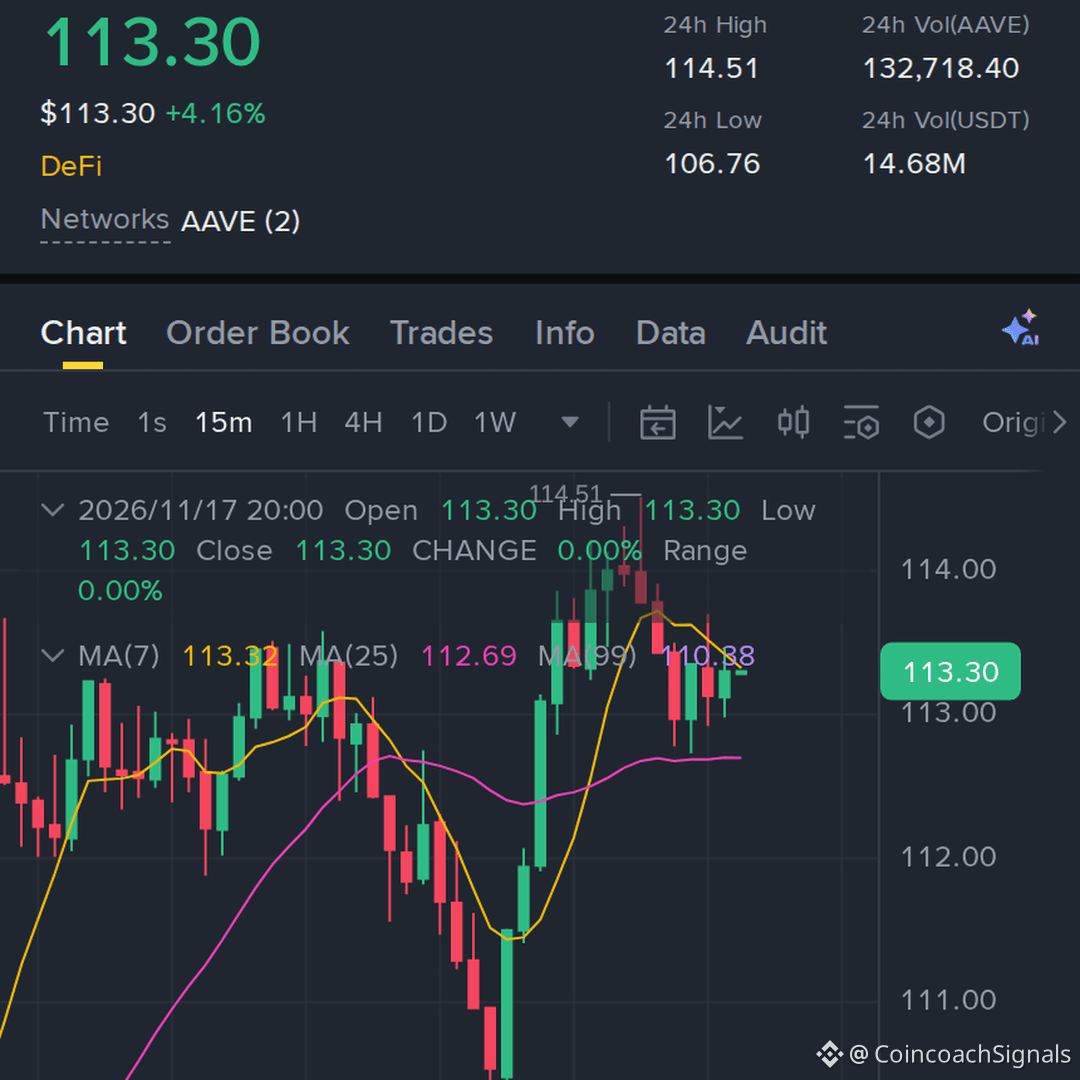
🚨 $AAVE BULLISH MOMENTUM ALERT!
$AAVE is gaining market strength!
💰 Price: $112.80
📈 24H Change: +4.54%
📊 MARKET SIGNAL
🟢 Support: $110.00
🔴 Resistance: $114.50
🎯 LONG SETUP:
Entry: Above $114.60 after confirmation
🎯 TP1: $117.00
🎯 TP2: $120.00
🎯 TP3: $124.00
🛑 SL: $112.00
⚠️ Wait for breakout confirmation. Protect your capital.
🔥 Is AAVE ready for another rally?
FOLLOW SHARE 🔁
#AAVE #AaveProtocol #AAVEUSDT #BinanceSquare #DeFi #CryptoSignals #Altcoins
🚨 $AAVE BULLISH MOMENTUM ALERT!
$AAVE is gaining market strength!
💰 Price: $112.80
📈 24H Change: +4.54%
📊 MARKET SIGNAL
🟢 Support: $110.00
🔴 Resistance: $114.50
🎯 LONG SETUP:
Entry: Above $114.60 after confirmation
🎯 TP1: $117.00
🎯 TP2: $120.00
🎯 TP3: $124.00
🛑 SL: $112.00
⚠️ Wait for breakout confirmation. Protect your capital.
🔥 Is AAVE ready for another rally?
FOLLOW SHARE 🔁
#AAVE #AaveProtocol #AAVEUSDT #BinanceSquare #DeFi #CryptoSignals #Altcoins
$AAVE is gaining market strength!
💰 Price: $112.80
📈 24H Change: +4.54%
📊 MARKET SIGNAL
🟢 Support: $110.00
🔴 Resistance: $114.50
🎯 LONG SETUP:
Entry: Above $114.60 after confirmation
🎯 TP1: $117.00
🎯 TP2: $120.00
🎯 TP3: $124.00
🛑 SL: $112.00
⚠️ Wait for breakout confirmation. Protect your capital.
🔥 Is AAVE ready for another rally?
FOLLOW SHARE 🔁
#AAVE #AaveProtocol #AAVEUSDT #BinanceSquare #DeFi #CryptoSignals #Altcoins
21
Log in to explore more content
Join global crypto users on Binance Square
⚡️ Get latest and useful information about crypto.
💬 Trusted by the world’s largest crypto exchange.
👍 Discover real insights from verified creators.
Email / Phone number
Trending Topics
1
#NvidiaBeatsEstimatesWith$130BQ4Outlook
3,092 views
72 Discussing
2
#AnthropicIPOPriceCouldExceed$80
7,553 views
75 Discussing
3
#CanNvidia’sDataCenterGrowthContinue?
17,244 views
308 Discussing
4
#BankOfEnglandUnveilsClearingHousePathwayCoveringDLTFirms
0 views
0 Discussing
5
#DBSAndCirclePartnerToExpandAsianInstitutionsUSDCAccess
973 views
24 Discussing
6
#LedgerHardwareImplantReportsExtendToDubai
391 views
41 Discussing
7
#NvidiaBoardNotConsideringHuang’sReturnasCEO
177,008 views
1,295 Discussing
8
#KOSPIFalls2.59%ToLowestCloseSinceFebruary
48,702 views
549 Discussing
9
#AnthropicClearedToListOnNasdaqAsANT
42,604 views
430 Discussing
10
#WhatInvestmentSignalsDo13FFilingsReveal?
93,963 views
828 Discussing