
#66
66
1,785 views
39 Discussing
Hot
Latest

·
--
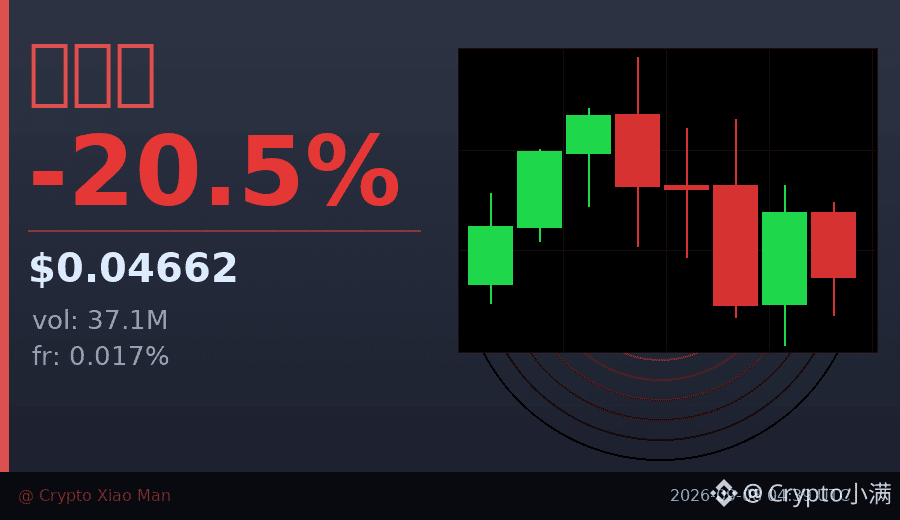
66% of people are going long, yet the price has still fallen 20%—Habakkuk was brutally trapped by a long-squeeze today.
Trading volume surged to 37 million USDT, and the funding rate is still positive at 0.017%, which suggests leveraged long positions are still being hard-held.
But the price action has been dumped from 0.065 down to 0.045—another textbook case of “buying more as it falls” being taught a lesson by the market.
In the short term, it’s ranging and consolidating; until the direction becomes clear, don’t rush to bottom-fish.
I’ve seen too many crowded long positions like this, and in the end, they only hit bottom after stop-loss liquidations trigger a cascade.
Wait for a long lower wick + contracting volume—those are the signals worth paying attention to.
$哈基米 #多头陷阱 #66% open interest ratio
Click the small card below to quickly check the market👇
66% of people are going long, yet the price has still fallen 20%—Habakkuk was brutally trapped by a long-squeeze today.
Trading volume surged to 37 million USDT, and the funding rate is still positive at 0.017%, which suggests leveraged long positions are still being hard-held.
But the price action has been dumped from 0.065 down to 0.045—another textbook case of “buying more as it falls” being taught a lesson by the market.
In the short term, it’s ranging and consolidating; until the direction becomes clear, don’t rush to bottom-fish.
I’ve seen too many crowded long positions like this, and in the end, they only hit bottom after stop-loss liquidations trigger a cascade.
Wait for a long lower wick + contracting volume—those are the signals worth paying attention to.
$哈基米 #多头陷阱 #66% open interest ratio
Click the small card below to quickly check the market👇
Trading volume surged to 37 million USDT, and the funding rate is still positive at 0.017%, which suggests leveraged long positions are still being hard-held.
But the price action has been dumped from 0.065 down to 0.045—another textbook case of “buying more as it falls” being taught a lesson by the market.
In the short term, it’s ranging and consolidating; until the direction becomes clear, don’t rush to bottom-fish.
I’ve seen too many crowded long positions like this, and in the end, they only hit bottom after stop-loss liquidations trigger a cascade.
Wait for a long lower wick + contracting volume—those are the signals worth paying attention to.
$哈基米 #多头陷阱 #66% open interest ratio
Click the small card below to quickly check the market👇
52
·
--
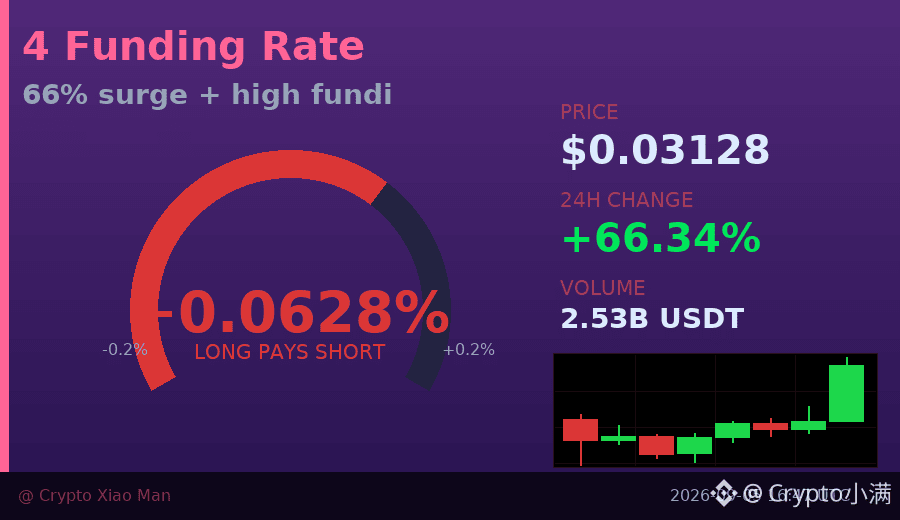
66% one-day increase, but the truly noteworthy thing is that the funding rate has already surged to 0.0627%.
This means the cost for longs borrowing money to buy coins is rising rapidly. Over the past 6 hours, candles have closed green continuously, with the last one showing a clear surge in volume. The price has risen from 0.0185 to the current 0.0313, nearly doubling.
The long-to-short position ratio is 52% to 48%, which is not extremely crowded, but the funding rate is already signaling that those chasing higher prices are starting to pay interest.
This kind of move is common during a short-term sentiment acceleration phase. Going forward, it will either continue squeezing shorts, or pull back for turnover before the funding rate comes down.
$4 #资金费率预警 #66%
Click the card below to quickly view the market👇
66% one-day increase, but the truly noteworthy thing is that the funding rate has already surged to 0.0627%.
This means the cost for longs borrowing money to buy coins is rising rapidly. Over the past 6 hours, candles have closed green continuously, with the last one showing a clear surge in volume. The price has risen from 0.0185 to the current 0.0313, nearly doubling.
The long-to-short position ratio is 52% to 48%, which is not extremely crowded, but the funding rate is already signaling that those chasing higher prices are starting to pay interest.
This kind of move is common during a short-term sentiment acceleration phase. Going forward, it will either continue squeezing shorts, or pull back for turnover before the funding rate comes down.
$4 #资金费率预警 #66%
Click the card below to quickly view the market👇
This means the cost for longs borrowing money to buy coins is rising rapidly. Over the past 6 hours, candles have closed green continuously, with the last one showing a clear surge in volume. The price has risen from 0.0185 to the current 0.0313, nearly doubling.
The long-to-short position ratio is 52% to 48%, which is not extremely crowded, but the funding rate is already signaling that those chasing higher prices are starting to pay interest.
This kind of move is common during a short-term sentiment acceleration phase. Going forward, it will either continue squeezing shorts, or pull back for turnover before the funding rate comes down.
$4 #资金费率预警 #66%
Click the card below to quickly view the market👇
54
·
--
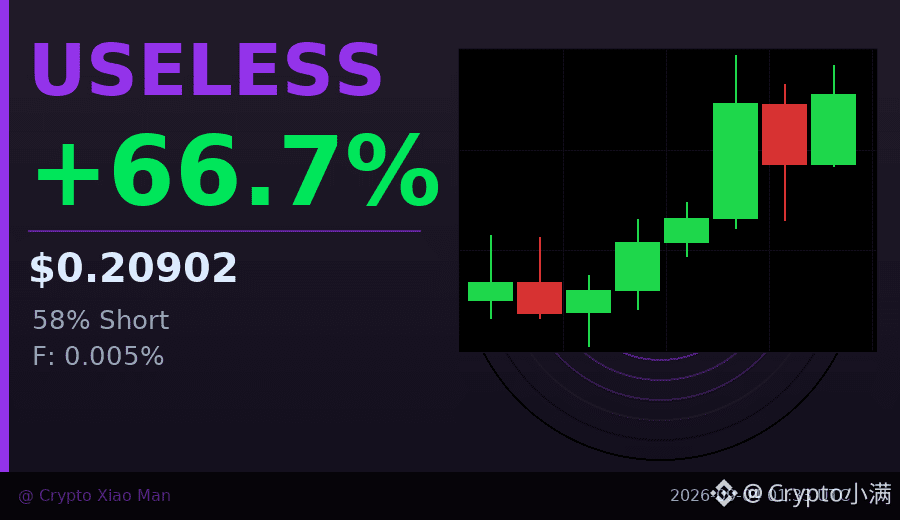
A Dangerous Signal Behind the 66% Surge: 58% of People Are Still Shorting.
USELESS moved very strongly over these 8 hours, with volume surging to 445 million USDT, and the price rising from 0.124 to 0.209. What’s interesting, though, is that in contract open interest, shorts make up 58%, while longs are only 42%.
This kind of divergence usually points to one of two things: either shorts are waiting for a pullback to add positions, or they haven’t realized the trend has already changed. Given that trading volume continues to expand and the candlesticks keep stepping higher, it looks more like the latter.
If the price keeps breaking above the prior high at 0.213, these shorts will be forced to close, which could trigger a burst of accelerated upside. Of course, if there’s a pullback below 0.185, this logic will fail.
I’ll place a small long near 0.205, with a stop loss set below 0.19.
$USELESS #空头挤压 #66%涨幅
Click the small card below to quickly check the market trend👇
A Dangerous Signal Behind the 66% Surge: 58% of People Are Still Shorting.
USELESS moved very strongly over these 8 hours, with volume surging to 445 million USDT, and the price rising from 0.124 to 0.209. What’s interesting, though, is that in contract open interest, shorts make up 58%, while longs are only 42%.
This kind of divergence usually points to one of two things: either shorts are waiting for a pullback to add positions, or they haven’t realized the trend has already changed. Given that trading volume continues to expand and the candlesticks keep stepping higher, it looks more like the latter.
If the price keeps breaking above the prior high at 0.213, these shorts will be forced to close, which could trigger a burst of accelerated upside. Of course, if there’s a pullback below 0.185, this logic will fail.
I’ll place a small long near 0.205, with a stop loss set below 0.19.
$USELESS #空头挤压 #66%涨幅
Click the small card below to quickly check the market trend👇
USELESS moved very strongly over these 8 hours, with volume surging to 445 million USDT, and the price rising from 0.124 to 0.209. What’s interesting, though, is that in contract open interest, shorts make up 58%, while longs are only 42%.
This kind of divergence usually points to one of two things: either shorts are waiting for a pullback to add positions, or they haven’t realized the trend has already changed. Given that trading volume continues to expand and the candlesticks keep stepping higher, it looks more like the latter.
If the price keeps breaking above the prior high at 0.213, these shorts will be forced to close, which could trigger a burst of accelerated upside. Of course, if there’s a pullback below 0.185, this logic will fail.
I’ll place a small long near 0.205, with a stop loss set below 0.19.
$USELESS #空头挤压 #66%涨幅
Click the small card below to quickly check the market trend👇
20
·
--
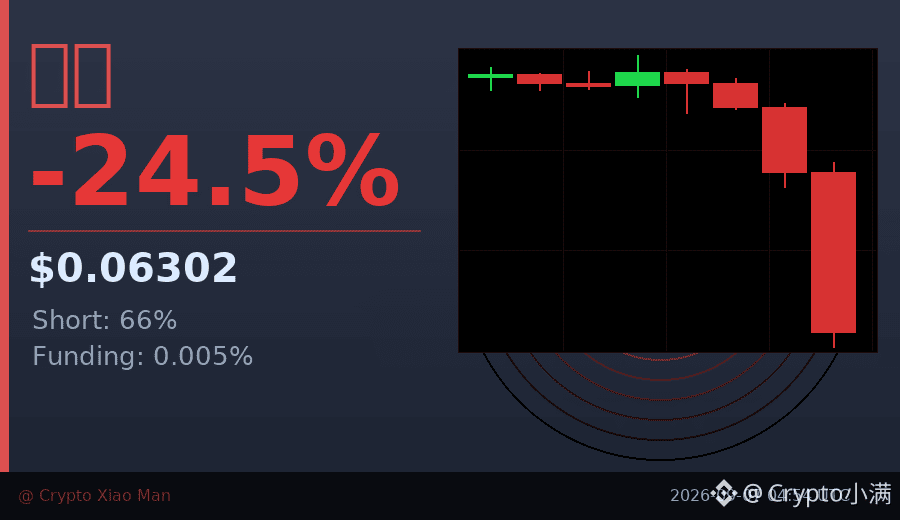
It dropped by a quarter in 24 hours—this price action is kind of interesting.
Lobster was smashed all the way down from 0.08776 to 0.063, yet trading volume surged to 29 million U — a textbook case of a sell-off on rising volume. More importantly, shorts have already reached 66%, while the funding rate is still holding at a positive 0.005%, which means the longs are still hanging on.
The hourly chart has posted three consecutive bearish candles, and the last one showed a clear spike in volume. This kind of pattern often means panic selling is starting to pour in. But on the flip side, when everyone is bearish, a rebound may be just around the corner.
I’m not rushing to buy the dip right now. Let’s wait for this big bearish candle to be absorbed, and then see whether it can hold around 0.062.
$Lobster #放量下跌 #66%shorts
Click the small card below to quickly check the market👇
It dropped by a quarter in 24 hours—this price action is kind of interesting.
Lobster was smashed all the way down from 0.08776 to 0.063, yet trading volume surged to 29 million U — a textbook case of a sell-off on rising volume. More importantly, shorts have already reached 66%, while the funding rate is still holding at a positive 0.005%, which means the longs are still hanging on.
The hourly chart has posted three consecutive bearish candles, and the last one showed a clear spike in volume. This kind of pattern often means panic selling is starting to pour in. But on the flip side, when everyone is bearish, a rebound may be just around the corner.
I’m not rushing to buy the dip right now. Let’s wait for this big bearish candle to be absorbed, and then see whether it can hold around 0.062.
$Lobster #放量下跌 #66%shorts
Click the small card below to quickly check the market👇
Lobster was smashed all the way down from 0.08776 to 0.063, yet trading volume surged to 29 million U — a textbook case of a sell-off on rising volume. More importantly, shorts have already reached 66%, while the funding rate is still holding at a positive 0.005%, which means the longs are still hanging on.
The hourly chart has posted three consecutive bearish candles, and the last one showed a clear spike in volume. This kind of pattern often means panic selling is starting to pour in. But on the flip side, when everyone is bearish, a rebound may be just around the corner.
I’m not rushing to buy the dip right now. Let’s wait for this big bearish candle to be absorbed, and then see whether it can hold around 0.062.
$Lobster #放量下跌 #66%shorts
Click the small card below to quickly check the market👇
19
·
--
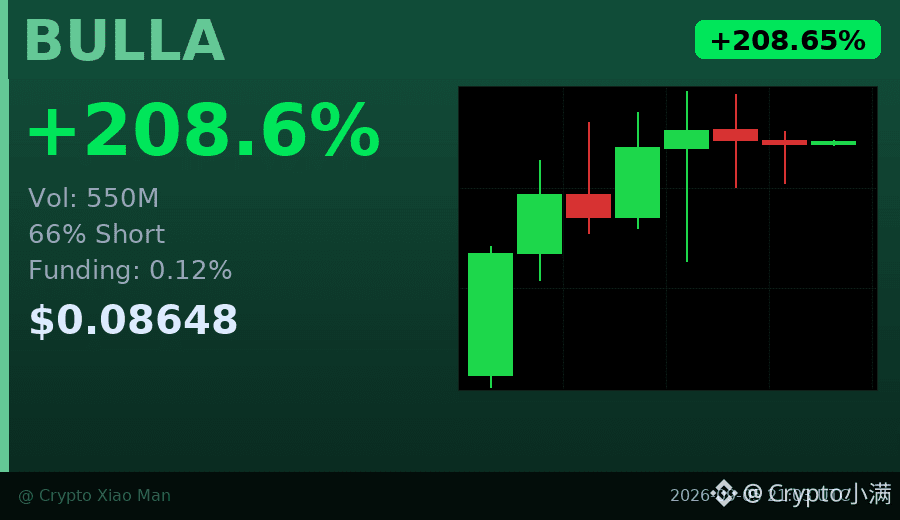
Behind the 208% surge there is a dangerous signal: 66% of people are still short.
BULLA has been strengthening steadily over the past 8 hours, with trading volume surging to $550 million, but the long/short ratio shows most people are still betting on a decline. This kind of divergence usually means two things: either the shorts get badly burned, or the longs run out of steam and pull back quickly.
The funding rate of 0.12% is not extreme, which means leverage has not yet reached a dangerous level. The key is whether the previous high at 0.092 can be broken—if it moves above that level, short stop-losses will help push the price up faster.
I’m leaning toward some more upside in the short term, but chasing longs carries significant risk. In this kind of market, it’s better to wait for a pullback to stabilize, or simply watch from the sidelines.
$BULLA #逼空行情 #66% shorts
Click the card below to quickly check the market👇
Behind the 208% surge there is a dangerous signal: 66% of people are still short.
BULLA has been strengthening steadily over the past 8 hours, with trading volume surging to $550 million, but the long/short ratio shows most people are still betting on a decline. This kind of divergence usually means two things: either the shorts get badly burned, or the longs run out of steam and pull back quickly.
The funding rate of 0.12% is not extreme, which means leverage has not yet reached a dangerous level. The key is whether the previous high at 0.092 can be broken—if it moves above that level, short stop-losses will help push the price up faster.
I’m leaning toward some more upside in the short term, but chasing longs carries significant risk. In this kind of market, it’s better to wait for a pullback to stabilize, or simply watch from the sidelines.
$BULLA #逼空行情 #66% shorts
Click the card below to quickly check the market👇
BULLA has been strengthening steadily over the past 8 hours, with trading volume surging to $550 million, but the long/short ratio shows most people are still betting on a decline. This kind of divergence usually means two things: either the shorts get badly burned, or the longs run out of steam and pull back quickly.
The funding rate of 0.12% is not extreme, which means leverage has not yet reached a dangerous level. The key is whether the previous high at 0.092 can be broken—if it moves above that level, short stop-losses will help push the price up faster.
I’m leaning toward some more upside in the short term, but chasing longs carries significant risk. In this kind of market, it’s better to wait for a pullback to stabilize, or simply watch from the sidelines.
$BULLA #逼空行情 #66% shorts
Click the card below to quickly check the market👇
23
·
--
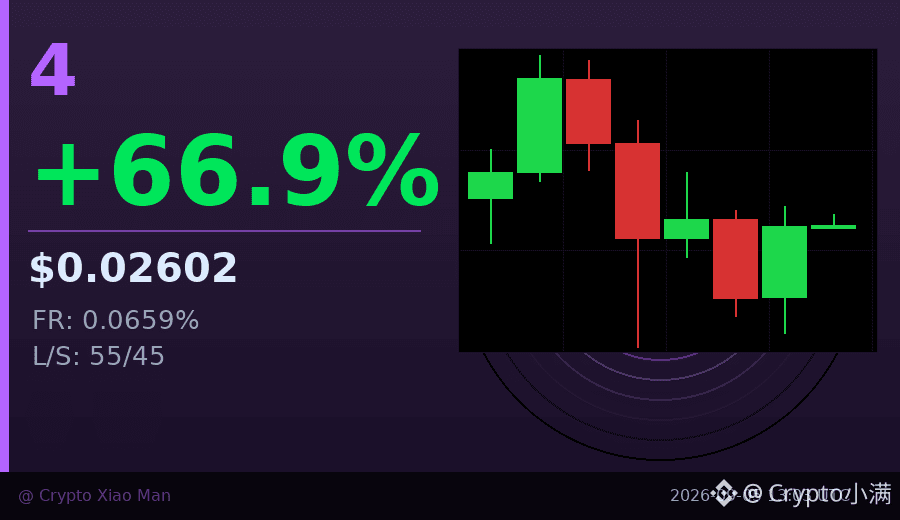
Behind the 66.89% surge, the funding rate has already soared to 0.0659%—this shows longs are leveraging up aggressively.
Trading volume reached 212 million USDT, but price pulled back from the high of 0.0287 to 0.0260, indicating that those who chased the rally are starting to be trapped.
After three consecutive bullish hourly candlesticks, a pullback appeared, a classic sign of profit-taking.
Long/short ratio is 55%/45%, with longs slightly in the lead, but the advantage is not stable.
In this kind of market, the risk of chasing the rise is greater than the opportunity; waiting for a pullback to stabilize is more prudent.
$4 #资金费率预警 #66.89%
Click the small card below to quickly view the market👇
Behind the 66.89% surge, the funding rate has already soared to 0.0659%—this shows longs are leveraging up aggressively.
Trading volume reached 212 million USDT, but price pulled back from the high of 0.0287 to 0.0260, indicating that those who chased the rally are starting to be trapped.
After three consecutive bullish hourly candlesticks, a pullback appeared, a classic sign of profit-taking.
Long/short ratio is 55%/45%, with longs slightly in the lead, but the advantage is not stable.
In this kind of market, the risk of chasing the rise is greater than the opportunity; waiting for a pullback to stabilize is more prudent.
$4 #资金费率预警 #66.89%
Click the small card below to quickly view the market👇
Trading volume reached 212 million USDT, but price pulled back from the high of 0.0287 to 0.0260, indicating that those who chased the rally are starting to be trapped.
After three consecutive bullish hourly candlesticks, a pullback appeared, a classic sign of profit-taking.
Long/short ratio is 55%/45%, with longs slightly in the lead, but the advantage is not stable.
In this kind of market, the risk of chasing the rise is greater than the opportunity; waiting for a pullback to stabilize is more prudent.
$4 #资金费率预警 #66.89%
Click the small card below to quickly view the market👇
5
·
--
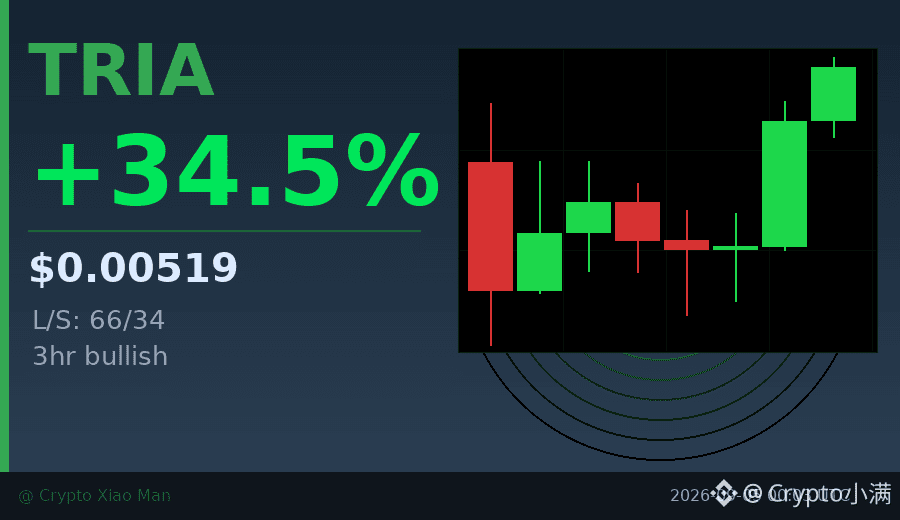
Behind the 34% surge, capital is quietly taking sides.
TRIA was pumped to 0.005188 today, with a trading volume of 147 million USDT.
More importantly, the long/short ratio is 66% to 34%, with longs clearly in the lead.
The hourly chart has already posted three consecutive bullish candles, indicating this is not just a short-lived spike.
A funding rate of 0.005% is not extreme yet, so it hasn’t hit a crowding warning.
This kind of price-volume combination plus sustained capital inflow is worth adding to the watchlist.
$TRIA #资金流向 #66% Longs
Click the card below to quickly view the market 👇
Behind the 34% surge, capital is quietly taking sides.
TRIA was pumped to 0.005188 today, with a trading volume of 147 million USDT.
More importantly, the long/short ratio is 66% to 34%, with longs clearly in the lead.
The hourly chart has already posted three consecutive bullish candles, indicating this is not just a short-lived spike.
A funding rate of 0.005% is not extreme yet, so it hasn’t hit a crowding warning.
This kind of price-volume combination plus sustained capital inflow is worth adding to the watchlist.
$TRIA #资金流向 #66% Longs
Click the card below to quickly view the market 👇
TRIA was pumped to 0.005188 today, with a trading volume of 147 million USDT.
More importantly, the long/short ratio is 66% to 34%, with longs clearly in the lead.
The hourly chart has already posted three consecutive bullish candles, indicating this is not just a short-lived spike.
A funding rate of 0.005% is not extreme yet, so it hasn’t hit a crowding warning.
This kind of price-volume combination plus sustained capital inflow is worth adding to the watchlist.
$TRIA #资金流向 #66% Longs
Click the card below to quickly view the market 👇
100
·
--
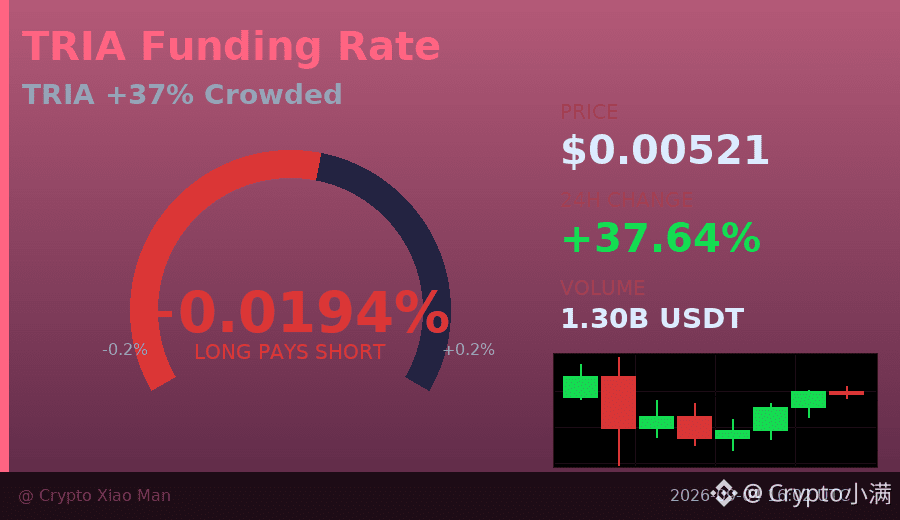
Behind the 37% surge, longs are already getting a bit crowded.
TRIA hit 0.0052 today, with $130 million in trading volume. It looks strong, but the funding rate has risen to 0.019, and 66% of traders are long, which means most people are already in.
What’s more worth noting is that over the past 8 hours, price has actually been weakening — the rise has been sharp, but the momentum isn’t holding up. At a time like this, chasing longs can easily make you the one holding the bag.
I usually wait for two kinds of signals: either a pullback to around 0.0045 to see whether support holds, or a breakout above the prior high at 0.0056 to confirm fresh momentum. At this level, staying on the sidelines is safer than acting on impulse.
$TRIA #资金费率预警 #66% Longs
Click the small card below to quickly view the market👇
Behind the 37% surge, longs are already getting a bit crowded.
TRIA hit 0.0052 today, with $130 million in trading volume. It looks strong, but the funding rate has risen to 0.019, and 66% of traders are long, which means most people are already in.
What’s more worth noting is that over the past 8 hours, price has actually been weakening — the rise has been sharp, but the momentum isn’t holding up. At a time like this, chasing longs can easily make you the one holding the bag.
I usually wait for two kinds of signals: either a pullback to around 0.0045 to see whether support holds, or a breakout above the prior high at 0.0056 to confirm fresh momentum. At this level, staying on the sidelines is safer than acting on impulse.
$TRIA #资金费率预警 #66% Longs
Click the small card below to quickly view the market👇
TRIA hit 0.0052 today, with $130 million in trading volume. It looks strong, but the funding rate has risen to 0.019, and 66% of traders are long, which means most people are already in.
What’s more worth noting is that over the past 8 hours, price has actually been weakening — the rise has been sharp, but the momentum isn’t holding up. At a time like this, chasing longs can easily make you the one holding the bag.
I usually wait for two kinds of signals: either a pullback to around 0.0045 to see whether support holds, or a breakout above the prior high at 0.0056 to confirm fresh momentum. At this level, staying on the sidelines is safer than acting on impulse.
$TRIA #资金费率预警 #66% Longs
Click the small card below to quickly view the market👇
42
·
--
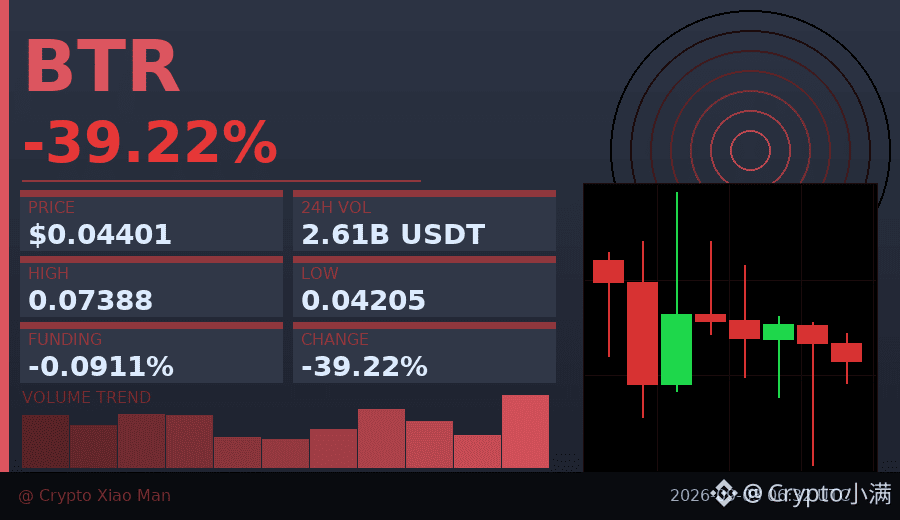
24 hours saw a nearly 40% plunge, yet the funding rate is strangely negative—what’s going on with BTR now?
The price was smashed from 0.074 down to 0.044. Trading volume of 260 million U isn’t small, but the most eye-catching part is the funding rate of -0.091%. What does that mean? Short sellers have to pay long buyers, yet the price is still falling.
Look at the long/short ratio too: 66% of people are long, while only 34% are short. Most participants are trying to bottom-pick, but the hourly candlesticks have been closing in the red consecutively, suggesting buy-side demand can’t absorb the sell pressure.
This kind of divergence usually leads to two outcomes: either the shorts get squeezed and drained by the funding rate and are forced to close, triggering a rebound, or longs’ confidence collapses and the selloff accelerates. I’ll wait for one hourly bullish candle to hold above 0.046 before reassessing.
$BTR #资金费率背离 #66% longs
Click the small card below to quickly check the market行情👇
24 hours saw a nearly 40% plunge, yet the funding rate is strangely negative—what’s going on with BTR now?
The price was smashed from 0.074 down to 0.044. Trading volume of 260 million U isn’t small, but the most eye-catching part is the funding rate of -0.091%. What does that mean? Short sellers have to pay long buyers, yet the price is still falling.
Look at the long/short ratio too: 66% of people are long, while only 34% are short. Most participants are trying to bottom-pick, but the hourly candlesticks have been closing in the red consecutively, suggesting buy-side demand can’t absorb the sell pressure.
This kind of divergence usually leads to two outcomes: either the shorts get squeezed and drained by the funding rate and are forced to close, triggering a rebound, or longs’ confidence collapses and the selloff accelerates. I’ll wait for one hourly bullish candle to hold above 0.046 before reassessing.
$BTR #资金费率背离 #66% longs
Click the small card below to quickly check the market行情👇
The price was smashed from 0.074 down to 0.044. Trading volume of 260 million U isn’t small, but the most eye-catching part is the funding rate of -0.091%. What does that mean? Short sellers have to pay long buyers, yet the price is still falling.
Look at the long/short ratio too: 66% of people are long, while only 34% are short. Most participants are trying to bottom-pick, but the hourly candlesticks have been closing in the red consecutively, suggesting buy-side demand can’t absorb the sell pressure.
This kind of divergence usually leads to two outcomes: either the shorts get squeezed and drained by the funding rate and are forced to close, triggering a rebound, or longs’ confidence collapses and the selloff accelerates. I’ll wait for one hourly bullish candle to hold above 0.046 before reassessing.
$BTR #资金费率背离 #66% longs
Click the small card below to quickly check the market行情👇
121
·
--
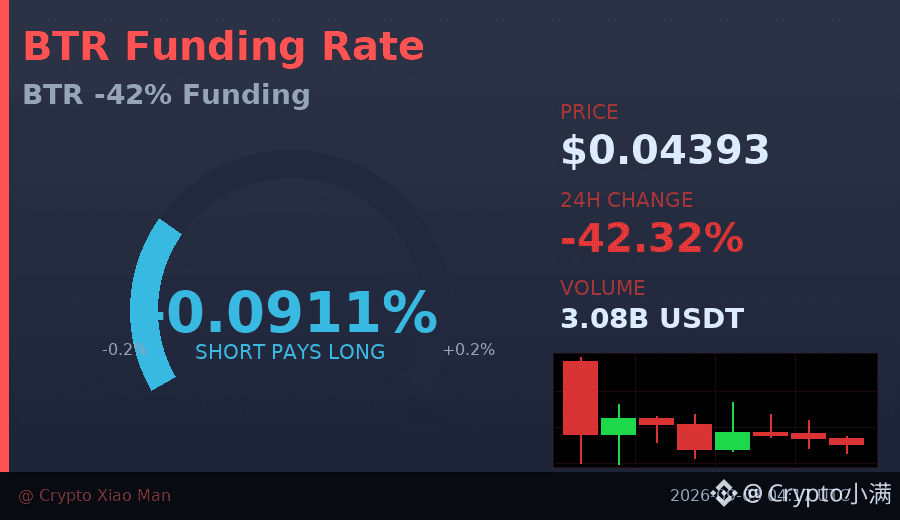
Behind the 42% drop, the shorts are paying an exorbitant funding rate.
BTR was dumped from 0.0925 down to 0.04245—seemingly a typical long-term liquidation cascade. But a funding rate of -0.09112 means that per hour, shorts have to pay a 9% cost to longs—highly unusual in a crash.
With 66% of the long positions not fully capitulated yet, consecutive bearish candles on the hourly chart suggest selling pressure is still ongoing. Yet the funding rate has already priced in extreme pessimism in advance.
In such situations, there are usually only two scenarios: either the shorts keep squeezing until the funding rate reverts, or the longs are completely liquidated and a bottom forms. I lean toward waiting for the funding rate to return to a normal range before taking action.
$BTR #资金费率异常 #66% Long positions
Click the small card below to quickly check the market 👇
Behind the 42% drop, the shorts are paying an exorbitant funding rate.
BTR was dumped from 0.0925 down to 0.04245—seemingly a typical long-term liquidation cascade. But a funding rate of -0.09112 means that per hour, shorts have to pay a 9% cost to longs—highly unusual in a crash.
With 66% of the long positions not fully capitulated yet, consecutive bearish candles on the hourly chart suggest selling pressure is still ongoing. Yet the funding rate has already priced in extreme pessimism in advance.
In such situations, there are usually only two scenarios: either the shorts keep squeezing until the funding rate reverts, or the longs are completely liquidated and a bottom forms. I lean toward waiting for the funding rate to return to a normal range before taking action.
$BTR #资金费率异常 #66% Long positions
Click the small card below to quickly check the market 👇
BTR was dumped from 0.0925 down to 0.04245—seemingly a typical long-term liquidation cascade. But a funding rate of -0.09112 means that per hour, shorts have to pay a 9% cost to longs—highly unusual in a crash.
With 66% of the long positions not fully capitulated yet, consecutive bearish candles on the hourly chart suggest selling pressure is still ongoing. Yet the funding rate has already priced in extreme pessimism in advance.
In such situations, there are usually only two scenarios: either the shorts keep squeezing until the funding rate reverts, or the longs are completely liquidated and a bottom forms. I lean toward waiting for the funding rate to return to a normal range before taking action.
$BTR #资金费率异常 #66% Long positions
Click the small card below to quickly check the market 👇
162

·
--
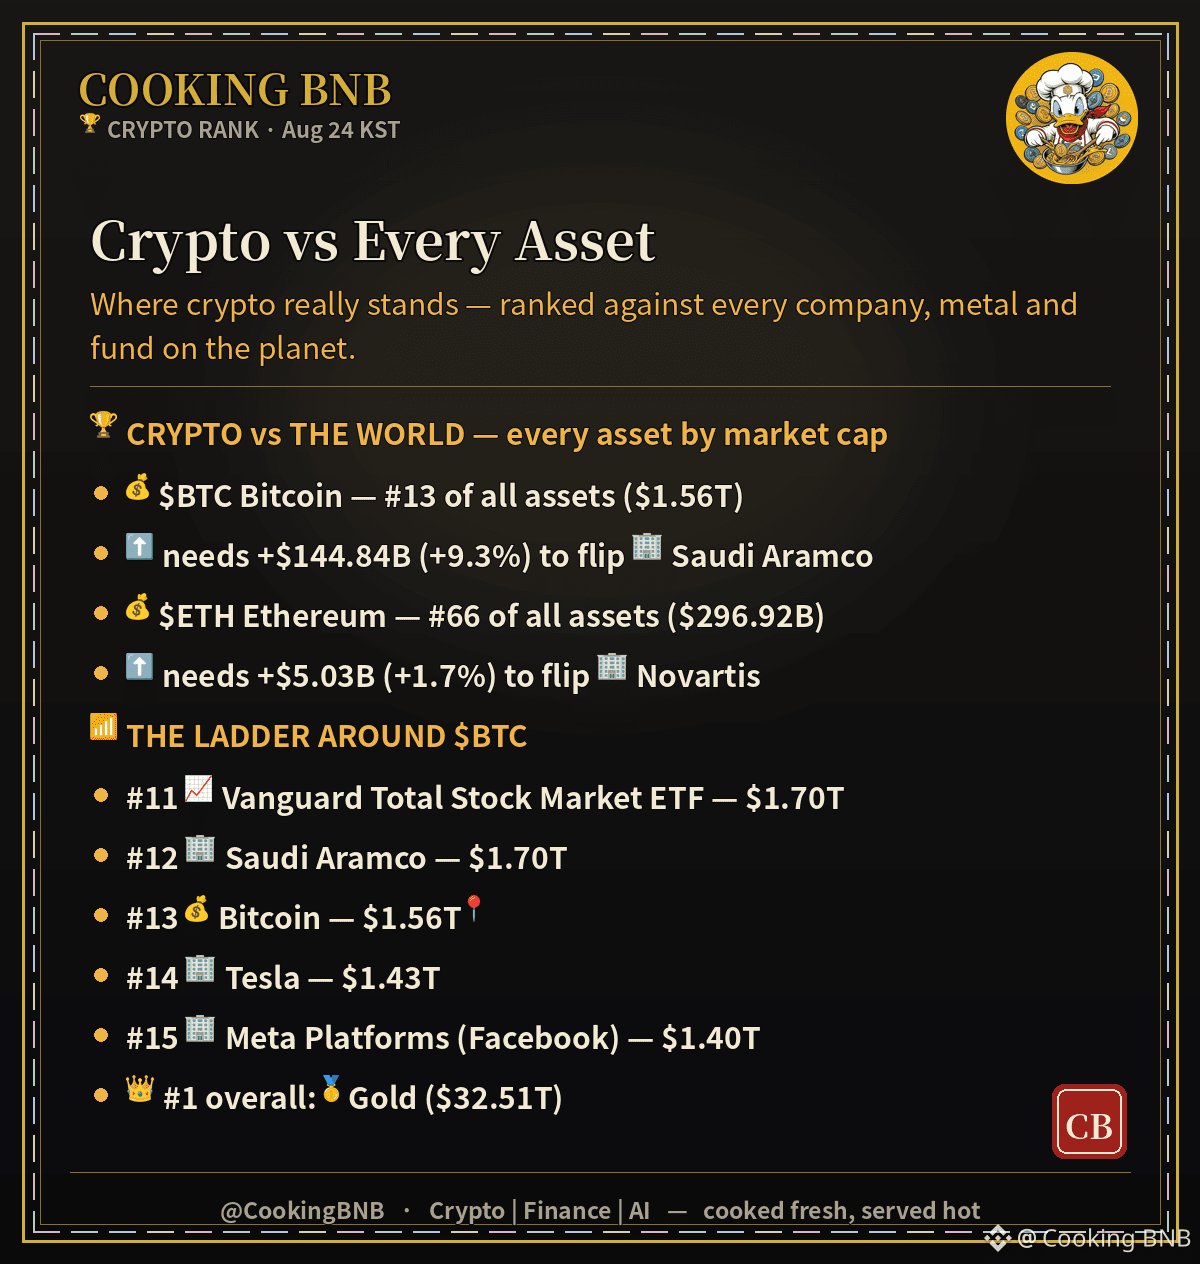
🏆 CRYPTO vs THE WORLD
$BTC #13 of all assets · needs +$144.84B to flip Saudi Aramco
$ETH #66 of all assets · needs +$5.03B to flip Novartis
🍳 Crypto vs stocks, gold, everything. Not financial advice.
#CookingBNB #Crypto
🏆 CRYPTO vs THE WORLD
$BTC #13 of all assets · needs +$144.84B to flip Saudi Aramco
$ETH #66 of all assets · needs +$5.03B to flip Novartis
🍳 Crypto vs stocks, gold, everything. Not financial advice.
#CookingBNB #Crypto
$BTC #13 of all assets · needs +$144.84B to flip Saudi Aramco
$ETH #66 of all assets · needs +$5.03B to flip Novartis
🍳 Crypto vs stocks, gold, everything. Not financial advice.
#CookingBNB #Crypto
97
·
--
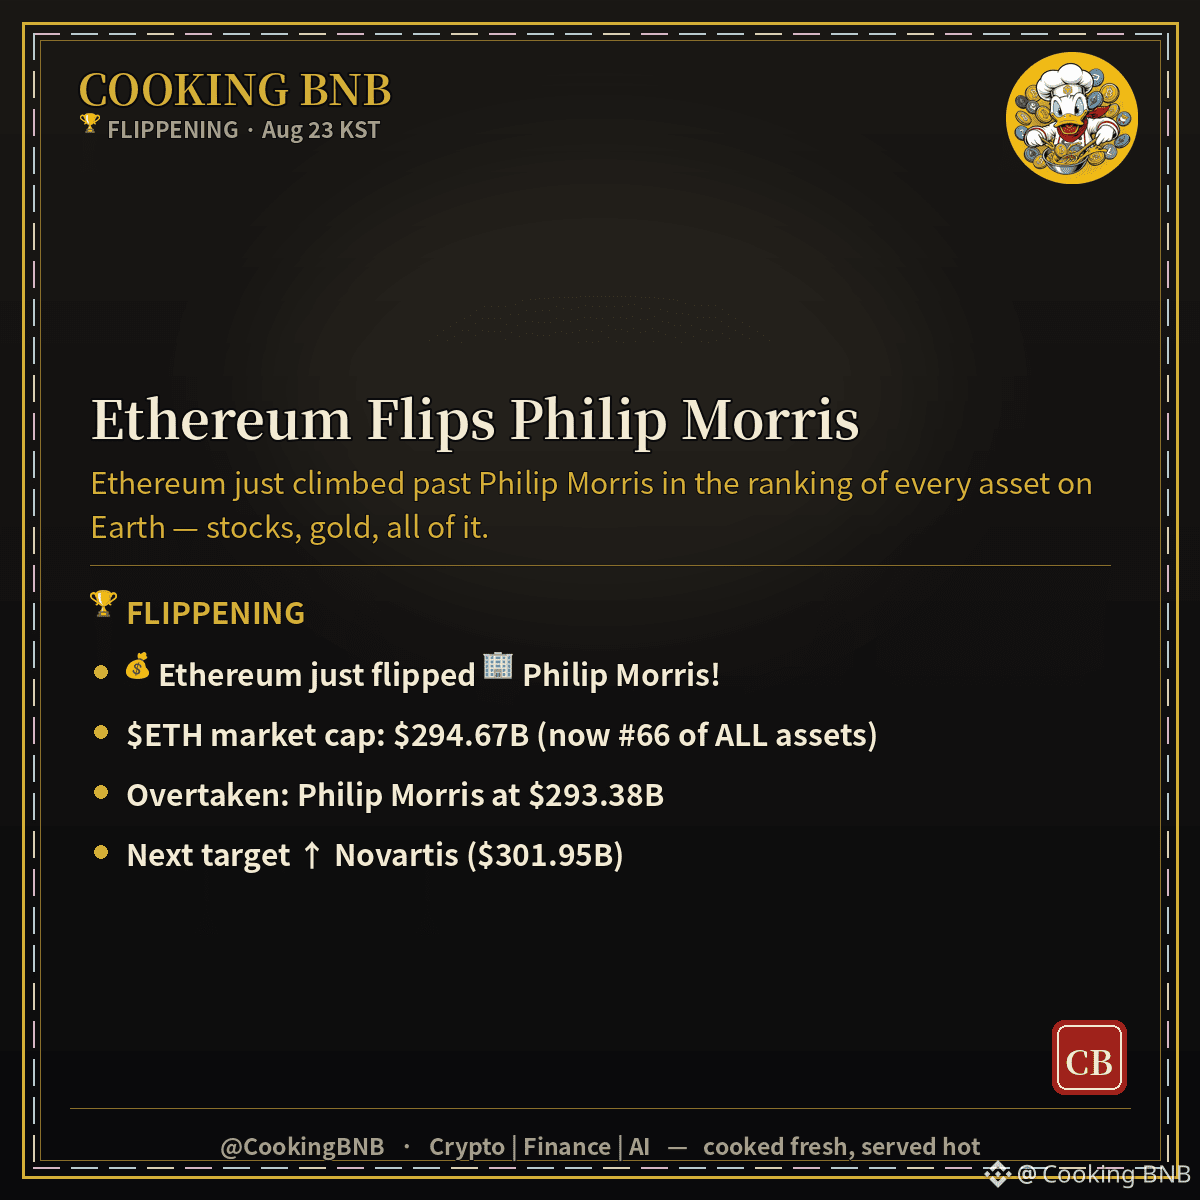
🏆 FLIPPENING
💰 Ethereum just flipped Philip Morris!
$ETH $294.67B · now #66 of all assets
Passed Philip Morris ($293.38B)
🍳 Crypto vs the whole world. Not financial advice.
#CookingBNB #Crypto #Bitcoin #BTC
🏆 FLIPPENING
💰 Ethereum just flipped Philip Morris!
$ETH $294.67B · now #66 of all assets
Passed Philip Morris ($293.38B)
🍳 Crypto vs the whole world. Not financial advice.
#CookingBNB #Crypto #Bitcoin #BTC
💰 Ethereum just flipped Philip Morris!
$ETH $294.67B · now #66 of all assets
Passed Philip Morris ($293.38B)
🍳 Crypto vs the whole world. Not financial advice.
#CookingBNB #Crypto #Bitcoin #BTC
21


·
--
We're excited to share the latest trending tokens on CoinGecko 🚀. Our community is always looking for new opportunities, and we're happy to provide insights. We're tracking several tokens, including Thinking Cat, Pi Network, and Holoworld.
We've noticed that Pi Network has a market cap rank of #66, while Pudgy Penguins is at #107, and XRP is at #6. Other notable tokens include Terra Luna Classic at #130 and Tutorial at #382. We're seeing a lot of movement in the market, with various tokens experiencing significant % changes.
As we continue to monitor the market, we're keeping an eye on these trending tokens 💡. Our community is eager to stay up-to-date on the latest developments, and we're committed to providing the best insights 📊. We're looking forward to seeing how these tokens perform in the future.
$CRWVB, $HOLO, $APR
We're excited to share the latest trending tokens on CoinGecko 🚀. Our community is always looking for new opportunities, and we're happy to provide insights. We're tracking several tokens, including Thinking Cat, Pi Network, and Holoworld.
We've noticed that Pi Network has a market cap rank of #66, while Pudgy Penguins is at #107, and XRP is at #6. Other notable tokens include Terra Luna Classic at #130 and Tutorial at #382. We're seeing a lot of movement in the market, with various tokens experiencing significant % changes.
As we continue to monitor the market, we're keeping an eye on these trending tokens 💡. Our community is eager to stay up-to-date on the latest developments, and we're committed to providing the best insights 📊. We're looking forward to seeing how these tokens perform in the future.
$CRWVB , $HOLO , $APR
We've noticed that Pi Network has a market cap rank of #66, while Pudgy Penguins is at #107, and XRP is at #6. Other notable tokens include Terra Luna Classic at #130 and Tutorial at #382. We're seeing a lot of movement in the market, with various tokens experiencing significant % changes.
As we continue to monitor the market, we're keeping an eye on these trending tokens 💡. Our community is eager to stay up-to-date on the latest developments, and we're committed to providing the best insights 📊. We're looking forward to seeing how these tokens perform in the future.
$CRWVB , $HOLO , $APR
1
706

·
--
$PI Today’s -2.81% drop isn’t the signal most worth paying attention to. The truly interesting part is this: it’s on declining volume.
After the surge on July 20 from a high-volume push to $0.095, trading volume has rapidly shrunk from 33M down to roughly 5M today—yet the price has kept grinding in a tight range of 0.08–0.09. This price is no longer being voted on frequently by capital. Over the past 30 days, the trend looks more like: a failed, exploratory rally, followed by the market using shrinking volume to reach a temporary equilibrium—not consensus, but fatigue.
What I care about more is that $PI is still 97% away from ATH, yet its market cap still ranks at #66. This suggests its chip (cost-basis) structure may deserve more scrutiny than the price itself: most holders’ costs are far above the current price. And now, with volume drying up, it means they neither cut losses nor add positions. The market lacks a trigger point that would force a direction choice.
For those holding, it’s no longer just about whether they’re in a loss. It’s that the price barely moves day after day, and opportunity/time cost is eroding patience. Those on the sidelines are waiting for volume—whether the move is upward or downward, only volume can confirm the direction.
The risk is this: volume-contracted equilibrium is the most fragile formation. It’s easiest to break with a single external variable—for example, an exchange announcement, the project’s unlock, or a sudden macro sentiment reversal. Once that possibility becomes true, who will be the first to point out the most likely variable to overturn it—will continued volume contraction drag the price lower, or will a sudden burst of volume pick a direction? Feel free to state your observations clearly.
$PI Today’s -2.81% drop isn’t the signal most worth paying attention to. The truly interesting part is this: it’s on declining volume.
After the surge on July 20 from a high-volume push to $0.095, trading volume has rapidly shrunk from 33M down to roughly 5M today—yet the price has kept grinding in a tight range of 0.08–0.09. This price is no longer being voted on frequently by capital. Over the past 30 days, the trend looks more like: a failed, exploratory rally, followed by the market using shrinking volume to reach a temporary equilibrium—not consensus, but fatigue.
What I care about more is that $PI is still 97% away from ATH, yet its market cap still ranks at #66. This suggests its chip (cost-basis) structure may deserve more scrutiny than the price itself: most holders’ costs are far above the current price. And now, with volume drying up, it means they neither cut losses nor add positions. The market lacks a trigger point that would force a direction choice.
For those holding, it’s no longer just about whether they’re in a loss. It’s that the price barely moves day after day, and opportunity/time cost is eroding patience. Those on the sidelines are waiting for volume—whether the move is upward or downward, only volume can confirm the direction.
The risk is this: volume-contracted equilibrium is the most fragile formation. It’s easiest to break with a single external variable—for example, an exchange announcement, the project’s unlock, or a sudden macro sentiment reversal. Once that possibility becomes true, who will be the first to point out the most likely variable to overturn it—will continued volume contraction drag the price lower, or will a sudden burst of volume pick a direction? Feel free to state your observations clearly.
After the surge on July 20 from a high-volume push to $0.095, trading volume has rapidly shrunk from 33M down to roughly 5M today—yet the price has kept grinding in a tight range of 0.08–0.09. This price is no longer being voted on frequently by capital. Over the past 30 days, the trend looks more like: a failed, exploratory rally, followed by the market using shrinking volume to reach a temporary equilibrium—not consensus, but fatigue.
What I care about more is that $PI is still 97% away from ATH, yet its market cap still ranks at #66. This suggests its chip (cost-basis) structure may deserve more scrutiny than the price itself: most holders’ costs are far above the current price. And now, with volume drying up, it means they neither cut losses nor add positions. The market lacks a trigger point that would force a direction choice.
For those holding, it’s no longer just about whether they’re in a loss. It’s that the price barely moves day after day, and opportunity/time cost is eroding patience. Those on the sidelines are waiting for volume—whether the move is upward or downward, only volume can confirm the direction.
The risk is this: volume-contracted equilibrium is the most fragile formation. It’s easiest to break with a single external variable—for example, an exchange announcement, the project’s unlock, or a sudden macro sentiment reversal. Once that possibility becomes true, who will be the first to point out the most likely variable to overturn it—will continued volume contraction drag the price lower, or will a sudden burst of volume pick a direction? Feel free to state your observations clearly.

·
--
Fixed-rate lending is making a move in DeFi - and it's not just a flash in the pan. Morpho just launched a protocol on Base, and that's not the only thing happening.
So why is this happening now? The market has been grappling with variable-rate uncertainty for a while, and fixed-rate lending offers a different kind of stability. It’s a response to a real problem - not just a trendy experiment.
Risk reminder: Fixed-rate lending protocols are still unproven at scale. Leverage and liquidity remain key factors - and they’re not always easy to manage.
—
For educational purposes only. Not financial advice.
📌 Crypto 101 · #66 · #CryptoEducation #CryptoSighted $MORPHO
Fixed-rate lending is making a move in DeFi - and it's not just a flash in the pan. Morpho just launched a protocol on Base, and that's not the only thing happening.
So why is this happening now? The market has been grappling with variable-rate uncertainty for a while, and fixed-rate lending offers a different kind of stability. It’s a response to a real problem - not just a trendy experiment.
Risk reminder: Fixed-rate lending protocols are still unproven at scale. Leverage and liquidity remain key factors - and they’re not always easy to manage.
—
For educational purposes only. Not financial advice.
📌 Crypto 101 · #66 · #CryptoEducation #CryptoSighted $MORPHO
So why is this happening now? The market has been grappling with variable-rate uncertainty for a while, and fixed-rate lending offers a different kind of stability. It’s a response to a real problem - not just a trendy experiment.
Risk reminder: Fixed-rate lending protocols are still unproven at scale. Leverage and liquidity remain key factors - and they’re not always easy to manage.
—
For educational purposes only. Not financial advice.
📌 Crypto 101 · #66 · #CryptoEducation #CryptoSighted $MORPHO
79
·
--
That was a valuation leap.
Revolut’s recent employee share sale has drawn attention, and it's not just a fintech story - it’s a signal.
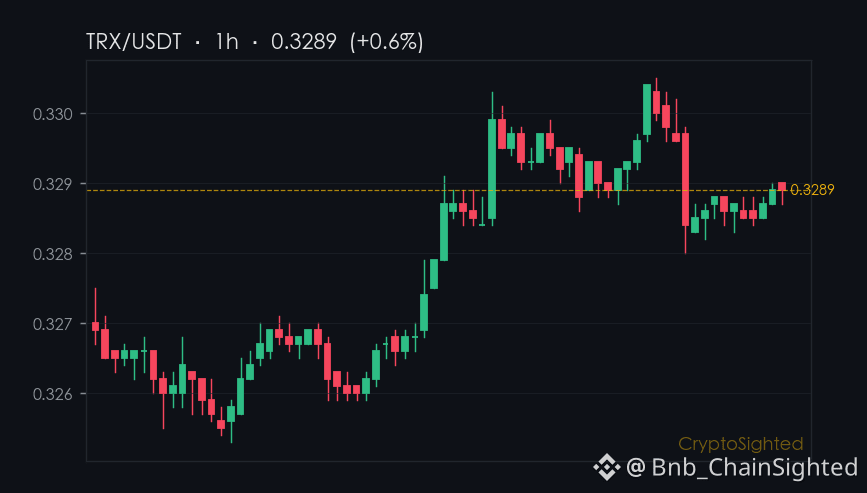
$TRX, which has been quietly tracking a 30-day uptick in on-chain activity, now sits at a level that’s starting to feel less like a correction and more like a test.
—
Not financial advice. DYOR.
📌 News Take · #66 · #CryptoNews #CryptoSighted $TRX
That was a valuation leap.
Revolut’s recent employee share sale has drawn attention, and it's not just a fintech story - it’s a signal.
$TRX , which has been quietly tracking a 30-day uptick in on-chain activity, now sits at a level that’s starting to feel less like a correction and more like a test.
—
Not financial advice. DYOR.
📌 News Take · #66 · #CryptoNews #CryptoSighted $TRX
Revolut’s recent employee share sale has drawn attention, and it's not just a fintech story - it’s a signal.
$TRX , which has been quietly tracking a 30-day uptick in on-chain activity, now sits at a level that’s starting to feel less like a correction and more like a test.
—
Not financial advice. DYOR.
📌 News Take · #66 · #CryptoNews #CryptoSighted $TRX
350


是小KaiYa
·
--
#predict 🔥 The BSC chain has recently gained noticeable momentum—will PREDICT become the next wave of hype?

1
·
--
What if the biggest move of the day isn’t on the top of the gainers list?
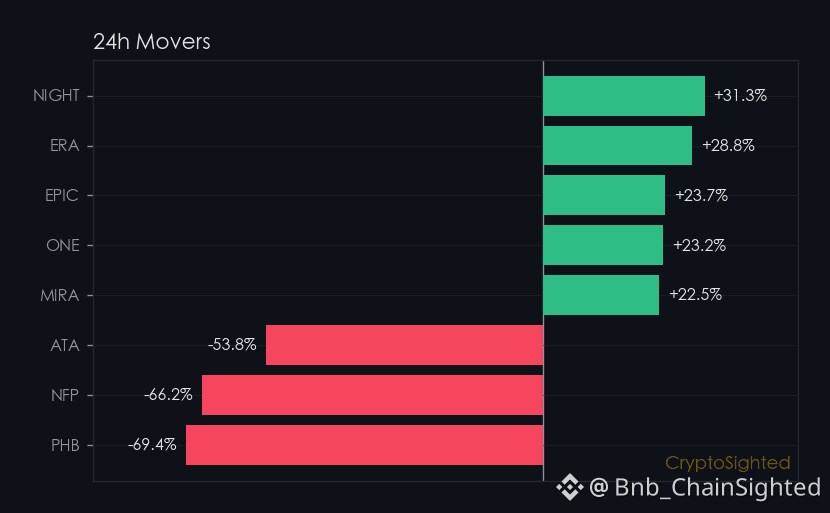
$BTC moved just 1.98% in the last 24 hours - a modest shift, barely enough to stir the waters.
CoinDesk reported earlier this morning that Bitcoin’s rally faces a key test as "summer slumber" grips crypto, with analysts cautioning that the next move hinges on clearing a level where many recent buyers may look to sell.
The news landed - but the market barely blinked.
This isn’t a rejection of the news, but it’s not a confirmation either.
The market is holding its breath. And that’s telling.
—
Not financial advice. DYOR.
📌 Gainers Radar · #66 · #Gainers #CryptoSighted $BTC
What if the biggest move of the day isn’t on the top of the gainers list?
$BTC moved just 1.98% in the last 24 hours - a modest shift, barely enough to stir the waters.
CoinDesk reported earlier this morning that Bitcoin’s rally faces a key test as "summer slumber" grips crypto, with analysts cautioning that the next move hinges on clearing a level where many recent buyers may look to sell.
The news landed - but the market barely blinked.
This isn’t a rejection of the news, but it’s not a confirmation either.
The market is holding its breath. And that’s telling.
—
Not financial advice. DYOR.
📌 Gainers Radar · #66 · #Gainers #CryptoSighted $BTC
$BTC moved just 1.98% in the last 24 hours - a modest shift, barely enough to stir the waters.
CoinDesk reported earlier this morning that Bitcoin’s rally faces a key test as "summer slumber" grips crypto, with analysts cautioning that the next move hinges on clearing a level where many recent buyers may look to sell.
The news landed - but the market barely blinked.
This isn’t a rejection of the news, but it’s not a confirmation either.
The market is holding its breath. And that’s telling.
—
Not financial advice. DYOR.
📌 Gainers Radar · #66 · #Gainers #CryptoSighted $BTC
359

·
--
I've been tracking the latest trends on CoinGecko, and I'm excited to share my findings with you. The platform has listed several tokens that are currently gaining traction, including Cash Cat (CASHCAT) and Heima (HEI).
I'm seeing some significant market cap rankings, with Bitcoin (BTC) leading at #1 and Hyperliquid (HYPE) at #10. Other notable tokens include Pump.fun (PUMP) at #66, Pudgy Penguins (PENGU) at #109, and Squid (QUID) at #899. These rankings can give us insight into the current market landscape and help us identify potential opportunities.
I believe it's essential to stay informed about these trending tokens, as they can experience significant price changes. As I continue to monitor the market, I'll be keeping a close eye on these tokens to see how they perform 📊💰. With this information, I'm confident that we can make more informed decisions and stay ahead of the curve 🚀. Overall, I'm excited to see how these tokens will evolve in the coming days 🔥.
$HEI, $HOME, $HEI
I've been tracking the latest trends on CoinGecko, and I'm excited to share my findings with you. The platform has listed several tokens that are currently gaining traction, including Cash Cat (CASHCAT) and Heima (HEI).
I'm seeing some significant market cap rankings, with Bitcoin (BTC) leading at #1 and Hyperliquid (HYPE) at #10. Other notable tokens include Pump.fun (PUMP) at #66, Pudgy Penguins (PENGU) at #109, and Squid (QUID) at #899. These rankings can give us insight into the current market landscape and help us identify potential opportunities.
I believe it's essential to stay informed about these trending tokens, as they can experience significant price changes. As I continue to monitor the market, I'll be keeping a close eye on these tokens to see how they perform 📊💰. With this information, I'm confident that we can make more informed decisions and stay ahead of the curve 🚀. Overall, I'm excited to see how these tokens will evolve in the coming days 🔥.
$HEI , $HOME , $HEI
I'm seeing some significant market cap rankings, with Bitcoin (BTC) leading at #1 and Hyperliquid (HYPE) at #10. Other notable tokens include Pump.fun (PUMP) at #66, Pudgy Penguins (PENGU) at #109, and Squid (QUID) at #899. These rankings can give us insight into the current market landscape and help us identify potential opportunities.
I believe it's essential to stay informed about these trending tokens, as they can experience significant price changes. As I continue to monitor the market, I'll be keeping a close eye on these tokens to see how they perform 📊💰. With this information, I'm confident that we can make more informed decisions and stay ahead of the curve 🚀. Overall, I'm excited to see how these tokens will evolve in the coming days 🔥.
$HEI , $HOME , $HEI
106
·
--
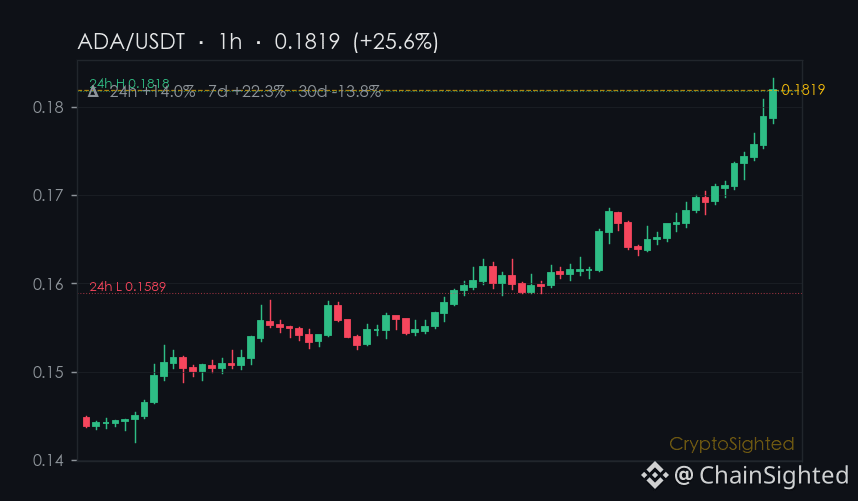
Yesterday it was a quiet day for $ADA. Today, it’s the biggest mover on the board — up 14.0% in 24 hours, and that’s just the start.
The coin’s 7-day gain is already at ↑22.6%, and its 30-day rise is ↑1.0%. But what’s even more telling is the volume: 269,959,105 ADA traded in the last 24 hours, the largest among the top five gainers. That’s not just noise — it’s real money moving.
There’s a story unfolding here — one that’s not yet reflected in the broader market. ADA’s move is sharp, but it’s also isolated. The rest of the crypto world is still digesting news about $BTC and the ETF inflows, but ADA is already ahead of the curve.
Is this the start of something bigger? Or is it just a flash in the pan?
The numbers don’t lie — but they don’t tell the full story either. What’s next for ADA? That’s up to you to decide.
—
Not financial advice. Crypto assets are high-risk; do your own research.
📌 Hotspot Watch · #66
#CryptoTrends #CryptoSighted $BTC
Yesterday it was a quiet day for $ADA . Today, it’s the biggest mover on the board — up 14.0% in 24 hours, and that’s just the start.
The coin’s 7-day gain is already at ↑22.6%, and its 30-day rise is ↑1.0%. But what’s even more telling is the volume: 269,959,105 ADA traded in the last 24 hours, the largest among the top five gainers. That’s not just noise — it’s real money moving.
There’s a story unfolding here — one that’s not yet reflected in the broader market. ADA’s move is sharp, but it’s also isolated. The rest of the crypto world is still digesting news about $BTC and the ETF inflows, but ADA is already ahead of the curve.
Is this the start of something bigger? Or is it just a flash in the pan?
The numbers don’t lie — but they don’t tell the full story either. What’s next for ADA? That’s up to you to decide.
—
Not financial advice. Crypto assets are high-risk; do your own research.
📌 Hotspot Watch · #66
#CryptoTrends #CryptoSighted $BTC
The coin’s 7-day gain is already at ↑22.6%, and its 30-day rise is ↑1.0%. But what’s even more telling is the volume: 269,959,105 ADA traded in the last 24 hours, the largest among the top five gainers. That’s not just noise — it’s real money moving.
There’s a story unfolding here — one that’s not yet reflected in the broader market. ADA’s move is sharp, but it’s also isolated. The rest of the crypto world is still digesting news about $BTC and the ETF inflows, but ADA is already ahead of the curve.
Is this the start of something bigger? Or is it just a flash in the pan?
The numbers don’t lie — but they don’t tell the full story either. What’s next for ADA? That’s up to you to decide.
—
Not financial advice. Crypto assets are high-risk; do your own research.
📌 Hotspot Watch · #66
#CryptoTrends #CryptoSighted $BTC
94
Log in to explore more content
Join global crypto users on Binance Square
⚡️ Get latest and useful information about crypto.
💬 Trusted by the world’s largest crypto exchange.
👍 Discover real insights from verified creators.
Email / Phone number
Trending Topics
1
#AppleDebutsFoldablePhone
4,593 views
120 Discussing
2
#US10YTreasuryYieldHitsHighestSinceNov2023
8,381 views
173 Discussing
3
#USTreasuryToBuyBackUpTo$6BLongDatedDebt
9,599 views
129 Discussing
4
#BitcoinSurpasses$79K
56,889 views
253 Discussing
5
#BrentCrudeTops$100
112,040 views
382 Discussing
6
#USADPWeeklyEmploymentRises12000
88,107 views
1,092 Discussing
7
#BankOfAmericaGroupPilotsUSBDCStablecoin
65,654 views
871 Discussing
8
#RippleLobbiesToAdvanceCLARITYActVote
99,104 views
1,145 Discussing
9
#GrayscaleZcashETFTops$500M
14,474 views
124 Discussing
10
#LAPTOPFoundationXAccountSuspended
5,189 views
90 Discussing