
#41
41
19,280 views
76 Discussing
Hot
Latest

·
--
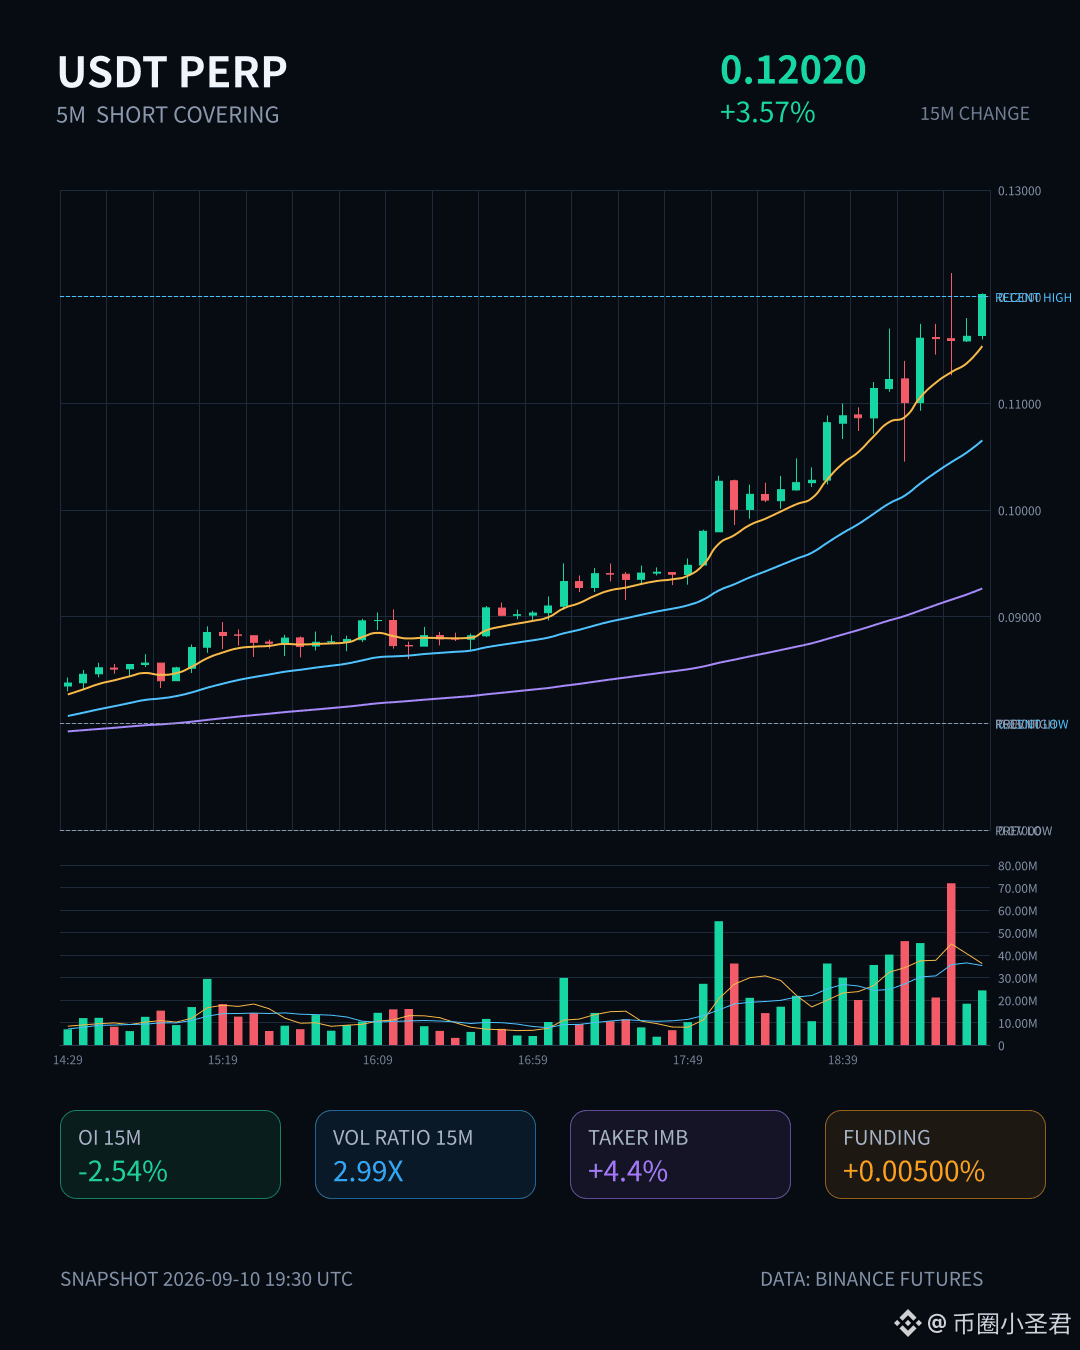
$Bull comes in hard this 15m move—up 3.57% straight away, trading volume shot up to 2.99x, but the OI for 15m actually fell by 2.54%. That’s a textbook short-covering order flow, not fresh long entries.
The OI on the 1h timeframe is still rising though—nominal 5.65M, +17.46%—which suggests someone is willing to take orders at these levels. Active traded gap is 4.4%, buy/sell ratio 1.09, slightly buy-dominant, but not to the point of frantic chasing.
I’ve been burned by this kind of structure before: the shorts close and push the price up, and once they’re done covering it tends to leak. The 24h turnover at 169M isn’t small, and the depth is there, but the OI abnormal percentile is only 47%, ranking #41 across the whole pool—still not at an extremely crowded level.
Chasing higher—be careful. Don’t end up being the last baton you hand to the shorts. Watch whether it can hold the level; otherwise it could be just a single pin’s worth of downside.
$Bull comes in hard this 15m move—up 3.57% straight away, trading volume shot up to 2.99x, but the OI for 15m actually fell by 2.54%. That’s a textbook short-covering order flow, not fresh long entries.
The OI on the 1h timeframe is still rising though—nominal 5.65M, +17.46%—which suggests someone is willing to take orders at these levels. Active traded gap is 4.4%, buy/sell ratio 1.09, slightly buy-dominant, but not to the point of frantic chasing.
I’ve been burned by this kind of structure before: the shorts close and push the price up, and once they’re done covering it tends to leak. The 24h turnover at 169M isn’t small, and the depth is there, but the OI abnormal percentile is only 47%, ranking #41 across the whole pool—still not at an extremely crowded level.
Chasing higher—be careful. Don’t end up being the last baton you hand to the shorts. Watch whether it can hold the level; otherwise it could be just a single pin’s worth of downside.
The OI on the 1h timeframe is still rising though—nominal 5.65M, +17.46%—which suggests someone is willing to take orders at these levels. Active traded gap is 4.4%, buy/sell ratio 1.09, slightly buy-dominant, but not to the point of frantic chasing.
I’ve been burned by this kind of structure before: the shorts close and push the price up, and once they’re done covering it tends to leak. The 24h turnover at 169M isn’t small, and the depth is there, but the OI abnormal percentile is only 47%, ranking #41 across the whole pool—still not at an extremely crowded level.
Chasing higher—be careful. Don’t end up being the last baton you hand to the shorts. Watch whether it can hold the level; otherwise it could be just a single pin’s worth of downside.
55


·
--
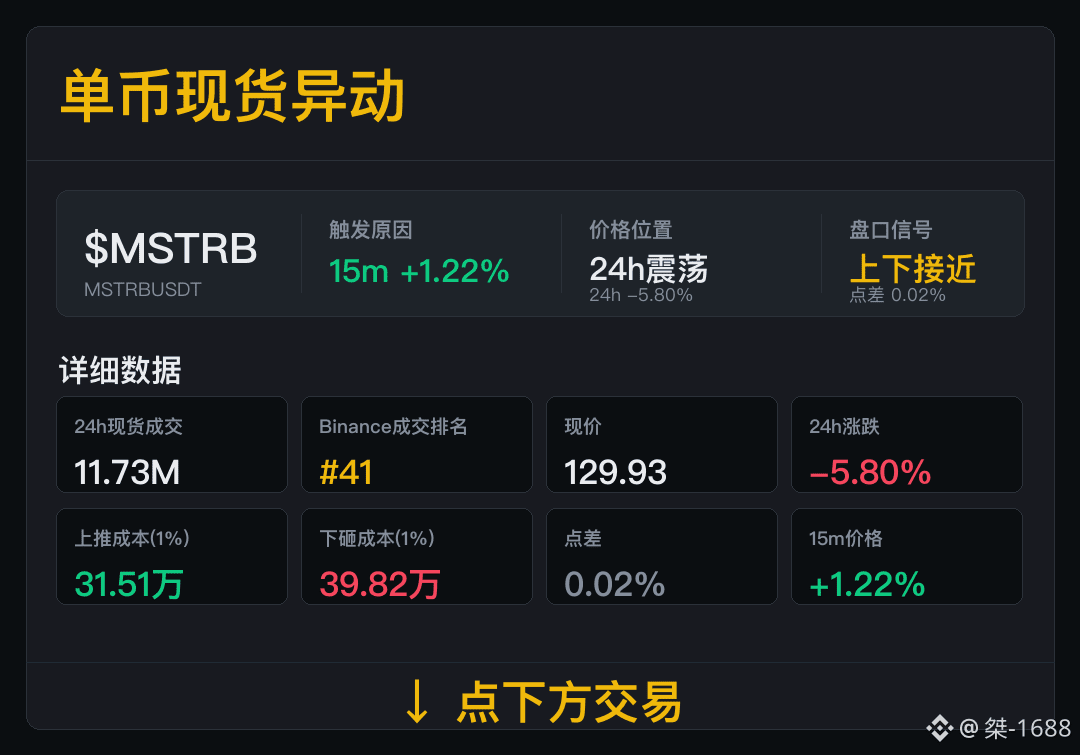
$MSTRB is available now and the spot market starts to accelerate—can the volume sustain, and is it more critical?
Spot成交 11.73M, Binance成交排名 #41. For now, observe by participating in the spot market first; when volume weakens, downgrade in time.
Now 24h change -5.80%; spread 0.02%, the push-up cost is 315,100, and the sell-down cost is 398,200. Going forward, if the spread remains stable and trading continues, then order-book information will have more reference value.
If trading volume weakens or the spread widens, short-term signals should all be downgraded.
$MSTRB is available now and the spot market starts to accelerate—can the volume sustain, and is it more critical?
Spot成交 11.73M, Binance成交排名 #41. For now, observe by participating in the spot market first; when volume weakens, downgrade in time.
Now 24h change -5.80%; spread 0.02%, the push-up cost is 315,100, and the sell-down cost is 398,200. Going forward, if the spread remains stable and trading continues, then order-book information will have more reference value.
If trading volume weakens or the spread widens, short-term signals should all be downgraded.
Spot成交 11.73M, Binance成交排名 #41. For now, observe by participating in the spot market first; when volume weakens, downgrade in time.
Now 24h change -5.80%; spread 0.02%, the push-up cost is 315,100, and the sell-down cost is 398,200. Going forward, if the spread remains stable and trading continues, then order-book information will have more reference value.
If trading volume weakens or the spread widens, short-term signals should all be downgraded.
121

·
--
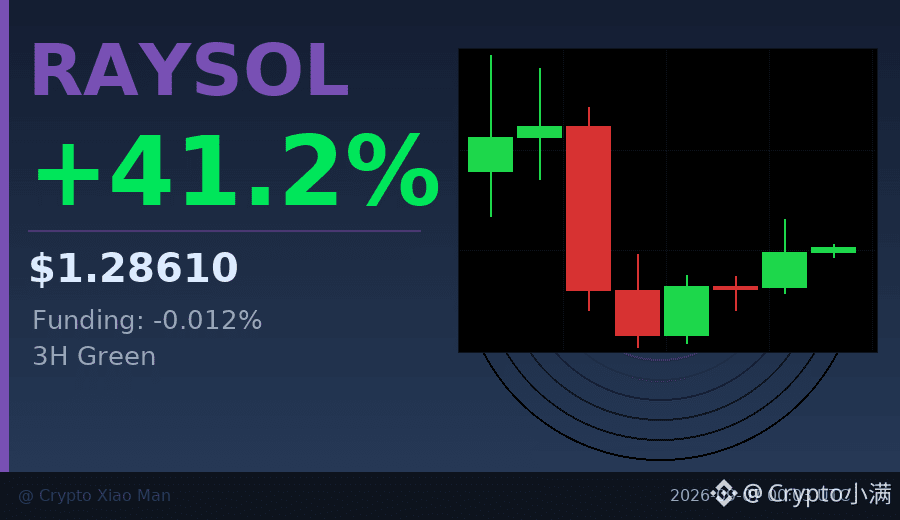
41% increase, but the funding rate is negative — this divergence is a bit interesting.
RAYSOL moved from 0.90 to 1.44 today, and has now pulled back to 1.28, with trading volume of 458 million US dollars. Normally, with a rally of this scale, longs should be fighting to pay the funding rate, but the current funding rate is -0.012%, meaning shorts are still paying longs.
The hourly chart has already closed three consecutive green candles, which shows that buying pressure is not just a short-lived spike, but a sustained inflow. The long-short ratio is 53% to 47%, so it isn't extremely crowded either.
This kind of divergence is either true strength (shorts refusing to give up), or a spot-driven move that futures haven't caught up with. I lean toward the former — if the funding rate turns positive later and the price holds steady, the trend may not be over yet.
$RAYSOL #资金费率背离 #41%
Click the small card below to quickly view the market 👇
41% increase, but the funding rate is negative — this divergence is a bit interesting.
RAYSOL moved from 0.90 to 1.44 today, and has now pulled back to 1.28, with trading volume of 458 million US dollars. Normally, with a rally of this scale, longs should be fighting to pay the funding rate, but the current funding rate is -0.012%, meaning shorts are still paying longs.
The hourly chart has already closed three consecutive green candles, which shows that buying pressure is not just a short-lived spike, but a sustained inflow. The long-short ratio is 53% to 47%, so it isn't extremely crowded either.
This kind of divergence is either true strength (shorts refusing to give up), or a spot-driven move that futures haven't caught up with. I lean toward the former — if the funding rate turns positive later and the price holds steady, the trend may not be over yet.
$RAYSOL #资金费率背离 #41%
Click the small card below to quickly view the market 👇
RAYSOL moved from 0.90 to 1.44 today, and has now pulled back to 1.28, with trading volume of 458 million US dollars. Normally, with a rally of this scale, longs should be fighting to pay the funding rate, but the current funding rate is -0.012%, meaning shorts are still paying longs.
The hourly chart has already closed three consecutive green candles, which shows that buying pressure is not just a short-lived spike, but a sustained inflow. The long-short ratio is 53% to 47%, so it isn't extremely crowded either.
This kind of divergence is either true strength (shorts refusing to give up), or a spot-driven move that futures haven't caught up with. I lean toward the former — if the funding rate turns positive later and the price holds steady, the trend may not be over yet.
$RAYSOL #资金费率背离 #41%
Click the small card below to quickly view the market 👇
112
·
--
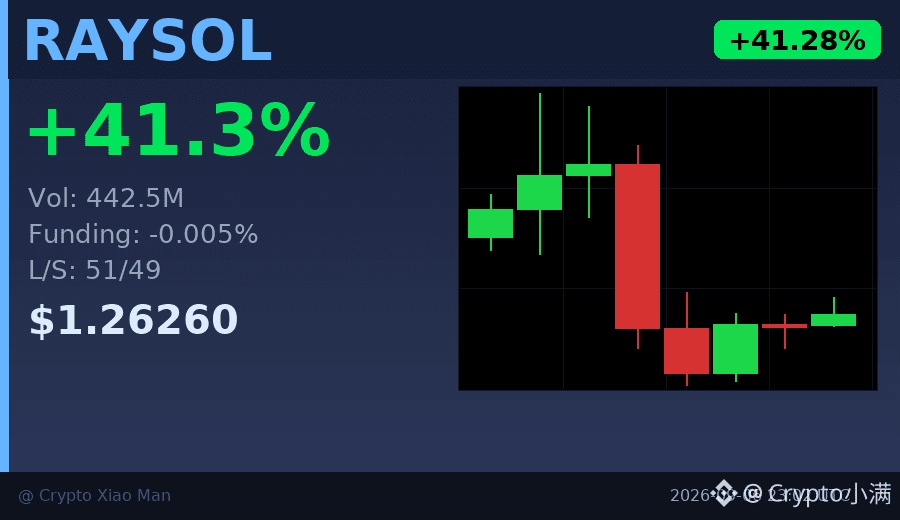
41% gain, but the funding rate is negative — that’s unusual.
RAYSOL’s trading volume today surged to $440 million, with the price rising from 0.89 to 1.44 before pulling back to 1.26.
Most people would chase a move like this, but in practice, nearly half of the open positions are short.
I think this suggests two things: first, this rally is mainly driven by spot buying, not leveraged positioning;
second, the 8-hour trend is already weakening, and those buying at the top are starting to hesitate.
In a market like this, I usually wouldn’t rush in. I’d wait for it to stabilize before taking a look.
$RAYSOL #资金费率背离 #41%
Click the card below to quickly view the market👇
41% gain, but the funding rate is negative — that’s unusual.
RAYSOL’s trading volume today surged to $440 million, with the price rising from 0.89 to 1.44 before pulling back to 1.26.
Most people would chase a move like this, but in practice, nearly half of the open positions are short.
I think this suggests two things: first, this rally is mainly driven by spot buying, not leveraged positioning;
second, the 8-hour trend is already weakening, and those buying at the top are starting to hesitate.
In a market like this, I usually wouldn’t rush in. I’d wait for it to stabilize before taking a look.
$RAYSOL #资金费率背离 #41%
Click the card below to quickly view the market👇
RAYSOL’s trading volume today surged to $440 million, with the price rising from 0.89 to 1.44 before pulling back to 1.26.
Most people would chase a move like this, but in practice, nearly half of the open positions are short.
I think this suggests two things: first, this rally is mainly driven by spot buying, not leveraged positioning;
second, the 8-hour trend is already weakening, and those buying at the top are starting to hesitate.
In a market like this, I usually wouldn’t rush in. I’d wait for it to stabilize before taking a look.
$RAYSOL #资金费率背离 #41%
Click the card below to quickly view the market👇
16
·
--
Behind the 41% gain, the funding rate is negative—what does that mean?
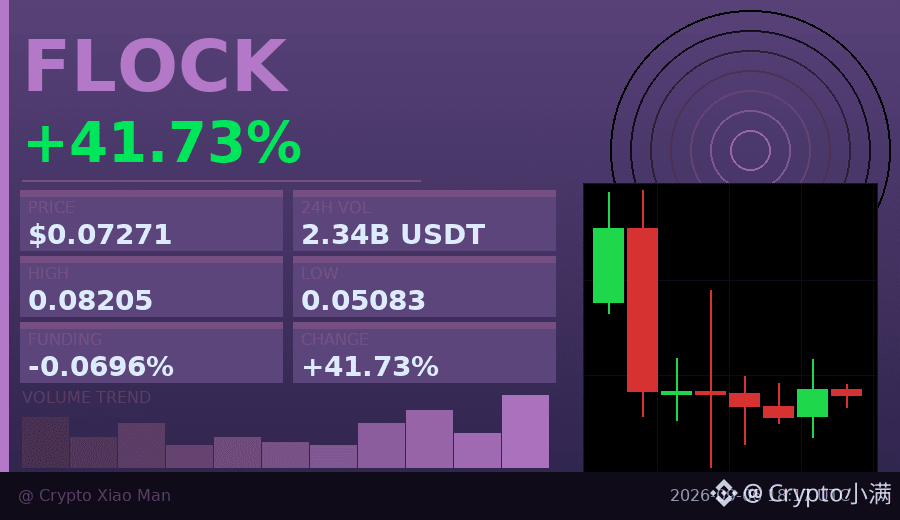
FLOCK surged 41.73% today, rising to 0.082 before pulling back to 0.0727. But interestingly, the funding rate is -0.069%, meaning shorts are still paying longs.
Trading volume was $234 million, which is not small. However, the overall 8-hour trend weakened, and the high level did not hold.
Longs account for 56%, so the positioning is not extremely crowded. My take: this rally was partly driven by short stop-losses, but there is not enough willingness to chase the price higher.
If funding stays negative, it means some traders are still willing to short despite the price surge—either because they think it is too high, or because they are hedging.
$FLOCK #资金费率背离 #41%
Click the small card below to quickly view the market👇
Behind the 41% gain, the funding rate is negative—what does that mean?
FLOCK surged 41.73% today, rising to 0.082 before pulling back to 0.0727. But interestingly, the funding rate is -0.069%, meaning shorts are still paying longs.
Trading volume was $234 million, which is not small. However, the overall 8-hour trend weakened, and the high level did not hold.
Longs account for 56%, so the positioning is not extremely crowded. My take: this rally was partly driven by short stop-losses, but there is not enough willingness to chase the price higher.
If funding stays negative, it means some traders are still willing to short despite the price surge—either because they think it is too high, or because they are hedging.
$FLOCK #资金费率背离 #41%
Click the small card below to quickly view the market👇
FLOCK surged 41.73% today, rising to 0.082 before pulling back to 0.0727. But interestingly, the funding rate is -0.069%, meaning shorts are still paying longs.
Trading volume was $234 million, which is not small. However, the overall 8-hour trend weakened, and the high level did not hold.
Longs account for 56%, so the positioning is not extremely crowded. My take: this rally was partly driven by short stop-losses, but there is not enough willingness to chase the price higher.
If funding stays negative, it means some traders are still willing to short despite the price surge—either because they think it is too high, or because they are hedging.
$FLOCK #资金费率背离 #41%
Click the small card below to quickly view the market👇
11
·
--
41% single-day gain, ARB surprised everyone today.
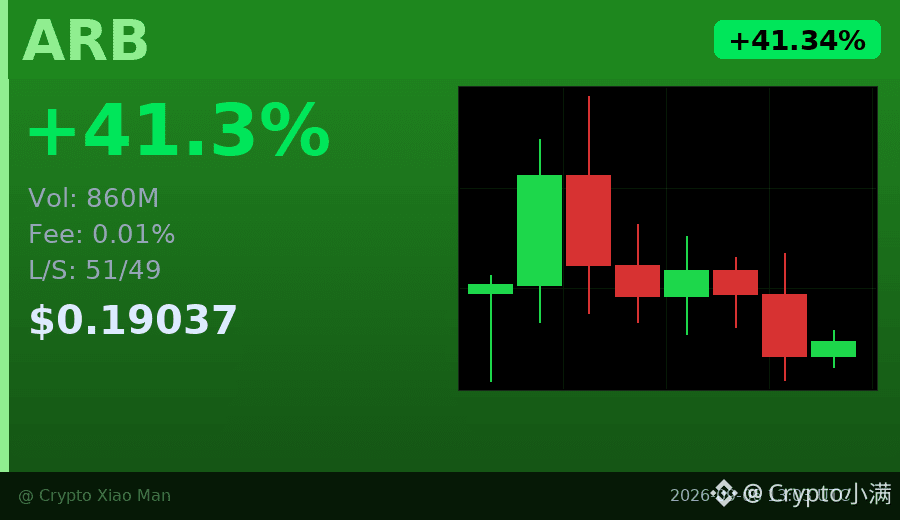
The price surged from 0.13 to 0.20, and trading volume hit 860 million USDT, but the funding rate was only 0.01%, meaning almost no one was paying a premium to go long.
More interestingly, the long/short ratio is 51%/49%, nearly evenly split — this suggests the rally wasn’t driven by leverage, but more like spot buyers quietly accumulating.
The candlestick chart shows short-term consolidation in the 0.19-0.20 range. If it holds above 0.195, the next move may test 0.21; if it falls below 0.188, watch out for a pullback to 0.17.
This kind of low-fee, high-volume rally is often more solid than a leverage-driven pump.
$ARB #ARB #41%
Click the small card below to quickly check the market👇
41% single-day gain, ARB surprised everyone today.
The price surged from 0.13 to 0.20, and trading volume hit 860 million USDT, but the funding rate was only 0.01%, meaning almost no one was paying a premium to go long.
More interestingly, the long/short ratio is 51%/49%, nearly evenly split — this suggests the rally wasn’t driven by leverage, but more like spot buyers quietly accumulating.
The candlestick chart shows short-term consolidation in the 0.19-0.20 range. If it holds above 0.195, the next move may test 0.21; if it falls below 0.188, watch out for a pullback to 0.17.
This kind of low-fee, high-volume rally is often more solid than a leverage-driven pump.
$ARB #ARB #41%
Click the small card below to quickly check the market👇
The price surged from 0.13 to 0.20, and trading volume hit 860 million USDT, but the funding rate was only 0.01%, meaning almost no one was paying a premium to go long.
More interestingly, the long/short ratio is 51%/49%, nearly evenly split — this suggests the rally wasn’t driven by leverage, but more like spot buyers quietly accumulating.
The candlestick chart shows short-term consolidation in the 0.19-0.20 range. If it holds above 0.195, the next move may test 0.21; if it falls below 0.188, watch out for a pullback to 0.17.
This kind of low-fee, high-volume rally is often more solid than a leverage-driven pump.
$ARB #ARB #41%
Click the small card below to quickly check the market👇
72

·
--
Bullish
60-SECOND ALPHA #41 | $JTO
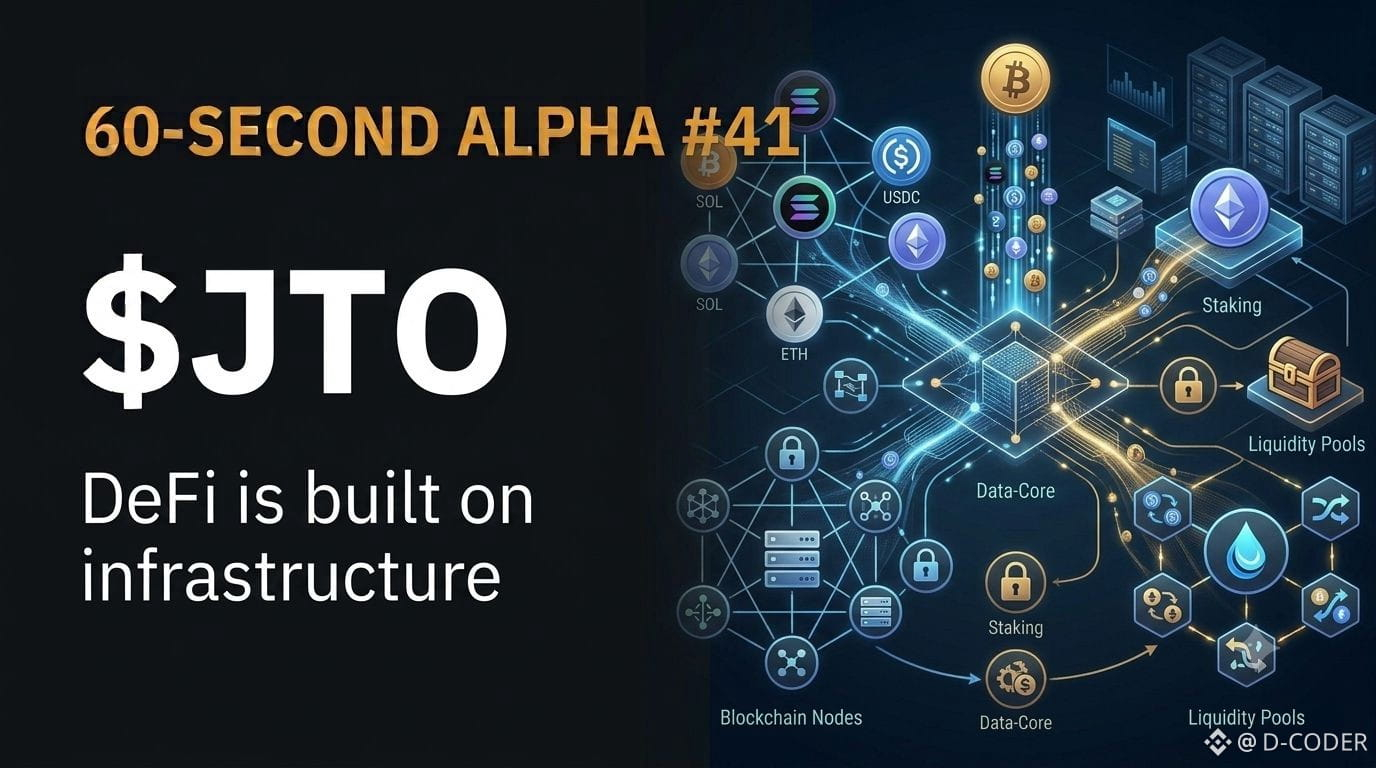
$JTO is connected to the Jito ecosystem on Solana, where staking, liquidity and MEV infrastructure come together. That makes it a good example of how a token can sit inside a much larger DeFi system.
Alpha: Don't judge a DeFi token only by its ticker. Understand the infrastructure behind it.
{future}(JTOUSDT)
60-SECOND ALPHA #41 | $JTO
$JTO is connected to the Jito ecosystem on Solana, where staking, liquidity and MEV infrastructure come together. That makes it a good example of how a token can sit inside a much larger DeFi system.
Alpha: Don't judge a DeFi token only by its ticker. Understand the infrastructure behind it.
$JTO is connected to the Jito ecosystem on Solana, where staking, liquidity and MEV infrastructure come together. That makes it a good example of how a token can sit inside a much larger DeFi system.
Alpha: Don't judge a DeFi token only by its ticker. Understand the infrastructure behind it.
100
·
--
41% increase, but the funding rate is only 0.005?
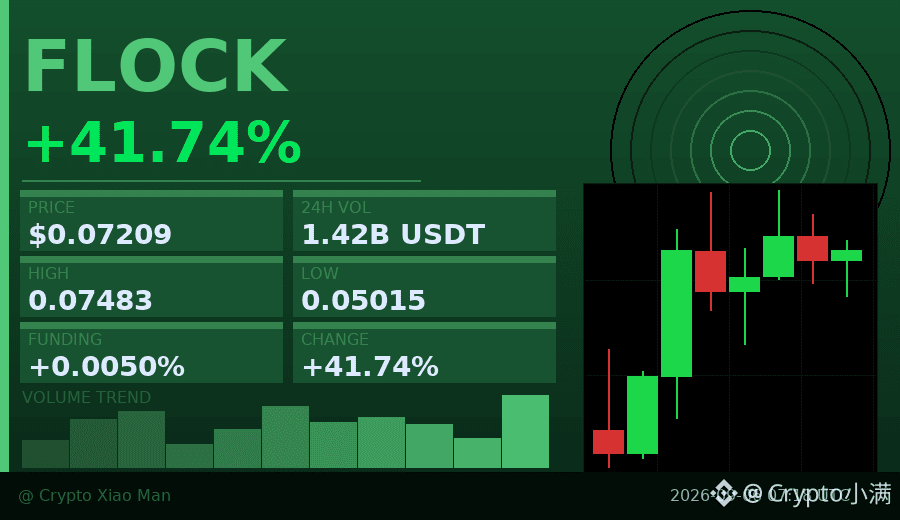
This rally in FLOCK is quite interesting. Within 8 hours, it climbed from 0.05 all the way to 0.072, with trading volume of 142 million U, but the funding rate barely moved.
What does that mean? This rise was not driven by excessive leverage. Long positions account for 59%, which is not extremely crowded, and the funding rate is low, meaning there is still room for new capital to come in.
The candlesticks strengthened continuously for 8 hours without a major pullback in between, showing relatively solid buying support. This kind of combination of low funding and strong gains is often more sustainable than a rally with a funding rate that has exploded.
Of course, after a strong short-term move, there will always be some profit-taking. The key is whether 0.07 can hold.
$FLOCK #低费率拉升 #41%
Click the small card below to quickly check the market👇
41% increase, but the funding rate is only 0.005?
This rally in FLOCK is quite interesting. Within 8 hours, it climbed from 0.05 all the way to 0.072, with trading volume of 142 million U, but the funding rate barely moved.
What does that mean? This rise was not driven by excessive leverage. Long positions account for 59%, which is not extremely crowded, and the funding rate is low, meaning there is still room for new capital to come in.
The candlesticks strengthened continuously for 8 hours without a major pullback in between, showing relatively solid buying support. This kind of combination of low funding and strong gains is often more sustainable than a rally with a funding rate that has exploded.
Of course, after a strong short-term move, there will always be some profit-taking. The key is whether 0.07 can hold.
$FLOCK #低费率拉升 #41%
Click the small card below to quickly check the market👇
This rally in FLOCK is quite interesting. Within 8 hours, it climbed from 0.05 all the way to 0.072, with trading volume of 142 million U, but the funding rate barely moved.
What does that mean? This rise was not driven by excessive leverage. Long positions account for 59%, which is not extremely crowded, and the funding rate is low, meaning there is still room for new capital to come in.
The candlesticks strengthened continuously for 8 hours without a major pullback in between, showing relatively solid buying support. This kind of combination of low funding and strong gains is often more sustainable than a rally with a funding rate that has exploded.
Of course, after a strong short-term move, there will always be some profit-taking. The key is whether 0.07 can hold.
$FLOCK #低费率拉升 #41%
Click the small card below to quickly check the market👇
39
·
--
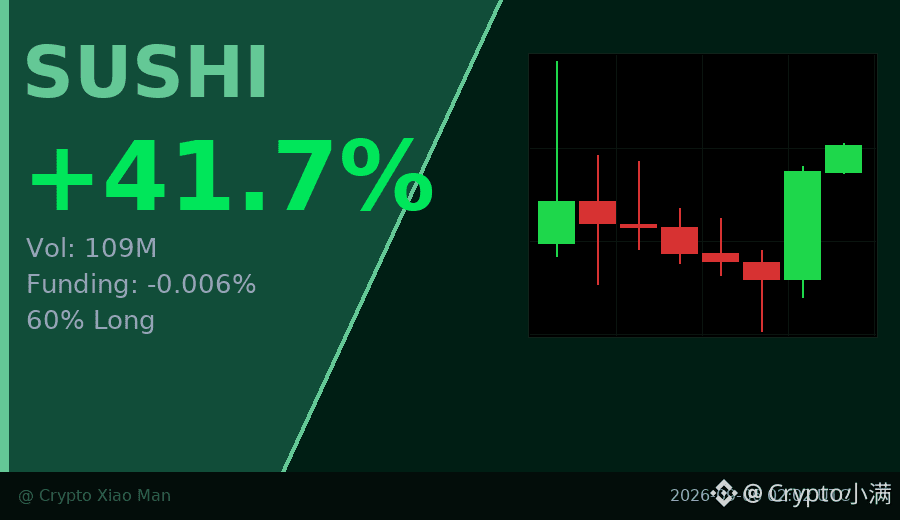
41% gain, but the funding rate is negative — this SUSHI move is interesting.
Price rose from 0.19 to 0.2693, with trading volume reaching $109 million. The hourly chart printed three consecutive bullish candles and closed higher. But the funding rate is -0.0059%, which means shorts are paying longs, while the long/short ratio of 60/40 still leans bullish.
This kind of divergence usually appears in two situations: either it is a shakeout before a real breakout, or short-term sentiment is overheated. I’d first watch whether the previous high at 0.28 can hold. Volume is expanding, but funding has not kept up, so chasing longs should be done cautiously.
$SUSHI #资金费率背离 #41%
Click the small card below to quickly view the market 👇
41% gain, but the funding rate is negative — this SUSHI move is interesting.
Price rose from 0.19 to 0.2693, with trading volume reaching $109 million. The hourly chart printed three consecutive bullish candles and closed higher. But the funding rate is -0.0059%, which means shorts are paying longs, while the long/short ratio of 60/40 still leans bullish.
This kind of divergence usually appears in two situations: either it is a shakeout before a real breakout, or short-term sentiment is overheated. I’d first watch whether the previous high at 0.28 can hold. Volume is expanding, but funding has not kept up, so chasing longs should be done cautiously.
$SUSHI #资金费率背离 #41%
Click the small card below to quickly view the market 👇
Price rose from 0.19 to 0.2693, with trading volume reaching $109 million. The hourly chart printed three consecutive bullish candles and closed higher. But the funding rate is -0.0059%, which means shorts are paying longs, while the long/short ratio of 60/40 still leans bullish.
This kind of divergence usually appears in two situations: either it is a shakeout before a real breakout, or short-term sentiment is overheated. I’d first watch whether the previous high at 0.28 can hold. Volume is expanding, but funding has not kept up, so chasing longs should be done cautiously.
$SUSHI #资金费率背离 #41%
Click the small card below to quickly view the market 👇
32
·
--
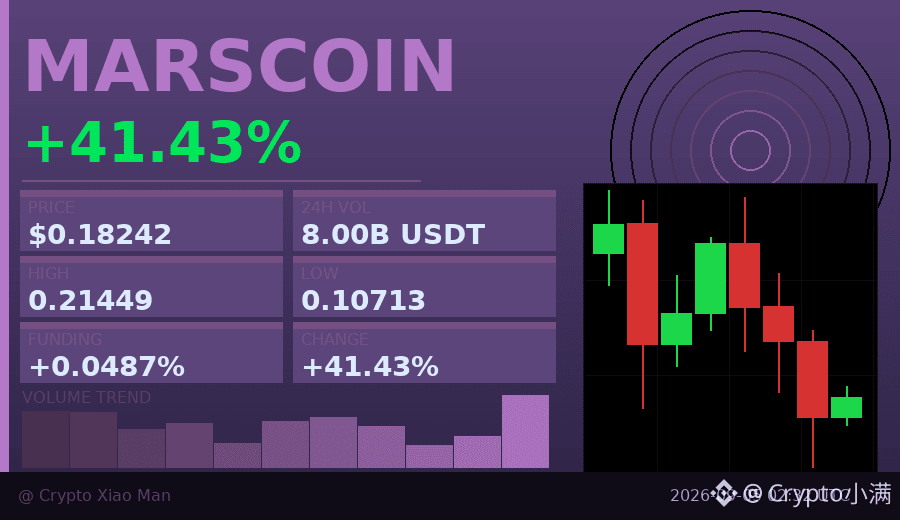
Behind the 41% surge, why are shorts getting more aggressive as it falls?
MARSCOIN surged from $0.107 to $0.214 today, and has since pulled back to $0.182. It looks like a victory for the bulls, but positioning data tells a different story — 63% short positions against 37% long positions.
Trading volume hit $800 million, yet the price weakened within 8 hours. What does that mean? Either shorts are waiting to add at higher levels, or longs are starting to take profits.
This kind of divergence usually doesn’t end quietly. It will either keep squeezing shorts, or bulls may fail to hold and trigger a cascade. I’m inclined to stay on the sidelines for now and wait for the direction to become clear.
$MARSCOIN #加密货币 #41%
Click the card below to quickly check the market 👇
Behind the 41% surge, why are shorts getting more aggressive as it falls?
MARSCOIN surged from $0.107 to $0.214 today, and has since pulled back to $0.182. It looks like a victory for the bulls, but positioning data tells a different story — 63% short positions against 37% long positions.
Trading volume hit $800 million, yet the price weakened within 8 hours. What does that mean? Either shorts are waiting to add at higher levels, or longs are starting to take profits.
This kind of divergence usually doesn’t end quietly. It will either keep squeezing shorts, or bulls may fail to hold and trigger a cascade. I’m inclined to stay on the sidelines for now and wait for the direction to become clear.
$MARSCOIN #加密货币 #41%
Click the card below to quickly check the market 👇
MARSCOIN surged from $0.107 to $0.214 today, and has since pulled back to $0.182. It looks like a victory for the bulls, but positioning data tells a different story — 63% short positions against 37% long positions.
Trading volume hit $800 million, yet the price weakened within 8 hours. What does that mean? Either shorts are waiting to add at higher levels, or longs are starting to take profits.
This kind of divergence usually doesn’t end quietly. It will either keep squeezing shorts, or bulls may fail to hold and trigger a cascade. I’m inclined to stay on the sidelines for now and wait for the direction to become clear.
$MARSCOIN #加密货币 #41%
Click the card below to quickly check the market 👇
46
·
--
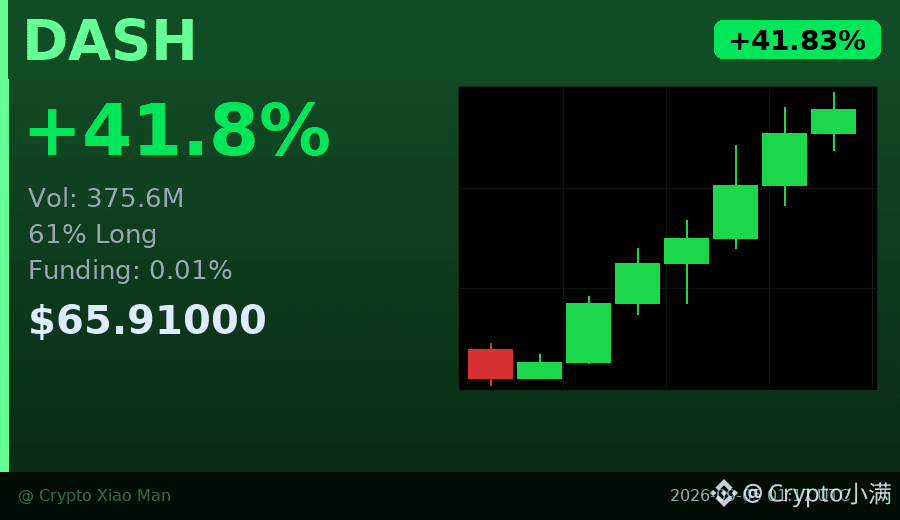
41.83% gain, DASH jumped directly from $46 to $66, with trading volume surging to $376 million.
Hourly candles have closed green consecutively, and buying momentum is clearly accelerating. The funding rate is only 0.01%, which shows it’s not overheated yet.
Long/short ratio: 61% long, not extremely crowded, so there’s still room.
For a stock/coin with both price and volume rising, short-term momentum is still there.
$DASH #达世币 #41.83%
Click the small card below to quickly view the market 👇
41.83% gain, DASH jumped directly from $46 to $66, with trading volume surging to $376 million.
Hourly candles have closed green consecutively, and buying momentum is clearly accelerating. The funding rate is only 0.01%, which shows it’s not overheated yet.
Long/short ratio: 61% long, not extremely crowded, so there’s still room.
For a stock/coin with both price and volume rising, short-term momentum is still there.
$DASH #达世币 #41.83%
Click the small card below to quickly view the market 👇
Hourly candles have closed green consecutively, and buying momentum is clearly accelerating. The funding rate is only 0.01%, which shows it’s not overheated yet.
Long/short ratio: 61% long, not extremely crowded, so there’s still room.
For a stock/coin with both price and volume rising, short-term momentum is still there.
$DASH #达世币 #41.83%
Click the small card below to quickly view the market 👇
185
·
--
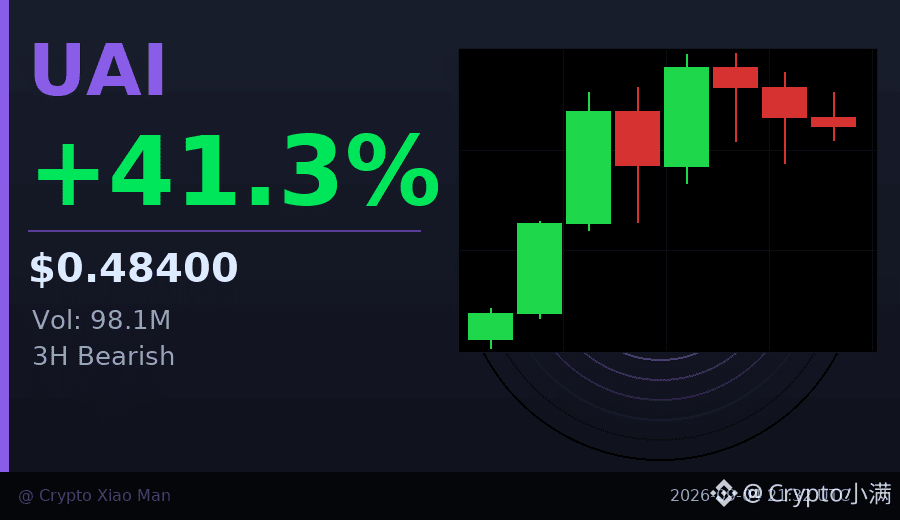
After a 41% surge, UAI is starting to catch its breath.
Over the past 24 hours, it moved from 0.32 to 0.51, with trading volume surging to 98 million U.
But the last 3 hourly candlesticks have all been pulling back — a classic sign of profit-taking after a sharp rise.
The funding rate is 0.037%, and the long/short ratio is 54% to 46%, so it’s not extremely crowded.
That suggests this rally hasn’t yet reached full-blown FOMO.
It’s now fluctuating around 0.48. Let’s see whether this is a continuation platform or a short-term top.
$UAI #强势币回调 #41%涨幅
Click the card below to quickly check the market 👇
After a 41% surge, UAI is starting to catch its breath.
Over the past 24 hours, it moved from 0.32 to 0.51, with trading volume surging to 98 million U.
But the last 3 hourly candlesticks have all been pulling back — a classic sign of profit-taking after a sharp rise.
The funding rate is 0.037%, and the long/short ratio is 54% to 46%, so it’s not extremely crowded.
That suggests this rally hasn’t yet reached full-blown FOMO.
It’s now fluctuating around 0.48. Let’s see whether this is a continuation platform or a short-term top.
$UAI #强势币回调 #41%涨幅
Click the card below to quickly check the market 👇
Over the past 24 hours, it moved from 0.32 to 0.51, with trading volume surging to 98 million U.
But the last 3 hourly candlesticks have all been pulling back — a classic sign of profit-taking after a sharp rise.
The funding rate is 0.037%, and the long/short ratio is 54% to 46%, so it’s not extremely crowded.
That suggests this rally hasn’t yet reached full-blown FOMO.
It’s now fluctuating around 0.48. Let’s see whether this is a continuation platform or a short-term top.
$UAI #强势币回调 #41%涨幅
Click the card below to quickly check the market 👇
80
·
--
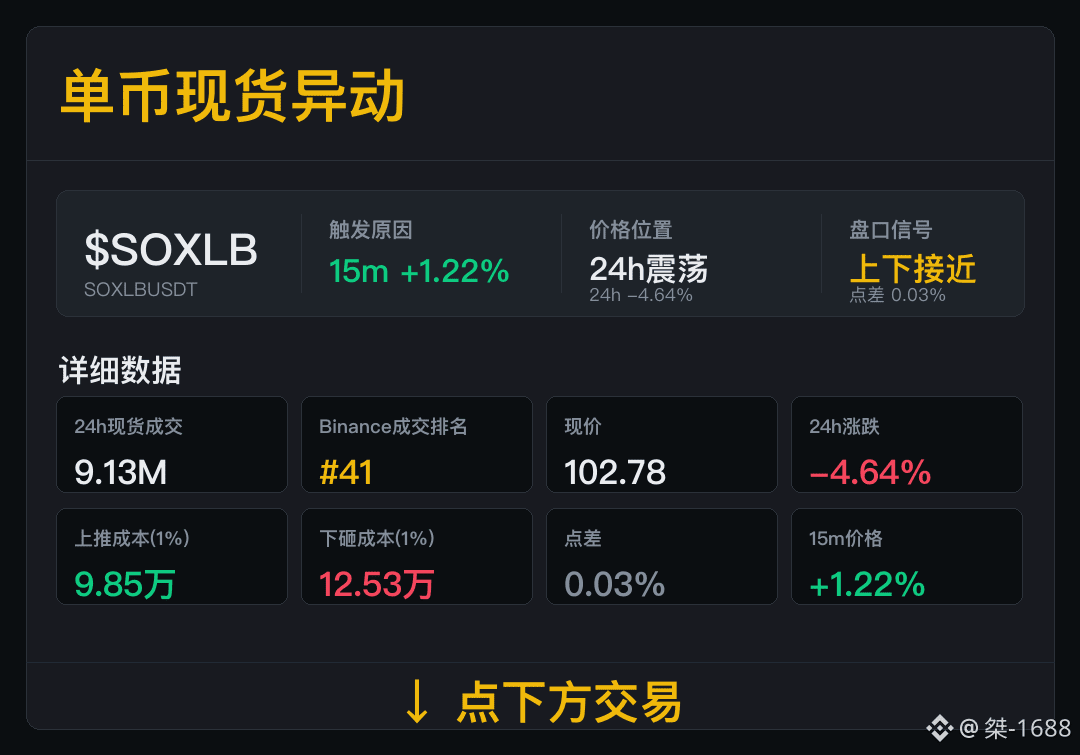
$SOXLB 15m Spot market anomaly, the price has jumped—now the key is whether the trading volume can keep it supported.
Spot trade volume 9.13M, Binance volume rank #41. The current participation size has already been specified; we will verify the trades in the next round as well.
Over the past 24h, price change is -4.64%; spread 0.03%. Pushing costs up to 98,500; pushing costs down to 125,300. First, make sure the entry/exit costs are clearly calculated, then check whether the trading can continue.
If trading volume weakens or the spread widens, short-term signals should all be downgraded.
$SOXLB 15m Spot market anomaly, the price has jumped—now the key is whether the trading volume can keep it supported.
Spot trade volume 9.13M, Binance volume rank #41. The current participation size has already been specified; we will verify the trades in the next round as well.
Over the past 24h, price change is -4.64%; spread 0.03%. Pushing costs up to 98,500; pushing costs down to 125,300. First, make sure the entry/exit costs are clearly calculated, then check whether the trading can continue.
If trading volume weakens or the spread widens, short-term signals should all be downgraded.
Spot trade volume 9.13M, Binance volume rank #41. The current participation size has already been specified; we will verify the trades in the next round as well.
Over the past 24h, price change is -4.64%; spread 0.03%. Pushing costs up to 98,500; pushing costs down to 125,300. First, make sure the entry/exit costs are clearly calculated, then check whether the trading can continue.
If trading volume weakens or the spread widens, short-term signals should all be downgraded.
201
·
--
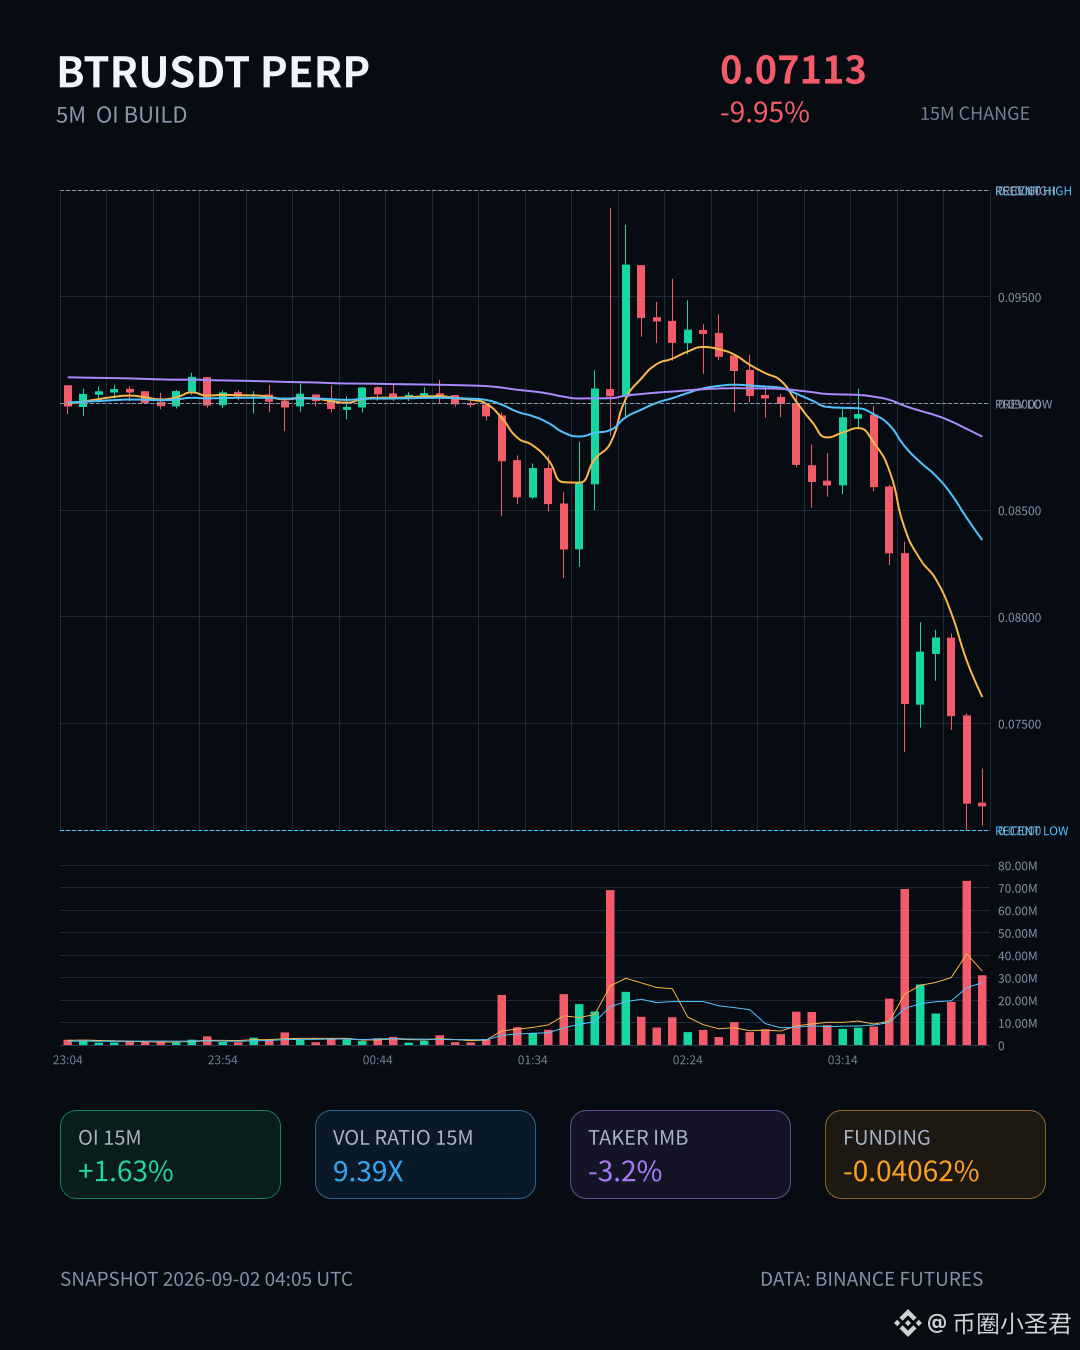
$BTR This 15-minute move directly plunged 9.95%, and the trading volume has surged to more than 9x the usual level. I don’t think it’s just retail investors running.
Open contract positions are still rising, but the notional value is down 8.37%—a classic case of leveraged short sellers adding to their positions. On the 1-hour timeframe it’s even clearer: OI shrank 19.55%, with the longs being cleared out completely.
In the pool’s abnormal signal rankings, it’s #41; the notional change has pushed into the top six. With this combination of depth and volume, it’s very likely not a false move. Buying power is 0.94, and sell pressure from active dumping is dominant—so the strength of a short-term rebound is questionable.
Don’t rush to bottom-fish. Wait until position volume starts to fall before acting.
$BTR This 15-minute move directly plunged 9.95%, and the trading volume has surged to more than 9x the usual level. I don’t think it’s just retail investors running.
Open contract positions are still rising, but the notional value is down 8.37%—a classic case of leveraged short sellers adding to their positions. On the 1-hour timeframe it’s even clearer: OI shrank 19.55%, with the longs being cleared out completely.
In the pool’s abnormal signal rankings, it’s #41; the notional change has pushed into the top six. With this combination of depth and volume, it’s very likely not a false move. Buying power is 0.94, and sell pressure from active dumping is dominant—so the strength of a short-term rebound is questionable.
Don’t rush to bottom-fish. Wait until position volume starts to fall before acting.
Open contract positions are still rising, but the notional value is down 8.37%—a classic case of leveraged short sellers adding to their positions. On the 1-hour timeframe it’s even clearer: OI shrank 19.55%, with the longs being cleared out completely.
In the pool’s abnormal signal rankings, it’s #41; the notional change has pushed into the top six. With this combination of depth and volume, it’s very likely not a false move. Buying power is 0.94, and sell pressure from active dumping is dominant—so the strength of a short-term rebound is questionable.
Don’t rush to bottom-fish. Wait until position volume starts to fall before acting.
24
·
--
To be honest, $BTR today’s data combination made me take a second look.
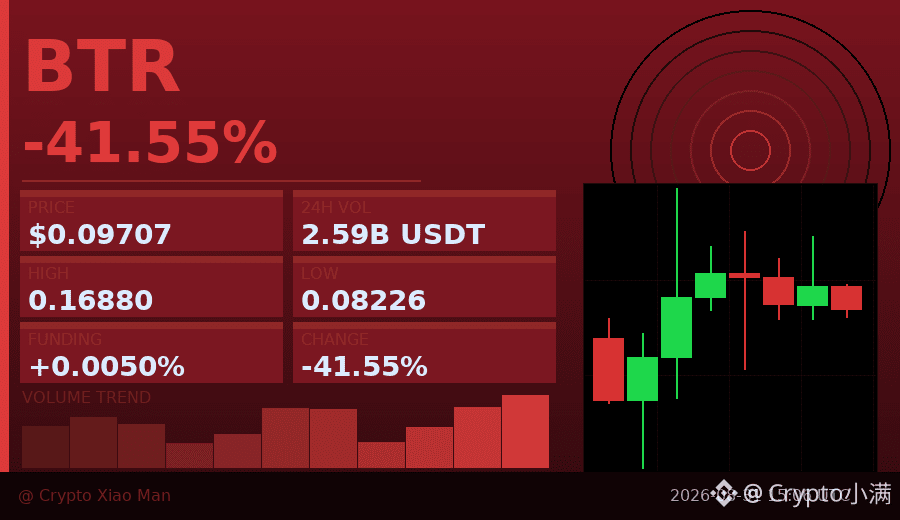
The 24-hour drop is over 41%—it was smashed down from the high of 0.1688 to the low of 0.0823, falling nearly by half.
But the interesting part isn’t the drop itself—it’s the structure.
Currently, shorts make up 62%, while longs are only 38%.
That means most of the positions in the market are betting that it will keep falling.
In this situation, the coin price should actually be watched carefully—if the decline can’t go any further, those short positions that were waiting with no room left will be forced to close,
and the act of closing shorts will then push the price upward in the opposite direction, commonly called “short covering.”
Today’s trading volume is also not small—$259 million. For a small coin at this price level, that’s quite active.
And looking at the recent candlesticks, the lows are getting higher, and selling pressure is weakening.
I’m not saying it will bounce back, but this setup—after a big drop, shorts piling in, volume shrinking, and the lows lifting—
is exactly the kind of trigger I would keep an eye on. If it can hold above 0.10, those shorts will feel very uncomfortable.
For now, it’s just observation—not an entry signal. After this kind of crash, there are often aftershocks. Until the direction is confirmed, keep your positions light.
$BTR #空头陷阱 #41%暴跌
Click the small card below to quickly view the market 👇
To be honest, $BTR today’s data combination made me take a second look.
The 24-hour drop is over 41%—it was smashed down from the high of 0.1688 to the low of 0.0823, falling nearly by half.
But the interesting part isn’t the drop itself—it’s the structure.
Currently, shorts make up 62%, while longs are only 38%.
That means most of the positions in the market are betting that it will keep falling.
In this situation, the coin price should actually be watched carefully—if the decline can’t go any further, those short positions that were waiting with no room left will be forced to close,
and the act of closing shorts will then push the price upward in the opposite direction, commonly called “short covering.”
Today’s trading volume is also not small—$259 million. For a small coin at this price level, that’s quite active.
And looking at the recent candlesticks, the lows are getting higher, and selling pressure is weakening.
I’m not saying it will bounce back, but this setup—after a big drop, shorts piling in, volume shrinking, and the lows lifting—
is exactly the kind of trigger I would keep an eye on. If it can hold above 0.10, those shorts will feel very uncomfortable.
For now, it’s just observation—not an entry signal. After this kind of crash, there are often aftershocks. Until the direction is confirmed, keep your positions light.
$BTR #空头陷阱 #41%暴跌
Click the small card below to quickly view the market 👇
The 24-hour drop is over 41%—it was smashed down from the high of 0.1688 to the low of 0.0823, falling nearly by half.
But the interesting part isn’t the drop itself—it’s the structure.
Currently, shorts make up 62%, while longs are only 38%.
That means most of the positions in the market are betting that it will keep falling.
In this situation, the coin price should actually be watched carefully—if the decline can’t go any further, those short positions that were waiting with no room left will be forced to close,
and the act of closing shorts will then push the price upward in the opposite direction, commonly called “short covering.”
Today’s trading volume is also not small—$259 million. For a small coin at this price level, that’s quite active.
And looking at the recent candlesticks, the lows are getting higher, and selling pressure is weakening.
I’m not saying it will bounce back, but this setup—after a big drop, shorts piling in, volume shrinking, and the lows lifting—
is exactly the kind of trigger I would keep an eye on. If it can hold above 0.10, those shorts will feel very uncomfortable.
For now, it’s just observation—not an entry signal. After this kind of crash, there are often aftershocks. Until the direction is confirmed, keep your positions light.
$BTR #空头陷阱 #41%暴跌
Click the small card below to quickly view the market 👇
565

·
--
$VET This 15-minute move is somewhat interesting—it directly pushed through the upper limit of nearly 20 K bars. Trading volume also rose in sync to 2.2x. This isn’t a fake breakout achieved by a tight, low-volume pull.
What’s even more worth noting is that OI is also increasing. The 15m nominal increment has already broken 100k U. The market is getting closer to fresh long positions entering and taking over, rather than just shorts covering.
The active buy/sell ratio is 2.32, with a net buy-side imbalance of 39.7%—the direction is already very clear. The funding rate is also sitting at a recent high level, suggesting leveraged longs are willing to pay a premium to hold positions, and the tempo is strong enough.
For VET, this round’s abnormal pool ranking is #20, and the nominal change is #41. It’s not in the absolute top tier, but within the tail-end sequence, such a structure is worth keeping an eye on. First, see whether this breakout can be defended. If it doesn’t break on a retest, there should be another leg ahead.
$VET This 15-minute move is somewhat interesting—it directly pushed through the upper limit of nearly 20 K bars. Trading volume also rose in sync to 2.2x. This isn’t a fake breakout achieved by a tight, low-volume pull.
What’s even more worth noting is that OI is also increasing. The 15m nominal increment has already broken 100k U. The market is getting closer to fresh long positions entering and taking over, rather than just shorts covering.
The active buy/sell ratio is 2.32, with a net buy-side imbalance of 39.7%—the direction is already very clear. The funding rate is also sitting at a recent high level, suggesting leveraged longs are willing to pay a premium to hold positions, and the tempo is strong enough.
For VET, this round’s abnormal pool ranking is #20, and the nominal change is #41. It’s not in the absolute top tier, but within the tail-end sequence, such a structure is worth keeping an eye on. First, see whether this breakout can be defended. If it doesn’t break on a retest, there should be another leg ahead.
What’s even more worth noting is that OI is also increasing. The 15m nominal increment has already broken 100k U. The market is getting closer to fresh long positions entering and taking over, rather than just shorts covering.
The active buy/sell ratio is 2.32, with a net buy-side imbalance of 39.7%—the direction is already very clear. The funding rate is also sitting at a recent high level, suggesting leveraged longs are willing to pay a premium to hold positions, and the tempo is strong enough.
For VET, this round’s abnormal pool ranking is #20, and the nominal change is #41. It’s not in the absolute top tier, but within the tail-end sequence, such a structure is worth keeping an eye on. First, see whether this breakout can be defended. If it doesn’t break on a retest, there should be another leg ahead.
80
·
--
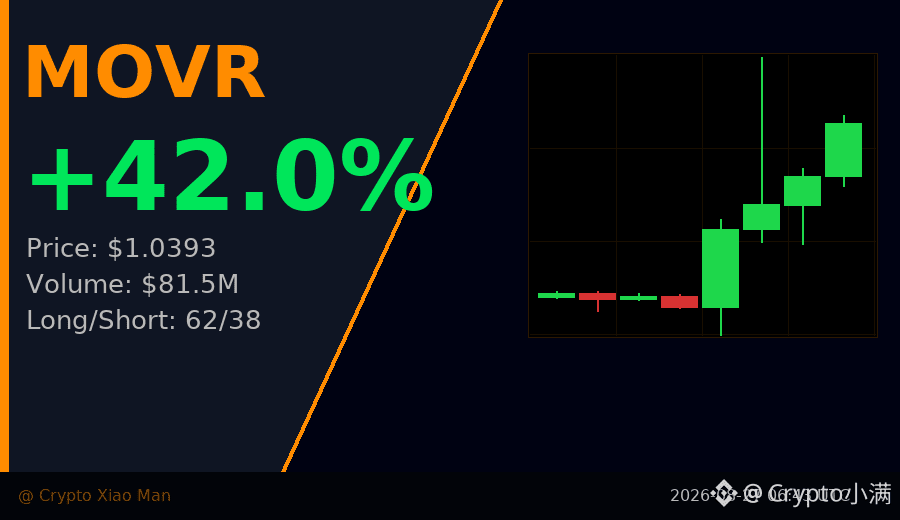
Low-priced zone has been consolidating sideways with shrinking volume for several K-lines. Suddenly, a single massive-volume candle shot up from 0.62 to 0.85—
This is the most noteworthy signal to watch for MOVR today. Volume leads price: the volume-spiking K-line has a trading amount close to RMB 140 million, which is more than ten times the combined volume of several prior K-lines.
The price surged from the low of 0.62 to the high of 1.17. It is currently 1.04, up 41% over the last 24 hours—this isn’t a minor move.
The long-vs-short ratio also confirms the momentum: long positions account for 62%, shorts for 38%, with longs dominating directionally. The funding rate is 0.005%, not yet in an overheated state, suggesting leverage hasn’t piled up crazily.
Three consecutive hourly K-lines closed bullish, and short-term momentum remains strong. However, pay attention: after the explosive rally, there’s a consolidation zone to digest between 0.85 and 0.93. That area is now an important support—whether the price can hold if it pulls back will determine the next direction.
Trading volume is the core of this move. Whether volume can carry the momentum matters more than price itself.
$MOVR #巨量启动 #41%暴涨
Tap the small card below to quickly check the market👇
Low-priced zone has been consolidating sideways with shrinking volume for several K-lines. Suddenly, a single massive-volume candle shot up from 0.62 to 0.85—
This is the most noteworthy signal to watch for MOVR today. Volume leads price: the volume-spiking K-line has a trading amount close to RMB 140 million, which is more than ten times the combined volume of several prior K-lines.
The price surged from the low of 0.62 to the high of 1.17. It is currently 1.04, up 41% over the last 24 hours—this isn’t a minor move.
The long-vs-short ratio also confirms the momentum: long positions account for 62%, shorts for 38%, with longs dominating directionally. The funding rate is 0.005%, not yet in an overheated state, suggesting leverage hasn’t piled up crazily.
Three consecutive hourly K-lines closed bullish, and short-term momentum remains strong. However, pay attention: after the explosive rally, there’s a consolidation zone to digest between 0.85 and 0.93. That area is now an important support—whether the price can hold if it pulls back will determine the next direction.
Trading volume is the core of this move. Whether volume can carry the momentum matters more than price itself.
$MOVR #巨量启动 #41%暴涨
Tap the small card below to quickly check the market👇
This is the most noteworthy signal to watch for MOVR today. Volume leads price: the volume-spiking K-line has a trading amount close to RMB 140 million, which is more than ten times the combined volume of several prior K-lines.
The price surged from the low of 0.62 to the high of 1.17. It is currently 1.04, up 41% over the last 24 hours—this isn’t a minor move.
The long-vs-short ratio also confirms the momentum: long positions account for 62%, shorts for 38%, with longs dominating directionally. The funding rate is 0.005%, not yet in an overheated state, suggesting leverage hasn’t piled up crazily.
Three consecutive hourly K-lines closed bullish, and short-term momentum remains strong. However, pay attention: after the explosive rally, there’s a consolidation zone to digest between 0.85 and 0.93. That area is now an important support—whether the price can hold if it pulls back will determine the next direction.
Trading volume is the core of this move. Whether volume can carry the momentum matters more than price itself.
$MOVR #巨量启动 #41%暴涨
Tap the small card below to quickly check the market👇
86

·
--
In the past month, the activity on $TAO ’s board has been declining. The real signal is that trading volume has shrunk from over $100 million in mid-July to now less than $45 million. The price itself has not chosen a direction—it's been churning back and forth within the $187–205 range—but the capital has already been “voting with its feet”—not dumping, but withdrawing participation.
This token is still 74% away from its ATH, with its market cap sitting at #41. It’s in a typical spot: an “old leader in its track,” but not a “hot theme.” A 30-day gain of +2.36% suggests the bottom area is being absorbed, but the 24-hour volume of 44.95M is not enough to sustain any meaningful upside move. Current liquidity is insufficient to support a trend in any direction; it’s more like it’s waiting for a catalyst—either the AI narrative re-attracting capital, or real progress on the demand side via a new subnet or increased computing-power requirements.
What I care about most is whether the sideways consolidation over the past 30 days will end up breaking down slowly, like most mid-cap setups, rather than building momentum for an upside attack. After all, after a volume contraction followed by sideways action, in 70% of cases the original trend continues—meaning downward. The difficulty in deciding at the $196 level is that existing holders are afraid of missing a rebound, but also afraid that what’s coming will be a slow bleed after liquidity dries up further; meanwhile, observers need confirmation that volume returns above 80M and that it does not break $187.
If you have any clues about capital rotation within the AI sector—for example, incremental increases in computing demand, or some kind of fund accumulating—those are exactly the key pieces for judging the future direction of $TAO .
In the past month, the activity on $TAO ’s board has been declining. The real signal is that trading volume has shrunk from over $100 million in mid-July to now less than $45 million. The price itself has not chosen a direction—it's been churning back and forth within the $187–205 range—but the capital has already been “voting with its feet”—not dumping, but withdrawing participation.
This token is still 74% away from its ATH, with its market cap sitting at #41. It’s in a typical spot: an “old leader in its track,” but not a “hot theme.” A 30-day gain of +2.36% suggests the bottom area is being absorbed, but the 24-hour volume of 44.95M is not enough to sustain any meaningful upside move. Current liquidity is insufficient to support a trend in any direction; it’s more like it’s waiting for a catalyst—either the AI narrative re-attracting capital, or real progress on the demand side via a new subnet or increased computing-power requirements.
What I care about most is whether the sideways consolidation over the past 30 days will end up breaking down slowly, like most mid-cap setups, rather than building momentum for an upside attack. After all, after a volume contraction followed by sideways action, in 70% of cases the original trend continues—meaning downward. The difficulty in deciding at the $196 level is that existing holders are afraid of missing a rebound, but also afraid that what’s coming will be a slow bleed after liquidity dries up further; meanwhile, observers need confirmation that volume returns above 80M and that it does not break $187.
If you have any clues about capital rotation within the AI sector—for example, incremental increases in computing demand, or some kind of fund accumulating—those are exactly the key pieces for judging the future direction of $TAO .
This token is still 74% away from its ATH, with its market cap sitting at #41. It’s in a typical spot: an “old leader in its track,” but not a “hot theme.” A 30-day gain of +2.36% suggests the bottom area is being absorbed, but the 24-hour volume of 44.95M is not enough to sustain any meaningful upside move. Current liquidity is insufficient to support a trend in any direction; it’s more like it’s waiting for a catalyst—either the AI narrative re-attracting capital, or real progress on the demand side via a new subnet or increased computing-power requirements.
What I care about most is whether the sideways consolidation over the past 30 days will end up breaking down slowly, like most mid-cap setups, rather than building momentum for an upside attack. After all, after a volume contraction followed by sideways action, in 70% of cases the original trend continues—meaning downward. The difficulty in deciding at the $196 level is that existing holders are afraid of missing a rebound, but also afraid that what’s coming will be a slow bleed after liquidity dries up further; meanwhile, observers need confirmation that volume returns above 80M and that it does not break $187.
If you have any clues about capital rotation within the AI sector—for example, incremental increases in computing demand, or some kind of fund accumulating—those are exactly the key pieces for judging the future direction of $TAO .
112

·
--
We're excited to share the latest trending tokens on CoinGecko 💰. Our community is always looking for the next big thing, and we're happy to provide the latest updates. We've got our eyes on Zama, Solana, and DeXe, among others.
We're seeing some significant movements in the market, with Solana and Ethereum holding strong positions. Zcash and Ondo are also gaining traction, with market cap ranks of #15 and #41, respectively. Meanwhile, Cash Cat is lurking at #411, waiting for its chance to shine 🚀.
We're confident that our community will find this information useful in making informed decisions 📊. As we continue to monitor the market, we're excited to see which tokens will rise to the top next 🔥. We're committed to keeping our community up-to-date on the latest trends and market movements.
$BANK, $DODO, $ON
We're excited to share the latest trending tokens on CoinGecko 💰. Our community is always looking for the next big thing, and we're happy to provide the latest updates. We've got our eyes on Zama, Solana, and DeXe, among others.
We're seeing some significant movements in the market, with Solana and Ethereum holding strong positions. Zcash and Ondo are also gaining traction, with market cap ranks of #15 and #41, respectively. Meanwhile, Cash Cat is lurking at #411, waiting for its chance to shine 🚀.
We're confident that our community will find this information useful in making informed decisions 📊. As we continue to monitor the market, we're excited to see which tokens will rise to the top next 🔥. We're committed to keeping our community up-to-date on the latest trends and market movements.
$BANK , $DODO , $ON
We're seeing some significant movements in the market, with Solana and Ethereum holding strong positions. Zcash and Ondo are also gaining traction, with market cap ranks of #15 and #41, respectively. Meanwhile, Cash Cat is lurking at #411, waiting for its chance to shine 🚀.
We're confident that our community will find this information useful in making informed decisions 📊. As we continue to monitor the market, we're excited to see which tokens will rise to the top next 🔥. We're committed to keeping our community up-to-date on the latest trends and market movements.
$BANK , $DODO , $ON
124
·
--
$TAO got stuck at $197—can’t go up or down. The chart is in a very typical low-range consolidation phase. Over the past 30 days, it ground down from $215 to $191. The overall focus has shifted lower, but the $187 to $200 range has been tested repeatedly: shorts haven’t been able to break it down, and longs can’t push it higher. The most interesting part was July 10: trading volume suddenly surged to $385M, price spiked to $214, and then was immediately pushed back down. After that, volume gradually shrank all the way to just over $60M—suggesting that some funds tried to make a move once, failed, and then everyone started waiting for the next excuse.
Market cap rank #41. For an AI-sector token of this size, a $102M daily trading volume isn’t healthy, but it’s not to the point of illiquidity either. It’s still 74% away from its ATH. In the past year, it’s fallen nearly 45%. $TAO is no longer that once-hyped star pick—its current pricing logic is more like: someone still cares about it, but nobody is in a rush to buy.
What I care about most is that the $190 level has been tested repeatedly without ever breaking down. This isn’t something that retail investors alone can hold up. If next the volume can rise back above $150M and the price holds $195, then the bottom structure remains intact. But if $190 is broken down decisively on high volume, there won’t be any meaningful psychological support levels below.
The real disagreement comes down to this: is the current sideways action buildup energy after chips have been absorbed, or is it a turnover platform during a continuation lower? The market hasn’t answered yet—volume will be the first thing to speak.
$TAO got stuck at $197—can’t go up or down. The chart is in a very typical low-range consolidation phase. Over the past 30 days, it ground down from $215 to $191. The overall focus has shifted lower, but the $187 to $200 range has been tested repeatedly: shorts haven’t been able to break it down, and longs can’t push it higher. The most interesting part was July 10: trading volume suddenly surged to $385M, price spiked to $214, and then was immediately pushed back down. After that, volume gradually shrank all the way to just over $60M—suggesting that some funds tried to make a move once, failed, and then everyone started waiting for the next excuse.
Market cap rank #41. For an AI-sector token of this size, a $102M daily trading volume isn’t healthy, but it’s not to the point of illiquidity either. It’s still 74% away from its ATH. In the past year, it’s fallen nearly 45%. $TAO is no longer that once-hyped star pick—its current pricing logic is more like: someone still cares about it, but nobody is in a rush to buy.
What I care about most is that the $190 level has been tested repeatedly without ever breaking down. This isn’t something that retail investors alone can hold up. If next the volume can rise back above $150M and the price holds $195, then the bottom structure remains intact. But if $190 is broken down decisively on high volume, there won’t be any meaningful psychological support levels below.
The real disagreement comes down to this: is the current sideways action buildup energy after chips have been absorbed, or is it a turnover platform during a continuation lower? The market hasn’t answered yet—volume will be the first thing to speak.
Market cap rank #41. For an AI-sector token of this size, a $102M daily trading volume isn’t healthy, but it’s not to the point of illiquidity either. It’s still 74% away from its ATH. In the past year, it’s fallen nearly 45%. $TAO is no longer that once-hyped star pick—its current pricing logic is more like: someone still cares about it, but nobody is in a rush to buy.
What I care about most is that the $190 level has been tested repeatedly without ever breaking down. This isn’t something that retail investors alone can hold up. If next the volume can rise back above $150M and the price holds $195, then the bottom structure remains intact. But if $190 is broken down decisively on high volume, there won’t be any meaningful psychological support levels below.
The real disagreement comes down to this: is the current sideways action buildup energy after chips have been absorbed, or is it a turnover platform during a continuation lower? The market hasn’t answered yet—volume will be the first thing to speak.
27
Log in to explore more content
Join global crypto users on Binance Square
⚡️ Get latest and useful information about crypto.
💬 Trusted by the world’s largest crypto exchange.
👍 Discover real insights from verified creators.
Email / Phone number
Trending Topics
1
#FedRateWatch
557,628 views
2,664 Discussing
2
#BitcoinSlidesTo$76000
20,757 views
114 Discussing
3
#BitcoinReboundsTo$79K
61,604 views
401 Discussing
4
#StrategyMarketCapPassesFord
37,442 views
635 Discussing
5
#ClarityActOddsHalveOnPolymarket
54,187 views
529 Discussing
6
#US30YTreasuryYieldTops5.40%
31,946 views
354 Discussing
7
#BessentEndorsesFinalClarityActDraft
54,641 views
733 Discussing
8
#ZamaOpens16ConfidentialMorphoVaults
18,617 views
351 Discussing
9
#USDCOnChainVolumeTops$100Trillion
2,877 views
48 Discussing
10
#BitcoinSpotETFsNetInflow$160M
4,848 views
102 Discussing