

#21
21
38,315 views
270 Discussing
Hot
Latest

·
--
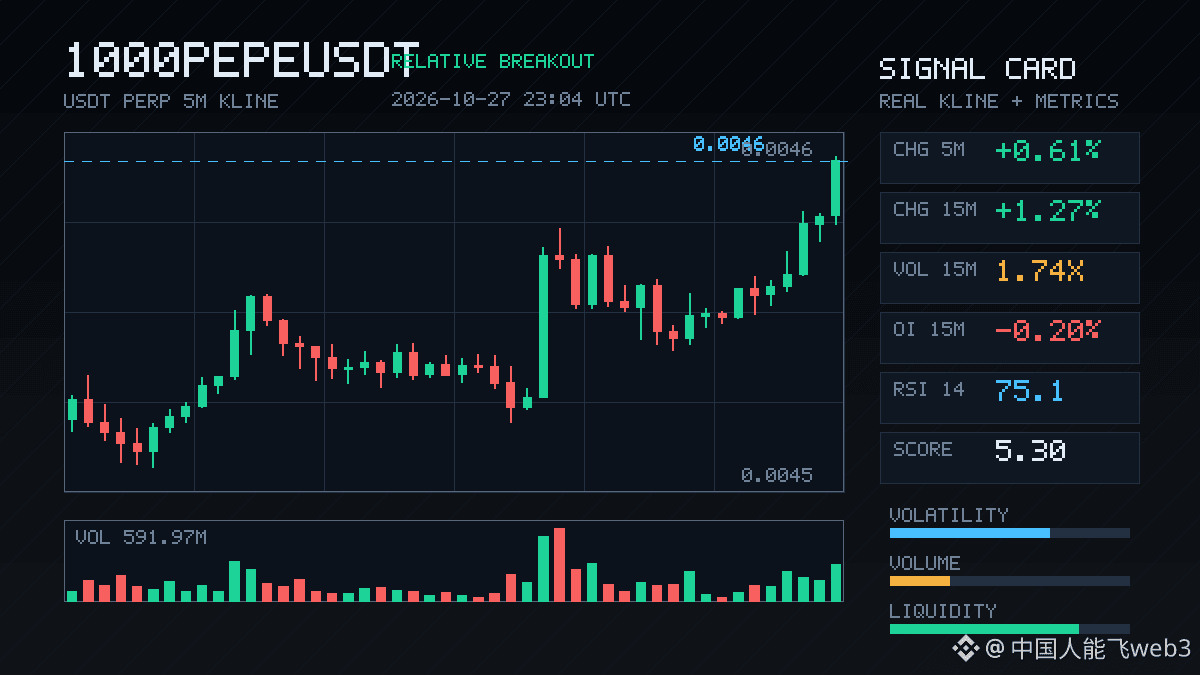
$1000PEPE's 15m move is getting interesting. The price is up 1.27%—not much on its own—but volume jumped to 1.74x, with a Z-score of 2.65. It also closed above the upper end of the past 20 or so 5m candles.
But take a closer look at OI: both the 15m and 1h readings are down 0.20%. The price is rising while open interest is falling. This looks more like a move driven by short covering than fresh longs entering. The taker buy-sell delta is 10.2%, and the buy/sell ratio is 1.23, so buyers do have the edge in the short term. But a rally without open-interest support makes chasing the move questionable.
It ranks #21 for anomalies across the whole pool and #9 for notional change, with 224 million in 24h trading volume—there's definitely interest. The key is whether fresh money follows through after this round of short covering; otherwise, this could easily turn into a one-off spike.
4

·
--
$BANK is showing some interesting action. It surged 1.71% in 15m, with volume climbing to more than 6 times its usual level, and closed above the highs of nearly 20 recent 5m candles. The key is that OI rose along with it—up 1.49% over 15m and 1.44% over 1h. Price up and open interest up suggests leveraged new longs are entering, rather than a short-covering pop. Net aggressive volume was +4.4%, with a buy/sell ratio of 1.09, so buyers had a slight edge. Its anomaly percentile is 91.9%, ranking #21 across the pool, with the notional change ranking #38—making it one of today's more notable moves. 24h trading volume is just over 64M, and market depth looks decent. Now the question is whether this breakout can hold, rather than just wick up and fade.
$BANK is showing some interesting action. It surged 1.71% in 15m, with volume climbing to more than 6 times its usual level, and closed above the highs of nearly 20 recent 5m candles. The key is that OI rose along with it—up 1.49% over 15m and 1.44% over 1h. Price up and open interest up suggests leveraged new longs are entering, rather than a short-covering pop. Net aggressive volume was +4.4%, with a buy/sell ratio of 1.09, so buyers had a slight edge. Its anomaly percentile is 91.9%, ranking #21 across the pool, with the notional change ranking #38—making it one of today's more notable moves. 24h trading volume is just over 64M, and market depth looks decent. Now the question is whether this breakout can hold, rather than just wick up and fade.
63

·
--
$Q has something going on. The 15m chart just ripped nearly 8%, with volume running at 2.4x normal levels, so this is not a fake breakout on thin liquidity. The key is that OI is rising in sync as well: both 1h and 15m are increasing. The notional change isn’t huge, but after several consecutive periods of continuation, it looks more like new leveraged longs entering than shorts being forced to cover.
Price has just closed above the upper end of the recent 20 5m candles' range. The active buy-sell imbalance is 1.7%, with buyers slightly in control but not to an extreme degree. The anomaly percentile is 90.5%, ranked #21 in the whole pool, so it’s one of those names that gets screened out as “worth keeping an eye on.”
24h turnover is at the $150 million level, so liquidity is sufficient. The real question now isn’t whether there’s volume, but whether it can hold after the breakout—continued OI growth would confirm it, while an OI reversal would be a warning that this may just be a short-term leverage-driven move. First watch how it reacts on a pullback to the upper band.
1

·
--
$ORDER Long Trade Live Results 🔥 50X Leverage, +36% ROE in 15 Minutes!
🎯 Live Trade
$ORDER (ORDERUSDT Perpetual) · LONG · 50X
Average entry price 0.0389 → current price 0.0403
ROE approx. +36%|15–30 minute holding window
TP1 0.04026 / TP2 0.04133 / SL 0.03795 (R:R 2.8:1)
🧠 Previous LLM Strategy Analysis (Instruction #21)
Watchlist entry: sharp 24h drop of -16.92%, 1h -2.22%, RSI (5m/15m) at 37.8/35.4, deeply oversold
Reversal confirmation: rebounded +1.67% from the low of 0.0382 (≥1.38% threshold)
5m long-lower-wick Pinbar (lower wick ratio 1.6x)|above EMA20|MACD just crossed bullish
Active buying returned at 51.7% (≥51.5%)|MILD_BULL trend-following check passed at 59 points
Multi-timeframe confluence + returning OI buying pressure; decisively entered at the current MARKET price
🛡️ Risk Management
With 50X, only trade short windows. If ROE is < +18% after 30 minutes, trigger a time-based circuit breaker; only highly profitable positions are exempt from this holding limit. SL at 0.03795 is non-negotiable.
Did you catch this confluence signal of left-side oversold conditions + right-side bullish crossover? Share your entry price in the comments 👇
#币安合约 #实盘战报 #量化交易 #ORDER
6
·
--
$BMT is down 2.73% over 15m, with volume at 1.81x and OI falling sharply for two consecutive periods—down 4.13% on the 1h and 2.50% on the 15m. It ranks #21 among anomalies across the entire pool. Price down + OI down typically means leveraged longs are being flushed out, rather than new shorts entering to push the price lower. Aggressive trade delta is -19%, the buy/sell ratio is 0.68, and the close fell below the lows of the last 20 5m candles. This setup often signals that position unwinding is nearing its end, but there are no signs of stabilization yet—don’t rush to buy the dip.
$BMT is down 2.73% over 15m, with volume at 1.81x and OI falling sharply for two consecutive periods—down 4.13% on the 1h and 2.50% on the 15m. It ranks #21 among anomalies across the entire pool. Price down + OI down typically means leveraged longs are being flushed out, rather than new shorts entering to push the price lower. Aggressive trade delta is -19%, the buy/sell ratio is 0.68, and the close fell below the lows of the last 20 5m candles. This setup often signals that position unwinding is nearing its end, but there are no signs of stabilization yet—don’t rush to buy the dip.
·
--
$CRV has something going on. The price is up 0.78% over 15m, volume has surged to 2.51x, the taker buy-sell volume difference is 20.2%, and the buy/sell ratio is 1.51. The close is also above the highs of nearly 20 recent 5m candles—this isn't just a price propped up by resting orders.
More importantly, OI is moving along with it: +0.03% over 15m and +0.12% over 1h. The absolute notional change isn't large (just 339K USDT over 1h), but it has remained positive across multiple consecutive periods. The anomaly percentile is 82.1%, ranking #21 across the whole pool. With price and OI both rising and funding rates still in a high percentile recently, the structure looks more like new leveraged longs entering than shorts covering.
24h trading volume is 19.15M, and market depth isn't particularly strong. Be cautious about chasing at these levels—the breakout is real, but liquidity really can't withstand a large sell order. First, let's see whether this move can hold above the range.
·
--
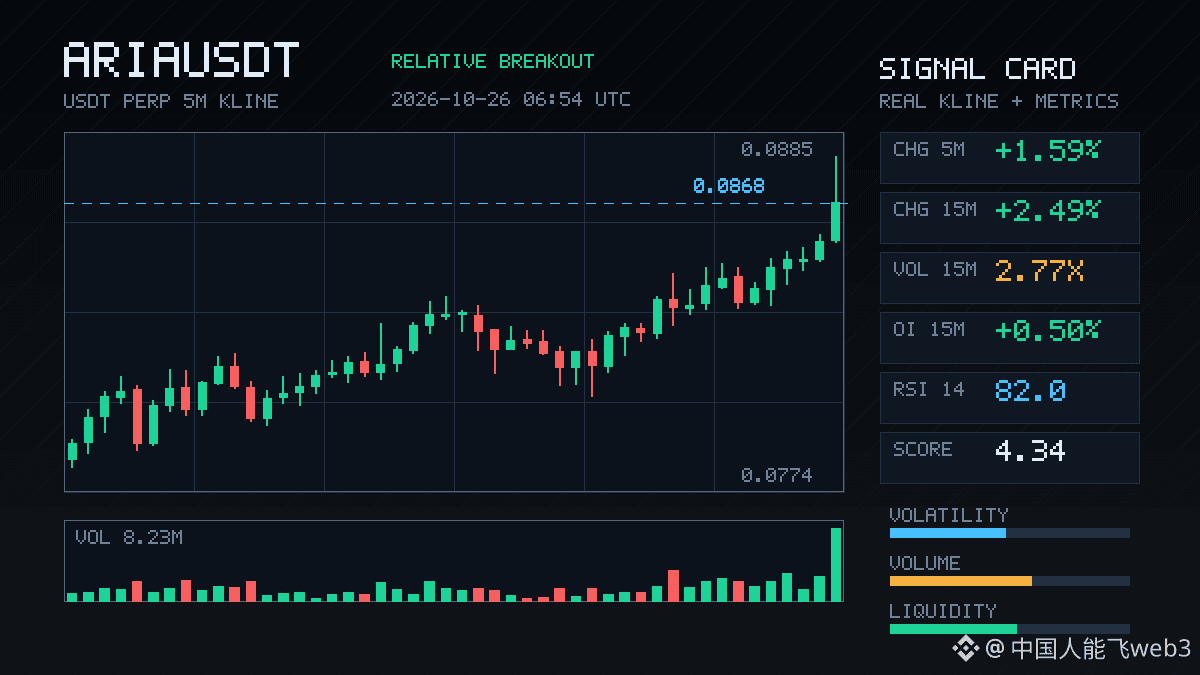
$ARIA This move is pretty interesting. Up 2.49% over 15m, with volume surging to 2.77x. Price broke above the top of the recent 20-bar 5m range, while OI is up 1.4% over 1h and notional volume of 529K is coming in alongside it. Price and open interest are moving together, which clearly points to new leveraged longs driving the move—not flimsy short covering.
However, the aggressive trade delta is -1.1% and the buy/sell ratio is 0.98, suggesting there was also plenty of aggressive selling during the rally. Be careful chasing the move in case of an upper wick. It ranks #17 for anomalies across the full pool and #21 for notional change; the signal has persisted for several consecutive periods and has also passed depth confirmation, so it’s high quality. But 24h trading volume is only 38M, and the pool is shallow, so don’t ignore the risk of a sudden wick.
I’m watching to see whether OI keeps building. If price consolidates while OI continues to rise, that’s when you know there are real buyers positioning. If OI drops and price stops making progress, leverage is being unwound.
1

·
--
$BCH This 15m move is interesting. The price is up 0.56%, which isn’t outrageous, but OI is rising along with it. The 1h contracts are up 0.55%, and the change in notional value is also near the top of the list. It doesn’t feel like a simple spot-market pump that’s over and done with; it looks more like new leveraged longs are testing the waters.
I just noticed the closing price pushed above the top of the range from the last 20 5m candles. The taker trade imbalance is 29%, and the buy/sell ratio is 1.82, showing a clear short-term buying bias. The anomaly percentile is 79.2% (#21 across the whole pool), and the depth confirms the move too—at least it’s not just a random poke in a thin pool.
Still, I’d be extra cautious with this kind of setup: rising OI and rising prices can mark the start of a trend when things go well, but a sudden reversal can easily turn into a leveraged squeeze. First, see if the price can hold above this range; don’t chase the tip of a wick.
2
·
--
$Lobster made an interesting move shortly after 7 a.m. It rose 1.36% in 15 minutes, with volume reaching 1.72x, and closed above the upper end of the recent 20-candle 5-minute range. The taker buy/sell delta was +13.2%, and the buy/sell ratio was 1.30, suggesting the price was pushed higher by aggressive buying. Open interest didn’t move much over the short term, while notional open interest edged up slightly on the 1-hour timeframe. Structurally, this looks more like newly opened leveraged longs testing the waters. It ranks #21 for anomalies across the full pool and #34 for notional change—not the most eye-catching, but still near the top. Daily trading volume is 15.84M, and liquidity is adequate for now. The key is whether it can hold above this range high, rather than turning into another one-day wick.
$Lobster made an interesting move shortly after 7 a.m. It rose 1.36% in 15 minutes, with volume reaching 1.72x, and closed above the upper end of the recent 20-candle 5-minute range. The taker buy/sell delta was +13.2%, and the buy/sell ratio was 1.30, suggesting the price was pushed higher by aggressive buying. Open interest didn’t move much over the short term, while notional open interest edged up slightly on the 1-hour timeframe. Structurally, this looks more like newly opened leveraged longs testing the waters. It ranks #21 for anomalies across the full pool and #34 for notional change—not the most eye-catching, but still near the top. Daily trading volume is 15.84M, and liquidity is adequate for now. The key is whether it can hold above this range high, rather than turning into another one-day wick.
4
·
--
$MAGMA This move is getting interesting. Price is up 1.73% over 15m, while volume is only 0.66x. But OI surged +1.70% over 15m, with a notional change of 744K, and it’s still building over the 1h timeframe. Price up, OI up—a classic sign of leveraged longs opening positions, rather than shorts being forced to cover.
The OI anomaly percentile has hit 94%, ranking #61 across the full pool, while the notional change ranks #21. This has continued for several consecutive periods, making the setup look more like someone is steadily adding leverage and pushing in. Aggressive trade delta is +8%, with a buy/sell ratio of 1.17, so short-term buying still has support.
However, the lack of volume confirmation is a risk, and the 94th-percentile reading is also approaching the upper end of its historical range. The more densely leveraged longs pile in, the faster things could unwind if price fails to keep rising. First, watch whether OI can continue to expand—if price can’t hold up, be careful.
·
--
$PUMP : This 15m candle broke below the lower bound of the last 20 5m candles' range, with volume surging to 3.42x, aggressive trade delta at -17%, and a buy/sell ratio of 0.71. The selling pressure is real.
Interestingly, OI is still rising: +1.28% over 1h. Price down + OI up is a classic sign of new leveraged shorts entering, not longs closing out and driving the price down. The notional change ranks #21 across the entire pool, while the anomaly percentile is only 50.2%, so this hasn't yet grabbed the whole market's attention.
24h trading volume is 236M, and market depth is sufficient—this isn't the kind of fake breakout you see in thin markets. The key is whether this 15m candle can close and hold below the range's lower bound. If it does, the shorts still have room to run; if price climbs back above it, it was a bear trap.
8

·
--
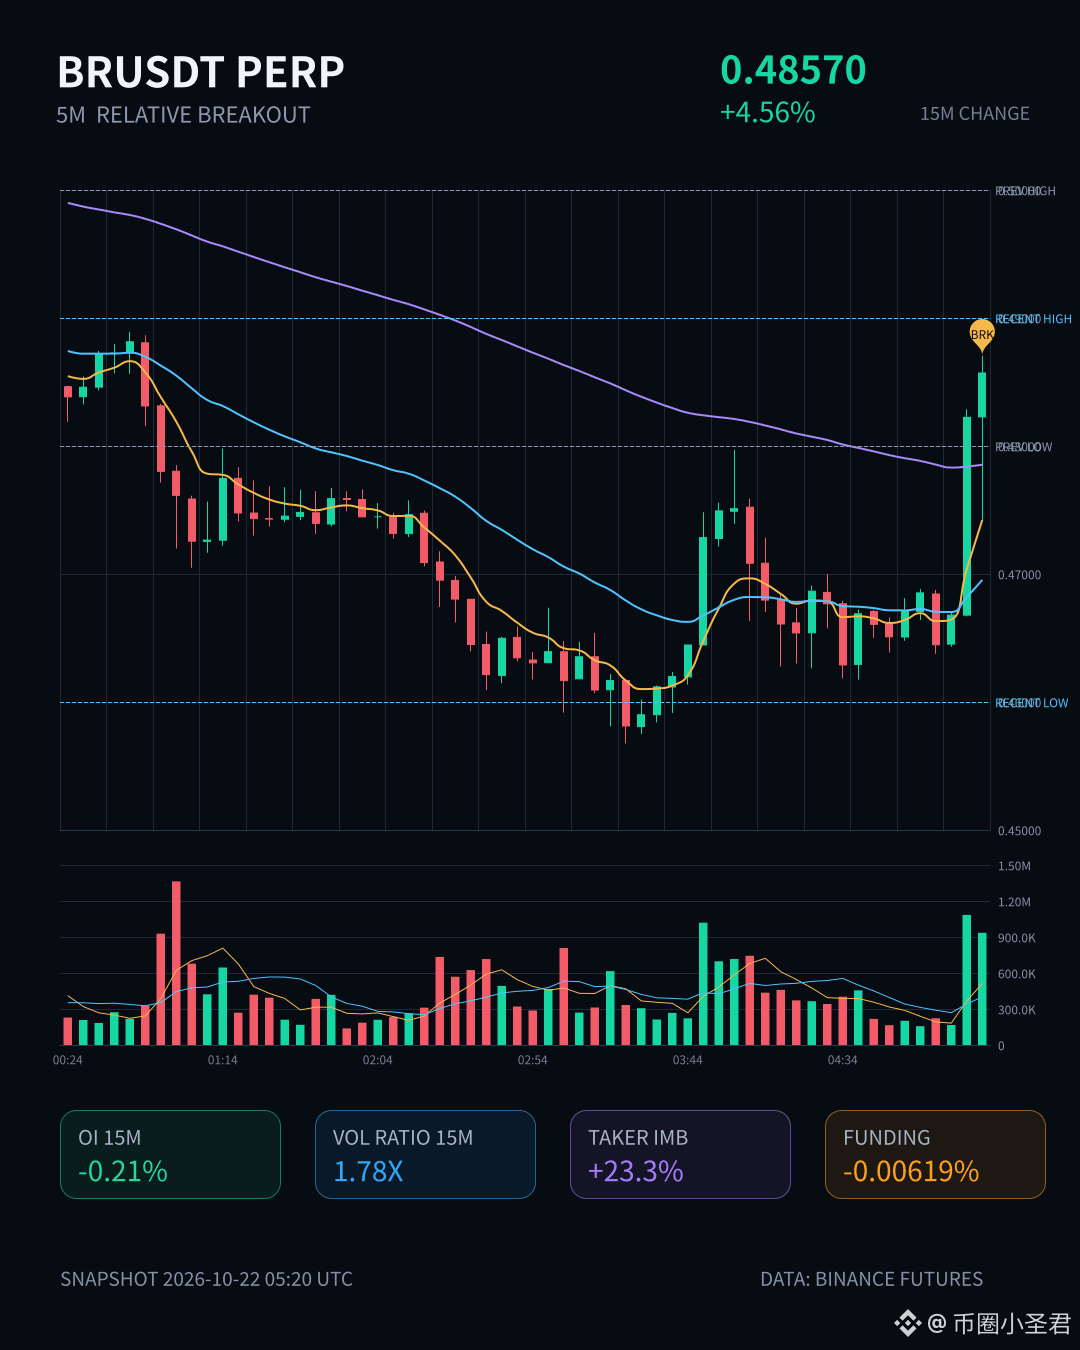
$BR surged 4.56% over 15m, with volume at 1.78x, a buy/sell ratio of 1.61, and an active trade imbalance of 23.3%. It closed above the upper end of the range formed by the last 20 5m candles—a genuine price breakout, but OI fell on both the 15m and 1h timeframes while notional change was positive. This looks more like short covering and position reduction driving the move than new longs entering.
Be cautious about chasing this kind of setup. The rally is driven by covering, so once that runs its course, the key question is whether spot demand can absorb the selling. 24h trading volume is just over 100M and market depth is decent, but this OI anomaly ranks at the 85.3rd percentile and #21 across the entire pool. So there is unusual activity, but it isn't especially extreme.
First, see whether price can hold above the range. If it can't, this could be the usual false-breakout scenario.
3

Article
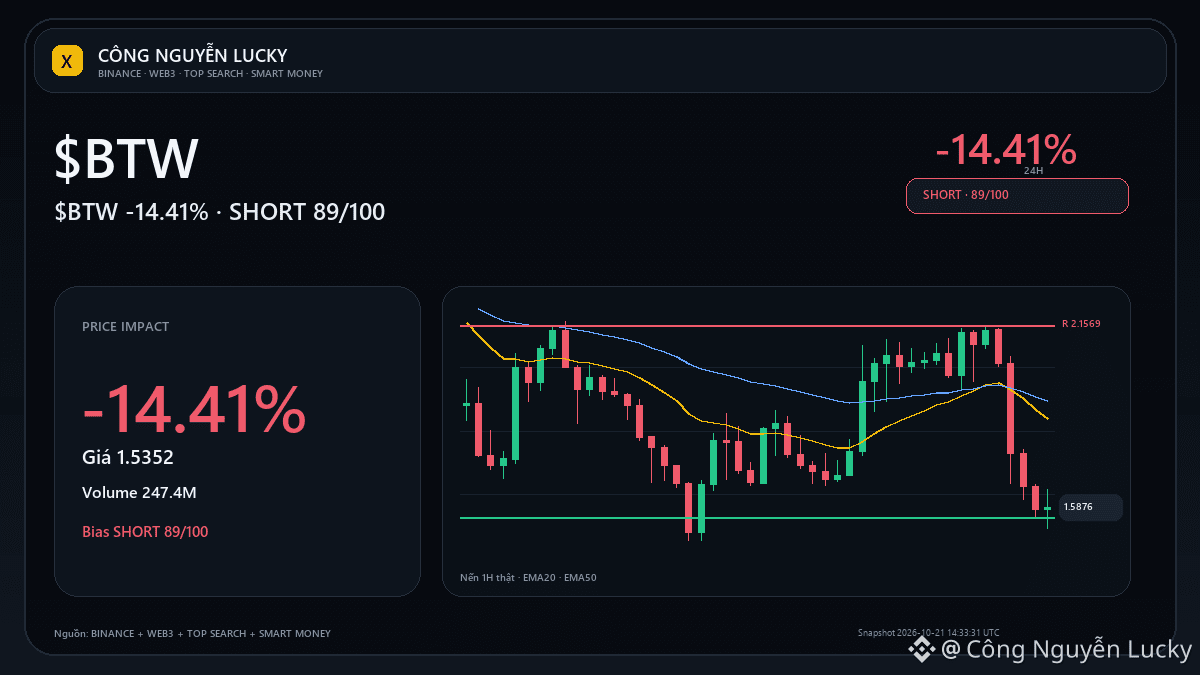
$BTW: Is doji price action reliable?🔥 $BTW is down 14.41% — but a percentage gain or loss alone isn’t enough to call this a good setup. Market: 1.5352 · 24h -14.41% · volume ~247.4M USDT · 4,182,627 trades.
Technical bias SHORT 84/100 · support 1.5555 · resistance 2.1569. Candlestick patterns only matter when they appear at the right structural level and are confirmed by the next candle/volume; otherwise, ignore them. The technical layers are selected based on the regime:
1H status: MIXED · technical bias SHORT 84/100 · 1H/4H: MIXED.
$BTW: Is doji price action reliable?
🔥 $BTW is down 14.41% — but a percentage gain or loss alone isn’t enough to call this a good setup. Market: 1.5352 · 24h -14.41% · volume ~247.4M USDT · 4,182,627 trades.
Technical bias SHORT 84/100 · support 1.5555 · resistance 2.1569. Candlestick patterns only matter when they appear at the right structural level and are confirmed by the next candle/volume; otherwise, ignore them. The technical layers are selected based on the regime:
1H status: MIXED · technical bias SHORT 84/100 · 1H/4H: MIXED.
630
·
--
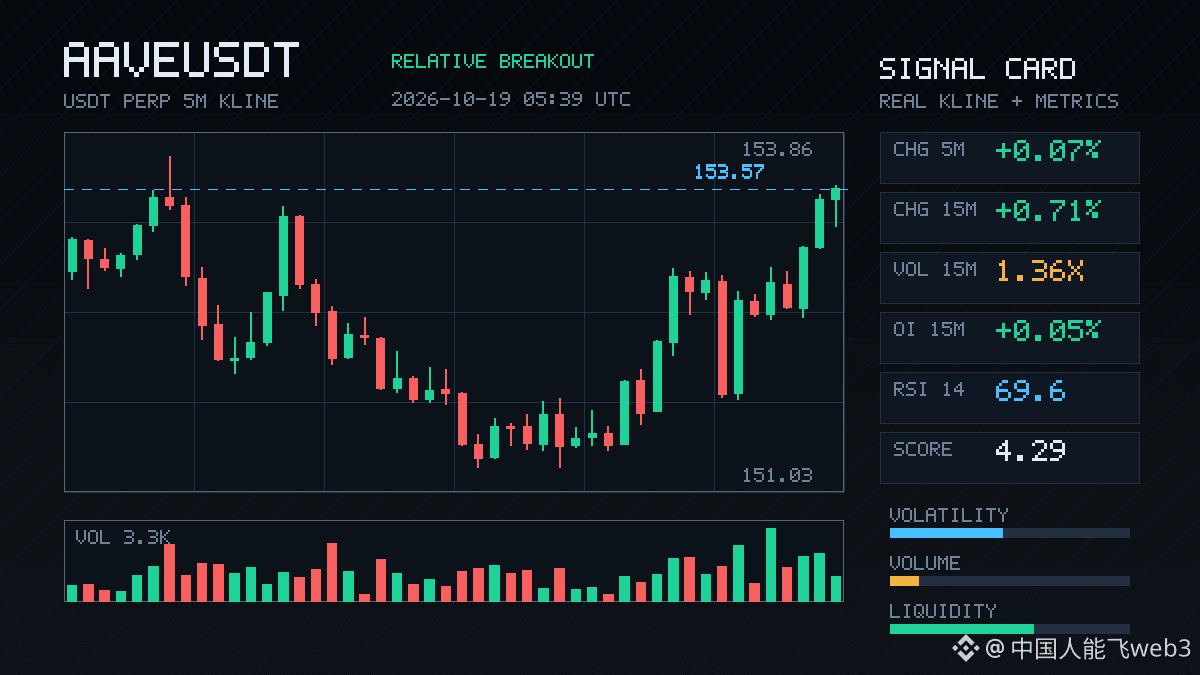
$AAVE This move has some substance. On the 15m chart, price is hugging the top of the range, and the latest candle just closed above the highs of nearly 20 recent 5m candles. Volume is 1.36x—not explosive, but the pieces are lining up nicely.
The key is OI: +0.05% on the 15m and +0.45% on the 1h, adding up to more than 1.2 million U in notional value. Its anomaly percentile is 86.7%, ranking #21 across the whole pool. Price is rising and OI is rising along with it, which structurally points to new leveraged longs entering—not the false pop of short covering. The active trade delta is 8.3%, and the buy/sell ratio is 1.18: buyers have the edge, but it’s not extreme.
An anomaly that persists across several consecutive timeframes like this is more reliable than a single candle wick. First, watch whether price can hold above the top of this range. If it can’t, it’s the usual fakeout script.
1
·
--
$ARB This 15m candle in the early hours is pretty interesting. Price rose by less than 1 point, but look at open interest—the 15m contract OI increased by 0.12%, with a notional value of 271K. The 1h notional change climbed all the way to 500K. Price and OI moving up together is a classic sign of leveraged longs entering, not natural spot buying.
The aggressive trade imbalance is 8%, and the buy/sell ratio is 1.17, so buyers are definitely in control. The closing price just broke above the highs of nearly 20 recent 5m candles, putting it right at the edge of the recent range. Its anomaly percentile across the full pool is 82.7%, ranking #19, and its notional change ranks #21. It’s not the most explosive one, but it’s already among the stronger signals in the pool.
24h volume is only 62M, so this pool isn’t very deep. We’ll have to see whether the breakout can hold with increased volume before deciding how much it means. Otherwise, with liquidity this thin in the early hours, one wick could send anyone chasing longs straight back down. I’ll keep an eye on it for now—no rush to act.
3
·
--
$AAVE These past 15 minutes have been interesting. Price rose 0.89%, while volume surged to 18 times its usual level. The taker buy/sell ratio was 1.79, showing clear buying pressure. But OI is down on both the 15m and 1h timeframes, by -0.05% and -0.41% respectively—price up, open interest down: a classic short-covering rally, not fresh longs entering.
The latest close broke above the highs of roughly the last 20 5m candles, bringing price up to the edge of its recent range. The OI anomaly percentile is 92.7%, ranking #21 across the whole pool. It’s persisted for several periods, and depth confirms it: volume is there, and there’s a directional bias.
I wouldn’t chase this kind of setup. The move is being driven by short covering, and it could fizzle once that fuel runs out. I’d wait to see whether OI turns positive and new longs step in before making a call. 24h trading volume is 45.65M, and the pool isn’t very deep, so don’t get carried away.
·
--
$ZEREBRO made a pretty decisive move on the 15m timeframe: up 1.3% on 2.18x volume, with an aggressive buy/sell ratio of 1.46—clearly, someone is sweeping the order book.
The key is OI: 15m contract OI is up 1.87%, with a notional change of 274K, ranking #21 across the entire pool by notional change. This wasn't driven by short covering; it's genuine new leveraged long positions coming in. Price up + OI up points more to active position building than a short squeeze.
However, 1h OI is only up 0.09%, which suggests leverage is just starting to build—not a position that's been accumulating all day. The pool-wide anomaly percentile of 62.7% isn't extreme, so there's room to run, but don't treat it as a guaranteed bullish signal.
24h trading volume is over 200 million, with enough depth that a single wick is unlikely to cut through the market in the short term. Watch whether the next 15m candle can hold this move's starting point. Continued OI growth would confirm the move; if volume dries up and OI turns lower, it'll likely be a one-and-done.
76
·
--
$1000PEPE is showing something interesting here.
It climbed 2.42% in 15 minutes, with volume surging to 4.23x and a Z-score of 3.57—this isn’t random noise. The closing price broke above the upper end of the past 20 five-minute candles, aggressive trade flow was +5.2%, and the buy/sell ratio was 1.11, with buyers pushing.
But what really caught my eye was OI: the notional change was -100% across both the 15-minute and 1-hour periods, with an anomaly percentile of 98.4%, ranked #21 across the entire pool and #9 on the notional change leaderboard. Volume is rising and price is climbing, but OI is falling. This setup looks more like short covering/position covering than a rally driven by new long positions.
The funding rate is still in a high percentile relative to recent levels, and 24-hour trading volume is 284 million. The move has persisted across multiple consecutive periods, and the price is already close to the extreme end of its own historical range, with a volatility Z-score of 3.57. #1000PEPE
·
--
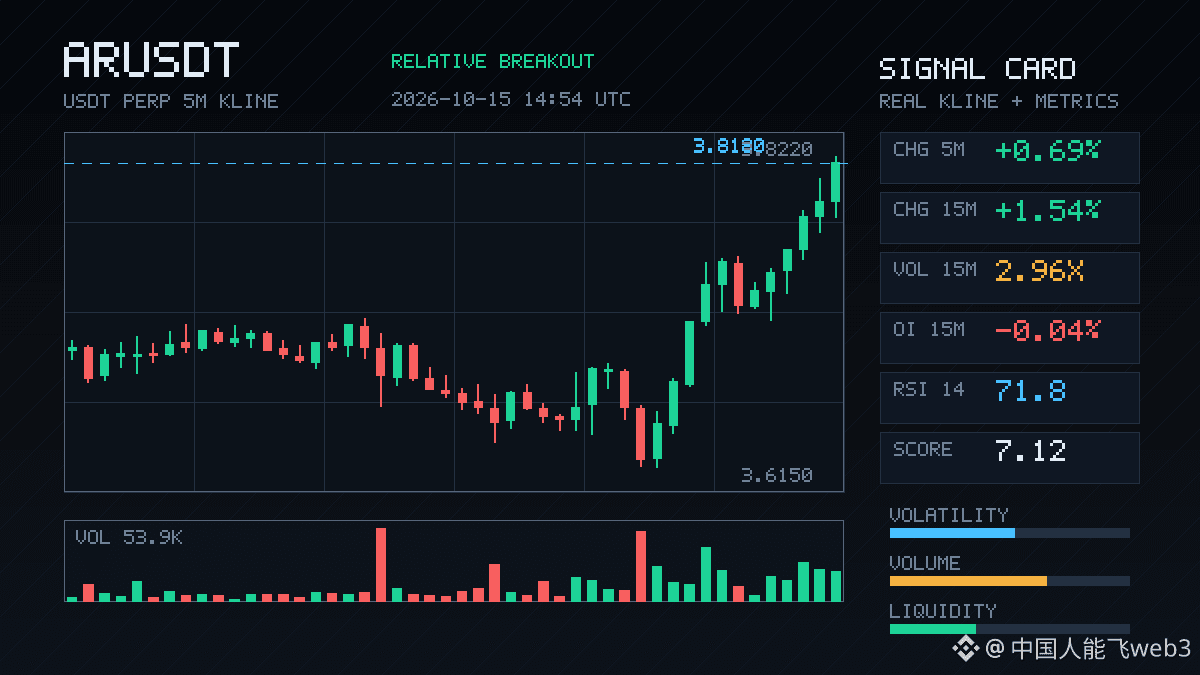
AR is doing something interesting here.
It’s up 1.54% over 15m, with volume surging to 2.96x, and the close pushed above the highs of nearly 20 previous 5m candles. But OI is moving the other way: 15m futures OI is down 0.04%, notional change is -7.45M, and there hasn’t been much increase in positions over 1h either. Price up + OI down is a classic short-covering pattern, not a move driven by new longs entering.
The taker flow imbalance is 9.9%, and the buy/sell ratio is 1.22, so short-term buyers are definitely lifting offers. The OI anomaly percentile is 94.2%, ranked #8 across the entire pool, with notional change ranked #21—this is already hovering near an extreme zone, not just some routine move.
24h trading volume is only 11.69M, so the pool isn’t very deep. When you see volume expand, price push above the range, and OI fail to follow, either shorts are getting stopped out and pushing price higher, or someone is taking advantage of the thin pool to give it a quick shove upward.
This isn’t the kind of setup I’d chase. A rally driven by short covering raises the question of who’ll step in once the covering is done. I’d watch for now and see whether OI follows.
5

·
--
My gut tells me that $NEAR ’s 30-day rally of +91% isn’t over yet, but today’s -9.98% bearish candle is determining whether it continues higher or enters a medium-term correction. This instinct needs to be tested against three data points: first, whether trading volume can stay above $1B over the next two days, rather than shrinking to $900M and turning weak, as it did on September 27; second, whether the 24-hour low of $4.54 becomes support during the pullback; and third, whether the market-cap ranking of #21 can still attract fresh money now that the AI and DePIN narratives are cooling.
What makes me watch rather than chase is $NEAR ’s price structure. It surged to $5.88 on October 12, then fell for three consecutive days, hitting a low of $4.54 today—giving back almost a third of this rally. But keep in mind that 30 days ago it was still at $2.33, so even after this pullback, it remains one of the few strong assets in this cycle. What matters more to me is that the past week’s decline has come with decreasing volume, and there has been no panic selling since October 8. This looks more like profit-taking than a collapse of the narrative.
The risk lies on the other side. If $NEAR falls below $4.50 over the next three trading days and 24-hour trading volume climbs back above $1.5B, my assessment above—that this is a correction rather than a reversal—will be invalidated. That would mean the money that previously drove it from $2.3 to $5.8 is starting to exit decisively. You can use this condition to test the thesis; there’s no need to rush into taking sides. After all, it’s still 77% below its ATH, and at this price, the disagreement is precisely why you shouldn’t vote with your position too hastily.
9
Log in to explore more content
Join global crypto users on Binance Square
⚡️ Get latest and useful information about crypto.
💬 Trusted by the world’s largest crypto exchange.
👍 Discover real insights from verified creators.
Email / Phone number
Trending Topics
1
#CanMicrosoftDeliverOnAI
440,119 views
3,306 Discussing
2
#CanGoogleDefindItsCore
272,927 views
2,335 Discussing
3
#EarningsSeason
6M views
29,397 Discussing
4
#$10.9BBitcoinOptionsExpireFriday
1,583 views
72 Discussing
5
#ThailandSupremeCourtRulesBitcoinIsProperty
9,031 views
306 Discussing
6
#BitcoinSurpasses$81K
32,690 views
113 Discussing
7
#RobinhoodFalls8.4%AfterItsResults
19,715 views
354 Discussing
8
#KOSPISurges6.63%BackAbove6000
18,586 views
354 Discussing
9
#DatavaultAICantWithdrawBitcoinFromBiconomy
22,326 views
329 Discussing
10
#FOMCWatch
9.4M views
29,787 Discussing