
CryptoQuant Quicktake
8.8k Posts

CryptoQuant Quicktake
 Square Verified+
Report
Block User
CryptoQuant.com - Leading On-chain Data/Analytics Provider
0 Following
22.9K+ Followers
27.1K+ Liked
Posts
Article
Bitcoin Reserves on Binance Have Reached a Dangerous LevelBitcoin is showing a strong recovery, but recent data suggests that profit taking may already be starting.
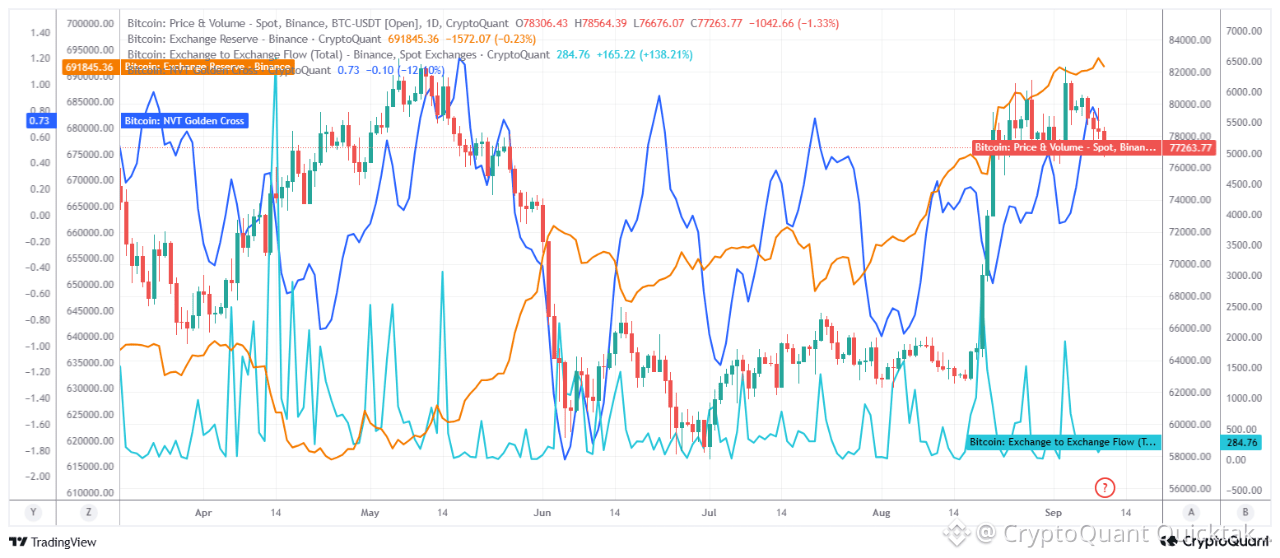
Binance’s total BTC reserve stands at 691,845 BTC, which is a medium term warning signal. The reserve has generally been rising since May, creating a cautious picture from the supply side. While BTC rallied in late August and early September, Binance’s reserves remained elevated. This divergence suggests that even if the rally continues, the risk of profit taking or a sharp pullback may be increasing.
Binance cross exchange transfer volume has also jumped to 284.76 BTC, up 138% daily. If transfer flows continue to increase while price weakens around a critical area, market volatility could rise. Previous major turquoise spikes on the chart have, at times, coincided with sharp price movements.
From a valuation perspective, however, Bitcoin is not showing an overheating signal yet.
NVT Golden Cross: 0.73 Historically, deeply negative NVT Golden Cross readings have appeared near market bottoms, while strong positive spikes have indicated greater overheating. At 0.73, the indicator is neither extremely low nor excessively high. It remains in a neutral to positive zone, with no clear overvaluation warning.
This does not mean BTC must rise from $77K. It simply suggests that the current pullback is not yet confirmed as a major valuation driven top by NVT.
The broader trend from the June lows remains upward. NVT is not overheated, and Binance’s reserve has seen a small decline over the past day.
However, Binance’s monthly reserve trend has risen significantly and remains elevated. BTC was rejected from the $82K–$83K area, while cross-exchange flows are picking up again.
For now, Bitcoin appears to be at a decision point around $77K. If short term selling pressure strengthens, the $72K–$74K zone could become the next target.
Written by PelinayPA
Bitcoin Reserves on Binance Have Reached a Dangerous Level
Bitcoin is showing a strong recovery, but recent data suggests that profit taking may already be starting.
Binance’s total BTC reserve stands at 691,845 BTC, which is a medium term warning signal. The reserve has generally been rising since May, creating a cautious picture from the supply side. While BTC rallied in late August and early September, Binance’s reserves remained elevated. This divergence suggests that even if the rally continues, the risk of profit taking or a sharp pullback may be increasing.
Binance cross exchange transfer volume has also jumped to 284.76 BTC, up 138% daily. If transfer flows continue to increase while price weakens around a critical area, market volatility could rise. Previous major turquoise spikes on the chart have, at times, coincided with sharp price movements.
From a valuation perspective, however, Bitcoin is not showing an overheating signal yet.
NVT Golden Cross: 0.73 Historically, deeply negative NVT Golden Cross readings have appeared near market bottoms, while strong positive spikes have indicated greater overheating. At 0.73, the indicator is neither extremely low nor excessively high. It remains in a neutral to positive zone, with no clear overvaluation warning.
This does not mean BTC must rise from $77K. It simply suggests that the current pullback is not yet confirmed as a major valuation driven top by NVT.
The broader trend from the June lows remains upward. NVT is not overheated, and Binance’s reserve has seen a small decline over the past day.
However, Binance’s monthly reserve trend has risen significantly and remains elevated. BTC was rejected from the $82K–$83K area, while cross-exchange flows are picking up again.
For now, Bitcoin appears to be at a decision point around $77K. If short term selling pressure strengthens, the $72K–$74K zone could become the next target.
Written by PelinayPA
Binance’s total BTC reserve stands at 691,845 BTC, which is a medium term warning signal. The reserve has generally been rising since May, creating a cautious picture from the supply side. While BTC rallied in late August and early September, Binance’s reserves remained elevated. This divergence suggests that even if the rally continues, the risk of profit taking or a sharp pullback may be increasing.
Binance cross exchange transfer volume has also jumped to 284.76 BTC, up 138% daily. If transfer flows continue to increase while price weakens around a critical area, market volatility could rise. Previous major turquoise spikes on the chart have, at times, coincided with sharp price movements.
From a valuation perspective, however, Bitcoin is not showing an overheating signal yet.
NVT Golden Cross: 0.73 Historically, deeply negative NVT Golden Cross readings have appeared near market bottoms, while strong positive spikes have indicated greater overheating. At 0.73, the indicator is neither extremely low nor excessively high. It remains in a neutral to positive zone, with no clear overvaluation warning.
This does not mean BTC must rise from $77K. It simply suggests that the current pullback is not yet confirmed as a major valuation driven top by NVT.
The broader trend from the June lows remains upward. NVT is not overheated, and Binance’s reserve has seen a small decline over the past day.
However, Binance’s monthly reserve trend has risen significantly and remains elevated. BTC was rejected from the $82K–$83K area, while cross-exchange flows are picking up again.
For now, Bitcoin appears to be at a decision point around $77K. If short term selling pressure strengthens, the $72K–$74K zone could become the next target.
Written by PelinayPA
82
Article
Gate’s Top Equity Tickers Drive Record TradFi VolumeGate’s equity activity is increasingly being driven by a small group of high conviction tickers.
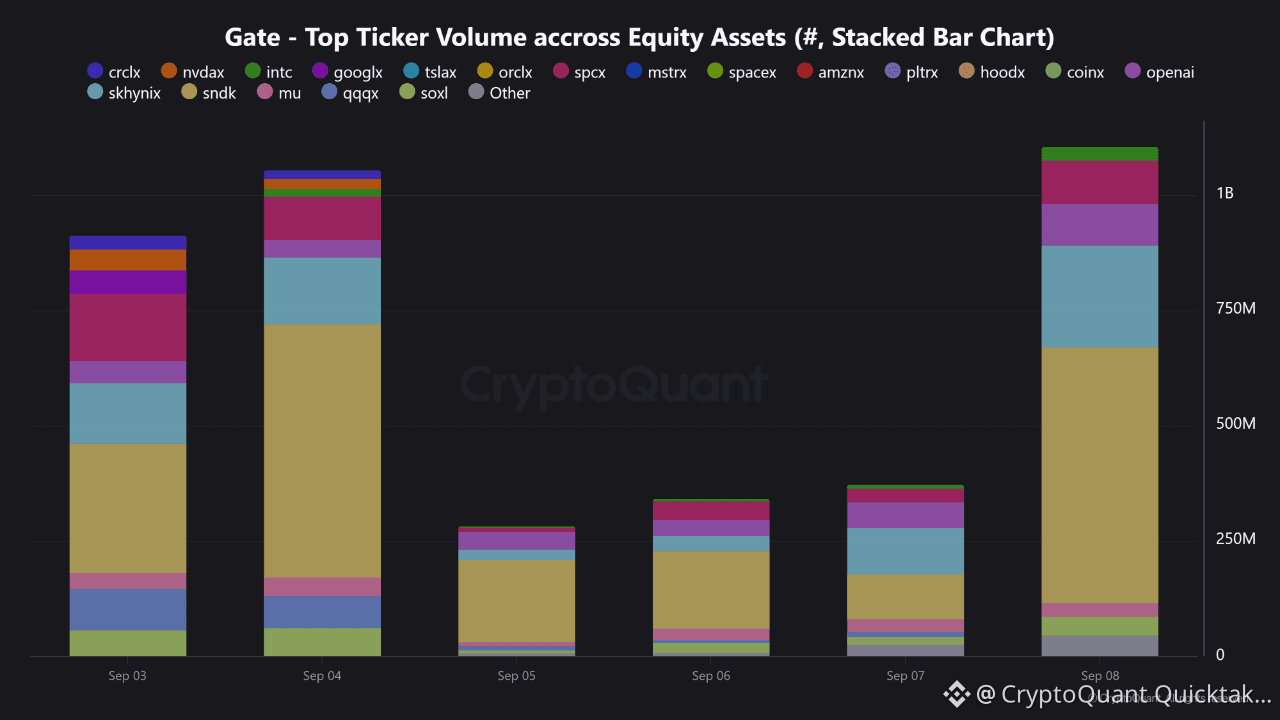
In recent weeks, the platform’s leading TradFi equity names have generated significant trading volume. Since late July, Gate’s top equity tickers have consistently recorded more than $10B in weekly volume. One recent week exceeded $20B, marking a new platform high and a 94% week over week increase.
The standout names include:
SNDK (SanDisk) led with an exceptional single day volume of more than $3.6B.
SPCX (SpaceX) and SK Hynix regularly recorded daily volumes above $500M.
NVDAX (Nvidia) remains one of the most consistently traded U.S. technology equities on the platform.
This concentration is not random. Strong performance in AI, memory, and technology stocks appears to be attracting crypto native capital seeking direct equity exposure without leaving the Gate ecosystem.
The result is a clear concentration of liquidity around a handful of high growth names, with AI, semiconductor, and technology stocks becoming major contributors to Gate’s equity volume.
Gate’s combination of real stock access, tokenized gStocks, and 24/7 trading is helping translate strong equity performance into sustained ticker level liquidity.
The takeaway: Gate’s leading equity books are moving beyond experimentation and becoming an increasingly important driver of its TradFi activity.
Written by theophiluspep
Gate’s Top Equity Tickers Drive Record TradFi Volume
Gate’s equity activity is increasingly being driven by a small group of high conviction tickers.
In recent weeks, the platform’s leading TradFi equity names have generated significant trading volume. Since late July, Gate’s top equity tickers have consistently recorded more than $10B in weekly volume. One recent week exceeded $20B, marking a new platform high and a 94% week over week increase.
The standout names include:
SNDK (SanDisk) led with an exceptional single day volume of more than $3.6B.
SPCX (SpaceX) and SK Hynix regularly recorded daily volumes above $500M.
NVDAX (Nvidia) remains one of the most consistently traded U.S. technology equities on the platform.
This concentration is not random. Strong performance in AI, memory, and technology stocks appears to be attracting crypto native capital seeking direct equity exposure without leaving the Gate ecosystem.
The result is a clear concentration of liquidity around a handful of high growth names, with AI, semiconductor, and technology stocks becoming major contributors to Gate’s equity volume.
Gate’s combination of real stock access, tokenized gStocks, and 24/7 trading is helping translate strong equity performance into sustained ticker level liquidity.
The takeaway: Gate’s leading equity books are moving beyond experimentation and becoming an increasingly important driver of its TradFi activity.
Written by theophiluspep
In recent weeks, the platform’s leading TradFi equity names have generated significant trading volume. Since late July, Gate’s top equity tickers have consistently recorded more than $10B in weekly volume. One recent week exceeded $20B, marking a new platform high and a 94% week over week increase.
The standout names include:
SNDK (SanDisk) led with an exceptional single day volume of more than $3.6B.
SPCX (SpaceX) and SK Hynix regularly recorded daily volumes above $500M.
NVDAX (Nvidia) remains one of the most consistently traded U.S. technology equities on the platform.
This concentration is not random. Strong performance in AI, memory, and technology stocks appears to be attracting crypto native capital seeking direct equity exposure without leaving the Gate ecosystem.
The result is a clear concentration of liquidity around a handful of high growth names, with AI, semiconductor, and technology stocks becoming major contributors to Gate’s equity volume.
Gate’s combination of real stock access, tokenized gStocks, and 24/7 trading is helping translate strong equity performance into sustained ticker level liquidity.
The takeaway: Gate’s leading equity books are moving beyond experimentation and becoming an increasingly important driver of its TradFi activity.
Written by theophiluspep
60
Article
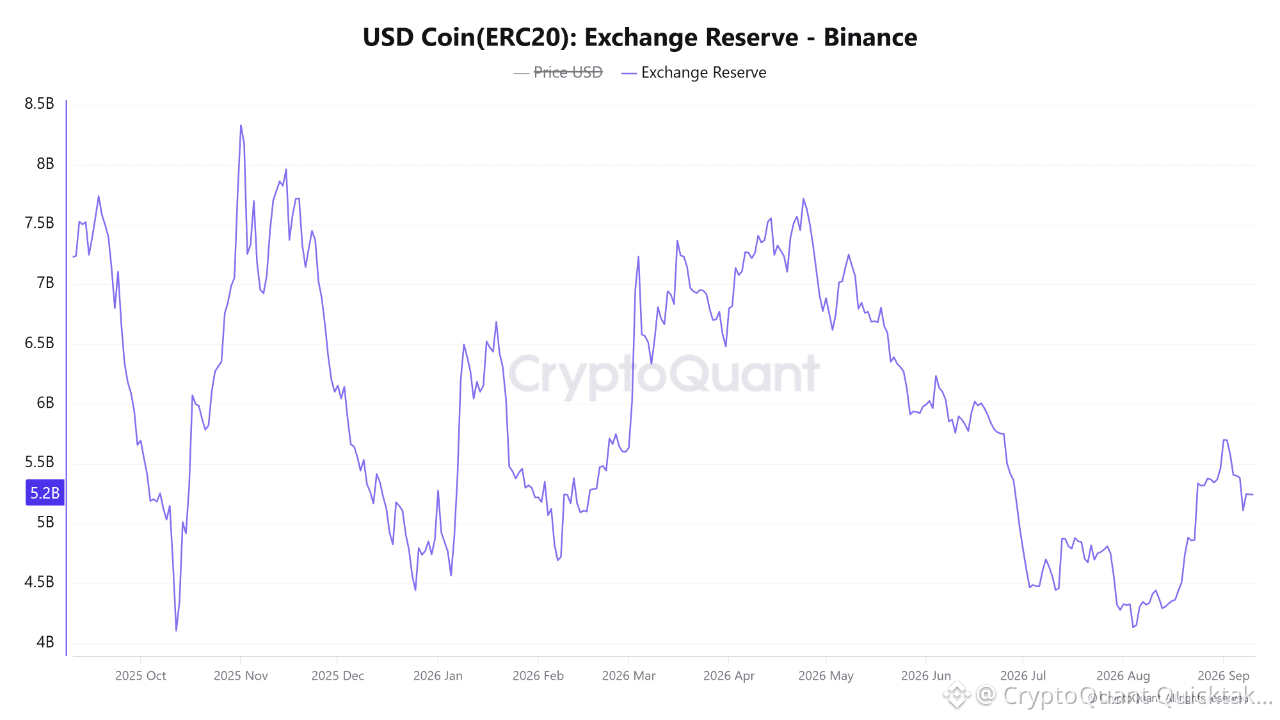
USDC Reserves on Binance Just Bounced Back.USDC mostly represents institutional money and size traders. When this reserve sat at the lows throughout July and August, the market barely had any real support. Seeing USDC flow back onto the exchange in less than a month shows a noticeable amount of cash is sitting ready in accounts again.
Capital isn't just sitting in cold wallets anymore—it's moving onto CEXs. That means people are willing to take on custody risk to wait for an opportunity.
It builds a thick buy-side liquidity cushion right on Binance. Whether this dry powder actually gets deployed to push prices up right away is hard to say. But at least the market isn't completely running on fumes like it was a few weeks ago.
Having cash parked on the exchange is where the story starts.
Written by Rei Researcher
USDC Reserves on Binance Just Bounced Back.
USDC mostly represents institutional money and size traders. When this reserve sat at the lows throughout July and August, the market barely had any real support. Seeing USDC flow back onto the exchange in less than a month shows a noticeable amount of cash is sitting ready in accounts again.
Capital isn't just sitting in cold wallets anymore—it's moving onto CEXs. That means people are willing to take on custody risk to wait for an opportunity.
It builds a thick buy-side liquidity cushion right on Binance. Whether this dry powder actually gets deployed to push prices up right away is hard to say. But at least the market isn't completely running on fumes like it was a few weeks ago.
Having cash parked on the exchange is where the story starts.
Written by Rei Researcher
Capital isn't just sitting in cold wallets anymore—it's moving onto CEXs. That means people are willing to take on custody risk to wait for an opportunity.
It builds a thick buy-side liquidity cushion right on Binance. Whether this dry powder actually gets deployed to push prices up right away is hard to say. But at least the market isn't completely running on fumes like it was a few weeks ago.
Having cash parked on the exchange is where the story starts.
Written by Rei Researcher
23
Article
Binance ETH Reserves Drop to 3 Month Low As Staking Hits Record 35.9%Ethereum is consolidating around the $2,420 to $2,470 range after recent volatility, while a notable supply signal is emerging on Binance.
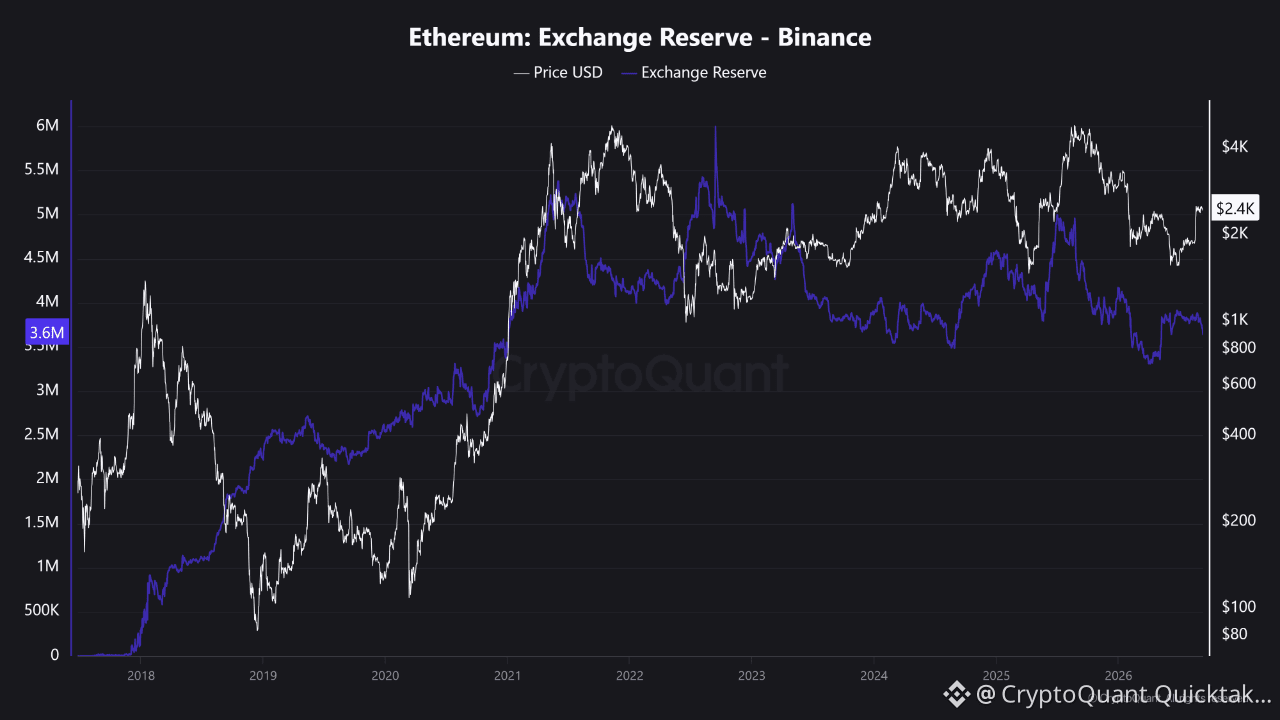
CryptoQuant data shows that Binance ETH reserves have fallen to approximately 3.74M ETH, the lowest level in three months. This decline is part of a broader reduction in exchange held ETH, with total reserves across major exchanges recently reaching a multi year low of approximately 14.88M ETH.
The decline on Binance matters because it reduces the amount of ETH immediately available for selling on one of the world's largest exchanges by trading volume. When ETH moves from exchanges into self custody or staking, the amount of liquid supply available for short term selling generally decreases.
This reserve decline coincides with a record level of Ethereum staking. Approximately 43.1M ETH, or 35.91% of circulating supply, is now staked, marking an all time high. More ETH is therefore being locked into the network rather than remaining readily available for sale on exchanges.
On the derivatives side, Binance continues to hold a significant share of ETH open interest at around $5.6B, while long positioning remains dominant. The combination of falling exchange reserves, record staking, and elevated but not extreme leverage points to a market where liquid ETH supply is gradually tightening as price consolidates.
If Binance ETH reserves continue to decline while staking remains elevated, the structural supply picture for Ethereum could improve further. The key metrics to watch are continued negative exchange netflows and whether spot demand begins absorbing the remaining available liquidity.
Written by theophiluspep
Binance ETH Reserves Drop to 3 Month Low As Staking Hits Record 35.9%
Ethereum is consolidating around the $2,420 to $2,470 range after recent volatility, while a notable supply signal is emerging on Binance.
CryptoQuant data shows that Binance ETH reserves have fallen to approximately 3.74M ETH, the lowest level in three months. This decline is part of a broader reduction in exchange held ETH, with total reserves across major exchanges recently reaching a multi year low of approximately 14.88M ETH.
The decline on Binance matters because it reduces the amount of ETH immediately available for selling on one of the world's largest exchanges by trading volume. When ETH moves from exchanges into self custody or staking, the amount of liquid supply available for short term selling generally decreases.
This reserve decline coincides with a record level of Ethereum staking. Approximately 43.1M ETH, or 35.91% of circulating supply, is now staked, marking an all time high. More ETH is therefore being locked into the network rather than remaining readily available for sale on exchanges.
On the derivatives side, Binance continues to hold a significant share of ETH open interest at around $5.6B, while long positioning remains dominant. The combination of falling exchange reserves, record staking, and elevated but not extreme leverage points to a market where liquid ETH supply is gradually tightening as price consolidates.
If Binance ETH reserves continue to decline while staking remains elevated, the structural supply picture for Ethereum could improve further. The key metrics to watch are continued negative exchange netflows and whether spot demand begins absorbing the remaining available liquidity.
Written by theophiluspep
CryptoQuant data shows that Binance ETH reserves have fallen to approximately 3.74M ETH, the lowest level in three months. This decline is part of a broader reduction in exchange held ETH, with total reserves across major exchanges recently reaching a multi year low of approximately 14.88M ETH.
The decline on Binance matters because it reduces the amount of ETH immediately available for selling on one of the world's largest exchanges by trading volume. When ETH moves from exchanges into self custody or staking, the amount of liquid supply available for short term selling generally decreases.
This reserve decline coincides with a record level of Ethereum staking. Approximately 43.1M ETH, or 35.91% of circulating supply, is now staked, marking an all time high. More ETH is therefore being locked into the network rather than remaining readily available for sale on exchanges.
On the derivatives side, Binance continues to hold a significant share of ETH open interest at around $5.6B, while long positioning remains dominant. The combination of falling exchange reserves, record staking, and elevated but not extreme leverage points to a market where liquid ETH supply is gradually tightening as price consolidates.
If Binance ETH reserves continue to decline while staking remains elevated, the structural supply picture for Ethereum could improve further. The key metrics to watch are continued negative exchange netflows and whether spot demand begins absorbing the remaining available liquidity.
Written by theophiluspep
69
Article
ECB Hike + Hot US PPI Send Bitcoin Futures Into Sell-off ModeThis afternoon, markets faced two rather negative pieces of news.
The first is the 0.25bps rate hike announced by the ECB. This is the second rate hike of the year, driven by concerns over rising inflation.
We also just got US Producer Price Index (PPI) figures, which came in stronger than expected. Core PPI, which excludes food and energy, rose to 4.6% YoY versus 4.5% expected, and headline PPI came in at 5.4% versus 5.1% expected.
These figures add to fears of intensifying inflation, something the markets immediately priced in.
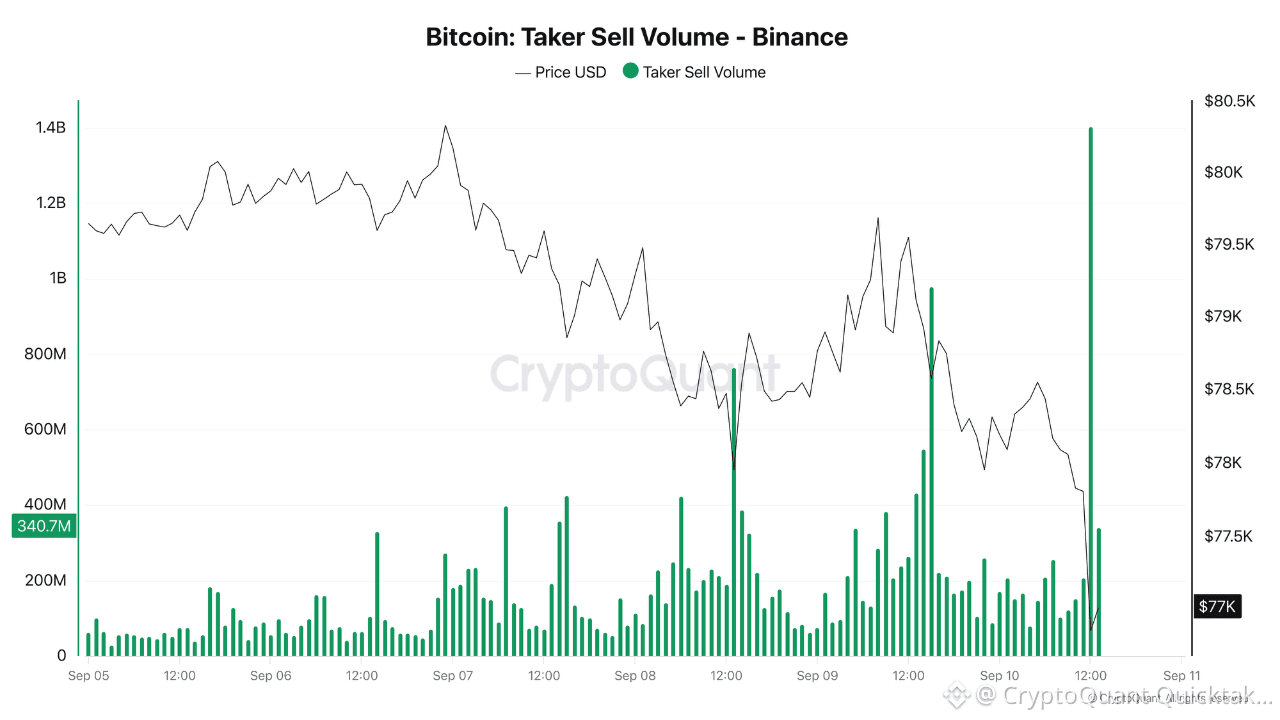
This can be seen in the Bitcoin futures market, where Taker sell volume surged to over $1.4 billion on Binance in that hour alone.
This sudden spike in selling pressure on futures reflects real investor concern, as they prefer to hedge by betting on a Bitcoin downside. The move was also accompanied by more than $60 million liquidated on Bitcoin in under an hour.
Written by Darkfost
ECB Hike + Hot US PPI Send Bitcoin Futures Into Sell-off Mode
This afternoon, markets faced two rather negative pieces of news.
The first is the 0.25bps rate hike announced by the ECB. This is the second rate hike of the year, driven by concerns over rising inflation.
We also just got US Producer Price Index (PPI) figures, which came in stronger than expected. Core PPI, which excludes food and energy, rose to 4.6% YoY versus 4.5% expected, and headline PPI came in at 5.4% versus 5.1% expected.
These figures add to fears of intensifying inflation, something the markets immediately priced in.
This can be seen in the Bitcoin futures market, where Taker sell volume surged to over $1.4 billion on Binance in that hour alone.
This sudden spike in selling pressure on futures reflects real investor concern, as they prefer to hedge by betting on a Bitcoin downside. The move was also accompanied by more than $60 million liquidated on Bitcoin in under an hour.
Written by Darkfost
The first is the 0.25bps rate hike announced by the ECB. This is the second rate hike of the year, driven by concerns over rising inflation.
We also just got US Producer Price Index (PPI) figures, which came in stronger than expected. Core PPI, which excludes food and energy, rose to 4.6% YoY versus 4.5% expected, and headline PPI came in at 5.4% versus 5.1% expected.
These figures add to fears of intensifying inflation, something the markets immediately priced in.
This can be seen in the Bitcoin futures market, where Taker sell volume surged to over $1.4 billion on Binance in that hour alone.
This sudden spike in selling pressure on futures reflects real investor concern, as they prefer to hedge by betting on a Bitcoin downside. The move was also accompanied by more than $60 million liquidated on Bitcoin in under an hour.
Written by Darkfost
88
Article
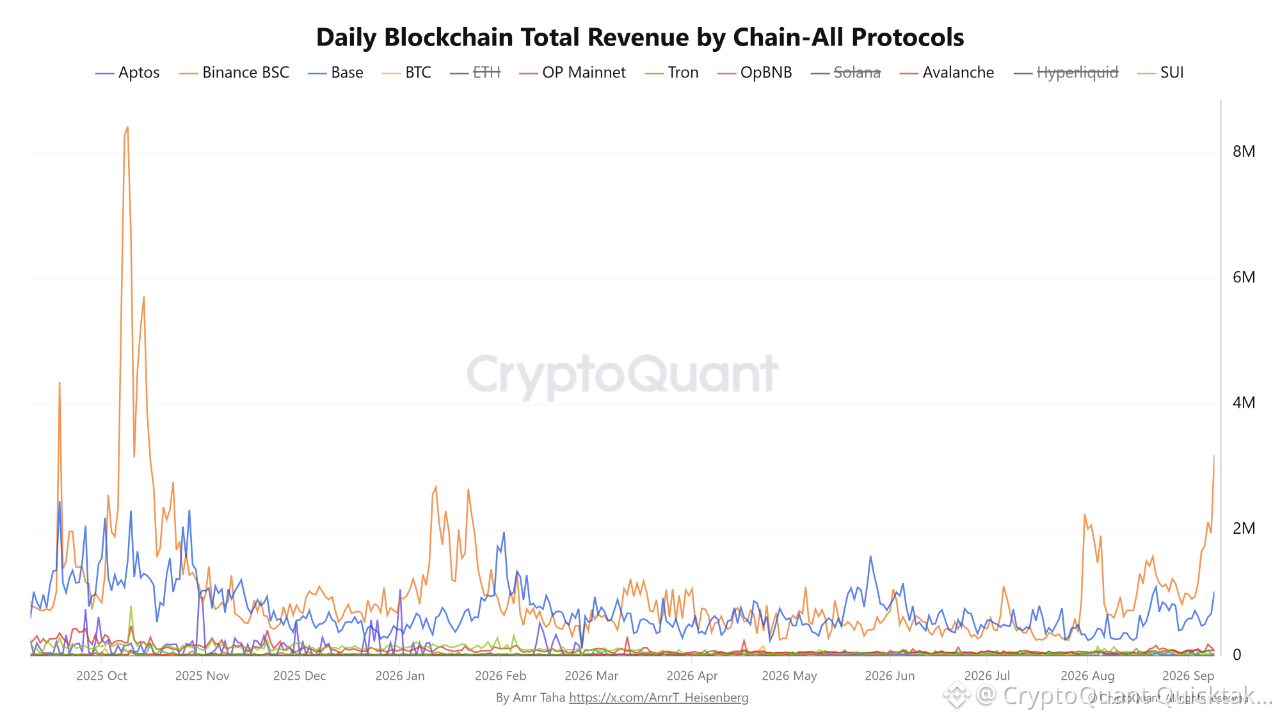
BNB Chain Protocol Revenue Jumps 42% to Highest Level Since October 2025BNB Smart Chain’s daily total revenue climbed to $3.2M on September 9, its highest level since October 2025, marking a sharp increase in fee-generating activity across All Protocols on the network.
The latest reading is roughly 42% above the $2.25M recorded on July 31, when Bitcoin traded near $62.4K.
Over the same period, BTC rose about 26% to $78.4K, meaning BSC protocols revenue expanded considerably faster than Bitcoin’s price.
The current level also stands around 19% above the $2.68 million recorded on January 12, even though Bitcoin is now roughly 14% below its January 12 price of $91.2K.
The divergence suggests that the latest increase in BSC protocol revenue is not simply tracking Bitcoin’s price direction.
The expansion is also visible on Base.
Daily protocol revenue reached approximately $1.02M on September 9, up from about $347,000 on July 31 — an increase of roughly 194%, or nearly 3x, in just over five weeks.
Higher protocols revenue generally reflects stronger fee-generating activity across decentralized exchanges, token launches, derivatives, lending platforms and other on-chain applications.
Revenue can increase alongside greater activity from both retail traders and larger investors, but the market implications can differ depending on which group is driving that activity.
Periods of stronger whale participation can be more consistent with constructive subsequent price behavior, particularly when larger holders absorb supply during weaker market phases.
In contrast, sharp retail-led activity near market tops can coincide with distribution from larger holders into rising retail demand, while near market bottoms the opposite dynamic may emerge as larger investors accumulate supply sold by weaker retail participants. Revenue alone, however, does not identify which investor cohort is responsible for the activity.
For now, the clearest signal is the scale of the increase itself: BSC revenue has reached its strongest level in nearly a year.
Written by Amr Taha
BNB Chain Protocol Revenue Jumps 42% to Highest Level Since October 2025
BNB Smart Chain’s daily total revenue climbed to $3.2M on September 9, its highest level since October 2025, marking a sharp increase in fee-generating activity across All Protocols on the network.
The latest reading is roughly 42% above the $2.25M recorded on July 31, when Bitcoin traded near $62.4K.
Over the same period, BTC rose about 26% to $78.4K, meaning BSC protocols revenue expanded considerably faster than Bitcoin’s price.
The current level also stands around 19% above the $2.68 million recorded on January 12, even though Bitcoin is now roughly 14% below its January 12 price of $91.2K.
The divergence suggests that the latest increase in BSC protocol revenue is not simply tracking Bitcoin’s price direction.
The expansion is also visible on Base.
Daily protocol revenue reached approximately $1.02M on September 9, up from about $347,000 on July 31 — an increase of roughly 194%, or nearly 3x, in just over five weeks.
Higher protocols revenue generally reflects stronger fee-generating activity across decentralized exchanges, token launches, derivatives, lending platforms and other on-chain applications.
Revenue can increase alongside greater activity from both retail traders and larger investors, but the market implications can differ depending on which group is driving that activity.
Periods of stronger whale participation can be more consistent with constructive subsequent price behavior, particularly when larger holders absorb supply during weaker market phases.
In contrast, sharp retail-led activity near market tops can coincide with distribution from larger holders into rising retail demand, while near market bottoms the opposite dynamic may emerge as larger investors accumulate supply sold by weaker retail participants. Revenue alone, however, does not identify which investor cohort is responsible for the activity.
For now, the clearest signal is the scale of the increase itself: BSC revenue has reached its strongest level in nearly a year.
Written by Amr Taha
The latest reading is roughly 42% above the $2.25M recorded on July 31, when Bitcoin traded near $62.4K.
Over the same period, BTC rose about 26% to $78.4K, meaning BSC protocols revenue expanded considerably faster than Bitcoin’s price.
The current level also stands around 19% above the $2.68 million recorded on January 12, even though Bitcoin is now roughly 14% below its January 12 price of $91.2K.
The divergence suggests that the latest increase in BSC protocol revenue is not simply tracking Bitcoin’s price direction.
The expansion is also visible on Base.
Daily protocol revenue reached approximately $1.02M on September 9, up from about $347,000 on July 31 — an increase of roughly 194%, or nearly 3x, in just over five weeks.
Higher protocols revenue generally reflects stronger fee-generating activity across decentralized exchanges, token launches, derivatives, lending platforms and other on-chain applications.
Revenue can increase alongside greater activity from both retail traders and larger investors, but the market implications can differ depending on which group is driving that activity.
Periods of stronger whale participation can be more consistent with constructive subsequent price behavior, particularly when larger holders absorb supply during weaker market phases.
In contrast, sharp retail-led activity near market tops can coincide with distribution from larger holders into rising retail demand, while near market bottoms the opposite dynamic may emerge as larger investors accumulate supply sold by weaker retail participants. Revenue alone, however, does not identify which investor cohort is responsible for the activity.
For now, the clearest signal is the scale of the increase itself: BSC revenue has reached its strongest level in nearly a year.
Written by Amr Taha
119
Article
Bitcoin Demand Is Stabilizing. Now It Needs ConvictionBitcoin’s apparent demand structure is beginning to improve, but the market is not yet showing the type of demand expansion normally associated with a sustained bullish regime.
Apparent Demand is designed to capture whether new Bitcoin supply is being absorbed by the market. In practical terms, positive readings point to net demand expansion, while negative readings indicate that available supply is exceeding the amount being absorbed.
The most constructive development is occurring on the negative side of the metric.
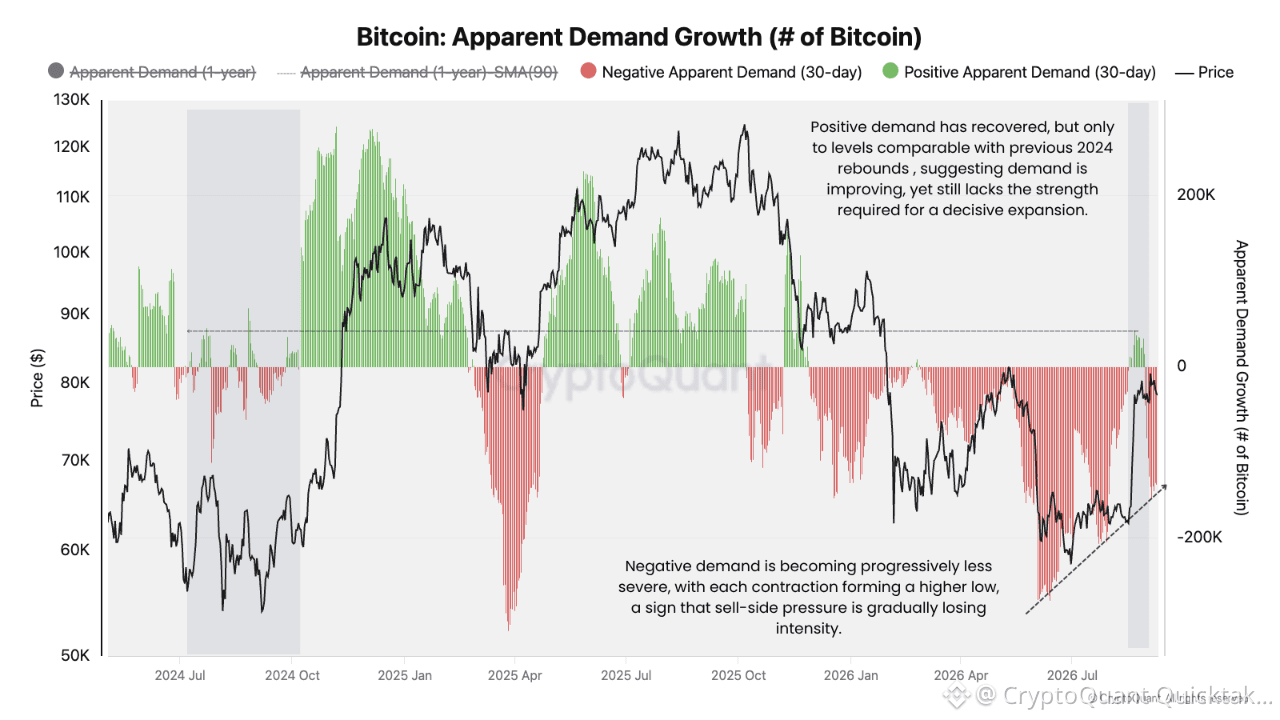
Since the deep contraction registered around May–June, successive negative-demand troughs have become progressively shallower. The higher-low structure suggests that the imbalance beneath price is improving: each new contraction is requiring less demand destruction than the previous one.
That is an important characteristic of a market moving away from a bearish regime. But there is another side to the signal.
The recent return of positive apparent demand has so far reached only levels comparable with relatively modest rebounds seen during 2024. It remains far from the stronger and more persistent demand expansions visible during the major advances of late 2024 and 2025.
Bitcoin may be transitioning from demand contraction into demand stabilization, rather than already entering demand expansion. Price can recover during that transition because the marginal imbalance between supply and demand is improving.
But for a durable upside leg, the market likely needs a sustained positive demand, progressively higher demand peaks, and enough liquidity and investor conviction to absorb supply consistently rather than temporarily.
Written by MorenoDV_
Bitcoin Demand Is Stabilizing. Now It Needs Conviction
Bitcoin’s apparent demand structure is beginning to improve, but the market is not yet showing the type of demand expansion normally associated with a sustained bullish regime.
Apparent Demand is designed to capture whether new Bitcoin supply is being absorbed by the market. In practical terms, positive readings point to net demand expansion, while negative readings indicate that available supply is exceeding the amount being absorbed.
The most constructive development is occurring on the negative side of the metric.
Since the deep contraction registered around May–June, successive negative-demand troughs have become progressively shallower. The higher-low structure suggests that the imbalance beneath price is improving: each new contraction is requiring less demand destruction than the previous one.
That is an important characteristic of a market moving away from a bearish regime. But there is another side to the signal.
The recent return of positive apparent demand has so far reached only levels comparable with relatively modest rebounds seen during 2024. It remains far from the stronger and more persistent demand expansions visible during the major advances of late 2024 and 2025.
Bitcoin may be transitioning from demand contraction into demand stabilization, rather than already entering demand expansion. Price can recover during that transition because the marginal imbalance between supply and demand is improving.
But for a durable upside leg, the market likely needs a sustained positive demand, progressively higher demand peaks, and enough liquidity and investor conviction to absorb supply consistently rather than temporarily.
Written by MorenoDV_
Apparent Demand is designed to capture whether new Bitcoin supply is being absorbed by the market. In practical terms, positive readings point to net demand expansion, while negative readings indicate that available supply is exceeding the amount being absorbed.
The most constructive development is occurring on the negative side of the metric.
Since the deep contraction registered around May–June, successive negative-demand troughs have become progressively shallower. The higher-low structure suggests that the imbalance beneath price is improving: each new contraction is requiring less demand destruction than the previous one.
That is an important characteristic of a market moving away from a bearish regime. But there is another side to the signal.
The recent return of positive apparent demand has so far reached only levels comparable with relatively modest rebounds seen during 2024. It remains far from the stronger and more persistent demand expansions visible during the major advances of late 2024 and 2025.
Bitcoin may be transitioning from demand contraction into demand stabilization, rather than already entering demand expansion. Price can recover during that transition because the marginal imbalance between supply and demand is improving.
But for a durable upside leg, the market likely needs a sustained positive demand, progressively higher demand peaks, and enough liquidity and investor conviction to absorb supply consistently rather than temporarily.
Written by MorenoDV_
91
Article
Is Exchange Flow Confirming the Price Move?BTC is back above $80K, but something feels a little off
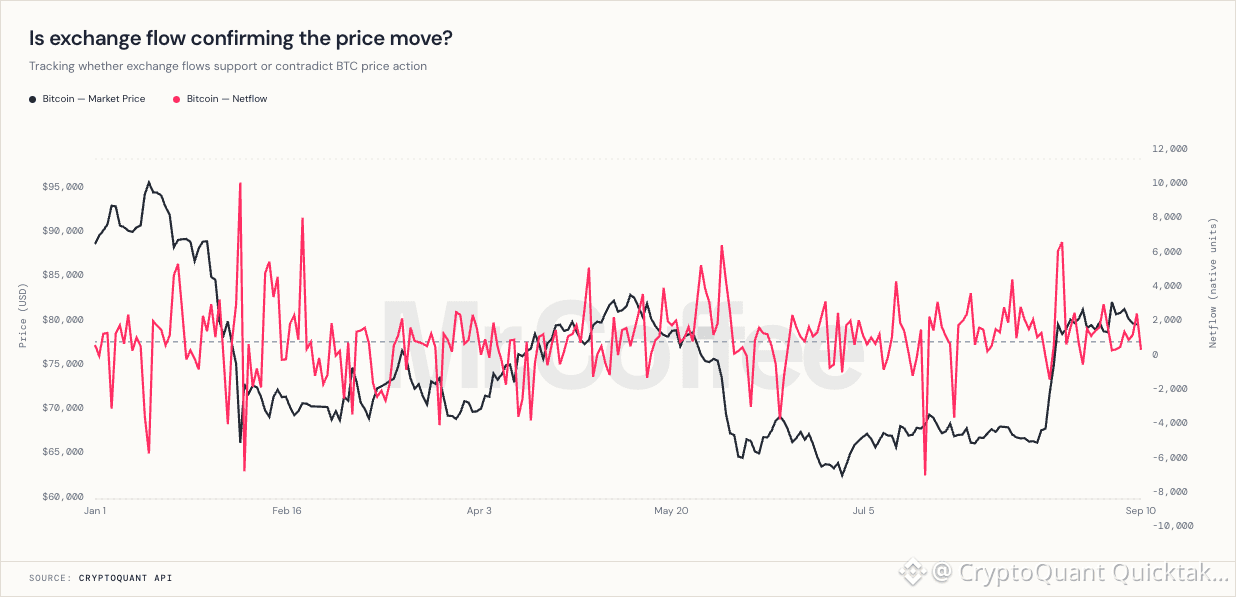
Exchange netflow just printed another pretty big spike, and we saw similar spikes during the May to July selloff
Obviously, this doesn't mean BTC is about to dump, but seeing these big inflows while price keeps pushing higher is something I don't want to ignore
Could be sellers taking advantage of the strength, or maybe the market just absorbs all this flow and keeps pushing
Curious to see which one plays out
Written by nocoffeenobrain
Is Exchange Flow Confirming the Price Move?
BTC is back above $80K, but something feels a little off
Exchange netflow just printed another pretty big spike, and we saw similar spikes during the May to July selloff
Obviously, this doesn't mean BTC is about to dump, but seeing these big inflows while price keeps pushing higher is something I don't want to ignore
Could be sellers taking advantage of the strength, or maybe the market just absorbs all this flow and keeps pushing
Curious to see which one plays out
Written by nocoffeenobrain
Exchange netflow just printed another pretty big spike, and we saw similar spikes during the May to July selloff
Obviously, this doesn't mean BTC is about to dump, but seeing these big inflows while price keeps pushing higher is something I don't want to ignore
Could be sellers taking advantage of the strength, or maybe the market just absorbs all this flow and keeps pushing
Curious to see which one plays out
Written by nocoffeenobrain
1
1
193
Article
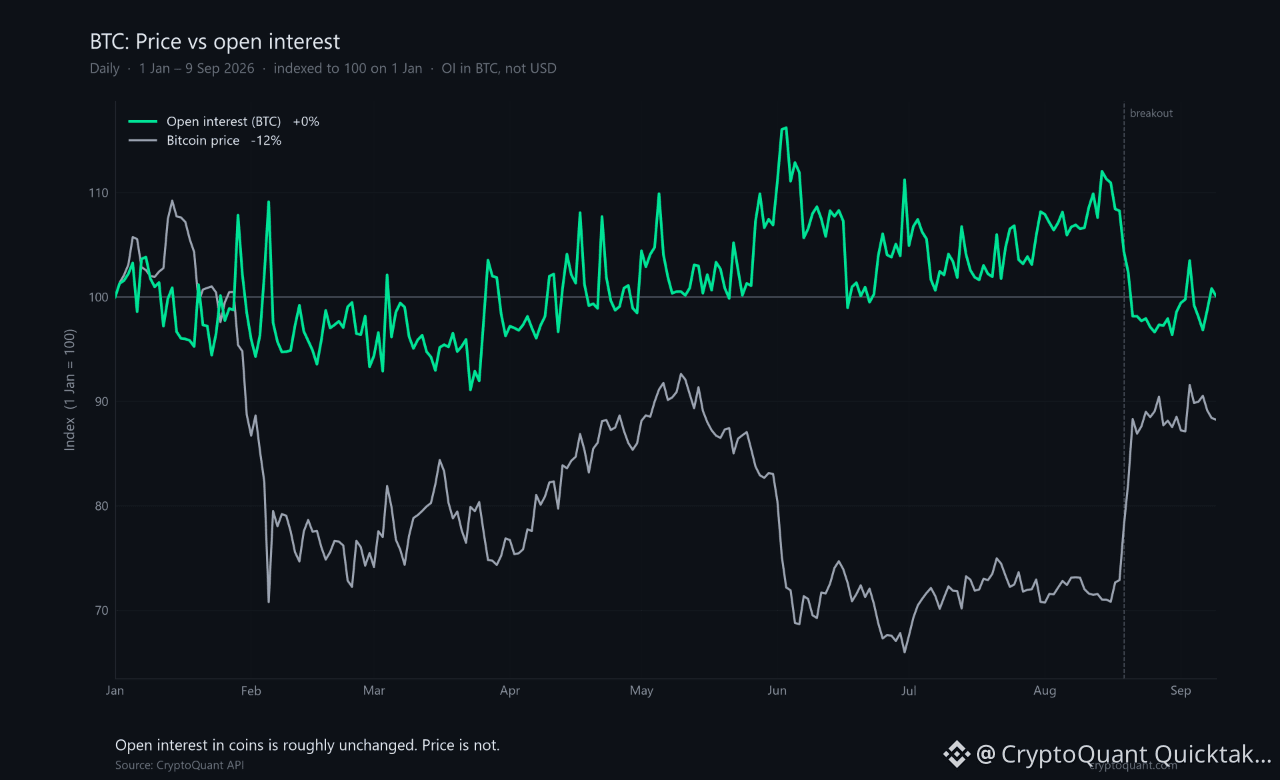
Since January, Bitcoin Is Down About 12%. Open Interest in Coins Is Not.From 1 January to 9 September, indexed to 100: price finished around 88, open interest in BTC around 100. Same amount of bitcoin sitting in perps. Very different price. The June low took price near $58.5k. The August breakout tagged $80k twice. Neither move shows up as a lasting shift in coin-denominated OI.
USD open interest looks glued to price. That is mostly the unit. When notional is measured in dollars, OI rises when price rises even if nobody opened a larger coin position. Divide by price and the bet size in BTC barely trended. It chopped around the same level. It did not explode with the August breakout, and it did not collapse with the June low.
That does not mean leverage cannot matter next week. It means 2026 so far does not look like a year driven by a bigger pile of BTC in futures. Spot supply did more of the work than a growing perp book.
Written by 우민규 Woominkyu
Since January, Bitcoin Is Down About 12%. Open Interest in Coins Is Not.
From 1 January to 9 September, indexed to 100: price finished around 88, open interest in BTC around 100. Same amount of bitcoin sitting in perps. Very different price. The June low took price near $58.5k. The August breakout tagged $80k twice. Neither move shows up as a lasting shift in coin-denominated OI.
USD open interest looks glued to price. That is mostly the unit. When notional is measured in dollars, OI rises when price rises even if nobody opened a larger coin position. Divide by price and the bet size in BTC barely trended. It chopped around the same level. It did not explode with the August breakout, and it did not collapse with the June low.
That does not mean leverage cannot matter next week. It means 2026 so far does not look like a year driven by a bigger pile of BTC in futures. Spot supply did more of the work than a growing perp book.
Written by 우민규 Woominkyu
USD open interest looks glued to price. That is mostly the unit. When notional is measured in dollars, OI rises when price rises even if nobody opened a larger coin position. Divide by price and the bet size in BTC barely trended. It chopped around the same level. It did not explode with the August breakout, and it did not collapse with the June low.
That does not mean leverage cannot matter next week. It means 2026 so far does not look like a year driven by a bigger pile of BTC in futures. Spot supply did more of the work than a growing perp book.
Written by 우민규 Woominkyu
98
Article
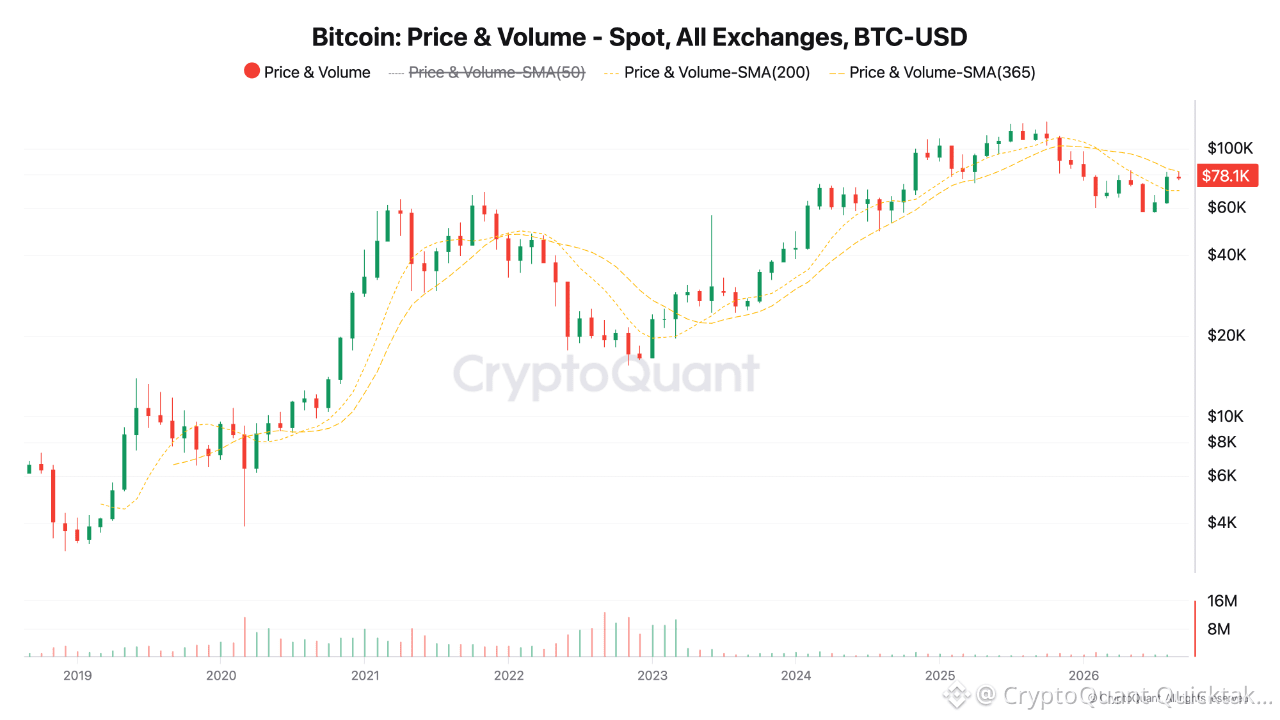
Real Recovery or Unfinished Business?Bitcoin has reclaimed both its 200-day SMA and 200-week MA after briefly breaking below the latter in early June and consolidating near it for nearly two months. The breakout came on August 19, but resistance at the 365-day SMA (~$82K) has already rejected one test: price spiked to $82,293 on September 3 before pulling back toward $79,000.
On-chain, price remains above both the Short-Term and Long-Term Holder Realized Price. STH-SOPR sits near 1.00 — breakeven. LTH-SOPR is more telling: it spent most of 2026 below 1, meaning long-term holders were realizing losses, not profits, for much of the year. Only the past two weeks have shown readings above 1 (1.20 on Sept 8), still volatile — it dropped to 0.89 the next day. NUPL sits at 0.32, in the Optimism zone: sentiment has turned positive but is far from euphoric.
The August 19-21 breakout carries a mechanical signature: roughly 17K BTC in short positions were liquidated over those three days, while aggregate exchange open interest fell rather than rose, pointing to forced short covering rather than fresh leveraged demand.
The squeeze did pull in real spot follow-through, but Spot Taker CVD (90-day) shows the spot momentum has not yet returned since May-June this year.
Bottom line: Bitcoin is attempting to leave the bottom, not confirming it. Reclaiming both 200-period MAs and holding above Realized Price levels are constructive. But until Spot Taker CVD 90-Day turns positive again and the 365-day SMA is reclaimed on a close, this remains an unconfirmed recovery attempt IMO.
Written by Crypto Mommy
Real Recovery or Unfinished Business?
Bitcoin has reclaimed both its 200-day SMA and 200-week MA after briefly breaking below the latter in early June and consolidating near it for nearly two months. The breakout came on August 19, but resistance at the 365-day SMA (~$82K) has already rejected one test: price spiked to $82,293 on September 3 before pulling back toward $79,000.
On-chain, price remains above both the Short-Term and Long-Term Holder Realized Price. STH-SOPR sits near 1.00 — breakeven. LTH-SOPR is more telling: it spent most of 2026 below 1, meaning long-term holders were realizing losses, not profits, for much of the year. Only the past two weeks have shown readings above 1 (1.20 on Sept 8), still volatile — it dropped to 0.89 the next day. NUPL sits at 0.32, in the Optimism zone: sentiment has turned positive but is far from euphoric.
The August 19-21 breakout carries a mechanical signature: roughly 17K BTC in short positions were liquidated over those three days, while aggregate exchange open interest fell rather than rose, pointing to forced short covering rather than fresh leveraged demand.
The squeeze did pull in real spot follow-through, but Spot Taker CVD (90-day) shows the spot momentum has not yet returned since May-June this year.
Bottom line: Bitcoin is attempting to leave the bottom, not confirming it. Reclaiming both 200-period MAs and holding above Realized Price levels are constructive. But until Spot Taker CVD 90-Day turns positive again and the 365-day SMA is reclaimed on a close, this remains an unconfirmed recovery attempt IMO.
Written by Crypto Mommy
On-chain, price remains above both the Short-Term and Long-Term Holder Realized Price. STH-SOPR sits near 1.00 — breakeven. LTH-SOPR is more telling: it spent most of 2026 below 1, meaning long-term holders were realizing losses, not profits, for much of the year. Only the past two weeks have shown readings above 1 (1.20 on Sept 8), still volatile — it dropped to 0.89 the next day. NUPL sits at 0.32, in the Optimism zone: sentiment has turned positive but is far from euphoric.
The August 19-21 breakout carries a mechanical signature: roughly 17K BTC in short positions were liquidated over those three days, while aggregate exchange open interest fell rather than rose, pointing to forced short covering rather than fresh leveraged demand.
The squeeze did pull in real spot follow-through, but Spot Taker CVD (90-day) shows the spot momentum has not yet returned since May-June this year.
Bottom line: Bitcoin is attempting to leave the bottom, not confirming it. Reclaiming both 200-period MAs and holding above Realized Price levels are constructive. But until Spot Taker CVD 90-Day turns positive again and the 365-day SMA is reclaimed on a close, this remains an unconfirmed recovery attempt IMO.
Written by Crypto Mommy
107
Article
"I'm the House Now ! "An iconic line from Treasury Secretary Scott Bessent regarding the U.S. intervention on the Yen.
At the same time, Bessent announced that the U.S. Treasury Department would buy more than $6 billion in 10- to 20-year treasury bonds, an announcement meant to curb the explosive upward trend in bond yields.
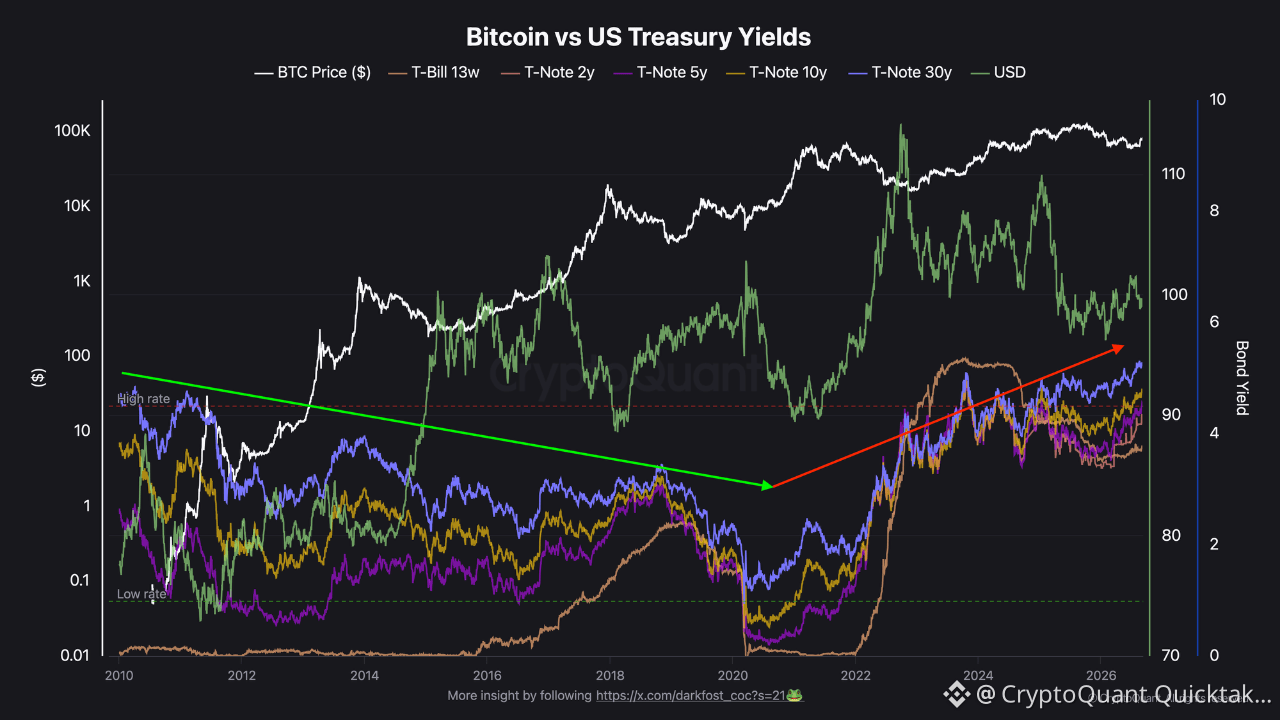
An announcement that turned out to be fairly disappointing for many, to the point that the U.S. 10Y is approaching 5% and its last 2023 high, a level similar to that of 2008. The same goes for the U.S. 20Y, which has now been trading above 5% since July.
Beyond this disappointment, the conflict with Iran is intensifying and pushing Brent crude back above $100, further fueling inflation concerns, which in turn is eroding investor confidence even more.
The momentum Bitcoin is trying to build is therefore unfolding against a very complex macroeconomic backdrop. Since 2021, the underlying trend in bond yields has been upward, a dynamic quite different from what Bitcoin had experienced since its inception.
It's therefore easy to understand that liquidity is tightening even further, but there's still one positive point worth noting.
The DXY, which had been on a positive trajectory since July 2025, is showing signs of weakness, slipping back below the $100 mark. A genuine break below its 180-day average, sitting at $99, would bring some relief.
Still, Bitcoin continues to face a tense economic and geopolitical environment that has likely weighed on its performance this cycle.
Written by Darkfost
"I'm the House Now ! "
An iconic line from Treasury Secretary Scott Bessent regarding the U.S. intervention on the Yen.
At the same time, Bessent announced that the U.S. Treasury Department would buy more than $6 billion in 10- to 20-year treasury bonds, an announcement meant to curb the explosive upward trend in bond yields.
An announcement that turned out to be fairly disappointing for many, to the point that the U.S. 10Y is approaching 5% and its last 2023 high, a level similar to that of 2008. The same goes for the U.S. 20Y, which has now been trading above 5% since July.
Beyond this disappointment, the conflict with Iran is intensifying and pushing Brent crude back above $100, further fueling inflation concerns, which in turn is eroding investor confidence even more.
The momentum Bitcoin is trying to build is therefore unfolding against a very complex macroeconomic backdrop. Since 2021, the underlying trend in bond yields has been upward, a dynamic quite different from what Bitcoin had experienced since its inception.
It's therefore easy to understand that liquidity is tightening even further, but there's still one positive point worth noting.
The DXY, which had been on a positive trajectory since July 2025, is showing signs of weakness, slipping back below the $100 mark. A genuine break below its 180-day average, sitting at $99, would bring some relief.
Still, Bitcoin continues to face a tense economic and geopolitical environment that has likely weighed on its performance this cycle.
Written by Darkfost
At the same time, Bessent announced that the U.S. Treasury Department would buy more than $6 billion in 10- to 20-year treasury bonds, an announcement meant to curb the explosive upward trend in bond yields.
An announcement that turned out to be fairly disappointing for many, to the point that the U.S. 10Y is approaching 5% and its last 2023 high, a level similar to that of 2008. The same goes for the U.S. 20Y, which has now been trading above 5% since July.
Beyond this disappointment, the conflict with Iran is intensifying and pushing Brent crude back above $100, further fueling inflation concerns, which in turn is eroding investor confidence even more.
The momentum Bitcoin is trying to build is therefore unfolding against a very complex macroeconomic backdrop. Since 2021, the underlying trend in bond yields has been upward, a dynamic quite different from what Bitcoin had experienced since its inception.
It's therefore easy to understand that liquidity is tightening even further, but there's still one positive point worth noting.
The DXY, which had been on a positive trajectory since July 2025, is showing signs of weakness, slipping back below the $100 mark. A genuine break below its 180-day average, sitting at $99, would bring some relief.
Still, Bitcoin continues to face a tense economic and geopolitical environment that has likely weighed on its performance this cycle.
Written by Darkfost
169
Article
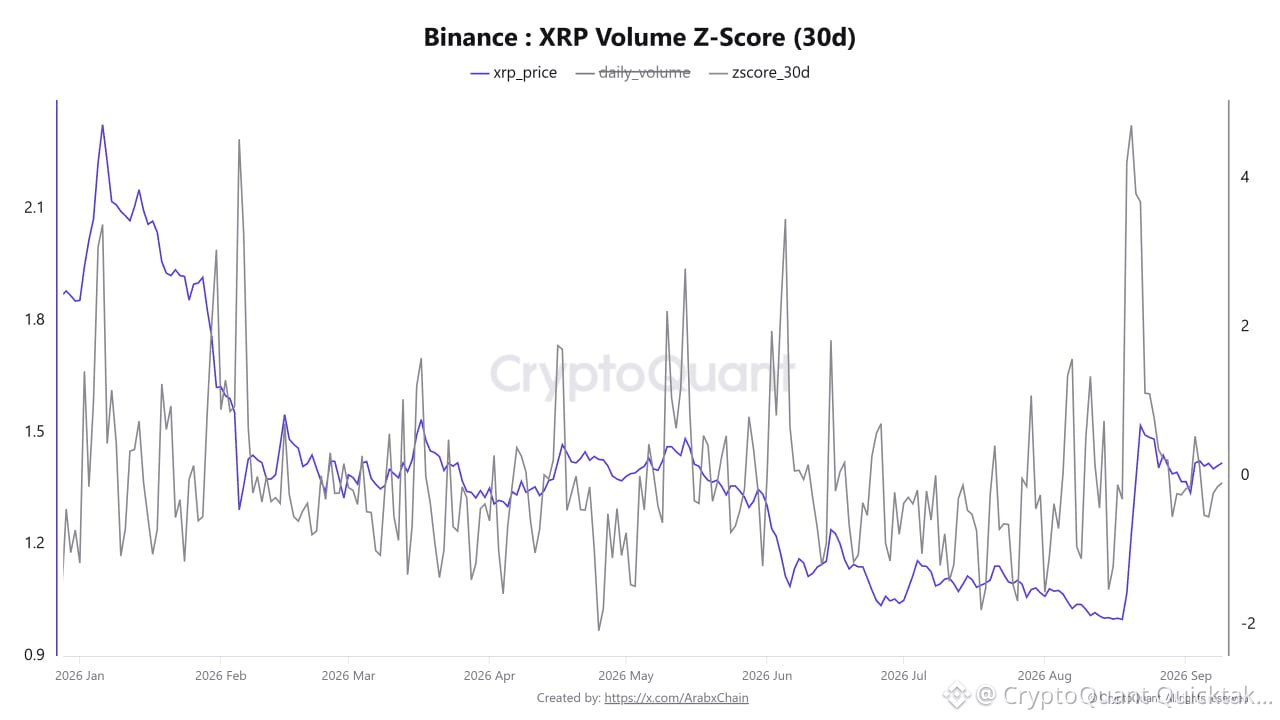
XRP Trading Volume Z-Score Declines on Binance As Activity Coolshe Binance XRP Volume Z-Score (30d) indicator shows a decline in momentum in XRP trading volumes on the Binance platform, following a surge in market activity during the second half of August. Data indicates that the Z-Score peaked above 4, coinciding with XRP’s price rise from near $1.00 to over $1.40, reflecting an exceptional spike in trading volume relative to the 30-day average.
However, the indicator subsequently entered a downward trend and is currently hovering near zero. It stood at approximately -0.09 on September 9, while the XRP price stabilized around $1.419. This level implies that current trading volume is very close to the average for the measured period, showing no significant positive or negative deviation from typical activity.
This decline in the Z-Score does not necessarily signal weakness in XRP’s price; rather, it indicates a decline in the exceptional trading volume momentum observed in August. Furthermore, the price’s stability near $1.40, despite trading volumes returning to normal levels, may reflect a consolidation phase as the market awaits a new catalyst.
Consequently, for XRP’s upward trend to continue, it is crucial to monitor whether trading volumes expand again and push the Z-Score into positive territory, which could support sustained momentum. Conversely, if the indicator remains near zero or slips into negative territory, it could signal subdued activity and weakening short-term price momentum.
Written by Arab Chain
XRP Trading Volume Z-Score Declines on Binance As Activity Cools
he Binance XRP Volume Z-Score (30d) indicator shows a decline in momentum in XRP trading volumes on the Binance platform, following a surge in market activity during the second half of August. Data indicates that the Z-Score peaked above 4, coinciding with XRP’s price rise from near $1.00 to over $1.40, reflecting an exceptional spike in trading volume relative to the 30-day average.
However, the indicator subsequently entered a downward trend and is currently hovering near zero. It stood at approximately -0.09 on September 9, while the XRP price stabilized around $1.419. This level implies that current trading volume is very close to the average for the measured period, showing no significant positive or negative deviation from typical activity.
This decline in the Z-Score does not necessarily signal weakness in XRP’s price; rather, it indicates a decline in the exceptional trading volume momentum observed in August. Furthermore, the price’s stability near $1.40, despite trading volumes returning to normal levels, may reflect a consolidation phase as the market awaits a new catalyst.
Consequently, for XRP’s upward trend to continue, it is crucial to monitor whether trading volumes expand again and push the Z-Score into positive territory, which could support sustained momentum. Conversely, if the indicator remains near zero or slips into negative territory, it could signal subdued activity and weakening short-term price momentum.
Written by Arab Chain
However, the indicator subsequently entered a downward trend and is currently hovering near zero. It stood at approximately -0.09 on September 9, while the XRP price stabilized around $1.419. This level implies that current trading volume is very close to the average for the measured period, showing no significant positive or negative deviation from typical activity.
This decline in the Z-Score does not necessarily signal weakness in XRP’s price; rather, it indicates a decline in the exceptional trading volume momentum observed in August. Furthermore, the price’s stability near $1.40, despite trading volumes returning to normal levels, may reflect a consolidation phase as the market awaits a new catalyst.
Consequently, for XRP’s upward trend to continue, it is crucial to monitor whether trading volumes expand again and push the Z-Score into positive territory, which could support sustained momentum. Conversely, if the indicator remains near zero or slips into negative territory, it could signal subdued activity and weakening short-term price momentum.
Written by Arab Chain
174
Article
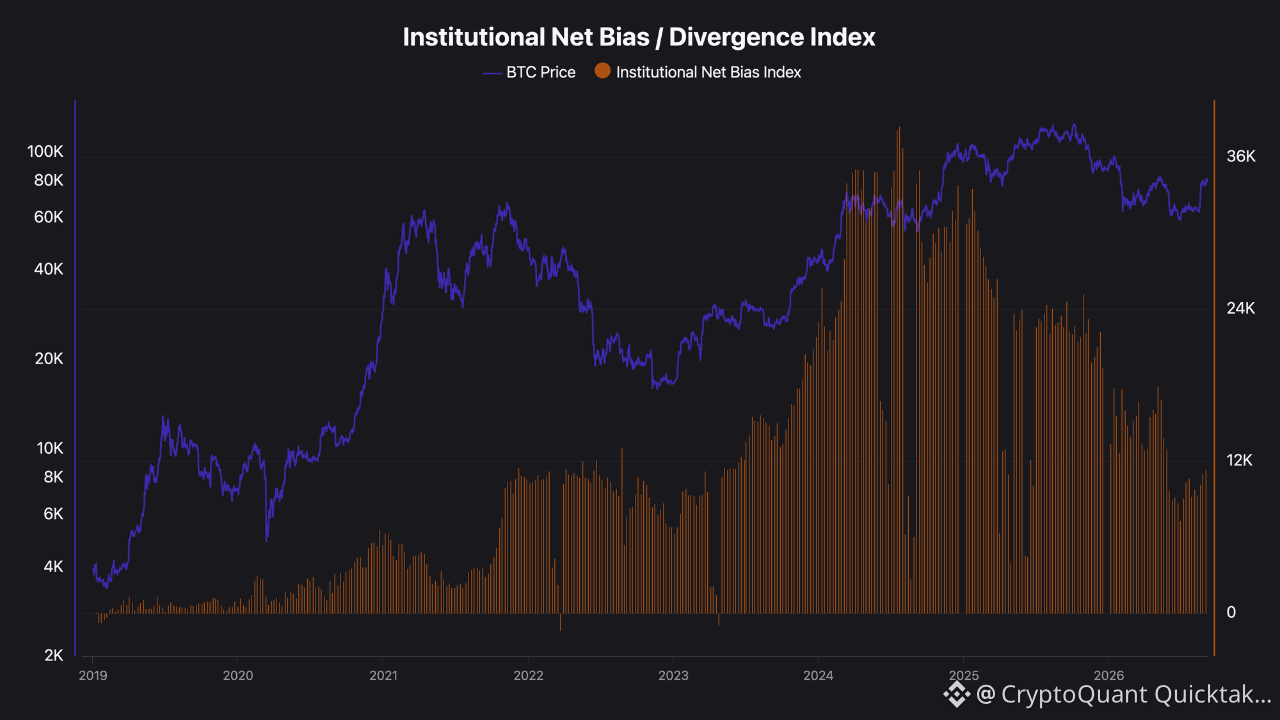
Institutional Trap or the Final Bottom? What the Net Bias Index Tells Us About BTCAs Bitcoin approaches the end of its bear market phase, the institutional Net Bias Index on the CME side has pulled back to the bottom levels seen during 2021–2022. American institutional investors, hedge funds, and asset management firms periodically restructure and rebalance their positions.
During the 2022 macro bottom, Bitcoin plummeted to around $15K while the Net Bias Index dipped to the 8K–10K range. Currently, Bitcoin is trading around the $78K mark with the institutional Net Bias Index sitting at 11K—a metric that actually dropped as low as 8K when Bitcoin was at $60K.
As a reminder, this metric is a composite scoring index calculated by tracking spot ETF flows, OTC trading volumes, and institutional wallet movements.
Data shows that hedge fund firms have significantly reduced their open short positions, signaling that selling pressure on Bitcoin is fading by the day. Overall, the broader picture looks promising. Even if we encounter another dip test or re-test after September, Bitcoin is poised to resume its upward trajectory once spot buying demand confirms strength.
Written by FundingVest
Institutional Trap or the Final Bottom? What the Net Bias Index Tells Us About BTC
As Bitcoin approaches the end of its bear market phase, the institutional Net Bias Index on the CME side has pulled back to the bottom levels seen during 2021–2022. American institutional investors, hedge funds, and asset management firms periodically restructure and rebalance their positions.
During the 2022 macro bottom, Bitcoin plummeted to around $15K while the Net Bias Index dipped to the 8K–10K range. Currently, Bitcoin is trading around the $78K mark with the institutional Net Bias Index sitting at 11K—a metric that actually dropped as low as 8K when Bitcoin was at $60K.
As a reminder, this metric is a composite scoring index calculated by tracking spot ETF flows, OTC trading volumes, and institutional wallet movements.
Data shows that hedge fund firms have significantly reduced their open short positions, signaling that selling pressure on Bitcoin is fading by the day. Overall, the broader picture looks promising. Even if we encounter another dip test or re-test after September, Bitcoin is poised to resume its upward trajectory once spot buying demand confirms strength.
Written by FundingVest
During the 2022 macro bottom, Bitcoin plummeted to around $15K while the Net Bias Index dipped to the 8K–10K range. Currently, Bitcoin is trading around the $78K mark with the institutional Net Bias Index sitting at 11K—a metric that actually dropped as low as 8K when Bitcoin was at $60K.
As a reminder, this metric is a composite scoring index calculated by tracking spot ETF flows, OTC trading volumes, and institutional wallet movements.
Data shows that hedge fund firms have significantly reduced their open short positions, signaling that selling pressure on Bitcoin is fading by the day. Overall, the broader picture looks promising. Even if we encounter another dip test or re-test after September, Bitcoin is poised to resume its upward trajectory once spot buying demand confirms strength.
Written by FundingVest
132
Article
What a Surging Yen Means for Bitcoin: BOJ Rate Hike Expectations and the Carry Trade UnwindUSD/JPY fell from 160.17 to 152.89 in roughly a week as expectations of another Bank of Japan rate hike fueled yen buying and the unwinding of short positions.
A stronger yen can pressure Bitcoin through two channels. Investors borrowing yen to buy risk assets may sell those holdings as repayment costs rise. Japanese investors also face currency losses: BTC's yen price equals its dollar price multiplied by USD/JPY. At $78,500 per BTC, a move from 160.17 to 153.81 cuts its yen value by about ¥500,000.
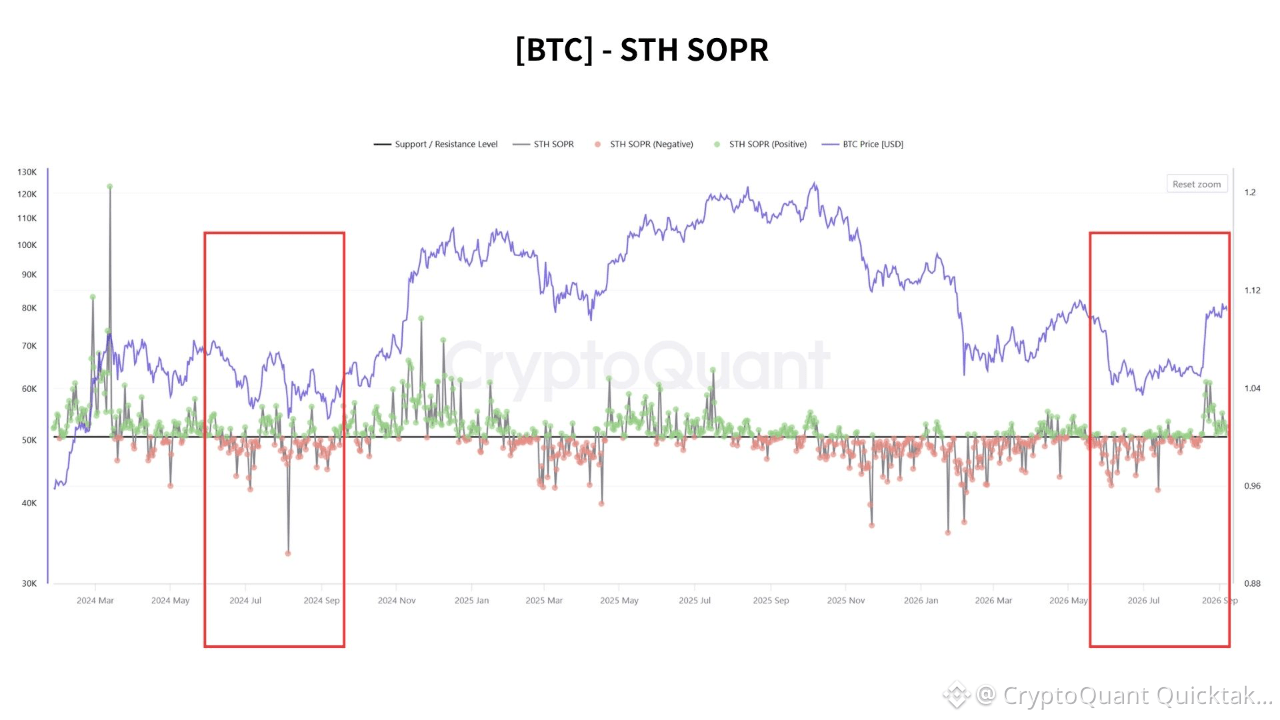
But is this August 2024 again? Not yet, based on the data presented. CryptoQuant's Short-Term Holder Spent Output Profit Ratio (STH-SOPR) plunged below 1 during that selloff, indicating realized losses. Recent readings around or slightly above 1 suggest no comparable panic among short-term holders.
STH-SOPR alone cannot establish whether carry trades are unwinding. A sustained drop below 1, rising exchange inflows and falling futures open interest would strengthen the case for broader deleveraging.
As USD/JPY approaches 150, watch the BOJ's guidance alongside these signals. For now, the clearest impact is on yen-denominated BTC, while evidence of a global liquidation wave remains limited.
Written by XWIN Japan
What a Surging Yen Means for Bitcoin: BOJ Rate Hike Expectations and the Carry Trade Unwind
USD/JPY fell from 160.17 to 152.89 in roughly a week as expectations of another Bank of Japan rate hike fueled yen buying and the unwinding of short positions.
A stronger yen can pressure Bitcoin through two channels. Investors borrowing yen to buy risk assets may sell those holdings as repayment costs rise. Japanese investors also face currency losses: BTC's yen price equals its dollar price multiplied by USD/JPY. At $78,500 per BTC, a move from 160.17 to 153.81 cuts its yen value by about ¥500,000.
But is this August 2024 again? Not yet, based on the data presented. CryptoQuant's Short-Term Holder Spent Output Profit Ratio (STH-SOPR) plunged below 1 during that selloff, indicating realized losses. Recent readings around or slightly above 1 suggest no comparable panic among short-term holders.
STH-SOPR alone cannot establish whether carry trades are unwinding. A sustained drop below 1, rising exchange inflows and falling futures open interest would strengthen the case for broader deleveraging.
As USD/JPY approaches 150, watch the BOJ's guidance alongside these signals. For now, the clearest impact is on yen-denominated BTC, while evidence of a global liquidation wave remains limited.
Written by XWIN Japan
A stronger yen can pressure Bitcoin through two channels. Investors borrowing yen to buy risk assets may sell those holdings as repayment costs rise. Japanese investors also face currency losses: BTC's yen price equals its dollar price multiplied by USD/JPY. At $78,500 per BTC, a move from 160.17 to 153.81 cuts its yen value by about ¥500,000.
But is this August 2024 again? Not yet, based on the data presented. CryptoQuant's Short-Term Holder Spent Output Profit Ratio (STH-SOPR) plunged below 1 during that selloff, indicating realized losses. Recent readings around or slightly above 1 suggest no comparable panic among short-term holders.
STH-SOPR alone cannot establish whether carry trades are unwinding. A sustained drop below 1, rising exchange inflows and falling futures open interest would strengthen the case for broader deleveraging.
As USD/JPY approaches 150, watch the BOJ's guidance alongside these signals. For now, the clearest impact is on yen-denominated BTC, while evidence of a global liquidation wave remains limited.
Written by XWIN Japan
111
Article
Bitcoin’s Bottoming Signals Strengthen, but Spot Demand Still LagsRecent CryptoQuant posts paint a mixed picture: Bitcoin shows signs of recovery, but a sustained bull market remains unconfirmed.
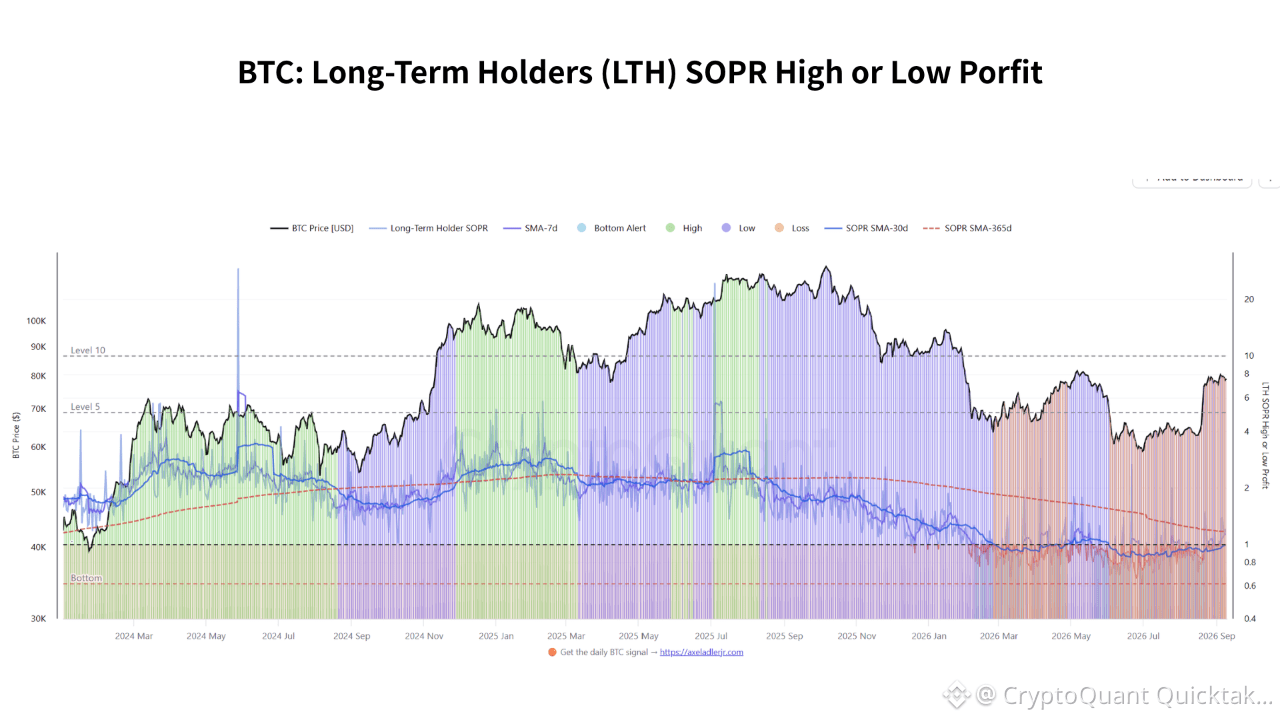
Net Realized Profit and Loss has turned positive, while Long-Term Holder SOPR has recovered to 1.2, suggesting easing loss realization. Accumulation addresses now hold around 2.3 million BTC, and hedge fund shorts have declined. Large exchange deposits have not surged despite BTC approaching $80,000.
Yet stronger buying is still needed. The 90-day spot CVD remains neutral, suggesting futures have led much of the rebound. Binance stablecoin reserves recovered by $1.6 billion over a month, but liquidity remains a concern. A negative Coinbase Premium and elevated whale deposit ratios also warrant caution.
These signals are not necessarily contradictory: whale activity can represent a high share of inflows without total deposits surging. Likewise, improving profitability does not guarantee fresh demand.
The key takeaway is that selling pressure appears to be easing, while new spot buyers remain insufficient. A sustained break above $80,000, supported by stronger spot demand and liquidity, would provide firmer evidence of a bullish transition. Until then, leverage-driven volatility remains a risk.
Written by XWIN Japan
Bitcoin’s Bottoming Signals Strengthen, but Spot Demand Still Lags
Recent CryptoQuant posts paint a mixed picture: Bitcoin shows signs of recovery, but a sustained bull market remains unconfirmed.
Net Realized Profit and Loss has turned positive, while Long-Term Holder SOPR has recovered to 1.2, suggesting easing loss realization. Accumulation addresses now hold around 2.3 million BTC, and hedge fund shorts have declined. Large exchange deposits have not surged despite BTC approaching $80,000.
Yet stronger buying is still needed. The 90-day spot CVD remains neutral, suggesting futures have led much of the rebound. Binance stablecoin reserves recovered by $1.6 billion over a month, but liquidity remains a concern. A negative Coinbase Premium and elevated whale deposit ratios also warrant caution.
These signals are not necessarily contradictory: whale activity can represent a high share of inflows without total deposits surging. Likewise, improving profitability does not guarantee fresh demand.
The key takeaway is that selling pressure appears to be easing, while new spot buyers remain insufficient. A sustained break above $80,000, supported by stronger spot demand and liquidity, would provide firmer evidence of a bullish transition. Until then, leverage-driven volatility remains a risk.
Written by XWIN Japan
Net Realized Profit and Loss has turned positive, while Long-Term Holder SOPR has recovered to 1.2, suggesting easing loss realization. Accumulation addresses now hold around 2.3 million BTC, and hedge fund shorts have declined. Large exchange deposits have not surged despite BTC approaching $80,000.
Yet stronger buying is still needed. The 90-day spot CVD remains neutral, suggesting futures have led much of the rebound. Binance stablecoin reserves recovered by $1.6 billion over a month, but liquidity remains a concern. A negative Coinbase Premium and elevated whale deposit ratios also warrant caution.
These signals are not necessarily contradictory: whale activity can represent a high share of inflows without total deposits surging. Likewise, improving profitability does not guarantee fresh demand.
The key takeaway is that selling pressure appears to be easing, while new spot buyers remain insufficient. A sustained break above $80,000, supported by stronger spot demand and liquidity, would provide firmer evidence of a bullish transition. Until then, leverage-driven volatility remains a risk.
Written by XWIN Japan
1
93
Article
Bitcoin's Rebound Looks Strong, but Liquidity Tells a Different StoryDespite a roughly 45% rebound from its recent low, Bitcoin's market is still feeling the effects of low liquidity.
This shows up notably in spot demand, which remains relatively weak, with the Cumulative Volume Delta (90 DMA) still sitting neutral, while on the futures side, buyers have clearly taken the upper hand.
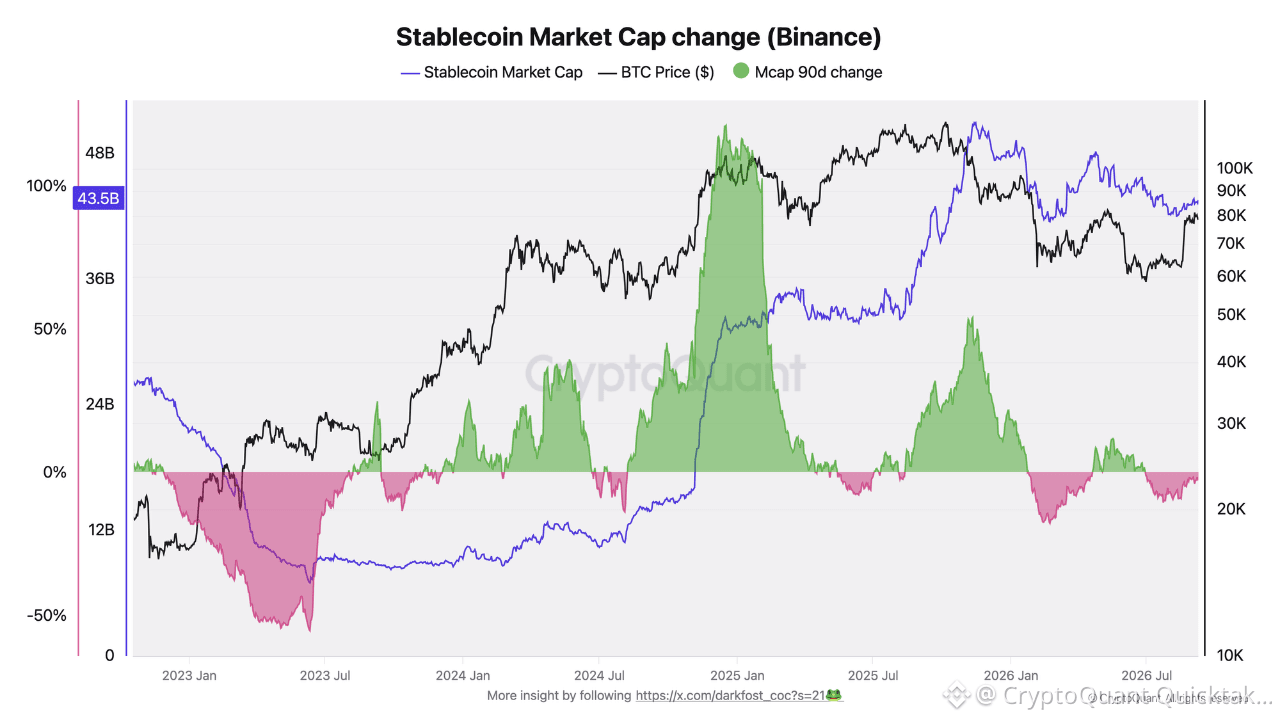
This lack of incoming liquidity is also visible in stablecoin reserves on exchanges. At the peak of this cycle, Binance saw its stablecoin reserves hit a new all-time high for the platform, at over $50 billion.
Since October, however, that dynamic has completely reversed, dragging Binance's stablecoin reserves down by nearly $7 billion. At the height of the correction, investor demand had contracted so sharply that the 90-day change in stablecoin market cap held in Binance's reserves reached -17%.
Today, things have improved slightly: the 90-day market cap change has recovered to -1.6%, and stablecoin reserves have grown by $1.6 billion over the past month.
While this is a positive development in the short term, it's still sluggish and needs more strength behind it to be considered truly meaningful.
That said, make no mistake: Bitcoin has swung back into clearly positive momentum, with a daily RSI at 67, and the 7 and 21-day EMAs turning up and crossing back above the 200-day moving average for the first time since November 2025.
A clean break above the $80 000 level should be the key to fully opening the door for liquidity to return for good.
Written by Darkfost
Bitcoin's Rebound Looks Strong, but Liquidity Tells a Different Story
Despite a roughly 45% rebound from its recent low, Bitcoin's market is still feeling the effects of low liquidity.
This shows up notably in spot demand, which remains relatively weak, with the Cumulative Volume Delta (90 DMA) still sitting neutral, while on the futures side, buyers have clearly taken the upper hand.
This lack of incoming liquidity is also visible in stablecoin reserves on exchanges. At the peak of this cycle, Binance saw its stablecoin reserves hit a new all-time high for the platform, at over $50 billion.
Since October, however, that dynamic has completely reversed, dragging Binance's stablecoin reserves down by nearly $7 billion. At the height of the correction, investor demand had contracted so sharply that the 90-day change in stablecoin market cap held in Binance's reserves reached -17%.
Today, things have improved slightly: the 90-day market cap change has recovered to -1.6%, and stablecoin reserves have grown by $1.6 billion over the past month.
While this is a positive development in the short term, it's still sluggish and needs more strength behind it to be considered truly meaningful.
That said, make no mistake: Bitcoin has swung back into clearly positive momentum, with a daily RSI at 67, and the 7 and 21-day EMAs turning up and crossing back above the 200-day moving average for the first time since November 2025.
A clean break above the $80 000 level should be the key to fully opening the door for liquidity to return for good.
Written by Darkfost
This shows up notably in spot demand, which remains relatively weak, with the Cumulative Volume Delta (90 DMA) still sitting neutral, while on the futures side, buyers have clearly taken the upper hand.
This lack of incoming liquidity is also visible in stablecoin reserves on exchanges. At the peak of this cycle, Binance saw its stablecoin reserves hit a new all-time high for the platform, at over $50 billion.
Since October, however, that dynamic has completely reversed, dragging Binance's stablecoin reserves down by nearly $7 billion. At the height of the correction, investor demand had contracted so sharply that the 90-day change in stablecoin market cap held in Binance's reserves reached -17%.
Today, things have improved slightly: the 90-day market cap change has recovered to -1.6%, and stablecoin reserves have grown by $1.6 billion over the past month.
While this is a positive development in the short term, it's still sluggish and needs more strength behind it to be considered truly meaningful.
That said, make no mistake: Bitcoin has swung back into clearly positive momentum, with a daily RSI at 67, and the 7 and 21-day EMAs turning up and crossing back above the 200-day moving average for the first time since November 2025.
A clean break above the $80 000 level should be the key to fully opening the door for liquidity to return for good.
Written by Darkfost
135
Article
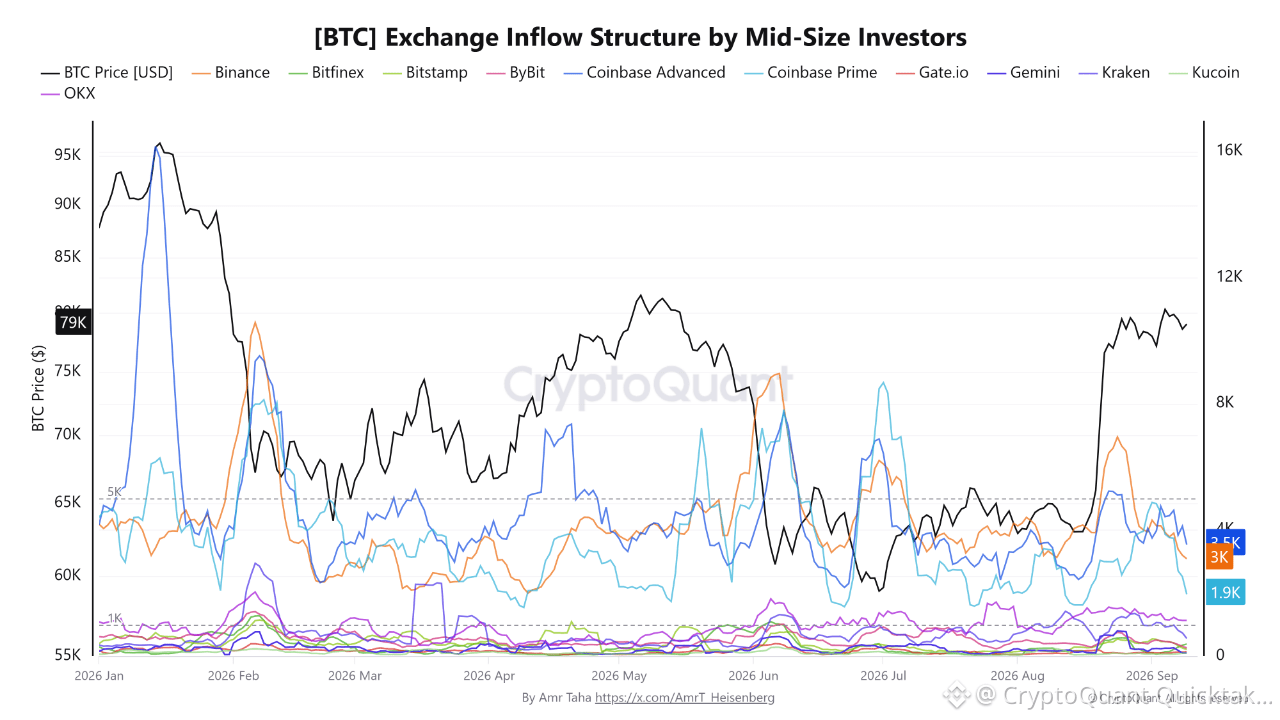
Bitcoin Climbs 25% While Mid-Size Exchange Inflows Drop 15%Bitcoin has risen roughly 25% since August 3, climbing from just above $63,000 to around $79,000, while mid-size investor inflows across Binance, Coinbase Advanced and Coinbase Prime moved in the opposite direction.
Combined inflows across the three venues fell from 10,144 BTC to 8,570 BTC, a decline of about 15.5% over the same period.
The divergence was strongest on Binance, where mid-size inflows dropped nearly 30%, from 4,390 BTC to 3,080 BTC.
Coinbase Advanced declined only 4%, from 3,677 BTC to 3,530 BTC, while Coinbase Prime fell about 5.6%, from 2,077 BTC to 1,960 BTC.
The relative exchange structure also shifted.
Binance stood 713 BTC above Coinbase Advanced on August 3, but by September 9 Coinbase Advanced was 450 BTC higher, representing a swing of more than 1,160 BTC between the two venues.
The data highlights a clear price-inflow divergence: Bitcoin is trading substantially higher than in early August, yet mid-size inflows across these key exchange channels remain lower.
Written by Amr Taha
Bitcoin Climbs 25% While Mid-Size Exchange Inflows Drop 15%
Bitcoin has risen roughly 25% since August 3, climbing from just above $63,000 to around $79,000, while mid-size investor inflows across Binance, Coinbase Advanced and Coinbase Prime moved in the opposite direction.
Combined inflows across the three venues fell from 10,144 BTC to 8,570 BTC, a decline of about 15.5% over the same period.
The divergence was strongest on Binance, where mid-size inflows dropped nearly 30%, from 4,390 BTC to 3,080 BTC.
Coinbase Advanced declined only 4%, from 3,677 BTC to 3,530 BTC, while Coinbase Prime fell about 5.6%, from 2,077 BTC to 1,960 BTC.
The relative exchange structure also shifted.
Binance stood 713 BTC above Coinbase Advanced on August 3, but by September 9 Coinbase Advanced was 450 BTC higher, representing a swing of more than 1,160 BTC between the two venues.
The data highlights a clear price-inflow divergence: Bitcoin is trading substantially higher than in early August, yet mid-size inflows across these key exchange channels remain lower.
Written by Amr Taha
Combined inflows across the three venues fell from 10,144 BTC to 8,570 BTC, a decline of about 15.5% over the same period.
The divergence was strongest on Binance, where mid-size inflows dropped nearly 30%, from 4,390 BTC to 3,080 BTC.
Coinbase Advanced declined only 4%, from 3,677 BTC to 3,530 BTC, while Coinbase Prime fell about 5.6%, from 2,077 BTC to 1,960 BTC.
The relative exchange structure also shifted.
Binance stood 713 BTC above Coinbase Advanced on August 3, but by September 9 Coinbase Advanced was 450 BTC higher, representing a swing of more than 1,160 BTC between the two venues.
The data highlights a clear price-inflow divergence: Bitcoin is trading substantially higher than in early August, yet mid-size inflows across these key exchange channels remain lower.
Written by Amr Taha
90
Article
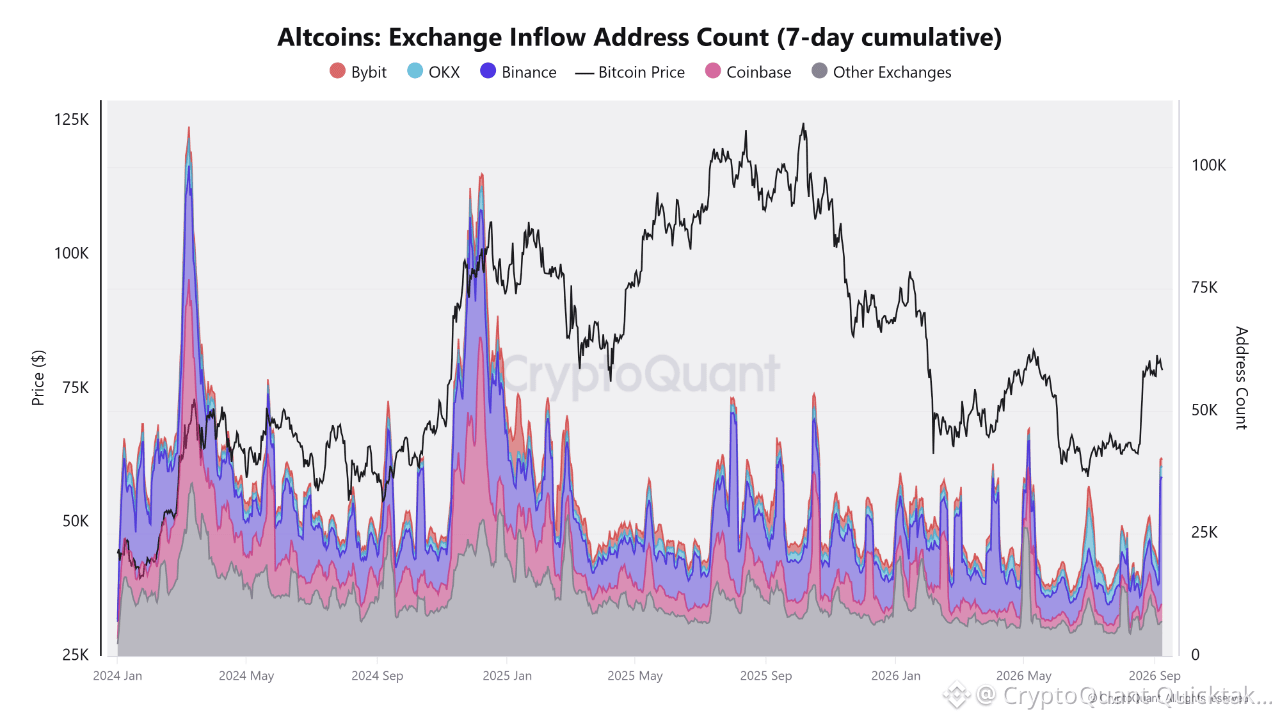
Altcoin Exchange Inflow Addresses Reach 4-Month HighData reveals a notable rise in the number of addresses associated with altcoin inflows to cryptocurrency exchanges, with the indicator reaching its highest level since last May, signaling increased user activity and greater movement of altcoins toward trading platforms.
According to the latest data, Binance recorded the highest number of addresses, at approximately 25,856, far outpacing other exchanges. Coinbase ranked second with around 3,574 addresses, followed by OKX with approximately 2,124, while Bybit recorded about 1,588 addresses.
The "Other Exchanges" category, comprising the remaining trading platforms, recorded approximately 6,978 addresses, reflecting widespread activity across a broader range of platforms.
The rise in the number of altcoin inflow addresses indicates increased movement of altcoins toward exchanges, potentially reflecting heightened trading activity or investors' readiness to reallocate their positions. However, this rise does not necessarily imply a sell-off, as coin inflows to exchanges can be linked to trading activity, portfolio restructuring, or increased liquidity.
Written by Arab Chain
Altcoin Exchange Inflow Addresses Reach 4-Month High
Data reveals a notable rise in the number of addresses associated with altcoin inflows to cryptocurrency exchanges, with the indicator reaching its highest level since last May, signaling increased user activity and greater movement of altcoins toward trading platforms.
According to the latest data, Binance recorded the highest number of addresses, at approximately 25,856, far outpacing other exchanges. Coinbase ranked second with around 3,574 addresses, followed by OKX with approximately 2,124, while Bybit recorded about 1,588 addresses.
The "Other Exchanges" category, comprising the remaining trading platforms, recorded approximately 6,978 addresses, reflecting widespread activity across a broader range of platforms.
The rise in the number of altcoin inflow addresses indicates increased movement of altcoins toward exchanges, potentially reflecting heightened trading activity or investors' readiness to reallocate their positions. However, this rise does not necessarily imply a sell-off, as coin inflows to exchanges can be linked to trading activity, portfolio restructuring, or increased liquidity.
Written by Arab Chain
According to the latest data, Binance recorded the highest number of addresses, at approximately 25,856, far outpacing other exchanges. Coinbase ranked second with around 3,574 addresses, followed by OKX with approximately 2,124, while Bybit recorded about 1,588 addresses.
The "Other Exchanges" category, comprising the remaining trading platforms, recorded approximately 6,978 addresses, reflecting widespread activity across a broader range of platforms.
The rise in the number of altcoin inflow addresses indicates increased movement of altcoins toward exchanges, potentially reflecting heightened trading activity or investors' readiness to reallocate their positions. However, this rise does not necessarily imply a sell-off, as coin inflows to exchanges can be linked to trading activity, portfolio restructuring, or increased liquidity.
Written by Arab Chain
66
Article
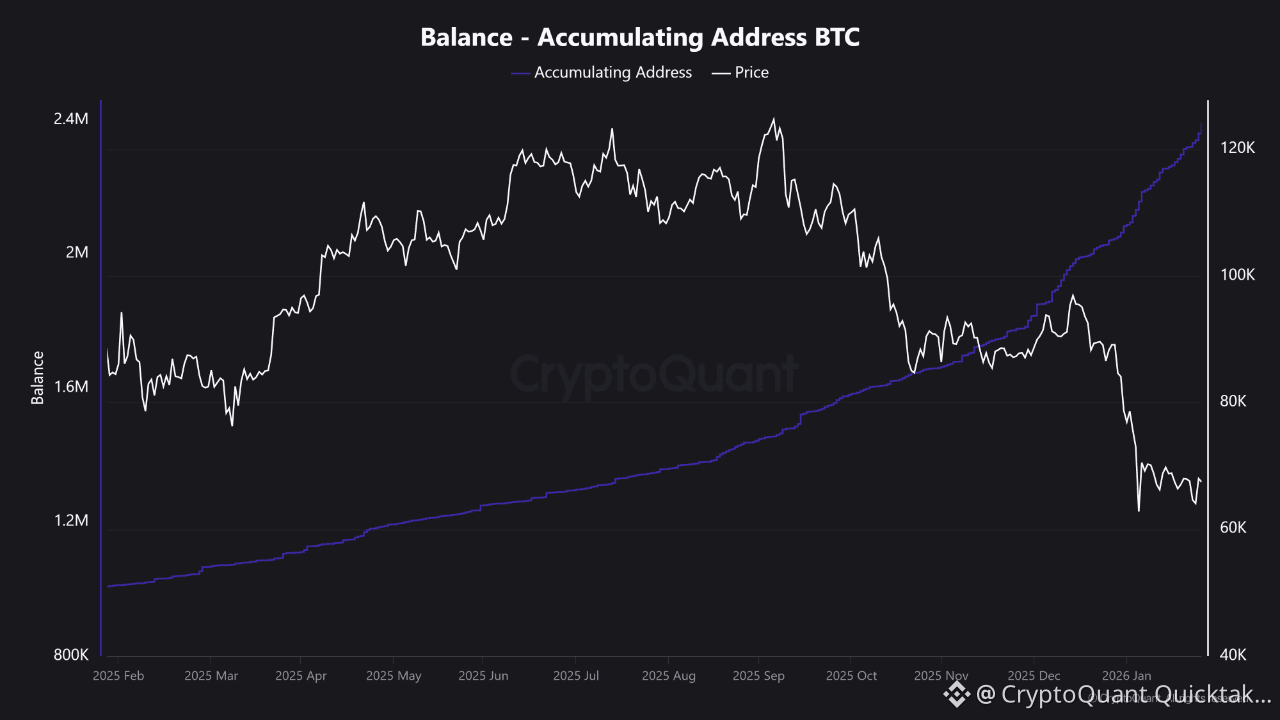
Bitcoin: Accumulating Addresses in an Environment of Scarce Supply ↓• Bitcoin accumulating addresses already hold 2.3M BTC.
• This represents more than 10% of Bitcoin’s maximum supply (21M).
Written by Facundo Fama
Bitcoin: Accumulating Addresses in an Environment of Scarce Supply ↓
• Bitcoin accumulating addresses already hold 2.3M BTC.
• This represents more than 10% of Bitcoin’s maximum supply (21M).
Written by Facundo Fama
• This represents more than 10% of Bitcoin’s maximum supply (21M).
Written by Facundo Fama
59
Article
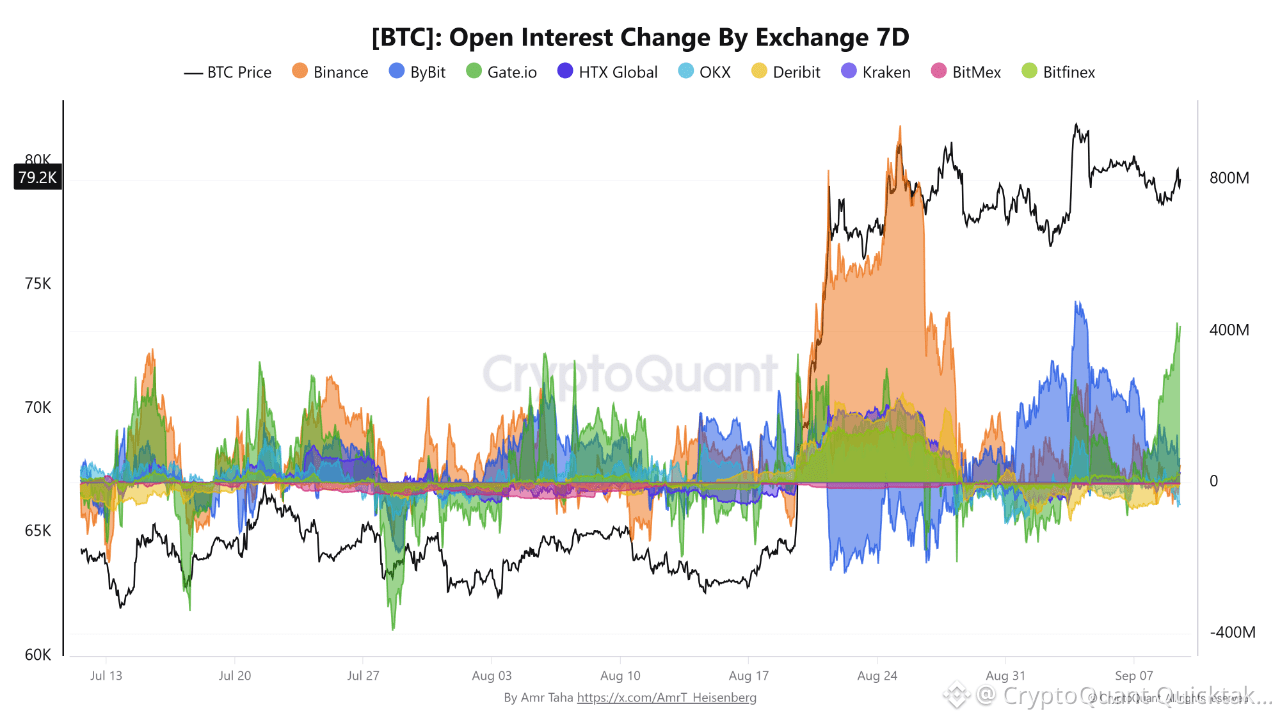
Bitcoin 7D Open Interest Swings 471M on Gate As Binance and Bybit Readings Retreat From Recent PeaksBitcoin’s 7-day open interest change showed a sharp shift across major derivatives venues on September 9, with the reading on Gate.io reaching +$414 million, up from -$57 million on September 6.
That represents a $471 million swing in just three days, moving the 7-day OI change from negative to strongly positive territory while Bitcoin traded near $79,200.
At the same time, the corresponding readings on Binance and Bybit eased substantially from their recent highs.
Binance’s 7-day open interest change stood at +$46 million on September 9, compared with +$926 million on August 25, a decline of roughly 95% from that peak reading.
Bybit recorded +$62 million, down around 87% from the +$470 million seen on September 4.
The contrast highlights a notable change in the distribution of Bitcoin’s recent open-interest expansion across exchanges.
While the latest Gate.io reading turned sharply positive, the previously elevated 7-day changes on Binance and Bybit have moderated significantly.
Importantly, open interest does not by itself reveal whether the newly opened positions are predominantly long or short.
The data therefore points to a divergence across exchanges in the balance between net position opening and position closure.
Where open interest is contracting, the reduction in outstanding positions can help ease excessive leverage and, if accompanied by softer perpetual-market imbalances, may also contribute to lower funding rates, without necessarily implying a directional signal for Bitcoin.
Written by Amr Taha
Bitcoin 7D Open Interest Swings 471M on Gate As Binance and Bybit Readings Retreat From Recent Peaks
Bitcoin’s 7-day open interest change showed a sharp shift across major derivatives venues on September 9, with the reading on Gate.io reaching +$414 million, up from -$57 million on September 6.
That represents a $471 million swing in just three days, moving the 7-day OI change from negative to strongly positive territory while Bitcoin traded near $79,200.
At the same time, the corresponding readings on Binance and Bybit eased substantially from their recent highs.
Binance’s 7-day open interest change stood at +$46 million on September 9, compared with +$926 million on August 25, a decline of roughly 95% from that peak reading.
Bybit recorded +$62 million, down around 87% from the +$470 million seen on September 4.
The contrast highlights a notable change in the distribution of Bitcoin’s recent open-interest expansion across exchanges.
While the latest Gate.io reading turned sharply positive, the previously elevated 7-day changes on Binance and Bybit have moderated significantly.
Importantly, open interest does not by itself reveal whether the newly opened positions are predominantly long or short.
The data therefore points to a divergence across exchanges in the balance between net position opening and position closure.
Where open interest is contracting, the reduction in outstanding positions can help ease excessive leverage and, if accompanied by softer perpetual-market imbalances, may also contribute to lower funding rates, without necessarily implying a directional signal for Bitcoin.
Written by Amr Taha
That represents a $471 million swing in just three days, moving the 7-day OI change from negative to strongly positive territory while Bitcoin traded near $79,200.
At the same time, the corresponding readings on Binance and Bybit eased substantially from their recent highs.
Binance’s 7-day open interest change stood at +$46 million on September 9, compared with +$926 million on August 25, a decline of roughly 95% from that peak reading.
Bybit recorded +$62 million, down around 87% from the +$470 million seen on September 4.
The contrast highlights a notable change in the distribution of Bitcoin’s recent open-interest expansion across exchanges.
While the latest Gate.io reading turned sharply positive, the previously elevated 7-day changes on Binance and Bybit have moderated significantly.
Importantly, open interest does not by itself reveal whether the newly opened positions are predominantly long or short.
The data therefore points to a divergence across exchanges in the balance between net position opening and position closure.
Where open interest is contracting, the reduction in outstanding positions can help ease excessive leverage and, if accompanied by softer perpetual-market imbalances, may also contribute to lower funding rates, without necessarily implying a directional signal for Bitcoin.
Written by Amr Taha
164
Log in to explore more content
Join global crypto users on Binance Square
⚡️ Get latest and useful information about crypto.
💬 Trusted by the world’s largest crypto exchange.
👍 Discover real insights from verified creators.
Email / Phone number
Trending Topics
USAugustPPIRisesLessThanExpected
8,939 views
270 Discussing
🚨 US AUG PPI: Rises LESS Than Expected! Bullish for Crypto? 🚀
PPI +0.4% MoM as expected, but CORE PPI only +0.2% vs +0.3% expected - cooling!
What it means:
• Wholesale inflation softer than feared
• Fed rate hike chance now 62% - but dovish signals coming
• Core PCE revisions expected downward - bullish
• BTC usually pumps on softer PPI
Fed meeting Sep 15-16 - Market now expects pause, not hike?
Is this the green light for Q4 rally?
#Bitcoin #PPI #Fed #CryptoNews #BTC#usaugustppiriseslessthanexpected
True News
·1 Likes
·1.1k views
SECApprovesNasdaqTexasCommodityTrustRule
7,757 views
275 Discussing
ECBRaisesRatesSecondTimeTo2.5%
4,799 views
198 Discussing