
Listerya
32 Posts

Listerya
Análisis de criptomonedas y trading con foco en gestión de riesgo e inteligencia: proteger capital, buscar oportunidades y operar con cabeza fría.
Open Trade

BTC Holder
Occasional Trader
5.3 Years
39 Following
20 Followers
7 Liked
Posts
Portfolio
📈 BITCOIN: ANOTHER PHASE OF THE BULL MARKET CYCLE?
Bitcoin has once again surpassed USD 80,000, and the move is beginning to resemble patterns seen in 2017 and 2021.
But there’s one important difference: history can rhyme without repeating itself exactly.
🔄 The pattern is back
After the previous halvings, BTC went through accumulation phases, breakouts, sharp corrections, and then acceleration.
Today we’re seeing something similar:
• recovery after a correction;
• resistance breakouts;
• higher volatility;
• Bitcoin leading versus many altcoins;
• a return of risk appetite.
🏦 This time Wall Street is involved
Between August 17 and August 25, Bitcoin spot ETFs accumulated approximately USD 2.57 billion in net inflows over seven consecutive sessions.
That marks an important difference from 2017.
Today, ETFs, institutional funds, large managers, and companies with direct exposure to BTC all participate.
💰 Bitcoin is also a macro asset
Its price increasingly responds to:
• global liquidity;
• interest rates;
• the U.S. dollar;
• public debt;
• Fed monetary policy.
⚠️ But this cycle isn’t identical
The halving took place in April 2024, and we’re in August 2026.
That means this cycle has already lasted longer than the classic 12–18 month pattern after the halving.
One possibility is that increased institutional participation is changing the cycle’s duration and volatility.
So the right question isn’t:
“Will 2017 or 2021 repeat?”
But:
“Are we living through a longer, more institutional version of the bull cycle?”
📌 History rhymes, but it doesn’t repeat the same way.
Information before speculation.
Risk management and intelligence.
#bitcoin
#BTC #BitcoinCycle #CryptoMarket
Bitcoin has once again surpassed USD 80,000, and the move is beginning to resemble patterns seen in 2017 and 2021.
But there’s one important difference: history can rhyme without repeating itself exactly.
🔄 The pattern is back
After the previous halvings, BTC went through accumulation phases, breakouts, sharp corrections, and then acceleration.
Today we’re seeing something similar:
• recovery after a correction;
• resistance breakouts;
• higher volatility;
• Bitcoin leading versus many altcoins;
• a return of risk appetite.
🏦 This time Wall Street is involved
Between August 17 and August 25, Bitcoin spot ETFs accumulated approximately USD 2.57 billion in net inflows over seven consecutive sessions.
That marks an important difference from 2017.
Today, ETFs, institutional funds, large managers, and companies with direct exposure to BTC all participate.
💰 Bitcoin is also a macro asset
Its price increasingly responds to:
• global liquidity;
• interest rates;
• the U.S. dollar;
• public debt;
• Fed monetary policy.
⚠️ But this cycle isn’t identical
The halving took place in April 2024, and we’re in August 2026.
That means this cycle has already lasted longer than the classic 12–18 month pattern after the halving.
One possibility is that increased institutional participation is changing the cycle’s duration and volatility.
So the right question isn’t:
“Will 2017 or 2021 repeat?”
But:
“Are we living through a longer, more institutional version of the bull cycle?”
📌 History rhymes, but it doesn’t repeat the same way.
Information before speculation.
Risk management and intelligence.
#bitcoin
#BTC #BitcoinCycle #CryptoMarket

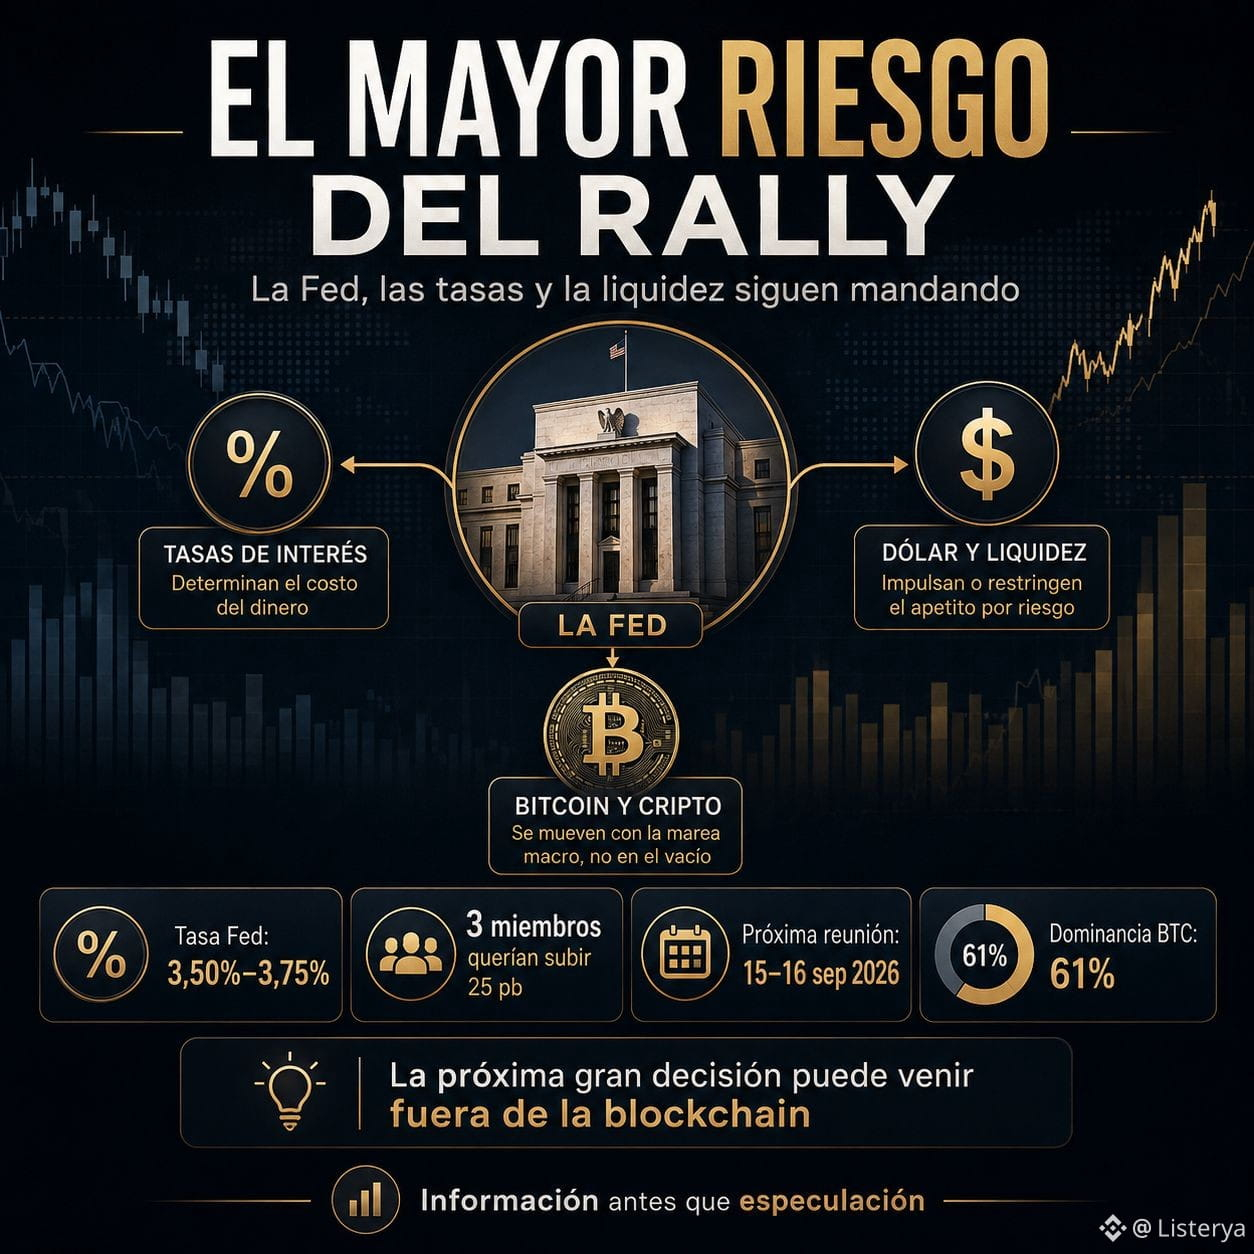
⚠️ THE BIGGEST RISK FOR CRYPTO TRADING IS NOT IN THE BLOCKCHAIN
Bitcoin, Ethereum, XRP, and Solana had an extraordinary week.
But the next major decision may come from a completely different place:
🏦 the U.S. Federal Reserve.
The Fed currently keeps its rate between 3.50% and 3.75%. However, something important happened at the July meeting:
3 FOMC members wanted to Hike rates by another 25 basis points.
The Fed itself continues to say that inflation remains above its 2% target.
Why does this matter for cryptocurrencies?
Higher rates → more expensive money → less liquidity → higher pressure on risk assets.
Stable or later declining rates → better conditions for BTC and altcoins.
Meanwhile, Bitcoin still controls about 61% of the total market cap of the crypto market, according to Coinbase.
That means that even though XRP rose by about 48%, ETH by around 29%, and SOL by roughly 24% over the week, Bitcoin remains the gravitational center of the market.
📅 Next Fed meeting: September 15–16, 2026.
That event could be far more important for the next stretch of BTC than any social-media narrative.
📌 Watch this: inflation + rates + ETF flows.
When those three variables point in the same direction, the market usually gives much more reliable signals.
Risk management and intelligence.
Bitcoin, Ethereum, XRP, and Solana had an extraordinary week.
But the next major decision may come from a completely different place:
🏦 the U.S. Federal Reserve.
The Fed currently keeps its rate between 3.50% and 3.75%. However, something important happened at the July meeting:
3 FOMC members wanted to Hike rates by another 25 basis points.
The Fed itself continues to say that inflation remains above its 2% target.
Why does this matter for cryptocurrencies?
Higher rates → more expensive money → less liquidity → higher pressure on risk assets.
Stable or later declining rates → better conditions for BTC and altcoins.
Meanwhile, Bitcoin still controls about 61% of the total market cap of the crypto market, according to Coinbase.
That means that even though XRP rose by about 48%, ETH by around 29%, and SOL by roughly 24% over the week, Bitcoin remains the gravitational center of the market.
📅 Next Fed meeting: September 15–16, 2026.
That event could be far more important for the next stretch of BTC than any social-media narrative.
📌 Watch this: inflation + rates + ETF flows.
When those three variables point in the same direction, the market usually gives much more reliable signals.
Risk management and intelligence.
📉 S&P 500 WIN STREAK OVER: IS CAPITAL ROTATING TOWARD CRYPTO?
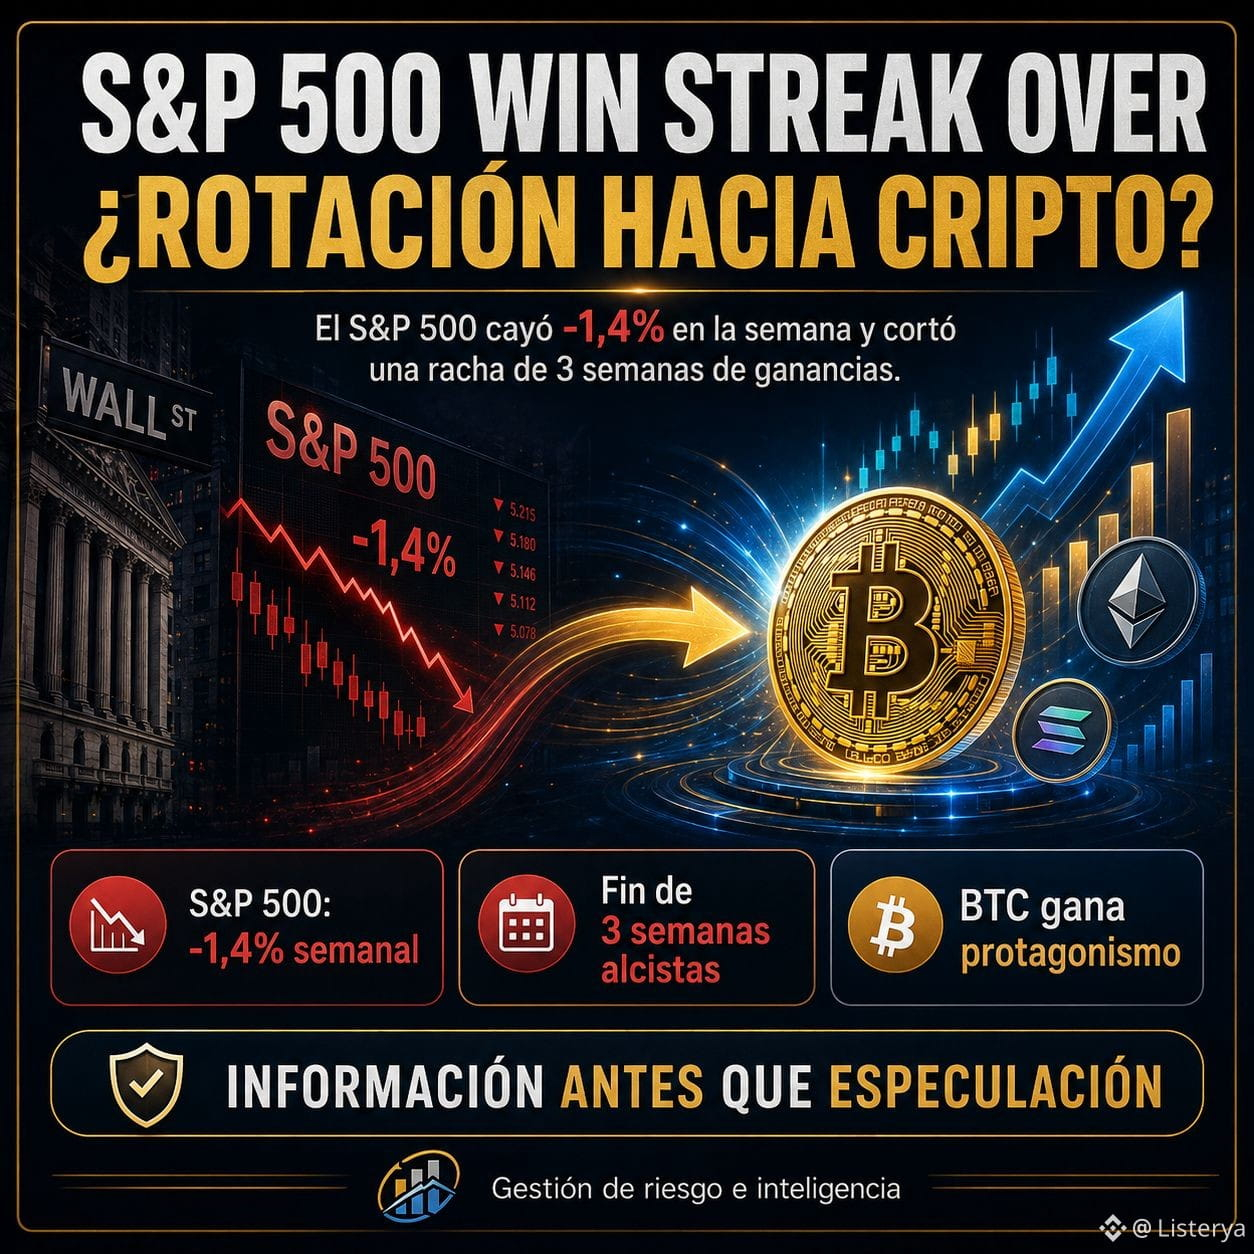
The S&P 500 ended the week with a 1.4% drop, putting an end to three straight weeks of gains. The Nasdaq fell even more: -2.1%, while the Dow lost approximately 0.9%.
However, an interesting divergence appeared on Friday.
While Wall Street tried to regain ground, Bitcoin moved toward USD 79,000, posting one of its best weeks in more than two years. At the same time, stocks tied to the crypto ecosystem reacted strongly: Coinbase +8.2%, Strategy +6.1%, and Robinhood +12.9% during Friday’s session.
What could be happening?
🔸 The S&P 500 is just 1.6% below its all-time high, so we are not yet seeing a structural bearish breakdown. In addition, it is still up about +12.1% in 2026.
🔸 Bitcoin, meanwhile, received support from ETF inflows, favorable regulatory expectations, and changes in U.S. liquidity conditions.
This opens up an interesting possibility:
some of the speculative capital may be looking for higher returns outside large U.S. stocks and temporarily entering BTC and crypto assets.
⚠️ But I still wouldn’t call it a confirmed rotation.
To do that, we need to see several weeks of BTC outperforming the S&P 500 + sustained institutional inflows + relative weakening of tech stocks.
📌 The signal is there. Confirmation is still missing.
Information before speculation. Risk management and intelligence.
#bitcoin #CryptoRotations #BTC #CryptoMarket #sp500endsweeklywinstreak
The S&P 500 ended the week with a 1.4% drop, putting an end to three straight weeks of gains. The Nasdaq fell even more: -2.1%, while the Dow lost approximately 0.9%.
However, an interesting divergence appeared on Friday.
While Wall Street tried to regain ground, Bitcoin moved toward USD 79,000, posting one of its best weeks in more than two years. At the same time, stocks tied to the crypto ecosystem reacted strongly: Coinbase +8.2%, Strategy +6.1%, and Robinhood +12.9% during Friday’s session.
What could be happening?
🔸 The S&P 500 is just 1.6% below its all-time high, so we are not yet seeing a structural bearish breakdown. In addition, it is still up about +12.1% in 2026.
🔸 Bitcoin, meanwhile, received support from ETF inflows, favorable regulatory expectations, and changes in U.S. liquidity conditions.
This opens up an interesting possibility:
some of the speculative capital may be looking for higher returns outside large U.S. stocks and temporarily entering BTC and crypto assets.
⚠️ But I still wouldn’t call it a confirmed rotation.
To do that, we need to see several weeks of BTC outperforming the S&P 500 + sustained institutional inflows + relative weakening of tech stocks.
📌 The signal is there. Confirmation is still missing.
Information before speculation. Risk management and intelligence.
#bitcoin #CryptoRotations #BTC #CryptoMarket #sp500endsweeklywinstreak
🏦 WALL STREET BACKS CRYPTO: USD 2,600 MILLION IN ONE WEEK
There’s a piece of data behind the latest rally that deserves far more attention than any green candle:
US spot Bitcoin and Ethereum ETFs received a combined net total of about USD 2.6 billion over the last week.
It was the best combined week since October 2025.
The numbers:
₿ Bitcoin ETF:
➡️ USD 1.9 billion in net inflows.
Ξ Ethereum ETF:
➡️ USD 697.2 million.
In addition, the combined trading volume of these ETFs exceeded roughly USD 29 billion—more than three times that of the previous week.
Bitcoin saw inflows of USD 517.2 million on Wednesday and another USD 606.3 million on Thursday. Only BlackRock IBIT received approximately USD 503 million that Thursday.
Why does it matter?
Because it partially distinguishes this move from a rally driven only by leveraged traders.
Institutional spot capital is entering the market.
But there’s a fact that prevents falling into hype: despite the recent rebound, BTC ETFs still have accumulated approximately USD 2.9 billion in net outflows in 2026, and ETH ETFs about USD 192 million.
📌 The positive signal is real.
The confirmation will be whether these inflows continue over the coming weeks.
Risk management and intelligence.
There’s a piece of data behind the latest rally that deserves far more attention than any green candle:
US spot Bitcoin and Ethereum ETFs received a combined net total of about USD 2.6 billion over the last week.
It was the best combined week since October 2025.
The numbers:
₿ Bitcoin ETF:
➡️ USD 1.9 billion in net inflows.
Ξ Ethereum ETF:
➡️ USD 697.2 million.
In addition, the combined trading volume of these ETFs exceeded roughly USD 29 billion—more than three times that of the previous week.
Bitcoin saw inflows of USD 517.2 million on Wednesday and another USD 606.3 million on Thursday. Only BlackRock IBIT received approximately USD 503 million that Thursday.
Why does it matter?
Because it partially distinguishes this move from a rally driven only by leveraged traders.
Institutional spot capital is entering the market.
But there’s a fact that prevents falling into hype: despite the recent rebound, BTC ETFs still have accumulated approximately USD 2.9 billion in net outflows in 2026, and ETH ETFs about USD 192 million.
📌 The positive signal is real.
The confirmation will be whether these inflows continue over the coming weeks.
Risk management and intelligence.

📊 CRYPTO TODAY: THE RALLY COOLS OFF, BUT THE WEEKLY CHANGE IS HUGE
Update — 23/08/2026
After one of the strongest weeks of the year, the crypto market starts to catch its breath.
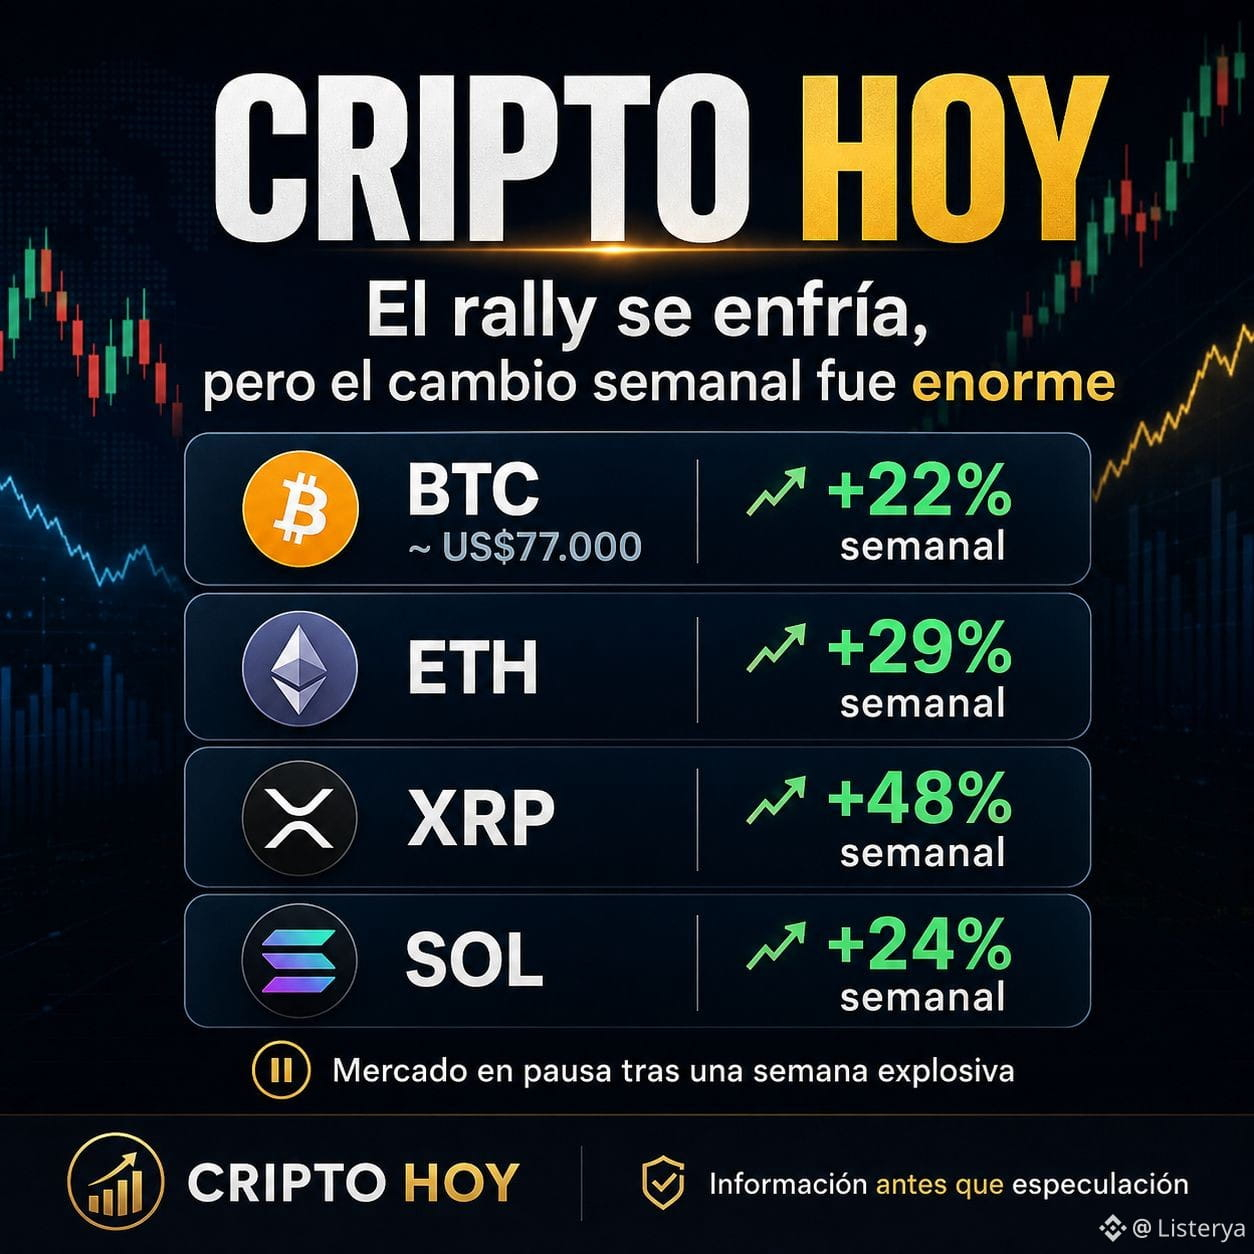
🔸 Bitcoin: around USD 77,000. Coinbase shows roughly +22% weekly, even though BTC is down about 1–2% over the last 24 hours.
🔹 Ethereum: holds a weekly gain close to +29%, but it also began correcting after the strong push toward USD 2,500.
🟣 XRP: was one of the big standouts: approximately +48% weekly, although it dropped about 3% during the last recorded day.
🟢 Solana: around USD 94–96 and up about +24% over seven days.
What does this tell us?
The rally was no longer concentrated only in Bitcoin. Capital spread to ETH, XRP, SOL, and other altcoins.
But after gains of 20%, 30%, or even 40–50% in just a few days, the risk of pullbacks increases.
📌 My take: the weekly structure improved clearly, but this is not the time to chase green candles. What matters now is checking which assets manage to turn the recovered zones into new supports.
Information first, not speculation. Risk management and intelligence.
Sources: Coinbase and The Block.
Update — 23/08/2026
After one of the strongest weeks of the year, the crypto market starts to catch its breath.
🔸 Bitcoin: around USD 77,000. Coinbase shows roughly +22% weekly, even though BTC is down about 1–2% over the last 24 hours.
🔹 Ethereum: holds a weekly gain close to +29%, but it also began correcting after the strong push toward USD 2,500.
🟣 XRP: was one of the big standouts: approximately +48% weekly, although it dropped about 3% during the last recorded day.
🟢 Solana: around USD 94–96 and up about +24% over seven days.
What does this tell us?
The rally was no longer concentrated only in Bitcoin. Capital spread to ETH, XRP, SOL, and other altcoins.
But after gains of 20%, 30%, or even 40–50% in just a few days, the risk of pullbacks increases.
📌 My take: the weekly structure improved clearly, but this is not the time to chase green candles. What matters now is checking which assets manage to turn the recovered zones into new supports.
Information first, not speculation. Risk management and intelligence.
Sources: Coinbase and The Block.
XRP 2026 (3/3): WHAT PRICE COULD IT HAVE BY YEAR-END?
With XRP around USD 1.47 after a weekly rise close to 47%, extrapolating the current rally would be risky.
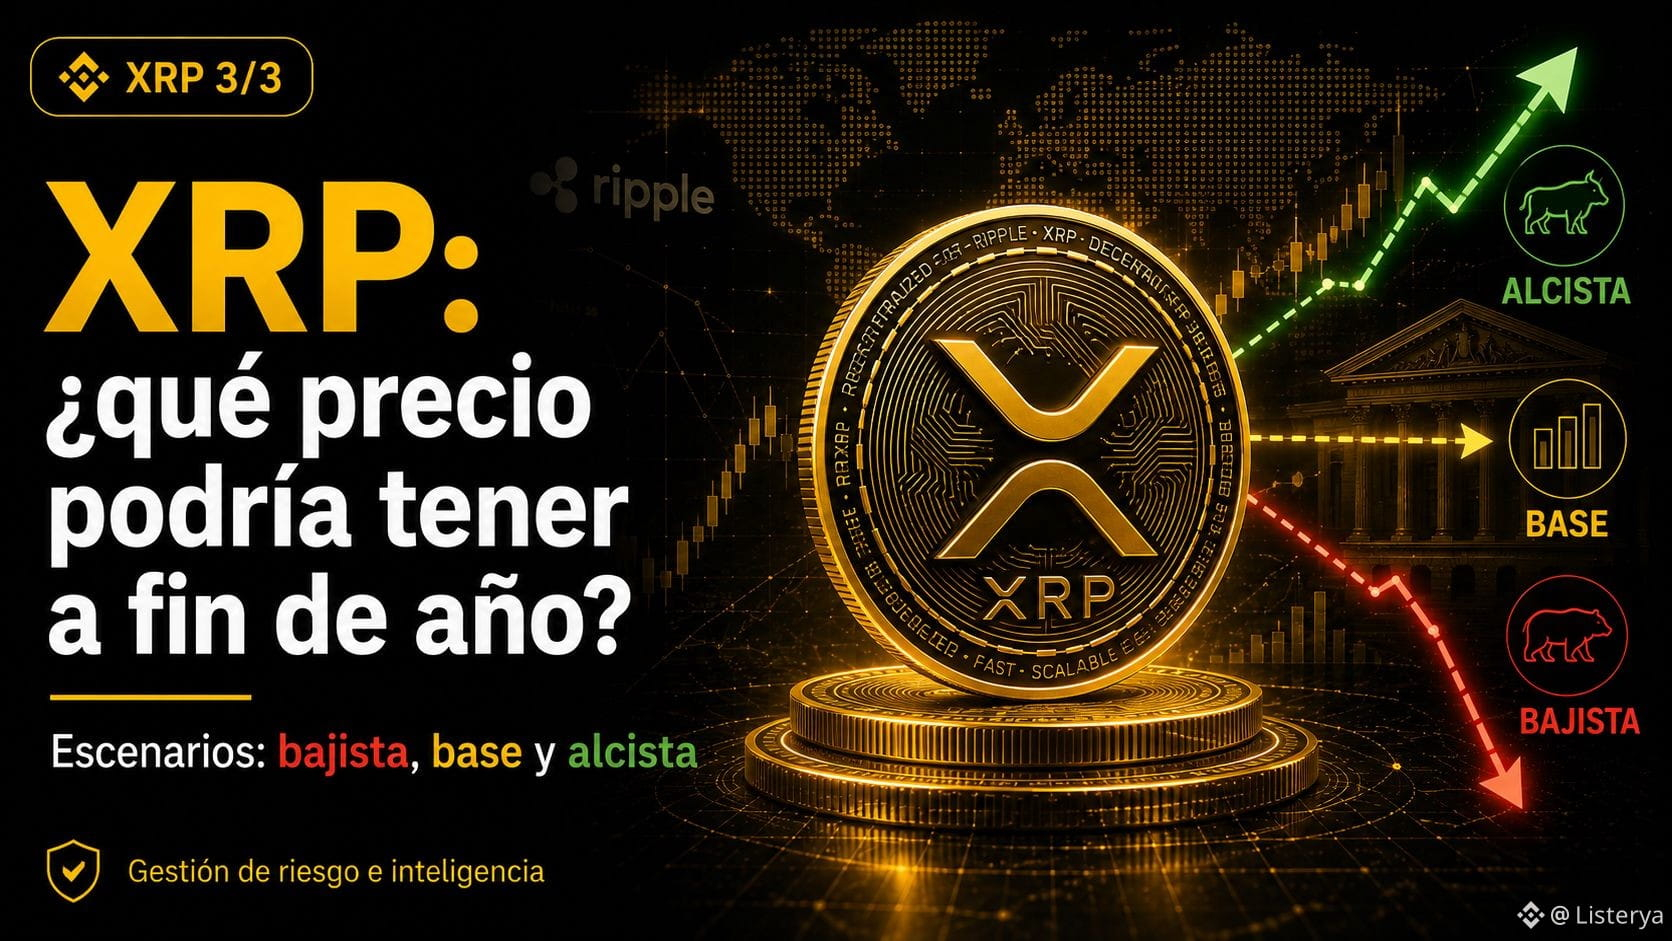
🔴 Bearish scenario: USD 0.95-1.20
It could appear if Bitcoin corrects strongly, the short squeeze disappears, or the specific demand for XRP does not match current expectations.
🟡 Base scenario: USD 1.65-2.10
I think it’s reasonable if XRP retains much of the breakout, continues increasing institutional access, and Ripple/XRPL keep expanding without major macro deterioration.
🟢 Bullish scenario: USD 2.50-3.20
It would require a much more demanding combination: strong Bitcoin, rotation of capital into altcoins, higher institutional flows, and evidence that XRPL growth and RLUSD generate real, effective demand for XRP.
There’s a critical point:
XRP is already pricing in a lot of regulatory improvement.
When a narrative becomes widely known, you need new data to justify higher prices.
That’s why I wouldn’t take USD 3 as an “inevitable target.”
To get there, we’d need a second phase of the rally backed by spot volume and adoption—not just leverage.
Central scenario for December 2026: USD 1.65-2.10.
Risk management and intelligence.
With XRP around USD 1.47 after a weekly rise close to 47%, extrapolating the current rally would be risky.
🔴 Bearish scenario: USD 0.95-1.20
It could appear if Bitcoin corrects strongly, the short squeeze disappears, or the specific demand for XRP does not match current expectations.
🟡 Base scenario: USD 1.65-2.10
I think it’s reasonable if XRP retains much of the breakout, continues increasing institutional access, and Ripple/XRPL keep expanding without major macro deterioration.
🟢 Bullish scenario: USD 2.50-3.20
It would require a much more demanding combination: strong Bitcoin, rotation of capital into altcoins, higher institutional flows, and evidence that XRPL growth and RLUSD generate real, effective demand for XRP.
There’s a critical point:
XRP is already pricing in a lot of regulatory improvement.
When a narrative becomes widely known, you need new data to justify higher prices.
That’s why I wouldn’t take USD 3 as an “inevitable target.”
To get there, we’d need a second phase of the rally backed by spot volume and adoption—not just leverage.
Central scenario for December 2026: USD 1.65-2.10.
Risk management and intelligence.
Verified
XRP 2026 (2/3): RIPPLE GROWS, BUT DOES THAT MEAN XRP HAS TO RISE?
Ripple is going through a strong institutional expansion.
In July, it announced that it had received CASP authorization under MiCA in Europe. RLUSD also advanced internationally and, in early August, had roughly USD 1.590 billion in circulation, backed by more than USD 1.700 billion in reserves.
Ripple is also expanding infrastructure for tokenization, payments, and capital markets. In August, it announced investments in ZILO and Licuido, while Ripple Prime closed a USD 275 million debt offering to strengthen its institutional expansion.
This reinforces the ecosystem around Ripple and the XRP Ledger.
But there is a common misunderstanding:
Ripple’s success ≠ an automatic increase in the price of XRP.
RLUSD, for example, runs on the XRP Ledger, Ethereum, and other networks. An institution can use Ripple’s infrastructure without necessarily accumulating large amounts of XRP.
That’s why it’s not enough to count agreements.
We need to look at whether growth creates real token demand: liquidity, use of XRP as a bridge, XRPL activity, and institutional participation.
Regulation removed some of the legal discount.
Now XRP must prove that this advantage can translate into sustained economic usage.
Risk management and intelligence.
Ripple is going through a strong institutional expansion.
In July, it announced that it had received CASP authorization under MiCA in Europe. RLUSD also advanced internationally and, in early August, had roughly USD 1.590 billion in circulation, backed by more than USD 1.700 billion in reserves.
Ripple is also expanding infrastructure for tokenization, payments, and capital markets. In August, it announced investments in ZILO and Licuido, while Ripple Prime closed a USD 275 million debt offering to strengthen its institutional expansion.
This reinforces the ecosystem around Ripple and the XRP Ledger.
But there is a common misunderstanding:
Ripple’s success ≠ an automatic increase in the price of XRP.
RLUSD, for example, runs on the XRP Ledger, Ethereum, and other networks. An institution can use Ripple’s infrastructure without necessarily accumulating large amounts of XRP.
That’s why it’s not enough to count agreements.
We need to look at whether growth creates real token demand: liquidity, use of XRP as a bridge, XRPL activity, and institutional participation.
Regulation removed some of the legal discount.
Now XRP must prove that this advantage can translate into sustained economic usage.
Risk management and intelligence.

Verified
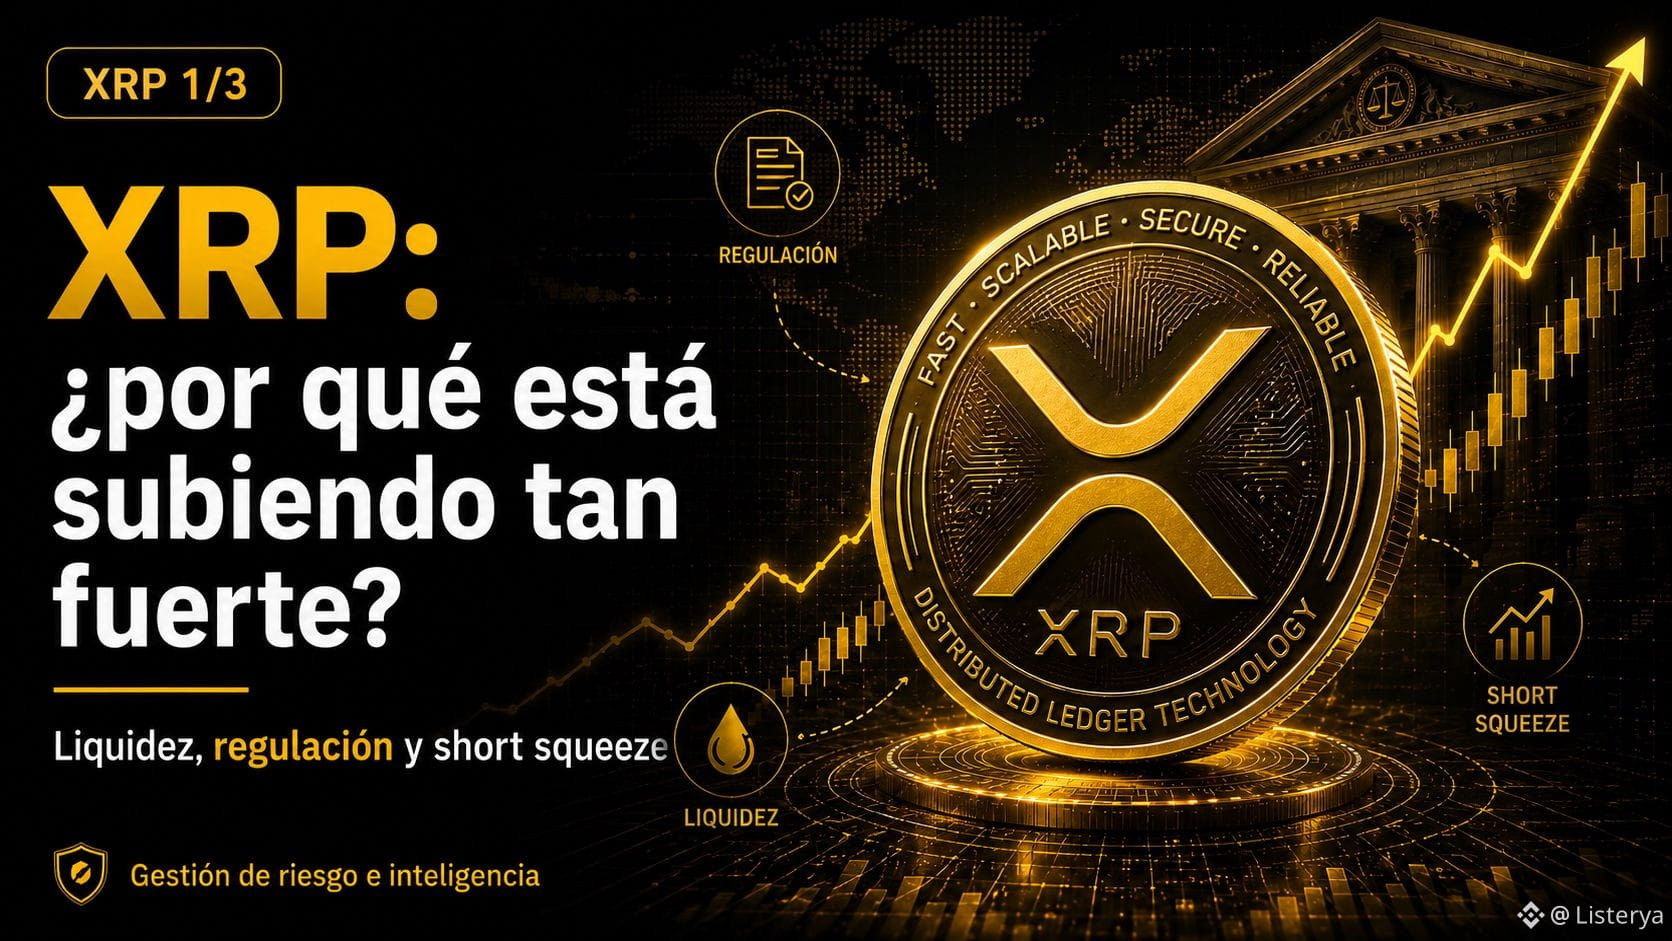
XRP 2026 (1/3): WHY IS IT RISING SO STRONGLY?
XRP is driving one of the most aggressive moves among the major cryptocurrencies.
At the time of this reading, Coinbase was showing approximately USD 1.47 per XRP, with around +47% over seven days and +16% in 24 hours. Trading volume had also increased by more than 40%.
Part of the move comes from the same momentum that favored Bitcoin and Ethereum: liquidity, U.S. dollar weakness, and the liquidation of short positions.
But XRP has an additional catalyst: a sharp reduction in its regulatory risk.
The lawsuit between Ripple and the SEC ended in 2025 with the withdrawal of the appeals, leaving the prior ruling in place. Programmatic sales of XRP on secondary markets were not considered securities offerings in that process.
In addition, institutional access to XRP was expanded through various listed products and funds tied to the asset.
That helps explain why XRP is reacting so strongly.
But a +47% weekly gain is also a warning.
The more vertical the move, the higher the risk of profit-taking and liquidation in the opposite direction.
After a rally like this, I prefer to look for consolidation rather than chase the price.
Risk management and intelligence.
XRP is driving one of the most aggressive moves among the major cryptocurrencies.
At the time of this reading, Coinbase was showing approximately USD 1.47 per XRP, with around +47% over seven days and +16% in 24 hours. Trading volume had also increased by more than 40%.
Part of the move comes from the same momentum that favored Bitcoin and Ethereum: liquidity, U.S. dollar weakness, and the liquidation of short positions.
But XRP has an additional catalyst: a sharp reduction in its regulatory risk.
The lawsuit between Ripple and the SEC ended in 2025 with the withdrawal of the appeals, leaving the prior ruling in place. Programmatic sales of XRP on secondary markets were not considered securities offerings in that process.
In addition, institutional access to XRP was expanded through various listed products and funds tied to the asset.
That helps explain why XRP is reacting so strongly.
But a +47% weekly gain is also a warning.
The more vertical the move, the higher the risk of profit-taking and liquidation in the opposite direction.
After a rally like this, I prefer to look for consolidation rather than chase the price.
Risk management and intelligence.
ETHEREUM 2026 (3/3): HOW FAR COULD IT GO?
With ETH around USD 2,500, I prefer to work with scenarios rather than a magic number.
🔴 Bear case: USD 1,700-2,100
It could happen if inflation accelerates again, the Fed tightens its policy, funds leave the ETFs, or Bitcoin loses the current rebound.
🟡 Base case: USD 2,800-3,400
This is my most reasonable zone if the ETFs maintain inflows, staking keeps reducing liquid supply, and the U.S. avoids a new, strong monetary tightening.
🟢 Bull case: USD 4,000-4,700
I would need a clear expansion of liquidity, strong Bitcoin, higher on-chain activity, sustained institutional inflows, and a breakout above the upper weekly resistances.
The main warning is the speed of the current rally. After advances close to 30% per week, buying only because “it’s going up” worsens the risk/reward ratio.
For me, the key piece of information won’t just be reaching USD 3,000, but checking whether ETH can turn old resistances into support.
Central scenario December 2026: USD 2,800-3,400.
This is not a prediction; it’s an estimate that must be updated with inflation, the Fed, ETFs, and network activity.
Risk management and intelligence.
With ETH around USD 2,500, I prefer to work with scenarios rather than a magic number.
🔴 Bear case: USD 1,700-2,100
It could happen if inflation accelerates again, the Fed tightens its policy, funds leave the ETFs, or Bitcoin loses the current rebound.
🟡 Base case: USD 2,800-3,400
This is my most reasonable zone if the ETFs maintain inflows, staking keeps reducing liquid supply, and the U.S. avoids a new, strong monetary tightening.
🟢 Bull case: USD 4,000-4,700
I would need a clear expansion of liquidity, strong Bitcoin, higher on-chain activity, sustained institutional inflows, and a breakout above the upper weekly resistances.
The main warning is the speed of the current rally. After advances close to 30% per week, buying only because “it’s going up” worsens the risk/reward ratio.
For me, the key piece of information won’t just be reaching USD 3,000, but checking whether ETH can turn old resistances into support.
Central scenario December 2026: USD 2,800-3,400.
This is not a prediction; it’s an estimate that must be updated with inflation, the Fed, ETFs, and network activity.
Risk management and intelligence.

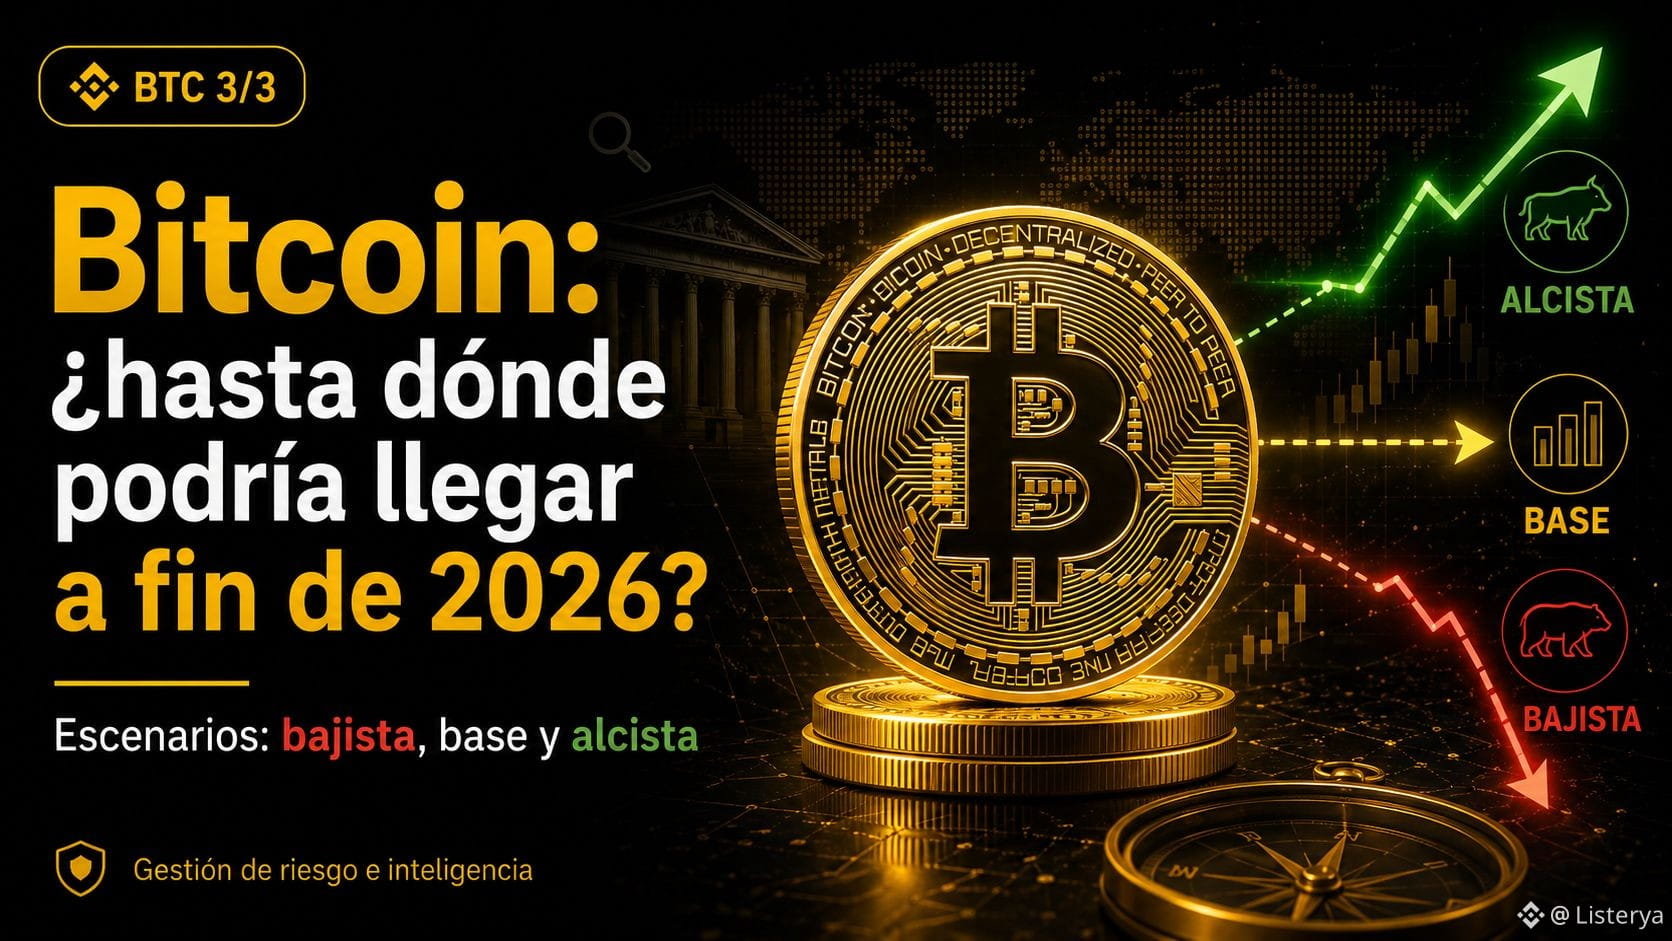
Bitcoin 2026 (3/3): How far could BTC go by year-end?
Trying to predict an exact Bitcoin price would be unserious.
What’s most useful is to work with scenarios and probabilities.
🔴 Bear case: USD 55,000–65,000
It could happen if inflation rises again, the Federal Reserve tightens its monetary policy, bond yields increase, or there are strong outflows from the ETFs.
In that scenario, BTC would likely suffer again due to restrictive financial conditions.
🟡 Base case: USD 85,000–95,000
Right now, I consider this range much more reasonable if inflation continues to cool, the Fed avoids further aggressive hikes, and the ETFs maintain positive inflows.
My central reference would be around USD 90,000 by the end of 2026.
🟢 Bull case: USD 105,000–120,000
To clearly move back above USD 100,000, we would probably need a stronger mix:
• strong institutional buying;
• liquidity expansion;
• lower bond yields;
• favorable regulation;
• a weaker dollar;
• a technical breakout accompanied by volume.
The most important variable won’t simply be that BTC breaks above a resistance.
It will be who is buying that breakout.
If the move is supported by the spot market and ETFs, it will matter far more than a rise dominated by derivatives and leverage.
For now, my base scenario remains around USD 85,000–95,000.
We shouldn’t fall in love with the target.
We must update it when the data changes.
Risk management and intelligence.
Trying to predict an exact Bitcoin price would be unserious.
What’s most useful is to work with scenarios and probabilities.
🔴 Bear case: USD 55,000–65,000
It could happen if inflation rises again, the Federal Reserve tightens its monetary policy, bond yields increase, or there are strong outflows from the ETFs.
In that scenario, BTC would likely suffer again due to restrictive financial conditions.
🟡 Base case: USD 85,000–95,000
Right now, I consider this range much more reasonable if inflation continues to cool, the Fed avoids further aggressive hikes, and the ETFs maintain positive inflows.
My central reference would be around USD 90,000 by the end of 2026.
🟢 Bull case: USD 105,000–120,000
To clearly move back above USD 100,000, we would probably need a stronger mix:
• strong institutional buying;
• liquidity expansion;
• lower bond yields;
• favorable regulation;
• a weaker dollar;
• a technical breakout accompanied by volume.
The most important variable won’t simply be that BTC breaks above a resistance.
It will be who is buying that breakout.
If the move is supported by the spot market and ETFs, it will matter far more than a rise dominated by derivatives and leverage.
For now, my base scenario remains around USD 85,000–95,000.
We shouldn’t fall in love with the target.
We must update it when the data changes.
Risk management and intelligence.
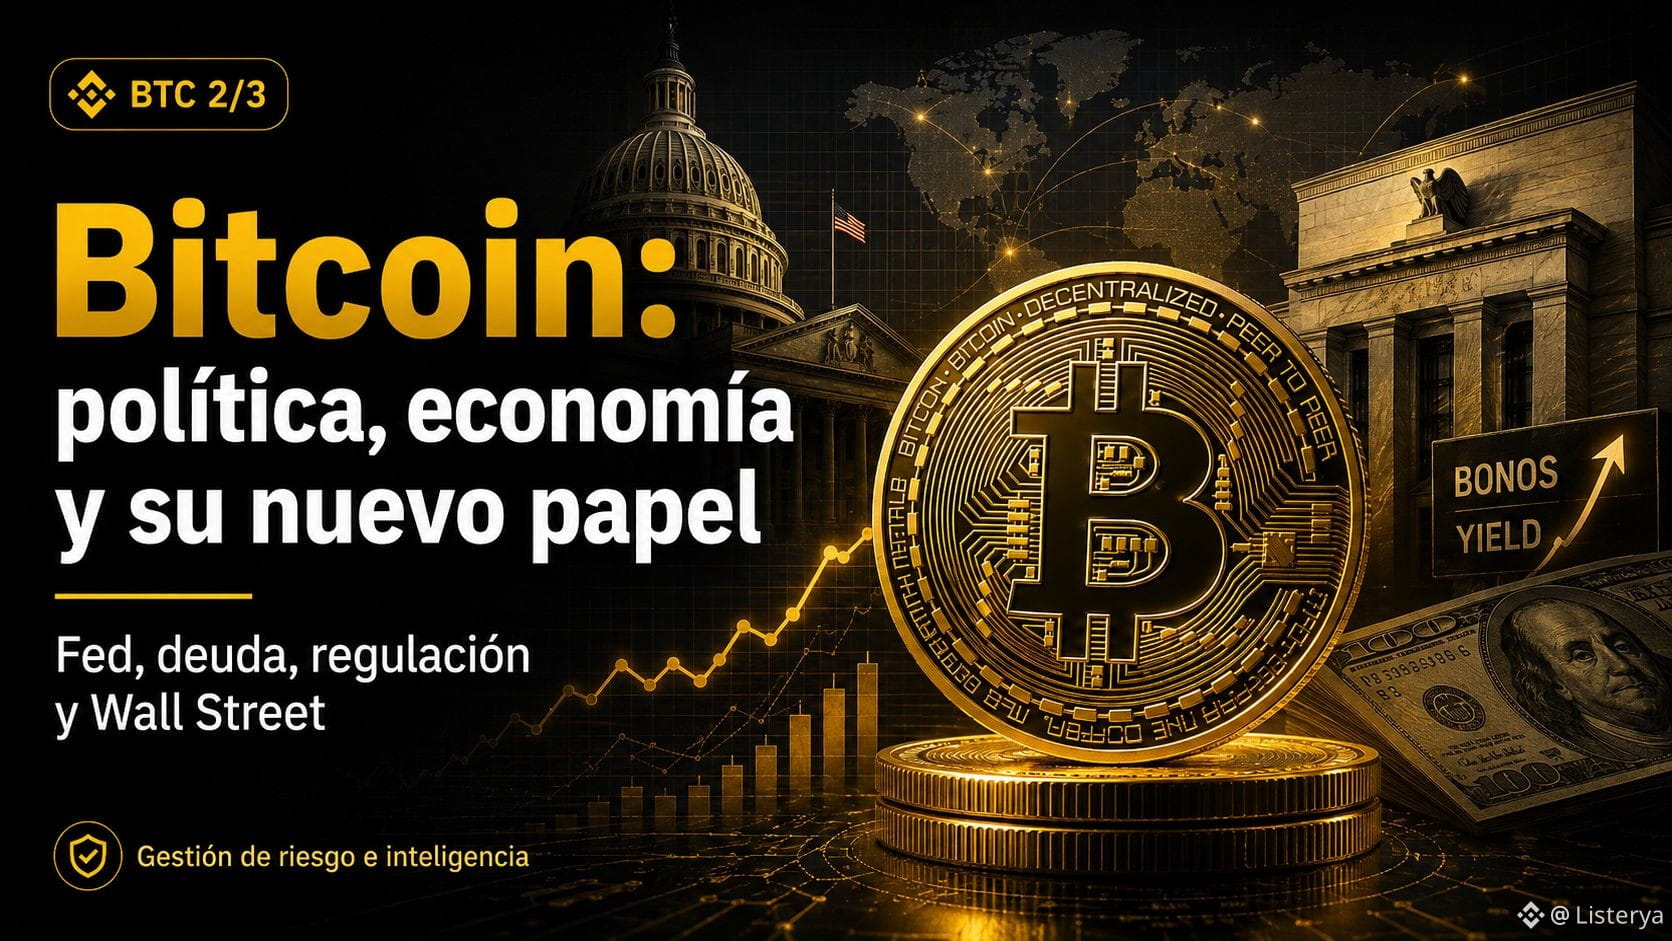
Bitcoin 2026 (2/3): politics, economics, and the new role of BTC
Bitcoin can no longer be analyzed by looking at a chart alone.
Today, its price is deeply tied to Washington, the Federal Reserve, Wall Street, and global liquidity.
In the United States, the debate over clearer regulation for digital assets continues to move forward. For Bitcoin, this can be extremely relevant.
Not because it changes its technology, but because more defined regulation reduces one of the main obstacles for large banks, funds, and institutional investors: legal uncertainty.
But there is another factor that is even more important: the economy.
Bitcoin often benefits when:
• real rates fall;
• the dollar loses strength;
• liquidity increases;
• investors seek alternative assets;
• concern about debt and deficits grows.
The United States has enormous public debt, and this situation strengthens the narrative of Bitcoin as a limited monetary asset.
However, there is a contradiction.
High debt can also lead to higher bond yields and more restrictive financial conditions.
That’s why the idea that “more debt automatically means higher Bitcoin” is too simplistic.
BTC still depends heavily on the Federal Reserve.
If inflation accelerates again and the Fed keeps rates high, Bitcoin could face difficulties.
If the opposite happens—inflation falling, more favorable monetary conditions, and institutional inflows—the picture changes considerably.
That’s why today we need to look at BTC together with inflation, rates, the dollar, bonds, and ETF flows.
Bitcoin is still crypto.
But every year it also looks more and more like a global macroeconomic asset.
Risk management and intelligence.
Bitcoin can no longer be analyzed by looking at a chart alone.
Today, its price is deeply tied to Washington, the Federal Reserve, Wall Street, and global liquidity.
In the United States, the debate over clearer regulation for digital assets continues to move forward. For Bitcoin, this can be extremely relevant.
Not because it changes its technology, but because more defined regulation reduces one of the main obstacles for large banks, funds, and institutional investors: legal uncertainty.
But there is another factor that is even more important: the economy.
Bitcoin often benefits when:
• real rates fall;
• the dollar loses strength;
• liquidity increases;
• investors seek alternative assets;
• concern about debt and deficits grows.
The United States has enormous public debt, and this situation strengthens the narrative of Bitcoin as a limited monetary asset.
However, there is a contradiction.
High debt can also lead to higher bond yields and more restrictive financial conditions.
That’s why the idea that “more debt automatically means higher Bitcoin” is too simplistic.
BTC still depends heavily on the Federal Reserve.
If inflation accelerates again and the Fed keeps rates high, Bitcoin could face difficulties.
If the opposite happens—inflation falling, more favorable monetary conditions, and institutional inflows—the picture changes considerably.
That’s why today we need to look at BTC together with inflation, rates, the dollar, bonds, and ETF flows.
Bitcoin is still crypto.
But every year it also looks more and more like a global macroeconomic asset.
Risk management and intelligence.
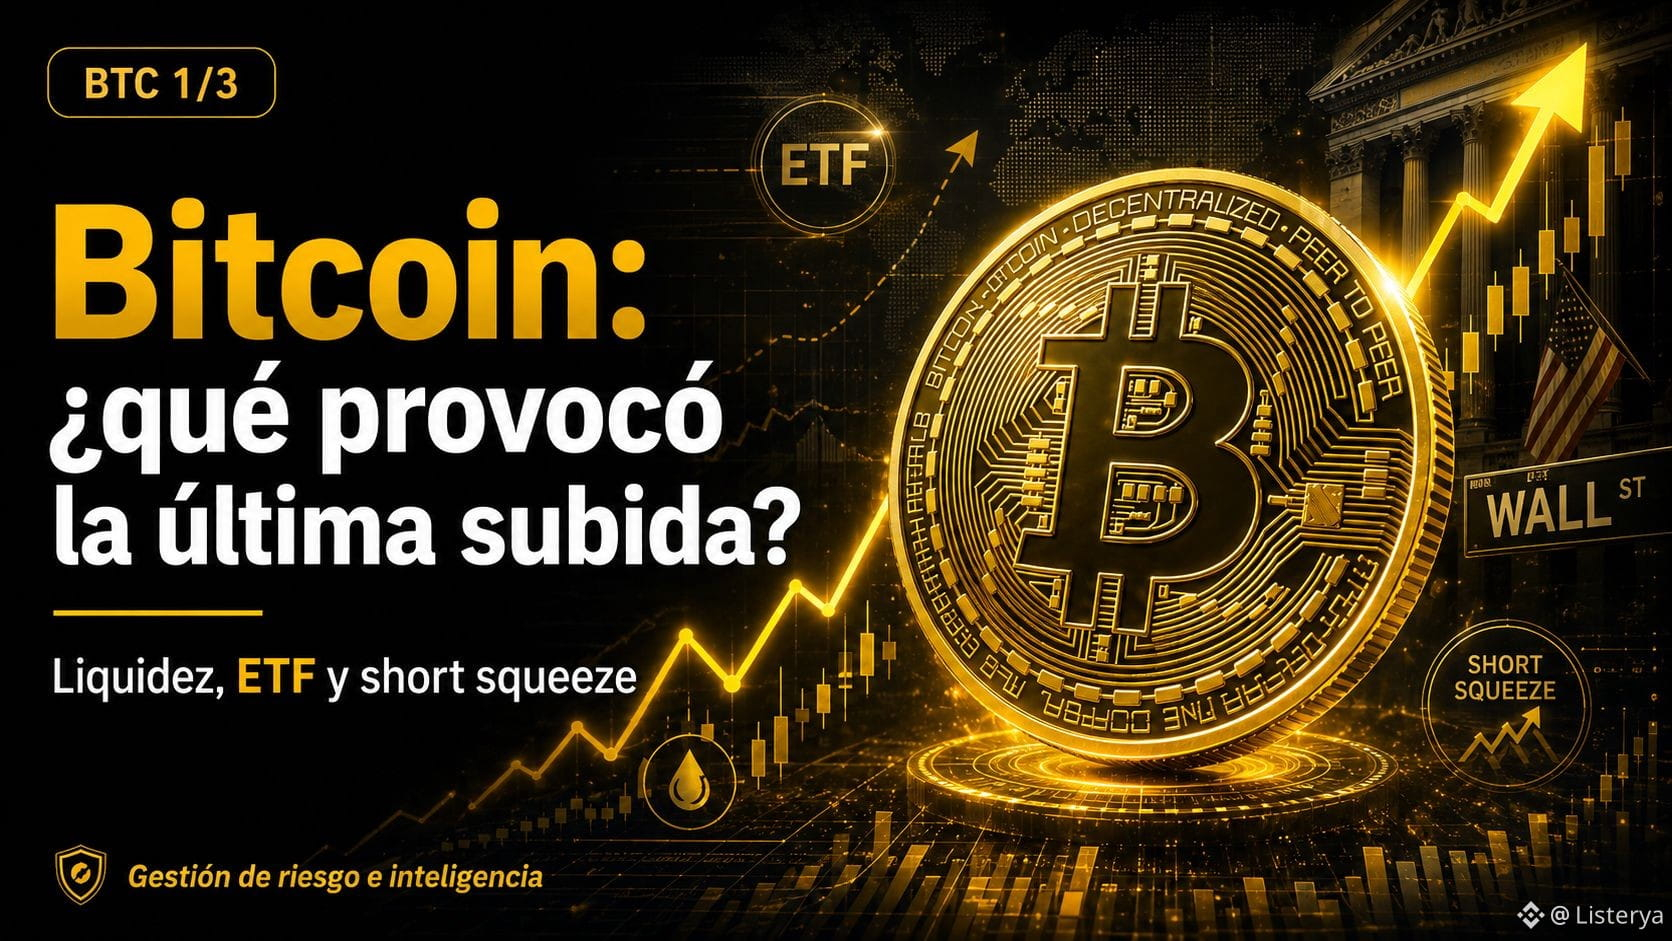
Bitcoin 2026 (1/3): What caused the last surge?
Bitcoin once again showed strength after several weeks of pressure. But behind the move there isn’t a single cause: liquidity, institutional buying, and the closing of bearish positions all came together.
One of the most important factors was an improvement in financial conditions in the United States. When bond yields fall or expectations of greater liquidity rise, scarce assets like Bitcoin tend to benefit.
On top of that, institutional money returned. Spot BTC ETFs continue to be a key piece because they help measure whether there is real demand from Wall Street. When significant capital inflows appear, the move has a different foundation than a simple speculative rally.
Another classic market phenomenon also took place: the short squeeze.
Many traders were holding positions betting on further declines. When BTC started breaking through resistance levels, those positions began to be automatically liquidated.
The sequence was simple:
BTC rises → short positions are liquidated → traders must buy back → BTC rises again.
This accelerated the move considerably.
The conclusion is important: the short squeeze likely amplified the surge, but it was not necessarily its origin.
The real signal we should watch now is whether Bitcoin can sustain the advance once those liquidations disappear.
If the price keeps rising alongside spot volume, ETF inflows, and improved liquidity conditions, then we’ll be looking at a much more structural recovery.
Risk management and intelligence.
Bitcoin once again showed strength after several weeks of pressure. But behind the move there isn’t a single cause: liquidity, institutional buying, and the closing of bearish positions all came together.
One of the most important factors was an improvement in financial conditions in the United States. When bond yields fall or expectations of greater liquidity rise, scarce assets like Bitcoin tend to benefit.
On top of that, institutional money returned. Spot BTC ETFs continue to be a key piece because they help measure whether there is real demand from Wall Street. When significant capital inflows appear, the move has a different foundation than a simple speculative rally.
Another classic market phenomenon also took place: the short squeeze.
Many traders were holding positions betting on further declines. When BTC started breaking through resistance levels, those positions began to be automatically liquidated.
The sequence was simple:
BTC rises → short positions are liquidated → traders must buy back → BTC rises again.
This accelerated the move considerably.
The conclusion is important: the short squeeze likely amplified the surge, but it was not necessarily its origin.
The real signal we should watch now is whether Bitcoin can sustain the advance once those liquidations disappear.
If the price keeps rising alongside spot volume, ETF inflows, and improved liquidity conditions, then we’ll be looking at a much more structural recovery.
Risk management and intelligence.
Cryptocurrency Market in December 2025: Weekly Movements and Benefited Cryptocurrencies
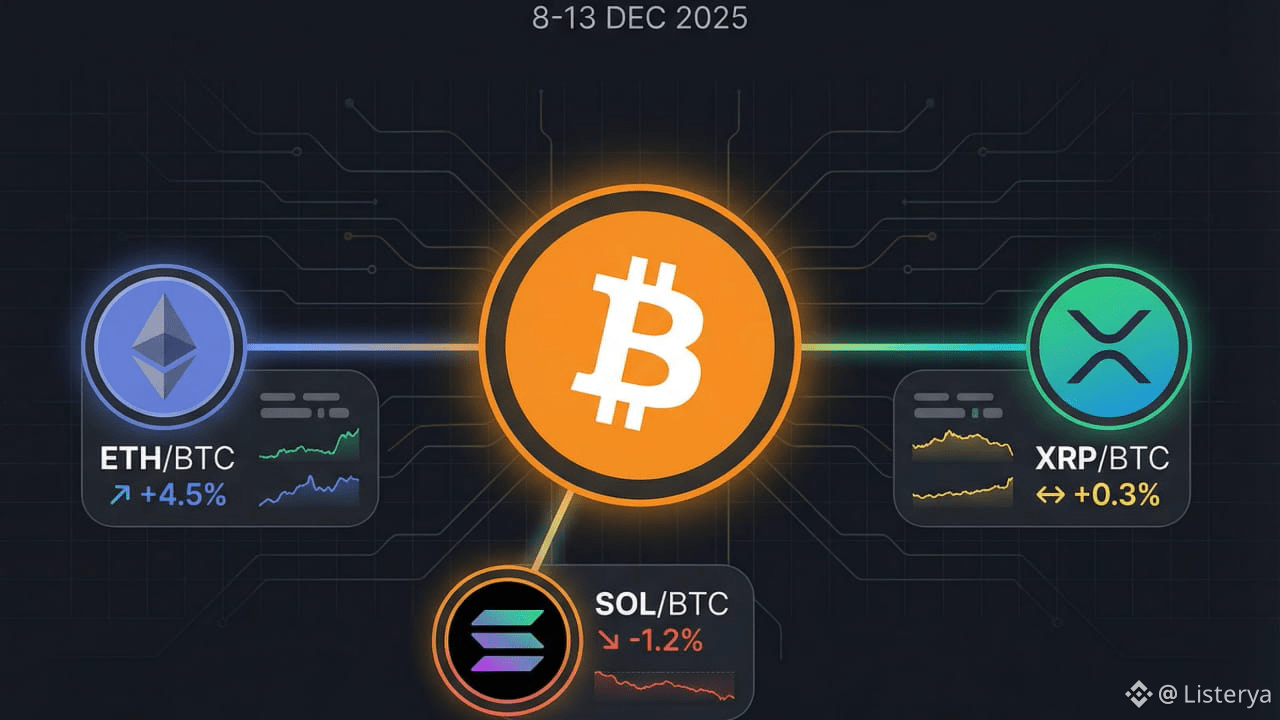
The cryptocurrency market in December 2025 has been characterized by high volatility, with a general downward trend in the first week and a half of the month. As of December 11 (current date), the global market has experienced declines, influenced by factors such as macroeconomic uncertainty, massive liquidations (over $494 million in 24 hours) and a "sell the news" following decisions by the Fed. The total market capitalization is around $3.08 trillion, with a 2.35% drop in 24 hours and weekly setbacks. Bitcoin (BTC) has fallen from highs of ~$126,000 in October to around $90,000–$93,000, with weekly losses of 2-3%. This has generated a sentiment of fear (Fear & Greed index at 29), but with signs of institutional recovery, such as progress in regulations and ETFs.
🤐Main Weekly Movements (First Week of December).... next Square...
$ETH
$XRP $BNB
The cryptocurrency market in December 2025 has been characterized by high volatility, with a general downward trend in the first week and a half of the month. As of December 11 (current date), the global market has experienced declines, influenced by factors such as macroeconomic uncertainty, massive liquidations (over $494 million in 24 hours) and a "sell the news" following decisions by the Fed. The total market capitalization is around $3.08 trillion, with a 2.35% drop in 24 hours and weekly setbacks. Bitcoin (BTC) has fallen from highs of ~$126,000 in October to around $90,000–$93,000, with weekly losses of 2-3%. This has generated a sentiment of fear (Fear & Greed index at 29), but with signs of institutional recovery, such as progress in regulations and ETFs.
🤐Main Weekly Movements (First Week of December).... next Square...
$ETH
$XRP $BNB
🌌 Exploring new frontiers in DeFi with @lagrangedev
Innovation doesn't stop and we continue to see how #Lagrange redefines scalability and interoperability on the blockchain. With $LA, the community has in its hands a tool to build a more efficient and decentralized financial future.
Are you already part of the revolution #lagrang ? 🚀
Innovation doesn't stop and we continue to see how #Lagrange redefines scalability and interoperability on the blockchain. With $LA, the community has in its hands a tool to build a more efficient and decentralized financial future.
Are you already part of the revolution #lagrang ? 🚀
🌌 Exploring new frontiers in DeFi with @lagrangedev
Innovation doesn't stop, and we continue to see how #Lagrange redefines scalability and interoperability in blockchain. With $LA, the community has in its hands a tool to build a more efficient and decentralized financial future.
Are you already part of the Lagrange revolution? 🚀
Innovation doesn't stop, and we continue to see how #Lagrange redefines scalability and interoperability in blockchain. With $LA, the community has in its hands a tool to build a more efficient and decentralized financial future.
Are you already part of the Lagrange revolution? 🚀
📈 One step closer to the goal
The campaign of @humafinance continues to advance with promising results.
Let's keep building the financial future together!
#finanzas #CryptoCommunity" #HumaFinance
The campaign of @humafinance continues to advance with promising results.
Let's keep building the financial future together!
#finanzas #CryptoCommunity" #HumaFinance
📈 One step closer to the goal
The campaign of @humafinance continues to progress with promising results.
Let's keep building the financial future together!
#finanzas #CryptoScamSurge #humafinancetoken
The campaign of @humafinance continues to progress with promising results.
Let's keep building the financial future together!
#finanzas #CryptoScamSurge #humafinancetoken
Log in to explore more content