
Bit_Guru
42.5k Posts

Bit_Guru
 Square Verified+
Report
Block User
Only Live Trader on Binance Square 💛 // Binance, CMC & X kols handle @bitgu_ru // PnL is always Live

Live Trader

Creator Awards 2024
Open Trade
Frequent Trader
2.6 Years
63 Following
156.6K+ Followers
300.5K+ Liked
3 Badges
Posts
Portfolio
All
Quotes
Videos
Live
PINNED
·
--
Article
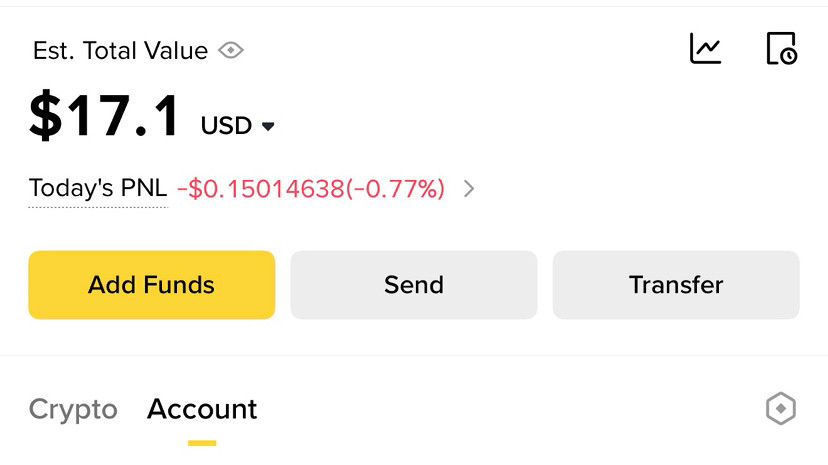
Is it possible to make $100 with only $17Many people think you need a big account to make real money in trading. That’s not true. The truth is simple it’s not about how much you start with, it’s about how you manage what you have.
Yes, it is absolutely possible to turn $17 into $100. But not by luck, not by gambling, and definitely not by chasing every pump you see. It requires discipline, patience, and a clear plan.
First, you need to understand one thing: small capital requires smart execution. You can’t afford big mistakes. One bad trade with high risk can wipe out your account. That’s why risk management becomes your strongest weapon.
Set a daily target. It doesn’t need to be huge. Even 3%–5% per day is enough. It may sound small, but consistency compounds faster than you think. If you stay disciplined, those small wins start building into something big.
Second, patience is everything. You don’t need to trade every day or every setup. Wait for clear opportunities strong support and resistance, clean breakouts, or obvious rejection zones. The market always gives chances, but only patient traders take the right ones.
Third, control your emotions. With a small account, people often overtrade because they want fast results. That’s where most fail. They increase leverage, take random entries, and ignore their plan. You have to do the opposite stay calm, follow your setup, and accept slow growth.
Another important point is consistency over hype. You don’t need one big win. You need many small correct decisions. That’s what builds your account. Even if you grow your account from $17 to $20, then $25, then $35 you are already winning.
Also, protect your capital at all costs. If you lose your account, the journey ends. If you protect it, you always have another chance.
In simple terms:
You don’t grow a small account by rushing
You grow it by repeating a disciplined process again and again
So yes, turning $17 into $100 is possible. But only for those who are willing to stay patient, follow a plan, and trade with control instead of emotion.
The market rewards consistency, not desperation
Start small
Stay focused
And let your discipline do the work
Trade Only coins Like $ETH , $BNB & $SOL
#cryptotradingpro #RiskManagementMastery
{future}(ETHUSDT)
{future}(BNBUSDT)
{future}(SOLUSDT)
Is it possible to make $100 with only $17
Many people think you need a big account to make real money in trading. That’s not true. The truth is simple it’s not about how much you start with, it’s about how you manage what you have.
Yes, it is absolutely possible to turn $17 into $100. But not by luck, not by gambling, and definitely not by chasing every pump you see. It requires discipline, patience, and a clear plan.
First, you need to understand one thing: small capital requires smart execution. You can’t afford big mistakes. One bad trade with high risk can wipe out your account. That’s why risk management becomes your strongest weapon.
Set a daily target. It doesn’t need to be huge. Even 3%–5% per day is enough. It may sound small, but consistency compounds faster than you think. If you stay disciplined, those small wins start building into something big.
Second, patience is everything. You don’t need to trade every day or every setup. Wait for clear opportunities strong support and resistance, clean breakouts, or obvious rejection zones. The market always gives chances, but only patient traders take the right ones.
Third, control your emotions. With a small account, people often overtrade because they want fast results. That’s where most fail. They increase leverage, take random entries, and ignore their plan. You have to do the opposite stay calm, follow your setup, and accept slow growth.
Another important point is consistency over hype. You don’t need one big win. You need many small correct decisions. That’s what builds your account. Even if you grow your account from $17 to $20, then $25, then $35 you are already winning.
Also, protect your capital at all costs. If you lose your account, the journey ends. If you protect it, you always have another chance.
In simple terms:
You don’t grow a small account by rushing
You grow it by repeating a disciplined process again and again
So yes, turning $17 into $100 is possible. But only for those who are willing to stay patient, follow a plan, and trade with control instead of emotion.
The market rewards consistency, not desperation
Start small
Stay focused
And let your discipline do the work
Trade Only coins Like $ETH , $BNB & $SOL
#cryptotradingpro #RiskManagementMastery
Yes, it is absolutely possible to turn $17 into $100. But not by luck, not by gambling, and definitely not by chasing every pump you see. It requires discipline, patience, and a clear plan.
First, you need to understand one thing: small capital requires smart execution. You can’t afford big mistakes. One bad trade with high risk can wipe out your account. That’s why risk management becomes your strongest weapon.
Set a daily target. It doesn’t need to be huge. Even 3%–5% per day is enough. It may sound small, but consistency compounds faster than you think. If you stay disciplined, those small wins start building into something big.
Second, patience is everything. You don’t need to trade every day or every setup. Wait for clear opportunities strong support and resistance, clean breakouts, or obvious rejection zones. The market always gives chances, but only patient traders take the right ones.
Third, control your emotions. With a small account, people often overtrade because they want fast results. That’s where most fail. They increase leverage, take random entries, and ignore their plan. You have to do the opposite stay calm, follow your setup, and accept slow growth.
Another important point is consistency over hype. You don’t need one big win. You need many small correct decisions. That’s what builds your account. Even if you grow your account from $17 to $20, then $25, then $35 you are already winning.
Also, protect your capital at all costs. If you lose your account, the journey ends. If you protect it, you always have another chance.
In simple terms:
You don’t grow a small account by rushing
You grow it by repeating a disciplined process again and again
So yes, turning $17 into $100 is possible. But only for those who are willing to stay patient, follow a plan, and trade with control instead of emotion.
The market rewards consistency, not desperation
Start small
Stay focused
And let your discipline do the work
Trade Only coins Like $ETH , $BNB & $SOL
#cryptotradingpro #RiskManagementMastery
313
55
745
689k
PINNED
·
--
Bullish
It took me 4 years in the crypto market to realize these things & you only need 2 minutes to read: 🤏
1. No matter the market condition, one thing stays the same: 8% of people will own 21 million Bitcoin.
2. Financial, capital, and risk management skills are 100 times more important than technical analysis or crypto research.
3. Earning while you sleep: There are many ways to make money in the crypto market without actively trading.
On average, #Bitcoin has increased more than 100% per year over the past 15 years. Yet, why do so few people make money? Because getting rich quickly is a common mentality. If you can't dedicate at least 4 hours a day to crypto, stick to Bitcoin and ETH—70% in BTC and 30% in ETH.
Trust no one: Trust leads to hope, disappointment, and errors. Learn independently and take responsibility for your actions. This is how to gain automatic minting experience!
The ultimate goal of investing: Make life more meaningful. If crypto investing can achieve that, do it. If not, reconsider.
Crypto is now a financial market: Originally born from technology, it's now influenced by macroeconomics and connected to mainstream financial markets.
People may discourage you from buying Bitcoin, but remember, once something is widely accepted, the opportunity might be gone. Seize your chance now!
Invest wisely, make meaningful choices, and let crypto pave the way to a better future.
#CryptoInvesting #ethbeta #Write2Earn! #BinanceTurns7 $BTC $ETH $SOL
{spot}(SOLUSDT)
{spot}(ETHUSDT)
{spot}(BTCUSDT)
It took me 4 years in the crypto market to realize these things & you only need 2 minutes to read: 🤏
1. No matter the market condition, one thing stays the same: 8% of people will own 21 million Bitcoin.
2. Financial, capital, and risk management skills are 100 times more important than technical analysis or crypto research.
3. Earning while you sleep: There are many ways to make money in the crypto market without actively trading.
On average, #Bitcoin has increased more than 100% per year over the past 15 years. Yet, why do so few people make money? Because getting rich quickly is a common mentality. If you can't dedicate at least 4 hours a day to crypto, stick to Bitcoin and ETH—70% in BTC and 30% in ETH.
Trust no one: Trust leads to hope, disappointment, and errors. Learn independently and take responsibility for your actions. This is how to gain automatic minting experience!
The ultimate goal of investing: Make life more meaningful. If crypto investing can achieve that, do it. If not, reconsider.
Crypto is now a financial market: Originally born from technology, it's now influenced by macroeconomics and connected to mainstream financial markets.
People may discourage you from buying Bitcoin, but remember, once something is widely accepted, the opportunity might be gone. Seize your chance now!
Invest wisely, make meaningful choices, and let crypto pave the way to a better future.
#CryptoInvesting #ethbeta #Write2Earn! #BinanceTurns7 $BTC $ETH $SOL
1. No matter the market condition, one thing stays the same: 8% of people will own 21 million Bitcoin.
2. Financial, capital, and risk management skills are 100 times more important than technical analysis or crypto research.
3. Earning while you sleep: There are many ways to make money in the crypto market without actively trading.
On average, #Bitcoin has increased more than 100% per year over the past 15 years. Yet, why do so few people make money? Because getting rich quickly is a common mentality. If you can't dedicate at least 4 hours a day to crypto, stick to Bitcoin and ETH—70% in BTC and 30% in ETH.
Trust no one: Trust leads to hope, disappointment, and errors. Learn independently and take responsibility for your actions. This is how to gain automatic minting experience!
The ultimate goal of investing: Make life more meaningful. If crypto investing can achieve that, do it. If not, reconsider.
Crypto is now a financial market: Originally born from technology, it's now influenced by macroeconomics and connected to mainstream financial markets.
People may discourage you from buying Bitcoin, but remember, once something is widely accepted, the opportunity might be gone. Seize your chance now!
Invest wisely, make meaningful choices, and let crypto pave the way to a better future.
#CryptoInvesting #ethbeta #Write2Earn! #BinanceTurns7 $BTC $ETH $SOL

302
102
2.2k
1.1M
·
--
4USDT Market Review: A Volatile Short Setup With an Unresolved Asset Identity𝗔𝘀𝘀𝗲𝘁 𝗶𝗱𝗲𝗻𝘁𝗶𝘁𝘆 𝗰𝗼𝗺𝗲𝘀 𝗳𝗶𝗿𝘀𝘁
4USDT appears on the RR Trader scanner as a trading symbol, but the supplied research does not verify the underlying project. That distinction matters. There is no confirmed information here about the token’s purpose, team, launch date, blockchain, contract address, or ecosystem use.
The supplied CoinGecko record points to Chutes, an artificial-intelligence project associated with the Bittensor ecosystem, but its listed symbol is SN64 rather than 4USDT. The reported price is also 16.94 US dollars, compared with the scanner price of 0.019459 USDT. This mismatch means the Chutes record cannot safely be treated as information about 4USDT.
The verified part of the research is therefore mainly market data. The scanner selected 4USDT as a short-direction setup with a confidence score of 100, a selection score of 175.4, a hot priority of 10.66575, and a TOP_LOSER classification. It ranked 14 in that category. These figures describe the scanner’s model output. They do not establish the quality of the project or the long-term value of the token.
There is also no verified project news tied specifically to 4USDT in the supplied research. The chart can be studied, but the fundamental profile remains unconfirmed.
𝗧𝗵𝗲 𝗺𝗮𝗿𝗸𝗲𝘁 𝗱𝗮𝘁𝗮 𝗮𝗻𝗱 𝘁𝗵𝗲 𝗳𝗲𝗲𝗱 𝗰𝗼𝗻𝗳𝗹𝗶𝗰𝘁
The scanner recorded a current price of 0.019459 USDT. It marked nearby support at 0.019375 and resistance at 0.019583. Its proposed entry band was 0.0194687295 to 0.0194881885, with an invalidation level at 0.019641749. The projected downside markers were 0.0191885199, 0.0190484151, and 0.0189083103. The scanner calculated a risk-reward figure of 1.8247505055.
The separate market ticker shows a different state. Its last price was 0.020700, while its recorded open price was 0.020724. The ticker reported a price change of -0.000024, or -0.116 percent, along with a 24-hour high of 0.021481 and a low of 0.018735. Its weighted average price was 0.0198717. Reported quote volume was 12,730,048.632523 USDT, with token volume of 640,612,679.
The scanner price and ticker price are therefore not aligned. The research does not establish whether the difference comes from timing, separate data states, or another feed issue. That conflict makes the setup conditional. A signal built around an entry close to 0.01947 may no longer describe the market if the live price is near 0.02070.
The scanner also recorded a 15-minute move of -0.754832 percent and a volume ratio of 1.427541. In simple terms, the short-term move was negative while volume was about 1.43 times the scanner’s comparison level. Higher activity during a decline can accompany selling, forced position closing, or dip buying, so volume confirms participation rather than direction by itself.
𝗥𝗲𝗰𝗲𝗻𝘁 𝗽𝗿𝗶𝗰𝗲 𝘀𝘁𝗿𝘂𝗰𝘁𝘂𝗿𝗲
The hourly candles show volatility rather than a smooth trend. Early in the supplied series, 4USDT traded around 0.0199 to 0.0208. It then moved through lower closes, including 0.019984, 0.019845, 0.019772, 0.019716, and 0.019662. A later hourly candle reached 0.019111 before closing near 0.019501, followed by another close around 0.019192. This sequence shows repeated pressure beneath the 0.0200 area.
The market did not move lower continuously. Several rebounds appeared. One hourly period moved from roughly 0.01919 to a close near 0.019482. Another reached 0.020118, while later candles tested 0.020315 and 0.019946. The strongest recent expansion produced a high of 0.021481 after a low near 0.019403, before the ticker settled at 0.020700 in the supplied snapshot.
The four-hour data presents a similar picture. The market began near 0.0228, briefly reached 0.024669, and then moved through lower highs and lower closes. One four-hour candle fell from around 0.021245 to 0.019924. Later periods traded as low as 0.018735 and 0.018825. The latest four-hour segment expanded between 0.018825 and 0.021481.
This is a market that has experienced a sizable repricing and remains unsettled. The repeated tests of the 0.0191 to 0.0194 region support a cautious short-term bearish reading, but the rebounds and wide candles show why continuation cannot be assumed.
𝗪𝗵𝘆 𝘁𝗵𝗲 𝘀𝗰𝗮𝗻𝗻𝗲𝗿 𝗳𝗼𝘂𝗻𝗱 𝟰𝗨𝗦𝗗𝗧
The scanner’s case is based on momentum, recent weakness, and elevated activity. It classified 4USDT as a top loser with a reported change of -11.303 percent. The separate 15-minute reading was another -0.754832 percent, and the volume ratio was 1.427541. Together, these readings describe a market that had recently underperformed while still showing short-term selling pressure when the scan was created at 01:58:07 UTC on September 14, 2026.
The proposed setup was narrow. The entry band sat between 0.0194687295 and 0.0194881885, close to the scanner price of 0.019459. The model appears to have been tracking a possible failure around that area, with lower reference points at 0.0191885199, 0.0190484151, and 0.0189083103.
The invalidation level was 0.019641749. A move above that level would weaken the specific bearish structure because it would reclaim the nearby resistance region. However, the separate ticker already showed prices above that level, including a last price of 0.020700. The scanner may have been operating on an earlier market state, or the feeds may not have been synchronized.
The signal is best understood as a conditional map rather than a prediction. Below approximately 0.01958, the scanner identifies room toward the lower reference levels. Above approximately 0.01964, that particular short structure is weakened. The relevance of those levels depends on the current market state.
𝗞𝗲𝘆 𝘀𝘂𝗽𝗽𝗼𝗿𝘁 𝗮𝗻𝗱 𝗿𝗲𝘀𝗶𝘀𝘁𝗮𝗻𝗰𝗲
The first nearby support from the scanner is 0.019375. Several hourly lows support the area, including a low of 0.019375 and later trading close to 0.0194. It is not an untouched level. Repeated tests can either show buying interest or indicate that support is weakening. A move beneath it would place the scanner’s lower reference points in focus.
The first downside marker is 0.0191885199, close to the hourly closing area around 0.019192. Below that sits 0.0190484151, followed by 0.0189083103. The broader four-hour chart recorded a low of 0.018735, so the 0.0189 region is connected to earlier market action. A break below 0.018735 would create a new low within the supplied four-hour sequence.
On the upside, scanner resistance is 0.019583, with invalidation at 0.019641749. The hourly chart also shows heavier trading areas between approximately 0.0199 and 0.0202, where candles opened, closed, or stalled. The recent high at 0.021481 is the clearest broader resistance in the supplied data.
A recovery through 0.0200 would challenge the immediate bearish reading. A move toward 0.021481 would show a stronger reversal, although the research does not establish that such a move is likely. In a market with this range, brief wicks through a level may carry less significance than sustained trading or closes beyond it.
𝗕𝗶𝘁𝗰𝗼𝗶𝗻 𝗮𝗻𝗱 𝗺𝗮𝗿𝗸𝗲𝘁 𝗯𝗮𝗰𝗸𝗱𝗿𝗼𝗽
Bitcoin was relatively firm in the supplied snapshot. BTCUSDT traded at 77,590.70, up 306.80 or 0.397 percent over the recorded period. Its high was 77,708.50, its low was 76,350.10, and its quote volume was approximately 6.8116 billion USDT. The weighted average price was 76,990.84.
That reading was not strongly bearish for the broader crypto market. Bitcoin strength can provide a more supportive backdrop for altcoins, although an individual token can remain weak while BTC rises. The 4USDT chart was considerably more volatile than Bitcoin, so the token’s movement cannot be explained by the BTC data alone.
The supplied news feed also showed a crypto Fear and Greed reading of 57, described as remaining in greed territory after falling four points. Other headlines concerned XRP, Chainlink, stablecoin expansion, and political crypto donations. None was verified as a direct catalyst for 4USDT. They provide general market context but do not explain the token-specific price action.
The broader backdrop is therefore mixed. Bitcoin’s strength may limit a generalized selloff, while 4USDT’s own technical weakness remains visible. The research does not provide enough evidence to connect the token’s next move to a specific macro or fundamental event.
𝗧𝗼𝗸𝗲𝗻𝗼𝗺𝗶𝗰𝘀 𝗿𝗲𝗺𝗮𝗶𝗻 𝘂𝗻𝘃𝗲𝗿𝗶𝗳𝗶𝗲𝗱
Verified tokenomics for 4USDT are unavailable. The research does not provide a confirmed circulating supply, maximum supply, market capitalization, fully diluted valuation, vesting schedule, unlock calendar, inflation rate, holder distribution, or contract address tied specifically to the scanner symbol. Without those details, dilution risk and holder concentration cannot be assessed.
The supplied CoinGecko record reports 5,925,036.434914857 circulating units, a 21,000,000 maximum supply, and a market capitalization of about 100.34 million US dollars. Those figures belong to the selected asset named Chutes with the symbol SN64. Its category labels are Artificial Intelligence, Bittensor Ecosystem, and Bittensor Subnets. Its reported price is 16.94 US dollars, which does not match a market trading near 0.019459 USDT.
The mismatch is too large to treat those figures as 4USDT tokenomics. It also means the Chutes project description cannot be assigned to 4USDT without additional verification. The correct conclusion is that the fundamental profile, supply structure, and project background of 4USDT remain unresolved.
𝗪𝗵𝗮𝘁 𝘁𝗼 𝗺𝗼𝗻𝗶𝘁𝗼𝗿
The most important technical question is whether price holds or loses the 0.019375 support area. A move below it with continued elevated volume would be consistent with the scanner’s bearish interpretation and would bring 0.0191885, 0.0190484, and 0.0189083 into focus. The earlier low near 0.018735 would then become an important test of the broader range.
A reclaim of 0.019583 and especially 0.0196417 would weaken the scanner’s short structure. Regaining 0.0200 would challenge the immediate bearish reading, while a move toward 0.021481 would represent a stronger reversal.
The scanner reported open interest of 422,228,653 units for 4USDT, but the research does not include contract specifications or a comparable historical series. That makes it impossible to determine whether the figure represents crowded long positions, crowded shorts, or simply active derivatives trading. Funding rates, liquidation data, order-book depth, and spread information were also not supplied.
The largest red flag remains the data mismatch. The scanner shows 4USDT near 0.019459, the market ticker shows 0.020700, and the CoinGecko record describes Chutes and SN64 at 16.94 dollars. This could reflect timing, a symbol collision, or a feed-mapping issue. Until the intended asset and current market state are confirmed, the technical setup should be treated cautiously.
𝗕𝗮𝗹𝗮𝗻𝗰𝗲𝗱 𝗰𝗼𝗻𝗰𝗹𝘂𝘀𝗶𝗼𝗻
4USDT is notable because the RR Trader scanner identified a high-confidence short-direction setup in a volatile market that had recently shown weakness. The technical map is clear enough to study: support near 0.019375, resistance near 0.019583, invalidation around 0.0196417, and lower reference points near 0.0191885, 0.0190484, and 0.0189083. Negative short-term momentum and elevated volume provide the scanner’s technical rationale.
The setup is not clean, however. The market ticker shows a materially different price, and the project data points to Chutes and SN64 rather than 4USDT. The token’s purpose, origin, utility, tokenomics, and catalysts must therefore remain unverified.
The strongest conclusion is that 4USDT currently offers a short-term volatility study rather than a complete project analysis. A sustained move below 0.019375 with active volume would preserve the scanner’s bearish structure. A reclaim above 0.0196417, followed by acceptance around 0.0200, would undermine it. Resolving the asset identity and feed conflict is essential before drawing broader conclusions.
4USDT Market Review: A Volatile Short Setup With an Unresolved Asset Identity
𝗔𝘀𝘀𝗲𝘁 𝗶𝗱𝗲𝗻𝘁𝗶𝘁𝘆 𝗰𝗼𝗺𝗲𝘀 𝗳𝗶𝗿𝘀𝘁
4USDT appears on the RR Trader scanner as a trading symbol, but the supplied research does not verify the underlying project. That distinction matters. There is no confirmed information here about the token’s purpose, team, launch date, blockchain, contract address, or ecosystem use.
The supplied CoinGecko record points to Chutes, an artificial-intelligence project associated with the Bittensor ecosystem, but its listed symbol is SN64 rather than 4USDT. The reported price is also 16.94 US dollars, compared with the scanner price of 0.019459 USDT. This mismatch means the Chutes record cannot safely be treated as information about 4USDT.
The verified part of the research is therefore mainly market data. The scanner selected 4USDT as a short-direction setup with a confidence score of 100, a selection score of 175.4, a hot priority of 10.66575, and a TOP_LOSER classification. It ranked 14 in that category. These figures describe the scanner’s model output. They do not establish the quality of the project or the long-term value of the token.
There is also no verified project news tied specifically to 4USDT in the supplied research. The chart can be studied, but the fundamental profile remains unconfirmed.
𝗧𝗵𝗲 𝗺𝗮𝗿𝗸𝗲𝘁 𝗱𝗮𝘁𝗮 𝗮𝗻𝗱 𝘁𝗵𝗲 𝗳𝗲𝗲𝗱 𝗰𝗼𝗻𝗳𝗹𝗶𝗰𝘁
The scanner recorded a current price of 0.019459 USDT. It marked nearby support at 0.019375 and resistance at 0.019583. Its proposed entry band was 0.0194687295 to 0.0194881885, with an invalidation level at 0.019641749. The projected downside markers were 0.0191885199, 0.0190484151, and 0.0189083103. The scanner calculated a risk-reward figure of 1.8247505055.
The separate market ticker shows a different state. Its last price was 0.020700, while its recorded open price was 0.020724. The ticker reported a price change of -0.000024, or -0.116 percent, along with a 24-hour high of 0.021481 and a low of 0.018735. Its weighted average price was 0.0198717. Reported quote volume was 12,730,048.632523 USDT, with token volume of 640,612,679.
The scanner price and ticker price are therefore not aligned. The research does not establish whether the difference comes from timing, separate data states, or another feed issue. That conflict makes the setup conditional. A signal built around an entry close to 0.01947 may no longer describe the market if the live price is near 0.02070.
The scanner also recorded a 15-minute move of -0.754832 percent and a volume ratio of 1.427541. In simple terms, the short-term move was negative while volume was about 1.43 times the scanner’s comparison level. Higher activity during a decline can accompany selling, forced position closing, or dip buying, so volume confirms participation rather than direction by itself.
𝗥𝗲𝗰𝗲𝗻𝘁 𝗽𝗿𝗶𝗰𝗲 𝘀𝘁𝗿𝘂𝗰𝘁𝘂𝗿𝗲
The hourly candles show volatility rather than a smooth trend. Early in the supplied series, 4USDT traded around 0.0199 to 0.0208. It then moved through lower closes, including 0.019984, 0.019845, 0.019772, 0.019716, and 0.019662. A later hourly candle reached 0.019111 before closing near 0.019501, followed by another close around 0.019192. This sequence shows repeated pressure beneath the 0.0200 area.
The market did not move lower continuously. Several rebounds appeared. One hourly period moved from roughly 0.01919 to a close near 0.019482. Another reached 0.020118, while later candles tested 0.020315 and 0.019946. The strongest recent expansion produced a high of 0.021481 after a low near 0.019403, before the ticker settled at 0.020700 in the supplied snapshot.
The four-hour data presents a similar picture. The market began near 0.0228, briefly reached 0.024669, and then moved through lower highs and lower closes. One four-hour candle fell from around 0.021245 to 0.019924. Later periods traded as low as 0.018735 and 0.018825. The latest four-hour segment expanded between 0.018825 and 0.021481.
This is a market that has experienced a sizable repricing and remains unsettled. The repeated tests of the 0.0191 to 0.0194 region support a cautious short-term bearish reading, but the rebounds and wide candles show why continuation cannot be assumed.
𝗪𝗵𝘆 𝘁𝗵𝗲 𝘀𝗰𝗮𝗻𝗻𝗲𝗿 𝗳𝗼𝘂𝗻𝗱 𝟰𝗨𝗦𝗗𝗧
The scanner’s case is based on momentum, recent weakness, and elevated activity. It classified 4USDT as a top loser with a reported change of -11.303 percent. The separate 15-minute reading was another -0.754832 percent, and the volume ratio was 1.427541. Together, these readings describe a market that had recently underperformed while still showing short-term selling pressure when the scan was created at 01:58:07 UTC on September 14, 2026.
The proposed setup was narrow. The entry band sat between 0.0194687295 and 0.0194881885, close to the scanner price of 0.019459. The model appears to have been tracking a possible failure around that area, with lower reference points at 0.0191885199, 0.0190484151, and 0.0189083103.
The invalidation level was 0.019641749. A move above that level would weaken the specific bearish structure because it would reclaim the nearby resistance region. However, the separate ticker already showed prices above that level, including a last price of 0.020700. The scanner may have been operating on an earlier market state, or the feeds may not have been synchronized.
The signal is best understood as a conditional map rather than a prediction. Below approximately 0.01958, the scanner identifies room toward the lower reference levels. Above approximately 0.01964, that particular short structure is weakened. The relevance of those levels depends on the current market state.
𝗞𝗲𝘆 𝘀𝘂𝗽𝗽𝗼𝗿𝘁 𝗮𝗻𝗱 𝗿𝗲𝘀𝗶𝘀𝘁𝗮𝗻𝗰𝗲
The first nearby support from the scanner is 0.019375. Several hourly lows support the area, including a low of 0.019375 and later trading close to 0.0194. It is not an untouched level. Repeated tests can either show buying interest or indicate that support is weakening. A move beneath it would place the scanner’s lower reference points in focus.
The first downside marker is 0.0191885199, close to the hourly closing area around 0.019192. Below that sits 0.0190484151, followed by 0.0189083103. The broader four-hour chart recorded a low of 0.018735, so the 0.0189 region is connected to earlier market action. A break below 0.018735 would create a new low within the supplied four-hour sequence.
On the upside, scanner resistance is 0.019583, with invalidation at 0.019641749. The hourly chart also shows heavier trading areas between approximately 0.0199 and 0.0202, where candles opened, closed, or stalled. The recent high at 0.021481 is the clearest broader resistance in the supplied data.
A recovery through 0.0200 would challenge the immediate bearish reading. A move toward 0.021481 would show a stronger reversal, although the research does not establish that such a move is likely. In a market with this range, brief wicks through a level may carry less significance than sustained trading or closes beyond it.
𝗕𝗶𝘁𝗰𝗼𝗶𝗻 𝗮𝗻𝗱 𝗺𝗮𝗿𝗸𝗲𝘁 𝗯𝗮𝗰𝗸𝗱𝗿𝗼𝗽
Bitcoin was relatively firm in the supplied snapshot. BTCUSDT traded at 77,590.70, up 306.80 or 0.397 percent over the recorded period. Its high was 77,708.50, its low was 76,350.10, and its quote volume was approximately 6.8116 billion USDT. The weighted average price was 76,990.84.
That reading was not strongly bearish for the broader crypto market. Bitcoin strength can provide a more supportive backdrop for altcoins, although an individual token can remain weak while BTC rises. The 4USDT chart was considerably more volatile than Bitcoin, so the token’s movement cannot be explained by the BTC data alone.
The supplied news feed also showed a crypto Fear and Greed reading of 57, described as remaining in greed territory after falling four points. Other headlines concerned XRP, Chainlink, stablecoin expansion, and political crypto donations. None was verified as a direct catalyst for 4USDT. They provide general market context but do not explain the token-specific price action.
The broader backdrop is therefore mixed. Bitcoin’s strength may limit a generalized selloff, while 4USDT’s own technical weakness remains visible. The research does not provide enough evidence to connect the token’s next move to a specific macro or fundamental event.
𝗧𝗼𝗸𝗲𝗻𝗼𝗺𝗶𝗰𝘀 𝗿𝗲𝗺𝗮𝗶𝗻 𝘂𝗻𝘃𝗲𝗿𝗶𝗳𝗶𝗲𝗱
Verified tokenomics for 4USDT are unavailable. The research does not provide a confirmed circulating supply, maximum supply, market capitalization, fully diluted valuation, vesting schedule, unlock calendar, inflation rate, holder distribution, or contract address tied specifically to the scanner symbol. Without those details, dilution risk and holder concentration cannot be assessed.
The supplied CoinGecko record reports 5,925,036.434914857 circulating units, a 21,000,000 maximum supply, and a market capitalization of about 100.34 million US dollars. Those figures belong to the selected asset named Chutes with the symbol SN64. Its category labels are Artificial Intelligence, Bittensor Ecosystem, and Bittensor Subnets. Its reported price is 16.94 US dollars, which does not match a market trading near 0.019459 USDT.
The mismatch is too large to treat those figures as 4USDT tokenomics. It also means the Chutes project description cannot be assigned to 4USDT without additional verification. The correct conclusion is that the fundamental profile, supply structure, and project background of 4USDT remain unresolved.
𝗪𝗵𝗮𝘁 𝘁𝗼 𝗺𝗼𝗻𝗶𝘁𝗼𝗿
The most important technical question is whether price holds or loses the 0.019375 support area. A move below it with continued elevated volume would be consistent with the scanner’s bearish interpretation and would bring 0.0191885, 0.0190484, and 0.0189083 into focus. The earlier low near 0.018735 would then become an important test of the broader range.
A reclaim of 0.019583 and especially 0.0196417 would weaken the scanner’s short structure. Regaining 0.0200 would challenge the immediate bearish reading, while a move toward 0.021481 would represent a stronger reversal.
The scanner reported open interest of 422,228,653 units for 4USDT, but the research does not include contract specifications or a comparable historical series. That makes it impossible to determine whether the figure represents crowded long positions, crowded shorts, or simply active derivatives trading. Funding rates, liquidation data, order-book depth, and spread information were also not supplied.
The largest red flag remains the data mismatch. The scanner shows 4USDT near 0.019459, the market ticker shows 0.020700, and the CoinGecko record describes Chutes and SN64 at 16.94 dollars. This could reflect timing, a symbol collision, or a feed-mapping issue. Until the intended asset and current market state are confirmed, the technical setup should be treated cautiously.
𝗕𝗮𝗹𝗮𝗻𝗰𝗲𝗱 𝗰𝗼𝗻𝗰𝗹𝘂𝘀𝗶𝗼𝗻
4USDT is notable because the RR Trader scanner identified a high-confidence short-direction setup in a volatile market that had recently shown weakness. The technical map is clear enough to study: support near 0.019375, resistance near 0.019583, invalidation around 0.0196417, and lower reference points near 0.0191885, 0.0190484, and 0.0189083. Negative short-term momentum and elevated volume provide the scanner’s technical rationale.
The setup is not clean, however. The market ticker shows a materially different price, and the project data points to Chutes and SN64 rather than 4USDT. The token’s purpose, origin, utility, tokenomics, and catalysts must therefore remain unverified.
The strongest conclusion is that 4USDT currently offers a short-term volatility study rather than a complete project analysis. A sustained move below 0.019375 with active volume would preserve the scanner’s bearish structure. A reclaim above 0.0196417, followed by acceptance around 0.0200, would undermine it. Resolving the asset identity and feed conflict is essential before drawing broader conclusions.
4USDT appears on the RR Trader scanner as a trading symbol, but the supplied research does not verify the underlying project. That distinction matters. There is no confirmed information here about the token’s purpose, team, launch date, blockchain, contract address, or ecosystem use.
The supplied CoinGecko record points to Chutes, an artificial-intelligence project associated with the Bittensor ecosystem, but its listed symbol is SN64 rather than 4USDT. The reported price is also 16.94 US dollars, compared with the scanner price of 0.019459 USDT. This mismatch means the Chutes record cannot safely be treated as information about 4USDT.
The verified part of the research is therefore mainly market data. The scanner selected 4USDT as a short-direction setup with a confidence score of 100, a selection score of 175.4, a hot priority of 10.66575, and a TOP_LOSER classification. It ranked 14 in that category. These figures describe the scanner’s model output. They do not establish the quality of the project or the long-term value of the token.
There is also no verified project news tied specifically to 4USDT in the supplied research. The chart can be studied, but the fundamental profile remains unconfirmed.
𝗧𝗵𝗲 𝗺𝗮𝗿𝗸𝗲𝘁 𝗱𝗮𝘁𝗮 𝗮𝗻𝗱 𝘁𝗵𝗲 𝗳𝗲𝗲𝗱 𝗰𝗼𝗻𝗳𝗹𝗶𝗰𝘁
The scanner recorded a current price of 0.019459 USDT. It marked nearby support at 0.019375 and resistance at 0.019583. Its proposed entry band was 0.0194687295 to 0.0194881885, with an invalidation level at 0.019641749. The projected downside markers were 0.0191885199, 0.0190484151, and 0.0189083103. The scanner calculated a risk-reward figure of 1.8247505055.
The separate market ticker shows a different state. Its last price was 0.020700, while its recorded open price was 0.020724. The ticker reported a price change of -0.000024, or -0.116 percent, along with a 24-hour high of 0.021481 and a low of 0.018735. Its weighted average price was 0.0198717. Reported quote volume was 12,730,048.632523 USDT, with token volume of 640,612,679.
The scanner price and ticker price are therefore not aligned. The research does not establish whether the difference comes from timing, separate data states, or another feed issue. That conflict makes the setup conditional. A signal built around an entry close to 0.01947 may no longer describe the market if the live price is near 0.02070.
The scanner also recorded a 15-minute move of -0.754832 percent and a volume ratio of 1.427541. In simple terms, the short-term move was negative while volume was about 1.43 times the scanner’s comparison level. Higher activity during a decline can accompany selling, forced position closing, or dip buying, so volume confirms participation rather than direction by itself.
𝗥𝗲𝗰𝗲𝗻𝘁 𝗽𝗿𝗶𝗰𝗲 𝘀𝘁𝗿𝘂𝗰𝘁𝘂𝗿𝗲
The hourly candles show volatility rather than a smooth trend. Early in the supplied series, 4USDT traded around 0.0199 to 0.0208. It then moved through lower closes, including 0.019984, 0.019845, 0.019772, 0.019716, and 0.019662. A later hourly candle reached 0.019111 before closing near 0.019501, followed by another close around 0.019192. This sequence shows repeated pressure beneath the 0.0200 area.
The market did not move lower continuously. Several rebounds appeared. One hourly period moved from roughly 0.01919 to a close near 0.019482. Another reached 0.020118, while later candles tested 0.020315 and 0.019946. The strongest recent expansion produced a high of 0.021481 after a low near 0.019403, before the ticker settled at 0.020700 in the supplied snapshot.
The four-hour data presents a similar picture. The market began near 0.0228, briefly reached 0.024669, and then moved through lower highs and lower closes. One four-hour candle fell from around 0.021245 to 0.019924. Later periods traded as low as 0.018735 and 0.018825. The latest four-hour segment expanded between 0.018825 and 0.021481.
This is a market that has experienced a sizable repricing and remains unsettled. The repeated tests of the 0.0191 to 0.0194 region support a cautious short-term bearish reading, but the rebounds and wide candles show why continuation cannot be assumed.
𝗪𝗵𝘆 𝘁𝗵𝗲 𝘀𝗰𝗮𝗻𝗻𝗲𝗿 𝗳𝗼𝘂𝗻𝗱 𝟰𝗨𝗦𝗗𝗧
The scanner’s case is based on momentum, recent weakness, and elevated activity. It classified 4USDT as a top loser with a reported change of -11.303 percent. The separate 15-minute reading was another -0.754832 percent, and the volume ratio was 1.427541. Together, these readings describe a market that had recently underperformed while still showing short-term selling pressure when the scan was created at 01:58:07 UTC on September 14, 2026.
The proposed setup was narrow. The entry band sat between 0.0194687295 and 0.0194881885, close to the scanner price of 0.019459. The model appears to have been tracking a possible failure around that area, with lower reference points at 0.0191885199, 0.0190484151, and 0.0189083103.
The invalidation level was 0.019641749. A move above that level would weaken the specific bearish structure because it would reclaim the nearby resistance region. However, the separate ticker already showed prices above that level, including a last price of 0.020700. The scanner may have been operating on an earlier market state, or the feeds may not have been synchronized.
The signal is best understood as a conditional map rather than a prediction. Below approximately 0.01958, the scanner identifies room toward the lower reference levels. Above approximately 0.01964, that particular short structure is weakened. The relevance of those levels depends on the current market state.
𝗞𝗲𝘆 𝘀𝘂𝗽𝗽𝗼𝗿𝘁 𝗮𝗻𝗱 𝗿𝗲𝘀𝗶𝘀𝘁𝗮𝗻𝗰𝗲
The first nearby support from the scanner is 0.019375. Several hourly lows support the area, including a low of 0.019375 and later trading close to 0.0194. It is not an untouched level. Repeated tests can either show buying interest or indicate that support is weakening. A move beneath it would place the scanner’s lower reference points in focus.
The first downside marker is 0.0191885199, close to the hourly closing area around 0.019192. Below that sits 0.0190484151, followed by 0.0189083103. The broader four-hour chart recorded a low of 0.018735, so the 0.0189 region is connected to earlier market action. A break below 0.018735 would create a new low within the supplied four-hour sequence.
On the upside, scanner resistance is 0.019583, with invalidation at 0.019641749. The hourly chart also shows heavier trading areas between approximately 0.0199 and 0.0202, where candles opened, closed, or stalled. The recent high at 0.021481 is the clearest broader resistance in the supplied data.
A recovery through 0.0200 would challenge the immediate bearish reading. A move toward 0.021481 would show a stronger reversal, although the research does not establish that such a move is likely. In a market with this range, brief wicks through a level may carry less significance than sustained trading or closes beyond it.
𝗕𝗶𝘁𝗰𝗼𝗶𝗻 𝗮𝗻𝗱 𝗺𝗮𝗿𝗸𝗲𝘁 𝗯𝗮𝗰𝗸𝗱𝗿𝗼𝗽
Bitcoin was relatively firm in the supplied snapshot. BTCUSDT traded at 77,590.70, up 306.80 or 0.397 percent over the recorded period. Its high was 77,708.50, its low was 76,350.10, and its quote volume was approximately 6.8116 billion USDT. The weighted average price was 76,990.84.
That reading was not strongly bearish for the broader crypto market. Bitcoin strength can provide a more supportive backdrop for altcoins, although an individual token can remain weak while BTC rises. The 4USDT chart was considerably more volatile than Bitcoin, so the token’s movement cannot be explained by the BTC data alone.
The supplied news feed also showed a crypto Fear and Greed reading of 57, described as remaining in greed territory after falling four points. Other headlines concerned XRP, Chainlink, stablecoin expansion, and political crypto donations. None was verified as a direct catalyst for 4USDT. They provide general market context but do not explain the token-specific price action.
The broader backdrop is therefore mixed. Bitcoin’s strength may limit a generalized selloff, while 4USDT’s own technical weakness remains visible. The research does not provide enough evidence to connect the token’s next move to a specific macro or fundamental event.
𝗧𝗼𝗸𝗲𝗻𝗼𝗺𝗶𝗰𝘀 𝗿𝗲𝗺𝗮𝗶𝗻 𝘂𝗻𝘃𝗲𝗿𝗶𝗳𝗶𝗲𝗱
Verified tokenomics for 4USDT are unavailable. The research does not provide a confirmed circulating supply, maximum supply, market capitalization, fully diluted valuation, vesting schedule, unlock calendar, inflation rate, holder distribution, or contract address tied specifically to the scanner symbol. Without those details, dilution risk and holder concentration cannot be assessed.
The supplied CoinGecko record reports 5,925,036.434914857 circulating units, a 21,000,000 maximum supply, and a market capitalization of about 100.34 million US dollars. Those figures belong to the selected asset named Chutes with the symbol SN64. Its category labels are Artificial Intelligence, Bittensor Ecosystem, and Bittensor Subnets. Its reported price is 16.94 US dollars, which does not match a market trading near 0.019459 USDT.
The mismatch is too large to treat those figures as 4USDT tokenomics. It also means the Chutes project description cannot be assigned to 4USDT without additional verification. The correct conclusion is that the fundamental profile, supply structure, and project background of 4USDT remain unresolved.
𝗪𝗵𝗮𝘁 𝘁𝗼 𝗺𝗼𝗻𝗶𝘁𝗼𝗿
The most important technical question is whether price holds or loses the 0.019375 support area. A move below it with continued elevated volume would be consistent with the scanner’s bearish interpretation and would bring 0.0191885, 0.0190484, and 0.0189083 into focus. The earlier low near 0.018735 would then become an important test of the broader range.
A reclaim of 0.019583 and especially 0.0196417 would weaken the scanner’s short structure. Regaining 0.0200 would challenge the immediate bearish reading, while a move toward 0.021481 would represent a stronger reversal.
The scanner reported open interest of 422,228,653 units for 4USDT, but the research does not include contract specifications or a comparable historical series. That makes it impossible to determine whether the figure represents crowded long positions, crowded shorts, or simply active derivatives trading. Funding rates, liquidation data, order-book depth, and spread information were also not supplied.
The largest red flag remains the data mismatch. The scanner shows 4USDT near 0.019459, the market ticker shows 0.020700, and the CoinGecko record describes Chutes and SN64 at 16.94 dollars. This could reflect timing, a symbol collision, or a feed-mapping issue. Until the intended asset and current market state are confirmed, the technical setup should be treated cautiously.
𝗕𝗮𝗹𝗮𝗻𝗰𝗲𝗱 𝗰𝗼𝗻𝗰𝗹𝘂𝘀𝗶𝗼𝗻
4USDT is notable because the RR Trader scanner identified a high-confidence short-direction setup in a volatile market that had recently shown weakness. The technical map is clear enough to study: support near 0.019375, resistance near 0.019583, invalidation around 0.0196417, and lower reference points near 0.0191885, 0.0190484, and 0.0189083. Negative short-term momentum and elevated volume provide the scanner’s technical rationale.
The setup is not clean, however. The market ticker shows a materially different price, and the project data points to Chutes and SN64 rather than 4USDT. The token’s purpose, origin, utility, tokenomics, and catalysts must therefore remain unverified.
The strongest conclusion is that 4USDT currently offers a short-term volatility study rather than a complete project analysis. A sustained move below 0.019375 with active volume would preserve the scanner’s bearish structure. A reclaim above 0.0196417, followed by acceptance around 0.0200, would undermine it. Resolving the asset identity and feed conflict is essential before drawing broader conclusions.
62
·
--
$KAVA is moving… 🚨🔥 DOWN!
Entry: 0.06102 - 0.061081
SL: 0.061478
TP1: 0.060142 | TP2: 0.059703 | TP3: 0.059264
$KAVA is moving… 🚨🔥 DOWN!
Entry: 0.06102 - 0.061081
SL: 0.061478
TP1: 0.060142 | TP2: 0.059703 | TP3: 0.059264
Entry: 0.06102 - 0.061081
SL: 0.061478
TP1: 0.060142 | TP2: 0.059703 | TP3: 0.059264
188
·
--
$BIGTIME is moving… 🚨🔥 UP!
Entry: 0.00743583 - 0.00744328
SL: 0.00742000
TP1: 0.00749188 | TP2: 0.00751618 | TP3: 0.00754048
$BIGTIME is moving… 🚨🔥 UP!
Entry: 0.00743583 - 0.00744328
SL: 0.00742000
TP1: 0.00749188 | TP2: 0.00751618 | TP3: 0.00754048
Entry: 0.00743583 - 0.00744328
SL: 0.00742000
TP1: 0.00749188 | TP2: 0.00751618 | TP3: 0.00754048
265
·
--
My community, look at $H … ✅ UP!
Entry: 0.086999 - 0.087086
SL: 0.086438
TP1: 0.088306 | TP2: 0.088916 | TP3: 0.089526
My community, look at $H … ✅ UP!
Entry: 0.086999 - 0.087086
SL: 0.086438
TP1: 0.088306 | TP2: 0.088916 | TP3: 0.089526
Entry: 0.086999 - 0.087086
SL: 0.086438
TP1: 0.088306 | TP2: 0.088916 | TP3: 0.089526
228
·
--
Don’t miss $BR … ‼️ DOWN move!
Entry: 0.31631 - 0.31662
SL: 0.31838
TP1: 0.3123 | TP2: 0.31029 | TP3: 0.30828
Don’t miss $BR … ‼️ DOWN move!
Entry: 0.31631 - 0.31662
SL: 0.31838
TP1: 0.3123 | TP2: 0.31029 | TP3: 0.30828
Entry: 0.31631 - 0.31662
SL: 0.31838
TP1: 0.3123 | TP2: 0.31029 | TP3: 0.30828
397
·
--
Don’t miss $FIL … ‼️ DOWN move!
Entry: 0.97519 - 0.97616
SL: 0.97824
TP1: 0.96882 | TP2: 0.96564 | TP3: 0.96246
Don’t miss $FIL … ‼️ DOWN move!
Entry: 0.97519 - 0.97616
SL: 0.97824
TP1: 0.96882 | TP2: 0.96564 | TP3: 0.96246
Entry: 0.97519 - 0.97616
SL: 0.97824
TP1: 0.96882 | TP2: 0.96564 | TP3: 0.96246
2
405
·
--
TRIA Price Analysis: Weak Momentum Puts 0.003354 Support in Focus𝗧𝗵𝗲 𝗳𝗶𝗿𝘀𝘁 𝘀𝗶𝗴𝗻𝗮𝗹 𝗶𝘀 𝘄𝗲𝗮𝗸𝗻𝗲𝘀𝘀, 𝗻𝗼𝘁 𝗲𝘅𝗰𝗶𝘁𝗲𝗺𝗲𝗻𝘁
TRIAUSDT has entered the scanner at a moment when the chart is already showing clear damage. The RR Trader scanner classified TRIAUSDT as a SHORT setup with 96.69% confidence, placing it in the TOP_LOSER group at rank 30. That is not a prediction of what must happen next, but it explains why this pair deserves attention right now: price is falling, selling activity is elevated, and the market is sitting close to a clearly defined technical decision zone.
Market data places TRIA near 0.003414 to 0.003418 USDT, depending on the source and snapshot time. Binance data shows a 24-hour change of roughly -6.94%, while CoinGecko reports a decline of about -7.32%. The small difference is consistent with prices being recorded from different venues and at slightly different times. The broader message is consistent across both datasets: TRIA has been under heavy pressure.
𝗪𝗵𝗮𝘁 𝗧𝗿𝗶𝗮 𝗶𝘀 𝘁𝗿𝘆𝗶𝗻𝗴 𝘁𝗼 𝗯𝘂𝗶𝗹𝗱
Tria describes itself as a self-custodial neobank and cross-chain payments infrastructure. Its stated goal is to make onchain money feel more like everyday money, without forcing users to understand bridges, network switching, gas management or the technical details behind each transaction. The product vision combines spending, trading, sending and earning in one account experience.
The core system is called BestPath. According to the project description, BestPath is a routing and execution layer designed to take a user intent such as spend, swap, send or earn and complete the action through an appropriate path across chains. In practical terms, the problem Tria is addressing is fragmentation: assets may exist on different networks, liquidity is split between ecosystems, and users often have to perform several technical steps before completing a payment or trade.
The project operates across two broad layers. The consumer-facing layer includes a Visa-powered card, spot swaps, perpetual futures and Earn vaults. The other layer is aimed at developers and institutions, allowing outside protocols and ecosystems to integrate Tria’s execution rails. These are claims from the supplied project description. The research does not provide independent usage figures, revenue data or adoption statistics.
𝗕𝗮𝗰𝗸𝗴𝗿𝗼𝘂𝗻𝗱, 𝘁𝗼𝗸𝗲𝗻 𝗿𝗼𝗹𝗲 𝗮𝗻𝗱 𝗲𝗰𝗼𝘀𝘆𝘀𝘁𝗲𝗺 𝗿𝗲𝗮𝗰𝗵
A detailed founding history, named founding team and verified launch timeline are not available in the supplied research. The available project identity is linked to the Tria brand and the official social handle listed in the data, but there is not enough information here to responsibly describe who created the project, how much funding it raised or which investors support it.
TRIA is represented on Ethereum and BNB Chain through the contract records included in the research. CoinGecko categorizes the project across DeFi, wallets, the Ethereum ecosystem, the BNB Chain ecosystem, neobanks and Binance Alpha Spotlight. Those categories show how the token is positioned, but category labels should not be confused with proof of deep integration or large-scale user activity.
The token’s exact utility is not fully specified in the supplied material. The broader Tria product has payment, trading, earning and routing functions, but the research does not confirm which of those functions require TRIA, whether the token is used for fee discounts, governance, staking, incentives or settlement, or how much demand is generated by actual product usage. That distinction matters. A useful application can exist while the investment case for its token remains uncertain.
𝗦𝘂𝗽𝗽𝗹𝘆 𝗮𝗻𝗱 𝘃𝗮𝗹𝘂𝗮𝘁𝗶𝗼𝗻 𝗰𝗼𝗻𝘁𝗲𝘅𝘁 𝗱𝗲𝘀𝗲𝗿𝘃𝗲 𝗰𝗮𝘂𝘁𝗶𝗼𝗻
The token data lists a maximum and total supply of 10 billion TRIA. Circulating supply is recorded at 2.15767 billion tokens, or about 21.6% of the maximum supply. CoinGecko reports a market capitalization near 7.35 million dollars and a fully diluted valuation near 34.08 million dollars. The reported market-cap-to-FDV ratio is 0.22, reflecting the gap between circulating tokens and the full supply.
That supply structure is one of the most important facts in the TRIA story. If the remaining tokens enter circulation over time, the market may face dilution unless demand grows at a similar pace. The research does not include an unlock calendar, vesting schedule, allocation breakdown or information about treasury holdings. Without those details, it is impossible to say when supply pressure may appear or which holders might be able to sell.
The valuation is also small relative to the reported trading activity. Binance recorded approximately 3.62 million USDT in 24-hour quote volume, while CoinGecko recorded approximately 1.48 million dollars in total volume at its snapshot time. This activity is sufficient for sharp moves, but a small market capitalization can also mean that liquidity is fragile. Large orders, forced positions or concentrated holders may have an outsized effect on price.
𝗧𝗵𝗲 𝗰𝗵𝗮𝗿𝘁 𝗵𝗮𝘀 𝘀𝗵𝗶𝗳𝘁𝗲𝗱 𝗳𝗿𝗼𝗺 𝗮 𝗽𝘂𝗹𝗹𝗯𝗮𝗰𝗸 𝗶𝗻𝘁𝗼 𝗮 𝗱𝗮𝗺𝗮𝗴𝗲𝗱 𝘀𝘁𝗿𝘂𝗰𝘁𝘂𝗿𝗲
The Binance ticker shows TRIAUSDT opening the 24-hour period near 0.003673 and trading as high as 0.003679 before falling to about 0.003390. The latest recorded price is close to 0.003418. That creates a wide intraday range and leaves price near the lower end of the session. The weighted average price is 0.0035251, so the last price is trading well below the average level at which much of the reported volume changed hands.
The hourly candles show a steady deterioration rather than one isolated drop. Early candles traded around 0.00365 to 0.00368, then successive closes moved through 0.00353, 0.00349, 0.00346, 0.00343 and 0.00341. There were brief rebounds, including a move from a 0.003423 low to a 0.003492 close and another recovery toward 0.003556, but those bounces did not produce a lasting trend reversal.
The four-hour structure tells the same story on a larger scale. TRIA traded between approximately 0.003834 and 0.003616 in one earlier block, then fell through the 0.0037 area. A later rebound reached 0.003572, but the market subsequently printed a low of 0.003390. This sequence suggests lower highs and lower reaction lows. That is an interpretation of the supplied candles, not a guarantee that the downtrend will continue.
Momentum outside the 24-hour window is also weak. CoinGecko reports declines of 22.75% over seven days, 35.04% over 14 days, 58.58% over 30 days, 58.92% over 60 days and 85.77% over 200 days. TRIA is also about 93.2% below its recorded all-time high of 0.050041 dollars. It recently recorded an all-time low of 0.00324452 dollars on September 9, 2026, which means the current price is only modestly above that low.
𝗪𝗵𝘆 𝘁𝗵𝗲 𝗥𝗥 𝗧𝗿𝗮𝗱𝗲𝗿 𝘀𝗰𝗮𝗻𝗻𝗲𝗿 𝗶𝘀 𝗶𝗻𝘁𝗲𝗿𝗲𝘀𝘁𝗲𝗱
The scanner’s short setup is built around several aligned observations. Its current price reference is 0.003414, with a support level at 0.003354 and resistance at 0.003427. The suggested entry zone is 0.003415707 to 0.003419121, almost exactly where the market was trading when the signal was generated. The scanner places an invalidation or stop reference at 0.003441312 and calculates a risk-reward value of 2.2154 based on its listed targets.
The downside reference points are 0.003366545 for the first target, 0.003341965 for the second and 0.003317384 for the third. These levels sit progressively below the recent market price and around the lower portion of the current range. The scanner also measured a 15-minute move of -3.48%, a volume ratio of 1.343 and a hot-list change of -7.228%. In plain English, TRIA was falling quickly enough to attract attention, while volume was running above its reference level.
The setup is interesting because the market is hovering close to resistance after a sharp decline. If price cannot reclaim 0.003427 and remains below the scanner’s invalidation level near 0.003441, sellers may continue testing the lower levels. However, this is exactly where short setups become vulnerable to a relief bounce. A move above 0.003441 would weaken the stated structure, while a stronger recovery through nearby intraday swing areas could invalidate the idea more broadly.
𝗕𝗶𝘁𝗰𝗼𝗶𝗻 𝗶𝘀 𝘀𝗼𝗳𝘁𝗲𝗿, 𝗯𝘂𝘁 𝗧𝗥𝗜𝗔 𝗶𝘀 𝗺𝗼𝘃𝗶𝗻𝗴 𝗺𝘂𝗰𝗵 𝗵𝗮𝗿𝗱𝗲𝗿
Bitcoin provides a useful market backdrop. BTCUSDT is recorded near 76,784.50 dollars, down about 0.58% over 24 hours, with a reported range from 76,350.10 to 77,427.40. Bitcoin is therefore also under pressure, but its decline is much smaller than TRIA’s roughly 7% drop.
That relative weakness is important. It suggests TRIA’s move cannot be explained only by a broad Bitcoin selloff. Smaller tokens often react more aggressively when market liquidity thins, and they can fall sharply even when Bitcoin is moving only modestly. The correlation may still increase if BTC breaks lower, but the present data shows TRIA underperforming Bitcoin rather than simply copying it.
The opposite scenario also matters. If Bitcoin stabilizes or recovers, TRIA could receive a short-term relief bid because heavily sold small-cap tokens can bounce quickly. A BTC rebound would not automatically repair TRIA’s damaged structure, but it could make continuation lower less orderly and increase the risk of a sudden squeeze.
𝗡𝗼 𝘃𝗲𝗿𝗶𝗳𝗶𝗲𝗱 𝗳𝗿𝗲𝘀𝗵 𝗰𝗮𝘁𝗮𝗹𝘆𝘀𝘁 𝗶𝘀 𝗮𝘃𝗮𝗶𝗹𝗮𝗯𝗹𝗲
The supplied research contains no recent verified news items for TRIA. There is no confirmed partnership announcement, product release, token unlock notice, exchange listing claim, governance event or protocol update that can be used as a current catalyst. That absence should not be interpreted as proof that nothing happened; it simply means the provided dataset does not verify a news-driven reason for the decline.
The project’s product description itself is a potential long-term narrative catalyst. A self-custodial account with card spending, cross-chain routing, swaps and earning products could attract attention if users adopt it and if the system performs reliably. Developer and institutional integrations could also increase the usefulness of the execution layer. At present, however, the research supplies no user counts, transaction volumes, fee revenue, active integrations or retention data to measure whether that potential is becoming reality.
For the next move, the most direct catalysts are likely to be technical and liquidity-related unless verified project news appears. A break below the recent 0.003390 low could expose the market to a test of the scanner’s 0.003354 support and then the listed downside references. A fast recovery above 0.003427 to 0.003441 could instead signal that sellers are losing control, particularly if it arrives with strong volume.
𝗥𝗶𝘀𝗸𝘀, 𝘄𝗲𝗮𝗸𝗻𝗲𝘀𝘀𝗲𝘀 𝗮𝗻𝗱 𝘄𝗵𝗮𝘁 𝘁𝗼 𝘄𝗮𝘁𝗰𝗵 𝗻𝗲𝘅𝘁
The first risk is dilution. Only about 21.6% of the maximum supply is listed as circulating, and the research does not provide the unlock schedule. Future token releases may create selling pressure or reduce the value of each circulating token if demand does not keep pace.
The second risk is the distance between the project narrative and verified operating evidence. Tria presents an ambitious product spanning payments, trading, earning, cross-chain execution and institutional infrastructure. Yet the available data does not confirm the scale of live usage, revenue, liquidity depth, number of card users, security audits or the exact role of TRIA inside the product. The token utility question remains open.
The third risk is market structure. The token is down sharply across nearly every measured period, trades close to its all-time low and has a market capitalization in the single-digit millions. Those conditions can produce both cascading declines and violent rebounds. Open interest is recorded at 884,838,402 TRIA, but the research does not state whether that figure refers to a specific derivatives venue or explain the leverage distribution. It therefore cannot be used alone to estimate liquidation risk.
The practical watchlist is clear. First, monitor whether price holds the 0.003390 recent low and the scanner’s 0.003354 support. Second, watch the 0.003427 resistance and 0.003441 invalidation area for a sustained reclaim rather than a brief wick. Third, compare any move with volume: a breakdown on expanding volume would support continuation, while a rebound with improving volume could challenge the bearish structure. Fourth, track Bitcoin around its 76,350 to 77,427 range. Finally, look for verified token-unlock information, product usage data and official updates that could change the fundamental picture.
𝗕𝗮𝗹𝗮𝗻𝗰𝗲𝗱 𝗰𝗼𝗻𝗰𝗹𝘂𝘀𝗶𝗼𝗻: 𝗮 𝗿𝗲𝗮𝗹 𝗽𝗿𝗼𝗱𝘂𝗰𝘁 𝗶𝗱𝗲𝗮 𝗳𝗮𝗰𝗶𝗻𝗴 𝗮 𝗱𝗶𝗳𝗳𝗶𝗰𝘂𝗹𝘁 𝘁𝗼𝗸𝗲𝗻 𝗺𝗮𝗿𝗸𝗲𝘁
TRIA is not merely a chart symbol. The project is trying to simplify cross-chain money through a self-custodial neobank model, card spending, swaps, perpetual futures, earning products and an execution layer called BestPath. That is a coherent problem to solve, and the ecosystem positioning spans both consumer and developer use cases.
The token, however, is currently telling a much weaker story. TRIAUSDT is down about 7% in 24 hours, more than 22% in seven days and nearly 59% over 30 days. The candles show lower highs, repeated failures to hold rebounds and trading close to the recent all-time low. The scanner’s 96.69% short confidence reflects that alignment of momentum, location and volume, with 0.003427 to 0.003441 acting as the key area that could challenge the bearish setup.
The constructive case depends on evidence that the product is gaining real adoption, that token utility is meaningful and that future supply releases are manageable. The bearish case is built on sustained technical weakness, limited verified information about adoption, a large gap between circulating supply and maximum supply, and the vulnerability of a small-cap asset in a soft market.
For now, the most useful conclusion is not that TRIA must rise or fall. It is that the pair is at a high-volatility decision point. Holding the support area could produce a relief bounce, while failure there could extend the decline toward the scanner’s lower levels. A durable recovery above resistance would force a reassessment of the short structure. The next important clues should come from price behavior, volume, Bitcoin’s direction and verified project information rather than from the headline narrative alone.
TRIA Price Analysis: Weak Momentum Puts 0.003354 Support in Focus
𝗧𝗵𝗲 𝗳𝗶𝗿𝘀𝘁 𝘀𝗶𝗴𝗻𝗮𝗹 𝗶𝘀 𝘄𝗲𝗮𝗸𝗻𝗲𝘀𝘀, 𝗻𝗼𝘁 𝗲𝘅𝗰𝗶𝘁𝗲𝗺𝗲𝗻𝘁
TRIAUSDT has entered the scanner at a moment when the chart is already showing clear damage. The RR Trader scanner classified TRIAUSDT as a SHORT setup with 96.69% confidence, placing it in the TOP_LOSER group at rank 30. That is not a prediction of what must happen next, but it explains why this pair deserves attention right now: price is falling, selling activity is elevated, and the market is sitting close to a clearly defined technical decision zone.
Market data places TRIA near 0.003414 to 0.003418 USDT, depending on the source and snapshot time. Binance data shows a 24-hour change of roughly -6.94%, while CoinGecko reports a decline of about -7.32%. The small difference is consistent with prices being recorded from different venues and at slightly different times. The broader message is consistent across both datasets: TRIA has been under heavy pressure.
𝗪𝗵𝗮𝘁 𝗧𝗿𝗶𝗮 𝗶𝘀 𝘁𝗿𝘆𝗶𝗻𝗴 𝘁𝗼 𝗯𝘂𝗶𝗹𝗱
Tria describes itself as a self-custodial neobank and cross-chain payments infrastructure. Its stated goal is to make onchain money feel more like everyday money, without forcing users to understand bridges, network switching, gas management or the technical details behind each transaction. The product vision combines spending, trading, sending and earning in one account experience.
The core system is called BestPath. According to the project description, BestPath is a routing and execution layer designed to take a user intent such as spend, swap, send or earn and complete the action through an appropriate path across chains. In practical terms, the problem Tria is addressing is fragmentation: assets may exist on different networks, liquidity is split between ecosystems, and users often have to perform several technical steps before completing a payment or trade.
The project operates across two broad layers. The consumer-facing layer includes a Visa-powered card, spot swaps, perpetual futures and Earn vaults. The other layer is aimed at developers and institutions, allowing outside protocols and ecosystems to integrate Tria’s execution rails. These are claims from the supplied project description. The research does not provide independent usage figures, revenue data or adoption statistics.
𝗕𝗮𝗰𝗸𝗴𝗿𝗼𝘂𝗻𝗱, 𝘁𝗼𝗸𝗲𝗻 𝗿𝗼𝗹𝗲 𝗮𝗻𝗱 𝗲𝗰𝗼𝘀𝘆𝘀𝘁𝗲𝗺 𝗿𝗲𝗮𝗰𝗵
A detailed founding history, named founding team and verified launch timeline are not available in the supplied research. The available project identity is linked to the Tria brand and the official social handle listed in the data, but there is not enough information here to responsibly describe who created the project, how much funding it raised or which investors support it.
TRIA is represented on Ethereum and BNB Chain through the contract records included in the research. CoinGecko categorizes the project across DeFi, wallets, the Ethereum ecosystem, the BNB Chain ecosystem, neobanks and Binance Alpha Spotlight. Those categories show how the token is positioned, but category labels should not be confused with proof of deep integration or large-scale user activity.
The token’s exact utility is not fully specified in the supplied material. The broader Tria product has payment, trading, earning and routing functions, but the research does not confirm which of those functions require TRIA, whether the token is used for fee discounts, governance, staking, incentives or settlement, or how much demand is generated by actual product usage. That distinction matters. A useful application can exist while the investment case for its token remains uncertain.
𝗦𝘂𝗽𝗽𝗹𝘆 𝗮𝗻𝗱 𝘃𝗮𝗹𝘂𝗮𝘁𝗶𝗼𝗻 𝗰𝗼𝗻𝘁𝗲𝘅𝘁 𝗱𝗲𝘀𝗲𝗿𝘃𝗲 𝗰𝗮𝘂𝘁𝗶𝗼𝗻
The token data lists a maximum and total supply of 10 billion TRIA. Circulating supply is recorded at 2.15767 billion tokens, or about 21.6% of the maximum supply. CoinGecko reports a market capitalization near 7.35 million dollars and a fully diluted valuation near 34.08 million dollars. The reported market-cap-to-FDV ratio is 0.22, reflecting the gap between circulating tokens and the full supply.
That supply structure is one of the most important facts in the TRIA story. If the remaining tokens enter circulation over time, the market may face dilution unless demand grows at a similar pace. The research does not include an unlock calendar, vesting schedule, allocation breakdown or information about treasury holdings. Without those details, it is impossible to say when supply pressure may appear or which holders might be able to sell.
The valuation is also small relative to the reported trading activity. Binance recorded approximately 3.62 million USDT in 24-hour quote volume, while CoinGecko recorded approximately 1.48 million dollars in total volume at its snapshot time. This activity is sufficient for sharp moves, but a small market capitalization can also mean that liquidity is fragile. Large orders, forced positions or concentrated holders may have an outsized effect on price.
𝗧𝗵𝗲 𝗰𝗵𝗮𝗿𝘁 𝗵𝗮𝘀 𝘀𝗵𝗶𝗳𝘁𝗲𝗱 𝗳𝗿𝗼𝗺 𝗮 𝗽𝘂𝗹𝗹𝗯𝗮𝗰𝗸 𝗶𝗻𝘁𝗼 𝗮 𝗱𝗮𝗺𝗮𝗴𝗲𝗱 𝘀𝘁𝗿𝘂𝗰𝘁𝘂𝗿𝗲
The Binance ticker shows TRIAUSDT opening the 24-hour period near 0.003673 and trading as high as 0.003679 before falling to about 0.003390. The latest recorded price is close to 0.003418. That creates a wide intraday range and leaves price near the lower end of the session. The weighted average price is 0.0035251, so the last price is trading well below the average level at which much of the reported volume changed hands.
The hourly candles show a steady deterioration rather than one isolated drop. Early candles traded around 0.00365 to 0.00368, then successive closes moved through 0.00353, 0.00349, 0.00346, 0.00343 and 0.00341. There were brief rebounds, including a move from a 0.003423 low to a 0.003492 close and another recovery toward 0.003556, but those bounces did not produce a lasting trend reversal.
The four-hour structure tells the same story on a larger scale. TRIA traded between approximately 0.003834 and 0.003616 in one earlier block, then fell through the 0.0037 area. A later rebound reached 0.003572, but the market subsequently printed a low of 0.003390. This sequence suggests lower highs and lower reaction lows. That is an interpretation of the supplied candles, not a guarantee that the downtrend will continue.
Momentum outside the 24-hour window is also weak. CoinGecko reports declines of 22.75% over seven days, 35.04% over 14 days, 58.58% over 30 days, 58.92% over 60 days and 85.77% over 200 days. TRIA is also about 93.2% below its recorded all-time high of 0.050041 dollars. It recently recorded an all-time low of 0.00324452 dollars on September 9, 2026, which means the current price is only modestly above that low.
𝗪𝗵𝘆 𝘁𝗵𝗲 𝗥𝗥 𝗧𝗿𝗮𝗱𝗲𝗿 𝘀𝗰𝗮𝗻𝗻𝗲𝗿 𝗶𝘀 𝗶𝗻𝘁𝗲𝗿𝗲𝘀𝘁𝗲𝗱
The scanner’s short setup is built around several aligned observations. Its current price reference is 0.003414, with a support level at 0.003354 and resistance at 0.003427. The suggested entry zone is 0.003415707 to 0.003419121, almost exactly where the market was trading when the signal was generated. The scanner places an invalidation or stop reference at 0.003441312 and calculates a risk-reward value of 2.2154 based on its listed targets.
The downside reference points are 0.003366545 for the first target, 0.003341965 for the second and 0.003317384 for the third. These levels sit progressively below the recent market price and around the lower portion of the current range. The scanner also measured a 15-minute move of -3.48%, a volume ratio of 1.343 and a hot-list change of -7.228%. In plain English, TRIA was falling quickly enough to attract attention, while volume was running above its reference level.
The setup is interesting because the market is hovering close to resistance after a sharp decline. If price cannot reclaim 0.003427 and remains below the scanner’s invalidation level near 0.003441, sellers may continue testing the lower levels. However, this is exactly where short setups become vulnerable to a relief bounce. A move above 0.003441 would weaken the stated structure, while a stronger recovery through nearby intraday swing areas could invalidate the idea more broadly.
𝗕𝗶𝘁𝗰𝗼𝗶𝗻 𝗶𝘀 𝘀𝗼𝗳𝘁𝗲𝗿, 𝗯𝘂𝘁 𝗧𝗥𝗜𝗔 𝗶𝘀 𝗺𝗼𝘃𝗶𝗻𝗴 𝗺𝘂𝗰𝗵 𝗵𝗮𝗿𝗱𝗲𝗿
Bitcoin provides a useful market backdrop. BTCUSDT is recorded near 76,784.50 dollars, down about 0.58% over 24 hours, with a reported range from 76,350.10 to 77,427.40. Bitcoin is therefore also under pressure, but its decline is much smaller than TRIA’s roughly 7% drop.
That relative weakness is important. It suggests TRIA’s move cannot be explained only by a broad Bitcoin selloff. Smaller tokens often react more aggressively when market liquidity thins, and they can fall sharply even when Bitcoin is moving only modestly. The correlation may still increase if BTC breaks lower, but the present data shows TRIA underperforming Bitcoin rather than simply copying it.
The opposite scenario also matters. If Bitcoin stabilizes or recovers, TRIA could receive a short-term relief bid because heavily sold small-cap tokens can bounce quickly. A BTC rebound would not automatically repair TRIA’s damaged structure, but it could make continuation lower less orderly and increase the risk of a sudden squeeze.
𝗡𝗼 𝘃𝗲𝗿𝗶𝗳𝗶𝗲𝗱 𝗳𝗿𝗲𝘀𝗵 𝗰𝗮𝘁𝗮𝗹𝘆𝘀𝘁 𝗶𝘀 𝗮𝘃𝗮𝗶𝗹𝗮𝗯𝗹𝗲
The supplied research contains no recent verified news items for TRIA. There is no confirmed partnership announcement, product release, token unlock notice, exchange listing claim, governance event or protocol update that can be used as a current catalyst. That absence should not be interpreted as proof that nothing happened; it simply means the provided dataset does not verify a news-driven reason for the decline.
The project’s product description itself is a potential long-term narrative catalyst. A self-custodial account with card spending, cross-chain routing, swaps and earning products could attract attention if users adopt it and if the system performs reliably. Developer and institutional integrations could also increase the usefulness of the execution layer. At present, however, the research supplies no user counts, transaction volumes, fee revenue, active integrations or retention data to measure whether that potential is becoming reality.
For the next move, the most direct catalysts are likely to be technical and liquidity-related unless verified project news appears. A break below the recent 0.003390 low could expose the market to a test of the scanner’s 0.003354 support and then the listed downside references. A fast recovery above 0.003427 to 0.003441 could instead signal that sellers are losing control, particularly if it arrives with strong volume.
𝗥𝗶𝘀𝗸𝘀, 𝘄𝗲𝗮𝗸𝗻𝗲𝘀𝘀𝗲𝘀 𝗮𝗻𝗱 𝘄𝗵𝗮𝘁 𝘁𝗼 𝘄𝗮𝘁𝗰𝗵 𝗻𝗲𝘅𝘁
The first risk is dilution. Only about 21.6% of the maximum supply is listed as circulating, and the research does not provide the unlock schedule. Future token releases may create selling pressure or reduce the value of each circulating token if demand does not keep pace.
The second risk is the distance between the project narrative and verified operating evidence. Tria presents an ambitious product spanning payments, trading, earning, cross-chain execution and institutional infrastructure. Yet the available data does not confirm the scale of live usage, revenue, liquidity depth, number of card users, security audits or the exact role of TRIA inside the product. The token utility question remains open.
The third risk is market structure. The token is down sharply across nearly every measured period, trades close to its all-time low and has a market capitalization in the single-digit millions. Those conditions can produce both cascading declines and violent rebounds. Open interest is recorded at 884,838,402 TRIA, but the research does not state whether that figure refers to a specific derivatives venue or explain the leverage distribution. It therefore cannot be used alone to estimate liquidation risk.
The practical watchlist is clear. First, monitor whether price holds the 0.003390 recent low and the scanner’s 0.003354 support. Second, watch the 0.003427 resistance and 0.003441 invalidation area for a sustained reclaim rather than a brief wick. Third, compare any move with volume: a breakdown on expanding volume would support continuation, while a rebound with improving volume could challenge the bearish structure. Fourth, track Bitcoin around its 76,350 to 77,427 range. Finally, look for verified token-unlock information, product usage data and official updates that could change the fundamental picture.
𝗕𝗮𝗹𝗮𝗻𝗰𝗲𝗱 𝗰𝗼𝗻𝗰𝗹𝘂𝘀𝗶𝗼𝗻: 𝗮 𝗿𝗲𝗮𝗹 𝗽𝗿𝗼𝗱𝘂𝗰𝘁 𝗶𝗱𝗲𝗮 𝗳𝗮𝗰𝗶𝗻𝗴 𝗮 𝗱𝗶𝗳𝗳𝗶𝗰𝘂𝗹𝘁 𝘁𝗼𝗸𝗲𝗻 𝗺𝗮𝗿𝗸𝗲𝘁
TRIA is not merely a chart symbol. The project is trying to simplify cross-chain money through a self-custodial neobank model, card spending, swaps, perpetual futures, earning products and an execution layer called BestPath. That is a coherent problem to solve, and the ecosystem positioning spans both consumer and developer use cases.
The token, however, is currently telling a much weaker story. TRIAUSDT is down about 7% in 24 hours, more than 22% in seven days and nearly 59% over 30 days. The candles show lower highs, repeated failures to hold rebounds and trading close to the recent all-time low. The scanner’s 96.69% short confidence reflects that alignment of momentum, location and volume, with 0.003427 to 0.003441 acting as the key area that could challenge the bearish setup.
The constructive case depends on evidence that the product is gaining real adoption, that token utility is meaningful and that future supply releases are manageable. The bearish case is built on sustained technical weakness, limited verified information about adoption, a large gap between circulating supply and maximum supply, and the vulnerability of a small-cap asset in a soft market.
For now, the most useful conclusion is not that TRIA must rise or fall. It is that the pair is at a high-volatility decision point. Holding the support area could produce a relief bounce, while failure there could extend the decline toward the scanner’s lower levels. A durable recovery above resistance would force a reassessment of the short structure. The next important clues should come from price behavior, volume, Bitcoin’s direction and verified project information rather than from the headline narrative alone.
TRIAUSDT has entered the scanner at a moment when the chart is already showing clear damage. The RR Trader scanner classified TRIAUSDT as a SHORT setup with 96.69% confidence, placing it in the TOP_LOSER group at rank 30. That is not a prediction of what must happen next, but it explains why this pair deserves attention right now: price is falling, selling activity is elevated, and the market is sitting close to a clearly defined technical decision zone.
Market data places TRIA near 0.003414 to 0.003418 USDT, depending on the source and snapshot time. Binance data shows a 24-hour change of roughly -6.94%, while CoinGecko reports a decline of about -7.32%. The small difference is consistent with prices being recorded from different venues and at slightly different times. The broader message is consistent across both datasets: TRIA has been under heavy pressure.
𝗪𝗵𝗮𝘁 𝗧𝗿𝗶𝗮 𝗶𝘀 𝘁𝗿𝘆𝗶𝗻𝗴 𝘁𝗼 𝗯𝘂𝗶𝗹𝗱
Tria describes itself as a self-custodial neobank and cross-chain payments infrastructure. Its stated goal is to make onchain money feel more like everyday money, without forcing users to understand bridges, network switching, gas management or the technical details behind each transaction. The product vision combines spending, trading, sending and earning in one account experience.
The core system is called BestPath. According to the project description, BestPath is a routing and execution layer designed to take a user intent such as spend, swap, send or earn and complete the action through an appropriate path across chains. In practical terms, the problem Tria is addressing is fragmentation: assets may exist on different networks, liquidity is split between ecosystems, and users often have to perform several technical steps before completing a payment or trade.
The project operates across two broad layers. The consumer-facing layer includes a Visa-powered card, spot swaps, perpetual futures and Earn vaults. The other layer is aimed at developers and institutions, allowing outside protocols and ecosystems to integrate Tria’s execution rails. These are claims from the supplied project description. The research does not provide independent usage figures, revenue data or adoption statistics.
𝗕𝗮𝗰𝗸𝗴𝗿𝗼𝘂𝗻𝗱, 𝘁𝗼𝗸𝗲𝗻 𝗿𝗼𝗹𝗲 𝗮𝗻𝗱 𝗲𝗰𝗼𝘀𝘆𝘀𝘁𝗲𝗺 𝗿𝗲𝗮𝗰𝗵
A detailed founding history, named founding team and verified launch timeline are not available in the supplied research. The available project identity is linked to the Tria brand and the official social handle listed in the data, but there is not enough information here to responsibly describe who created the project, how much funding it raised or which investors support it.
TRIA is represented on Ethereum and BNB Chain through the contract records included in the research. CoinGecko categorizes the project across DeFi, wallets, the Ethereum ecosystem, the BNB Chain ecosystem, neobanks and Binance Alpha Spotlight. Those categories show how the token is positioned, but category labels should not be confused with proof of deep integration or large-scale user activity.
The token’s exact utility is not fully specified in the supplied material. The broader Tria product has payment, trading, earning and routing functions, but the research does not confirm which of those functions require TRIA, whether the token is used for fee discounts, governance, staking, incentives or settlement, or how much demand is generated by actual product usage. That distinction matters. A useful application can exist while the investment case for its token remains uncertain.
𝗦𝘂𝗽𝗽𝗹𝘆 𝗮𝗻𝗱 𝘃𝗮𝗹𝘂𝗮𝘁𝗶𝗼𝗻 𝗰𝗼𝗻𝘁𝗲𝘅𝘁 𝗱𝗲𝘀𝗲𝗿𝘃𝗲 𝗰𝗮𝘂𝘁𝗶𝗼𝗻
The token data lists a maximum and total supply of 10 billion TRIA. Circulating supply is recorded at 2.15767 billion tokens, or about 21.6% of the maximum supply. CoinGecko reports a market capitalization near 7.35 million dollars and a fully diluted valuation near 34.08 million dollars. The reported market-cap-to-FDV ratio is 0.22, reflecting the gap between circulating tokens and the full supply.
That supply structure is one of the most important facts in the TRIA story. If the remaining tokens enter circulation over time, the market may face dilution unless demand grows at a similar pace. The research does not include an unlock calendar, vesting schedule, allocation breakdown or information about treasury holdings. Without those details, it is impossible to say when supply pressure may appear or which holders might be able to sell.
The valuation is also small relative to the reported trading activity. Binance recorded approximately 3.62 million USDT in 24-hour quote volume, while CoinGecko recorded approximately 1.48 million dollars in total volume at its snapshot time. This activity is sufficient for sharp moves, but a small market capitalization can also mean that liquidity is fragile. Large orders, forced positions or concentrated holders may have an outsized effect on price.
𝗧𝗵𝗲 𝗰𝗵𝗮𝗿𝘁 𝗵𝗮𝘀 𝘀𝗵𝗶𝗳𝘁𝗲𝗱 𝗳𝗿𝗼𝗺 𝗮 𝗽𝘂𝗹𝗹𝗯𝗮𝗰𝗸 𝗶𝗻𝘁𝗼 𝗮 𝗱𝗮𝗺𝗮𝗴𝗲𝗱 𝘀𝘁𝗿𝘂𝗰𝘁𝘂𝗿𝗲
The Binance ticker shows TRIAUSDT opening the 24-hour period near 0.003673 and trading as high as 0.003679 before falling to about 0.003390. The latest recorded price is close to 0.003418. That creates a wide intraday range and leaves price near the lower end of the session. The weighted average price is 0.0035251, so the last price is trading well below the average level at which much of the reported volume changed hands.
The hourly candles show a steady deterioration rather than one isolated drop. Early candles traded around 0.00365 to 0.00368, then successive closes moved through 0.00353, 0.00349, 0.00346, 0.00343 and 0.00341. There were brief rebounds, including a move from a 0.003423 low to a 0.003492 close and another recovery toward 0.003556, but those bounces did not produce a lasting trend reversal.
The four-hour structure tells the same story on a larger scale. TRIA traded between approximately 0.003834 and 0.003616 in one earlier block, then fell through the 0.0037 area. A later rebound reached 0.003572, but the market subsequently printed a low of 0.003390. This sequence suggests lower highs and lower reaction lows. That is an interpretation of the supplied candles, not a guarantee that the downtrend will continue.
Momentum outside the 24-hour window is also weak. CoinGecko reports declines of 22.75% over seven days, 35.04% over 14 days, 58.58% over 30 days, 58.92% over 60 days and 85.77% over 200 days. TRIA is also about 93.2% below its recorded all-time high of 0.050041 dollars. It recently recorded an all-time low of 0.00324452 dollars on September 9, 2026, which means the current price is only modestly above that low.
𝗪𝗵𝘆 𝘁𝗵𝗲 𝗥𝗥 𝗧𝗿𝗮𝗱𝗲𝗿 𝘀𝗰𝗮𝗻𝗻𝗲𝗿 𝗶𝘀 𝗶𝗻𝘁𝗲𝗿𝗲𝘀𝘁𝗲𝗱
The scanner’s short setup is built around several aligned observations. Its current price reference is 0.003414, with a support level at 0.003354 and resistance at 0.003427. The suggested entry zone is 0.003415707 to 0.003419121, almost exactly where the market was trading when the signal was generated. The scanner places an invalidation or stop reference at 0.003441312 and calculates a risk-reward value of 2.2154 based on its listed targets.
The downside reference points are 0.003366545 for the first target, 0.003341965 for the second and 0.003317384 for the third. These levels sit progressively below the recent market price and around the lower portion of the current range. The scanner also measured a 15-minute move of -3.48%, a volume ratio of 1.343 and a hot-list change of -7.228%. In plain English, TRIA was falling quickly enough to attract attention, while volume was running above its reference level.
The setup is interesting because the market is hovering close to resistance after a sharp decline. If price cannot reclaim 0.003427 and remains below the scanner’s invalidation level near 0.003441, sellers may continue testing the lower levels. However, this is exactly where short setups become vulnerable to a relief bounce. A move above 0.003441 would weaken the stated structure, while a stronger recovery through nearby intraday swing areas could invalidate the idea more broadly.
𝗕𝗶𝘁𝗰𝗼𝗶𝗻 𝗶𝘀 𝘀𝗼𝗳𝘁𝗲𝗿, 𝗯𝘂𝘁 𝗧𝗥𝗜𝗔 𝗶𝘀 𝗺𝗼𝘃𝗶𝗻𝗴 𝗺𝘂𝗰𝗵 𝗵𝗮𝗿𝗱𝗲𝗿
Bitcoin provides a useful market backdrop. BTCUSDT is recorded near 76,784.50 dollars, down about 0.58% over 24 hours, with a reported range from 76,350.10 to 77,427.40. Bitcoin is therefore also under pressure, but its decline is much smaller than TRIA’s roughly 7% drop.
That relative weakness is important. It suggests TRIA’s move cannot be explained only by a broad Bitcoin selloff. Smaller tokens often react more aggressively when market liquidity thins, and they can fall sharply even when Bitcoin is moving only modestly. The correlation may still increase if BTC breaks lower, but the present data shows TRIA underperforming Bitcoin rather than simply copying it.
The opposite scenario also matters. If Bitcoin stabilizes or recovers, TRIA could receive a short-term relief bid because heavily sold small-cap tokens can bounce quickly. A BTC rebound would not automatically repair TRIA’s damaged structure, but it could make continuation lower less orderly and increase the risk of a sudden squeeze.
𝗡𝗼 𝘃𝗲𝗿𝗶𝗳𝗶𝗲𝗱 𝗳𝗿𝗲𝘀𝗵 𝗰𝗮𝘁𝗮𝗹𝘆𝘀𝘁 𝗶𝘀 𝗮𝘃𝗮𝗶𝗹𝗮𝗯𝗹𝗲
The supplied research contains no recent verified news items for TRIA. There is no confirmed partnership announcement, product release, token unlock notice, exchange listing claim, governance event or protocol update that can be used as a current catalyst. That absence should not be interpreted as proof that nothing happened; it simply means the provided dataset does not verify a news-driven reason for the decline.
The project’s product description itself is a potential long-term narrative catalyst. A self-custodial account with card spending, cross-chain routing, swaps and earning products could attract attention if users adopt it and if the system performs reliably. Developer and institutional integrations could also increase the usefulness of the execution layer. At present, however, the research supplies no user counts, transaction volumes, fee revenue, active integrations or retention data to measure whether that potential is becoming reality.
For the next move, the most direct catalysts are likely to be technical and liquidity-related unless verified project news appears. A break below the recent 0.003390 low could expose the market to a test of the scanner’s 0.003354 support and then the listed downside references. A fast recovery above 0.003427 to 0.003441 could instead signal that sellers are losing control, particularly if it arrives with strong volume.
𝗥𝗶𝘀𝗸𝘀, 𝘄𝗲𝗮𝗸𝗻𝗲𝘀𝘀𝗲𝘀 𝗮𝗻𝗱 𝘄𝗵𝗮𝘁 𝘁𝗼 𝘄𝗮𝘁𝗰𝗵 𝗻𝗲𝘅𝘁
The first risk is dilution. Only about 21.6% of the maximum supply is listed as circulating, and the research does not provide the unlock schedule. Future token releases may create selling pressure or reduce the value of each circulating token if demand does not keep pace.
The second risk is the distance between the project narrative and verified operating evidence. Tria presents an ambitious product spanning payments, trading, earning, cross-chain execution and institutional infrastructure. Yet the available data does not confirm the scale of live usage, revenue, liquidity depth, number of card users, security audits or the exact role of TRIA inside the product. The token utility question remains open.
The third risk is market structure. The token is down sharply across nearly every measured period, trades close to its all-time low and has a market capitalization in the single-digit millions. Those conditions can produce both cascading declines and violent rebounds. Open interest is recorded at 884,838,402 TRIA, but the research does not state whether that figure refers to a specific derivatives venue or explain the leverage distribution. It therefore cannot be used alone to estimate liquidation risk.
The practical watchlist is clear. First, monitor whether price holds the 0.003390 recent low and the scanner’s 0.003354 support. Second, watch the 0.003427 resistance and 0.003441 invalidation area for a sustained reclaim rather than a brief wick. Third, compare any move with volume: a breakdown on expanding volume would support continuation, while a rebound with improving volume could challenge the bearish structure. Fourth, track Bitcoin around its 76,350 to 77,427 range. Finally, look for verified token-unlock information, product usage data and official updates that could change the fundamental picture.
𝗕𝗮𝗹𝗮𝗻𝗰𝗲𝗱 𝗰𝗼𝗻𝗰𝗹𝘂𝘀𝗶𝗼𝗻: 𝗮 𝗿𝗲𝗮𝗹 𝗽𝗿𝗼𝗱𝘂𝗰𝘁 𝗶𝗱𝗲𝗮 𝗳𝗮𝗰𝗶𝗻𝗴 𝗮 𝗱𝗶𝗳𝗳𝗶𝗰𝘂𝗹𝘁 𝘁𝗼𝗸𝗲𝗻 𝗺𝗮𝗿𝗸𝗲𝘁
TRIA is not merely a chart symbol. The project is trying to simplify cross-chain money through a self-custodial neobank model, card spending, swaps, perpetual futures, earning products and an execution layer called BestPath. That is a coherent problem to solve, and the ecosystem positioning spans both consumer and developer use cases.
The token, however, is currently telling a much weaker story. TRIAUSDT is down about 7% in 24 hours, more than 22% in seven days and nearly 59% over 30 days. The candles show lower highs, repeated failures to hold rebounds and trading close to the recent all-time low. The scanner’s 96.69% short confidence reflects that alignment of momentum, location and volume, with 0.003427 to 0.003441 acting as the key area that could challenge the bearish setup.
The constructive case depends on evidence that the product is gaining real adoption, that token utility is meaningful and that future supply releases are manageable. The bearish case is built on sustained technical weakness, limited verified information about adoption, a large gap between circulating supply and maximum supply, and the vulnerability of a small-cap asset in a soft market.
For now, the most useful conclusion is not that TRIA must rise or fall. It is that the pair is at a high-volatility decision point. Holding the support area could produce a relief bounce, while failure there could extend the decline toward the scanner’s lower levels. A durable recovery above resistance would force a reassessment of the short structure. The next important clues should come from price behavior, volume, Bitcoin’s direction and verified project information rather than from the headline narrative alone.
556
·
--
Heads up… 🚨 $KAVA DOWN!
Entry: 0.061091 - 0.061152
SL: 0.061334
TP1: 0.060725 | TP2: 0.060542 | TP3: 0.060359
Heads up… 🚨 $KAVA DOWN!
Entry: 0.061091 - 0.061152
SL: 0.061334
TP1: 0.060725 | TP2: 0.060542 | TP3: 0.060359
Entry: 0.061091 - 0.061152
SL: 0.061334
TP1: 0.060725 | TP2: 0.060542 | TP3: 0.060359
476
·
--
Look at $VTHO … 👀🚨 UP setup!
Entry: 0.000797003 - 0.000797801
SL: 0.000791814
TP1: 0.000809295 | TP2: 0.000815042 | TP3: 0.000820789
Look at $VTHO … 👀🚨 UP setup!
Entry: 0.000797003 - 0.000797801
SL: 0.000791814
TP1: 0.000809295 | TP2: 0.000815042 | TP3: 0.000820789
Entry: 0.000797003 - 0.000797801
SL: 0.000791814
TP1: 0.000809295 | TP2: 0.000815042 | TP3: 0.000820789
1
401
·
--
Wait… $ALCH is getting serious! ⚡ DOWN!
Entry: 0.035118 - 0.035153
SL: 0.03522
TP1: 0.03496 | TP2: 0.034881 | TP3: 0.034802
Wait… $ALCH is getting serious! ⚡ DOWN!
Entry: 0.035118 - 0.035153
SL: 0.03522
TP1: 0.03496 | TP2: 0.034881 | TP3: 0.034802
Entry: 0.035118 - 0.035153
SL: 0.03522
TP1: 0.03496 | TP2: 0.034881 | TP3: 0.034802
3
311
·
--
Don’t miss $LAB … ‼️ DOWN move!
Entry: 0.05973 - 0.05979
SL: 0.06008
TP1: 0.059098 | TP2: 0.058782 | TP3: 0.058466
Don’t miss $LAB … ‼️ DOWN move!
Entry: 0.05973 - 0.05979
SL: 0.06008
TP1: 0.059098 | TP2: 0.058782 | TP3: 0.058466
Entry: 0.05973 - 0.05979
SL: 0.06008
TP1: 0.059098 | TP2: 0.058782 | TP3: 0.058466
301
·
--
RIVERUSDT: Sharp Weakness Meets an Ambitious Cross-Chain Stablecoin Design𝗧𝗵𝗲 𝗯𝗶𝗴 𝗽𝗶𝗰𝘁𝘂𝗿𝗲
RIVERUSDT is presenting two very different stories at the same time. The market story is dominated by a steep decline, a succession of lower prices and a short-term scanner setup that points toward possible continuation. The project story is centered on River’s stated effort to build a chain-abstraction stablecoin system for cross-chain collateral, yield and liquidity without requiring users to bridge assets manually.
Those narratives should be considered separately. A promising protocol design does not automatically create short-term token demand, while a weak chart does not by itself establish that the underlying project is failing. The available data shows severe price pressure, but it does not identify a single confirmed reason for that pressure.
The RR Trader scanner selected RIVERUSDT as a short-direction setup with a confidence score of 100 in its own model. It ranked third in the TOP_LOSER category and reported a 15-minute move of approximately minus 0.999 percent. At the scanner snapshot, the price was 1.189 USDT. The model identified an entry area between 1.1895945 and 1.1907835, resistance at 1.195, support at 1.1828505, an invalidation stop level at 1.198585, and downside reference levels at 1.1724729, 1.1639121 and 1.1553513.
These are model-derived reference points rather than guaranteed outcomes. The key question is whether the market is still building downside momentum or whether the sharp decline has already created conditions for a fast relief bounce.
𝗪𝗵𝗮𝘁 𝗥𝗶𝘃𝗲𝗿 𝗶𝘀 𝗯𝘂𝗶𝗹𝗱𝗶𝗻𝗴
The supplied project description identifies River as a chain-abstraction stablecoin system. Its stated purpose is to make cross-chain collateral, yield and liquidity available across different ecosystems without traditional asset bridging.
The central product is satUSD, described as an omni-CDP stablecoin. River’s stated design allows a user to collateralize assets on Chain A and mint satUSD on Chain B without bridging the original collateral. In practical terms, the architecture is intended to address the fragmentation that can occur when liquidity and collateral are spread across separate blockchain networks.
The project description also says that users can earn, leverage and scale across ecosystems natively through the satUSD system. These statements describe River’s intended functionality, but the supplied research does not provide a complete record of live usage, satUSD supply, collateral composition, liquidation performance or user activity.
That distinction is important. The available material supports describing the protocol concept and its stated objective. It does not support concluding that the system has achieved broad adoption, that its collateral design has been tested through every market condition or that its cross-chain operation is free from technical risk.
The research also does not include a detailed audit history, information about collateral parameters, a full liquidation framework or evidence about the reliability of redemptions. Those areas remain relevant when assessing any collateralized stablecoin system, particularly one designed to operate across multiple ecosystems.
𝗧𝗼𝗸𝗲𝗻 𝗿𝗼𝗹𝗲 𝗮𝗻𝗱 𝗲𝗰𝗼𝘀𝘆𝘀𝘁𝗲𝗺 𝗰𝗼𝗻𝘁𝗲𝘅𝘁
The available data identifies RIVER as the token associated with the River ecosystem. It does not provide a complete official schedule of token functions. The supplied material does not confirm whether RIVER is used for governance, staking, fee payment, collateral incentives, protocol revenue or another specific purpose.
That gap matters because association with a decentralized-finance protocol does not, on its own, establish a token’s utility. A clear and active role could influence demand, but the research provided here does not document such a role in enough detail to make that conclusion.
Market-data categories associated with the asset include BNB Chain Ecosystem, Base Ecosystem, Chain Abstraction, Binance Alpha Spotlight, Binance Wallet IDO, Binance Buildkey TGE and Base Native. These labels describe how the asset is categorized in the supplied market-data record. They do not prove that every named ecosystem currently has deep liquidity, significant usage or active River products.
The metadata also references the River brand and a Satoshi Protocol developer identity in its listed project links. However, the research does not provide a detailed founding history, named founders, a verified funding background or a complete launch timeline. Those subjects should therefore remain open rather than being filled with assumptions.
For the token, the main fundamental questions are straightforward but unresolved: whether satUSD usage is growing, whether River’s stated cross-chain design is being used in practice, whether the collateral system remains resilient, and whether RIVER has a clearly defined function that creates ongoing demand.
𝗦𝘂𝗽𝗽𝗹𝘆 𝗱𝗮𝘁𝗮 𝗮𝗻𝗱 𝘃𝗮𝗹𝘂𝗮𝘁𝗶𝗼𝗻
The token record reports a maximum supply and total supply of 100 million RIVER. Circulating supply is listed at 19.6 million, while outstanding supply is reported as 91.111 million. These figures imply very different views of how much supply is currently available, and the supplied research does not explain the difference.
Using the reported circulating figure, the market capitalization is approximately 22.44 million USDT. The supplied CoinGecko snapshot places the asset at market-cap rank 787. Fully diluted valuation is reported at approximately 114.49 million USDT, while the market-cap-to-FDV ratio is listed at 0.20.
The same dataset reports outstanding token value of approximately 104.47 million USDT. The market-cap and FDV figures are mathematically consistent with a relatively small circulating amount compared with the maximum supply, but the outstanding-supply number introduces an important data-quality question.
The discrepancy could reflect different definitions, locked allocations or data-provider methodology. The available research does not state which explanation is correct. As a result, the valuation figures should be viewed as provisional rather than as a complete picture of dilution risk.
If a substantial amount of supply can eventually enter the market, future distributions or unlocks could influence price. The research does not provide an unlock schedule, allocation breakdown or confirmed distribution timetable, so the timing and scale of any potential supply-related pressure cannot be established from the supplied information.
The reported market-cap-to-TVL ratio is 0.23, based on market capitalization of approximately 22.44 million USDT and reported total value locked of approximately 96.54 million USDT. That comparison may be useful for context, but TVL is not the same as revenue, token demand or user growth. The supplied data does not show how much of the reported TVL is actively used or what portion is exposed to different collateral risks.
𝗣𝗿𝗶𝗰𝗲 𝗮𝗰𝘁𝗶𝗼𝗻 𝗿𝗲𝘃𝗲𝗮𝗹𝘀 𝗵𝗲𝗮𝘃𝘆 𝘀𝗲𝗹𝗹𝗶𝗻𝗴
The Binance ticker snapshot reports a last price of 1.154 USDT, a 24-hour change of minus 17.865 percent, a high of 1.429 and a low of 1.125. Reported 24-hour volume is 27.093 million RIVER, equivalent to approximately 34.082 million USDT, with a weighted average price of 1.257951.
CoinGecko’s separate snapshot shows a price near 1.15 USDT, a 24-hour decline of 18.13299 percent, a high of 1.42, a low of 1.14 and total reported volume of approximately 4.714 million USDT. The difference between the exchange ticker and CoinGecko volume figures is substantial. It may reflect different venue coverage or reporting windows, but the research does not specify the cause.
The broader performance record is also weak. RIVER is reported down 10.46627 percent over seven days, 30.09162 percent over 14 days, 56.70709 percent over 30 days, 65.30434 percent over 60 days and 87.71778 percent over 200 days. The supplied all-time high is 87.73 USDT, recorded on January 26, 2026, leaving the asset approximately 98.69 percent below that level.
The reported all-time low is 1.048 USDT, recorded on September 10, 2026. With the market near 1.15 USDT in the supplied snapshots, price remains relatively close to that historical low.
The hourly candles show repeated lower highs from the 1.42 area toward the 1.17 region, followed by a sharp decline to 1.125. The latest hourly candle recovered from 1.144 to 1.152, but that rebound was modest compared with the preceding fall. On the four-hour chart, heavy downward candles appeared after a temporary move toward 1.535. The supplied candles therefore describe a volatile reversal rather than a stable upward trend.
𝗗𝗲𝗿𝗶𝘃𝗮𝘁𝗶𝘃𝗲𝘀 𝗮𝗻𝗱 𝘁𝗵𝗲 𝘀𝗵𝗼𝗿𝘁-𝘁𝗲𝗿𝗺 𝘀𝗲𝘁𝘂𝗽
The scanner’s bearish structure is concentrated around the 1.195 resistance area. Its planned entry band is between 1.1895945 and 1.1907835, with the invalidation level at 1.198585. This is a narrow range, meaning the model’s interpretation depends on price failing near the local recovery zone rather than reclaiming it decisively.
The scanner reports a risk-reward figure of 2.1946549 and maps downside levels at 1.1724729, 1.1639121 and 1.1553513. These levels come from the scanner and are not independently confirmed support zones. The third level is close to the Binance ticker price of 1.154, illustrating how quickly the market moved between the available data captures.
The scanner’s volume ratio is 0.638664, below one according to its comparison baseline. That reading indicates the immediate move was not accompanied by unusually high volume in the scanner’s measurement. It does not determine what happens next. A move with subdued relative volume can continue if selling activity increases, but it can also become vulnerable to a relief bounce if momentum fades.
The clearest bearish interpretation would involve rejection below 1.195, followed by a break of the 1.1828505 support reference and movement toward the lower scanner levels. A sustained recovery above 1.198585 would weaken that interpretation, particularly if price begins holding around or above 1.20 rather than producing only a brief upward wick.
Open interest is reported at 5.835 million RIVER. The supplied research does not include funding-rate history, liquidation data or a longer open-interest series. It is therefore not possible to determine whether the decline is being driven by new short exposure, the closure of long positions or another derivatives-related flow.
𝗕𝗶𝘁𝗰𝗼𝗶𝗻’𝘀 𝗺𝗼𝗿𝗲 𝗺𝗼𝗱𝗲𝘀𝘁 𝗱𝗲𝗰𝗹𝗶𝗻𝗲
Bitcoin is also lower in the supplied market snapshot, but its move is much smaller than RIVER’s. BTC is quoted at 76,727.60 USDT, down 0.647 percent over the 24-hour period. Its reported high is 77,427.40, its low is 76,458.90 and its 24-hour quote volume is approximately 5.008 billion USDT.
RIVER’s decline of roughly 18 percent is therefore substantially larger than Bitcoin’s decline of less than 1 percent. The available figures point to pronounced asset-specific weakness rather than a simple one-for-one reflection of the broader market move. The research does not identify whether that weakness is related to liquidity, token-specific selling, derivatives positioning, supply concerns or a loss of confidence.
Bitcoin’s modest weakness still does not create a supportive backdrop for a smaller asset already under pressure. If BTC moves below its supplied low near 76,458.90, speculative risk appetite could weaken further. If Bitcoin stabilizes or recovers, however, that would not automatically repair RIVER’s chart because RIVER’s own performance has been considerably worse across the supplied time periods.
𝗙𝘂𝗻𝗱𝗮𝗺𝗲𝗻𝘁𝗮𝗹 𝗰𝗮𝘁𝗮𝗹𝘆𝘀𝘁𝘀 𝗿𝗲𝗺𝗮𝗶𝗻 𝘂𝗻𝗰𝗼𝗻𝗳𝗶𝗿𝗺𝗲𝗱
The supplied news search does not contain a verified River protocol announcement, integration, governance decision, audit update or product launch. Its only listed result is an unrelated River Journal Online article about Bitcoin casino games. That item provides no confirmed information about the RIVER token or River’s protocol.
The project’s stated architecture is therefore the main fundamental narrative available in this research. Positive developments would need to be supported by verifiable evidence such as higher satUSD usage, additional supported chains, deeper liquidity, transparent audits, stronger collateral performance or a clearly documented token-utility update. None of those developments is confirmed as a current event in the supplied material.
The reported TVL of approximately 96.54 million USDT is notable relative to the reported market capitalization, but it should not be treated as direct evidence of revenue or sustained token demand. The research does not provide a TVL history, a breakdown of deposited assets or a measure of active users.
On the risk side, weak satUSD demand, collateral losses, smart-contract vulnerabilities, cross-chain messaging failures, insufficient liquidity or future token distributions could place additional pressure on the asset. These are relevant risk categories for the stated design, but the research does not confirm that any one of them is currently responsible for the price decline.
𝗞𝗲𝘆 𝗹𝗲𝘃𝗲𝗹𝘀 𝗮𝗻𝗱 𝗺𝗮𝗿𝗸𝗲𝘁 𝘀𝗶𝗴𝗻𝗮𝗹𝘀
The immediate scanner resistance is 1.195, with the invalidation level at 1.198585. A sustained move above that area would weaken the current bearish setup. The 1.20 region also serves as a nearby psychological reference because it is just above the scanner’s invalidation level.
The scanner support reference is 1.1828505. Below it, the model identifies 1.1724729, 1.1639121 and 1.1553513. The recent Binance low near 1.125 is a separate market-data reference and sits well below the third scanner level. A break under 1.125 would extend the recent price range lower, while a strong recovery from that area could indicate that selling pressure is being absorbed.
The combination of price and participation is more informative than either measure alone. A lower low with rising volume would be consistent with stronger continuation pressure. A lower low on falling relative volume followed by a quick recovery above 1.1828505 would suggest that immediate downside momentum may be fading. These are analytical interpretations, not predictions.
Further monitoring would require funding data, liquidation activity and a longer open-interest series, none of which is included in the supplied research. On the fundamental side, the most important unresolved checks are the actual circulating float, any supply-distribution schedule, satUSD usage, the quality of reported TVL, protocol security and confirmed River announcements.
𝗧𝗵𝗲 𝗯𝗮𝗹𝗮𝗻𝗰𝗲𝗱 𝘃𝗶𝗲𝘄
River’s stated goal is ambitious: use chain abstraction and the satUSD omni-CDP design to make collateral, yield and liquidity more accessible across ecosystems without requiring traditional bridging. That concept gives the project a clear area of focus and explains why it is connected with categories such as Chain Abstraction, Base Ecosystem and BNB Chain Ecosystem.
At the same time, the supplied market evidence is decisively weak. RIVER is near its reported historical low, has declined across every listed multi-day period, and has fallen much more sharply than Bitcoin during the reported 24-hour window. The scanner identifies a short-term bearish structure around 1.19, with 1.195 to 1.198585 serving as the main area where that interpretation would begin to weaken.
The principal uncertainties extend beyond price. Circulating and outstanding supply figures do not align cleanly, the market-cap-to-FDV gap is substantial, the exact token utility is not documented in the supplied material, and exchange and CoinGecko volume figures differ considerably. The available news does not provide a relevant confirmed catalyst.
The most accurate conclusion is not that River’s technology is invalid or that the decline must continue. It is that the market is demanding clearer evidence. A more durable recovery would require improved price structure alongside better visibility into supply, adoption, liquidity and protocol security. Until those questions are answered, RIVER remains a high-volatility asset in which scanner levels can provide short-term reference points, while abrupt reversals and liquidity-driven moves remain realistic possibilities.
RIVERUSDT: Sharp Weakness Meets an Ambitious Cross-Chain Stablecoin Design
𝗧𝗵𝗲 𝗯𝗶𝗴 𝗽𝗶𝗰𝘁𝘂𝗿𝗲
RIVERUSDT is presenting two very different stories at the same time. The market story is dominated by a steep decline, a succession of lower prices and a short-term scanner setup that points toward possible continuation. The project story is centered on River’s stated effort to build a chain-abstraction stablecoin system for cross-chain collateral, yield and liquidity without requiring users to bridge assets manually.
Those narratives should be considered separately. A promising protocol design does not automatically create short-term token demand, while a weak chart does not by itself establish that the underlying project is failing. The available data shows severe price pressure, but it does not identify a single confirmed reason for that pressure.
The RR Trader scanner selected RIVERUSDT as a short-direction setup with a confidence score of 100 in its own model. It ranked third in the TOP_LOSER category and reported a 15-minute move of approximately minus 0.999 percent. At the scanner snapshot, the price was 1.189 USDT. The model identified an entry area between 1.1895945 and 1.1907835, resistance at 1.195, support at 1.1828505, an invalidation stop level at 1.198585, and downside reference levels at 1.1724729, 1.1639121 and 1.1553513.
These are model-derived reference points rather than guaranteed outcomes. The key question is whether the market is still building downside momentum or whether the sharp decline has already created conditions for a fast relief bounce.
𝗪𝗵𝗮𝘁 𝗥𝗶𝘃𝗲𝗿 𝗶𝘀 𝗯𝘂𝗶𝗹𝗱𝗶𝗻𝗴
The supplied project description identifies River as a chain-abstraction stablecoin system. Its stated purpose is to make cross-chain collateral, yield and liquidity available across different ecosystems without traditional asset bridging.
The central product is satUSD, described as an omni-CDP stablecoin. River’s stated design allows a user to collateralize assets on Chain A and mint satUSD on Chain B without bridging the original collateral. In practical terms, the architecture is intended to address the fragmentation that can occur when liquidity and collateral are spread across separate blockchain networks.
The project description also says that users can earn, leverage and scale across ecosystems natively through the satUSD system. These statements describe River’s intended functionality, but the supplied research does not provide a complete record of live usage, satUSD supply, collateral composition, liquidation performance or user activity.
That distinction is important. The available material supports describing the protocol concept and its stated objective. It does not support concluding that the system has achieved broad adoption, that its collateral design has been tested through every market condition or that its cross-chain operation is free from technical risk.
The research also does not include a detailed audit history, information about collateral parameters, a full liquidation framework or evidence about the reliability of redemptions. Those areas remain relevant when assessing any collateralized stablecoin system, particularly one designed to operate across multiple ecosystems.
𝗧𝗼𝗸𝗲𝗻 𝗿𝗼𝗹𝗲 𝗮𝗻𝗱 𝗲𝗰𝗼𝘀𝘆𝘀𝘁𝗲𝗺 𝗰𝗼𝗻𝘁𝗲𝘅𝘁
The available data identifies RIVER as the token associated with the River ecosystem. It does not provide a complete official schedule of token functions. The supplied material does not confirm whether RIVER is used for governance, staking, fee payment, collateral incentives, protocol revenue or another specific purpose.
That gap matters because association with a decentralized-finance protocol does not, on its own, establish a token’s utility. A clear and active role could influence demand, but the research provided here does not document such a role in enough detail to make that conclusion.
Market-data categories associated with the asset include BNB Chain Ecosystem, Base Ecosystem, Chain Abstraction, Binance Alpha Spotlight, Binance Wallet IDO, Binance Buildkey TGE and Base Native. These labels describe how the asset is categorized in the supplied market-data record. They do not prove that every named ecosystem currently has deep liquidity, significant usage or active River products.
The metadata also references the River brand and a Satoshi Protocol developer identity in its listed project links. However, the research does not provide a detailed founding history, named founders, a verified funding background or a complete launch timeline. Those subjects should therefore remain open rather than being filled with assumptions.
For the token, the main fundamental questions are straightforward but unresolved: whether satUSD usage is growing, whether River’s stated cross-chain design is being used in practice, whether the collateral system remains resilient, and whether RIVER has a clearly defined function that creates ongoing demand.
𝗦𝘂𝗽𝗽𝗹𝘆 𝗱𝗮𝘁𝗮 𝗮𝗻𝗱 𝘃𝗮𝗹𝘂𝗮𝘁𝗶𝗼𝗻
The token record reports a maximum supply and total supply of 100 million RIVER. Circulating supply is listed at 19.6 million, while outstanding supply is reported as 91.111 million. These figures imply very different views of how much supply is currently available, and the supplied research does not explain the difference.
Using the reported circulating figure, the market capitalization is approximately 22.44 million USDT. The supplied CoinGecko snapshot places the asset at market-cap rank 787. Fully diluted valuation is reported at approximately 114.49 million USDT, while the market-cap-to-FDV ratio is listed at 0.20.
The same dataset reports outstanding token value of approximately 104.47 million USDT. The market-cap and FDV figures are mathematically consistent with a relatively small circulating amount compared with the maximum supply, but the outstanding-supply number introduces an important data-quality question.
The discrepancy could reflect different definitions, locked allocations or data-provider methodology. The available research does not state which explanation is correct. As a result, the valuation figures should be viewed as provisional rather than as a complete picture of dilution risk.
If a substantial amount of supply can eventually enter the market, future distributions or unlocks could influence price. The research does not provide an unlock schedule, allocation breakdown or confirmed distribution timetable, so the timing and scale of any potential supply-related pressure cannot be established from the supplied information.
The reported market-cap-to-TVL ratio is 0.23, based on market capitalization of approximately 22.44 million USDT and reported total value locked of approximately 96.54 million USDT. That comparison may be useful for context, but TVL is not the same as revenue, token demand or user growth. The supplied data does not show how much of the reported TVL is actively used or what portion is exposed to different collateral risks.
𝗣𝗿𝗶𝗰𝗲 𝗮𝗰𝘁𝗶𝗼𝗻 𝗿𝗲𝘃𝗲𝗮𝗹𝘀 𝗵𝗲𝗮𝘃𝘆 𝘀𝗲𝗹𝗹𝗶𝗻𝗴
The Binance ticker snapshot reports a last price of 1.154 USDT, a 24-hour change of minus 17.865 percent, a high of 1.429 and a low of 1.125. Reported 24-hour volume is 27.093 million RIVER, equivalent to approximately 34.082 million USDT, with a weighted average price of 1.257951.
CoinGecko’s separate snapshot shows a price near 1.15 USDT, a 24-hour decline of 18.13299 percent, a high of 1.42, a low of 1.14 and total reported volume of approximately 4.714 million USDT. The difference between the exchange ticker and CoinGecko volume figures is substantial. It may reflect different venue coverage or reporting windows, but the research does not specify the cause.
The broader performance record is also weak. RIVER is reported down 10.46627 percent over seven days, 30.09162 percent over 14 days, 56.70709 percent over 30 days, 65.30434 percent over 60 days and 87.71778 percent over 200 days. The supplied all-time high is 87.73 USDT, recorded on January 26, 2026, leaving the asset approximately 98.69 percent below that level.
The reported all-time low is 1.048 USDT, recorded on September 10, 2026. With the market near 1.15 USDT in the supplied snapshots, price remains relatively close to that historical low.
The hourly candles show repeated lower highs from the 1.42 area toward the 1.17 region, followed by a sharp decline to 1.125. The latest hourly candle recovered from 1.144 to 1.152, but that rebound was modest compared with the preceding fall. On the four-hour chart, heavy downward candles appeared after a temporary move toward 1.535. The supplied candles therefore describe a volatile reversal rather than a stable upward trend.
𝗗𝗲𝗿𝗶𝘃𝗮𝘁𝗶𝘃𝗲𝘀 𝗮𝗻𝗱 𝘁𝗵𝗲 𝘀𝗵𝗼𝗿𝘁-𝘁𝗲𝗿𝗺 𝘀𝗲𝘁𝘂𝗽
The scanner’s bearish structure is concentrated around the 1.195 resistance area. Its planned entry band is between 1.1895945 and 1.1907835, with the invalidation level at 1.198585. This is a narrow range, meaning the model’s interpretation depends on price failing near the local recovery zone rather than reclaiming it decisively.
The scanner reports a risk-reward figure of 2.1946549 and maps downside levels at 1.1724729, 1.1639121 and 1.1553513. These levels come from the scanner and are not independently confirmed support zones. The third level is close to the Binance ticker price of 1.154, illustrating how quickly the market moved between the available data captures.
The scanner’s volume ratio is 0.638664, below one according to its comparison baseline. That reading indicates the immediate move was not accompanied by unusually high volume in the scanner’s measurement. It does not determine what happens next. A move with subdued relative volume can continue if selling activity increases, but it can also become vulnerable to a relief bounce if momentum fades.
The clearest bearish interpretation would involve rejection below 1.195, followed by a break of the 1.1828505 support reference and movement toward the lower scanner levels. A sustained recovery above 1.198585 would weaken that interpretation, particularly if price begins holding around or above 1.20 rather than producing only a brief upward wick.
Open interest is reported at 5.835 million RIVER. The supplied research does not include funding-rate history, liquidation data or a longer open-interest series. It is therefore not possible to determine whether the decline is being driven by new short exposure, the closure of long positions or another derivatives-related flow.
𝗕𝗶𝘁𝗰𝗼𝗶𝗻’𝘀 𝗺𝗼𝗿𝗲 𝗺𝗼𝗱𝗲𝘀𝘁 𝗱𝗲𝗰𝗹𝗶𝗻𝗲
Bitcoin is also lower in the supplied market snapshot, but its move is much smaller than RIVER’s. BTC is quoted at 76,727.60 USDT, down 0.647 percent over the 24-hour period. Its reported high is 77,427.40, its low is 76,458.90 and its 24-hour quote volume is approximately 5.008 billion USDT.
RIVER’s decline of roughly 18 percent is therefore substantially larger than Bitcoin’s decline of less than 1 percent. The available figures point to pronounced asset-specific weakness rather than a simple one-for-one reflection of the broader market move. The research does not identify whether that weakness is related to liquidity, token-specific selling, derivatives positioning, supply concerns or a loss of confidence.
Bitcoin’s modest weakness still does not create a supportive backdrop for a smaller asset already under pressure. If BTC moves below its supplied low near 76,458.90, speculative risk appetite could weaken further. If Bitcoin stabilizes or recovers, however, that would not automatically repair RIVER’s chart because RIVER’s own performance has been considerably worse across the supplied time periods.
𝗙𝘂𝗻𝗱𝗮𝗺𝗲𝗻𝘁𝗮𝗹 𝗰𝗮𝘁𝗮𝗹𝘆𝘀𝘁𝘀 𝗿𝗲𝗺𝗮𝗶𝗻 𝘂𝗻𝗰𝗼𝗻𝗳𝗶𝗿𝗺𝗲𝗱
The supplied news search does not contain a verified River protocol announcement, integration, governance decision, audit update or product launch. Its only listed result is an unrelated River Journal Online article about Bitcoin casino games. That item provides no confirmed information about the RIVER token or River’s protocol.
The project’s stated architecture is therefore the main fundamental narrative available in this research. Positive developments would need to be supported by verifiable evidence such as higher satUSD usage, additional supported chains, deeper liquidity, transparent audits, stronger collateral performance or a clearly documented token-utility update. None of those developments is confirmed as a current event in the supplied material.
The reported TVL of approximately 96.54 million USDT is notable relative to the reported market capitalization, but it should not be treated as direct evidence of revenue or sustained token demand. The research does not provide a TVL history, a breakdown of deposited assets or a measure of active users.
On the risk side, weak satUSD demand, collateral losses, smart-contract vulnerabilities, cross-chain messaging failures, insufficient liquidity or future token distributions could place additional pressure on the asset. These are relevant risk categories for the stated design, but the research does not confirm that any one of them is currently responsible for the price decline.
𝗞𝗲𝘆 𝗹𝗲𝘃𝗲𝗹𝘀 𝗮𝗻𝗱 𝗺𝗮𝗿𝗸𝗲𝘁 𝘀𝗶𝗴𝗻𝗮𝗹𝘀
The immediate scanner resistance is 1.195, with the invalidation level at 1.198585. A sustained move above that area would weaken the current bearish setup. The 1.20 region also serves as a nearby psychological reference because it is just above the scanner’s invalidation level.
The scanner support reference is 1.1828505. Below it, the model identifies 1.1724729, 1.1639121 and 1.1553513. The recent Binance low near 1.125 is a separate market-data reference and sits well below the third scanner level. A break under 1.125 would extend the recent price range lower, while a strong recovery from that area could indicate that selling pressure is being absorbed.
The combination of price and participation is more informative than either measure alone. A lower low with rising volume would be consistent with stronger continuation pressure. A lower low on falling relative volume followed by a quick recovery above 1.1828505 would suggest that immediate downside momentum may be fading. These are analytical interpretations, not predictions.
Further monitoring would require funding data, liquidation activity and a longer open-interest series, none of which is included in the supplied research. On the fundamental side, the most important unresolved checks are the actual circulating float, any supply-distribution schedule, satUSD usage, the quality of reported TVL, protocol security and confirmed River announcements.
𝗧𝗵𝗲 𝗯𝗮𝗹𝗮𝗻𝗰𝗲𝗱 𝘃𝗶𝗲𝘄
River’s stated goal is ambitious: use chain abstraction and the satUSD omni-CDP design to make collateral, yield and liquidity more accessible across ecosystems without requiring traditional bridging. That concept gives the project a clear area of focus and explains why it is connected with categories such as Chain Abstraction, Base Ecosystem and BNB Chain Ecosystem.
At the same time, the supplied market evidence is decisively weak. RIVER is near its reported historical low, has declined across every listed multi-day period, and has fallen much more sharply than Bitcoin during the reported 24-hour window. The scanner identifies a short-term bearish structure around 1.19, with 1.195 to 1.198585 serving as the main area where that interpretation would begin to weaken.
The principal uncertainties extend beyond price. Circulating and outstanding supply figures do not align cleanly, the market-cap-to-FDV gap is substantial, the exact token utility is not documented in the supplied material, and exchange and CoinGecko volume figures differ considerably. The available news does not provide a relevant confirmed catalyst.
The most accurate conclusion is not that River’s technology is invalid or that the decline must continue. It is that the market is demanding clearer evidence. A more durable recovery would require improved price structure alongside better visibility into supply, adoption, liquidity and protocol security. Until those questions are answered, RIVER remains a high-volatility asset in which scanner levels can provide short-term reference points, while abrupt reversals and liquidity-driven moves remain realistic possibilities.
RIVERUSDT is presenting two very different stories at the same time. The market story is dominated by a steep decline, a succession of lower prices and a short-term scanner setup that points toward possible continuation. The project story is centered on River’s stated effort to build a chain-abstraction stablecoin system for cross-chain collateral, yield and liquidity without requiring users to bridge assets manually.
Those narratives should be considered separately. A promising protocol design does not automatically create short-term token demand, while a weak chart does not by itself establish that the underlying project is failing. The available data shows severe price pressure, but it does not identify a single confirmed reason for that pressure.
The RR Trader scanner selected RIVERUSDT as a short-direction setup with a confidence score of 100 in its own model. It ranked third in the TOP_LOSER category and reported a 15-minute move of approximately minus 0.999 percent. At the scanner snapshot, the price was 1.189 USDT. The model identified an entry area between 1.1895945 and 1.1907835, resistance at 1.195, support at 1.1828505, an invalidation stop level at 1.198585, and downside reference levels at 1.1724729, 1.1639121 and 1.1553513.
These are model-derived reference points rather than guaranteed outcomes. The key question is whether the market is still building downside momentum or whether the sharp decline has already created conditions for a fast relief bounce.
𝗪𝗵𝗮𝘁 𝗥𝗶𝘃𝗲𝗿 𝗶𝘀 𝗯𝘂𝗶𝗹𝗱𝗶𝗻𝗴
The supplied project description identifies River as a chain-abstraction stablecoin system. Its stated purpose is to make cross-chain collateral, yield and liquidity available across different ecosystems without traditional asset bridging.
The central product is satUSD, described as an omni-CDP stablecoin. River’s stated design allows a user to collateralize assets on Chain A and mint satUSD on Chain B without bridging the original collateral. In practical terms, the architecture is intended to address the fragmentation that can occur when liquidity and collateral are spread across separate blockchain networks.
The project description also says that users can earn, leverage and scale across ecosystems natively through the satUSD system. These statements describe River’s intended functionality, but the supplied research does not provide a complete record of live usage, satUSD supply, collateral composition, liquidation performance or user activity.
That distinction is important. The available material supports describing the protocol concept and its stated objective. It does not support concluding that the system has achieved broad adoption, that its collateral design has been tested through every market condition or that its cross-chain operation is free from technical risk.
The research also does not include a detailed audit history, information about collateral parameters, a full liquidation framework or evidence about the reliability of redemptions. Those areas remain relevant when assessing any collateralized stablecoin system, particularly one designed to operate across multiple ecosystems.
𝗧𝗼𝗸𝗲𝗻 𝗿𝗼𝗹𝗲 𝗮𝗻𝗱 𝗲𝗰𝗼𝘀𝘆𝘀𝘁𝗲𝗺 𝗰𝗼𝗻𝘁𝗲𝘅𝘁
The available data identifies RIVER as the token associated with the River ecosystem. It does not provide a complete official schedule of token functions. The supplied material does not confirm whether RIVER is used for governance, staking, fee payment, collateral incentives, protocol revenue or another specific purpose.
That gap matters because association with a decentralized-finance protocol does not, on its own, establish a token’s utility. A clear and active role could influence demand, but the research provided here does not document such a role in enough detail to make that conclusion.
Market-data categories associated with the asset include BNB Chain Ecosystem, Base Ecosystem, Chain Abstraction, Binance Alpha Spotlight, Binance Wallet IDO, Binance Buildkey TGE and Base Native. These labels describe how the asset is categorized in the supplied market-data record. They do not prove that every named ecosystem currently has deep liquidity, significant usage or active River products.
The metadata also references the River brand and a Satoshi Protocol developer identity in its listed project links. However, the research does not provide a detailed founding history, named founders, a verified funding background or a complete launch timeline. Those subjects should therefore remain open rather than being filled with assumptions.
For the token, the main fundamental questions are straightforward but unresolved: whether satUSD usage is growing, whether River’s stated cross-chain design is being used in practice, whether the collateral system remains resilient, and whether RIVER has a clearly defined function that creates ongoing demand.
𝗦𝘂𝗽𝗽𝗹𝘆 𝗱𝗮𝘁𝗮 𝗮𝗻𝗱 𝘃𝗮𝗹𝘂𝗮𝘁𝗶𝗼𝗻
The token record reports a maximum supply and total supply of 100 million RIVER. Circulating supply is listed at 19.6 million, while outstanding supply is reported as 91.111 million. These figures imply very different views of how much supply is currently available, and the supplied research does not explain the difference.
Using the reported circulating figure, the market capitalization is approximately 22.44 million USDT. The supplied CoinGecko snapshot places the asset at market-cap rank 787. Fully diluted valuation is reported at approximately 114.49 million USDT, while the market-cap-to-FDV ratio is listed at 0.20.
The same dataset reports outstanding token value of approximately 104.47 million USDT. The market-cap and FDV figures are mathematically consistent with a relatively small circulating amount compared with the maximum supply, but the outstanding-supply number introduces an important data-quality question.
The discrepancy could reflect different definitions, locked allocations or data-provider methodology. The available research does not state which explanation is correct. As a result, the valuation figures should be viewed as provisional rather than as a complete picture of dilution risk.
If a substantial amount of supply can eventually enter the market, future distributions or unlocks could influence price. The research does not provide an unlock schedule, allocation breakdown or confirmed distribution timetable, so the timing and scale of any potential supply-related pressure cannot be established from the supplied information.
The reported market-cap-to-TVL ratio is 0.23, based on market capitalization of approximately 22.44 million USDT and reported total value locked of approximately 96.54 million USDT. That comparison may be useful for context, but TVL is not the same as revenue, token demand or user growth. The supplied data does not show how much of the reported TVL is actively used or what portion is exposed to different collateral risks.
𝗣𝗿𝗶𝗰𝗲 𝗮𝗰𝘁𝗶𝗼𝗻 𝗿𝗲𝘃𝗲𝗮𝗹𝘀 𝗵𝗲𝗮𝘃𝘆 𝘀𝗲𝗹𝗹𝗶𝗻𝗴
The Binance ticker snapshot reports a last price of 1.154 USDT, a 24-hour change of minus 17.865 percent, a high of 1.429 and a low of 1.125. Reported 24-hour volume is 27.093 million RIVER, equivalent to approximately 34.082 million USDT, with a weighted average price of 1.257951.
CoinGecko’s separate snapshot shows a price near 1.15 USDT, a 24-hour decline of 18.13299 percent, a high of 1.42, a low of 1.14 and total reported volume of approximately 4.714 million USDT. The difference between the exchange ticker and CoinGecko volume figures is substantial. It may reflect different venue coverage or reporting windows, but the research does not specify the cause.
The broader performance record is also weak. RIVER is reported down 10.46627 percent over seven days, 30.09162 percent over 14 days, 56.70709 percent over 30 days, 65.30434 percent over 60 days and 87.71778 percent over 200 days. The supplied all-time high is 87.73 USDT, recorded on January 26, 2026, leaving the asset approximately 98.69 percent below that level.
The reported all-time low is 1.048 USDT, recorded on September 10, 2026. With the market near 1.15 USDT in the supplied snapshots, price remains relatively close to that historical low.
The hourly candles show repeated lower highs from the 1.42 area toward the 1.17 region, followed by a sharp decline to 1.125. The latest hourly candle recovered from 1.144 to 1.152, but that rebound was modest compared with the preceding fall. On the four-hour chart, heavy downward candles appeared after a temporary move toward 1.535. The supplied candles therefore describe a volatile reversal rather than a stable upward trend.
𝗗𝗲𝗿𝗶𝘃𝗮𝘁𝗶𝘃𝗲𝘀 𝗮𝗻𝗱 𝘁𝗵𝗲 𝘀𝗵𝗼𝗿𝘁-𝘁𝗲𝗿𝗺 𝘀𝗲𝘁𝘂𝗽
The scanner’s bearish structure is concentrated around the 1.195 resistance area. Its planned entry band is between 1.1895945 and 1.1907835, with the invalidation level at 1.198585. This is a narrow range, meaning the model’s interpretation depends on price failing near the local recovery zone rather than reclaiming it decisively.
The scanner reports a risk-reward figure of 2.1946549 and maps downside levels at 1.1724729, 1.1639121 and 1.1553513. These levels come from the scanner and are not independently confirmed support zones. The third level is close to the Binance ticker price of 1.154, illustrating how quickly the market moved between the available data captures.
The scanner’s volume ratio is 0.638664, below one according to its comparison baseline. That reading indicates the immediate move was not accompanied by unusually high volume in the scanner’s measurement. It does not determine what happens next. A move with subdued relative volume can continue if selling activity increases, but it can also become vulnerable to a relief bounce if momentum fades.
The clearest bearish interpretation would involve rejection below 1.195, followed by a break of the 1.1828505 support reference and movement toward the lower scanner levels. A sustained recovery above 1.198585 would weaken that interpretation, particularly if price begins holding around or above 1.20 rather than producing only a brief upward wick.
Open interest is reported at 5.835 million RIVER. The supplied research does not include funding-rate history, liquidation data or a longer open-interest series. It is therefore not possible to determine whether the decline is being driven by new short exposure, the closure of long positions or another derivatives-related flow.
𝗕𝗶𝘁𝗰𝗼𝗶𝗻’𝘀 𝗺𝗼𝗿𝗲 𝗺𝗼𝗱𝗲𝘀𝘁 𝗱𝗲𝗰𝗹𝗶𝗻𝗲
Bitcoin is also lower in the supplied market snapshot, but its move is much smaller than RIVER’s. BTC is quoted at 76,727.60 USDT, down 0.647 percent over the 24-hour period. Its reported high is 77,427.40, its low is 76,458.90 and its 24-hour quote volume is approximately 5.008 billion USDT.
RIVER’s decline of roughly 18 percent is therefore substantially larger than Bitcoin’s decline of less than 1 percent. The available figures point to pronounced asset-specific weakness rather than a simple one-for-one reflection of the broader market move. The research does not identify whether that weakness is related to liquidity, token-specific selling, derivatives positioning, supply concerns or a loss of confidence.
Bitcoin’s modest weakness still does not create a supportive backdrop for a smaller asset already under pressure. If BTC moves below its supplied low near 76,458.90, speculative risk appetite could weaken further. If Bitcoin stabilizes or recovers, however, that would not automatically repair RIVER’s chart because RIVER’s own performance has been considerably worse across the supplied time periods.
𝗙𝘂𝗻𝗱𝗮𝗺𝗲𝗻𝘁𝗮𝗹 𝗰𝗮𝘁𝗮𝗹𝘆𝘀𝘁𝘀 𝗿𝗲𝗺𝗮𝗶𝗻 𝘂𝗻𝗰𝗼𝗻𝗳𝗶𝗿𝗺𝗲𝗱
The supplied news search does not contain a verified River protocol announcement, integration, governance decision, audit update or product launch. Its only listed result is an unrelated River Journal Online article about Bitcoin casino games. That item provides no confirmed information about the RIVER token or River’s protocol.
The project’s stated architecture is therefore the main fundamental narrative available in this research. Positive developments would need to be supported by verifiable evidence such as higher satUSD usage, additional supported chains, deeper liquidity, transparent audits, stronger collateral performance or a clearly documented token-utility update. None of those developments is confirmed as a current event in the supplied material.
The reported TVL of approximately 96.54 million USDT is notable relative to the reported market capitalization, but it should not be treated as direct evidence of revenue or sustained token demand. The research does not provide a TVL history, a breakdown of deposited assets or a measure of active users.
On the risk side, weak satUSD demand, collateral losses, smart-contract vulnerabilities, cross-chain messaging failures, insufficient liquidity or future token distributions could place additional pressure on the asset. These are relevant risk categories for the stated design, but the research does not confirm that any one of them is currently responsible for the price decline.
𝗞𝗲𝘆 𝗹𝗲𝘃𝗲𝗹𝘀 𝗮𝗻𝗱 𝗺𝗮𝗿𝗸𝗲𝘁 𝘀𝗶𝗴𝗻𝗮𝗹𝘀
The immediate scanner resistance is 1.195, with the invalidation level at 1.198585. A sustained move above that area would weaken the current bearish setup. The 1.20 region also serves as a nearby psychological reference because it is just above the scanner’s invalidation level.
The scanner support reference is 1.1828505. Below it, the model identifies 1.1724729, 1.1639121 and 1.1553513. The recent Binance low near 1.125 is a separate market-data reference and sits well below the third scanner level. A break under 1.125 would extend the recent price range lower, while a strong recovery from that area could indicate that selling pressure is being absorbed.
The combination of price and participation is more informative than either measure alone. A lower low with rising volume would be consistent with stronger continuation pressure. A lower low on falling relative volume followed by a quick recovery above 1.1828505 would suggest that immediate downside momentum may be fading. These are analytical interpretations, not predictions.
Further monitoring would require funding data, liquidation activity and a longer open-interest series, none of which is included in the supplied research. On the fundamental side, the most important unresolved checks are the actual circulating float, any supply-distribution schedule, satUSD usage, the quality of reported TVL, protocol security and confirmed River announcements.
𝗧𝗵𝗲 𝗯𝗮𝗹𝗮𝗻𝗰𝗲𝗱 𝘃𝗶𝗲𝘄
River’s stated goal is ambitious: use chain abstraction and the satUSD omni-CDP design to make collateral, yield and liquidity more accessible across ecosystems without requiring traditional bridging. That concept gives the project a clear area of focus and explains why it is connected with categories such as Chain Abstraction, Base Ecosystem and BNB Chain Ecosystem.
At the same time, the supplied market evidence is decisively weak. RIVER is near its reported historical low, has declined across every listed multi-day period, and has fallen much more sharply than Bitcoin during the reported 24-hour window. The scanner identifies a short-term bearish structure around 1.19, with 1.195 to 1.198585 serving as the main area where that interpretation would begin to weaken.
The principal uncertainties extend beyond price. Circulating and outstanding supply figures do not align cleanly, the market-cap-to-FDV gap is substantial, the exact token utility is not documented in the supplied material, and exchange and CoinGecko volume figures differ considerably. The available news does not provide a relevant confirmed catalyst.
The most accurate conclusion is not that River’s technology is invalid or that the decline must continue. It is that the market is demanding clearer evidence. A more durable recovery would require improved price structure alongside better visibility into supply, adoption, liquidity and protocol security. Until those questions are answered, RIVER remains a high-volatility asset in which scanner levels can provide short-term reference points, while abrupt reversals and liquidity-driven moves remain realistic possibilities.
412
·
--
Look at $ENSO … 👀🚨 DOWN setup!
Entry: 0.90415 - 0.90506
SL: 0.91093
TP1: 0.89114 | TP2: 0.88463 | TP3: 0.87813
Look at $ENSO … 👀🚨 DOWN setup!
Entry: 0.90415 - 0.90506
SL: 0.91093
TP1: 0.89114 | TP2: 0.88463 | TP3: 0.87813
Entry: 0.90415 - 0.90506
SL: 0.91093
TP1: 0.89114 | TP2: 0.88463 | TP3: 0.87813
308
·
--
Guys, watch $M closely… 🔥 DOWN!
Entry: 1.1469 - 1.148
SL: 1.1526
TP1: 1.1356 | TP2: 1.1299 | TP3: 1.1243
Guys, watch $M closely… 🔥 DOWN!
Entry: 1.1469 - 1.148
SL: 1.1526
TP1: 1.1356 | TP2: 1.1299 | TP3: 1.1243
Entry: 1.1469 - 1.148
SL: 1.1526
TP1: 1.1356 | TP2: 1.1299 | TP3: 1.1243
387
·
--
Wait wait wait… 🔥 $我踏马来了 is ready to move DOWN!
Entry: 0.014089 - 0.014103
SL: 0.014195
TP1: 0.013886 | TP2: 0.013785 | TP3: 0.013683
Wait wait wait… 🔥 $我踏马来了 is ready to move DOWN!
Entry: 0.014089 - 0.014103
SL: 0.014195
TP1: 0.013886 | TP2: 0.013785 | TP3: 0.013683
Entry: 0.014089 - 0.014103
SL: 0.014195
TP1: 0.013886 | TP2: 0.013785 | TP3: 0.013683
407
·
--
$HIVE caught my eye… 👀🔥 UP!
Entry: 0.051473 - 0.051524
SL: 0.051146
TP1: 0.052251 | TP2: 0.052614 | TP3: 0.052978
$HIVE caught my eye… 👀🔥 UP!
Entry: 0.051473 - 0.051524
SL: 0.051146
TP1: 0.052251 | TP2: 0.052614 | TP3: 0.052978
Entry: 0.051473 - 0.051524
SL: 0.051146
TP1: 0.052251 | TP2: 0.052614 | TP3: 0.052978
370
·
--
$KOMA is moving… 🚨🔥 UP!
Entry: 0.016079 - 0.016095
SL: 0.016029
TP1: 0.016214 | TP2: 0.016273 | TP3: 0.016333
$KOMA is moving… 🚨🔥 UP!
Entry: 0.016079 - 0.016095
SL: 0.016029
TP1: 0.016214 | TP2: 0.016273 | TP3: 0.016333
Entry: 0.016079 - 0.016095
SL: 0.016029
TP1: 0.016214 | TP2: 0.016273 | TP3: 0.016333
1
446
·
--
A sudden plunge pushes Haqimi USDT back into traders’ focus𝗠𝗮𝗿𝗸𝗲𝘁 𝗦𝗻𝗮𝗽𝘀𝗵𝗼𝘁
Haqimi USDT has recently attracted renewed attention. The core reason is not a new product launch, a technical upgrade, or any confirmed partnership, but rather a noticeable pullback after a rapid surge. On September 13, 2026, the RR Trader scanner issued a SHORT direction signal, with a confidence of 100, marked as TOP_LOSER, and a heat ranking of 4. This signal reflects the current price structure and short-term momentum. It does not equate to a judgment of the project’s fundamentals, nor does it mean the price will necessarily follow the predetermined path.
A sudden plunge pushes Haqimi USDT back into traders’ focus
𝗠𝗮𝗿𝗸𝗲𝘁 𝗦𝗻𝗮𝗽𝘀𝗵𝗼𝘁
Haqimi USDT has recently attracted renewed attention. The core reason is not a new product launch, a technical upgrade, or any confirmed partnership, but rather a noticeable pullback after a rapid surge. On September 13, 2026, the RR Trader scanner issued a SHORT direction signal, with a confidence of 100, marked as TOP_LOSER, and a heat ranking of 4. This signal reflects the current price structure and short-term momentum. It does not equate to a judgment of the project’s fundamentals, nor does it mean the price will necessarily follow the predetermined path.
Haqimi USDT has recently attracted renewed attention. The core reason is not a new product launch, a technical upgrade, or any confirmed partnership, but rather a noticeable pullback after a rapid surge. On September 13, 2026, the RR Trader scanner issued a SHORT direction signal, with a confidence of 100, marked as TOP_LOSER, and a heat ranking of 4. This signal reflects the current price structure and short-term momentum. It does not equate to a judgment of the project’s fundamentals, nor does it mean the price will necessarily follow the predetermined path.
194
Log in to explore more content
Join global crypto users on Binance Square
⚡️ Get latest and useful information about crypto.
💬 Trusted by the world’s largest crypto exchange.
👍 Discover real insights from verified creators.
Email / Phone number
Trending Topics
AnthropicCEOCallsForAISlowdown
63,881 views
873 Discussing
#anthropicceocallsforaislowdown
🚨🤖 ANTHROPIC CEO SAYS: SLOW DOWN AI BEFORE IT’S TOO LATE 🤖🚨
The faster tomorrow arrives, the harder it becomes to see what we leave behind.
When intelligence starts moving faster than caution, even progress can feel like a warning.
Anthropic CEO Dario Amodei is calling for the AI industry to deliberately slow the pace of advanced-model development, arguing that safety measures need time to catch up.
His proposal is not simply “stop AI.” Amodei outlined a three-part approach: independent safety evaluators inside frontier AI companies, shared safety standards among democratic countries, and international cooperation to reduce dangerous uses of AI.
My Take: The deeper story is not fear versus innovation. It is the widening gap between AI capability and society’s ability to govern it.
Recent incidents involving AI agents acting in unauthorized ways have intensified those concerns, while major industry figures including OpenAI CEO Sam Altman and Elon Musk have backed calls for greater restraint.
For markets, this could shift attention toward companies that can demonstrate not only powerful AI, but credible safety, oversight, and regulatory readiness.
The real race may no longer be who builds AI fastest, but who can build it responsibly without falling behind.
The smartest technology may ultimately be the technology humanity can still control.
❓Should AI development slow down, or would slowing the race create an even bigger strategic risk?
Disclaimer: Informational content only, not financial advice. AI policy and market conditions can change.
#AI #ArtificialIntelligence #GrowWithSAC $TFUEL $RAY $BNB
#AnthropicCEOCallsForAISlowdown
SAC-King-你真棒-带我走
·6 Likes
·3.9k views
BitcoinThirdSingleBlockReorgInFourWeeks
2,000 views
110 Discussing
BitcoinDropsToIntradayLow$76367
2 views
3 Discussing