
#msft
msft
74,680 views
1,046 Discussing
Hot
Latest

🚨 INSIDE THE $7 TRILLION CAPEX ENGINE DRIVING THE $MSFT AND HYPERSCALER AI EXPANSION! 🦈
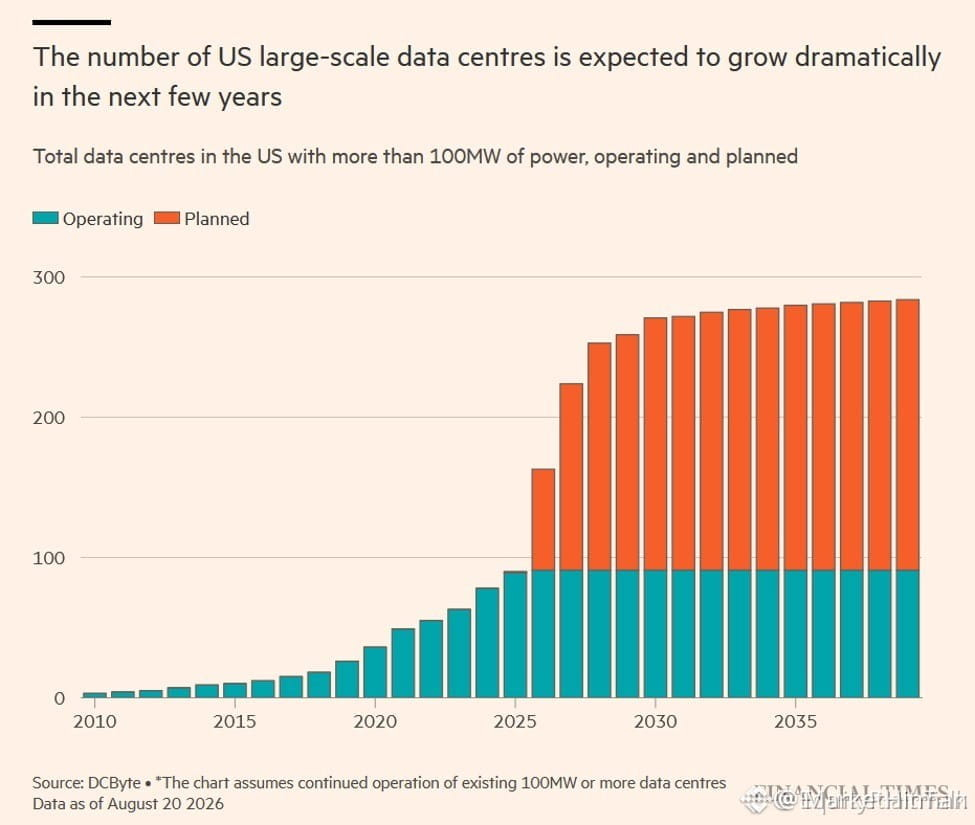
Smart money is anchoring capital directly into baseline physical infrastructure rather than chasing derivative hype. Over 90 mega-facilities exceeding 100MW are operational, with projections scaling to 280 units by 2030 as institutional players secure long-term energy capacity. 📊
Hyperscalers like $MSFT and $GOOGL have already committed $1.5 trillion in infrastructure leases since the AI expansion phase kicked off. 🌊 This massive $7 trillion capex cycle represents an unprecedented structural capital reallocation into power grids, energy delivery, and physical compute nodes. 💡
💬 Are you allocating into the underlying utility infrastructure, or trading the high-beta software pivots? 👇
⚠️ Not financial advice. Always manage your risk. 🛡️
🏷️ #MSFT #AICapex #DataCenters #Macro #Crypto
🎯 🦈
Smart money is anchoring capital directly into baseline physical infrastructure rather than chasing derivative hype. Over 90 mega-facilities exceeding 100MW are operational, with projections scaling to 280 units by 2030 as institutional players secure long-term energy capacity. 📊
Hyperscalers like $MSFT and $GOOGL have already committed $1.5 trillion in infrastructure leases since the AI expansion phase kicked off. 🌊 This massive $7 trillion capex cycle represents an unprecedented structural capital reallocation into power grids, energy delivery, and physical compute nodes. 💡
💬 Are you allocating into the underlying utility infrastructure, or trading the high-beta software pivots? 👇
⚠️ Not financial advice. Always manage your risk. 🛡️
🏷️ #MSFT #AICapex #DataCenters #Macro #Crypto
🎯 🦈

$MSFT
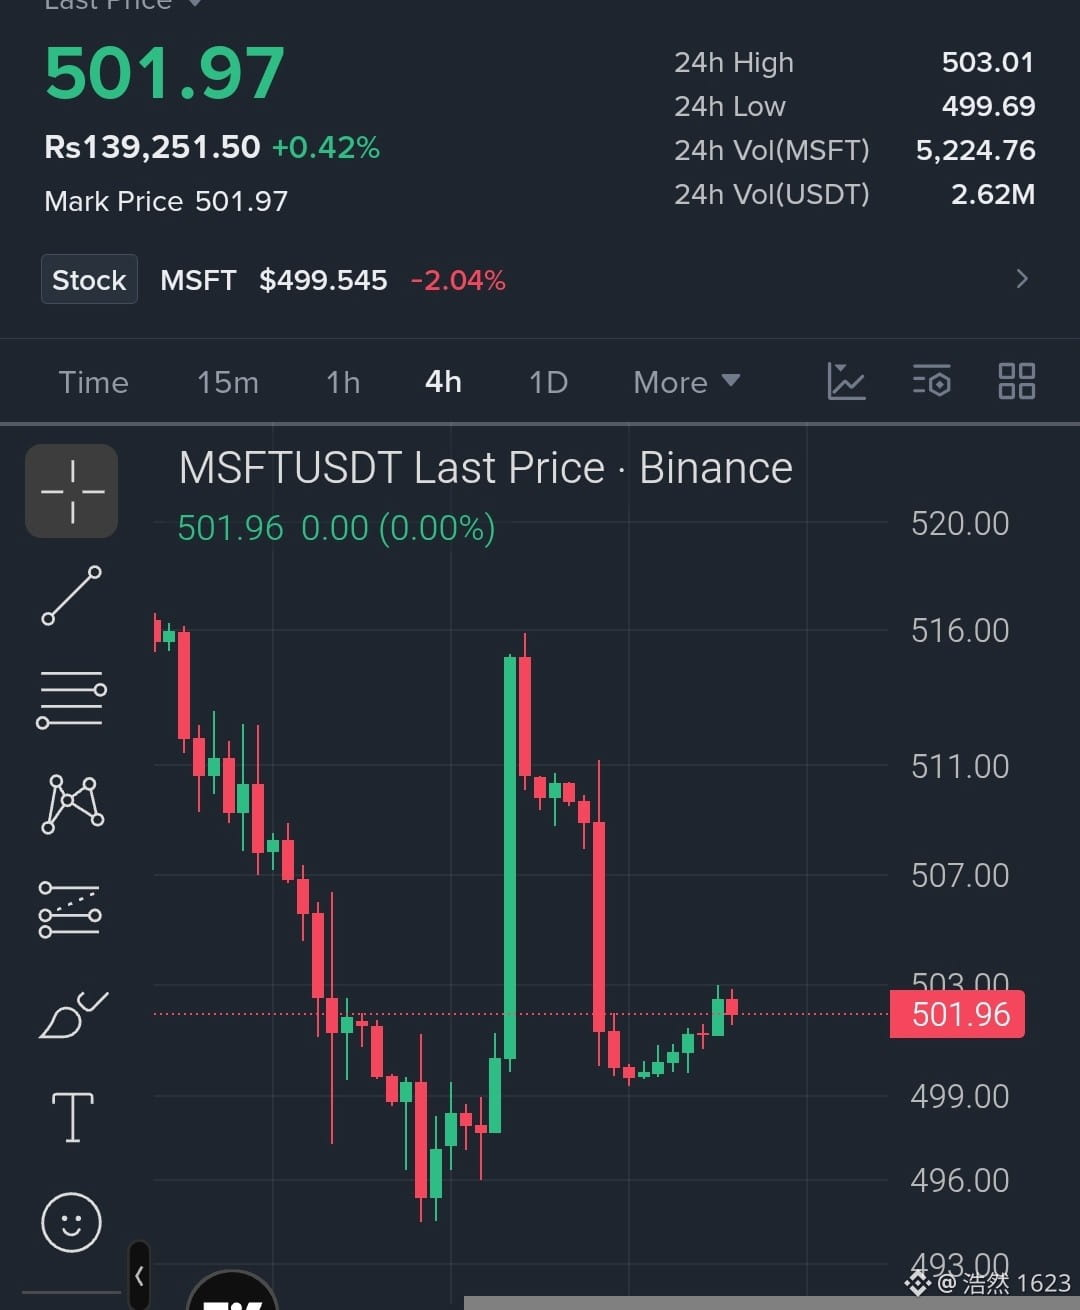
is showing steady recovery after consolidating near the $496.00 local support level and climbing back toward $501.97. The 4-hour chart reflects a rebound in buying momentum following a sharp pull-back, with price stabilizing above key short-term moving levels. If bulls maintain control and break above immediate resistance around $503.00, a stronger bullish continuation toward upper resistance zones remains on the horizon.
Target 1: $508 Target 2: $516 Target 3: $522
#MSFT #Microsoft #Trading
$TUT
$ZEC
is showing steady recovery after consolidating near the $496.00 local support level and climbing back toward $501.97. The 4-hour chart reflects a rebound in buying momentum following a sharp pull-back, with price stabilizing above key short-term moving levels. If bulls maintain control and break above immediate resistance around $503.00, a stronger bullish continuation toward upper resistance zones remains on the horizon.
Target 1: $508 Target 2: $516 Target 3: $522
#MSFT #Microsoft #Trading
$TUT
$ZEC

Three signals. All are 4-hour oversold.
$MSFT 4-hour RSI dropped to 10.9, oversold. Current price 493. In the past 24h, it fell 1%.
$AAPL 4-hour RSI dropped to 14.1, oversold. Current price 316.6. In the past 24h, it fell 1.1%.
$CRCL 4-hour RSI dropped to 19.4, oversold. Current price 99. In the past 24h, it fell 2.8%.
---
$MSFT 4-hour RSI 10.9. Extremely oversold. Current price 493. In the past 24h, it fell 1%.
Support 490 485. Resistance 498 500.
Fee rate 0%. Market neutral.
Current price 493. Slightly bullish. Entry zone 490-493, stop loss 487, target 499, reward-to-risk about 2:1. RSI 10.9 is an extreme value; short-term selling pressure has been sufficiently released, and there is support around 490.
$AAPL 4-hour RSI 14.1. Extremely oversold. Current price 316.6. In the past 24h, it fell 1.1%.
Support 315 313. Resistance 320 322.
Fee rate +0.008%. Market neutral, slightly bullish.
Current price 316.6. Slightly bullish. Entry zone 315-317, stop loss 313, target 321, reward-to-risk about 2:1. RSI 14.1 together with the intraday low around 315 suggests room for a short-term rebound.
$CRCL 4-hour RSI 19.4. Oversold. Current price 99. In the past 24h, it fell 2.8%.
Support 97 95. Resistance 102 105.
Fee rate +0.07%. Bulls are holding on.
Current price 99. Slightly bullish. Entry zone 97-99, stop loss 95, target 105, reward-to-risk about 2.5:1. RSI 19.4 plus a relatively high fee rate means shorts may be crowded; the rebound strength could be significant.
---
All three coins are oversold and biased bullish. When the direction aligns, position control matters more than direction. Don’t go all-in at once.
I’m watching.
If you need a strategy customized, you can look for Nini.
#MSFT #AAPL #CRCL #超卖反弹 #RSI signal
$MSFT 4-hour RSI dropped to 10.9, oversold. Current price 493. In the past 24h, it fell 1%.
$AAPL 4-hour RSI dropped to 14.1, oversold. Current price 316.6. In the past 24h, it fell 1.1%.
$CRCL 4-hour RSI dropped to 19.4, oversold. Current price 99. In the past 24h, it fell 2.8%.
---
$MSFT 4-hour RSI 10.9. Extremely oversold. Current price 493. In the past 24h, it fell 1%.
Support 490 485. Resistance 498 500.
Fee rate 0%. Market neutral.
Current price 493. Slightly bullish. Entry zone 490-493, stop loss 487, target 499, reward-to-risk about 2:1. RSI 10.9 is an extreme value; short-term selling pressure has been sufficiently released, and there is support around 490.
$AAPL 4-hour RSI 14.1. Extremely oversold. Current price 316.6. In the past 24h, it fell 1.1%.
Support 315 313. Resistance 320 322.
Fee rate +0.008%. Market neutral, slightly bullish.
Current price 316.6. Slightly bullish. Entry zone 315-317, stop loss 313, target 321, reward-to-risk about 2:1. RSI 14.1 together with the intraday low around 315 suggests room for a short-term rebound.
$CRCL 4-hour RSI 19.4. Oversold. Current price 99. In the past 24h, it fell 2.8%.
Support 97 95. Resistance 102 105.
Fee rate +0.07%. Bulls are holding on.
Current price 99. Slightly bullish. Entry zone 97-99, stop loss 95, target 105, reward-to-risk about 2.5:1. RSI 19.4 plus a relatively high fee rate means shorts may be crowded; the rebound strength could be significant.
---
All three coins are oversold and biased bullish. When the direction aligns, position control matters more than direction. Don’t go all-in at once.
I’m watching.
If you need a strategy customized, you can look for Nini.
#MSFT #AAPL #CRCL #超卖反弹 #RSI signal

30-minute Level 3 coin simultaneous sell-off alert—check quickly if your holdings are included 🔥
════════════════════
🟢 $DOOD 30-minute Bearish Signal
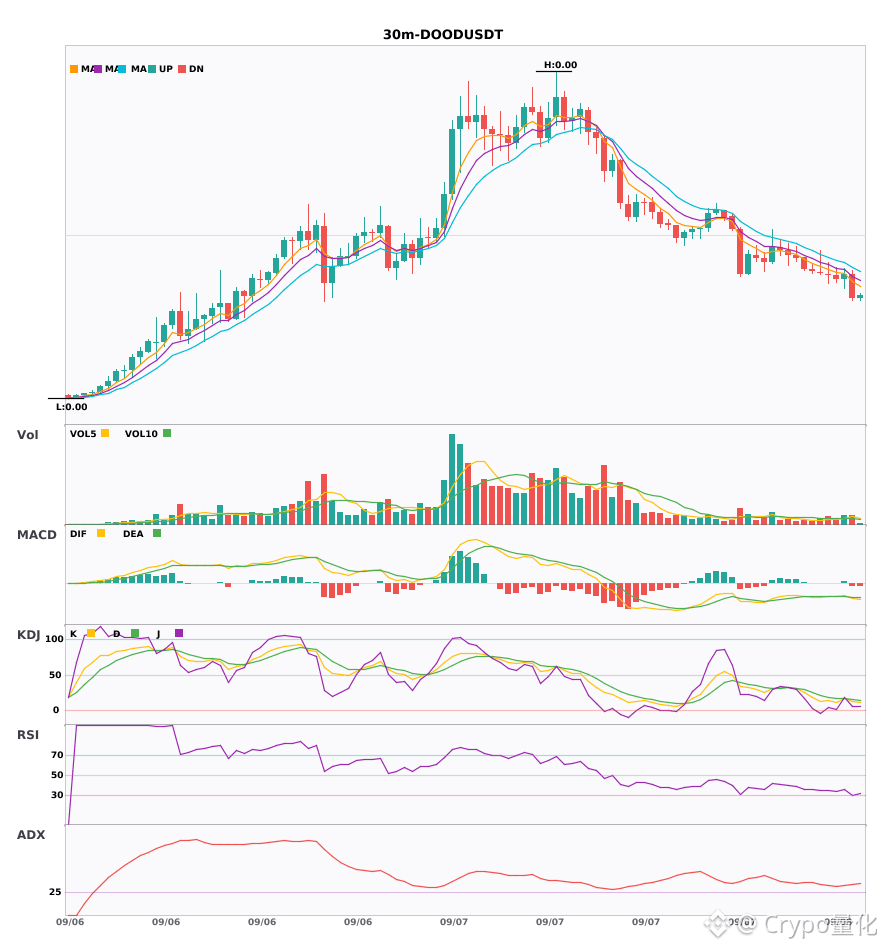
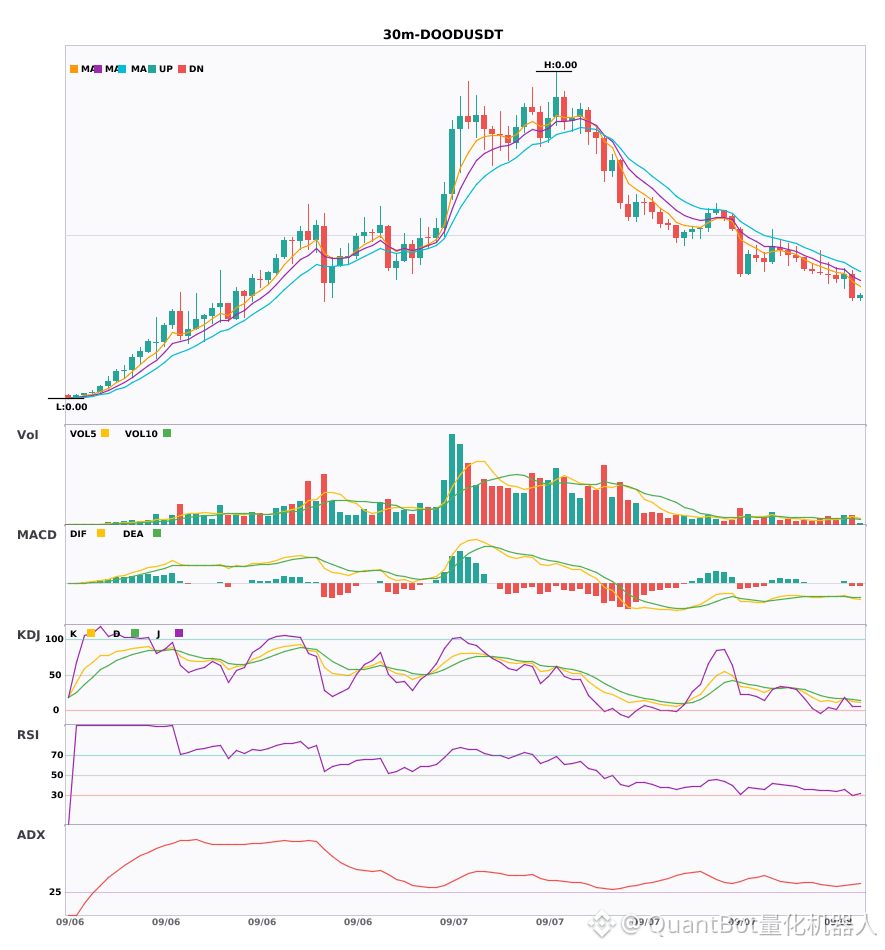
⚠️ Technicals: ADX 33—trend is moving very strongly. MACD has a bearish cross below zero; the bears are accelerating. Moving averages are arranged in a bearish stack and moving downward. KDJ also formed a dead cross, and the short-term still looks set to fall. Trading volume has expanded as well, indicating strong bearish momentum.
📢 Market Update: Binance will air-drop DOOD tokens to holders of MUBARAK, BROCCOLI714, TST, 1MBABYDOGE, and KOMA.
════════════════════
🟢 $SAMSUNG 30-minute Bearish Signal
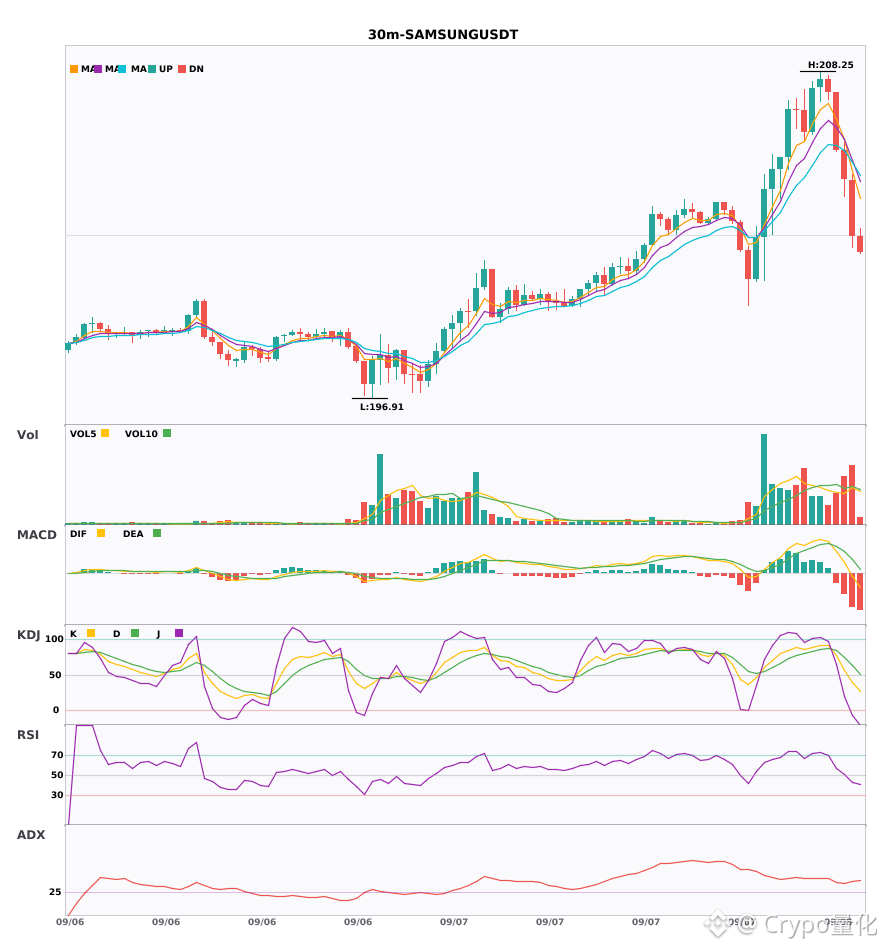
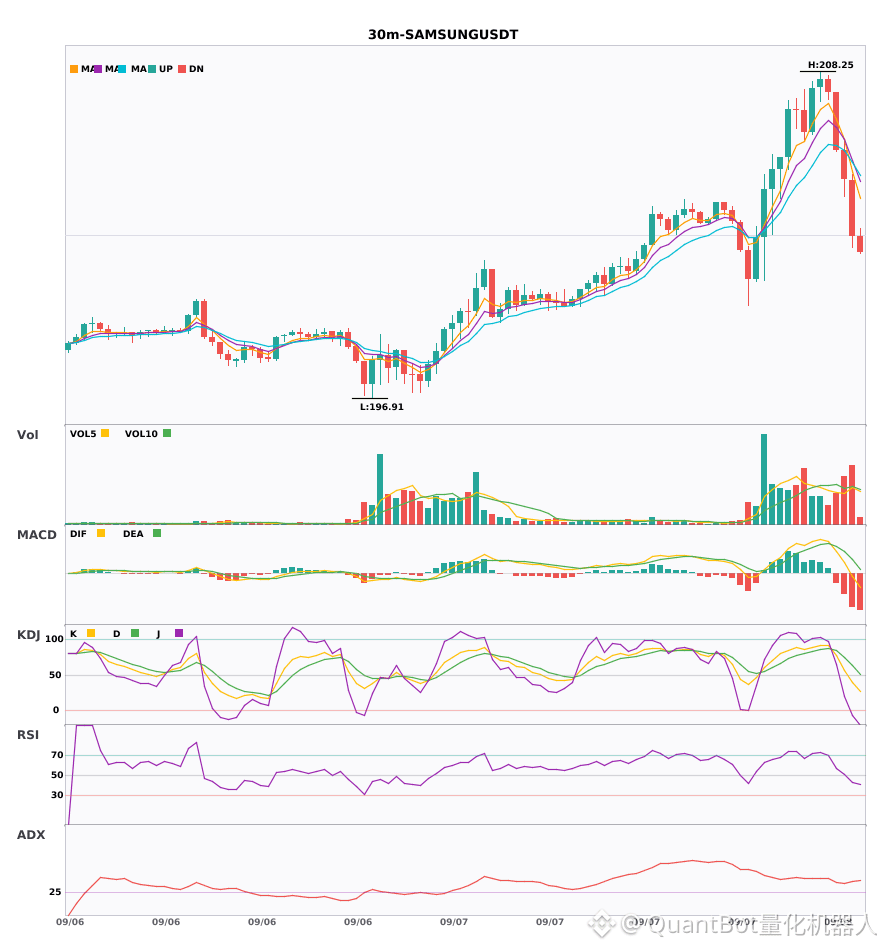
⚠️ Technicals: ADX has surged to 39, and the trend is very clear. MACD’s DIF has fallen through the zero line—bearish signal for the short term. Moving averages are sticking together and building energy; a breakout/reversal is likely imminent. Trading volume is up by 1.5x.
📢 Market Update: Samsung SDS is expanding its AI collaboration with OpenAI and Anthropic, strengthening its competitive advantage—driving innovation and setting a high entry barrier for competitors.
════════════════════
🟢 $MSFT 30-minute Bearish Signal
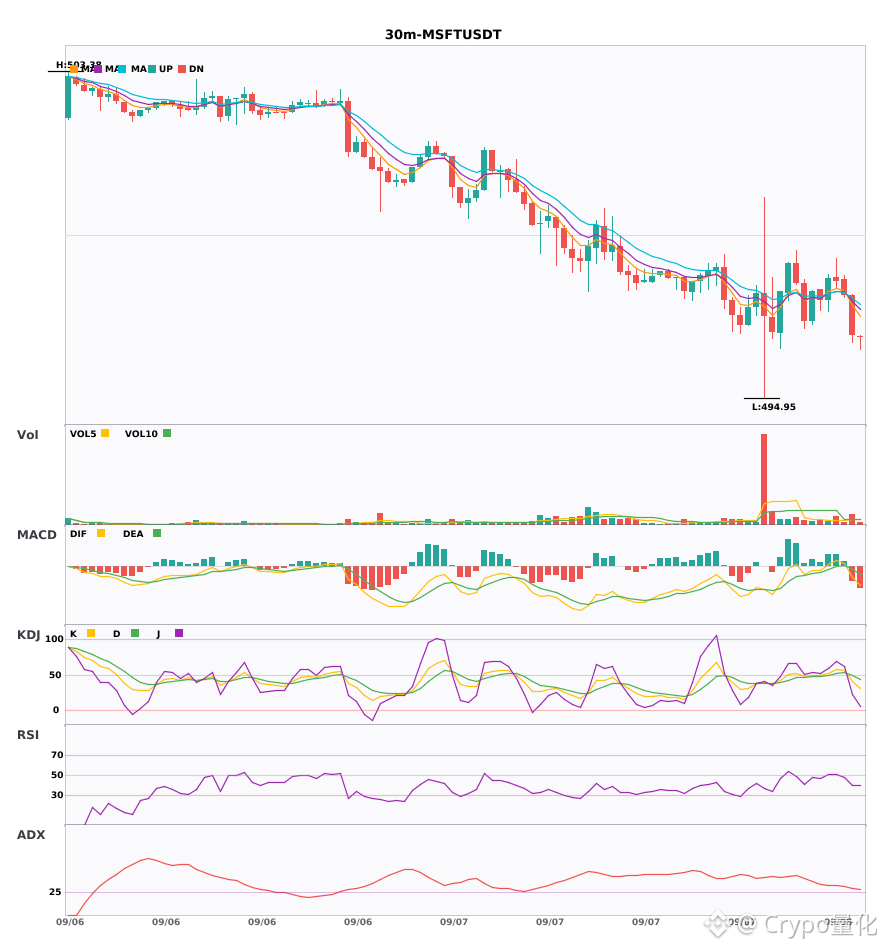
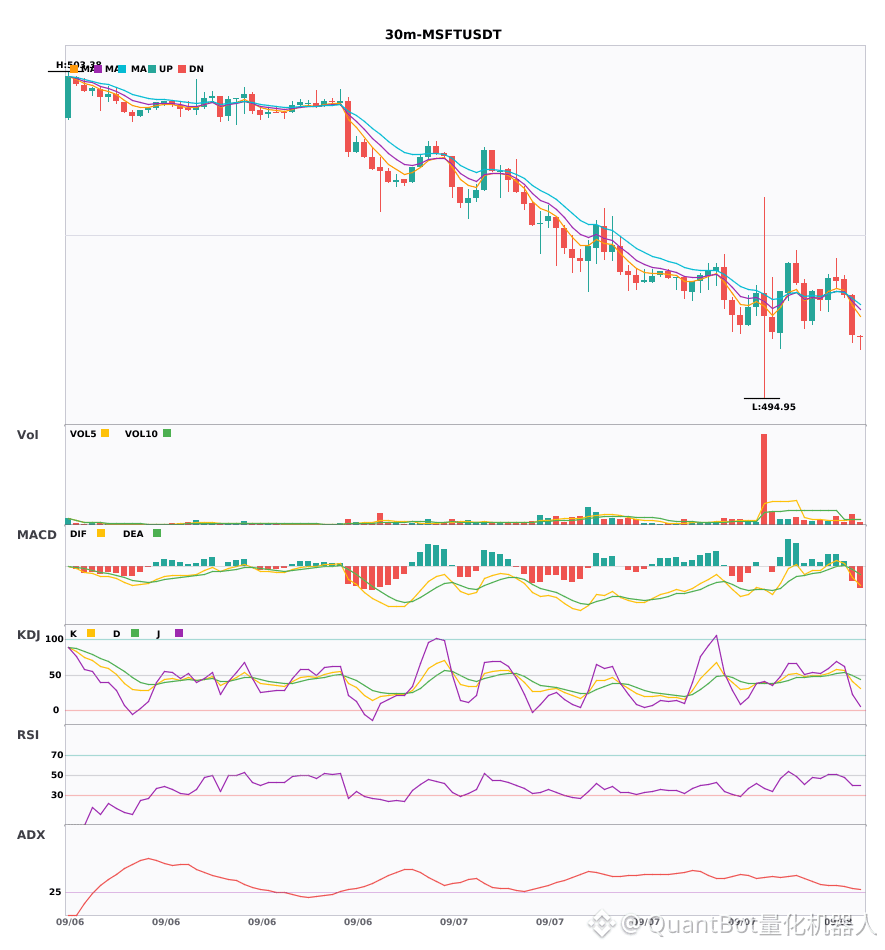
⚠️ Technicals: ADX 29—the trend is just beginning to emerge. MACD has formed a dead cross below the zero line; the bears are pushing harder. The 5-day line has broken below the 8-day line—short-term downside likely. KDJ is dead-crossed, with K at 40 and D at 49—short-term bearish. Trading volume is expanding to nearly 2x.
════════════════════
🔔 Follow to get first-hand market fluctuations 🔔
#技术分析 #DOOD #SAMSUNG #MSFT
📌 When trading, pay attention to whether the candlestick patterns match
════════════════════
🟢 $DOOD 30-minute Bearish Signal
⚠️ Technicals: ADX 33—trend is moving very strongly. MACD has a bearish cross below zero; the bears are accelerating. Moving averages are arranged in a bearish stack and moving downward. KDJ also formed a dead cross, and the short-term still looks set to fall. Trading volume has expanded as well, indicating strong bearish momentum.
📢 Market Update: Binance will air-drop DOOD tokens to holders of MUBARAK, BROCCOLI714, TST, 1MBABYDOGE, and KOMA.
════════════════════
🟢 $SAMSUNG 30-minute Bearish Signal
⚠️ Technicals: ADX has surged to 39, and the trend is very clear. MACD’s DIF has fallen through the zero line—bearish signal for the short term. Moving averages are sticking together and building energy; a breakout/reversal is likely imminent. Trading volume is up by 1.5x.
📢 Market Update: Samsung SDS is expanding its AI collaboration with OpenAI and Anthropic, strengthening its competitive advantage—driving innovation and setting a high entry barrier for competitors.
════════════════════
🟢 $MSFT 30-minute Bearish Signal
⚠️ Technicals: ADX 29—the trend is just beginning to emerge. MACD has formed a dead cross below the zero line; the bears are pushing harder. The 5-day line has broken below the 8-day line—short-term downside likely. KDJ is dead-crossed, with K at 40 and D at 49—short-term bearish. Trading volume is expanding to nearly 2x.
════════════════════
🔔 Follow to get first-hand market fluctuations 🔔
#技术分析 #DOOD #SAMSUNG #MSFT
📌 When trading, pay attention to whether the candlestick patterns match

$DOOD /$SAMSUNG /$MSFT 30-minute-level bearish structure continues; short-term pressure awaits a breakdown
📉 $DOOD | 30-minute bearish signal
━━━━━━━━━━━━━━━━━━
Technical Analysis: ADX value 33 confirms a trending market; a dead cross forms below the zero line on MACD, and bearish momentum strengthens; EMA5, EMA8, and EMA13 are arranged in a bearish formation; the KDJ indicator forms a dead cross, with K=12.3 and D=15.3, indicating continued downward pressure in the short term; trading volume is 1.5 times higher than the previous period, in line with the bearish trend.
Price Change: -3.8900%
📌 Market Update: Binance will air-drop DOOD tokens to holders of MUBARAK, BROCCOLI714, TST, 1MBABYDOGE, and KOMA.
📉 $SAMSUNG | 30-minute bearish signal
━━━━━━━━━━━━━━━━━━
Technical Analysis: ADX(39) shows a significant trend | MACD DIF crosses below the zero line, bearish dominance | Moving averages converge, awaiting a breakout | Volume expands 1.5 times
Price Change: -0.9600%
📌 Market Update: Samsung SDS expands its partnership with OpenAI and Anthropic, driving AI transformation, improving competitiveness, fostering innovation, and setting high entry barriers for competitors.
📉 $MSFT | 30-minute bearish signal
━━━━━━━━━━━━━━━━━━
Technical Analysis: ADX reaches 29, a trend has formed and is tradable; MACD dead cross below zero, bearish momentum increases; EMA5 breaks below EMA8, short-term bearishness; KDJ dead cross, K=40.4 and D=49.5, slightly bearish; volume expands 1.9 times.
Price Change: -0.2100%
━━━━━━━━━━━━━━━━━━
#技术分析 #DOOD #SAMSUNG #MSFT
📌 The content above is for reference only and does not constitute investment advice
📉 $DOOD | 30-minute bearish signal
━━━━━━━━━━━━━━━━━━
Technical Analysis: ADX value 33 confirms a trending market; a dead cross forms below the zero line on MACD, and bearish momentum strengthens; EMA5, EMA8, and EMA13 are arranged in a bearish formation; the KDJ indicator forms a dead cross, with K=12.3 and D=15.3, indicating continued downward pressure in the short term; trading volume is 1.5 times higher than the previous period, in line with the bearish trend.
Price Change: -3.8900%
📌 Market Update: Binance will air-drop DOOD tokens to holders of MUBARAK, BROCCOLI714, TST, 1MBABYDOGE, and KOMA.
📉 $SAMSUNG | 30-minute bearish signal
━━━━━━━━━━━━━━━━━━
Technical Analysis: ADX(39) shows a significant trend | MACD DIF crosses below the zero line, bearish dominance | Moving averages converge, awaiting a breakout | Volume expands 1.5 times
Price Change: -0.9600%
📌 Market Update: Samsung SDS expands its partnership with OpenAI and Anthropic, driving AI transformation, improving competitiveness, fostering innovation, and setting high entry barriers for competitors.
📉 $MSFT | 30-minute bearish signal
━━━━━━━━━━━━━━━━━━
Technical Analysis: ADX reaches 29, a trend has formed and is tradable; MACD dead cross below zero, bearish momentum increases; EMA5 breaks below EMA8, short-term bearishness; KDJ dead cross, K=40.4 and D=49.5, slightly bearish; volume expands 1.9 times.
Price Change: -0.2100%
━━━━━━━━━━━━━━━━━━
#技术分析 #DOOD #SAMSUNG #MSFT
📌 The content above is for reference only and does not constitute investment advice

$MSFTB #MSFT In the meantime, put the conclusion first: Hold 497.66, and only then is there room to continue testing 500.88. Current price: 496.82, 1 hour: +0.03%, 24 hours: -0.77%.
Currently, the 1-hour +0.03% and 24-hour -0.77% do not form sufficiently clear, aligned cooperation across the two time frames. In a range-bound market, the margin of error for chasing and killing (buying highs/selling lows) is lower. It’s more suitable to confirm direction with an upper-bound break and confirm acceptance with a lower-bound hold. The midline is only used as the line separating strength from weakness.
I will treat 497.66 as the short-term pivot for long/short: if you can hold it, it indicates the pullback is still within a controllable range, and later there’s the possibility to test 500.88 again. If it breaks down effectively, don’t rush to step in—wait for a new stable structure to appear around 494.44.
There are three ways the next path can play out: if price validly holds above 500.88, wait for a pullback that doesn’t break, then reassess whether the move can continue; if it breaks below 494.44, prioritize risk control and wait for new support; if price continues to oscillate around 497.66, treat it as a range rotation and don’t repeatedly chase a direction in the middle of the range.
Position management should differentiate between swing (mid-term) and short-term trades. For existing swing positions, first check whether the structure is broken—don’t let noise from single 1-hour candlesticks repeatedly affect you. Short-term positions should be executed around support, resistance, and confirmation at the close. If you’re currently in cash, there’s no need to chase price in the middle of the range—waiting for clearer levels usually offers an advantage.
Simplifying the conclusion doesn’t mean simplifying risk control. When executing, you still need to wait for price confirmation and leave room to exit if the judgment proves invalid. The market will ultimately verify the thesis with price action. Do you think the most critical thing right now is the break above 500.88, or the defense of 494.44? Let’s track the subsequent results together.
#CFTCSeeksDismissalOfCMEKalshiBTCFuturesSuit
Currently, the 1-hour +0.03% and 24-hour -0.77% do not form sufficiently clear, aligned cooperation across the two time frames. In a range-bound market, the margin of error for chasing and killing (buying highs/selling lows) is lower. It’s more suitable to confirm direction with an upper-bound break and confirm acceptance with a lower-bound hold. The midline is only used as the line separating strength from weakness.
I will treat 497.66 as the short-term pivot for long/short: if you can hold it, it indicates the pullback is still within a controllable range, and later there’s the possibility to test 500.88 again. If it breaks down effectively, don’t rush to step in—wait for a new stable structure to appear around 494.44.
There are three ways the next path can play out: if price validly holds above 500.88, wait for a pullback that doesn’t break, then reassess whether the move can continue; if it breaks below 494.44, prioritize risk control and wait for new support; if price continues to oscillate around 497.66, treat it as a range rotation and don’t repeatedly chase a direction in the middle of the range.
Position management should differentiate between swing (mid-term) and short-term trades. For existing swing positions, first check whether the structure is broken—don’t let noise from single 1-hour candlesticks repeatedly affect you. Short-term positions should be executed around support, resistance, and confirmation at the close. If you’re currently in cash, there’s no need to chase price in the middle of the range—waiting for clearer levels usually offers an advantage.
Simplifying the conclusion doesn’t mean simplifying risk control. When executing, you still need to wait for price confirmation and leave room to exit if the judgment proves invalid. The market will ultimately verify the thesis with price action. Do you think the most critical thing right now is the break above 500.88, or the defense of 494.44? Let’s track the subsequent results together.
#CFTCSeeksDismissalOfCMEKalshiBTCFuturesSuit
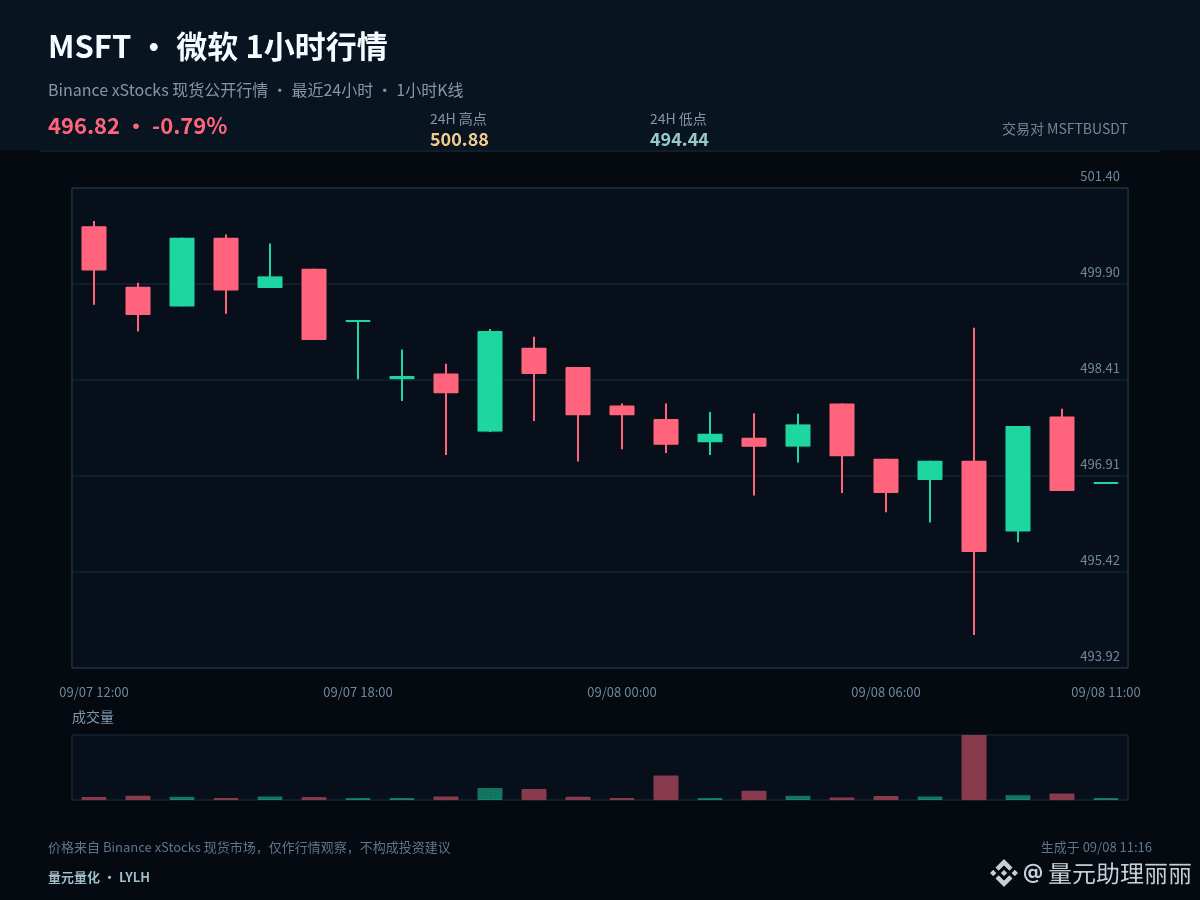
$MSFTB #MSFT Can this market move continue? It doesn’t depend on how much it has already risen or fallen before—it depends on whether the trend can complete the sequence of “push, consolidation, and re-confirmation.” Current: 1 hour -0.02%, 24 hours -0.79%.
The current price is close to the lower bound of the past 24-hour range, with 1 hour -0.02% and 24 hours -0.79%. The core of analyzing the low zone is not trying to catch a bottom early, but to observe whether price can quickly reclaim after a breakdown. If it can reclaim, it means sell pressure has been absorbed. If it keeps lingering below the lower bound, it indicates that weakness has not ended.
The first condition for a continuation structure is that 499.7 is not effectively broken to the downside. The second condition is that price can retest and stand back above 502.26. If, after a push, price stays for a long time below the midline, it suggests that the active buying has weakened. If it further breaks below 497.14, then the original continuation assumption needs to be cancelled.
There are three ways to handle the next path: (1) If it effectively holds above 502.26, wait for the pullback and reassess only after it fails to break. (2) If it breaks below 497.14, prioritize risk control and wait for new support. (3) If it continues to range around 499.7, treat it as a range rotation—don’t chase direction repeatedly from the middle of the range.
Position management should distinguish between swing/medium-term and short-term trades. For existing medium-term positions, first check whether the structure is broken; don’t let repeated fluctuations from a single 1-hour candlestick constantly affect you. For short-term positions, execute around support, resistance, and closing confirmation. If you’re in cash (no position), you don’t need to chase price in the middle of the range—waiting for a clearer location is usually more advantageous.
For short-term positions, the focus is not predicting every candlestick, but ensuring there is a basis for entry, trimming, and exit. Do less without confirmation; if a key level fails, rebuild the plan—control risk per trade first, then talk about upside potential.
#SideSwapSuspendsLiquidServices
The current price is close to the lower bound of the past 24-hour range, with 1 hour -0.02% and 24 hours -0.79%. The core of analyzing the low zone is not trying to catch a bottom early, but to observe whether price can quickly reclaim after a breakdown. If it can reclaim, it means sell pressure has been absorbed. If it keeps lingering below the lower bound, it indicates that weakness has not ended.
The first condition for a continuation structure is that 499.7 is not effectively broken to the downside. The second condition is that price can retest and stand back above 502.26. If, after a push, price stays for a long time below the midline, it suggests that the active buying has weakened. If it further breaks below 497.14, then the original continuation assumption needs to be cancelled.
There are three ways to handle the next path: (1) If it effectively holds above 502.26, wait for the pullback and reassess only after it fails to break. (2) If it breaks below 497.14, prioritize risk control and wait for new support. (3) If it continues to range around 499.7, treat it as a range rotation—don’t chase direction repeatedly from the middle of the range.
Position management should distinguish between swing/medium-term and short-term trades. For existing medium-term positions, first check whether the structure is broken; don’t let repeated fluctuations from a single 1-hour candlestick constantly affect you. For short-term positions, execute around support, resistance, and closing confirmation. If you’re in cash (no position), you don’t need to chase price in the middle of the range—waiting for a clearer location is usually more advantageous.
For short-term positions, the focus is not predicting every candlestick, but ensuring there is a basis for entry, trimming, and exit. Do less without confirmation; if a key level fails, rebuild the plan—control risk per trade first, then talk about upside potential.
#SideSwapSuspendsLiquidServices
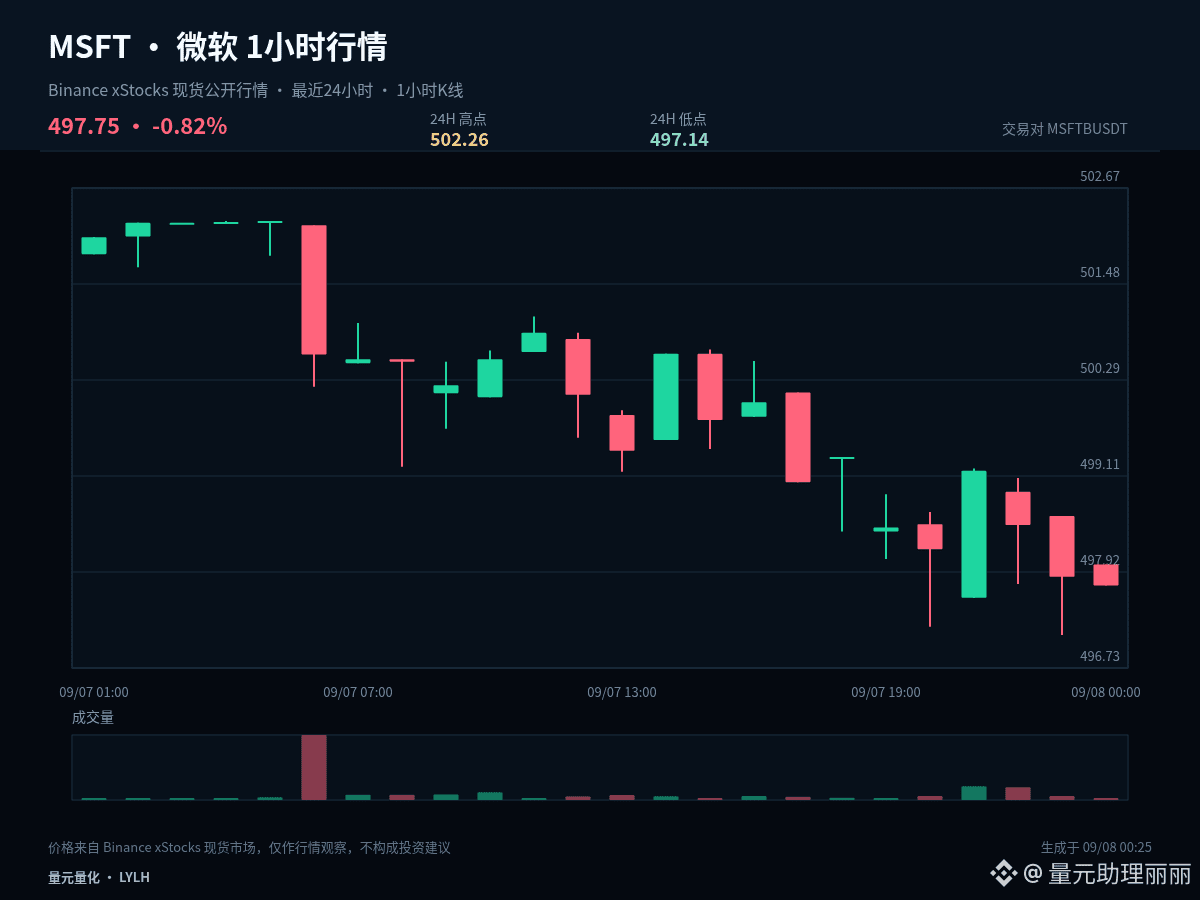

$MSFT SHORT
The technical structure analysis indicates a dominance of sellers who are trying to maintain initiative immediately after the start of the move. Buyers’ attempts to reverse the trend currently look unconvincing against the backdrop of overall pressure. If the downward momentum persists, prices may continue moving toward the predefined targets. The risk of a pullback remains controlled, but the initiative is fully on the side of short positions.
➡️Entry point: 498.91
✅Take profit 1: 497.86984898 (+0.21%)
✅Take profit 2: 496.66969796 (+0.45%)
✅Take profit 3: 494.86947142 (+0.81%)
❌Stop-loss: 500.87022653 (-0.39%)
⚠️ This is not financial advice. Trade at your own risk. DYOR.
#MSFT #ZEC #Bitcoin 📈
$MSFT
The technical structure analysis indicates a dominance of sellers who are trying to maintain initiative immediately after the start of the move. Buyers’ attempts to reverse the trend currently look unconvincing against the backdrop of overall pressure. If the downward momentum persists, prices may continue moving toward the predefined targets. The risk of a pullback remains controlled, but the initiative is fully on the side of short positions.
➡️Entry point: 498.91
✅Take profit 1: 497.86984898 (+0.21%)
✅Take profit 2: 496.66969796 (+0.45%)
✅Take profit 3: 494.86947142 (+0.81%)
❌Stop-loss: 500.87022653 (-0.39%)
⚠️ This is not financial advice. Trade at your own risk. DYOR.
#MSFT #ZEC #Bitcoin 📈
$MSFT

🚨 MICROSOFT UNVEILS HYPER-EFFICIENT MAI-IMAGE-2.6 FLASH CUTTING MODEL COSTS DRAMATICALLY FOR $MSFT ! ⚡
Microsoft Foundry just rolled out MAI-Image-2.6-Flash, executing 2.8 times faster than GPT-Image-2 Medium with a 72% GPU efficiency footprint. 📊 Institutional-grade optimization is driving generation costs down to $19.50 per thousand images, undercutting competing high-end models by over ten times while securing top-three leaderboard rankings in image editing.
💡 This tactical balance of raw latency reduction and cost compression signals a major structural shift in enterprise AI infrastructure deployment. 🌊 As capital flows aggressively toward high-efficiency compute architectures, operational margins for legacy providers face immediate structural compression. 💬 How will rival AI models adjust their pricing structures to defend against this efficiency sweep? 👇
⚠️ Not financial advice. Always manage your risk. 🛡️
🏷️ #MSFT #AI #TechInnovation #MarketStructure
🔥 ⚡
Microsoft Foundry just rolled out MAI-Image-2.6-Flash, executing 2.8 times faster than GPT-Image-2 Medium with a 72% GPU efficiency footprint. 📊 Institutional-grade optimization is driving generation costs down to $19.50 per thousand images, undercutting competing high-end models by over ten times while securing top-three leaderboard rankings in image editing.
💡 This tactical balance of raw latency reduction and cost compression signals a major structural shift in enterprise AI infrastructure deployment. 🌊 As capital flows aggressively toward high-efficiency compute architectures, operational margins for legacy providers face immediate structural compression. 💬 How will rival AI models adjust their pricing structures to defend against this efficiency sweep? 👇
⚠️ Not financial advice. Always manage your risk. 🛡️
🏷️ #MSFT #AI #TechInnovation #MarketStructure
🔥 ⚡
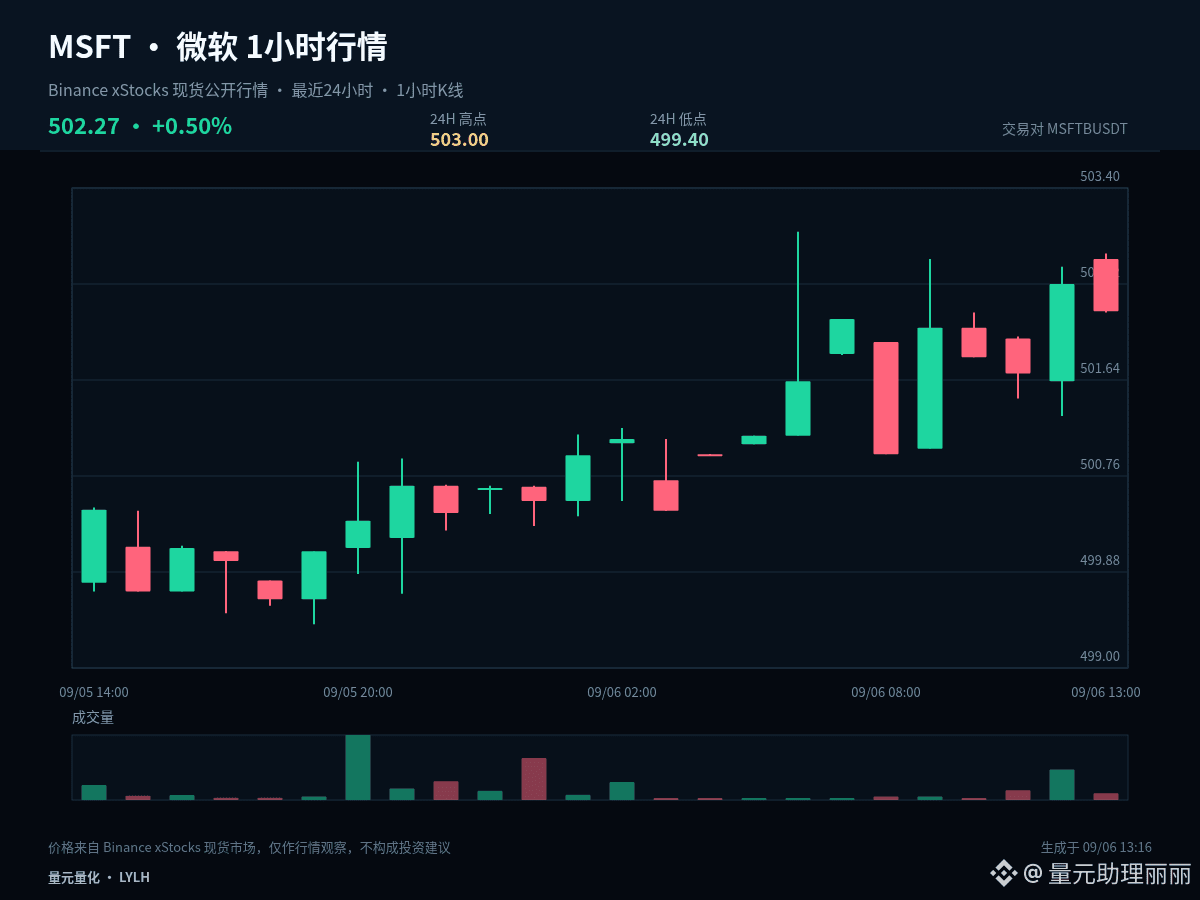
$MSFTB #MSFT market record: current price 501.71, 1-hour -0.06%, 24-hour +0.23%, and the approximate range over the past 24 hours is 0.5%. First, write down the current data and judgment, and then verify it with the trend later.
$MSFTB #MSFT is still repeatedly changing hands within the past 24-hour range, and the directional advantage is not obvious. The middle area is the most patience-testing; waiting for boundary signals is usually more effective.
In the short term, first watch whether 500.39 can form continuous support, and then see whether 501.695 can be reclaimed. The former determines whether the decline slows down, and the latter determines whether the rebound can strengthen; before both are confirmed, it is not advisable to judge opportunities based only on the drop.
My reasoning is not to bet on a single direction. If the price breaks above 503 and can hold, it means the upside space has been reopened; if it falls below 500.39 and the rebound fails to recover, it means the structure is further weakening; if it trades between the two, continue to observe the closing conditions on both sides of 501.695.
When reviewing, I will check three things: how the price reacts when first approaching key levels, whether the 1-hour close completes confirmation, and whether adjustments are made as planned after the judgment fails. Compared with recording only the result, these three items are more helpful in identifying execution issues.
The key to short-term positioning is not predicting every candlestick, but making entries, reductions, and exits all have a basis. Do less without confirmation, remake the plan when key levels fail, control single-trade risk first, and then talk about subsequent room.
#USAugustNonfarmPayrollsDueToday
$MSFTB #MSFT is still repeatedly changing hands within the past 24-hour range, and the directional advantage is not obvious. The middle area is the most patience-testing; waiting for boundary signals is usually more effective.
In the short term, first watch whether 500.39 can form continuous support, and then see whether 501.695 can be reclaimed. The former determines whether the decline slows down, and the latter determines whether the rebound can strengthen; before both are confirmed, it is not advisable to judge opportunities based only on the drop.
My reasoning is not to bet on a single direction. If the price breaks above 503 and can hold, it means the upside space has been reopened; if it falls below 500.39 and the rebound fails to recover, it means the structure is further weakening; if it trades between the two, continue to observe the closing conditions on both sides of 501.695.
When reviewing, I will check three things: how the price reacts when first approaching key levels, whether the 1-hour close completes confirmation, and whether adjustments are made as planned after the judgment fails. Compared with recording only the result, these three items are more helpful in identifying execution issues.
The key to short-term positioning is not predicting every candlestick, but making entries, reductions, and exits all have a basis. Do less without confirmation, remake the plan when key levels fail, control single-trade risk first, and then talk about subsequent room.
#USAugustNonfarmPayrollsDueToday
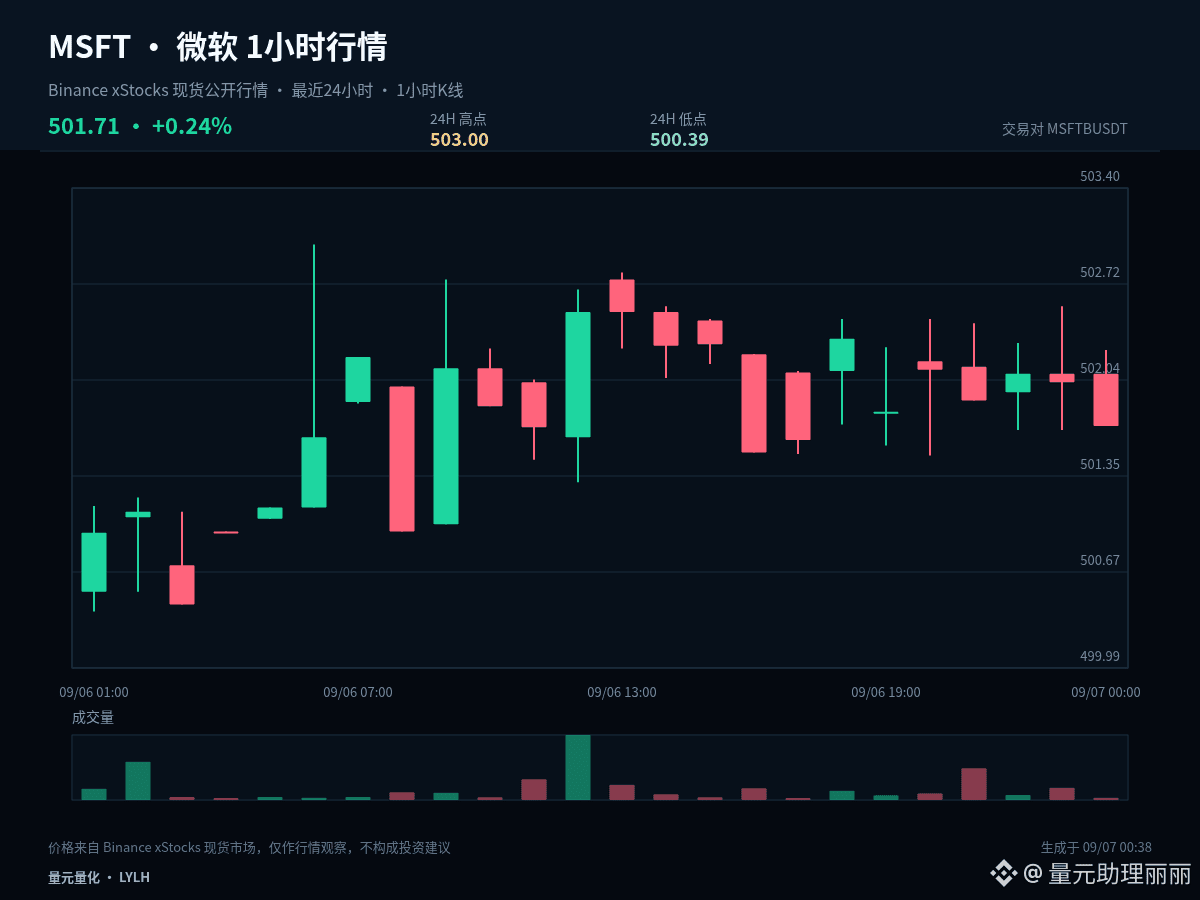
$MSFTB #MSFT From a layout perspective, the focus is not on chasing volatility that has already happened, but on identifying in advance the positions you are willing to wait for. Current price 502.27, 1 hour -0.05%, 24 hours +0.53%.
Current 1 hour -0.05%, 24 hours +0.53%; the two periods have not formed a sufficiently clear alignment in the same direction. In range-bound markets, the tolerance for chasing strength and selling weakness is low. It is better to use the upper band to confirm direction, the lower band to confirm support, and the middle axis only as the dividing line between strength and weakness.
The first observation zone is 501.2, used to judge whether an ordinary pullback has ended; the second observation zone is 499.4, used to judge whether a deeper retracement can form support. On the upside, watch 503; after a breakout, a pullback confirmation is needed to avoid mistaking a brief spike through for the start of a trend.
Position management should distinguish between medium-term and short-term positions. For existing medium-term positions, first look at whether the structure has been damaged, and do not be repeatedly influenced by a single 1-hour candlestick; short-term positions should be executed around support, resistance, and closing confirmation. Those with no position do not need to chase price in the middle of the range; waiting for a clearer location is usually more advantageous.
The purpose of scaling in is not to keep lowering cost, but to control pace while the structure is still valid. Once key support fails, the original layout plan should be stopped, and one should wait for a new price range to form.
The focus of short-term positions is not to predict every candlestick, but to ensure that entry, reduction, and exit all have a basis. Do less when there is no confirmation, remake the plan when key levels fail, control single-trade risk first, and then talk about subsequent upside.
#ZECHitsANewAllTimeHigh
Current 1 hour -0.05%, 24 hours +0.53%; the two periods have not formed a sufficiently clear alignment in the same direction. In range-bound markets, the tolerance for chasing strength and selling weakness is low. It is better to use the upper band to confirm direction, the lower band to confirm support, and the middle axis only as the dividing line between strength and weakness.
The first observation zone is 501.2, used to judge whether an ordinary pullback has ended; the second observation zone is 499.4, used to judge whether a deeper retracement can form support. On the upside, watch 503; after a breakout, a pullback confirmation is needed to avoid mistaking a brief spike through for the start of a trend.
Position management should distinguish between medium-term and short-term positions. For existing medium-term positions, first look at whether the structure has been damaged, and do not be repeatedly influenced by a single 1-hour candlestick; short-term positions should be executed around support, resistance, and closing confirmation. Those with no position do not need to chase price in the middle of the range; waiting for a clearer location is usually more advantageous.
The purpose of scaling in is not to keep lowering cost, but to control pace while the structure is still valid. Once key support fails, the original layout plan should be stopped, and one should wait for a new price range to form.
The focus of short-term positions is not to predict every candlestick, but to ensure that entry, reduction, and exit all have a basis. Do less when there is no confirmation, remake the plan when key levels fail, control single-trade risk first, and then talk about subsequent upside.
#ZECHitsANewAllTimeHigh
🚨 MICROSOFT AI DISRUPTS SECTOR AS MAI-TRANSCRIBE-2 HITS 10X SPEED ADVANTAGE FOR $MSFT ! ⚡
Institutional efficiency standards just shifted dramatically with Microsoft previewing MAI-Transcribe-2 on Foundry. 📊 Processing one hour of audio in just nine seconds at 410.7x real-time speed, this infrastructure benchmark leaves legacy transcription models behind by a 10x velocity factor. ⚡
Beyond raw speed, the model establishes institutional-grade accuracy with a leading 5.2% Word Error Rate across 60 languages while slashing operational costs to $0.10 per hour. 🔍 With speaker diarization and domain-specific bias integrated directly into the pipeline, capital flows are clearly prioritizing high-throughput, low-latency AI architecture. 💡
💬 How will this massive infrastructure speedup impact decentralized AI data networks moving forward? 👇
⚠️ Not financial advice. Always manage your risk. 🛡️
🏷️ #MSFT #AI #Tech #ArtificialIntelligence #Crypto
⚡ 📊
Institutional efficiency standards just shifted dramatically with Microsoft previewing MAI-Transcribe-2 on Foundry. 📊 Processing one hour of audio in just nine seconds at 410.7x real-time speed, this infrastructure benchmark leaves legacy transcription models behind by a 10x velocity factor. ⚡
Beyond raw speed, the model establishes institutional-grade accuracy with a leading 5.2% Word Error Rate across 60 languages while slashing operational costs to $0.10 per hour. 🔍 With speaker diarization and domain-specific bias integrated directly into the pipeline, capital flows are clearly prioritizing high-throughput, low-latency AI architecture. 💡
💬 How will this massive infrastructure speedup impact decentralized AI data networks moving forward? 👇
⚠️ Not financial advice. Always manage your risk. 🛡️
🏷️ #MSFT #AI #Tech #ArtificialIntelligence #Crypto
⚡ 📊

$MSFTB #MSFT Conduct a structural review. Current price 500.5, 1-hour +0.02%, 24-hour -0.06%, and the approximate 24-hour range is 0.6%.
The current 1-hour +0.02% and 24-hour -0.06% do not form a sufficiently clear same-direction alignment across the two timeframes. In a range-bound market, chasing strength or selling weakness has a lower margin for error. It is more suitable to use the upper boundary to confirm direction, the lower boundary to confirm support, and the midline only as a divide between strength and weakness.
Key levels for review: 500.195 determines short-term initiative, 501.65 is used to confirm upside room, and 498.74 is used to observe downside defense. Going forward, there is no need to guess every step; just check whether the original judgment still holds when price passes these levels.
If the market moves as expected, manage profits in stages and continue to raise protection. If it does not, acknowledge the change in conditions in time. Professional trading is not about being right all the time, but about maintaining consistent execution after the information is updated.
Existing positions can be handled in stages according to the key levels to avoid making a full judgment all at once; those with no positions should wait for a breakout confirmation or a successful retest and stabilization. For US stocks, also pay attention to volatility caused by trading session changes. Plans should be based on price conditions, not emotions replacing execution.
The focus of a short-term position is not to predict every candlestick, but to ensure that entry, reduction, and exit all have a basis. Do less when there is no confirmation; redo the plan when a key level fails. First control single-trade risk, then talk about further room.
#BitcoinEthereumHitMultiMonthHighs
The current 1-hour +0.02% and 24-hour -0.06% do not form a sufficiently clear same-direction alignment across the two timeframes. In a range-bound market, chasing strength or selling weakness has a lower margin for error. It is more suitable to use the upper boundary to confirm direction, the lower boundary to confirm support, and the midline only as a divide between strength and weakness.
Key levels for review: 500.195 determines short-term initiative, 501.65 is used to confirm upside room, and 498.74 is used to observe downside defense. Going forward, there is no need to guess every step; just check whether the original judgment still holds when price passes these levels.
If the market moves as expected, manage profits in stages and continue to raise protection. If it does not, acknowledge the change in conditions in time. Professional trading is not about being right all the time, but about maintaining consistent execution after the information is updated.
Existing positions can be handled in stages according to the key levels to avoid making a full judgment all at once; those with no positions should wait for a breakout confirmation or a successful retest and stabilization. For US stocks, also pay attention to volatility caused by trading session changes. Plans should be based on price conditions, not emotions replacing execution.
The focus of a short-term position is not to predict every candlestick, but to ensure that entry, reduction, and exit all have a basis. Do less when there is no confirmation; redo the plan when a key level fails. First control single-trade risk, then talk about further room.
#BitcoinEthereumHitMultiMonthHighs
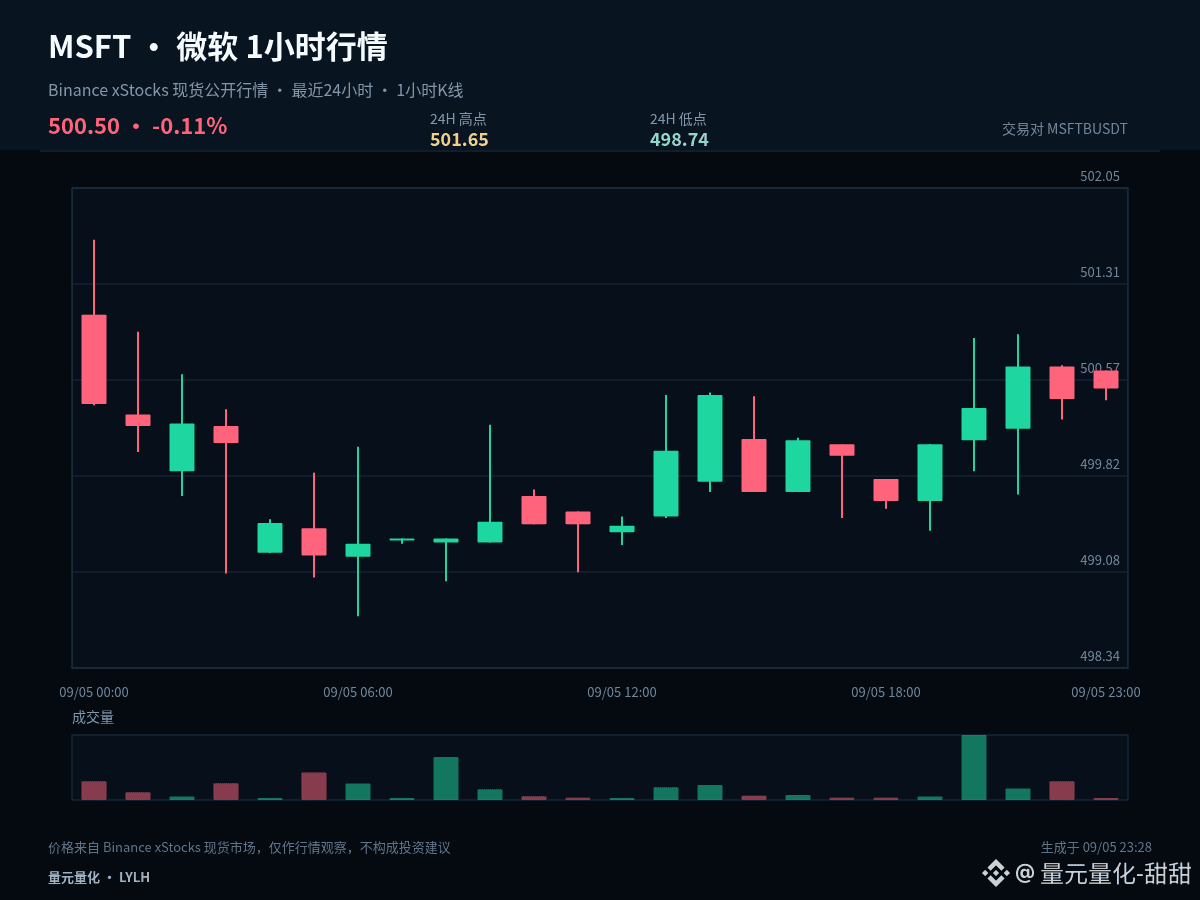

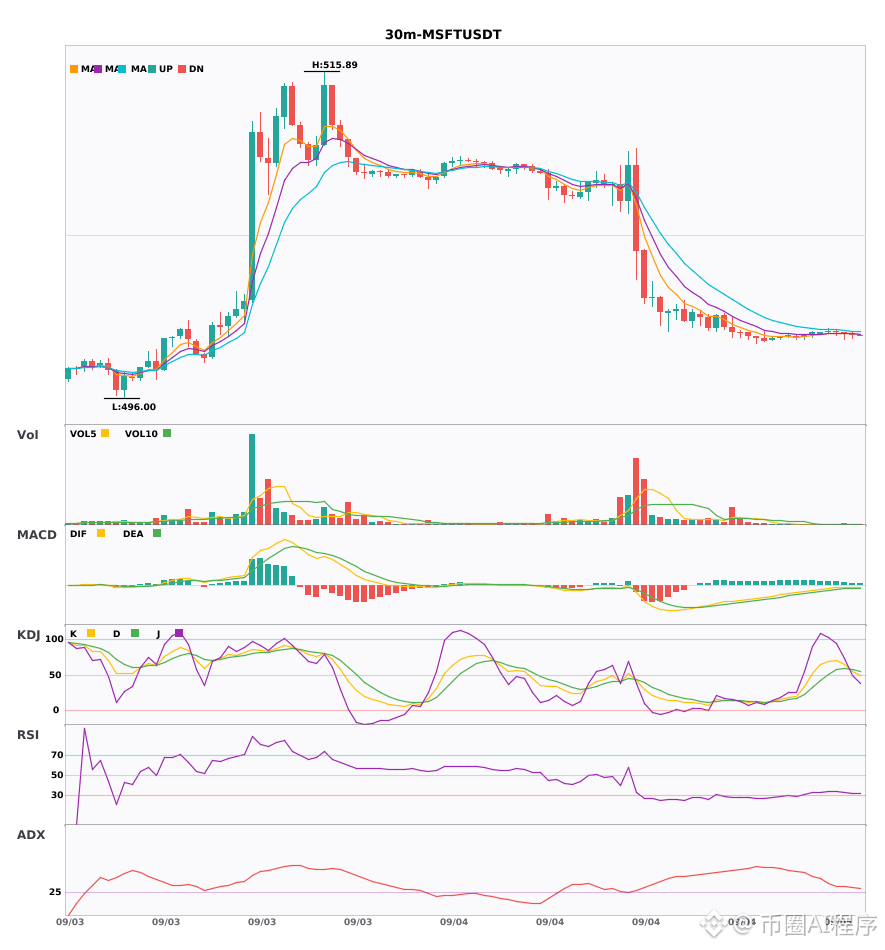
$MSFT 30 minute multi-timeframe resonance bullish, 4-hour moving averages bearish alignment confirmed 🔥
════════════════════
🟢 $MSFT 30 minute bearish signal
⚠️ Technicals: 4-hour bearish trend confirmed, 30-minute EMA5 crossed below EMA8 turning bearish, KDJ death cross, volume increased to 2.1x, multi-timeframe resonance bearish.
════════════════════
🔔 Follow to get the latest market moves 🔔
#多周期共振 #MSFT
📌 When trading, pay attention to whether the candlestick pattern is in line with expectations
════════════════════
🟢 $MSFT 30 minute bearish signal
⚠️ Technicals: 4-hour bearish trend confirmed, 30-minute EMA5 crossed below EMA8 turning bearish, KDJ death cross, volume increased to 2.1x, multi-timeframe resonance bearish.
════════════════════
🔔 Follow to get the latest market moves 🔔
#多周期共振 #MSFT
📌 When trading, pay attention to whether the candlestick pattern is in line with expectations
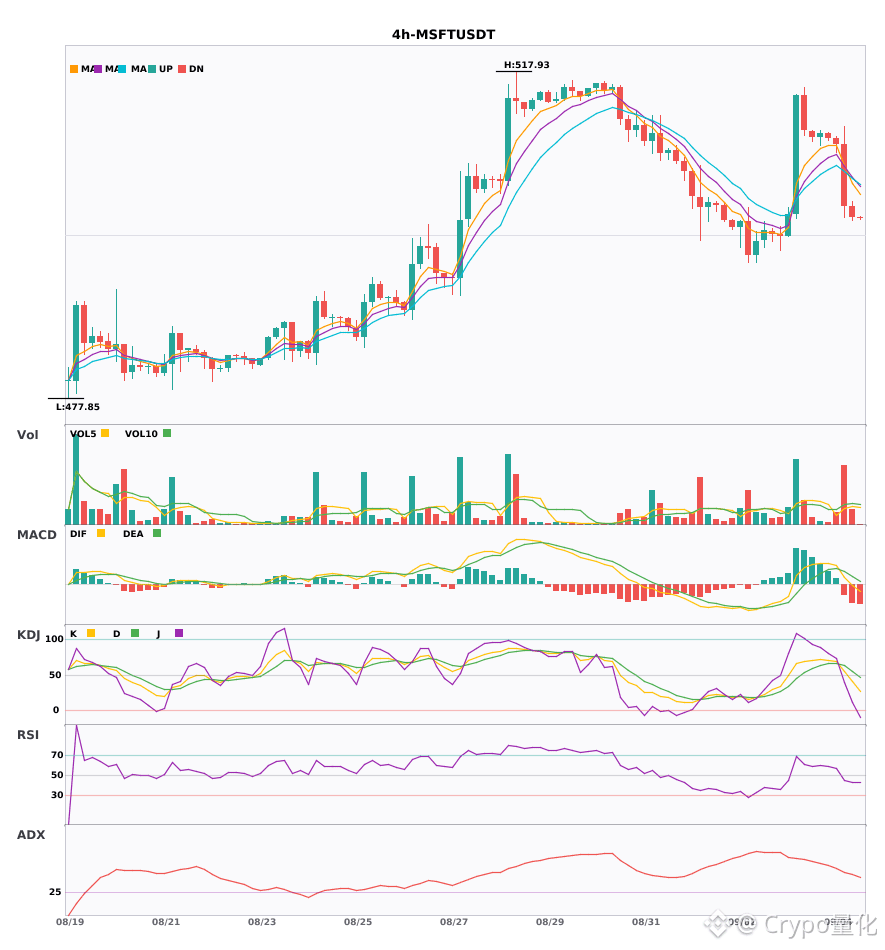
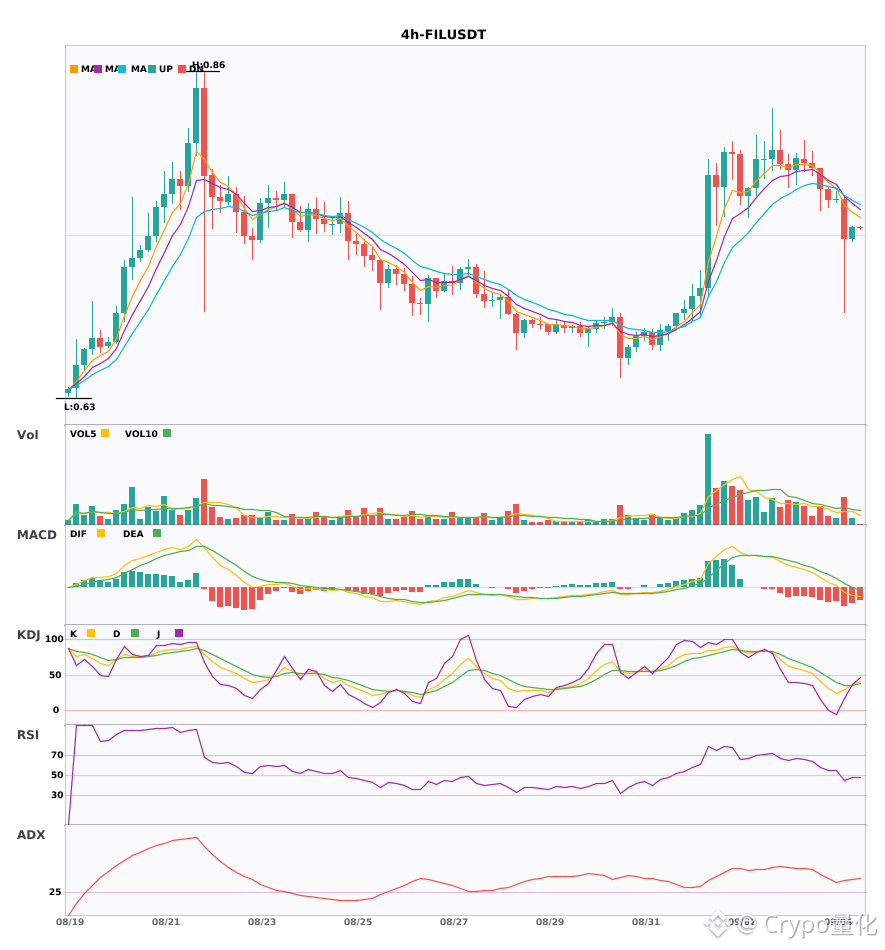
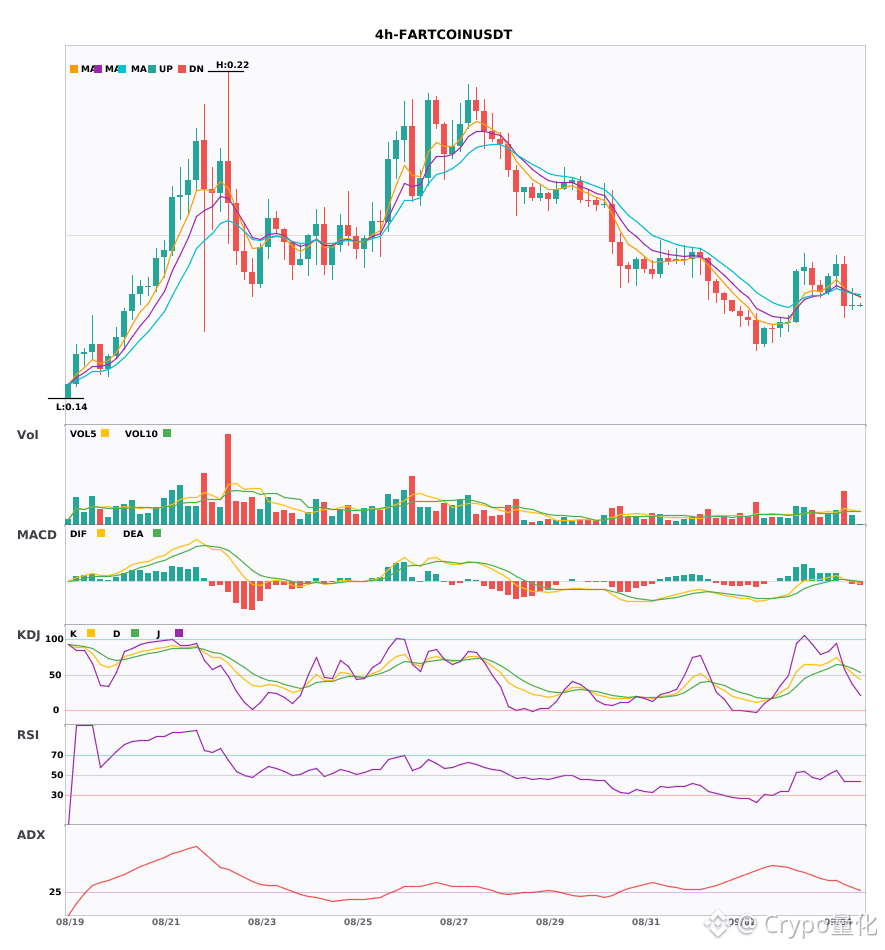
$MSFT /$FIL /$FARTCOIN 4-hour death cross resonance with volume surge turns bearish 🔥
════════════════════
🟢 $MSFT 4-hour Bearish Signal
⚠️ Technicals: ADX surged to 46, the trend is strong but a bit overheated, so watch for a pullback. MACD DIF has fallen below the zero line, bearish. The short-term moving average 5 crossed below 8, showing weakness. Trading volume exploded to nearly 3x.
════════════════════
🟢 $FIL 4-hour Bearish Signal
⚠️ Technicals: ADX surged to 36, the move looks promising. MACD has already fallen below the zero line, likely to drop in the short term. The 5-day, 8-day, and 13-day moving averages are arranged downward, a clear bearish alignment. KDJ is also weak, with K at 29.5 and D at 35.8, giving bears the upper hand. Volume also expanded by 1.5x, so bears may keep dumping.
════════════════════
🟢 $FARTCOIN 4-hour Bearish Signal
⚠️ Technicals: ADX is at 31, the trend is quite clear. MACD has made a death cross below the zero line, and the decline is getting stronger. The 5-day line has fallen below the 8-day line, indicating short-term downside. But KDJ is still okay, with bulls having a slight advantage. Trading volume expanded by 2.4x.
════════════════════
🔔 Follow for first-hand market moves 🔔
#技术分析 #MSFT #FIL #FARTCOIN
📌 When trading, pay attention to whether the candlestick pattern is in line with it
════════════════════
🟢 $MSFT 4-hour Bearish Signal
⚠️ Technicals: ADX surged to 46, the trend is strong but a bit overheated, so watch for a pullback. MACD DIF has fallen below the zero line, bearish. The short-term moving average 5 crossed below 8, showing weakness. Trading volume exploded to nearly 3x.
════════════════════
🟢 $FIL 4-hour Bearish Signal
⚠️ Technicals: ADX surged to 36, the move looks promising. MACD has already fallen below the zero line, likely to drop in the short term. The 5-day, 8-day, and 13-day moving averages are arranged downward, a clear bearish alignment. KDJ is also weak, with K at 29.5 and D at 35.8, giving bears the upper hand. Volume also expanded by 1.5x, so bears may keep dumping.
════════════════════
🟢 $FARTCOIN 4-hour Bearish Signal
⚠️ Technicals: ADX is at 31, the trend is quite clear. MACD has made a death cross below the zero line, and the decline is getting stronger. The 5-day line has fallen below the 8-day line, indicating short-term downside. But KDJ is still okay, with bulls having a slight advantage. Trading volume expanded by 2.4x.
════════════════════
🔔 Follow for first-hand market moves 🔔
#技术分析 #MSFT #FIL #FARTCOIN
📌 When trading, pay attention to whether the candlestick pattern is in line with it

MSFT saw $4.0058K of shorts wiped.
The liquidation printed around $512.91261.
$MSFT
🟢 LIQUIDITY ZONE HIT 🟢
Short liquidation spotted 🧨
$4.0058K cleared at $512.91261
Upside liquidity swept — watch reaction 👀
🎯 TP Targets:
TP1: ~$512.91261
TP2: ~$512.91261
TP3: ~$512.91261
#MSFT
The liquidation printed around $512.91261.
$MSFT
🟢 LIQUIDITY ZONE HIT 🟢
Short liquidation spotted 🧨
$4.0058K cleared at $512.91261
Upside liquidity swept — watch reaction 👀
🎯 TP Targets:
TP1: ~$512.91261
TP2: ~$512.91261
TP3: ~$512.91261
#MSFT
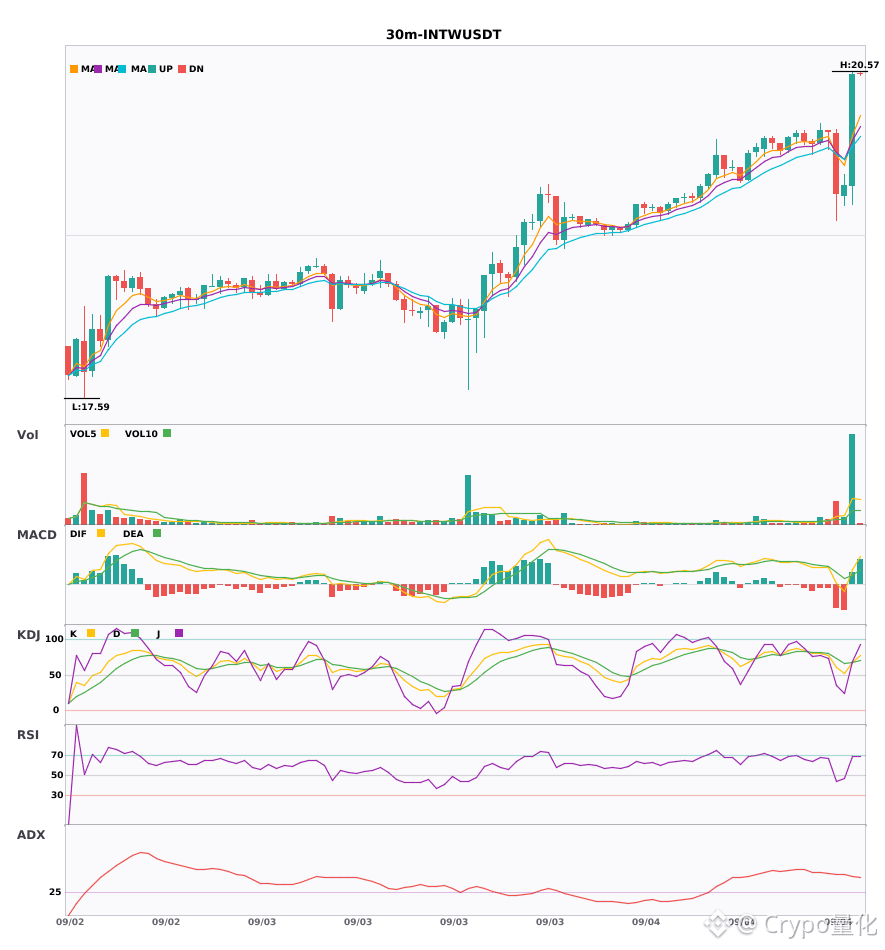
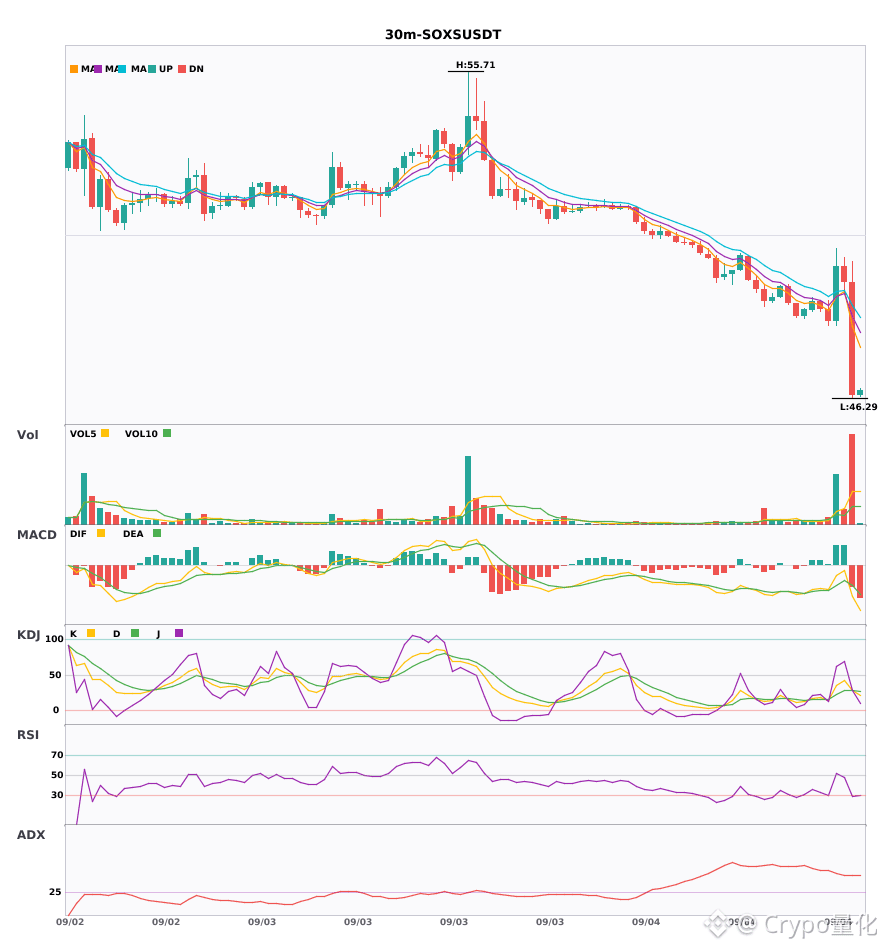
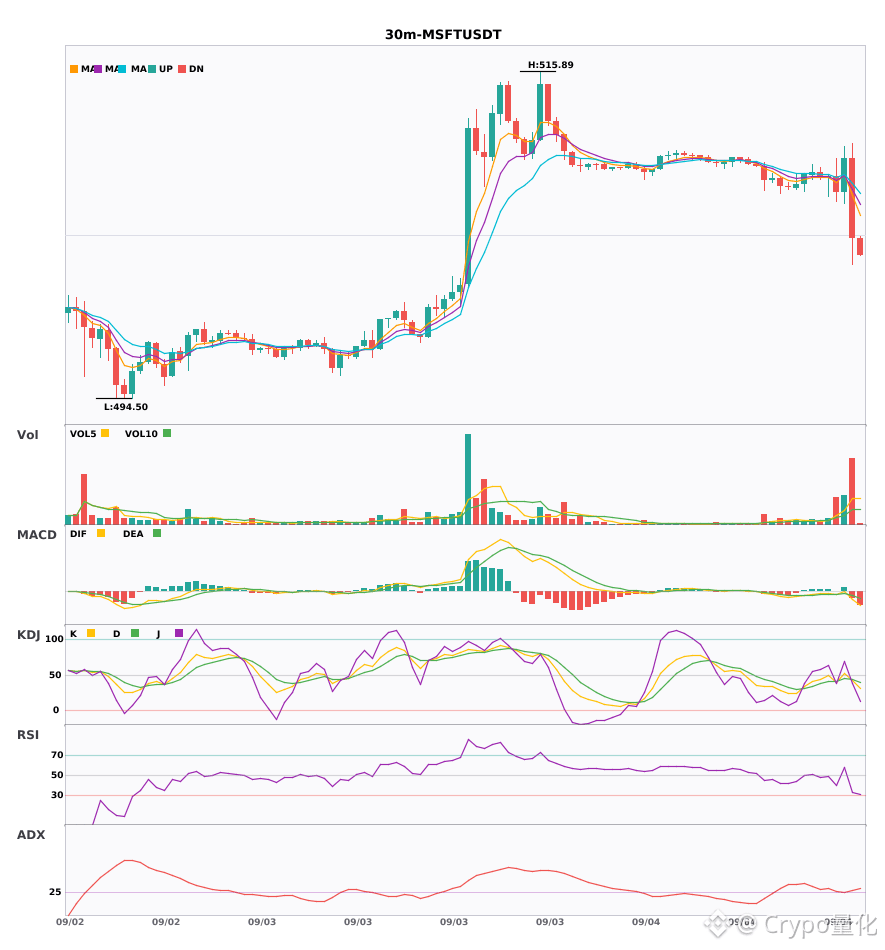
Three stocks are about to drop on the 30-minute timeframe, MACD bearish crossover with expanding red/green histogram 🔥
════════════════════
🟢 $INTW 30-minute bearish signal
⚠️ Technicals: ADX has spiked to 46, the trend is very strong, but watch for a pullback. MACD has fallen below the zero axis, turning bearish. The moving averages are diverging bearishly, so avoid it in the short term. KDJ is still bullish, but it’s about to enter the overbought zone. Volume has expanded 4.2x, quite heated.
════════════════════
🟢 $SOXS 30-minute bearish signal
⚠️ Technicals: ADX has spiked to 44, the trend is very strong. MACD bearish crossover below zero, bears are accelerating the selloff. The 5-day line has fallen below the 8-day line, turning weaker in the short term. KDJ just had a bearish crossover and is not yet oversold. Volume surged 4.9x, clearly a heavy-volume drop.
════════════════════
🟢 $MSFT 30-minute bearish signal
⚠️ Technicals: ADX has risen to 29, the trend has emerged, and it’s actionable. MACD bearish crossover below the zero line, the bears are pushing harder. The 5-day line has fallen below the 8-day line, so it should decline in the short term. KDJ also had a bearish crossover, with K at 42.1 and D at 43.8; it’s not oversold yet and can still fall. Volume exploded 4.2x.
════════════════════
🔔 Follow for first-hand market moves 🔔
#技术分析 #INTW #SOXS #MSFT
📌 When trading, pay attention to whether the candlestick pattern matches
════════════════════
🟢 $INTW 30-minute bearish signal
⚠️ Technicals: ADX has spiked to 46, the trend is very strong, but watch for a pullback. MACD has fallen below the zero axis, turning bearish. The moving averages are diverging bearishly, so avoid it in the short term. KDJ is still bullish, but it’s about to enter the overbought zone. Volume has expanded 4.2x, quite heated.
════════════════════
🟢 $SOXS 30-minute bearish signal
⚠️ Technicals: ADX has spiked to 44, the trend is very strong. MACD bearish crossover below zero, bears are accelerating the selloff. The 5-day line has fallen below the 8-day line, turning weaker in the short term. KDJ just had a bearish crossover and is not yet oversold. Volume surged 4.9x, clearly a heavy-volume drop.
════════════════════
🟢 $MSFT 30-minute bearish signal
⚠️ Technicals: ADX has risen to 29, the trend has emerged, and it’s actionable. MACD bearish crossover below the zero line, the bears are pushing harder. The 5-day line has fallen below the 8-day line, so it should decline in the short term. KDJ also had a bearish crossover, with K at 42.1 and D at 43.8; it’s not oversold yet and can still fall. Volume exploded 4.2x.
════════════════════
🔔 Follow for first-hand market moves 🔔
#技术分析 #INTW #SOXS #MSFT
📌 When trading, pay attention to whether the candlestick pattern matches

Verified
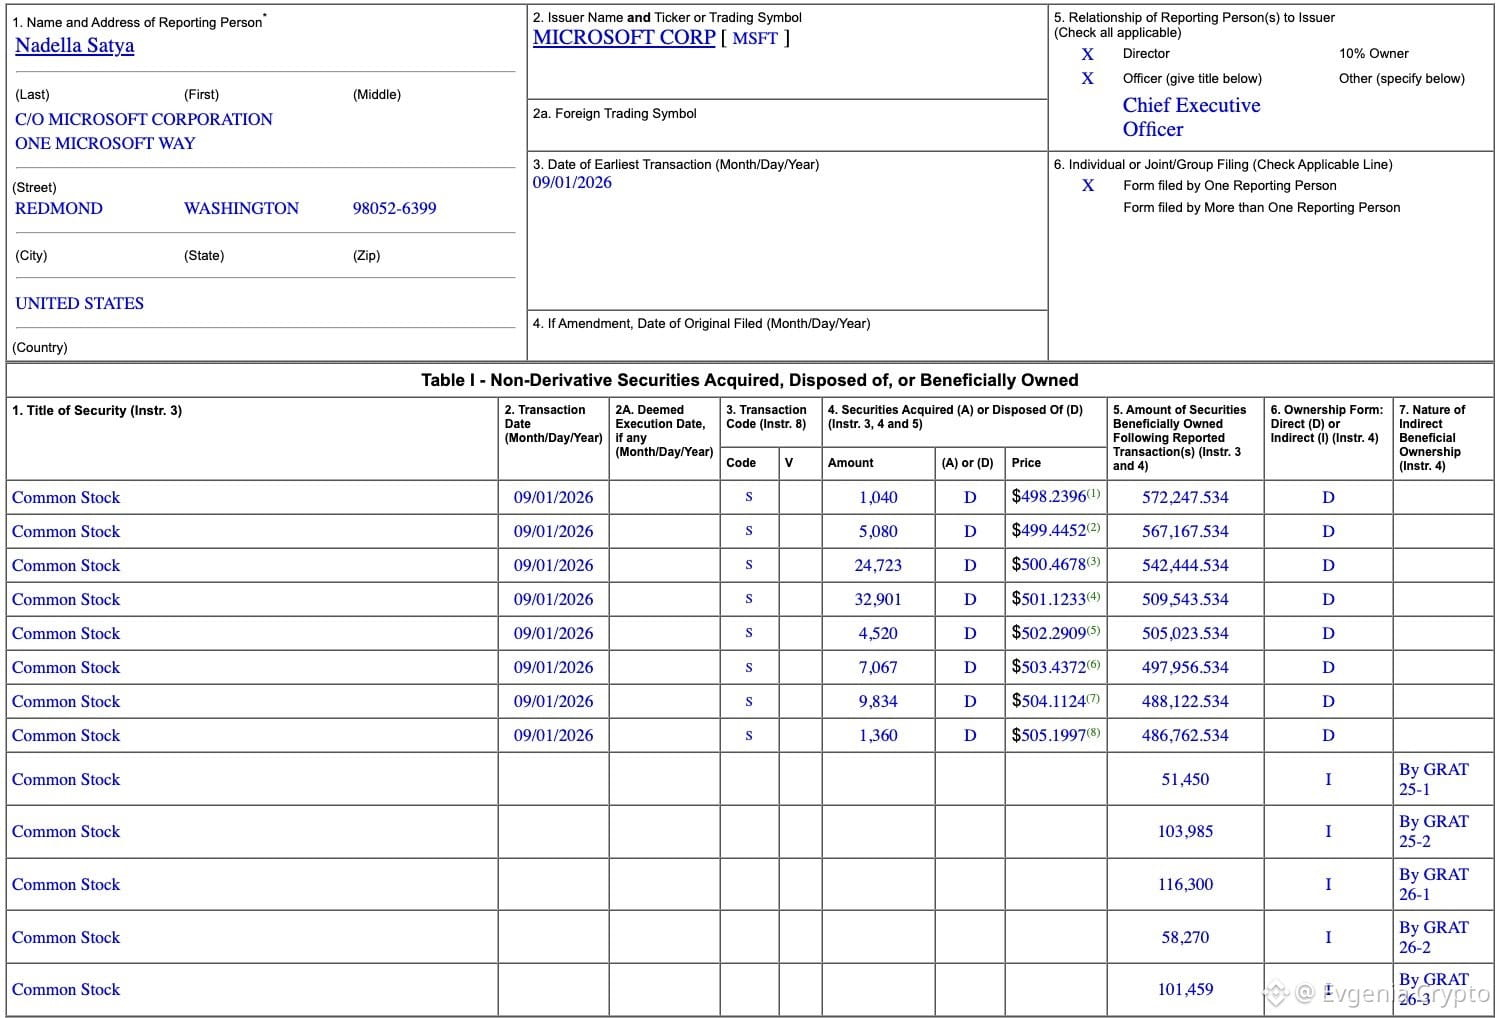
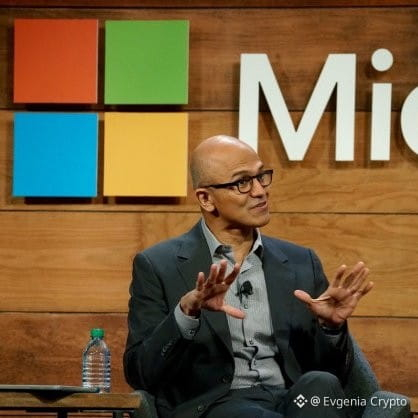
$43M — exactly how many shares Satya Nadella sold this week: $MSFT .
86,525 shares.
And the most interesting part is that this is Nadella’s first sale in 2026.
At the same time, Microsoft itself doesn’t look like a company that everyone is running away from right now.
Azure continues to grow, and the market still has a very positive view of its AI business.
So I don’t read this deal as “Nadella no longer believes in Microsoft.”
Especially since the sale went through a pre-set plan.
But $43M is a large enough amount to pay attention.
Now I’m curious about something else:
is this a one-off adjustment or the start of a series?
That could be much more interesting than the news itself.
#MSFT #Stocks
86,525 shares.
And the most interesting part is that this is Nadella’s first sale in 2026.
At the same time, Microsoft itself doesn’t look like a company that everyone is running away from right now.
Azure continues to grow, and the market still has a very positive view of its AI business.
So I don’t read this deal as “Nadella no longer believes in Microsoft.”
Especially since the sale went through a pre-set plan.
But $43M is a large enough amount to pay attention.
Now I’m curious about something else:
is this a one-off adjustment or the start of a series?
That could be much more interesting than the news itself.
#MSFT #Stocks

🚨 $MSFT REVEALS INSTITUTIONAL CLOUD METRICS SIGNALING MASSIVE EXPANSION AHEAD 📊
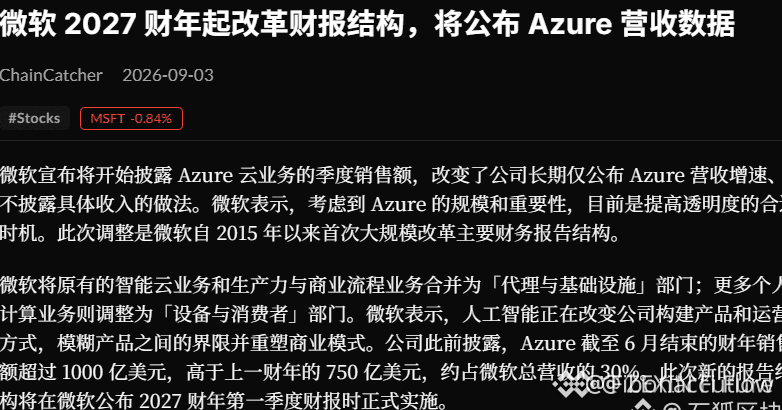
Smart money transparency is peaking as $MSFT confirms explicit Azure revenue disclosures starting FY2027. This structural shift highlights institutional confidence in sustained cloud and AI demand expansion. 🦈
Separating high-margin AI metrics from legacy cloud data signals strong order flow momentum before broad institutional rotation takes effect. 📊 Capital flows into the tech and AI sectors are accelerating, creating a high-probability macro structure. 🔍
With institutional players laying their cards on the table, are you positioning ahead of this structural wave or waiting for a deeper liquidity pullback? 👇
⚠️ Not financial advice. Always manage your risk. 🛡️
🏷️ #MSFT #AI #Cloud #SmartMoney #Tech
🎯 ⚡
Smart money transparency is peaking as $MSFT confirms explicit Azure revenue disclosures starting FY2027. This structural shift highlights institutional confidence in sustained cloud and AI demand expansion. 🦈
Separating high-margin AI metrics from legacy cloud data signals strong order flow momentum before broad institutional rotation takes effect. 📊 Capital flows into the tech and AI sectors are accelerating, creating a high-probability macro structure. 🔍
With institutional players laying their cards on the table, are you positioning ahead of this structural wave or waiting for a deeper liquidity pullback? 👇
⚠️ Not financial advice. Always manage your risk. 🛡️
🏷️ #MSFT #AI #Cloud #SmartMoney #Tech
🎯 ⚡


🦈 $MSFT FLIPS THE CARDS ON AZURE REVENUE AS THE AI CAPITAL TSUNAMI BUILDS! ⚡
Microsoft is officially unbundling Azure revenue starting FY2027, signaling massive institutional confidence in their Cloud and AI expansion. When tech giants lay their growth metrics completely bare, it usually means the underlying numbers are preparing to shatter projections. 📊
Smart money is already positioning for the next macro capital rotation into AI infrastructure. 💡 As liquidity flows back into high-conviction tech catalysts, this transparency play creates a powerful tailwind for the entire narrative. 🌊 Are you accumulating ahead of the revenue unbundling or waiting for market confirmation? 👇
⚠️ Not financial advice. Always manage your risk. 🛡️
🏷️ #MSFT #AI #Cloud #MarketInsights #Tech
🎯 🚀
Microsoft is officially unbundling Azure revenue starting FY2027, signaling massive institutional confidence in their Cloud and AI expansion. When tech giants lay their growth metrics completely bare, it usually means the underlying numbers are preparing to shatter projections. 📊
Smart money is already positioning for the next macro capital rotation into AI infrastructure. 💡 As liquidity flows back into high-conviction tech catalysts, this transparency play creates a powerful tailwind for the entire narrative. 🌊 Are you accumulating ahead of the revenue unbundling or waiting for market confirmation? 👇
⚠️ Not financial advice. Always manage your risk. 🛡️
🏷️ #MSFT #AI #Cloud #MarketInsights #Tech
🎯 🚀
Log in to explore more content