
威廉WIL
18 Posts

威廉WIL
Report
Block User
佛系加密研究员 | 公众号:威廉日志 | 微博:威廉的风向站 | 推特X:@weilianbtc6
1 Following
59 Followers
43 Liked
Posts
·
--

Article
BTC holds above $73,000, but institutions are still pulling out: Is this rebound really sustainable?There’s a noteworthy development in today’s crypto market:
BTC is currently hovering around $73,000, but market sentiment around capital flows has not improved significantly.
On the surface, Bitcoin has not continued to fall sharply. But judging by ETF flows, the dollar’s performance, and ETH’s relative performance, it is too soon to call the market stable.
I believe the most important thing to watch right now is not how much the market has rebounded, but when investors will be willing to re-enter.
I. BTC has stabilized for now, but the trend has not yet reversed
As of the Asian trading session on November 12, BTC briefly traded near $73,750, while ETH was around $2,038.
BTC holds above $73,000, but institutions are still pulling out: Is this rebound really sustainable?
There’s a noteworthy development in today’s crypto market:
BTC is currently hovering around $73,000, but market sentiment around capital flows has not improved significantly.
On the surface, Bitcoin has not continued to fall sharply. But judging by ETF flows, the dollar’s performance, and ETH’s relative performance, it is too soon to call the market stable.
I believe the most important thing to watch right now is not how much the market has rebounded, but when investors will be willing to re-enter.
I. BTC has stabilized for now, but the trend has not yet reversed
As of the Asian trading session on November 12, BTC briefly traded near $73,750, while ETH was around $2,038.
BTC is currently hovering around $73,000, but market sentiment around capital flows has not improved significantly.
On the surface, Bitcoin has not continued to fall sharply. But judging by ETF flows, the dollar’s performance, and ETH’s relative performance, it is too soon to call the market stable.
I believe the most important thing to watch right now is not how much the market has rebounded, but when investors will be willing to re-enter.
I. BTC has stabilized for now, but the trend has not yet reversed
As of the Asian trading session on November 12, BTC briefly traded near $73,750, while ETH was around $2,038.
2
59
·
--
Bullish
📢 William’s Daily Crypto Briefing | November 12
Spend a few minutes each day keeping up with the most important developments in the crypto market.
Today, we’re focusing on three key areas:
🔥 Macroeconomic policy: How will Fed rate expectations affect the crypto market?
$BTC Fund flows: Have there been any new changes in ETF flows?
📊 Market trends: Can BTC hold key support levels? What’s next for ETH and altcoins? There’s news every day, but what really matters is understanding the flow of capital behind it.
I’m William WIL. Every day, I curate important crypto market news and track macroeconomic shifts, institutional moves, and market trends.
Don’t blindly chase rallies or let emotions drive bearish calls.
Use data to read the market and logic to make decisions.
Follow William, and let’s make sense of crypto together every day.
—— William WIL | William’s Crypto Compass
#资讯 #Web3DatingRevolution
📢 William’s Daily Crypto Briefing | November 12
Spend a few minutes each day keeping up with the most important developments in the crypto market.
Today, we’re focusing on three key areas:
🔥 Macroeconomic policy: How will Fed rate expectations affect the crypto market?
$BTC Fund flows: Have there been any new changes in ETF flows?
📊 Market trends: Can BTC hold key support levels? What’s next for ETH and altcoins? There’s news every day, but what really matters is understanding the flow of capital behind it.
I’m William WIL. Every day, I curate important crypto market news and track macroeconomic shifts, institutional moves, and market trends.
Don’t blindly chase rallies or let emotions drive bearish calls.
Use data to read the market and logic to make decisions.
Follow William, and let’s make sense of crypto together every day.
—— William WIL | William’s Crypto Compass
#资讯 #Web3DatingRevolution
Spend a few minutes each day keeping up with the most important developments in the crypto market.
Today, we’re focusing on three key areas:
🔥 Macroeconomic policy: How will Fed rate expectations affect the crypto market?
$BTC Fund flows: Have there been any new changes in ETF flows?
📊 Market trends: Can BTC hold key support levels? What’s next for ETH and altcoins? There’s news every day, but what really matters is understanding the flow of capital behind it.
I’m William WIL. Every day, I curate important crypto market news and track macroeconomic shifts, institutional moves, and market trends.
Don’t blindly chase rallies or let emotions drive bearish calls.
Use data to read the market and logic to make decisions.
Follow William, and let’s make sense of crypto together every day.
—— William WIL | William’s Crypto Compass
#资讯 #Web3DatingRevolution

2
147
·
--

Article
BTC’s decline isn’t the real worry—the real warning sign is that money is leaving the marketThe mood in crypto has clearly shifted over the past few days.
BTC has been seesawing around $74,000, ETH has been relatively weaker, and U.S. spot BTC ETFs have seen net outflows for several consecutive days. Meanwhile, U.S. inflation data came in above market expectations, putting renewed pressure on risk assets through the dollar and interest rate expectations.
The question on many people’s minds right now is:
Is this just a normal pullback, or is the market entering a new phase of risk-off selling?
I’m personally watching three signals:
1. Have ETF outflows stopped?
ETFs are an important window into institutional sentiment.
If outflows continue and show no sign of reversing, it means institutions have yet to show a strong enough willingness to buy.
BTC’s decline isn’t the real worry—the real warning sign is that money is leaving the market
The mood in crypto has clearly shifted over the past few days.
BTC has been seesawing around $74,000, ETH has been relatively weaker, and U.S. spot BTC ETFs have seen net outflows for several consecutive days. Meanwhile, U.S. inflation data came in above market expectations, putting renewed pressure on risk assets through the dollar and interest rate expectations.
The question on many people’s minds right now is:
Is this just a normal pullback, or is the market entering a new phase of risk-off selling?
I’m personally watching three signals:
1. Have ETF outflows stopped?
ETFs are an important window into institutional sentiment.
If outflows continue and show no sign of reversing, it means institutions have yet to show a strong enough willingness to buy.
BTC has been seesawing around $74,000, ETH has been relatively weaker, and U.S. spot BTC ETFs have seen net outflows for several consecutive days. Meanwhile, U.S. inflation data came in above market expectations, putting renewed pressure on risk assets through the dollar and interest rate expectations.
The question on many people’s minds right now is:
Is this just a normal pullback, or is the market entering a new phase of risk-off selling?
I’m personally watching three signals:
1. Have ETF outflows stopped?
ETFs are an important window into institutional sentiment.
If outflows continue and show no sign of reversing, it means institutions have yet to show a strong enough willingness to buy.
1
2
232
·
--
Bullish
Whales accumulated $1.2 billion worth of ETH in a week, and ETFs are back—do you think this is “smart money buying the dip” or “catching a falling knife halfway down”? Which do you think we’ll hit first today, 2,050 or 2,200? Let me know in the comments.$ETH
#CPI高于预期,美股与BTC再度承压
CPI has shut the door on macro factors, but ETH holdings on-chain are increasingly concentrated in whale hands. 2,050 is a level both bulls and bears are watching—if it breaks, the long liquidation zone could keep exploding; if it holds, the whales’ cost basis (around 3,400) may be far off, but at least it suggests someone is using spot to catch the falling knife in futures. The signal that the washout is over is still the same combination: funding rates turning negative + a clear drop in open interest. So far, we’ve only seen one of those.
Whales accumulated $1.2 billion worth of ETH in a week, and ETFs are back—do you think this is “smart money buying the dip” or “catching a falling knife halfway down”? Which do you think we’ll hit first today, 2,050 or 2,200? Let me know in the comments.$ETH
#CPI高于预期,美股与BTC再度承压
CPI has shut the door on macro factors, but ETH holdings on-chain are increasingly concentrated in whale hands. 2,050 is a level both bulls and bears are watching—if it breaks, the long liquidation zone could keep exploding; if it holds, the whales’ cost basis (around 3,400) may be far off, but at least it suggests someone is using spot to catch the falling knife in futures. The signal that the washout is over is still the same combination: funding rates turning negative + a clear drop in open interest. So far, we’ve only seen one of those.
#CPI高于预期,美股与BTC再度承压
CPI has shut the door on macro factors, but ETH holdings on-chain are increasingly concentrated in whale hands. 2,050 is a level both bulls and bears are watching—if it breaks, the long liquidation zone could keep exploding; if it holds, the whales’ cost basis (around 3,400) may be far off, but at least it suggests someone is using spot to catch the falling knife in futures. The signal that the washout is over is still the same combination: funding rates turning negative + a clear drop in open interest. So far, we’ve only seen one of those.
1
2
190
·
--
Bullish
Tonight’s CPI: are you betting that core MoM will come in below or above 0.2%? $BTC 75,000 in ETF selling pressure and short fuel at 79,250—which side do you think gets hit first after the data comes out? Let me know in the comments.
#CPI前瞻,12月利率走向迎关键考验
Don’t chase shorts around 75,000. 87% of longs have already been liquidated, and the fuel for another short-term drop is dwindling. Chasing shorts could leave you caught in a reversal if CPI comes in as expected.
And don’t chase longs either. ETFs saw $1.28 billion in outflows in a week, year-to-date flows have turned negative, and longs are still paying a 7.3% annualized funding rate to hold on. When all three conditions are in place, buying the dip means betting against institutional flows.
The only signal combination worth waiting for tonight: the first 1-hour candle close after CPI comes out + whether the funding rate turns negative + whether open interest drops another notch. Only when all three conditions appear can you call it a flush; meeting just one is noise. In this middle stretch, managing position size matters more than calling the direction.
Tonight’s CPI: are you betting that core MoM will come in below or above 0.2%? $BTC 75,000 in ETF selling pressure and short fuel at 79,250—which side do you think gets hit first after the data comes out? Let me know in the comments.
#CPI前瞻,12月利率走向迎关键考验
Don’t chase shorts around 75,000. 87% of longs have already been liquidated, and the fuel for another short-term drop is dwindling. Chasing shorts could leave you caught in a reversal if CPI comes in as expected.
And don’t chase longs either. ETFs saw $1.28 billion in outflows in a week, year-to-date flows have turned negative, and longs are still paying a 7.3% annualized funding rate to hold on. When all three conditions are in place, buying the dip means betting against institutional flows.
The only signal combination worth waiting for tonight: the first 1-hour candle close after CPI comes out + whether the funding rate turns negative + whether open interest drops another notch. Only when all three conditions appear can you call it a flush; meeting just one is noise. In this middle stretch, managing position size matters more than calling the direction.
#CPI前瞻,12月利率走向迎关键考验
Don’t chase shorts around 75,000. 87% of longs have already been liquidated, and the fuel for another short-term drop is dwindling. Chasing shorts could leave you caught in a reversal if CPI comes in as expected.
And don’t chase longs either. ETFs saw $1.28 billion in outflows in a week, year-to-date flows have turned negative, and longs are still paying a 7.3% annualized funding rate to hold on. When all three conditions are in place, buying the dip means betting against institutional flows.
The only signal combination worth waiting for tonight: the first 1-hour candle close after CPI comes out + whether the funding rate turns negative + whether open interest drops another notch. Only when all three conditions appear can you call it a flush; meeting just one is noise. In this middle stretch, managing position size matters more than calling the direction.
3
135
·
--
Bullish
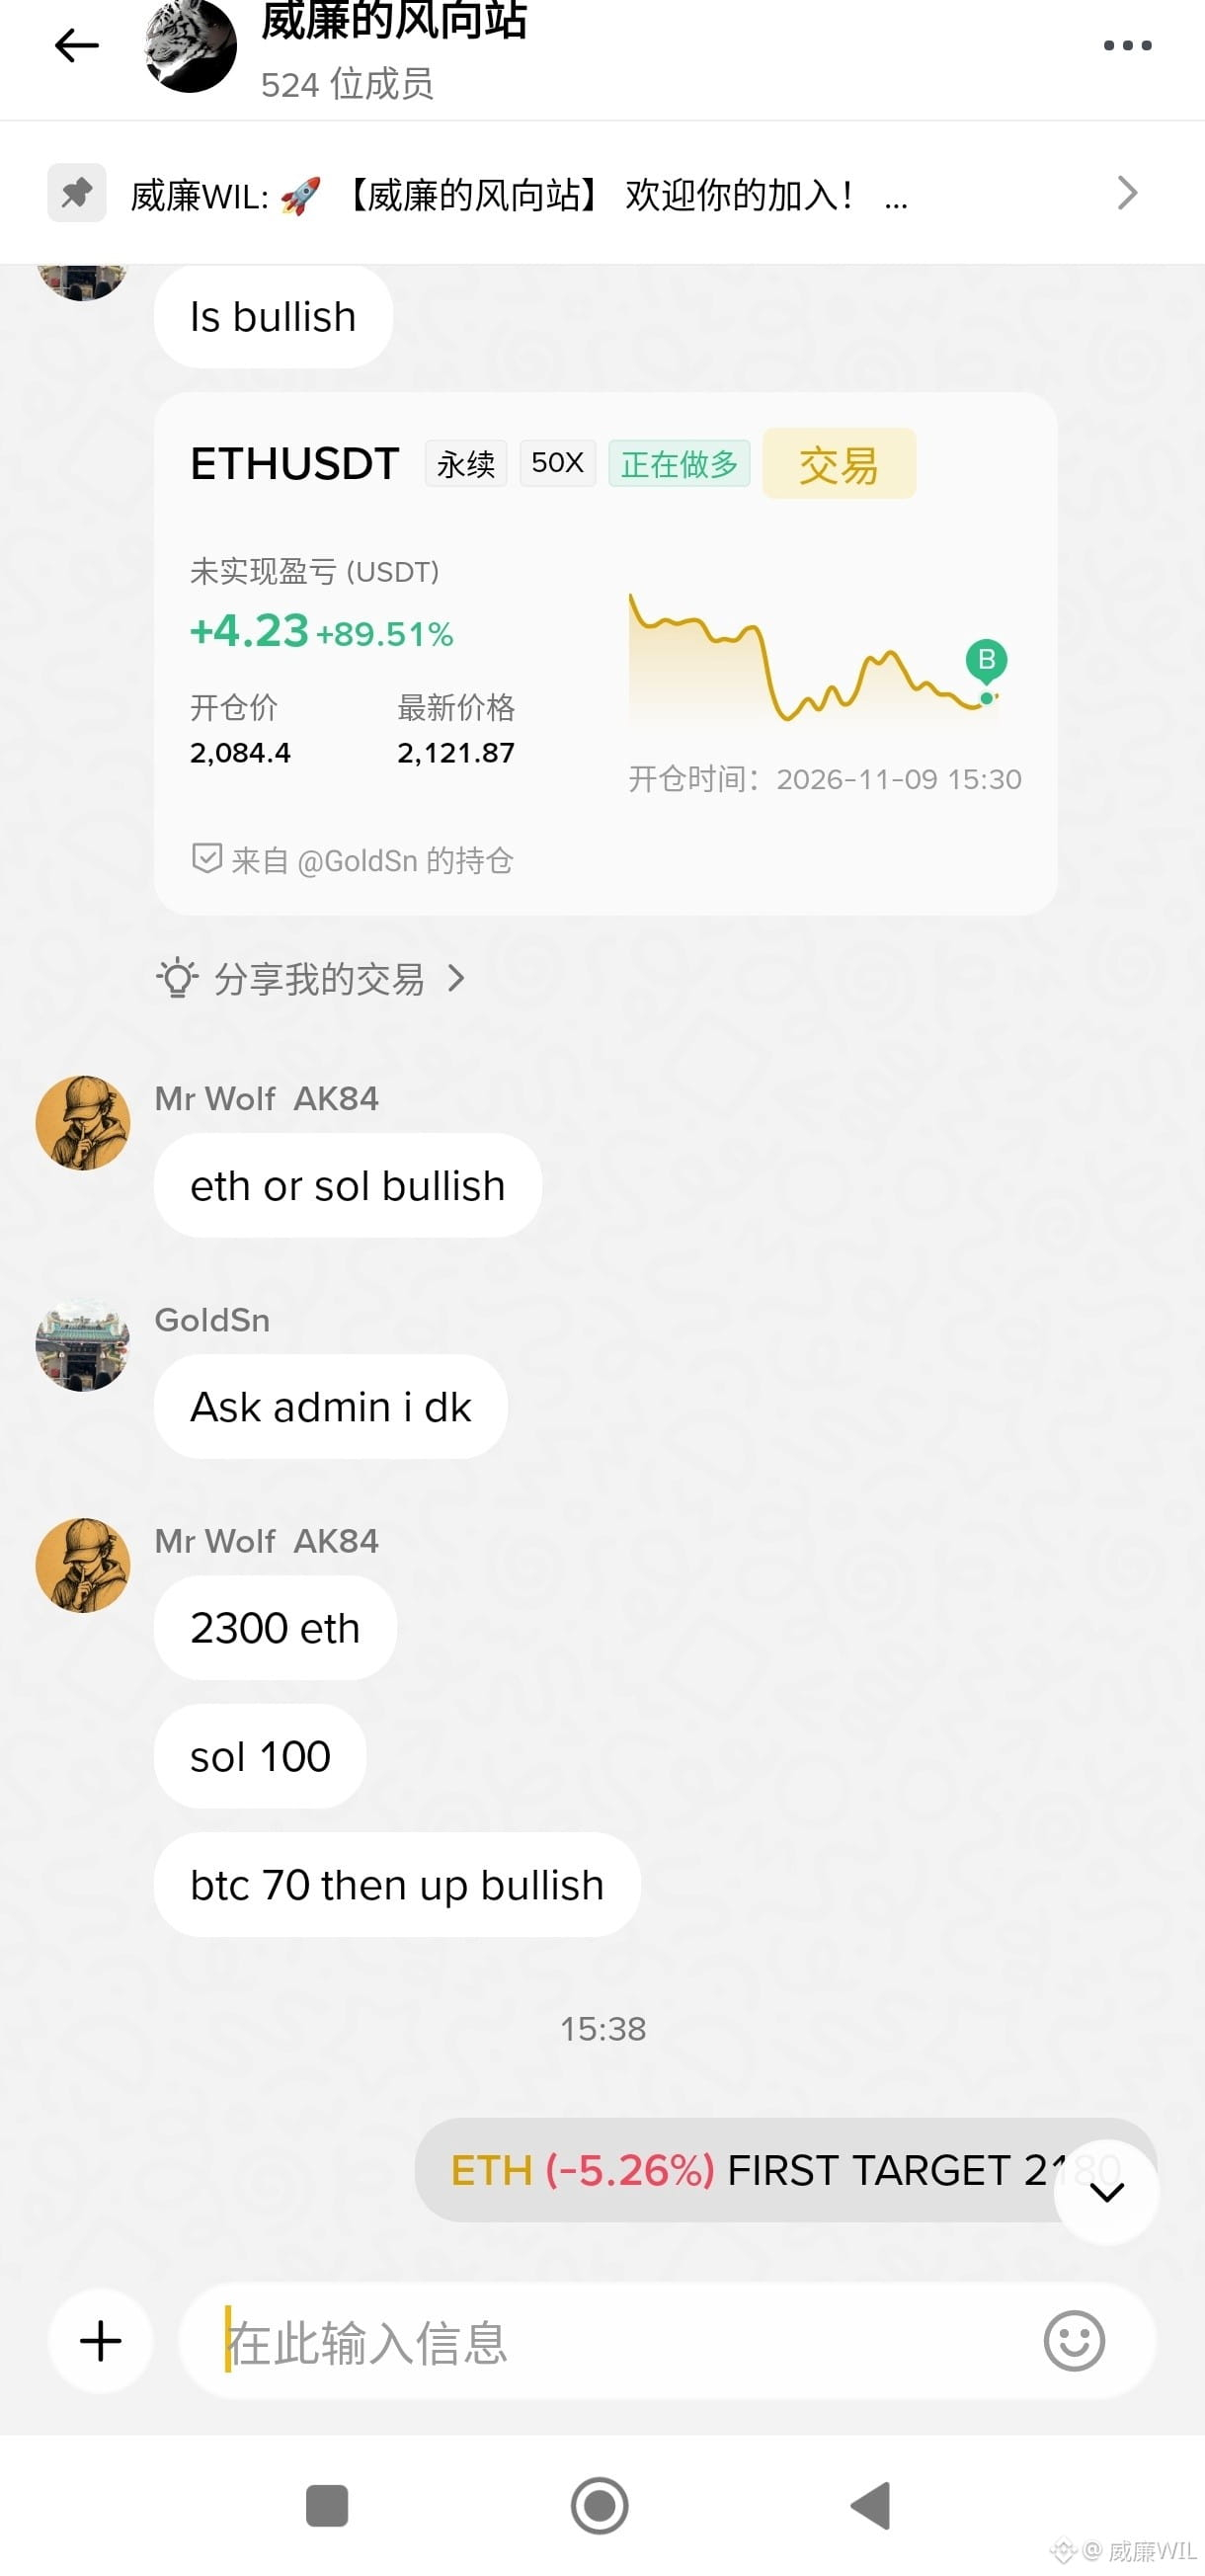
Market insights and technical analysis on Binance: William's Trend Watch
You're invited to join my group, William's Trend Watch: https://app.binance.com/uni-qr/UcoiWpXP
#非农就业数据推升加息预期
Market insights and technical analysis on Binance: William's Trend Watch
You're invited to join my group, William's Trend Watch: https://app.binance.com/uni-qr/UcoiWpXP
#非农就业数据推升加息预期
You're invited to join my group, William's Trend Watch: https://app.binance.com/uni-qr/UcoiWpXP
#非农就业数据推升加息预期

1
2
607
·
--
Bullish
After BTC sweeps long positions, flip long to target the shorts!
#比特币连续五周下跌
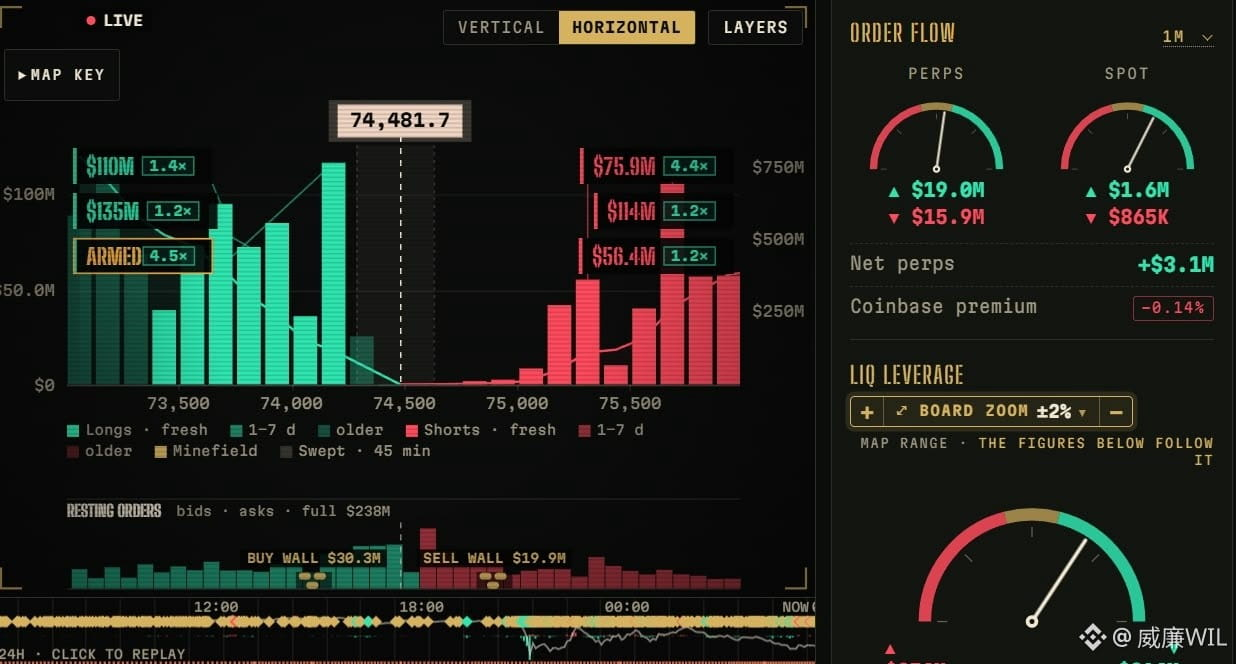
The market makers’ intent is crystal clear: sweep long positions on the way down to accumulate, then push up to liquidate shorts and drive the price higher.
Current price: 74,481. A large number of highly leveraged long positions (ARMED 4.5x) and a $30M buy wall are stacked in the 73,500–74,000 range below; meanwhile, the 75,000–75,500 range above is a dense short liquidation zone ($114M). A classic liquidity-hunt sandwich.
After BTC sweeps long positions, flip long to target the shorts!
#比特币连续五周下跌
The market makers’ intent is crystal clear: sweep long positions on the way down to accumulate, then push up to liquidate shorts and drive the price higher.
Current price: 74,481. A large number of highly leveraged long positions (ARMED 4.5x) and a $30M buy wall are stacked in the 73,500–74,000 range below; meanwhile, the 75,000–75,500 range above is a dense short liquidation zone ($114M). A classic liquidity-hunt sandwich.
#比特币连续五周下跌
The market makers’ intent is crystal clear: sweep long positions on the way down to accumulate, then push up to liquidate shorts and drive the price higher.
Current price: 74,481. A large number of highly leveraged long positions (ARMED 4.5x) and a $30M buy wall are stacked in the 73,500–74,000 range below; meanwhile, the 75,000–75,500 range above is a dense short liquidation zone ($114M). A classic liquidity-hunt sandwich.
1
2
346
·
--
Bullish
Brothers, have a great weekend! $BTC
Making money is the real way to love yourself!
Go against your human nature and make the right choice 🚀
#人性认知
Brothers, have a great weekend! $BTC
Making money is the real way to love yourself!
Go against your human nature and make the right choice 🚀
#人性认知
Making money is the real way to love yourself!
Go against your human nature and make the right choice 🚀
#人性认知

1
167
·
--
Bullish
Liquidation map: the structure has flipped compared with 11.5
#清算地图
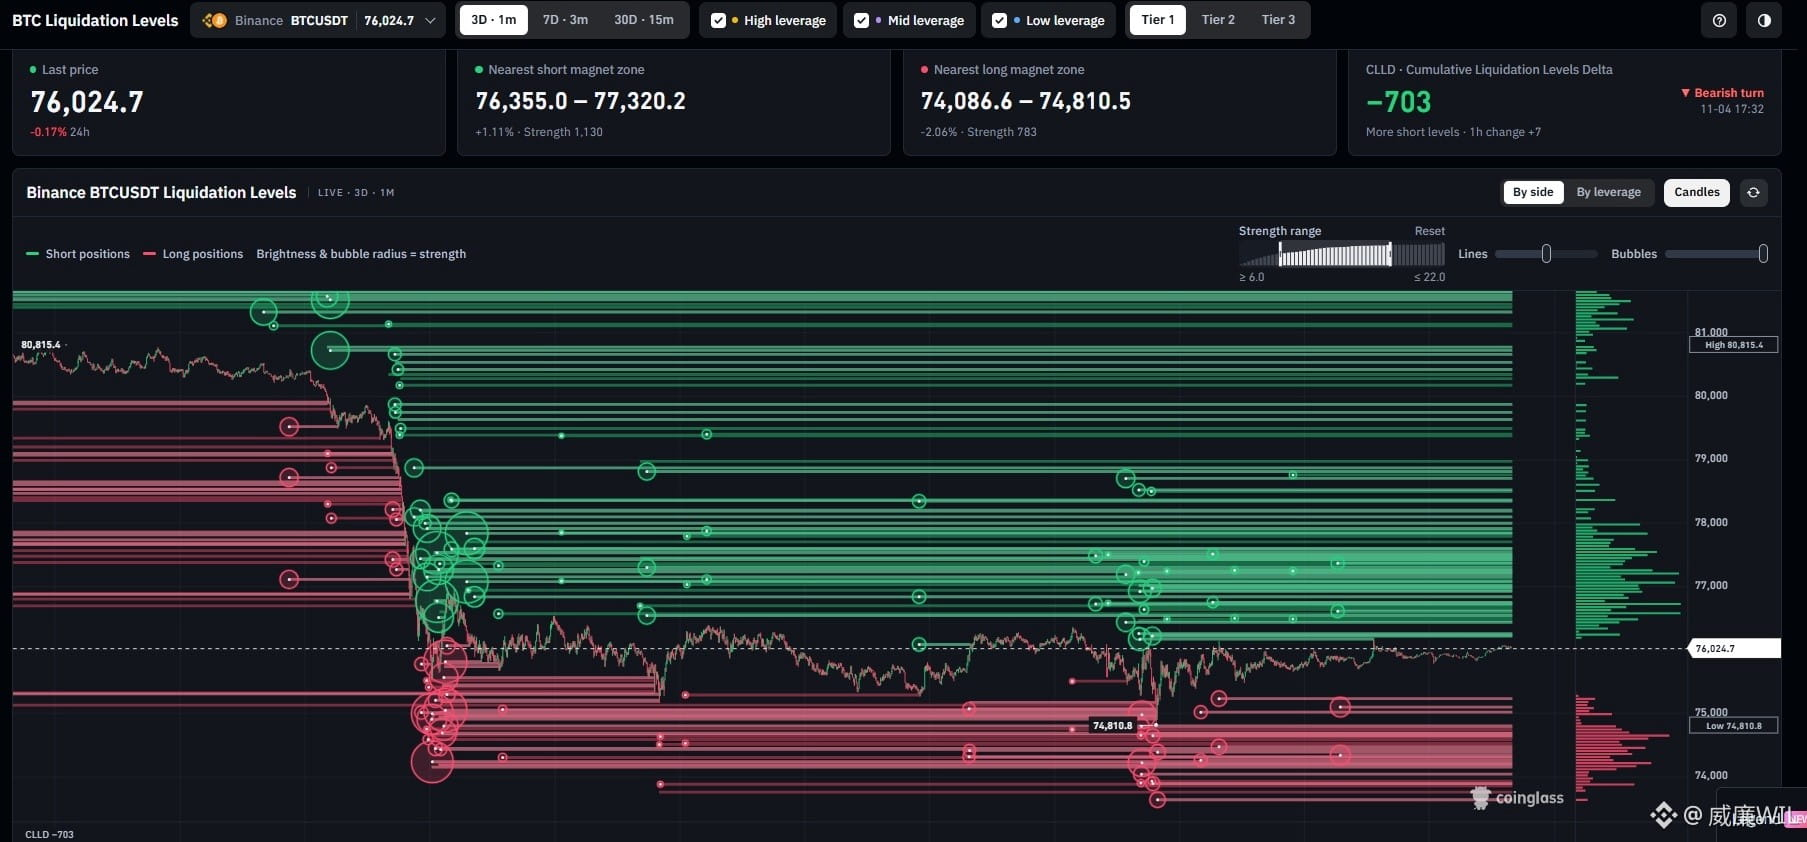
Above: A break above 79,484 would trigger $1.823 billion in cumulative short liquidations across major CEXs.
Below: A drop below 72,152 would trigger $1.541 billion in cumulative long liquidations.
On 11.5, we wrote, “There’s not much to liquidate above, but plenty below”—at the time, there were only $337 million in shorts above, versus $919 million in longs below. Today, it’s the other way around: for the first time, the short liquidation fuel above exceeds the long liquidation minefield below, and 79,484 is only about 4.8% from the current price.
One level closer: a sell wall sits at 76,309, accounting for 91.7% of sell-side limit orders. Every rebound runs into it and gets pushed back. Below, 75,563 is the last intraday support. A daily close below it would put the Bollinger lower band at 74,880 to the test.
Whether 75,700 holds will determine which path the market takes today: if it holds, price could reach the sell wall around 76,300, with the heavy short-liquidation zone at 79,484 above that. If it fails, the long-liquidation minefield at 72,152 comes into view.
Liquidation map: the structure has flipped compared with 11.5
#清算地图
Above: A break above 79,484 would trigger $1.823 billion in cumulative short liquidations across major CEXs.
Below: A drop below 72,152 would trigger $1.541 billion in cumulative long liquidations.
On 11.5, we wrote, “There’s not much to liquidate above, but plenty below”—at the time, there were only $337 million in shorts above, versus $919 million in longs below. Today, it’s the other way around: for the first time, the short liquidation fuel above exceeds the long liquidation minefield below, and 79,484 is only about 4.8% from the current price.
One level closer: a sell wall sits at 76,309, accounting for 91.7% of sell-side limit orders. Every rebound runs into it and gets pushed back. Below, 75,563 is the last intraday support. A daily close below it would put the Bollinger lower band at 74,880 to the test.
Whether 75,700 holds will determine which path the market takes today: if it holds, price could reach the sell wall around 76,300, with the heavy short-liquidation zone at 79,484 above that. If it fails, the long-liquidation minefield at 72,152 comes into view.
#清算地图
Above: A break above 79,484 would trigger $1.823 billion in cumulative short liquidations across major CEXs.
Below: A drop below 72,152 would trigger $1.541 billion in cumulative long liquidations.
On 11.5, we wrote, “There’s not much to liquidate above, but plenty below”—at the time, there were only $337 million in shorts above, versus $919 million in longs below. Today, it’s the other way around: for the first time, the short liquidation fuel above exceeds the long liquidation minefield below, and 79,484 is only about 4.8% from the current price.
One level closer: a sell wall sits at 76,309, accounting for 91.7% of sell-side limit orders. Every rebound runs into it and gets pushed back. Below, 75,563 is the last intraday support. A daily close below it would put the Bollinger lower band at 74,880 to the test.
Whether 75,700 holds will determine which path the market takes today: if it holds, price could reach the sell wall around 76,300, with the heavy short-liquidation zone at 79,484 above that. If it fails, the long-liquidation minefield at 72,152 comes into view.
2
231
·
--
Bearish
📊 BTC Liquidation Heatmap Analysis (3D Level)
📍 Current market: #清算地图
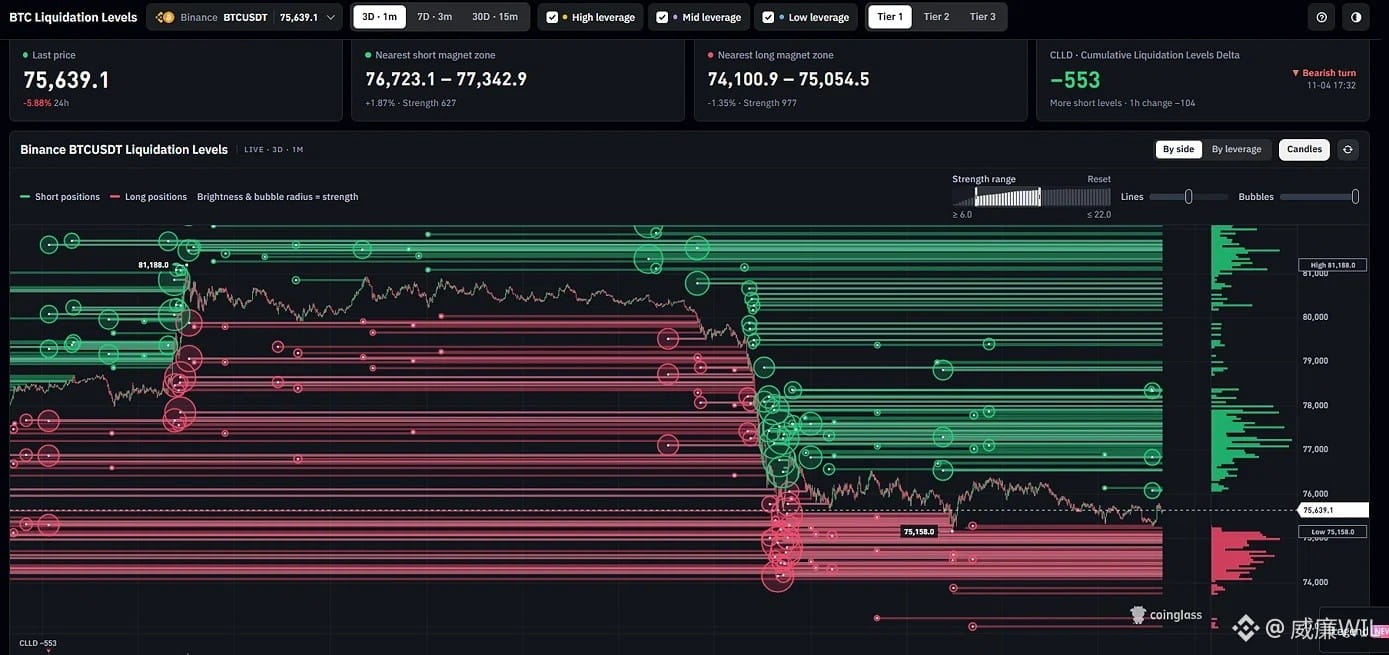
Current price $75,639, down 5.88% over 24 hours. The price has broken below the previous consolidation range and is now looking for new support.
📉 Key data (CLLD indicator):
- CLLD (Cumulative Liquidation Level Delta): -553, showing a “Bearish turn.” This means bears have the upper hand in the short term, and the market is liquidating longs at higher levels.
🎯 Key liquidation zones (liquidation points):
1. 👇 Strong support below / long liquidation zone (red zone): $74,100 - $75,054
- Strength: 977 (very strong!)
- Analysis: This is the nearest dense long liquidation zone to the current price. Notice the rows of large red circles below the chart: if the price falls below 75,000 or even 74,100, it could trigger a large-scale cascade of long liquidations, accelerating the drop with a sharp downward wick. This is also a favorite stop-hunting target for large players.
2. ☝️ Resistance above / short liquidation zone (green zone): $76,723 - $77,342
- Strength: 627 (weaker than below)
- Analysis: There are some leveraged shorts above the current price. If the market rebounds, it could rise as high as the 76,700 - 77,300 area to liquidate these highly leveraged short positions. However, overall, there is strong resistance overhead (the green lines run through a dense cluster).
📊 BTC Liquidation Heatmap Analysis (3D Level)
📍 Current market: #清算地图
Current price $75,639, down 5.88% over 24 hours. The price has broken below the previous consolidation range and is now looking for new support.
📉 Key data (CLLD indicator):
- CLLD (Cumulative Liquidation Level Delta): -553, showing a “Bearish turn.” This means bears have the upper hand in the short term, and the market is liquidating longs at higher levels.
🎯 Key liquidation zones (liquidation points):
1. 👇 Strong support below / long liquidation zone (red zone): $74,100 - $75,054
- Strength: 977 (very strong!)
- Analysis: This is the nearest dense long liquidation zone to the current price. Notice the rows of large red circles below the chart: if the price falls below 75,000 or even 74,100, it could trigger a large-scale cascade of long liquidations, accelerating the drop with a sharp downward wick. This is also a favorite stop-hunting target for large players.
2. ☝️ Resistance above / short liquidation zone (green zone): $76,723 - $77,342
- Strength: 627 (weaker than below)
- Analysis: There are some leveraged shorts above the current price. If the market rebounds, it could rise as high as the 76,700 - 77,300 area to liquidate these highly leveraged short positions. However, overall, there is strong resistance overhead (the green lines run through a dense cluster).
📍 Current market: #清算地图
Current price $75,639, down 5.88% over 24 hours. The price has broken below the previous consolidation range and is now looking for new support.
📉 Key data (CLLD indicator):
- CLLD (Cumulative Liquidation Level Delta): -553, showing a “Bearish turn.” This means bears have the upper hand in the short term, and the market is liquidating longs at higher levels.
🎯 Key liquidation zones (liquidation points):
1. 👇 Strong support below / long liquidation zone (red zone): $74,100 - $75,054
- Strength: 977 (very strong!)
- Analysis: This is the nearest dense long liquidation zone to the current price. Notice the rows of large red circles below the chart: if the price falls below 75,000 or even 74,100, it could trigger a large-scale cascade of long liquidations, accelerating the drop with a sharp downward wick. This is also a favorite stop-hunting target for large players.
2. ☝️ Resistance above / short liquidation zone (green zone): $76,723 - $77,342
- Strength: 627 (weaker than below)
- Analysis: There are some leveraged shorts above the current price. If the market rebounds, it could rise as high as the 76,700 - 77,300 area to liquidate these highly leveraged short positions. However, overall, there is strong resistance overhead (the green lines run through a dense cluster).
1
4
256
·
--
Bullish
Keep an eye on tonight’s nonfarm payrolls
#非农就业数据
If the figure is higher than expected, the dollar will strengthen, putting pressure on Bitcoin.
Conversely, if it’s lower than expected, it could help Bitcoin rebound.
Keep an eye on tonight’s nonfarm payrolls
#非农就业数据
If the figure is higher than expected, the dollar will strengthen, putting pressure on Bitcoin.
Conversely, if it’s lower than expected, it could help Bitcoin rebound.
#非农就业数据
If the figure is higher than expected, the dollar will strengthen, putting pressure on Bitcoin.
Conversely, if it’s lower than expected, it could help Bitcoin rebound.

5
202
·
--
Bearish
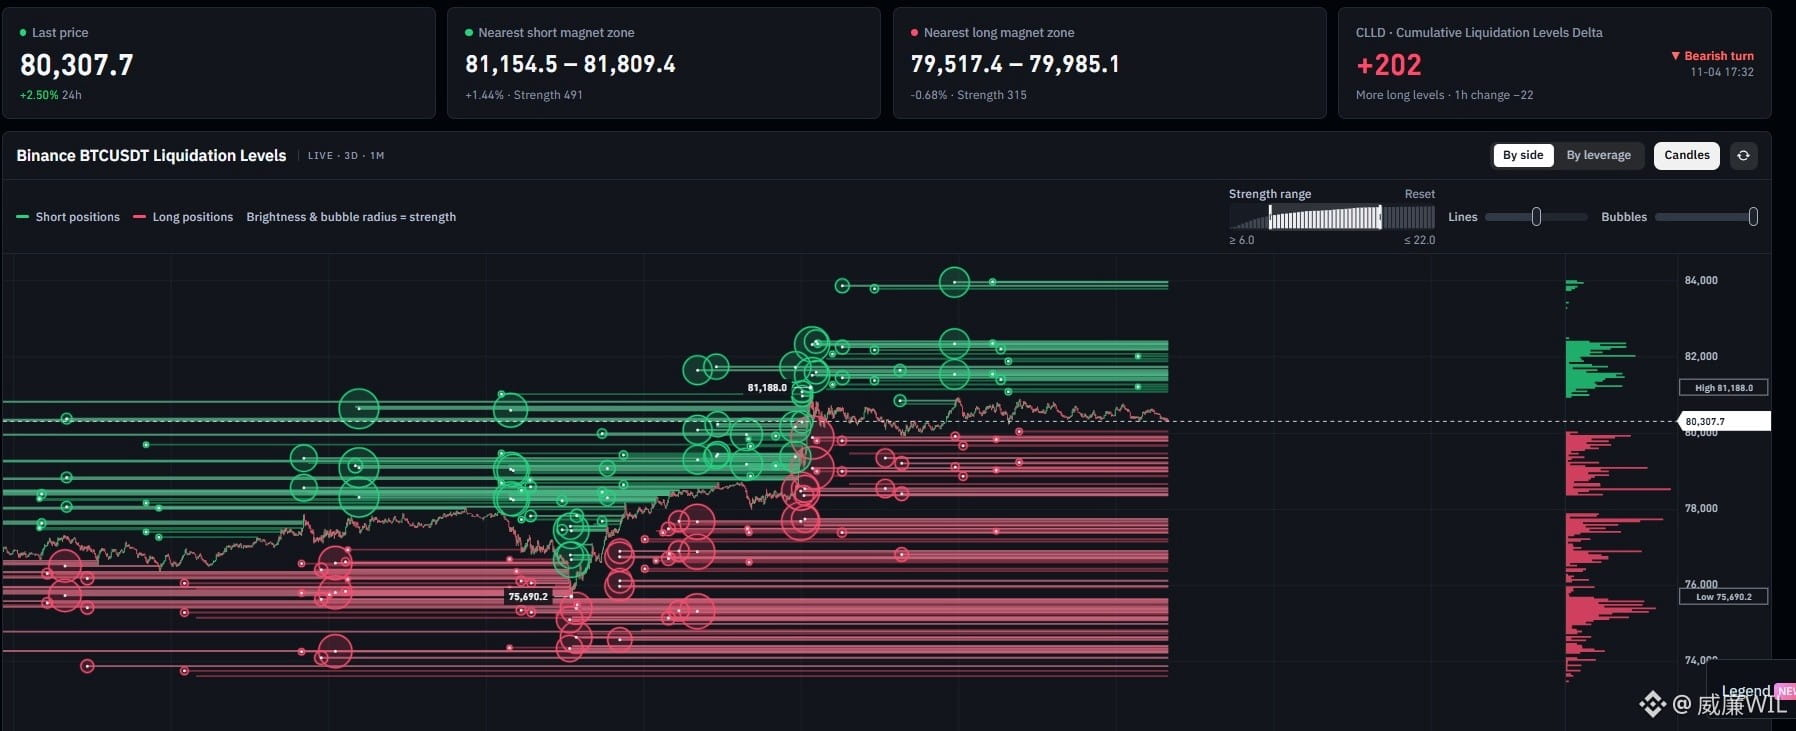
$BTC #清算地图
Above: If it breaks 82,000, the cumulative short liquidation intensity across major CEXs is approximately 337 million.
Below: If it falls below 79,000, the cumulative long liquidation intensity is approximately 919 million.
Looking one level further out: below 76,461, the cumulative long liquidation intensity is 2.485 billion; above 84,429, the cumulative short liquidation intensity is only 1.18 billion.
{future}(BTCUSDT)
Shorts’ fuel is rapidly running out, while the long liquidation minefield is getting denser. With the short squeeze having reached this point, the risk-reward ratio for chasing further upside is already asymmetric—there are only a little over 300 million in shorts left to liquidate above, while more than 900 million in longs are piled up below, waiting to be tested.
In the nearer-term structure, the peak zone for medium-leverage long liquidation liquidity is around 79K (approximately the 78.5–79K range), less than 2% from the current price.
$BTC #清算地图
Above: If it breaks 82,000, the cumulative short liquidation intensity across major CEXs is approximately 337 million.
Below: If it falls below 79,000, the cumulative long liquidation intensity is approximately 919 million.
Looking one level further out: below 76,461, the cumulative long liquidation intensity is 2.485 billion; above 84,429, the cumulative short liquidation intensity is only 1.18 billion.
Shorts’ fuel is rapidly running out, while the long liquidation minefield is getting denser. With the short squeeze having reached this point, the risk-reward ratio for chasing further upside is already asymmetric—there are only a little over 300 million in shorts left to liquidate above, while more than 900 million in longs are piled up below, waiting to be tested.
In the nearer-term structure, the peak zone for medium-leverage long liquidation liquidity is around 79K (approximately the 78.5–79K range), less than 2% from the current price.
Above: If it breaks 82,000, the cumulative short liquidation intensity across major CEXs is approximately 337 million.
Below: If it falls below 79,000, the cumulative long liquidation intensity is approximately 919 million.
Looking one level further out: below 76,461, the cumulative long liquidation intensity is 2.485 billion; above 84,429, the cumulative short liquidation intensity is only 1.18 billion.
Shorts’ fuel is rapidly running out, while the long liquidation minefield is getting denser. With the short squeeze having reached this point, the risk-reward ratio for chasing further upside is already asymmetric—there are only a little over 300 million in shorts left to liquidate above, while more than 900 million in longs are piled up below, waiting to be tested.
In the nearer-term structure, the peak zone for medium-leverage long liquidation liquidity is around 79K (approximately the 78.5–79K range), less than 2% from the current price.
1
3
280
·
--
Bullish
The midterm election results are in, and the fading uncertainty has set the mood for this rally. But the November 6 nonfarm payrolls report is the real trigger this week: ADP added 86,000 jobs, slightly above expectations, but the forecast for nonfarm payrolls is only 60,000. With expectations of a rate hike in December still in place, employment data that is “too strong” could actually weigh on risk assets. ETFs have offered no confirmation either: net outflows totaled $1.16 billion over three days, with BlackRock’s IBIT seeing $405 million in outflows in a single day. Institutional money is still flowing out. #美国10月非农出炉:降息还有戏吗?
The midterm election results are in, and the fading uncertainty has set the mood for this rally. But the November 6 nonfarm payrolls report is the real trigger this week: ADP added 86,000 jobs, slightly above expectations, but the forecast for nonfarm payrolls is only 60,000. With expectations of a rate hike in December still in place, employment data that is “too strong” could actually weigh on risk assets. ETFs have offered no confirmation either: net outflows totaled $1.16 billion over three days, with BlackRock’s IBIT seeing $405 million in outflows in a single day. Institutional money is still flowing out. #美国10月非农出炉:降息还有戏吗?

IBITETF-3.05%
BLKUS-0.12%
2
102
·
--
Bearish
This rebound from $BTC 78,000—do you agree more with the view that short covering isn’t over yet and price could reach 78,800, or that without fresh buying, a retest of 77,000 is only a matter of time? Let me know in the comments. 🤙
#行情分析📈
Don’t chase longs near 78,000. The driver is short covering, not fresh buying; the fuel for short covering is running low, and fresh buyers haven’t stepped in yet.
There’s no need to rush into shorts either. Short positions have just been liquidated in a wave, and short-side crowding is easing in the near term. Chasing shorts could easily run into choppy price action near 78,800.
Wait for price to reach the edges. The 78,556–78,836 area above is the first zone to watch for a reaction. If price pushes up there but stalls on heavy volume, that’s a window to consider short-term shorts. Below, if 77,000 is retested and finds support, that’s a window to consider longs. In between, managing position size matters more than picking a direction.
This rebound from $BTC 78,000—do you agree more with the view that short covering isn’t over yet and price could reach 78,800, or that without fresh buying, a retest of 77,000 is only a matter of time? Let me know in the comments. 🤙
#行情分析📈
Don’t chase longs near 78,000. The driver is short covering, not fresh buying; the fuel for short covering is running low, and fresh buyers haven’t stepped in yet.
There’s no need to rush into shorts either. Short positions have just been liquidated in a wave, and short-side crowding is easing in the near term. Chasing shorts could easily run into choppy price action near 78,800.
Wait for price to reach the edges. The 78,556–78,836 area above is the first zone to watch for a reaction. If price pushes up there but stalls on heavy volume, that’s a window to consider short-term shorts. Below, if 77,000 is retested and finds support, that’s a window to consider longs. In between, managing position size matters more than picking a direction.
#行情分析📈
Don’t chase longs near 78,000. The driver is short covering, not fresh buying; the fuel for short covering is running low, and fresh buyers haven’t stepped in yet.
There’s no need to rush into shorts either. Short positions have just been liquidated in a wave, and short-side crowding is easing in the near term. Chasing shorts could easily run into choppy price action near 78,800.
Wait for price to reach the edges. The 78,556–78,836 area above is the first zone to watch for a reaction. If price pushes up there but stalls on heavy volume, that’s a window to consider short-term shorts. Below, if 77,000 is retested and finds support, that’s a window to consider longs. In between, managing position size matters more than picking a direction.
3
226
·
--
Bearish
The CLARITY Act is effectively dead $BTC
#美国中期选举
The CLARITY Act failed a procedural vote in the Senate on September 15, with a vote of 49–50, falling short of the 60-vote threshold. No alternative vote was subsequently scheduled. The stumbling block was not the division of authority between the SEC and CFTC, but opposition from several Democrats to the bill’s ethics provisions on crypto assets held by public officials. They argued that the draft did not adequately address assets held by the president and his family.
If Democrats take both chambers, as predicted, the Warren-aligned direction of the Senate Banking Committee is likely, but exactly who will lead it depends on the election results; it is not as certain as the original text suggests. The path for the CLARITY Act to receive another full Senate vote in the next two years is effectively closed. However, 1inch Deputy General Counsel Maylea Ma’s assessment is worth noting: real regulatory progress will come not from Congress, but from the SEC, CFTC, and Treasury Department. The SEC proposed a crypto financing framework in August, and the CFTC submitted a crypto market regulatory plan to the White House on September 17. Agencies will continue issuing guidance, but the next administration could reverse it. The industry will not get legislative-level certainty, and institutional investors will continue to wait and see.
The CLARITY Act is effectively dead $BTC
#美国中期选举
The CLARITY Act failed a procedural vote in the Senate on September 15, with a vote of 49–50, falling short of the 60-vote threshold. No alternative vote was subsequently scheduled. The stumbling block was not the division of authority between the SEC and CFTC, but opposition from several Democrats to the bill’s ethics provisions on crypto assets held by public officials. They argued that the draft did not adequately address assets held by the president and his family.
If Democrats take both chambers, as predicted, the Warren-aligned direction of the Senate Banking Committee is likely, but exactly who will lead it depends on the election results; it is not as certain as the original text suggests. The path for the CLARITY Act to receive another full Senate vote in the next two years is effectively closed. However, 1inch Deputy General Counsel Maylea Ma’s assessment is worth noting: real regulatory progress will come not from Congress, but from the SEC, CFTC, and Treasury Department. The SEC proposed a crypto financing framework in August, and the CFTC submitted a crypto market regulatory plan to the White House on September 17. Agencies will continue issuing guidance, but the next administration could reverse it. The industry will not get legislative-level certainty, and institutional investors will continue to wait and see.
#美国中期选举
The CLARITY Act failed a procedural vote in the Senate on September 15, with a vote of 49–50, falling short of the 60-vote threshold. No alternative vote was subsequently scheduled. The stumbling block was not the division of authority between the SEC and CFTC, but opposition from several Democrats to the bill’s ethics provisions on crypto assets held by public officials. They argued that the draft did not adequately address assets held by the president and his family.
If Democrats take both chambers, as predicted, the Warren-aligned direction of the Senate Banking Committee is likely, but exactly who will lead it depends on the election results; it is not as certain as the original text suggests. The path for the CLARITY Act to receive another full Senate vote in the next two years is effectively closed. However, 1inch Deputy General Counsel Maylea Ma’s assessment is worth noting: real regulatory progress will come not from Congress, but from the SEC, CFTC, and Treasury Department. The SEC proposed a crypto financing framework in August, and the CFTC submitted a crypto market regulatory plan to the White House on September 17. Agencies will continue issuing guidance, but the next administration could reverse it. The industry will not get legislative-level certainty, and institutional investors will continue to wait and see.

2
382
·
--
Bearish
Funding rates are still positive, and open interest is still rising. Around $BTC 76000, would you short, buy the dip, or stay on the sidelines until funding turns negative + open interest falls before making a move? Let me know in the comments. 🚀#美国中期选举倒计时,美股博弈窗口已开启?
BTC dipped as low as 76621 and is now hovering around 77200. BTC liquidations totaled $84.7 million over 24 hours, with longs accounting for 76%—the bulls are bleeding.
But here’s the contradiction: Binance BTC open interest rose from $7.42 billion to $7.63 billion, the long/short account ratio is 2.62, and funding is still at +0.01%. The longs getting liquidated and the longs entering to buy the dip are two different groups. Leverage is changing hands; the flush-out isn’t complete.
Liquidation map: around 73731 below, $779 million in long liquidations; around 80783 above, $1.373 billion in short liquidations. The nearest dense long zone is 76950–77600, right beneath us.
So don’t chase shorts while funding is still positive, and don’t treat 76000 as a dip-buying level. What’s worth waiting for is funding turning negative + open interest clearly declining at the same time.
Watch the 1-hour close at 77600. The back-and-forth around 76000 may come before the direction itself.
Funding rates are still positive, and open interest is still rising. Around $BTC 76000, would you short, buy the dip, or stay on the sidelines until funding turns negative + open interest falls before making a move? Let me know in the comments. 🚀#美国中期选举倒计时,美股博弈窗口已开启?
BTC dipped as low as 76621 and is now hovering around 77200. BTC liquidations totaled $84.7 million over 24 hours, with longs accounting for 76%—the bulls are bleeding.
But here’s the contradiction: Binance BTC open interest rose from $7.42 billion to $7.63 billion, the long/short account ratio is 2.62, and funding is still at +0.01%. The longs getting liquidated and the longs entering to buy the dip are two different groups. Leverage is changing hands; the flush-out isn’t complete.
Liquidation map: around 73731 below, $779 million in long liquidations; around 80783 above, $1.373 billion in short liquidations. The nearest dense long zone is 76950–77600, right beneath us.
So don’t chase shorts while funding is still positive, and don’t treat 76000 as a dip-buying level. What’s worth waiting for is funding turning negative + open interest clearly declining at the same time.
Watch the 1-hour close at 77600. The back-and-forth around 76000 may come before the direction itself.
BTC dipped as low as 76621 and is now hovering around 77200. BTC liquidations totaled $84.7 million over 24 hours, with longs accounting for 76%—the bulls are bleeding.
But here’s the contradiction: Binance BTC open interest rose from $7.42 billion to $7.63 billion, the long/short account ratio is 2.62, and funding is still at +0.01%. The longs getting liquidated and the longs entering to buy the dip are two different groups. Leverage is changing hands; the flush-out isn’t complete.
Liquidation map: around 73731 below, $779 million in long liquidations; around 80783 above, $1.373 billion in short liquidations. The nearest dense long zone is 76950–77600, right beneath us.
So don’t chase shorts while funding is still positive, and don’t treat 76000 as a dip-buying level. What’s worth waiting for is funding turning negative + open interest clearly declining at the same time.
Watch the 1-hour close at 77600. The back-and-forth around 76000 may come before the direction itself.
2
249
Log in to explore more content
Join global crypto users on Binance Square
⚡️ Get latest and useful information about crypto.
💬 Trusted by the world’s largest crypto exchange.
👍 Discover real insights from verified creators.
Email / Phone number
Trending Topics
HuangRisksOusterOverReportedAffairWithSubordinate
79,082 views
1,130 Discussing
Nvidia Board Meets to Decide Jensen Huang's Future as Crisis Deepens
Binance News
·44 Likes
·56.5k views
AnthropicRejectsIPODelayValuationinQuestion
541,059 views
4,475 Discussing
BitMineReports$6.3BNetLossForFiscal2026
249 views
35 Discussing