
汪情探员二狗
1.5k Posts

汪情探员二狗
Q:2154318881 推:那个王二狗呀 微博:汪情探员二狗
0 Following
531 Followers
1.2K+ Liked
Posts
All
Quotes
Videos
Live
PINNED

汪情探员二狗
·
--
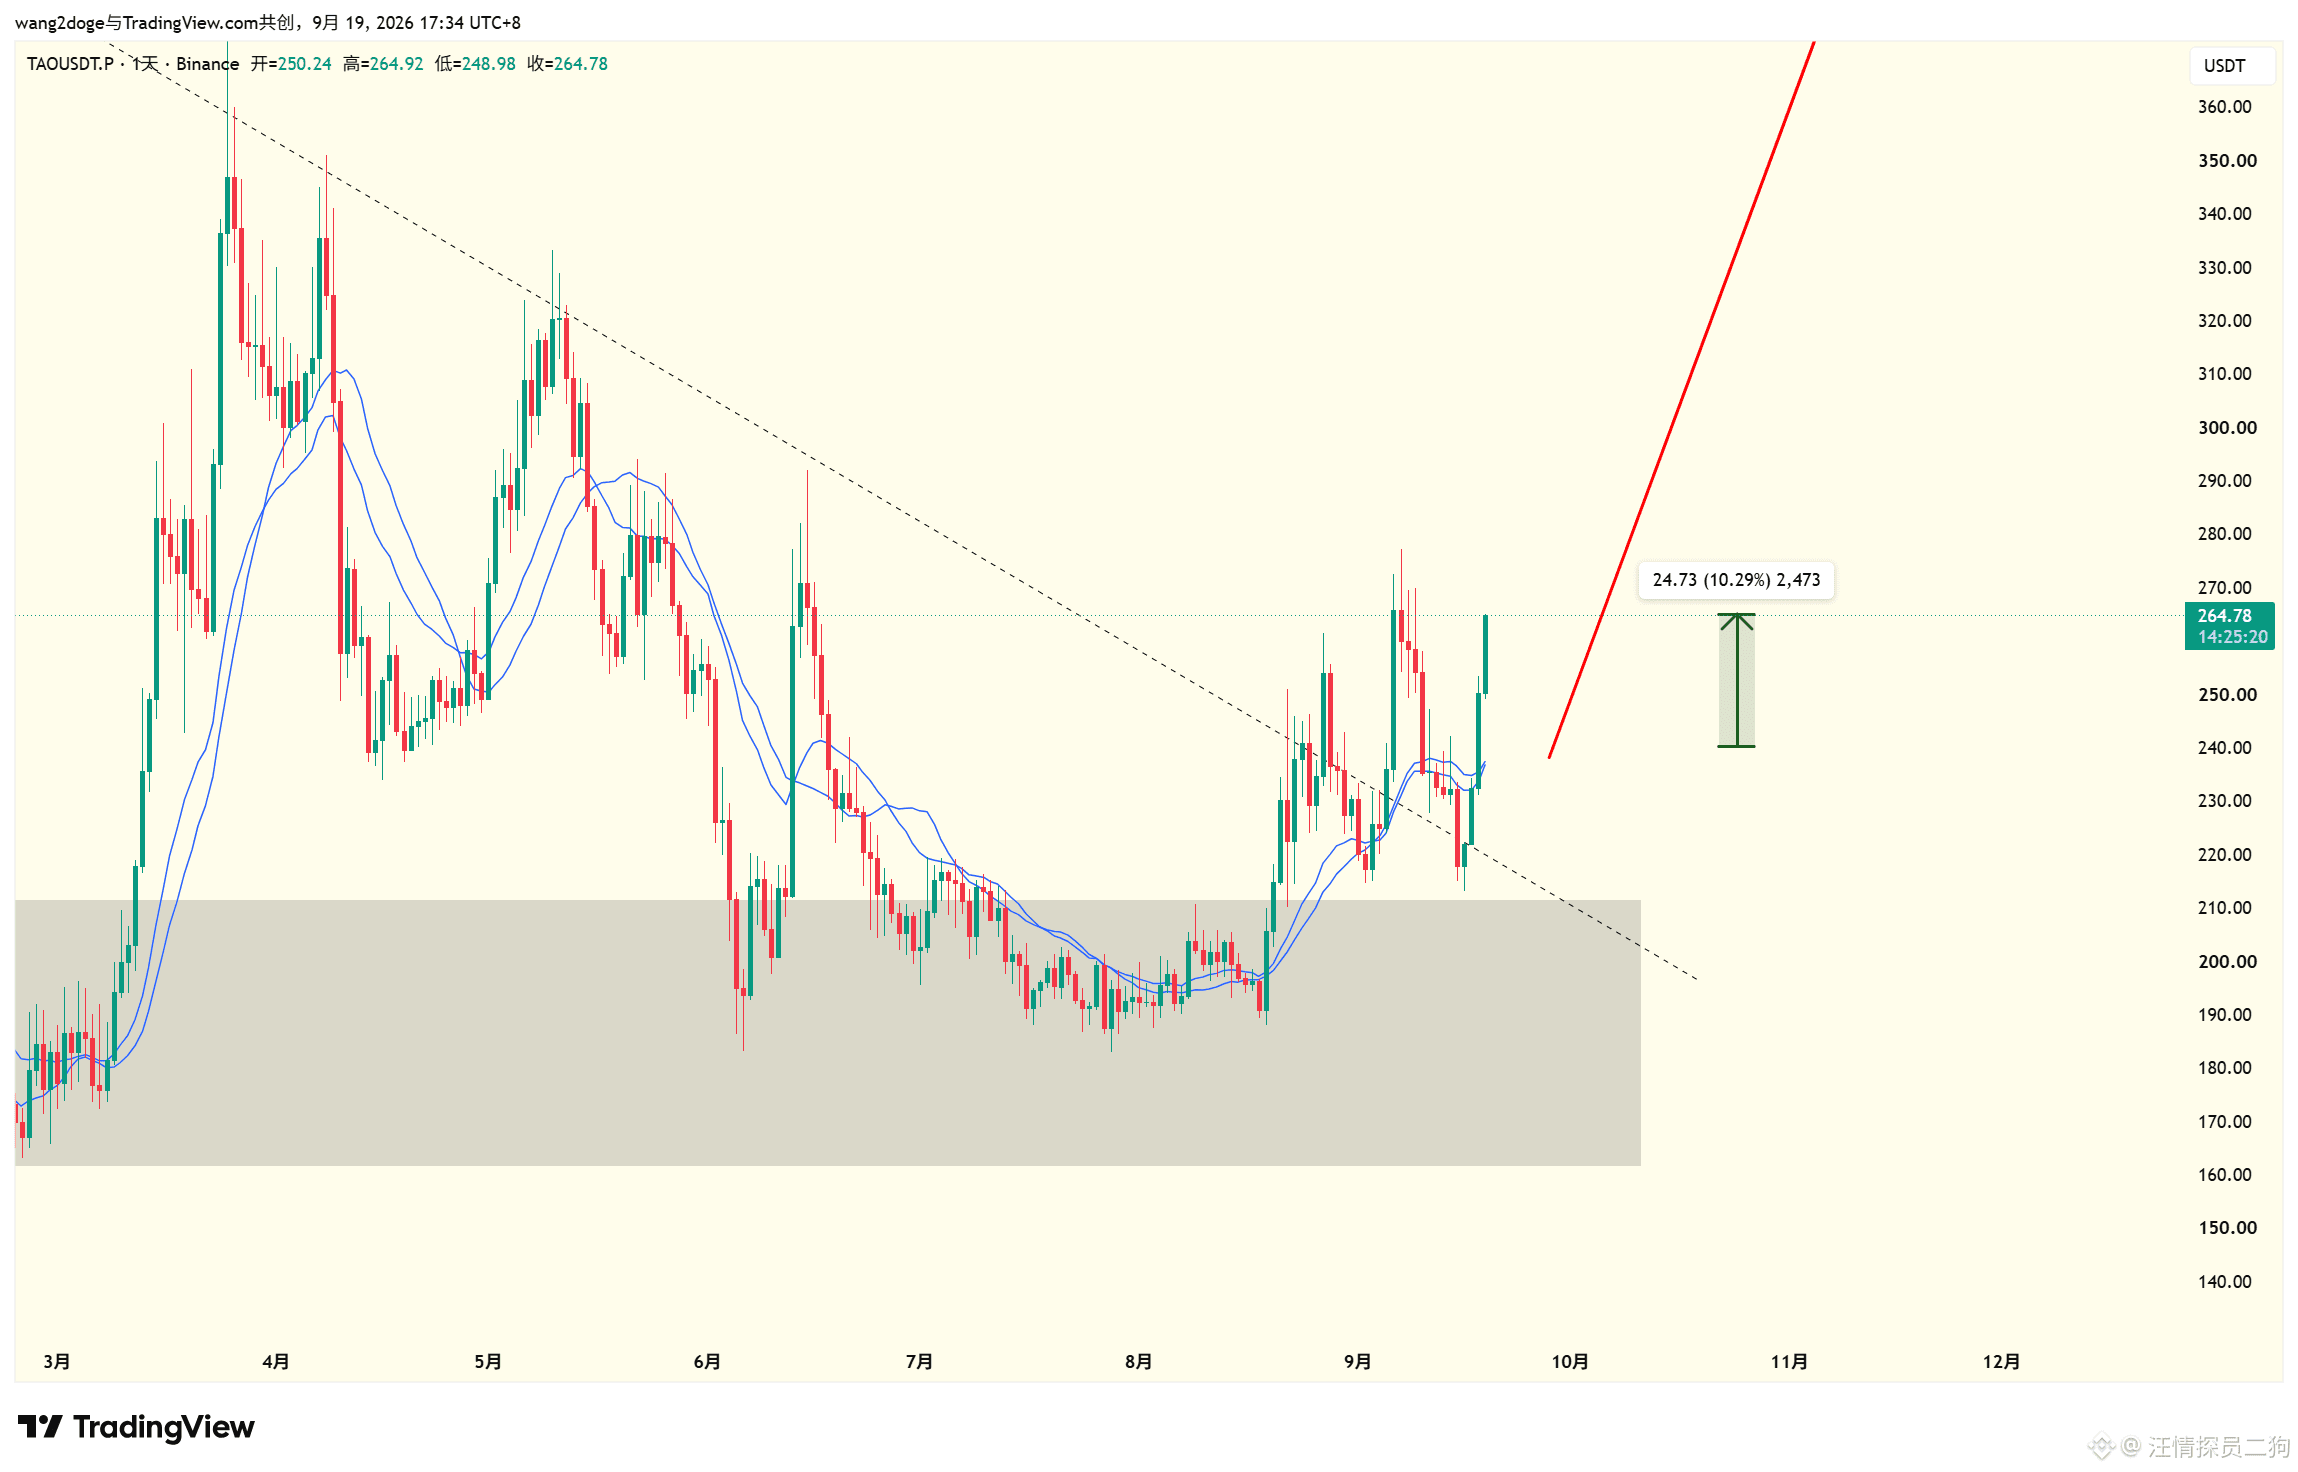
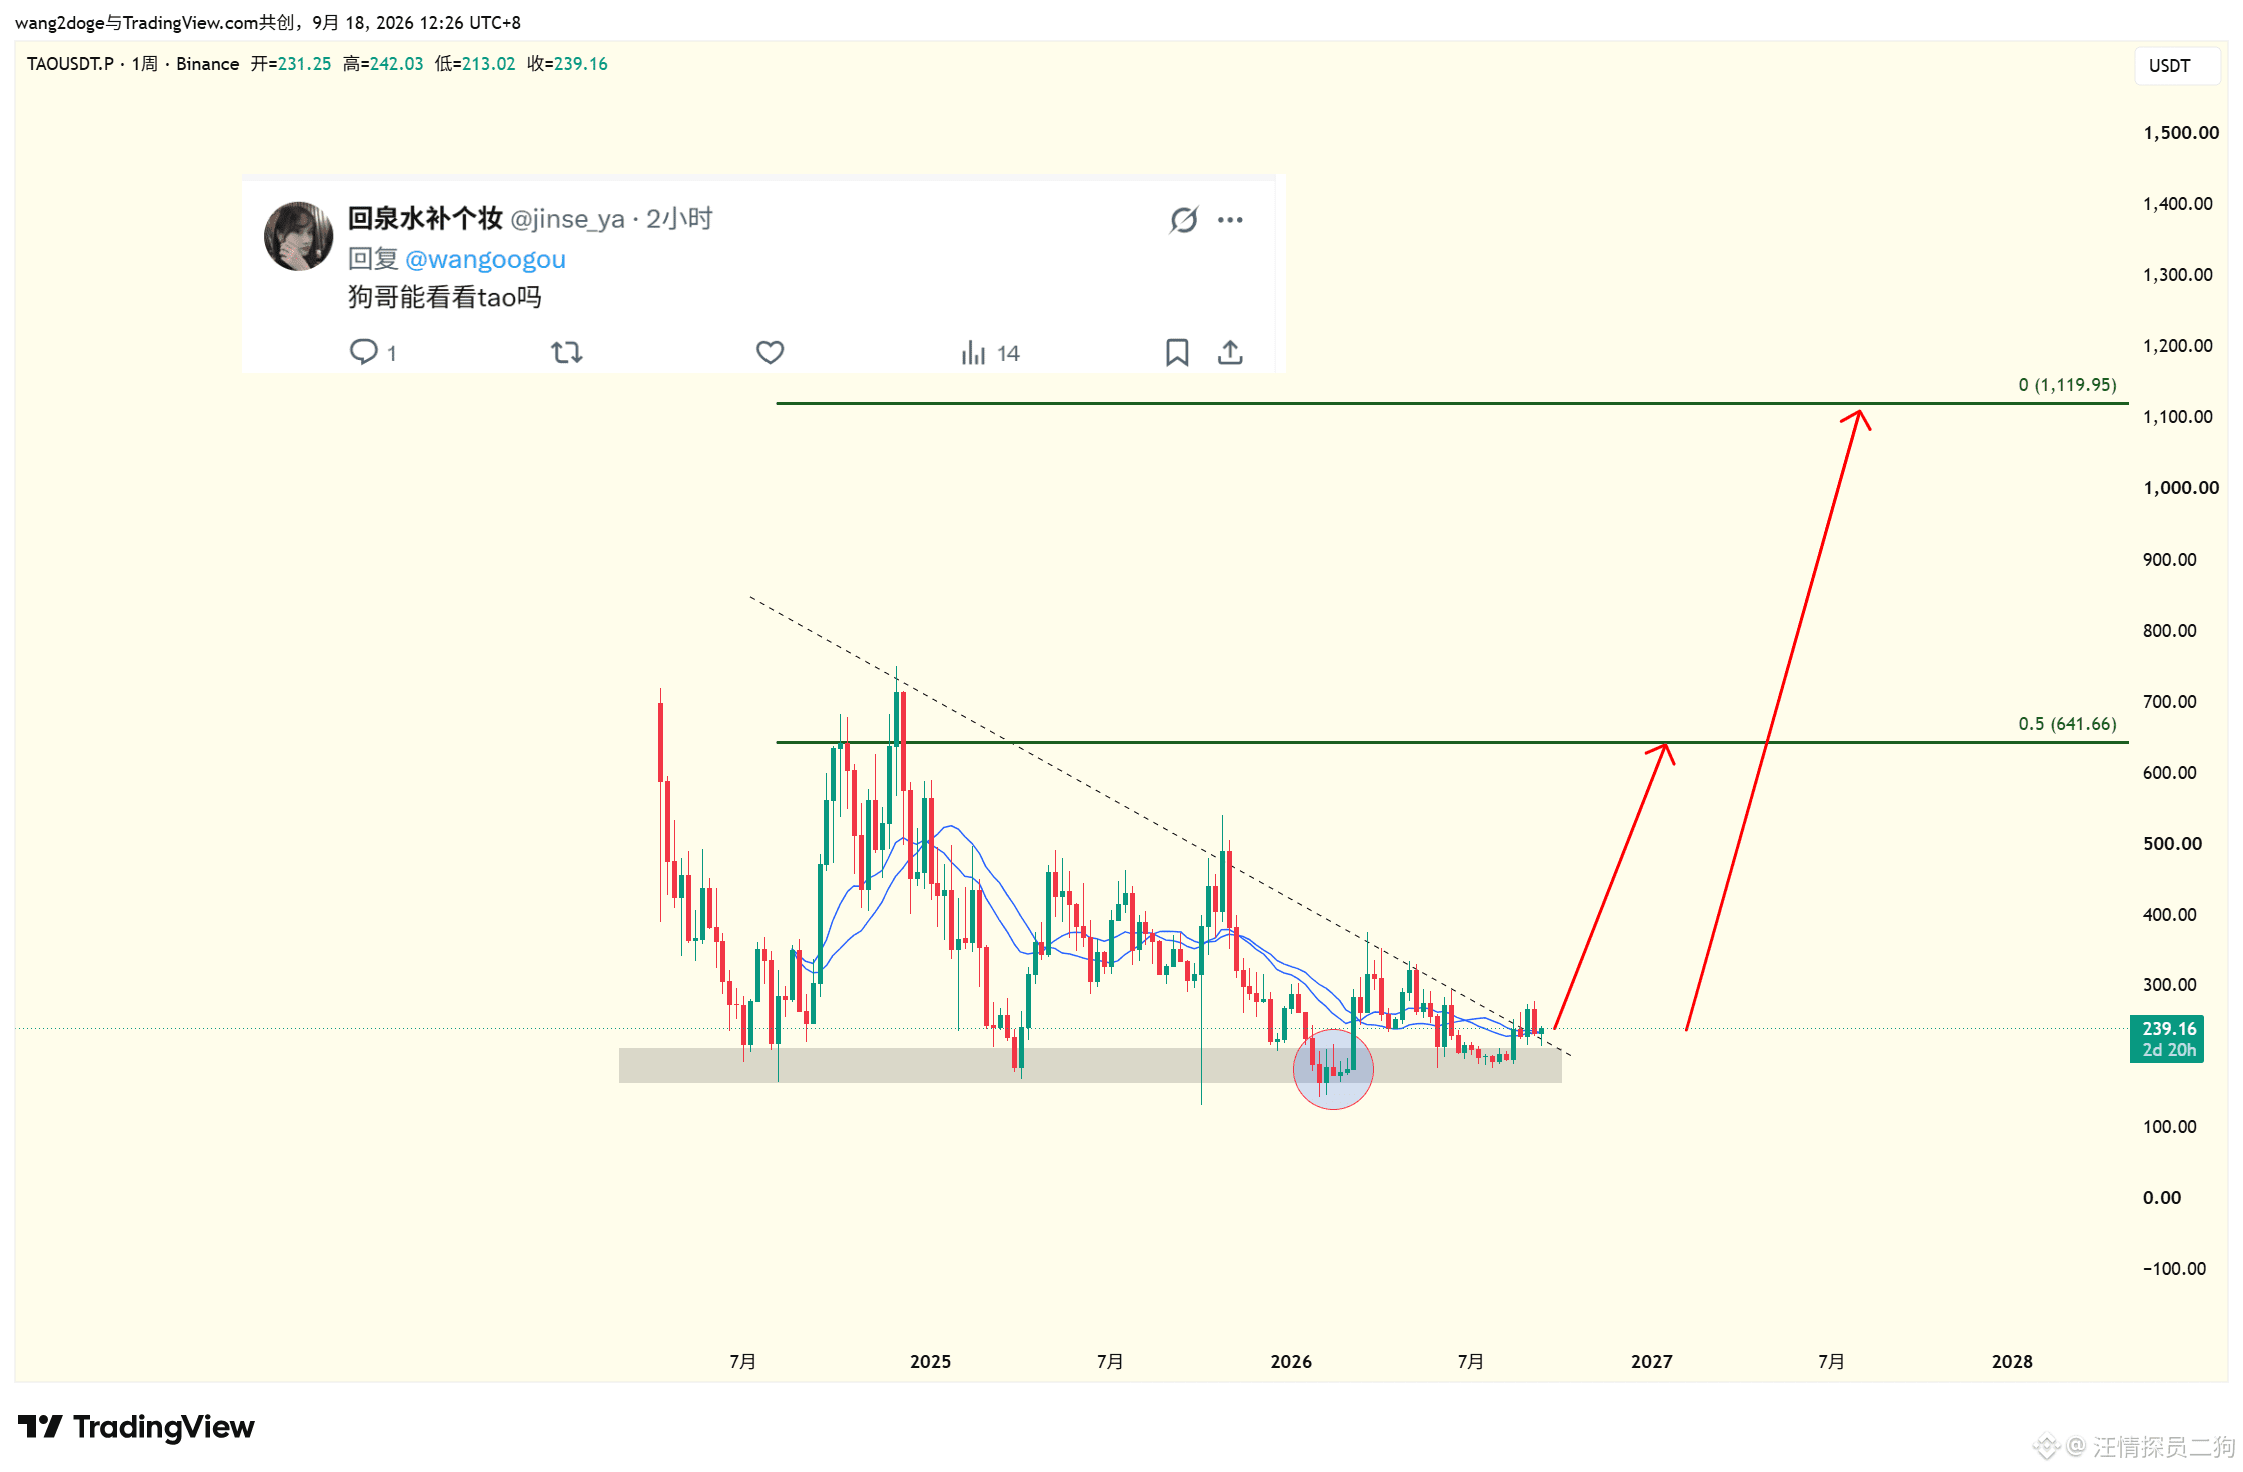
#TAO is required to look ahead at the weekly level
The weekly level forms a descending triangle with a relatively long time-frame
In a normal descending triangle, when it reaches 3/4
that is when you should try to break downward
But TAO does not—it keeps converging toward the top of the triangle
This implies that the descending triangle is likely to fail
In summary: As long as TAO does not lose the black support zone, it will move upward to reach the green line $TAO
The weekly level forms a descending triangle with a relatively long time-frame
In a normal descending triangle, when it reaches 3/4
that is when you should try to break downward
But TAO does not—it keeps converging toward the top of the triangle
This implies that the descending triangle is likely to fail
In summary: As long as TAO does not lose the black support zone, it will move upward to reach the green line $TAO
汪情探员二狗
·
--
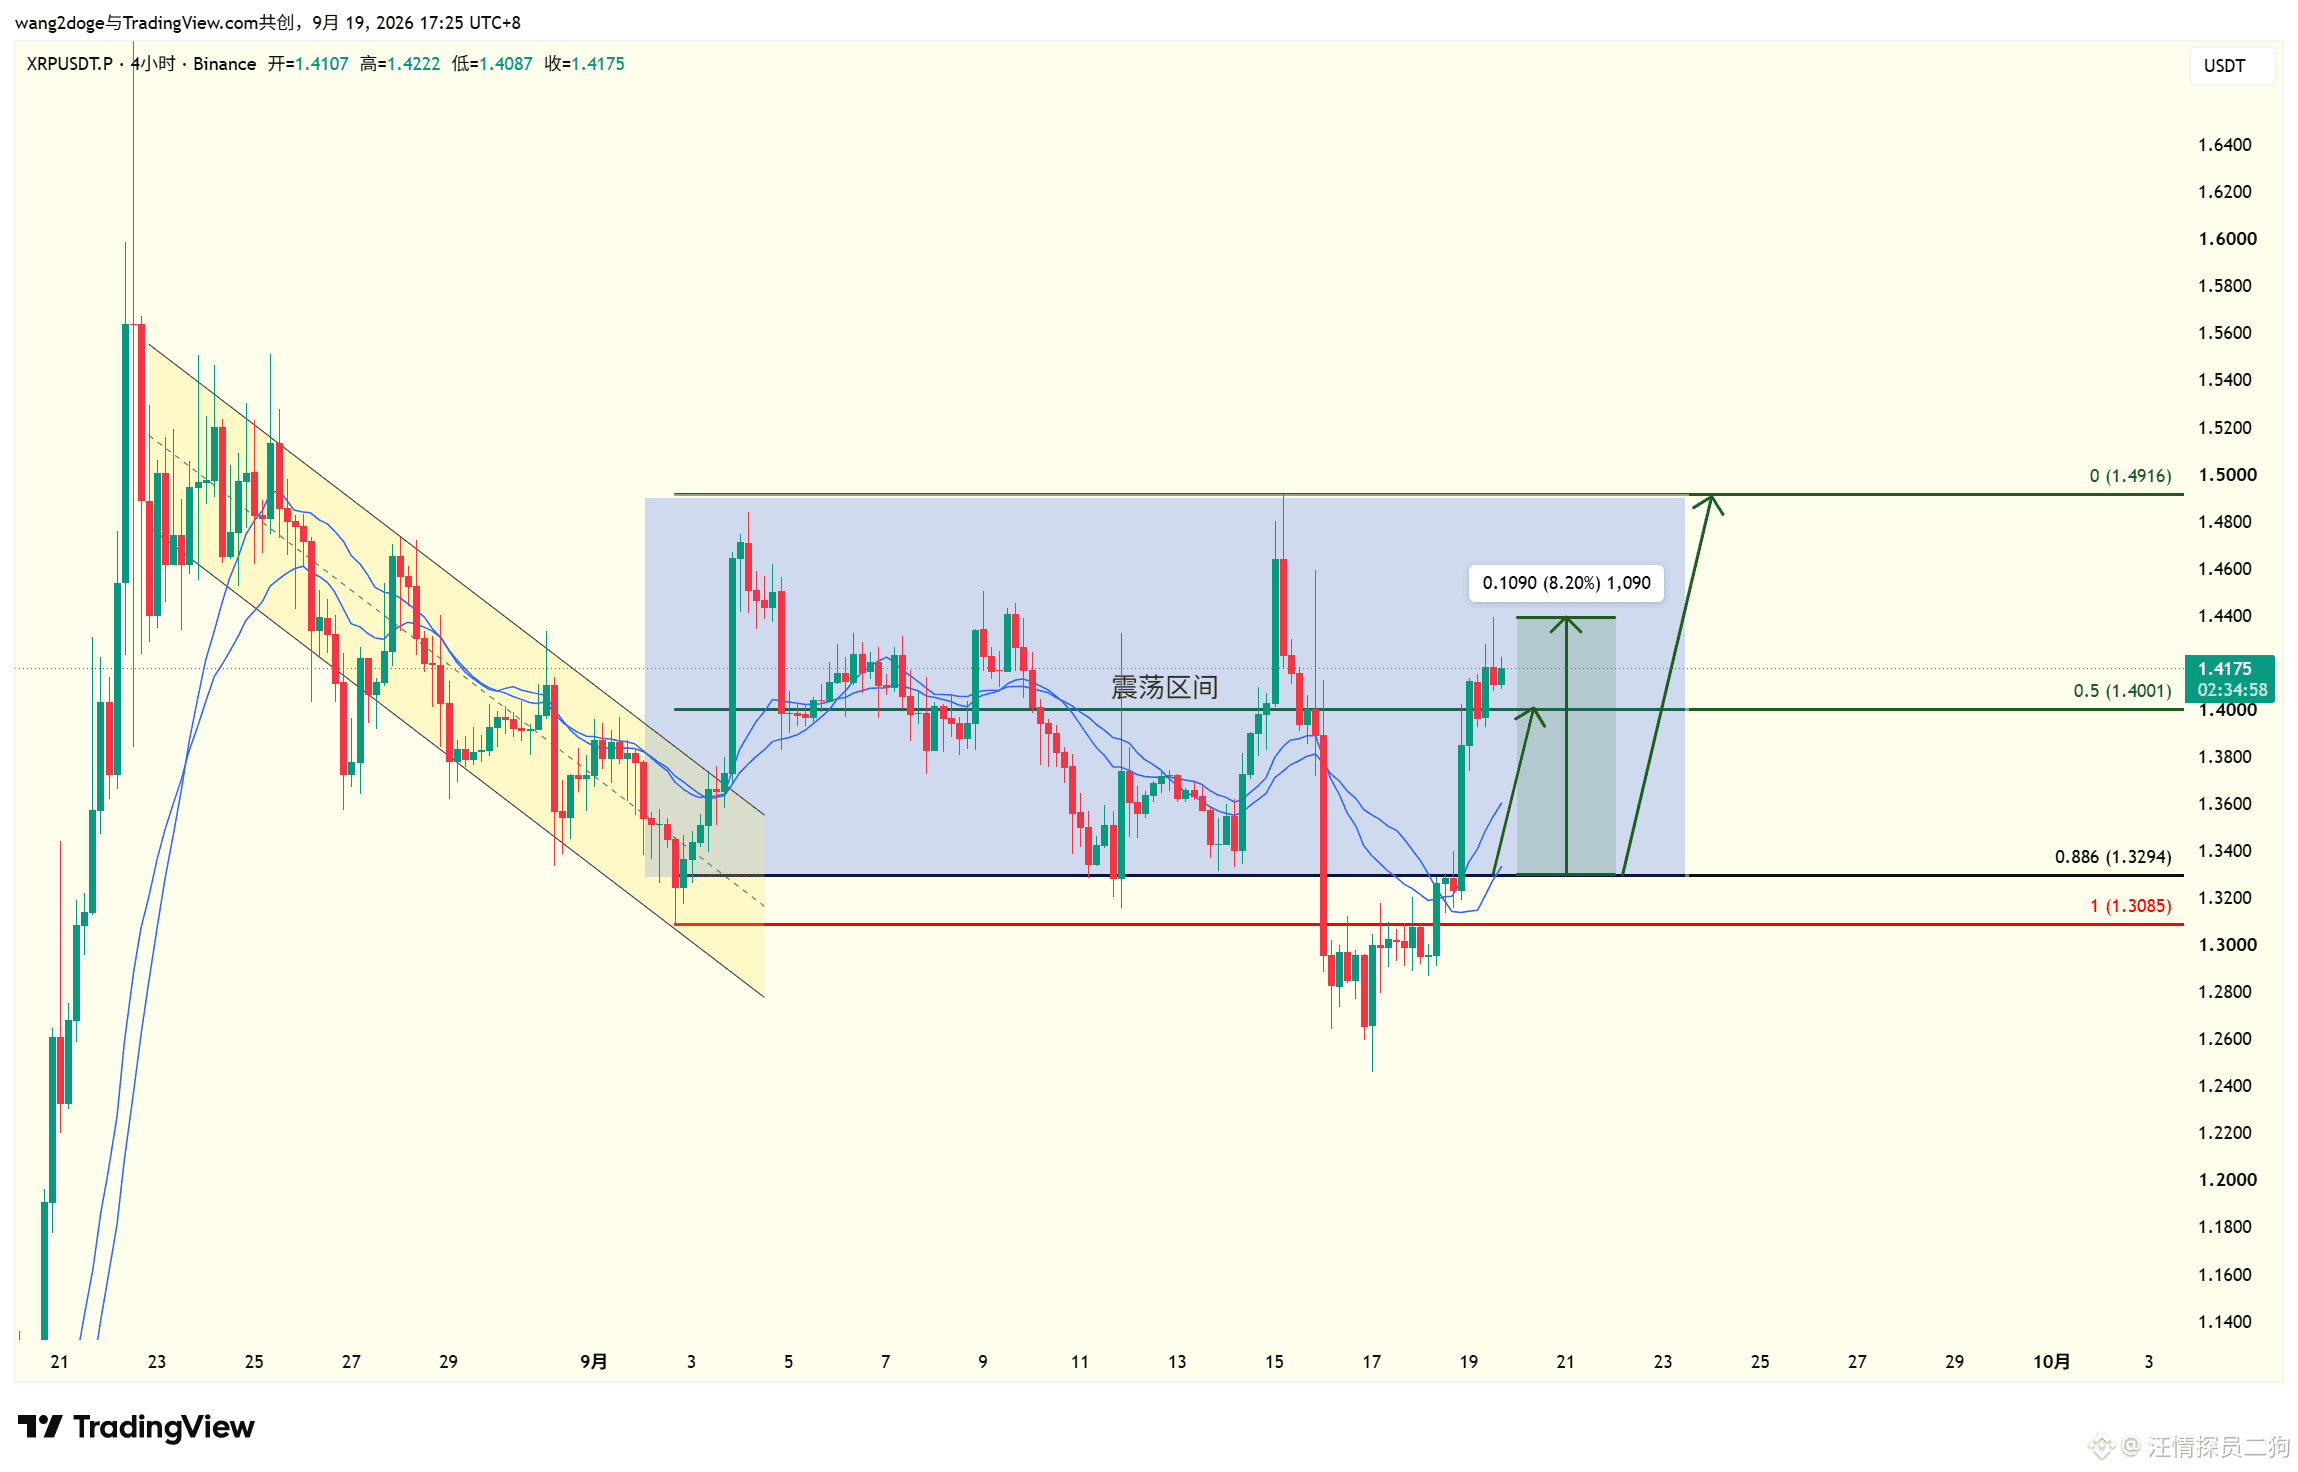
#XRP 4H update
Before, the 4H price action had turned the downward channel into a wide-ranging consolidation
Now it has broken below that consolidation range
To look bullish again, it needs to return back into the consolidation range
That is, the 4H close must continue trading above the black line!$XRP
Before, the 4H price action had turned the downward channel into a wide-ranging consolidation
Now it has broken below that consolidation range
To look bullish again, it needs to return back into the consolidation range
That is, the 4H close must continue trading above the black line!$XRP
汪情探员二狗
·
--
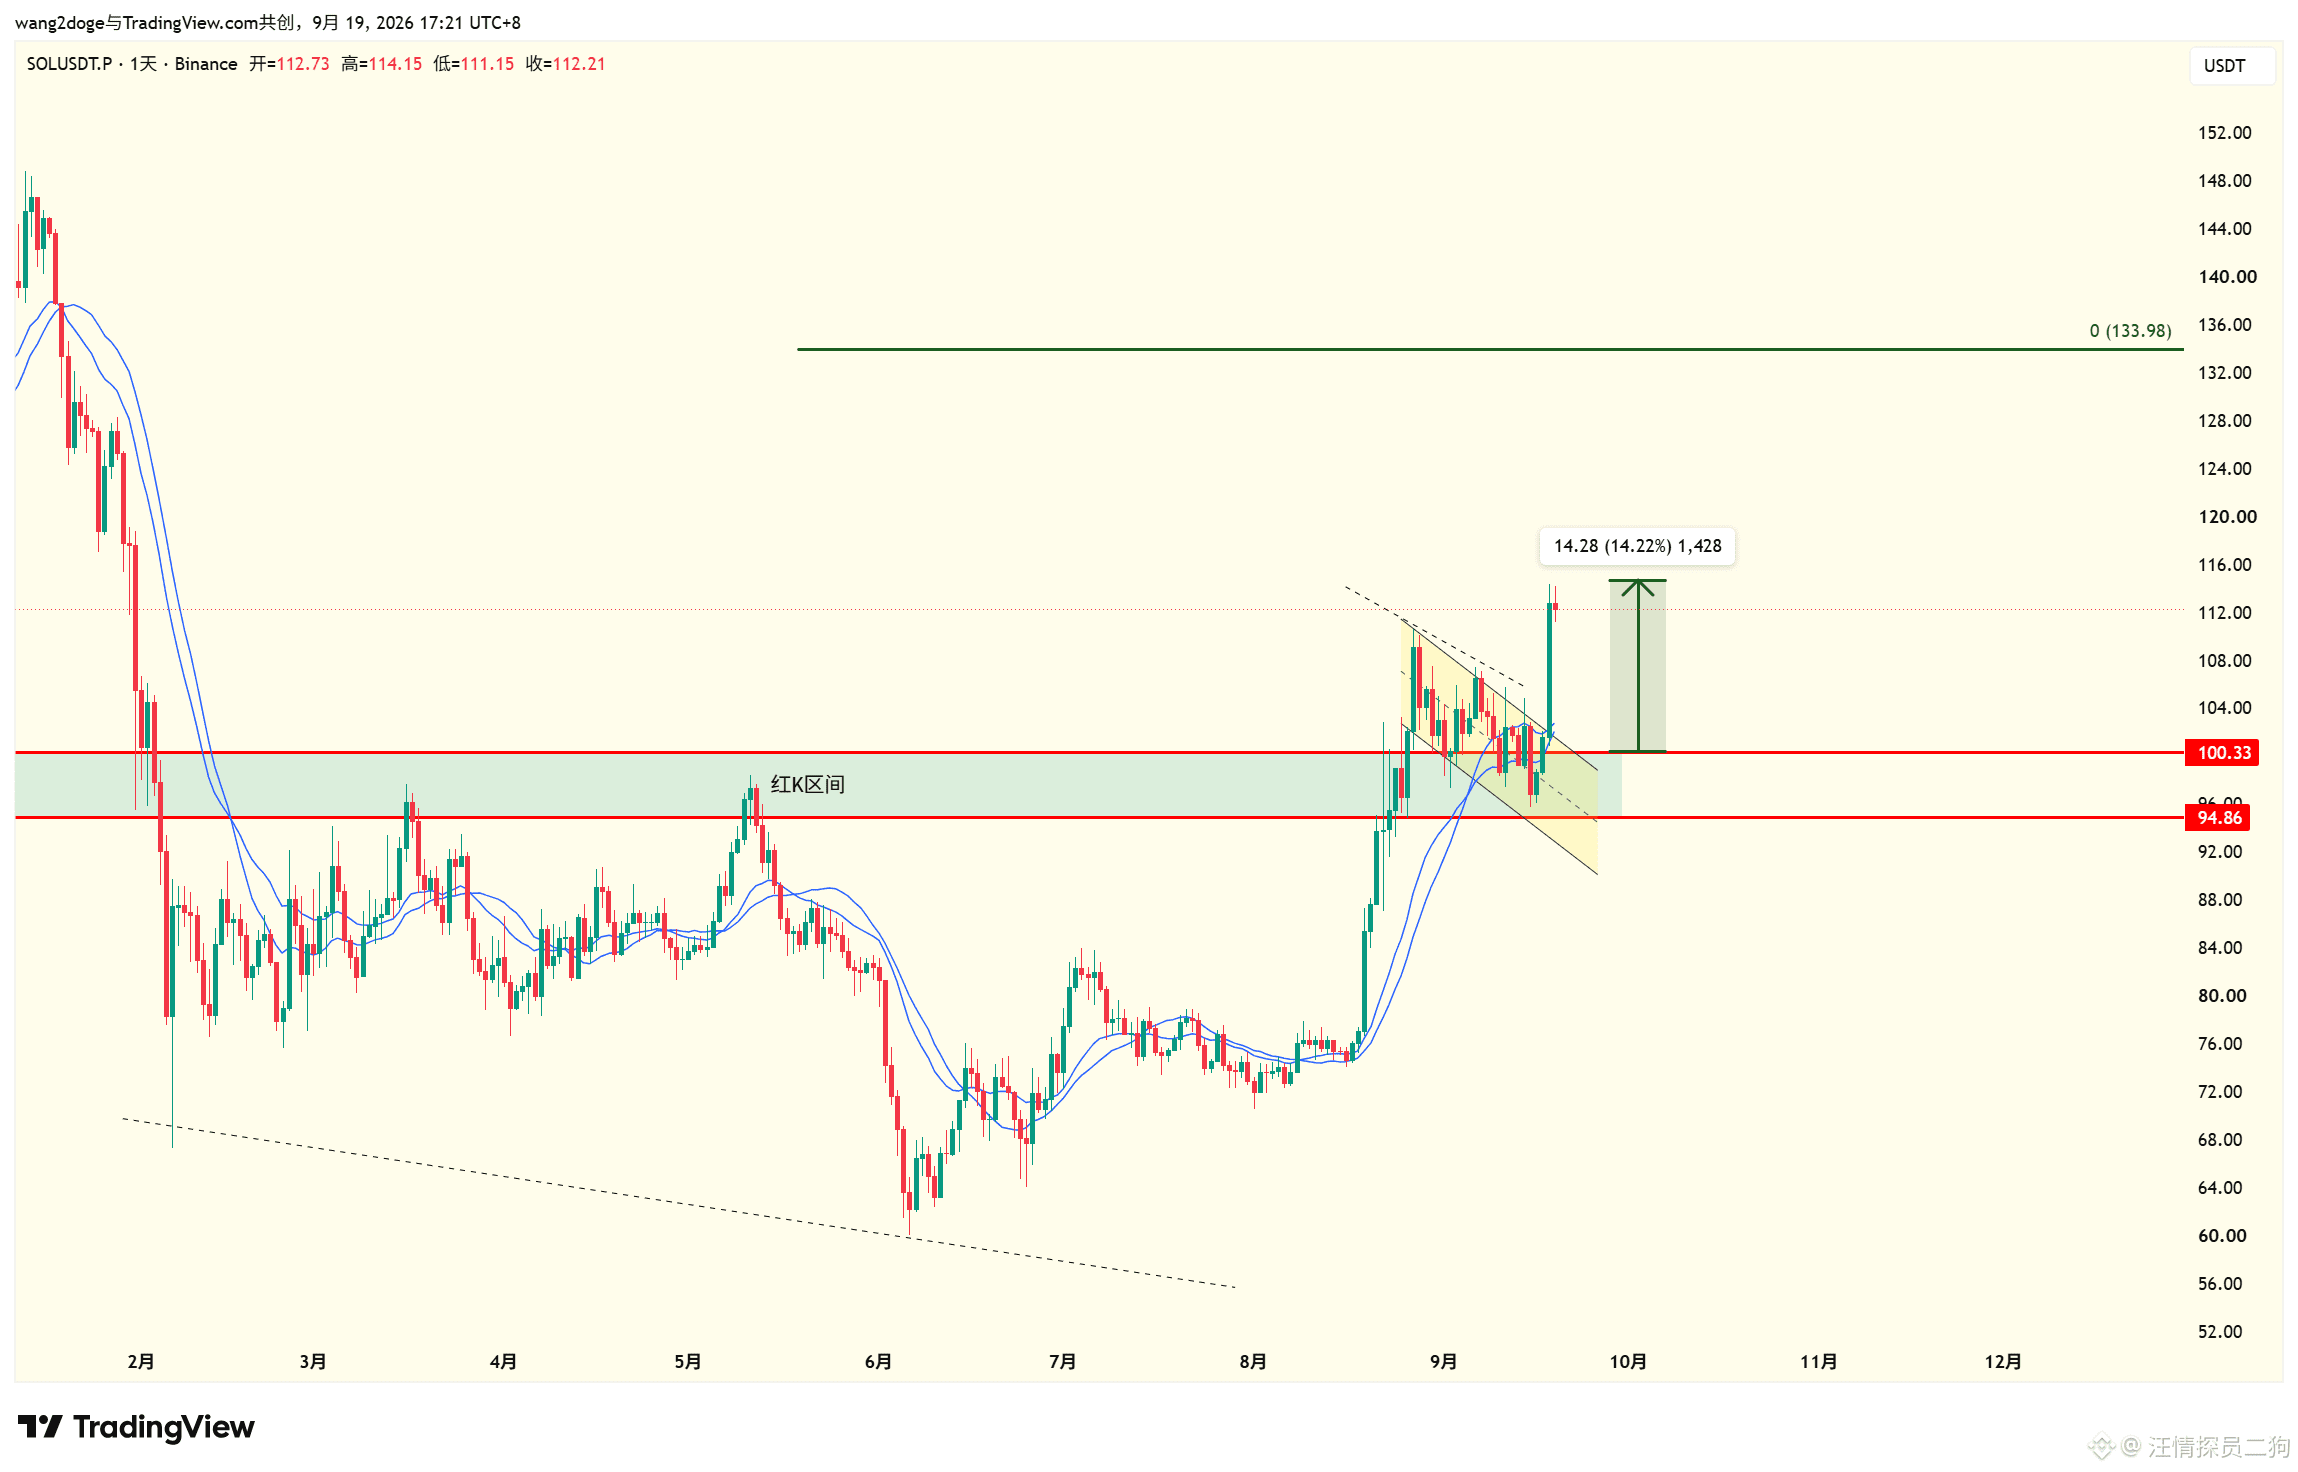
#SOL 1D Update
Previously, our analysis of SOL was that 100 was crucial.
However, due to the fact that the subsequent price action did not break out to form a new high point,
that 100 level was vulnerable and got cleared.
See the previous SOL analysis for details.
Now the market structure is clear.
94.82 is the bottom of SOL.
If the 1D close is below 94.82, then upside space opens up.
If it is not below 94.82, then we can still look toward the upper green line as the target.
Previously, our analysis of SOL was that 100 was crucial.
However, due to the fact that the subsequent price action did not break out to form a new high point,
that 100 level was vulnerable and got cleared.
See the previous SOL analysis for details.
Now the market structure is clear.
94.82 is the bottom of SOL.
If the 1D close is below 94.82, then upside space opens up.
If it is not below 94.82, then we can still look toward the upper green line as the target.
汪情探员二狗
·
--
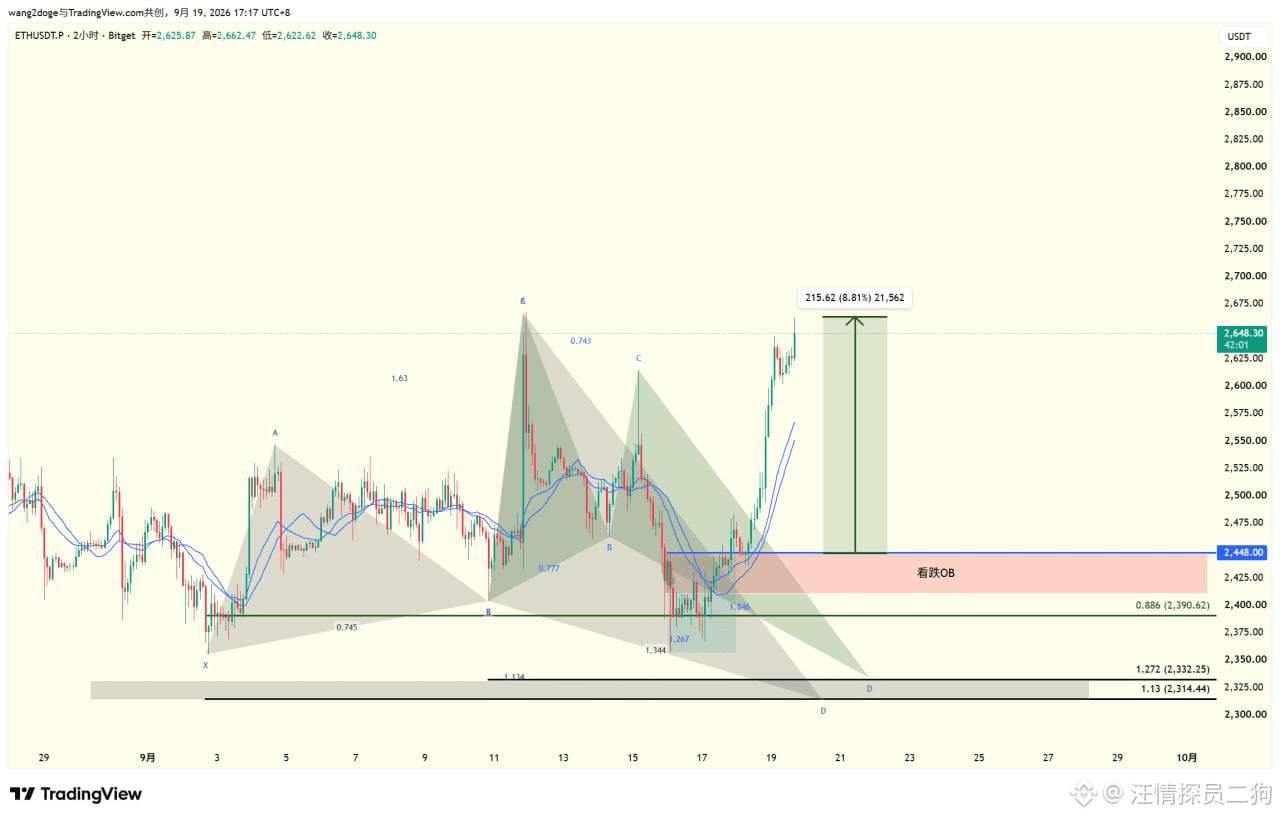
#ETH 2H Update
2H has a harmonious pattern
A bullish pending shark 🦈 and a bullish pending butterfly 🦋 form a harmonious structure
Both structures require entry at point D
So the combined D-point range is an important reversal zone
Meanwhile, the bearish OB range above is the current resistance zone
In summary:
1. When it reaches the lower black zone, try to enter
2. Re-transform the bearish OB zone into support to enter
Be wary of extreme market conditions leading to a test 2222
We talked about this earlier when we discussed copying the boat after the fact, so I won’t repeat it $ETH
2H has a harmonious pattern
A bullish pending shark 🦈 and a bullish pending butterfly 🦋 form a harmonious structure
Both structures require entry at point D
So the combined D-point range is an important reversal zone
Meanwhile, the bearish OB range above is the current resistance zone
In summary:
1. When it reaches the lower black zone, try to enter
2. Re-transform the bearish OB zone into support to enter
Be wary of extreme market conditions leading to a test 2222
We talked about this earlier when we discussed copying the boat after the fact, so I won’t repeat it $ETH
汪情探员二狗
·
--
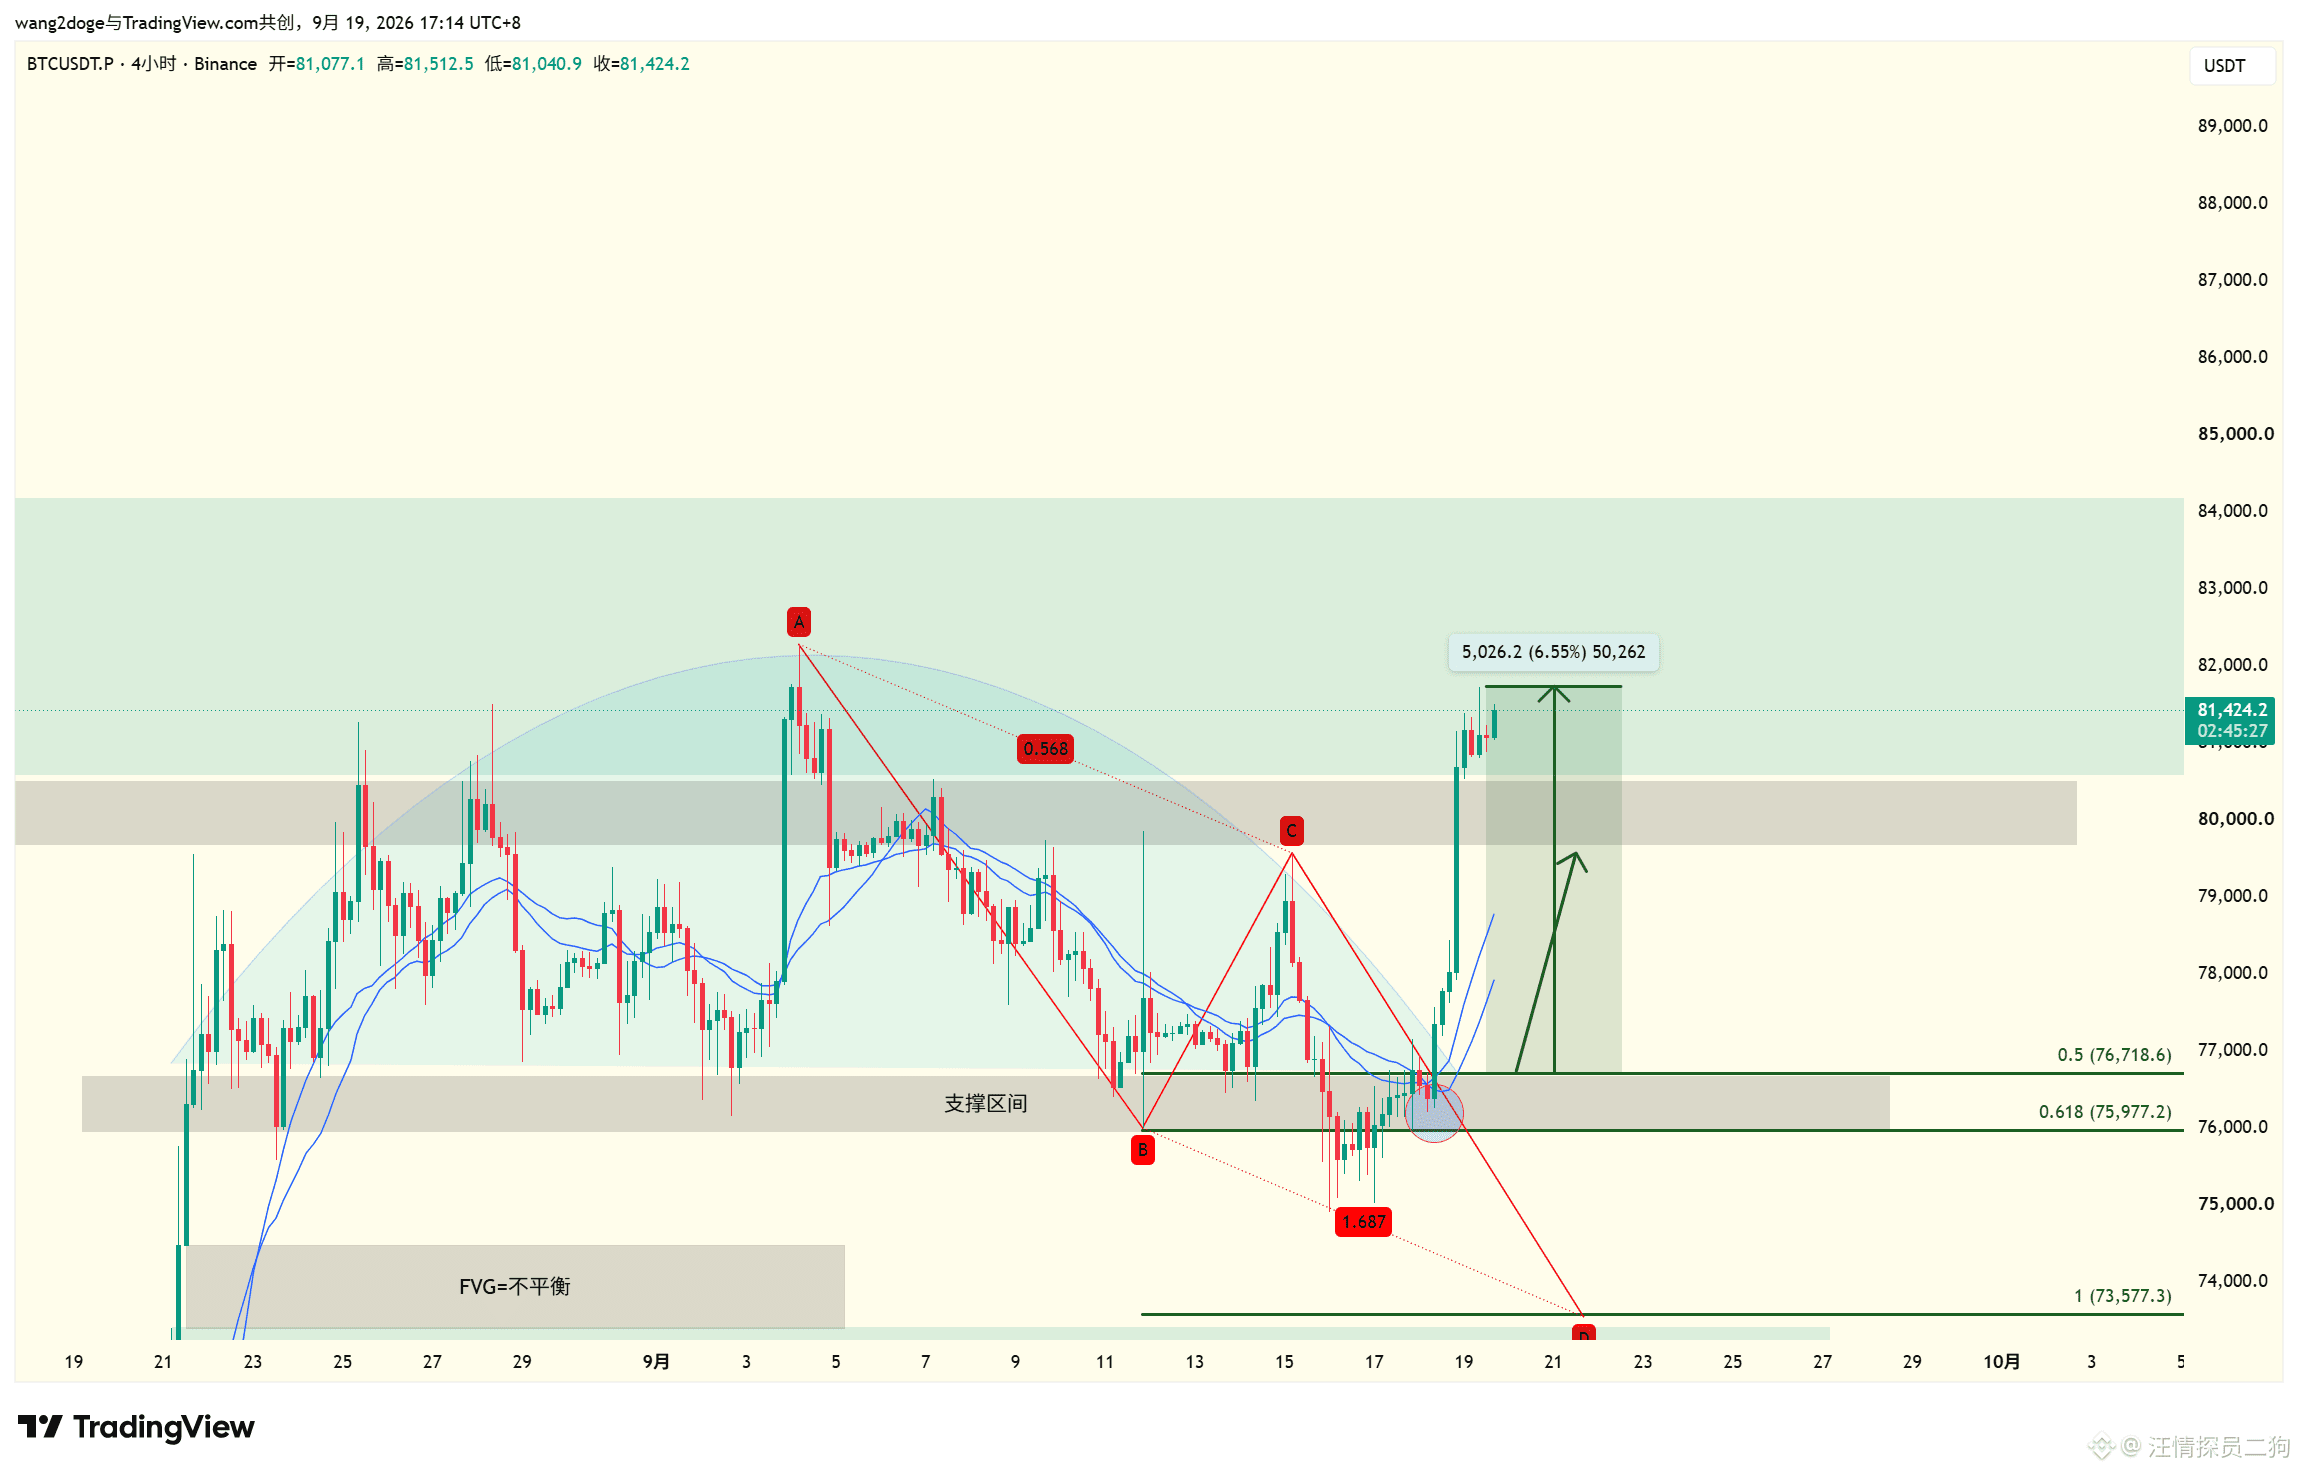
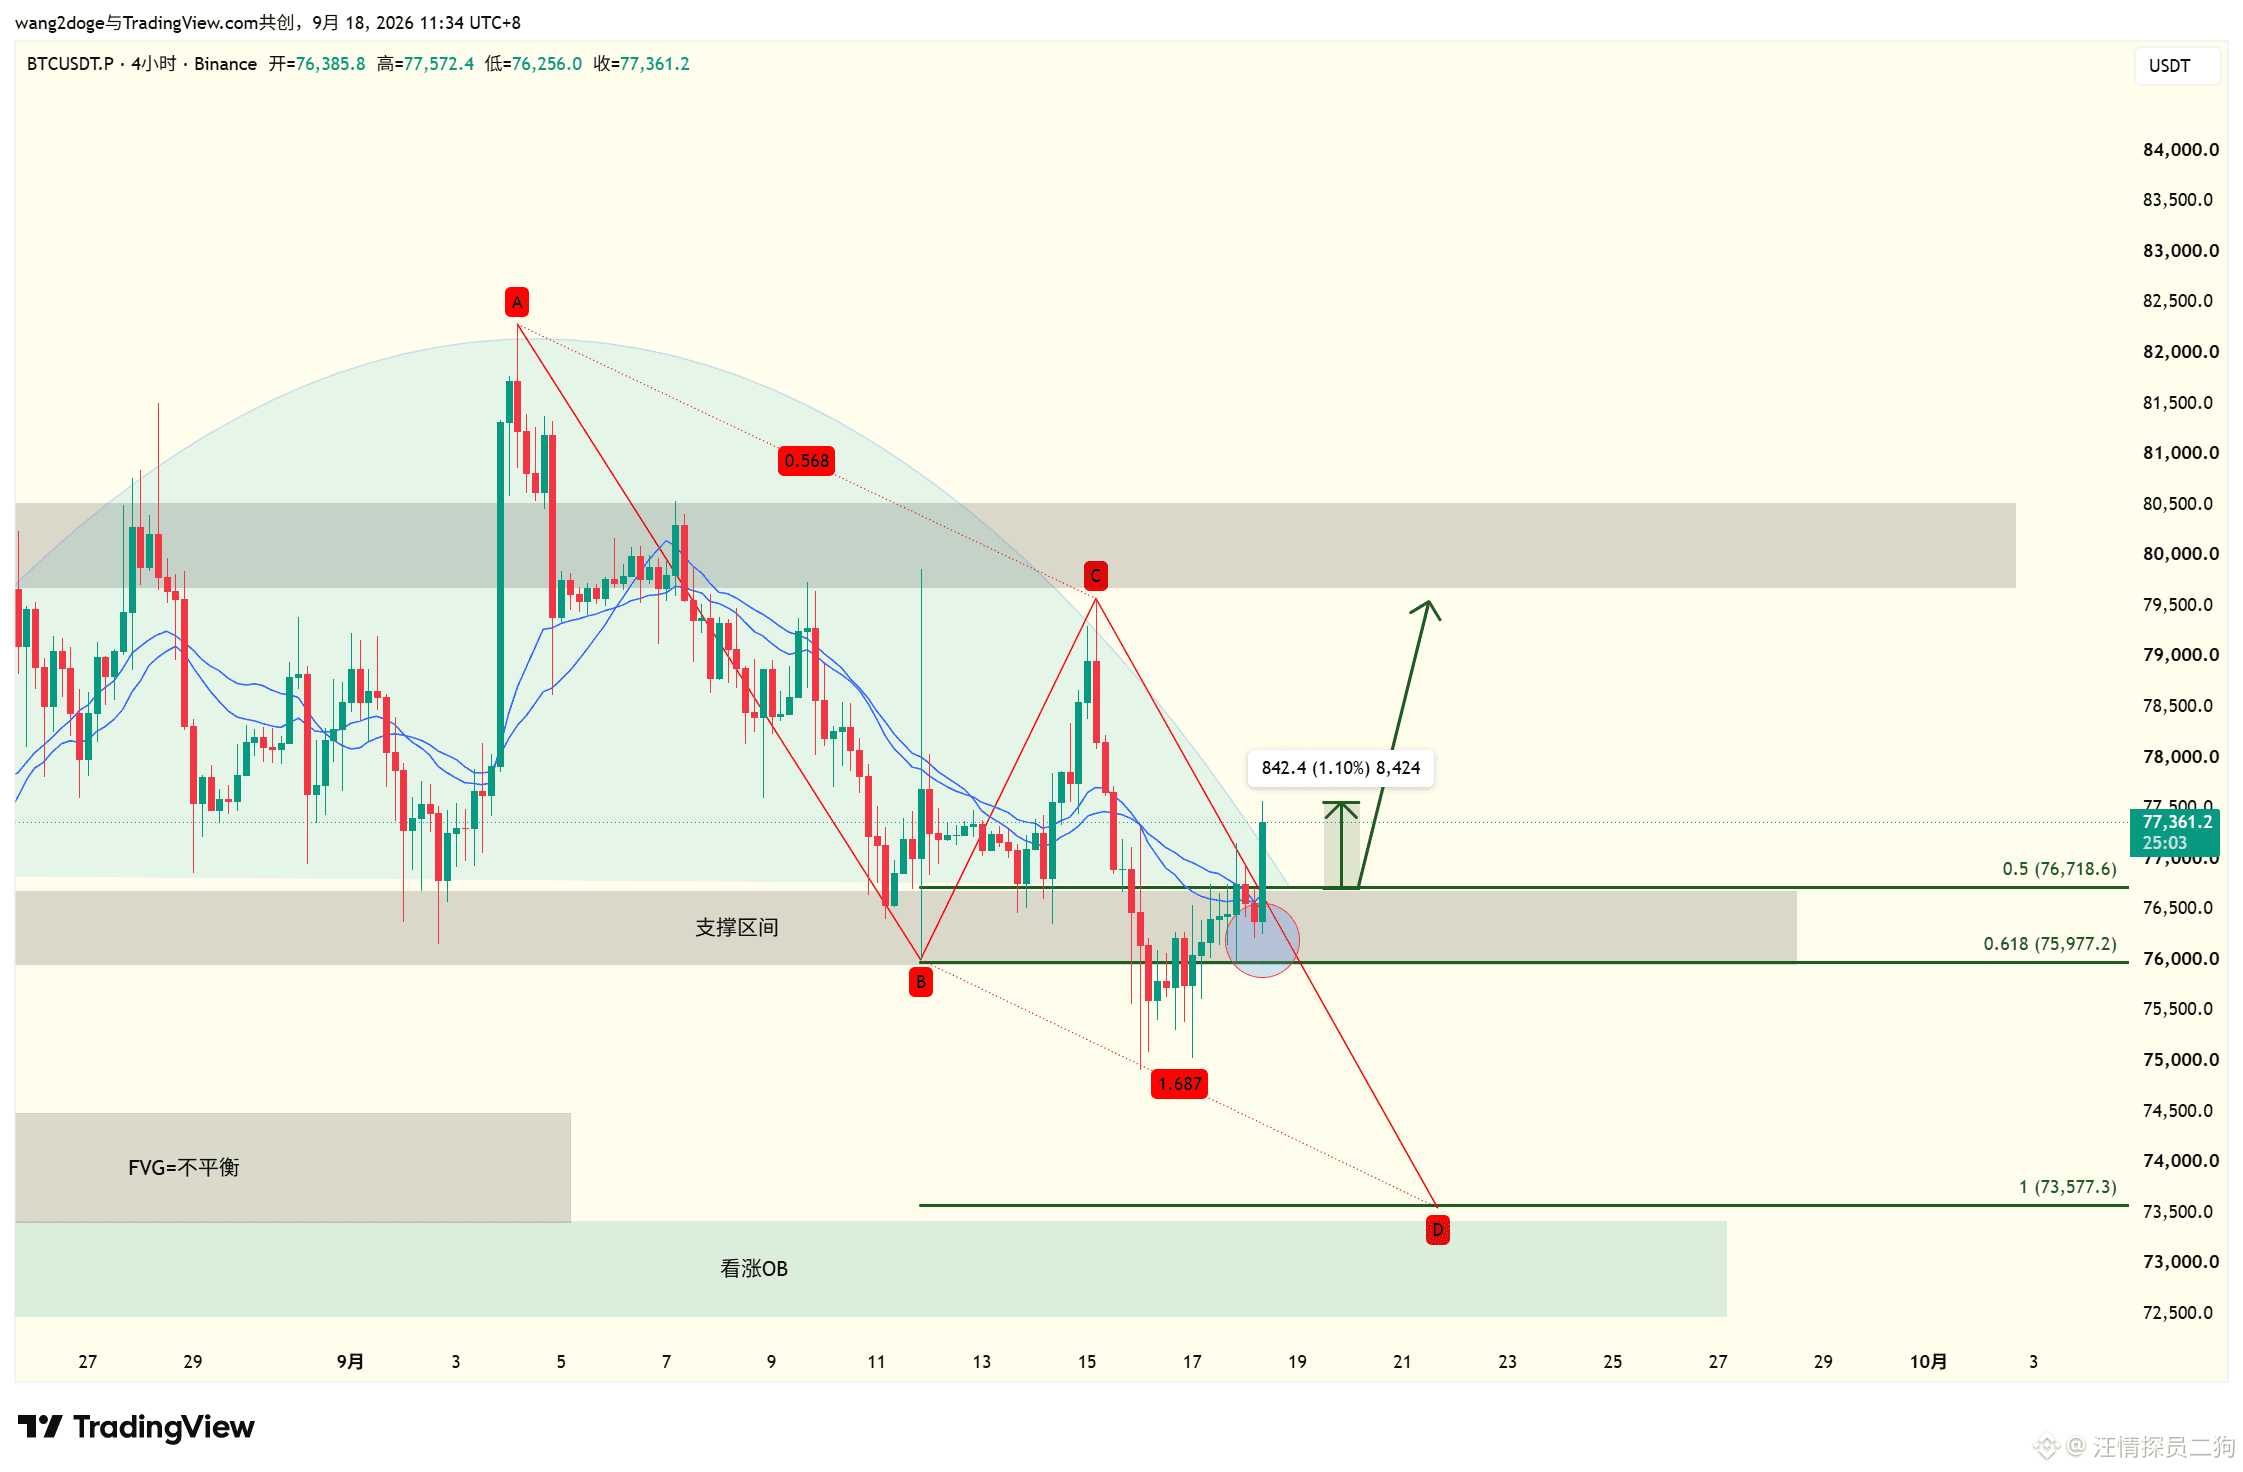
#BTC 4H
There is suspicion of a breakdown test from a rounded-top
At the same time, there is a potential AB=CD
The normal landing point D for AB=CD is 73577, and the extreme landing point D is 69694
The two D levels overlap with the bullish OB zone, forming a key reversal zone
Now it is necessary to quickly resume upward movement above the black zone
The black zone is the watershed of the price action
In summary:
1. Stay above the black zone and continue to look bullish
2. If you cannot remain below the black zone, it will test upward below the green zone by $BTC
There is suspicion of a breakdown test from a rounded-top
At the same time, there is a potential AB=CD
The normal landing point D for AB=CD is 73577, and the extreme landing point D is 69694
The two D levels overlap with the bullish OB zone, forming a key reversal zone
Now it is necessary to quickly resume upward movement above the black zone
The black zone is the watershed of the price action
In summary:
1. Stay above the black zone and continue to look bullish
2. If you cannot remain below the black zone, it will test upward below the green zone by $BTC
汪情探员二狗
·
--
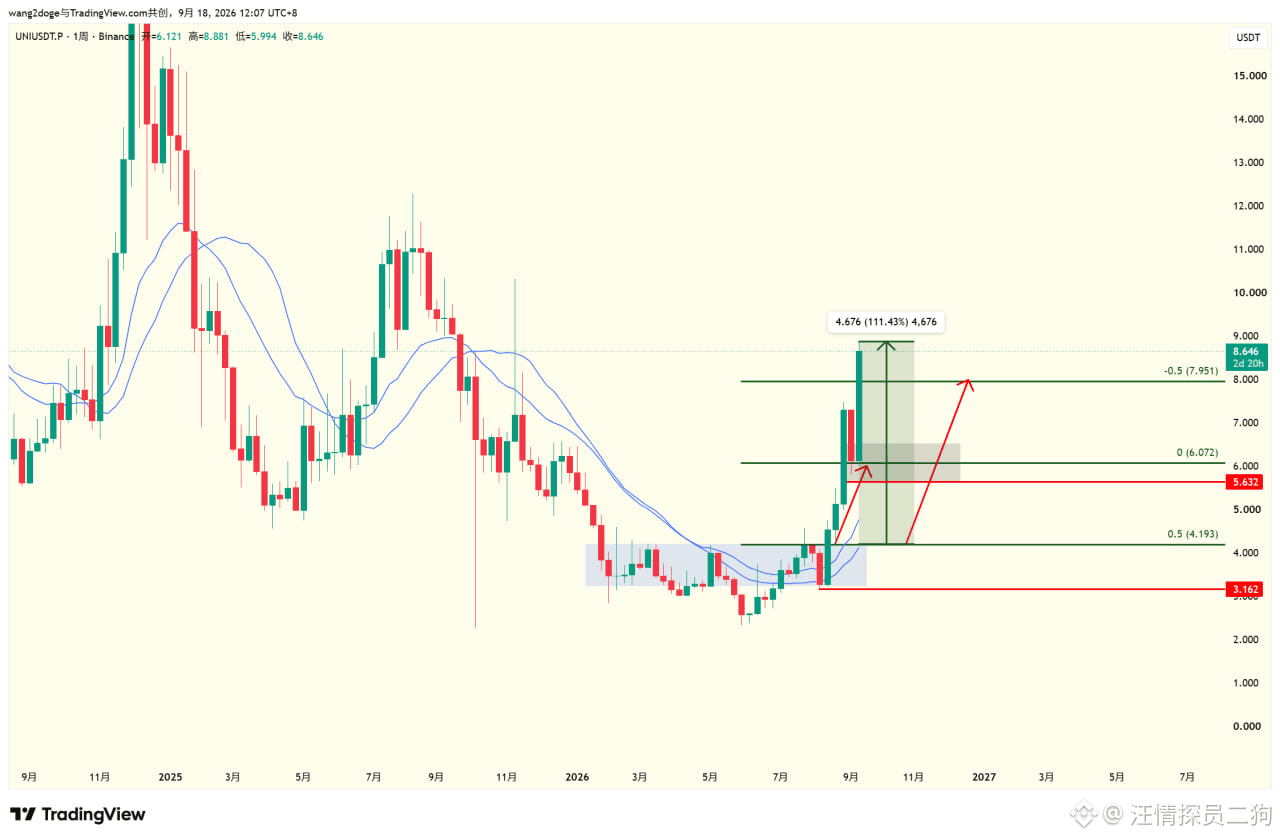
#UNI Weekly Outlook
Weekly Head-and-Shoulders Bottom Pattern
If this week’s K-close is still a large bullish candle like this
the breakout probability is higher than 60%
the expected successful breakout targets an increase to the green line
Weekly Head-and-Shoulders Bottom Pattern
If this week’s K-close is still a large bullish candle like this
the breakout probability is higher than 60%
the expected successful breakout targets an increase to the green line
汪情探员二狗
·
--
#BTC 4H
There is suspicion of a breakdown test from a rounded-top
At the same time, there is a potential AB=CD
The normal landing point D for AB=CD is 73577, and the extreme landing point D is 69694
The two D levels overlap with the bullish OB zone, forming a key reversal zone
Now it is necessary to quickly resume upward movement above the black zone
The black zone is the watershed of the price action
In summary:
1. Stay above the black zone and continue to look bullish
2. If you cannot remain below the black zone, it will test upward below the green zone by $BTC
There is suspicion of a breakdown test from a rounded-top
At the same time, there is a potential AB=CD
The normal landing point D for AB=CD is 73577, and the extreme landing point D is 69694
The two D levels overlap with the bullish OB zone, forming a key reversal zone
Now it is necessary to quickly resume upward movement above the black zone
The black zone is the watershed of the price action
In summary:
1. Stay above the black zone and continue to look bullish
2. If you cannot remain below the black zone, it will test upward below the green zone by $BTC
汪情探员二狗
·
--
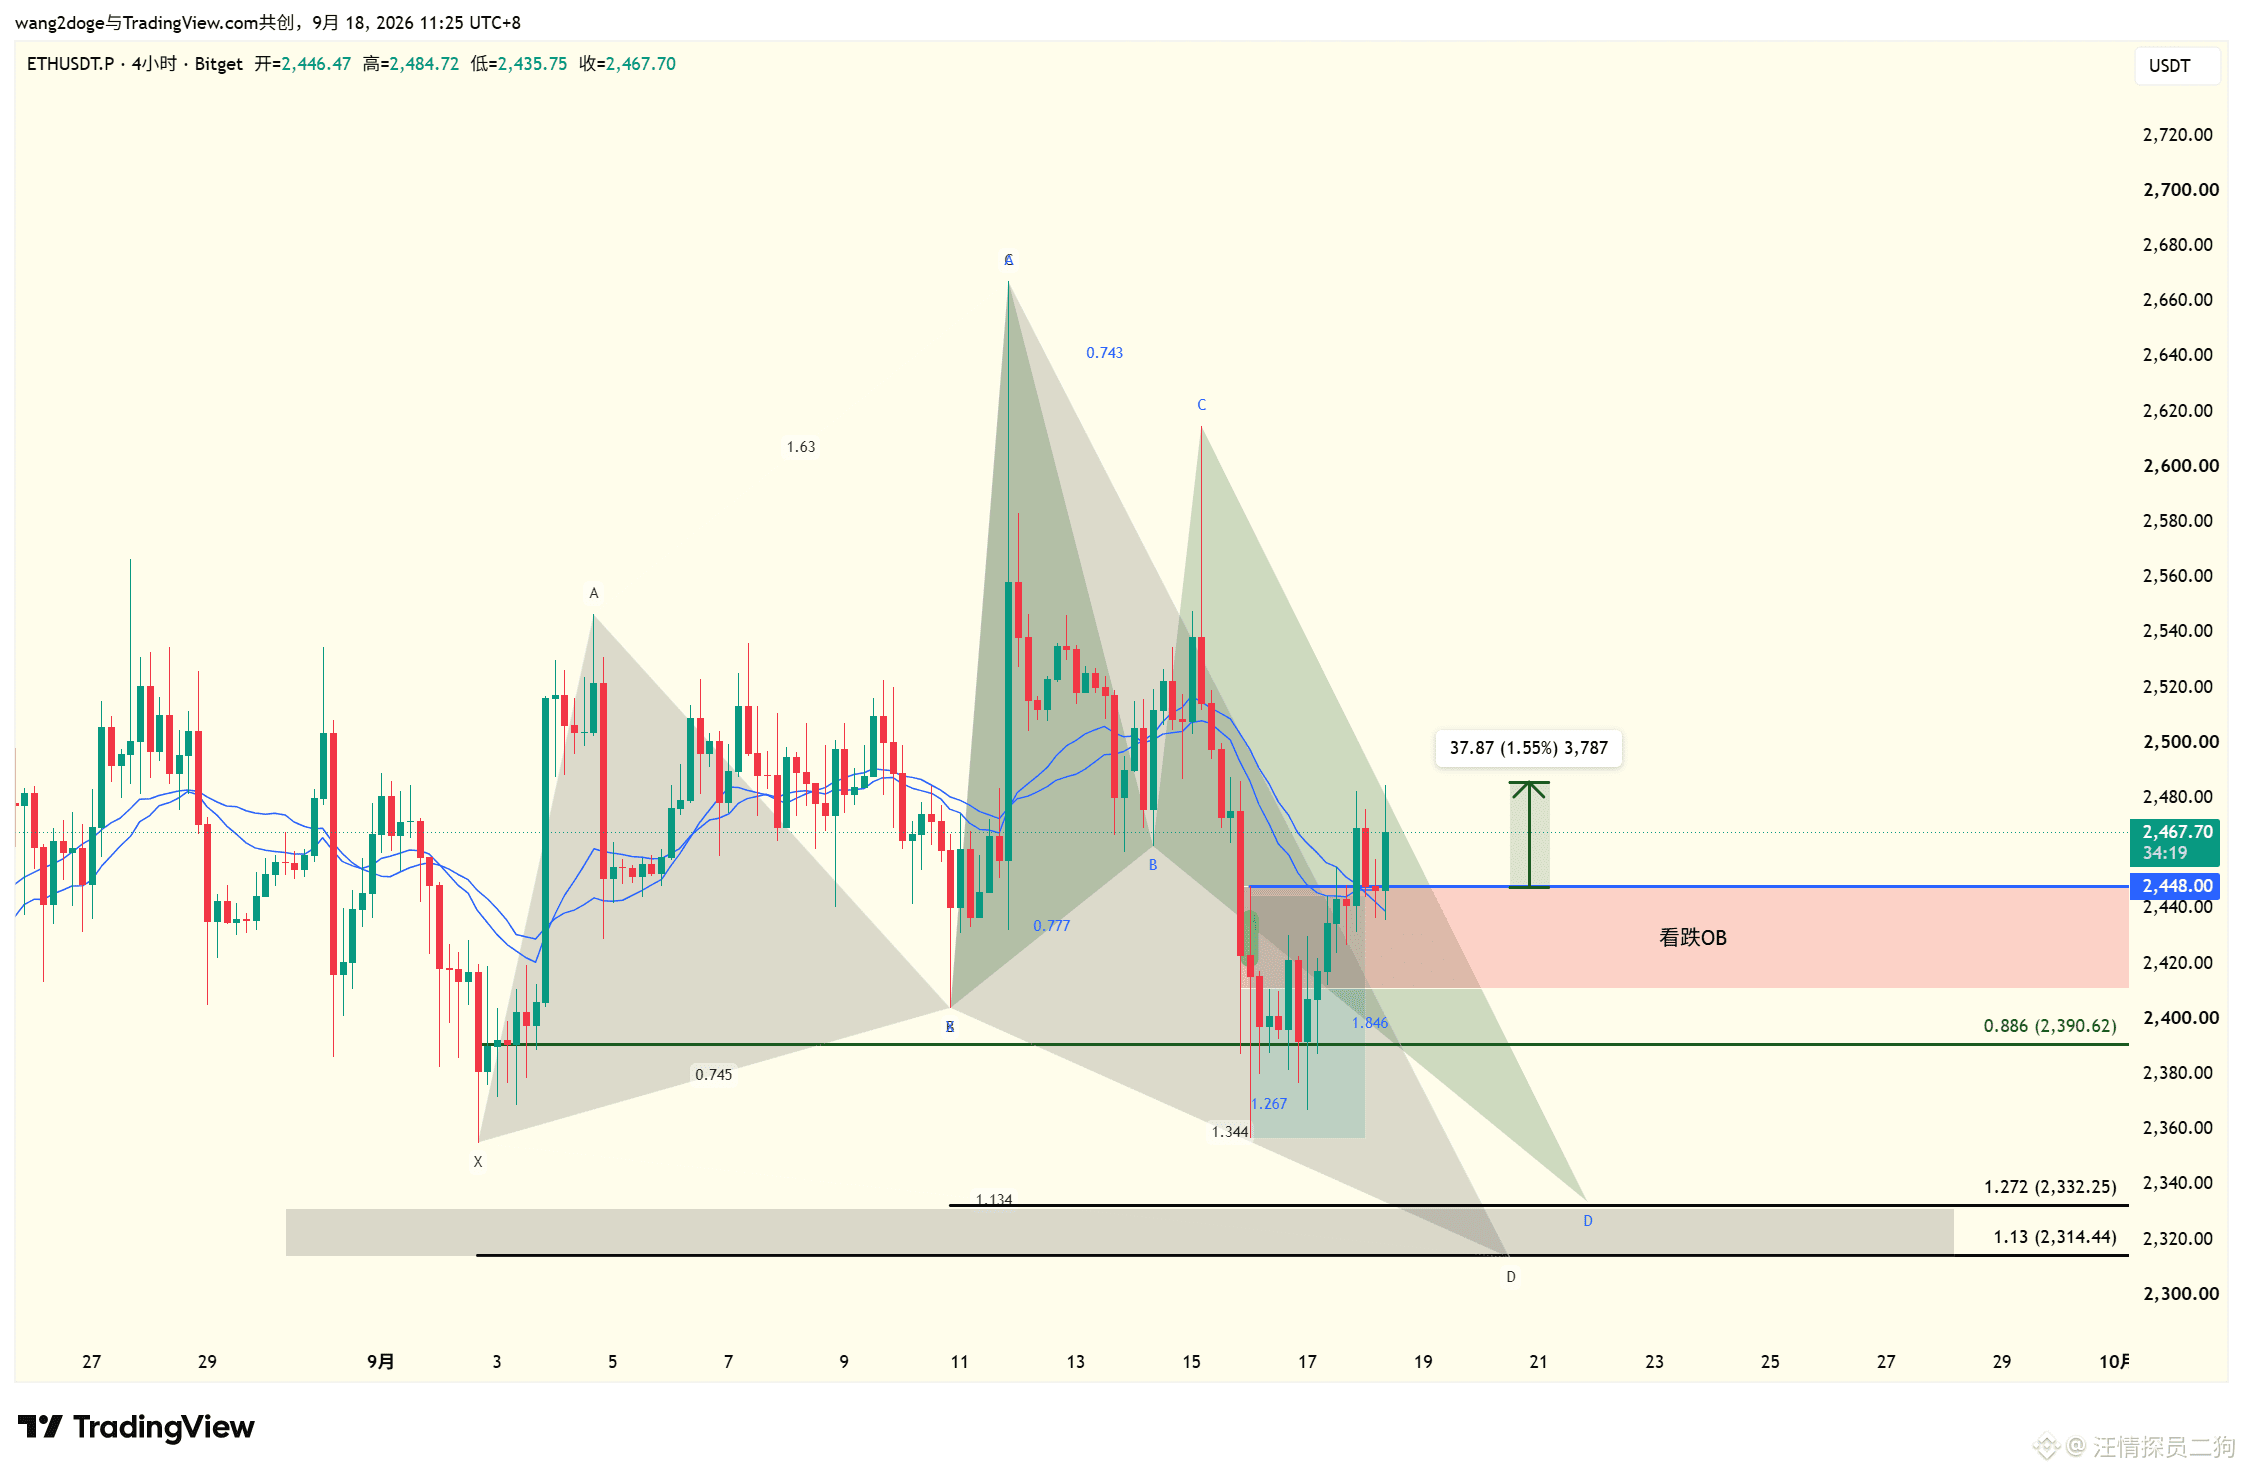
#ETH 2H Update
2H has a harmonious pattern
A bullish pending shark 🦈 and a bullish pending butterfly 🦋 form a harmonious structure
Both structures require entry at point D
So the combined D-point range is an important reversal zone
Meanwhile, the bearish OB range above is the current resistance zone
In summary:
1. When it reaches the lower black zone, try to enter
2. Re-transform the bearish OB zone into support to enter
Be wary of extreme market conditions leading to a test 2222
We talked about this earlier when we discussed copying the boat after the fact, so I won’t repeat it $ETH
2H has a harmonious pattern
A bullish pending shark 🦈 and a bullish pending butterfly 🦋 form a harmonious structure
Both structures require entry at point D
So the combined D-point range is an important reversal zone
Meanwhile, the bearish OB range above is the current resistance zone
In summary:
1. When it reaches the lower black zone, try to enter
2. Re-transform the bearish OB zone into support to enter
Be wary of extreme market conditions leading to a test 2222
We talked about this earlier when we discussed copying the boat after the fact, so I won’t repeat it $ETH
汪情探员二狗
·
--
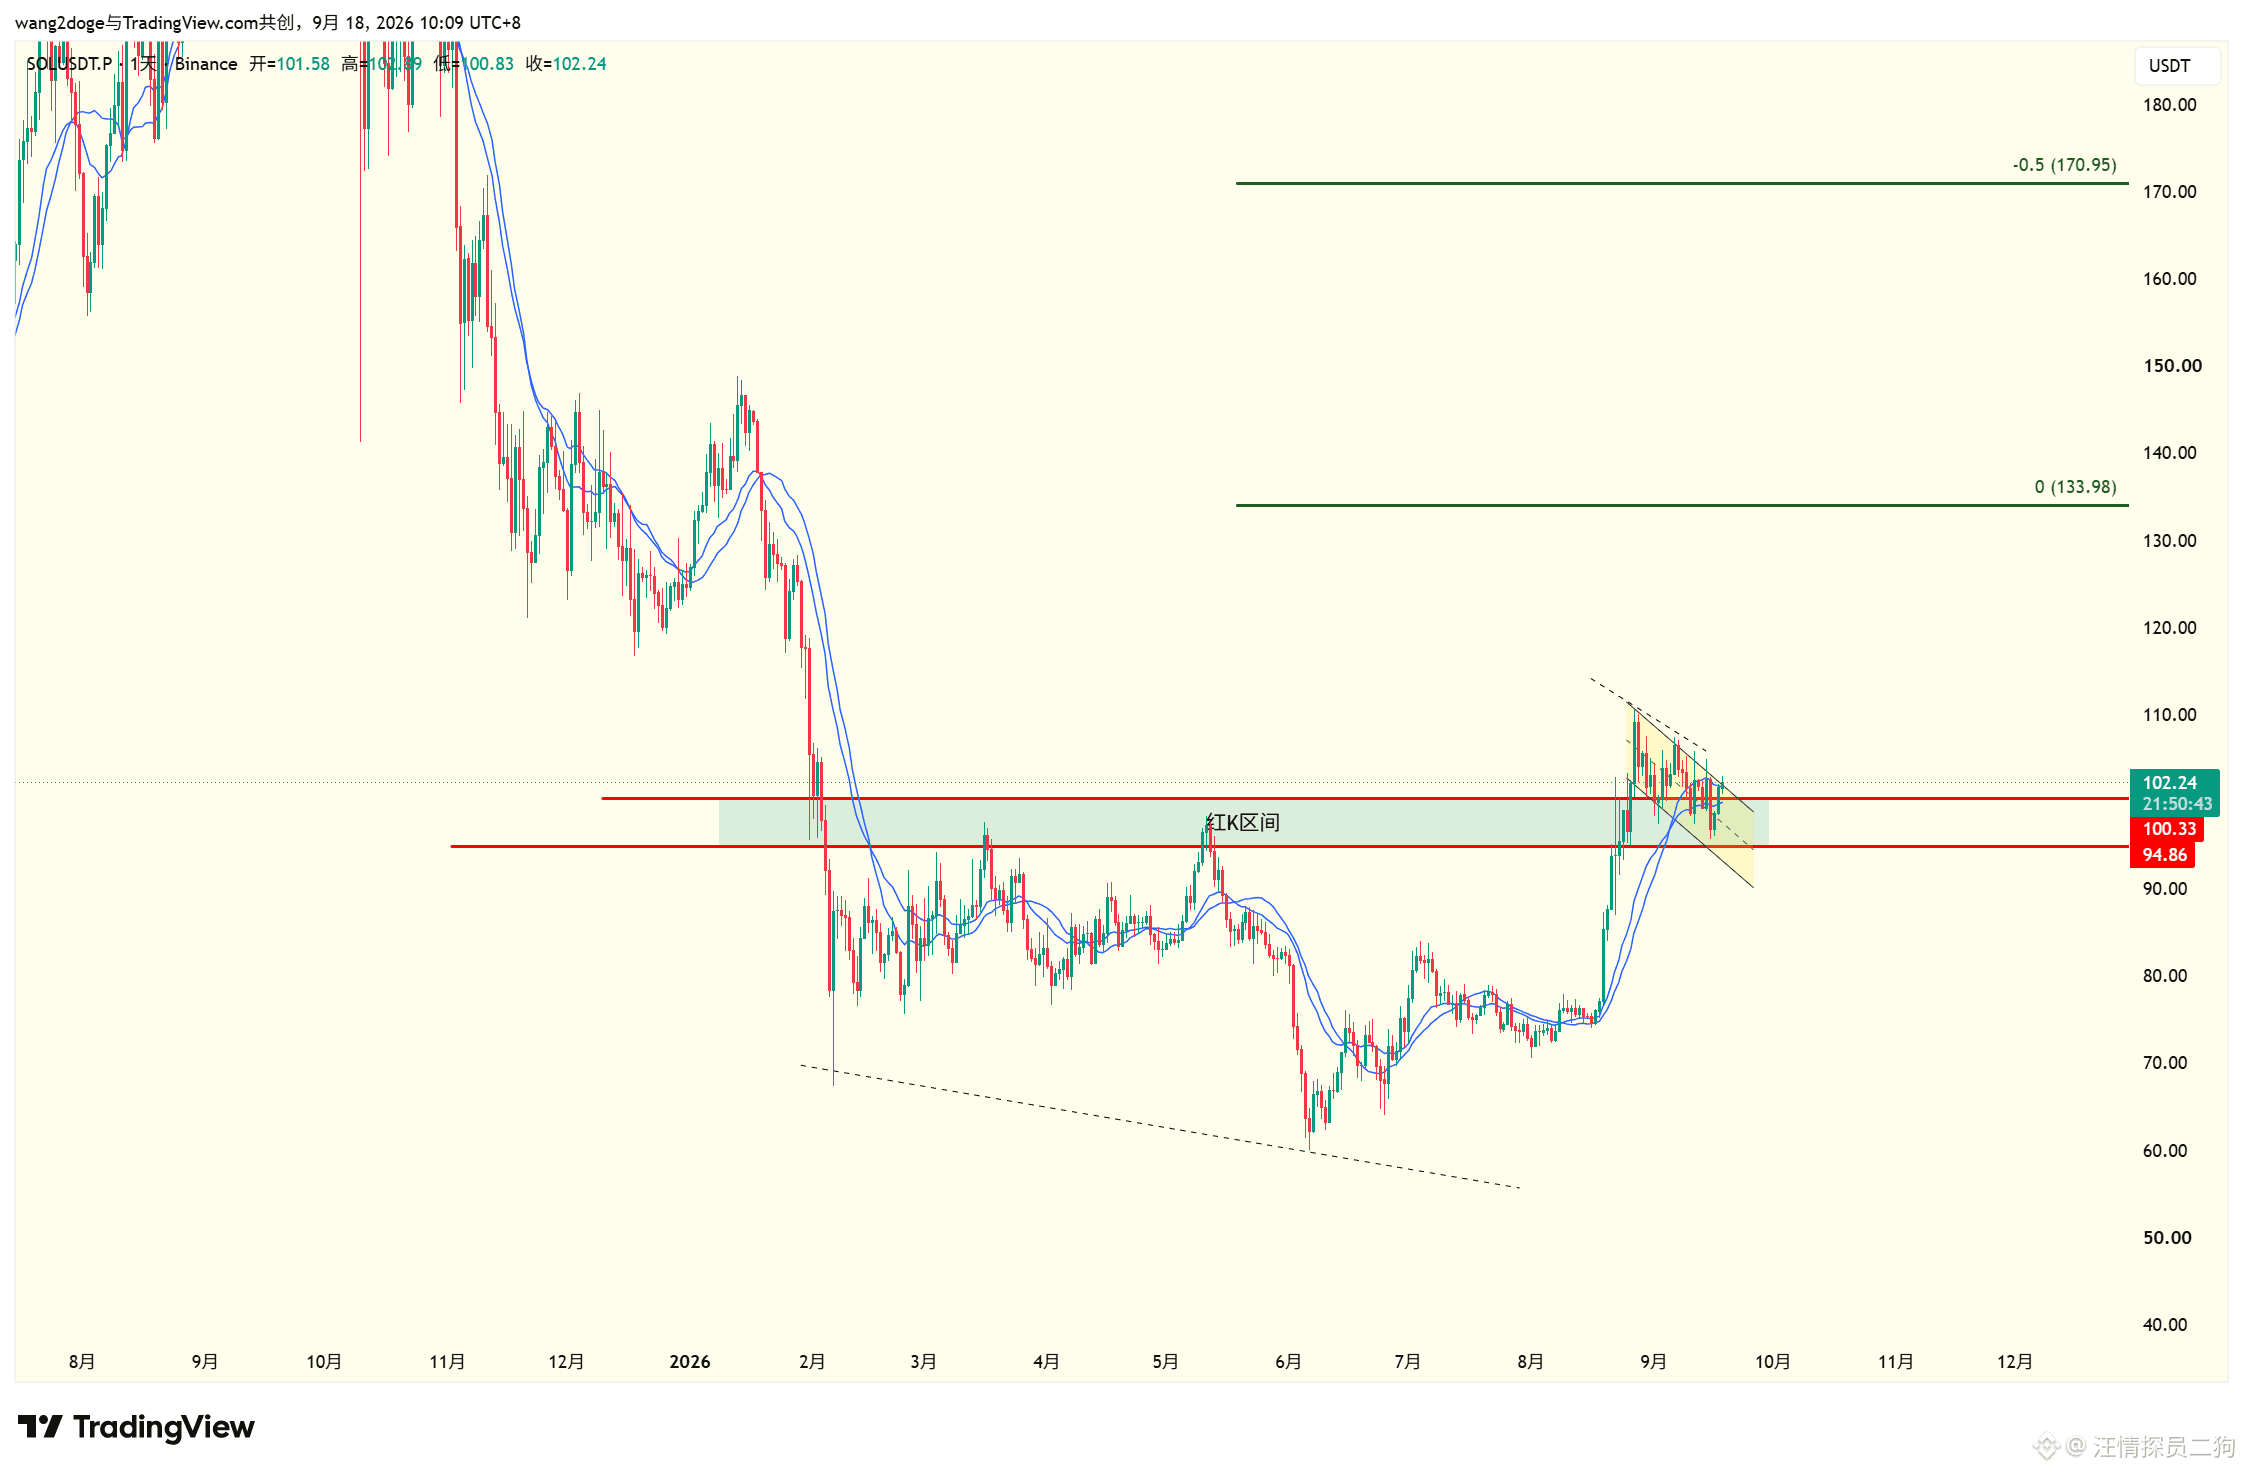
#SOL 1D Update
Previously, our analysis of SOL was that 100 was crucial.
However, due to the fact that the subsequent price action did not break out to form a new high point,
that 100 level was vulnerable and got cleared.
See the previous SOL analysis for details.
Now the market structure is clear.
94.82 is the bottom of SOL.
If the 1D close is below 94.82, then upside space opens up.
If it is not below 94.82, then we can still look toward the upper green line as the target.
Previously, our analysis of SOL was that 100 was crucial.
However, due to the fact that the subsequent price action did not break out to form a new high point,
that 100 level was vulnerable and got cleared.
See the previous SOL analysis for details.
Now the market structure is clear.
94.82 is the bottom of SOL.
If the 1D close is below 94.82, then upside space opens up.
If it is not below 94.82, then we can still look toward the upper green line as the target.
Log in to explore more content