
YANG BNB
10.6k Posts

YANG BNB
Report
Block User
Community Builder || BNB Holder || We b3.0 || NFT’s || Binance KOL”
Open Trade
High-Frequency Trader
5.5 Years
32 Following
10.9K+ Followers
12.6K+ Liked
Posts
Portfolio
All
Quotes
Videos
Live
PINNED
·
--
Bullish
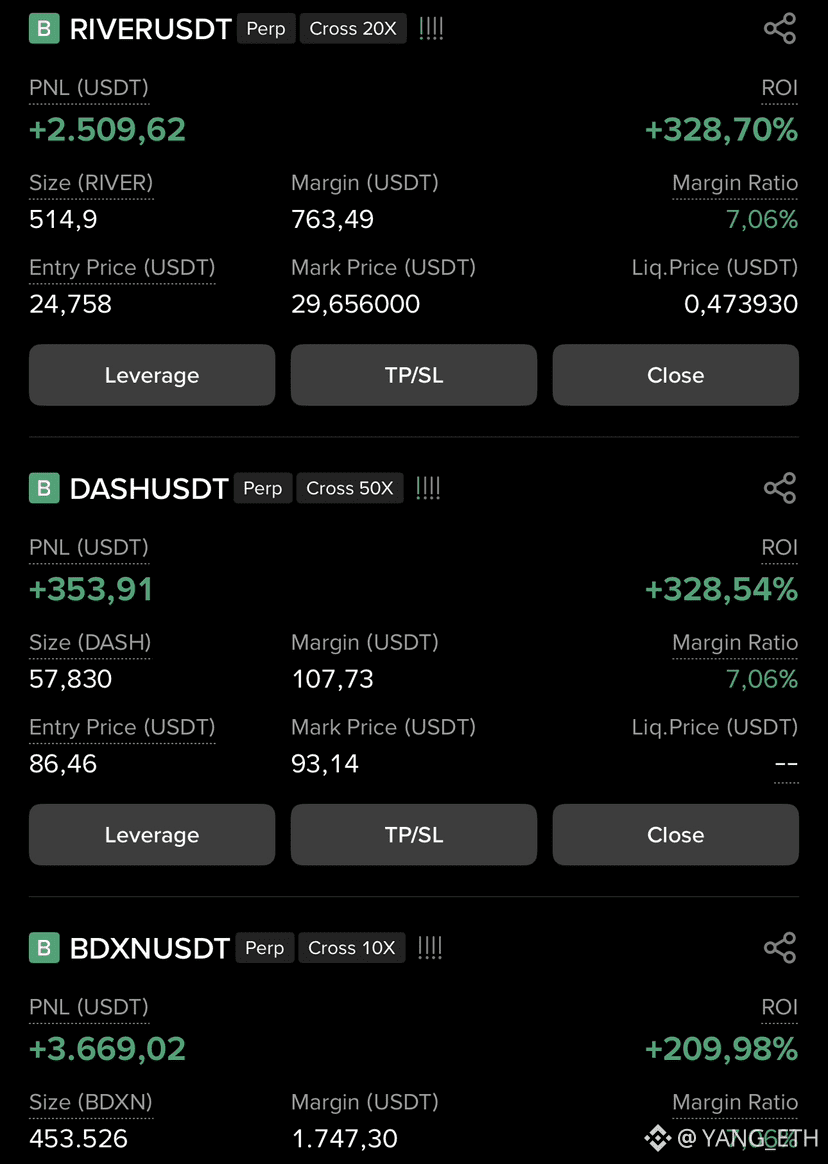
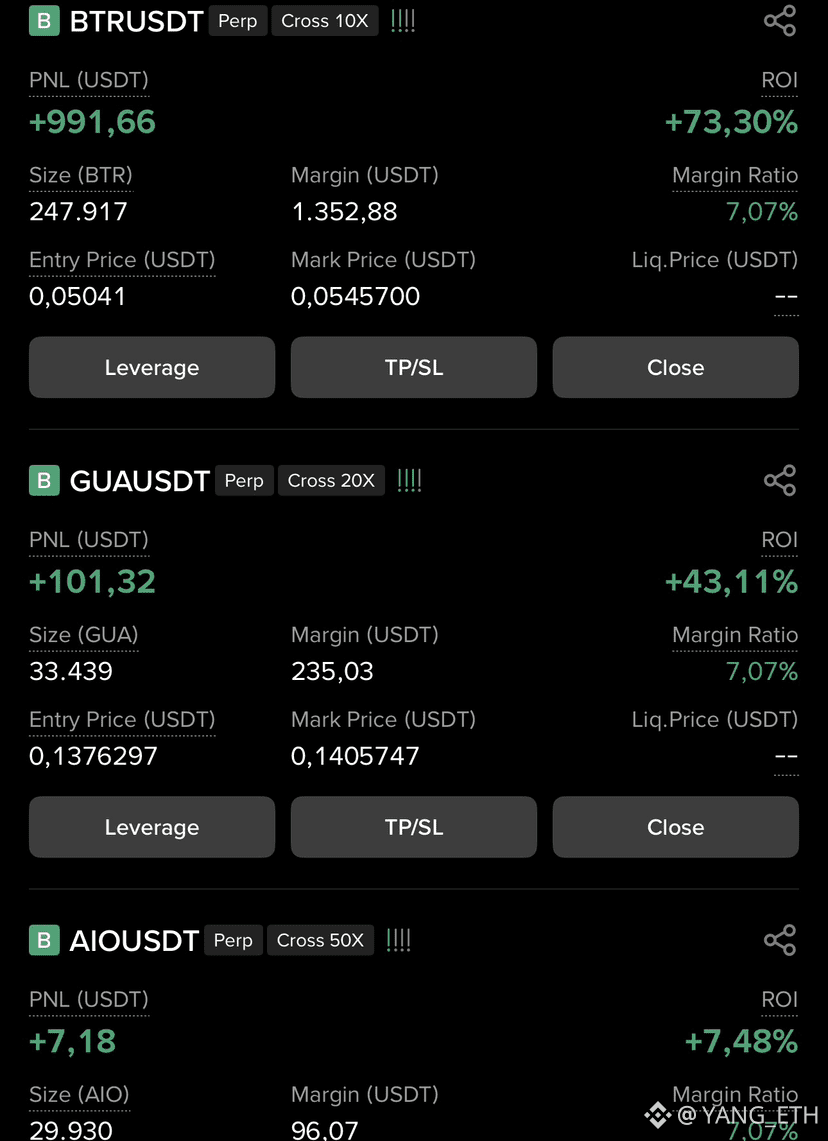
🔥 ALL CALLS IN PROFIT — STRONG DAY! 🔥
Every setup I shared is now in profit — clean execution across the board.
$RIVER , $BDXN , and$DASH are leading the way with the strongest momentum and growth 🚀
If you caught profits on these trades, drop a comment below — your feedback keeps me motivated to keep calling these moves early.
You can hold and ride the trend or secure profits if you feel it’s enough — discipline always comes first.
Thanks to everyone who followed and trusted the calls.
More opportunities ahead — stay locked in 🔥📈
{future}(DASHUSDT)
{future}(BDXNUSDT)
{future}(RIVERUSDT)
🔥 ALL CALLS IN PROFIT — STRONG DAY! 🔥
Every setup I shared is now in profit — clean execution across the board.
$RIVER , $BDXN , and$DASH are leading the way with the strongest momentum and growth 🚀
If you caught profits on these trades, drop a comment below — your feedback keeps me motivated to keep calling these moves early.
You can hold and ride the trend or secure profits if you feel it’s enough — discipline always comes first.
Thanks to everyone who followed and trusted the calls.
More opportunities ahead — stay locked in 🔥📈
Every setup I shared is now in profit — clean execution across the board.
$RIVER , $BDXN , and$DASH are leading the way with the strongest momentum and growth 🚀
If you caught profits on these trades, drop a comment below — your feedback keeps me motivated to keep calling these moves early.
You can hold and ride the trend or secure profits if you feel it’s enough — discipline always comes first.
Thanks to everyone who followed and trusted the calls.
More opportunities ahead — stay locked in 🔥📈
70
19
110
8k
·
--
Bearish
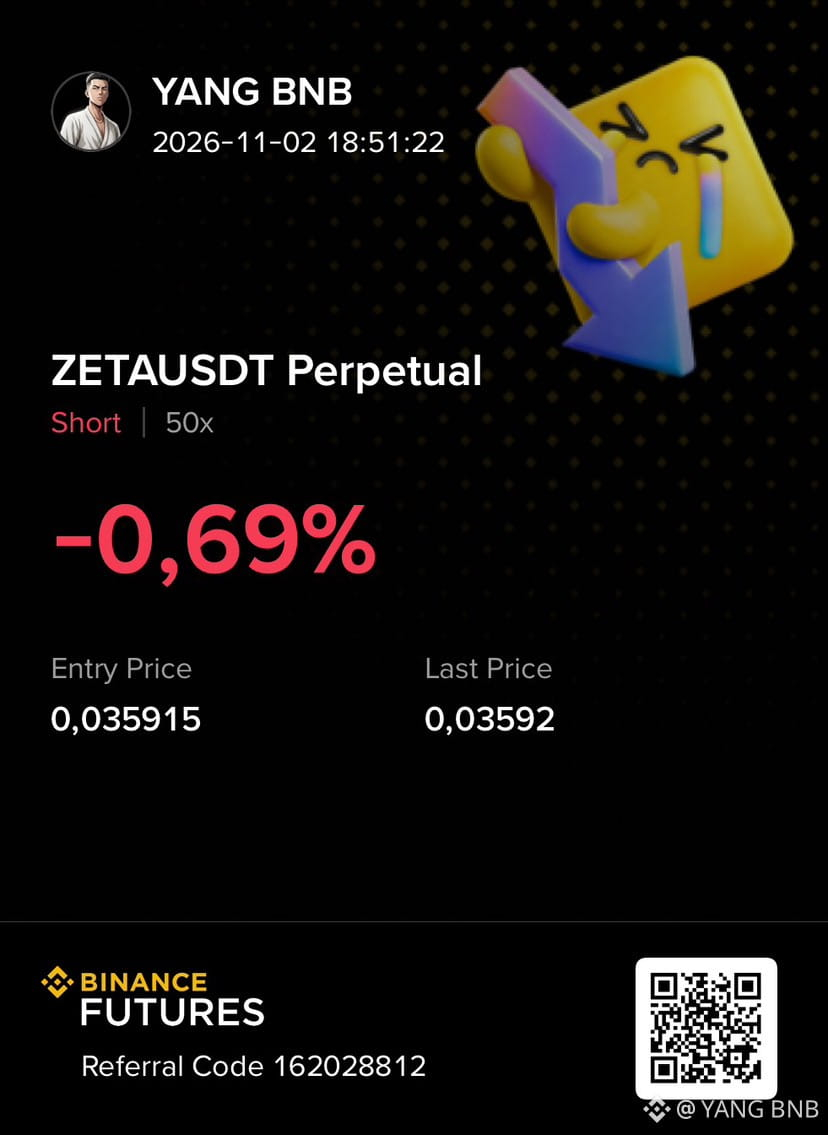
🔥 $ZETA BIG SHORT OPPORTUNITY :
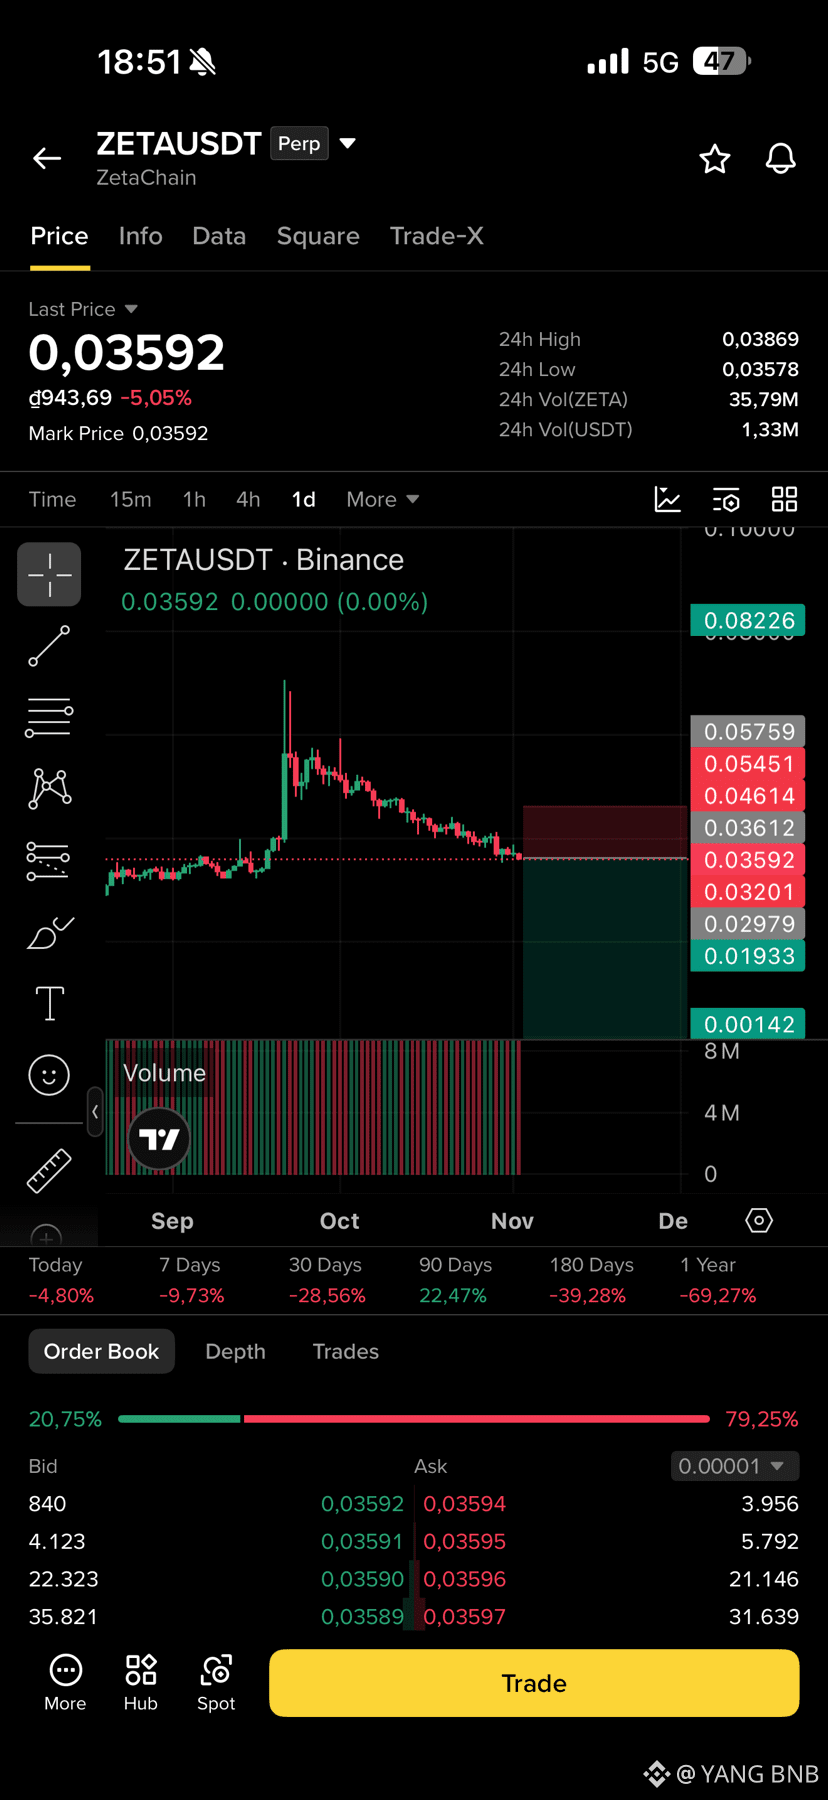
ZETA is showing continued bearish momentum after experiencing a significant rejection from its previous resistance zone. The price is currently trading around 0.03592, down more than 5% in the last 24 hours. Sellers remain firmly in control, pushing the price lower after failing to maintain its previous highs around 0.05500. The daily chart shows a clear bearish structure, with consistent lower highs and persistent selling pressure. The price is now approaching an important support zone around 0.03500. If this level breaks and bearish momentum continues, further downside toward lower support levels could follow. 📉
Trading Ideas Short $ZETAUSDT
Entry: 0.03590 – 0.03650
TP1: 0.03201
TP2: 0.02979
SL: 0.04614
TP3: 0.01933
Short $ZETA 👇
{future}(ZETAUSDT)
🔥 $ZETA BIG SHORT OPPORTUNITY :
ZETA is showing continued bearish momentum after experiencing a significant rejection from its previous resistance zone. The price is currently trading around 0.03592, down more than 5% in the last 24 hours. Sellers remain firmly in control, pushing the price lower after failing to maintain its previous highs around 0.05500. The daily chart shows a clear bearish structure, with consistent lower highs and persistent selling pressure. The price is now approaching an important support zone around 0.03500. If this level breaks and bearish momentum continues, further downside toward lower support levels could follow. 📉
Trading Ideas Short $ZETAUSDT
Entry: 0.03590 – 0.03650
TP1: 0.03201
TP2: 0.02979
SL: 0.04614
TP3: 0.01933
Short $ZETA 👇
ZETA is showing continued bearish momentum after experiencing a significant rejection from its previous resistance zone. The price is currently trading around 0.03592, down more than 5% in the last 24 hours. Sellers remain firmly in control, pushing the price lower after failing to maintain its previous highs around 0.05500. The daily chart shows a clear bearish structure, with consistent lower highs and persistent selling pressure. The price is now approaching an important support zone around 0.03500. If this level breaks and bearish momentum continues, further downside toward lower support levels could follow. 📉
Trading Ideas Short $ZETAUSDT
Entry: 0.03590 – 0.03650
TP1: 0.03201
TP2: 0.02979
SL: 0.04614
TP3: 0.01933
Short $ZETA 👇
109
·
--
Bearish
🔥 $INIT BIG SHORT OPPORTUNITY :
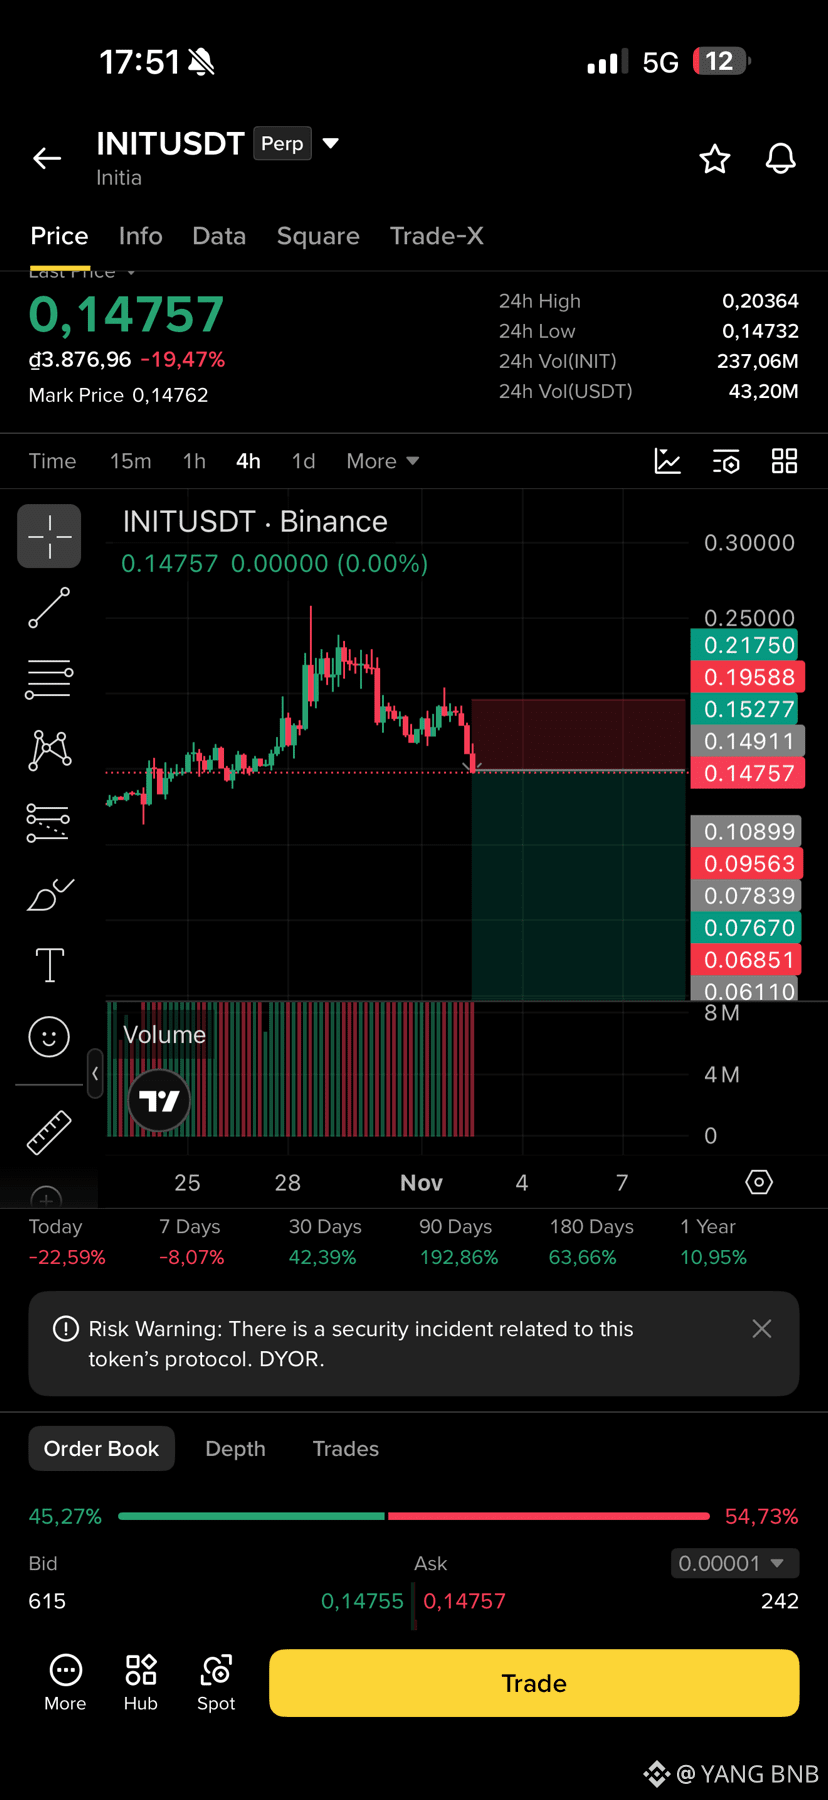
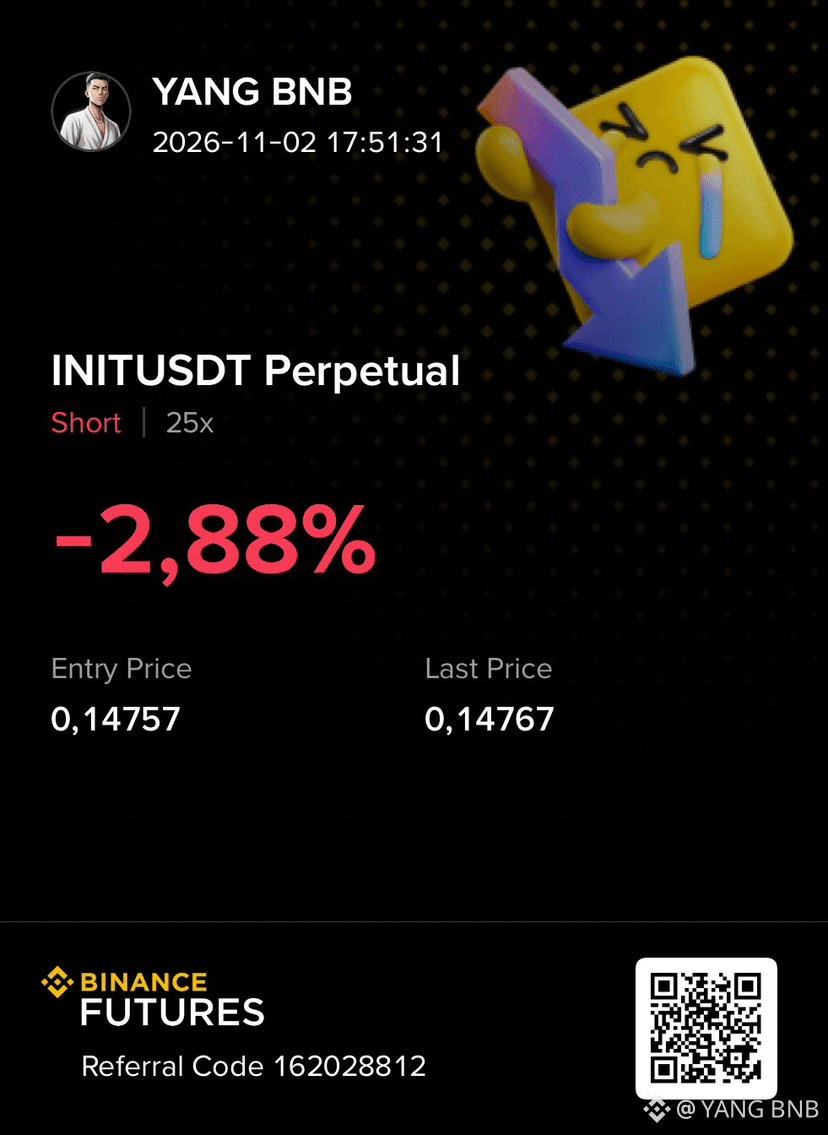
INIT is showing strong bearish momentum after facing repeated rejection from its previous resistance zone. The price is currently trading around 0.14757, down more than 19% in the last 24 hours. Sellers have regained control, pushing the price sharply lower after failing to maintain its previous highs around 0.22000.
Trading Ideas Short $INIT
Entry: 0.14750 – 0.15300
TP1: 0.10899
TP2: 0.09563
SL: 0.19588
TP3: 0.06851
{future}(INITUSDT)
🔥 $INIT BIG SHORT OPPORTUNITY :
INIT is showing strong bearish momentum after facing repeated rejection from its previous resistance zone. The price is currently trading around 0.14757, down more than 19% in the last 24 hours. Sellers have regained control, pushing the price sharply lower after failing to maintain its previous highs around 0.22000.
Trading Ideas Short $INIT
Entry: 0.14750 – 0.15300
TP1: 0.10899
TP2: 0.09563
SL: 0.19588
TP3: 0.06851
INIT is showing strong bearish momentum after facing repeated rejection from its previous resistance zone. The price is currently trading around 0.14757, down more than 19% in the last 24 hours. Sellers have regained control, pushing the price sharply lower after failing to maintain its previous highs around 0.22000.
Trading Ideas Short $INIT
Entry: 0.14750 – 0.15300
TP1: 0.10899
TP2: 0.09563
SL: 0.19588
TP3: 0.06851
239
·
--
Bearish
🔥 $ELSA BIG SHORT OPPORTUNITY :
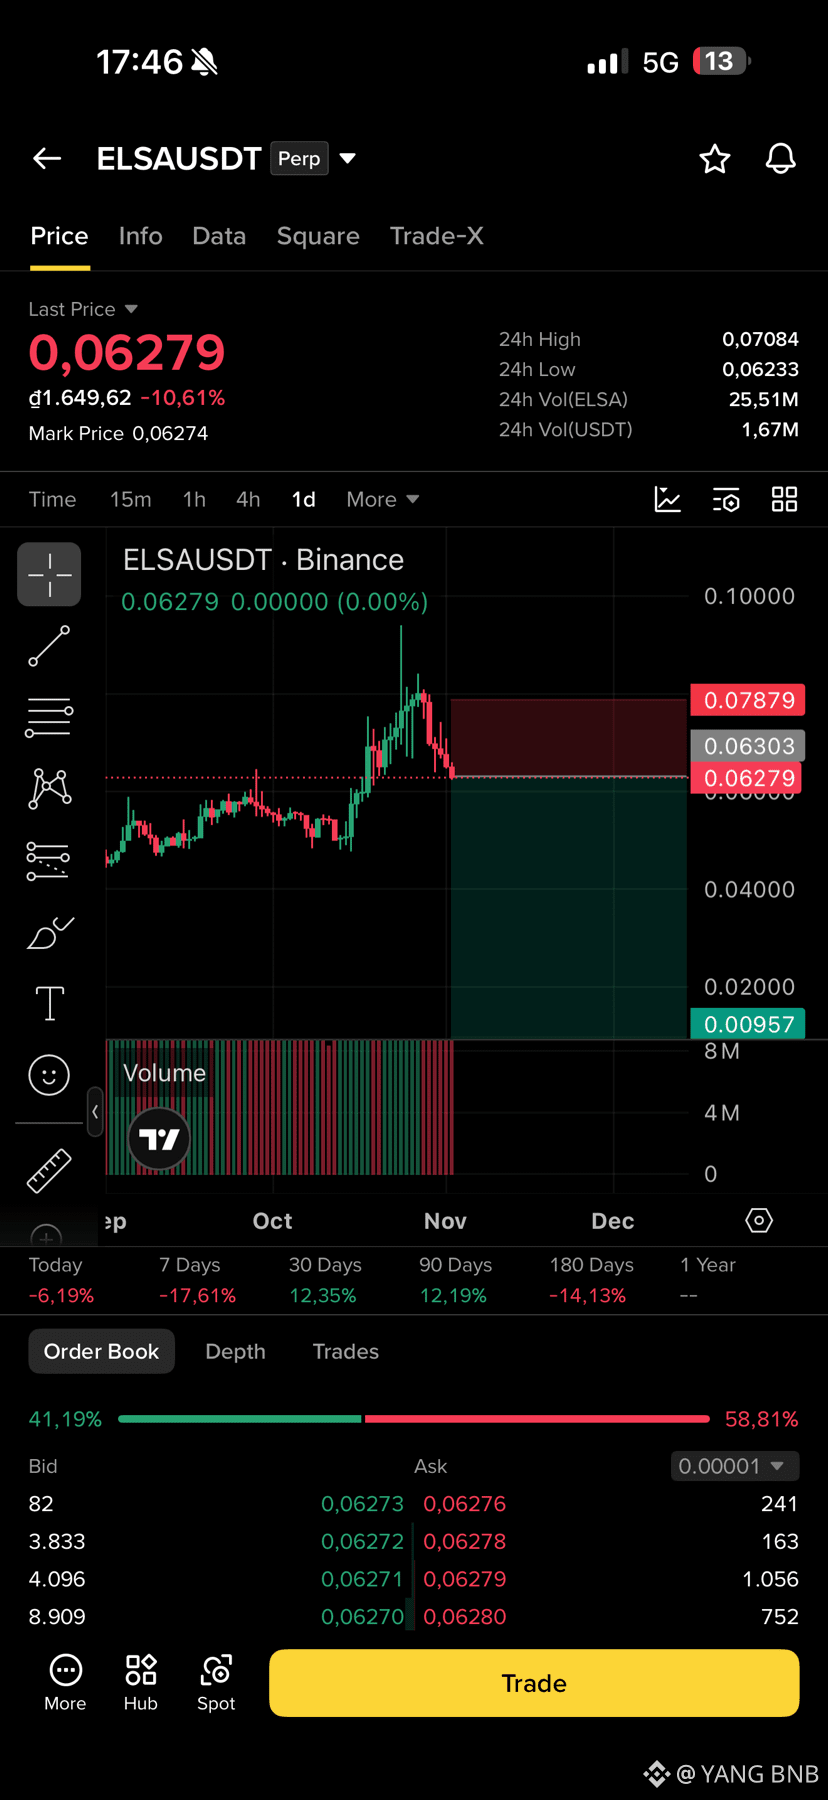
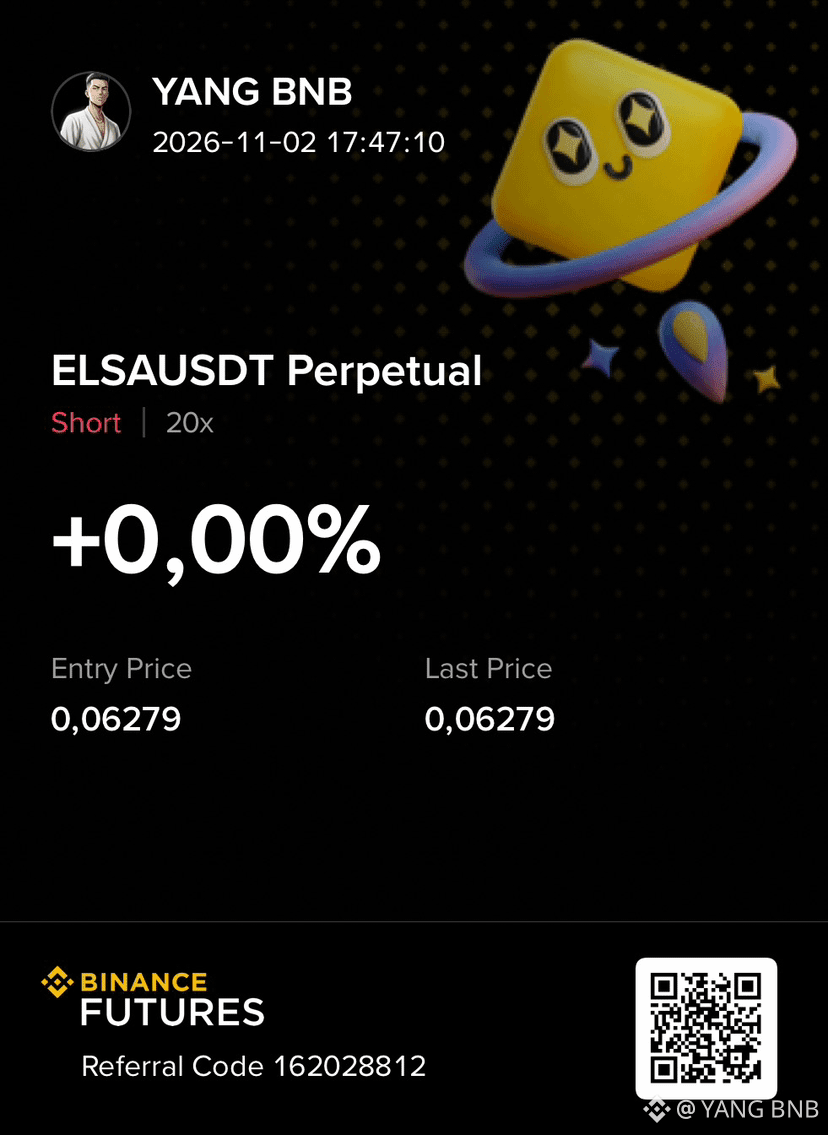
ELSA is showing strong bearish momentum after facing a sharp rejection from its recent highs. The price is currently trading around 0.06279, down more than 10% in the last 24 hours. Sellers are regaining control after the price failed to maintain its previous breakout above the 0.07500 resistance zone.
Trading Ideas Short $ELSA
Entry: 0.06280 – 0.06400
TP1: 0.05500
TP2: 0.04000
SL: 0.07879
TP3: 0.00957
Short $ELSA 👇
{future}(ELSAUSDT)
🔥 $ELSA BIG SHORT OPPORTUNITY :
ELSA is showing strong bearish momentum after facing a sharp rejection from its recent highs. The price is currently trading around 0.06279, down more than 10% in the last 24 hours. Sellers are regaining control after the price failed to maintain its previous breakout above the 0.07500 resistance zone.
Trading Ideas Short $ELSA
Entry: 0.06280 – 0.06400
TP1: 0.05500
TP2: 0.04000
SL: 0.07879
TP3: 0.00957
Short $ELSA 👇
ELSA is showing strong bearish momentum after facing a sharp rejection from its recent highs. The price is currently trading around 0.06279, down more than 10% in the last 24 hours. Sellers are regaining control after the price failed to maintain its previous breakout above the 0.07500 resistance zone.
Trading Ideas Short $ELSA
Entry: 0.06280 – 0.06400
TP1: 0.05500
TP2: 0.04000
SL: 0.07879
TP3: 0.00957
Short $ELSA 👇
115
·
--
Bearish
🔥 $BTW BIG SHORT OPPORTUNITY :
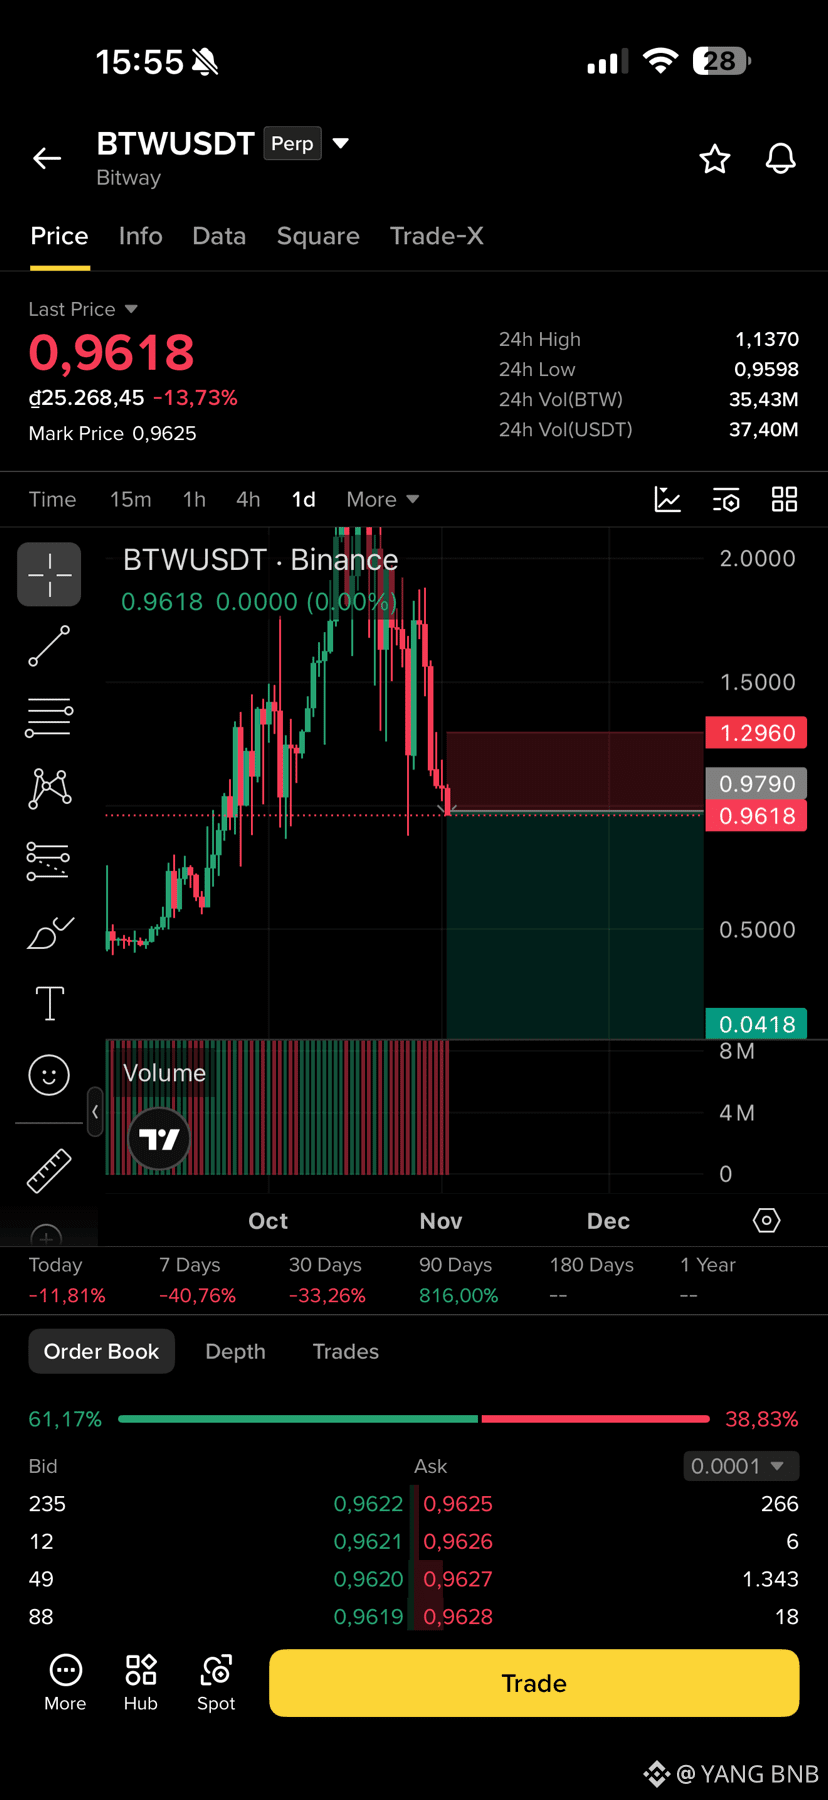
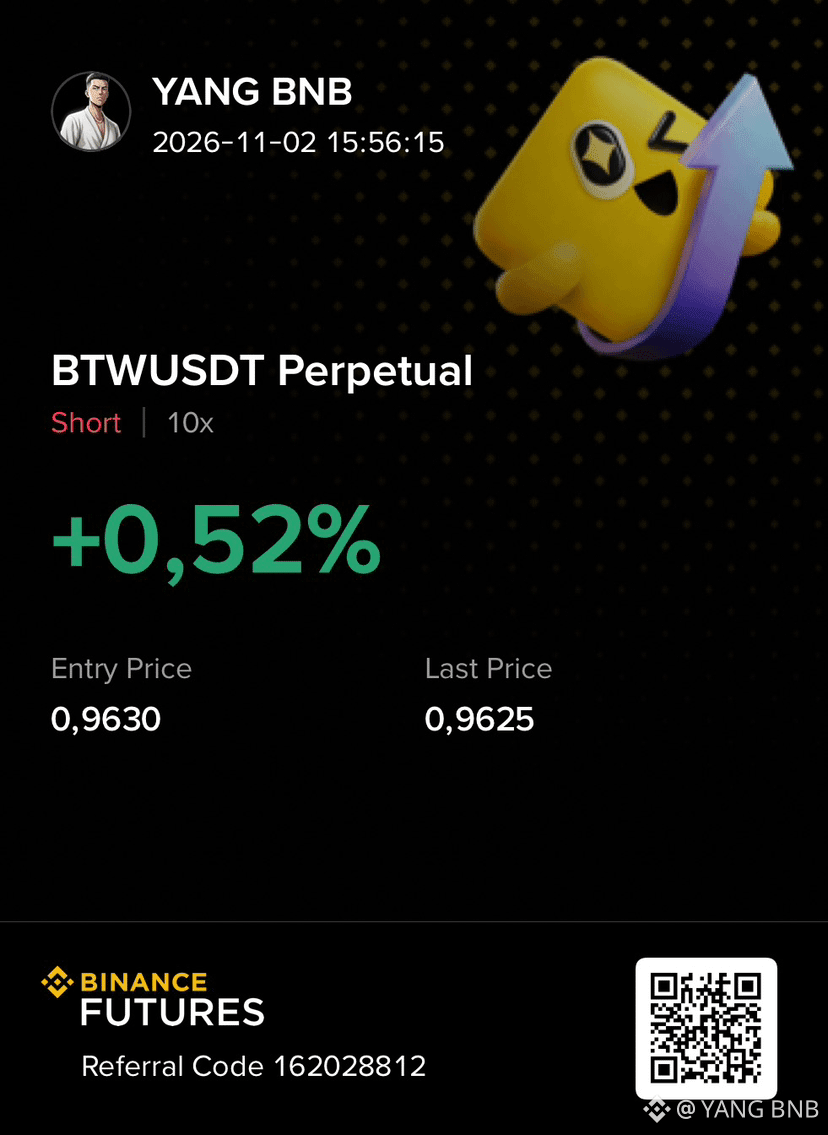
BTW is showing strong bearish momentum after experiencing a sharp rejection from its previous highs. The price is currently trading around 0.9618, down more than 13% in the last 24 hours. Sellers have taken control, pushing the price sharply lower after failing to maintain its previous resistance zone around 1.5000–2.0000. The daily chart shows a clear bearish reversal, with consecutive selling candles indicating increasing downward pressure. The price is now approaching an important support area. If selling pressure continues and buyers fail to defend the current levels, further downside could follow toward lower support zones. 📉
Trading Ideas Short $BTW
Entry: 0.9600 – 0.9800
TP1: 0.8000
TP2: 0.5000
SL: 1.2960
TP3: 0.0418
{future}(BTWUSDT)
🔥 $BTW BIG SHORT OPPORTUNITY :
BTW is showing strong bearish momentum after experiencing a sharp rejection from its previous highs. The price is currently trading around 0.9618, down more than 13% in the last 24 hours. Sellers have taken control, pushing the price sharply lower after failing to maintain its previous resistance zone around 1.5000–2.0000. The daily chart shows a clear bearish reversal, with consecutive selling candles indicating increasing downward pressure. The price is now approaching an important support area. If selling pressure continues and buyers fail to defend the current levels, further downside could follow toward lower support zones. 📉
Trading Ideas Short $BTW
Entry: 0.9600 – 0.9800
TP1: 0.8000
TP2: 0.5000
SL: 1.2960
TP3: 0.0418
BTW is showing strong bearish momentum after experiencing a sharp rejection from its previous highs. The price is currently trading around 0.9618, down more than 13% in the last 24 hours. Sellers have taken control, pushing the price sharply lower after failing to maintain its previous resistance zone around 1.5000–2.0000. The daily chart shows a clear bearish reversal, with consecutive selling candles indicating increasing downward pressure. The price is now approaching an important support area. If selling pressure continues and buyers fail to defend the current levels, further downside could follow toward lower support zones. 📉
Trading Ideas Short $BTW
Entry: 0.9600 – 0.9800
TP1: 0.8000
TP2: 0.5000
SL: 1.2960
TP3: 0.0418
282
·
--
Bearish
🔥 $BOME BIG SHORT OPPORTUNITY :
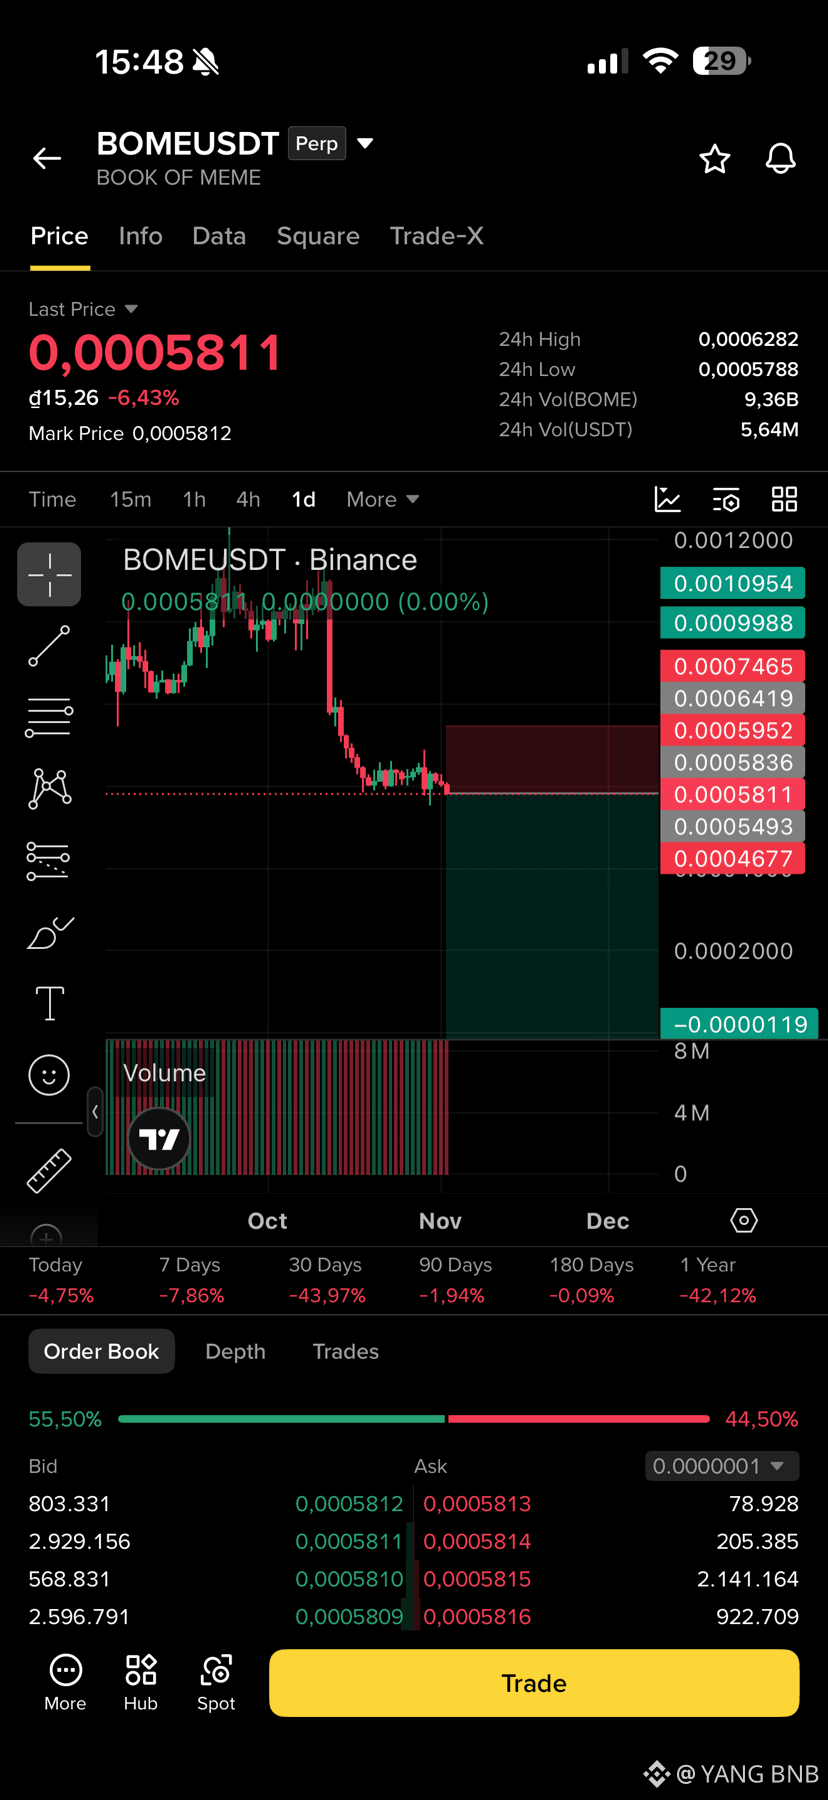
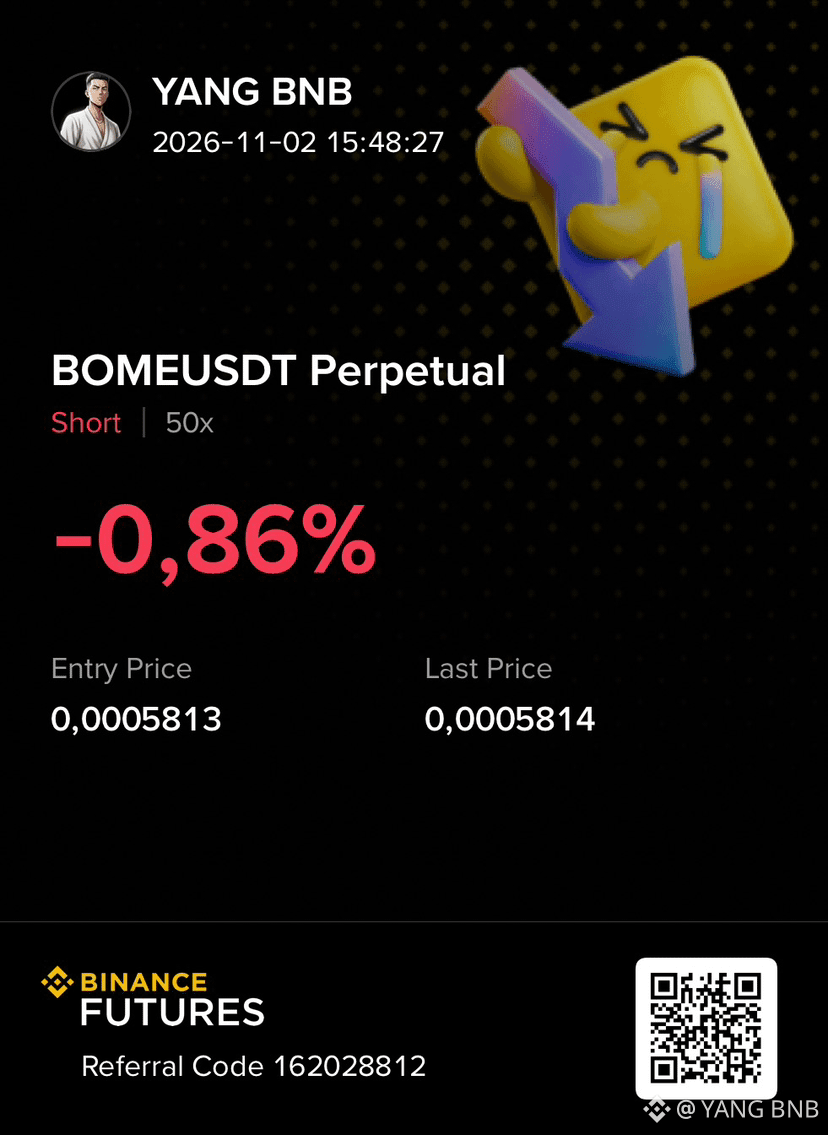
BOME is showing continued bearish momentum after experiencing a major breakdown from its previous consolidation zone. The price is currently trading around 0.0005811, down more than 6% in the last 24 hours. Sellers remain firmly in control, pushing the price lower after losing important support levels. The daily chart shows a clear bearish structure, with a sharp decline from its previous highs around 0.0010000. The price is now consolidating near its recent lows, but buying pressure remains weak. If the current support zone fails to hold, another downward move toward lower support levels could follow. 📉
Trading Ideas Short $BOMEUSDT
Entry: 0.0005810 – 0.0005950
TP1: 0.0005493
TP2: 0.0005000
SL: 0.0007465
TP3: 0.0004677
Short $BOME 👇
{future}(BOMEUSDT)
🔥 $BOME BIG SHORT OPPORTUNITY :
BOME is showing continued bearish momentum after experiencing a major breakdown from its previous consolidation zone. The price is currently trading around 0.0005811, down more than 6% in the last 24 hours. Sellers remain firmly in control, pushing the price lower after losing important support levels. The daily chart shows a clear bearish structure, with a sharp decline from its previous highs around 0.0010000. The price is now consolidating near its recent lows, but buying pressure remains weak. If the current support zone fails to hold, another downward move toward lower support levels could follow. 📉
Trading Ideas Short $BOMEUSDT
Entry: 0.0005810 – 0.0005950
TP1: 0.0005493
TP2: 0.0005000
SL: 0.0007465
TP3: 0.0004677
Short $BOME 👇
BOME is showing continued bearish momentum after experiencing a major breakdown from its previous consolidation zone. The price is currently trading around 0.0005811, down more than 6% in the last 24 hours. Sellers remain firmly in control, pushing the price lower after losing important support levels. The daily chart shows a clear bearish structure, with a sharp decline from its previous highs around 0.0010000. The price is now consolidating near its recent lows, but buying pressure remains weak. If the current support zone fails to hold, another downward move toward lower support levels could follow. 📉
Trading Ideas Short $BOMEUSDT
Entry: 0.0005810 – 0.0005950
TP1: 0.0005493
TP2: 0.0005000
SL: 0.0007465
TP3: 0.0004677
Short $BOME 👇
1
127
·
--
Bearish
🔥 $HUMA BIG SHORT OPPORTUNITY :
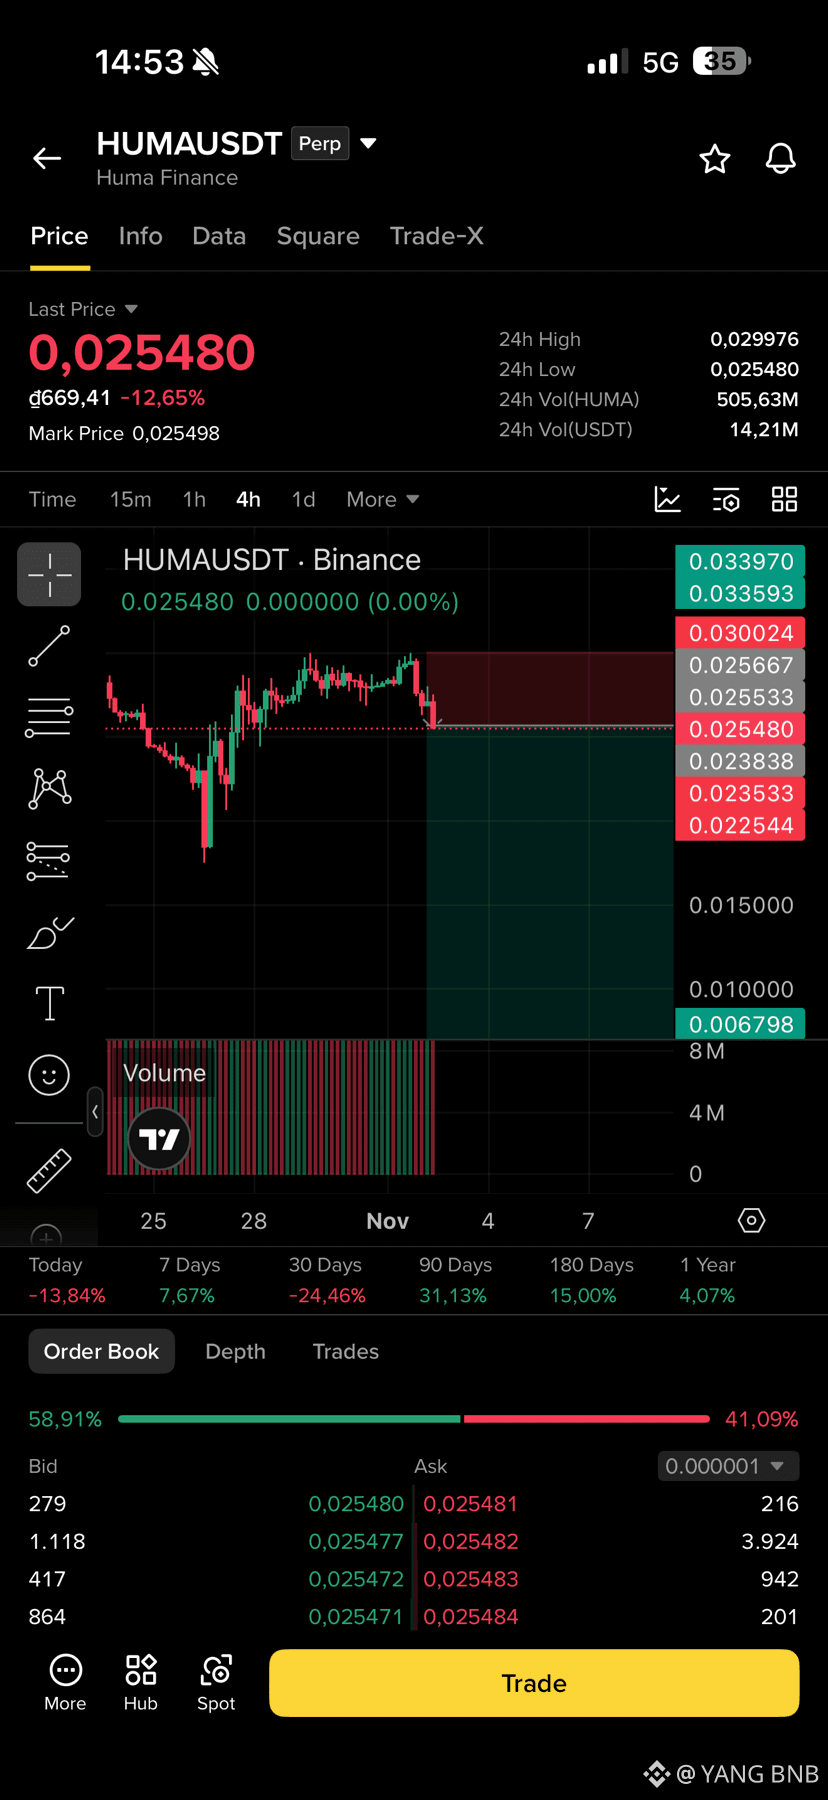
HUMA is showing strong bearish momentum after facing repeated rejection from its previous resistance zone. The price is currently trading around 0.025480, down more than 12% in the last 24 hours. Sellers are regaining control, pushing the price lower after failing to maintain its previous highs around 0.03000.
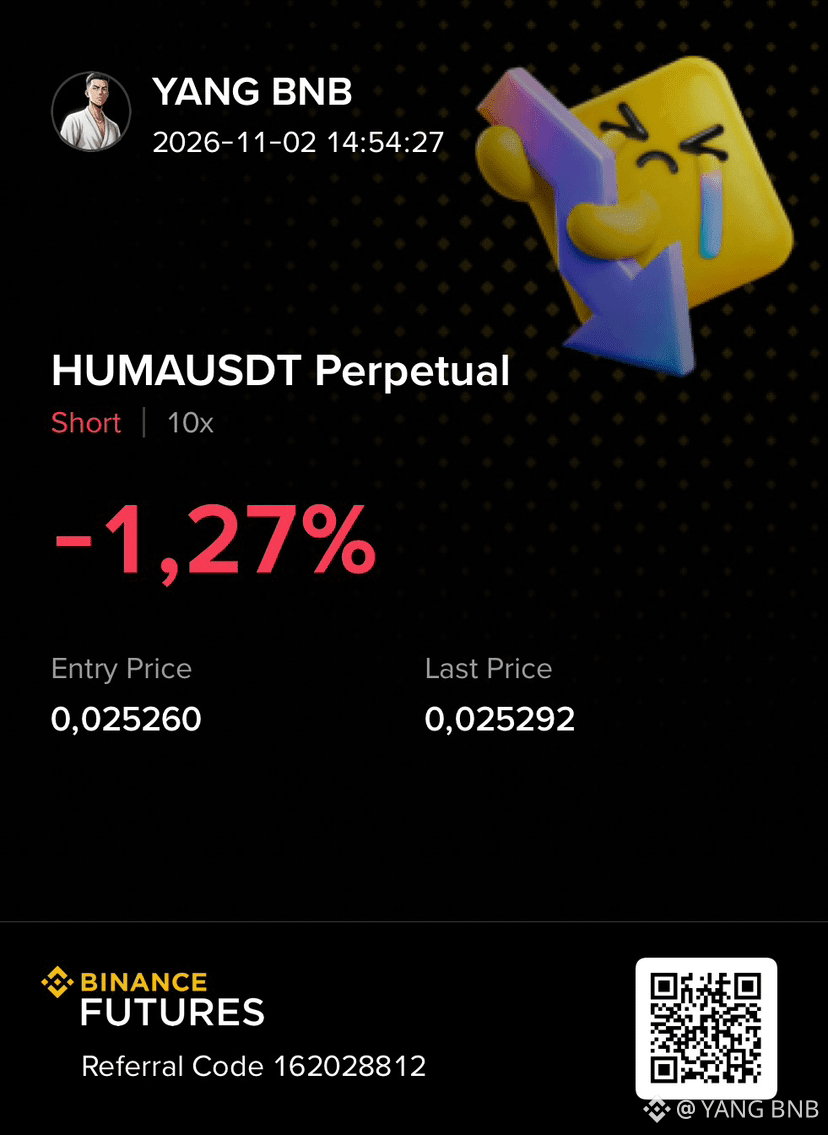
Trading Ideas Short $HUMAUSDT
Entry: 0.02550 – 0.02600
TP1: 0.02353
TP2: 0.02254
SL: 0.03002
TP3: 0.00679
.
{future}(HUMAUSDT)
🔥 $HUMA BIG SHORT OPPORTUNITY :
HUMA is showing strong bearish momentum after facing repeated rejection from its previous resistance zone. The price is currently trading around 0.025480, down more than 12% in the last 24 hours. Sellers are regaining control, pushing the price lower after failing to maintain its previous highs around 0.03000.
Trading Ideas Short $HUMAUSDT
Entry: 0.02550 – 0.02600
TP1: 0.02353
TP2: 0.02254
SL: 0.03002
TP3: 0.00679
.
HUMA is showing strong bearish momentum after facing repeated rejection from its previous resistance zone. The price is currently trading around 0.025480, down more than 12% in the last 24 hours. Sellers are regaining control, pushing the price lower after failing to maintain its previous highs around 0.03000.
Trading Ideas Short $HUMAUSDT
Entry: 0.02550 – 0.02600
TP1: 0.02353
TP2: 0.02254
SL: 0.03002
TP3: 0.00679
.
225
·
--
Bullish
🔥 $LYN BIG LONG OPPORTUNITY :
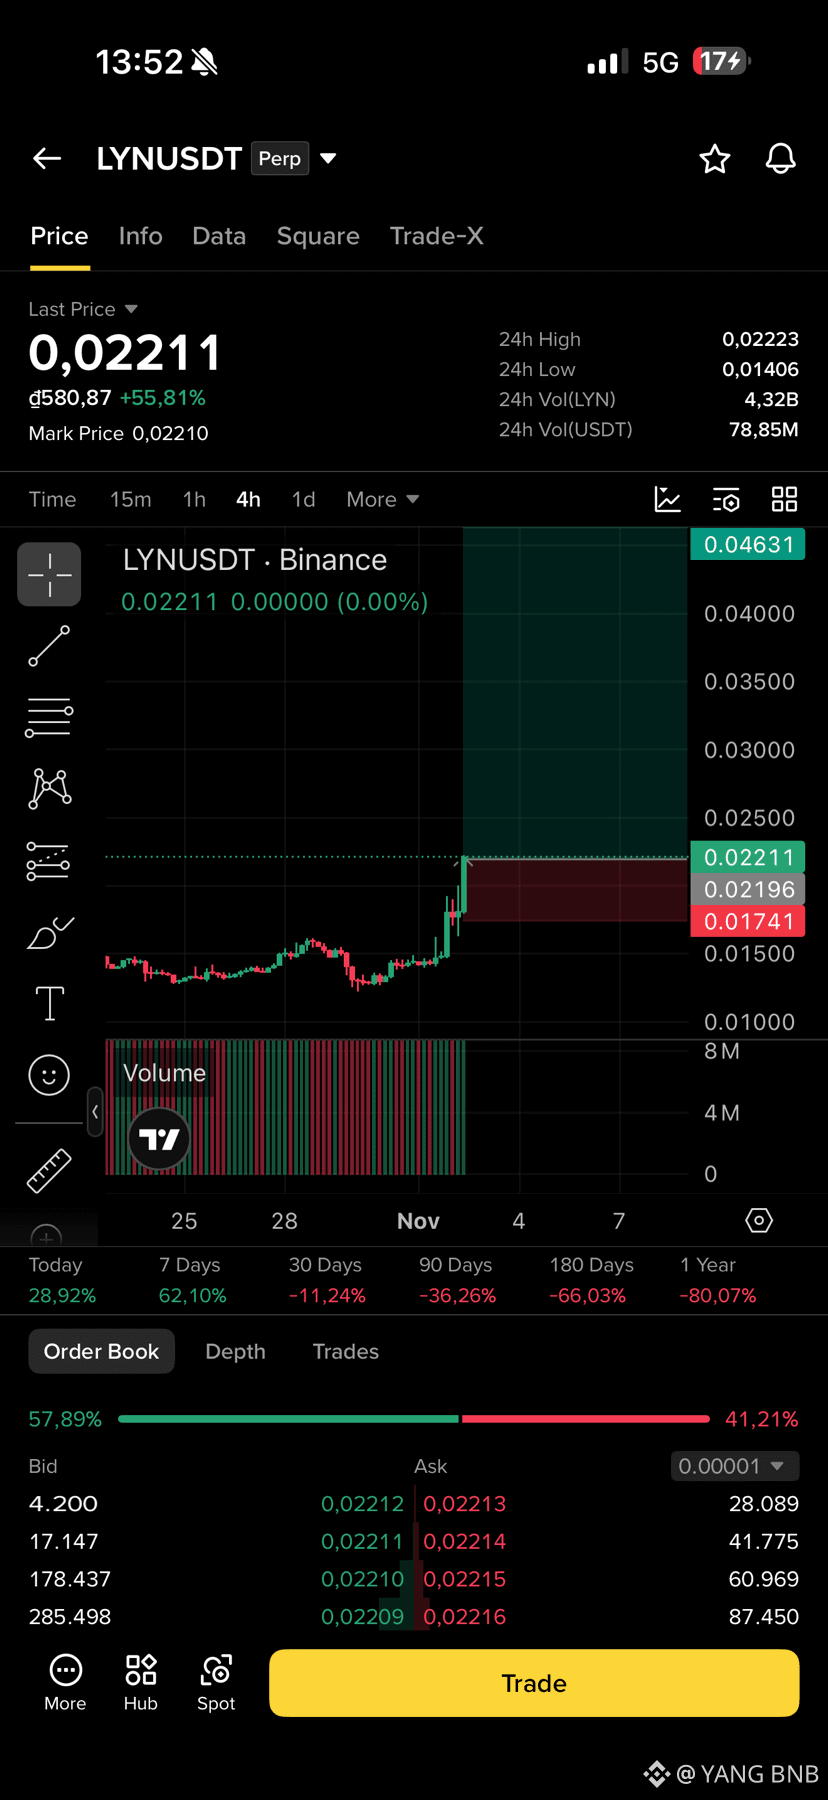
LYN is showing strong bullish momentum after breaking out from its previous consolidation zone. The price is currently trading around 0.02211, gaining more than 55% in the last 24 hours. Buyers have taken control, pushing the price sharply higher with a significant increase in trading activity. The 4H chart shows a strong bullish breakout after an extended period of sideways movement. The price is now attempting to establish a new support zone around 0.02100–0.02200. If buying pressure remains strong and the price holds above this breakout area, further upside toward higher resistance levels could follow. 📈
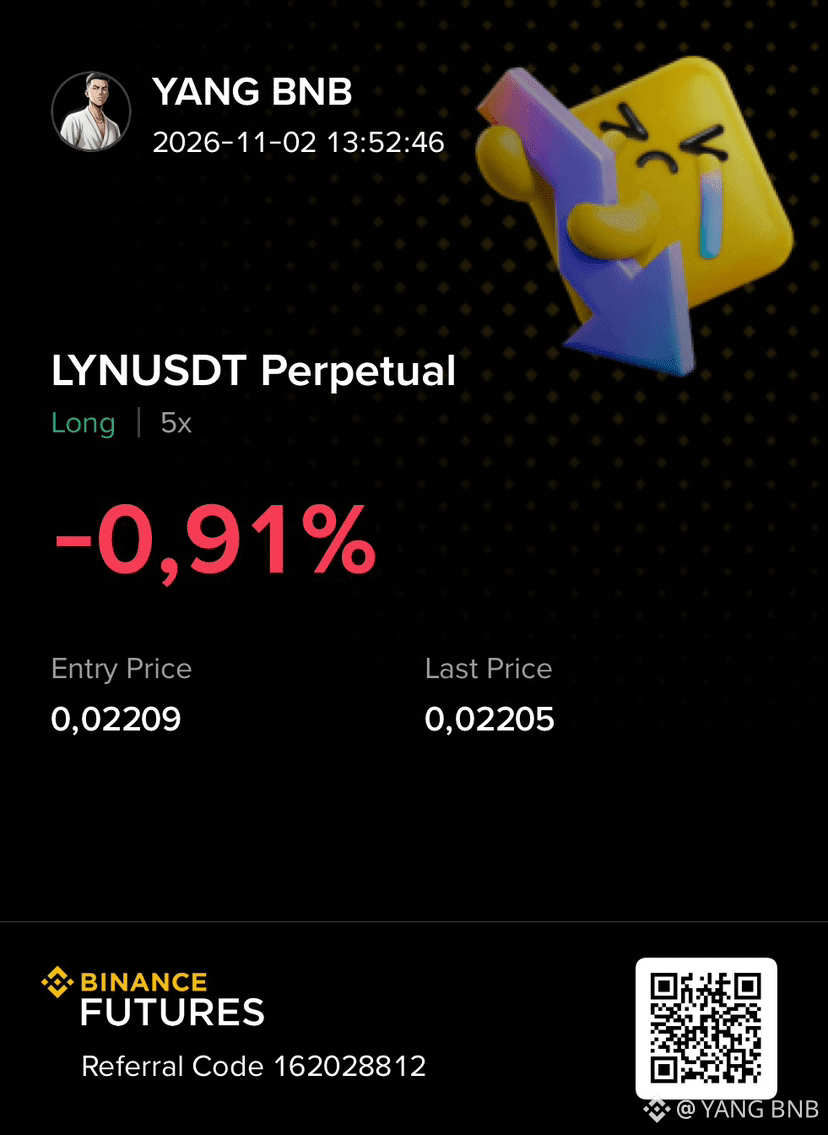
Trading Ideas Long $LYNUSDT
Entry: 0.02150 – 0.02220
TP1: 0.03000
TP2: 0.03500
SL: 0.01741
TP3: 0.04631
Long $LYN 👇
{future}(LYNUSDT)
🔥 $LYN BIG LONG OPPORTUNITY :
LYN is showing strong bullish momentum after breaking out from its previous consolidation zone. The price is currently trading around 0.02211, gaining more than 55% in the last 24 hours. Buyers have taken control, pushing the price sharply higher with a significant increase in trading activity. The 4H chart shows a strong bullish breakout after an extended period of sideways movement. The price is now attempting to establish a new support zone around 0.02100–0.02200. If buying pressure remains strong and the price holds above this breakout area, further upside toward higher resistance levels could follow. 📈
Trading Ideas Long $LYNUSDT
Entry: 0.02150 – 0.02220
TP1: 0.03000
TP2: 0.03500
SL: 0.01741
TP3: 0.04631
Long $LYN 👇
LYN is showing strong bullish momentum after breaking out from its previous consolidation zone. The price is currently trading around 0.02211, gaining more than 55% in the last 24 hours. Buyers have taken control, pushing the price sharply higher with a significant increase in trading activity. The 4H chart shows a strong bullish breakout after an extended period of sideways movement. The price is now attempting to establish a new support zone around 0.02100–0.02200. If buying pressure remains strong and the price holds above this breakout area, further upside toward higher resistance levels could follow. 📈
Trading Ideas Long $LYNUSDT
Entry: 0.02150 – 0.02220
TP1: 0.03000
TP2: 0.03500
SL: 0.01741
TP3: 0.04631
Long $LYN 👇
292
·
--
Bearish
🔥 $DRIFT BIG SHORT OPPORTUNITY :
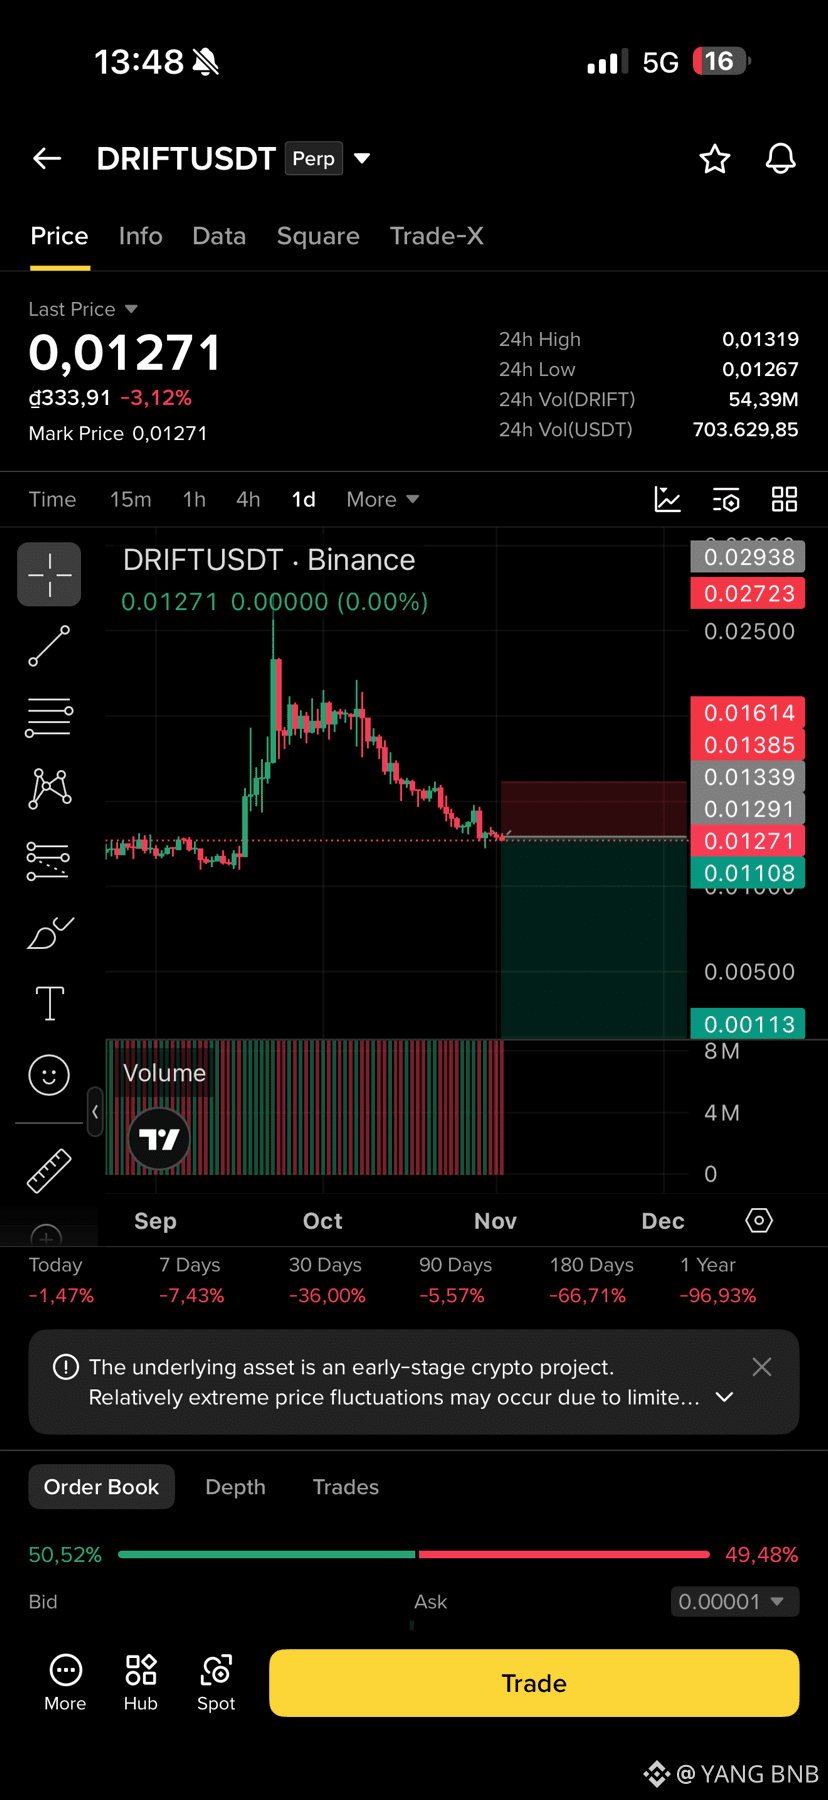
DRIFT is showing continued bearish momentum after experiencing a significant decline from its previous highs. The price is currently trading around 0.01271, down more than 3% in the last 24 hours. Sellers remain in control, with the daily chart showing a consistent pattern of lower highs and lower lows. After failing to maintain its previous support around 0.01600, the price has continued moving downward and is now approaching its recent lows. The overall market structure remains bearish, and if selling pressure continues, another breakdown toward lower support levels could follow. 📉
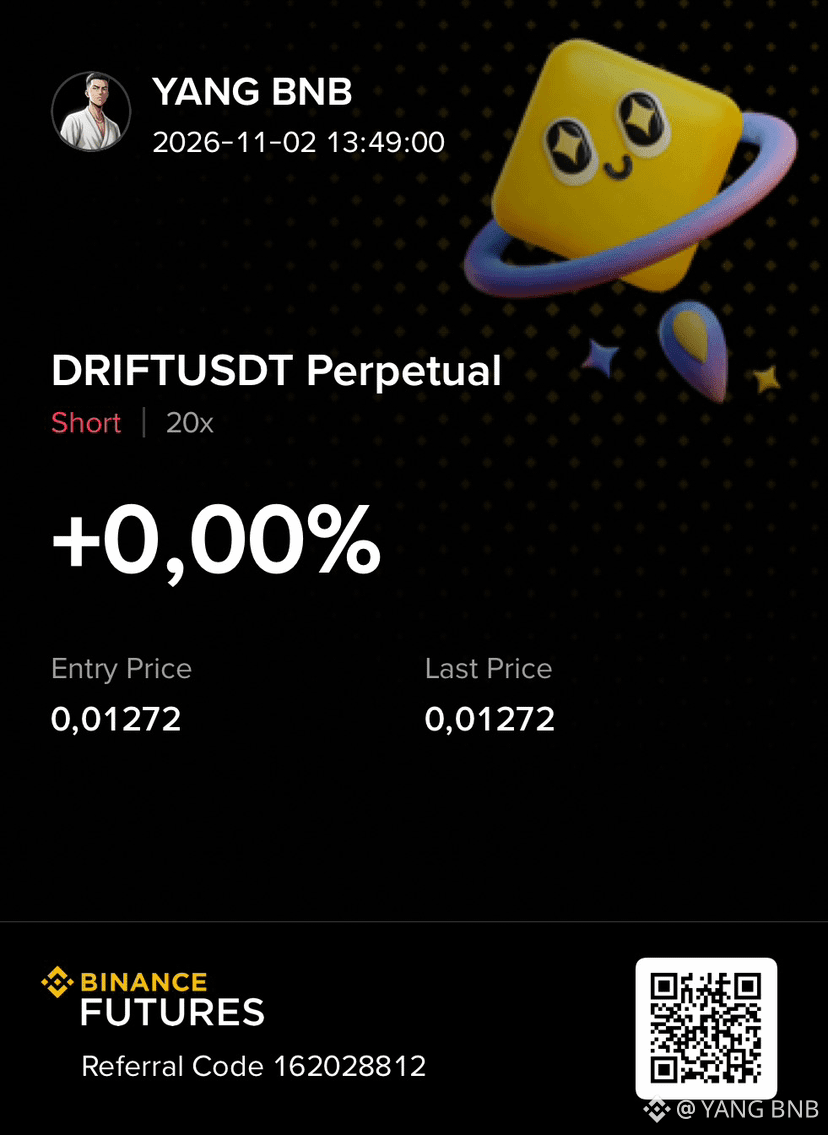
Trading Ideas Short $DRIFT
Entry: 0.01270 – 0.01340
TP1: 0.01108
TP2: 0.00800
SL: 0.01614
TP3: 0.00113
Shirt $DRIFT 👇
{future}(DRIFTUSDT)
🔥 $DRIFT BIG SHORT OPPORTUNITY :
DRIFT is showing continued bearish momentum after experiencing a significant decline from its previous highs. The price is currently trading around 0.01271, down more than 3% in the last 24 hours. Sellers remain in control, with the daily chart showing a consistent pattern of lower highs and lower lows. After failing to maintain its previous support around 0.01600, the price has continued moving downward and is now approaching its recent lows. The overall market structure remains bearish, and if selling pressure continues, another breakdown toward lower support levels could follow. 📉
Trading Ideas Short $DRIFT
Entry: 0.01270 – 0.01340
TP1: 0.01108
TP2: 0.00800
SL: 0.01614
TP3: 0.00113
Shirt $DRIFT 👇
DRIFT is showing continued bearish momentum after experiencing a significant decline from its previous highs. The price is currently trading around 0.01271, down more than 3% in the last 24 hours. Sellers remain in control, with the daily chart showing a consistent pattern of lower highs and lower lows. After failing to maintain its previous support around 0.01600, the price has continued moving downward and is now approaching its recent lows. The overall market structure remains bearish, and if selling pressure continues, another breakdown toward lower support levels could follow. 📉
Trading Ideas Short $DRIFT
Entry: 0.01270 – 0.01340
TP1: 0.01108
TP2: 0.00800
SL: 0.01614
TP3: 0.00113
Shirt $DRIFT 👇
192
·
--
Bearish
🔥 $AGT BIG SHORT OPPORTUNITY :
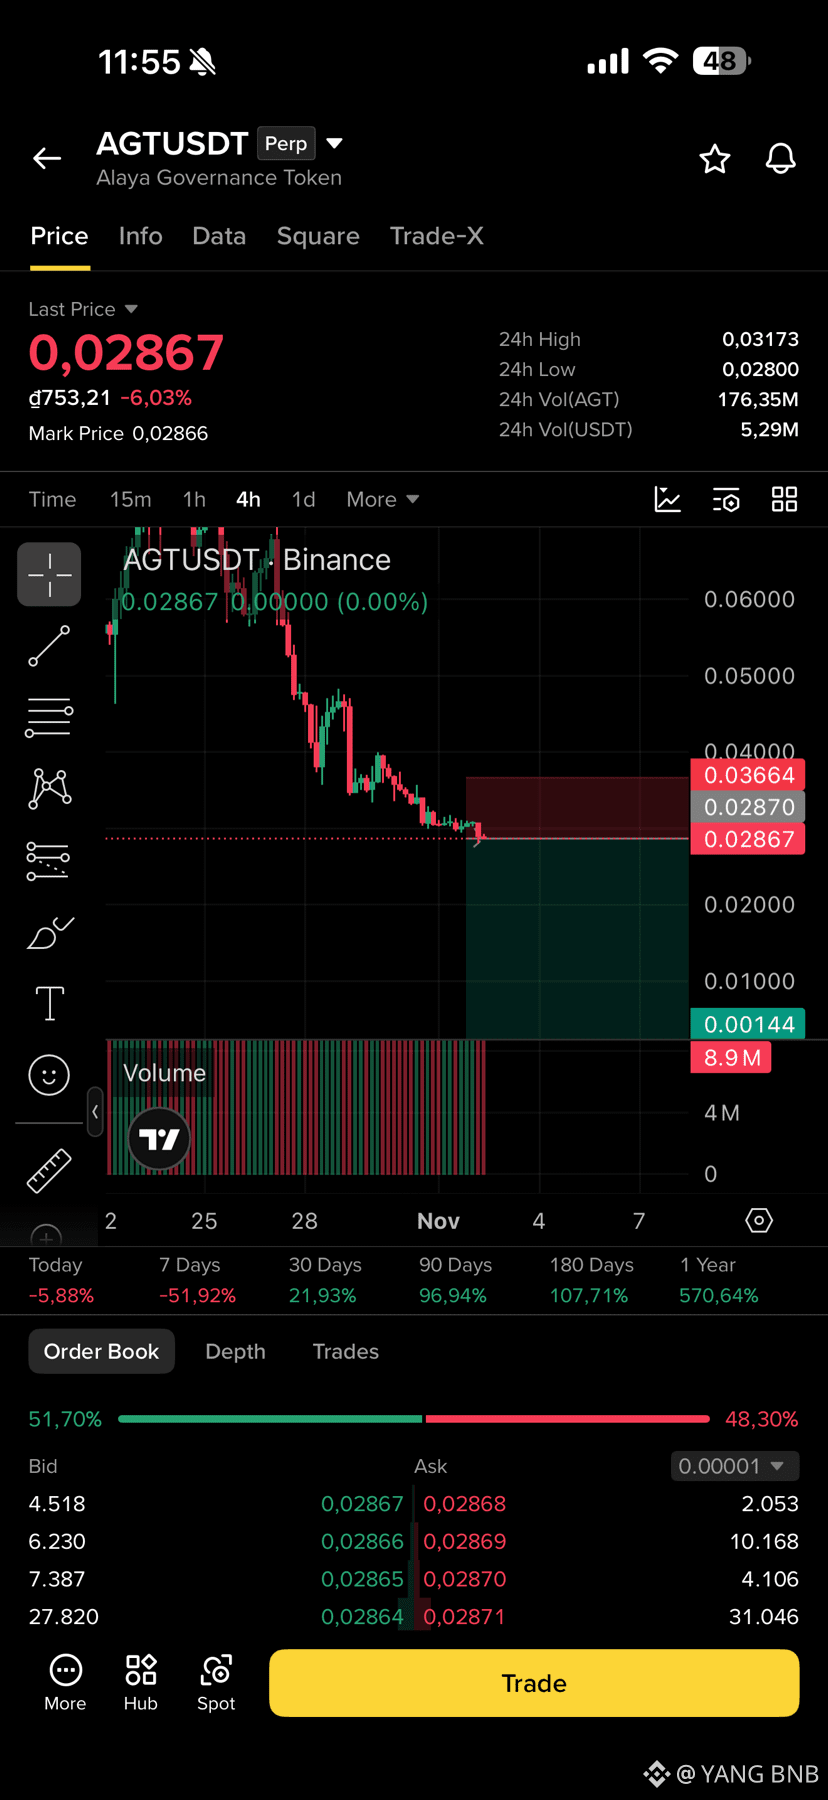
AGT is showing continued bearish momentum after experiencing a significant breakdown from its previous resistance zones. The price is currently trading around 0.02867, down more than 6% in the last 24 hours. Sellers remain firmly in control, pushing the price lower after repeated failures to recover above previous resistance levels. 📉
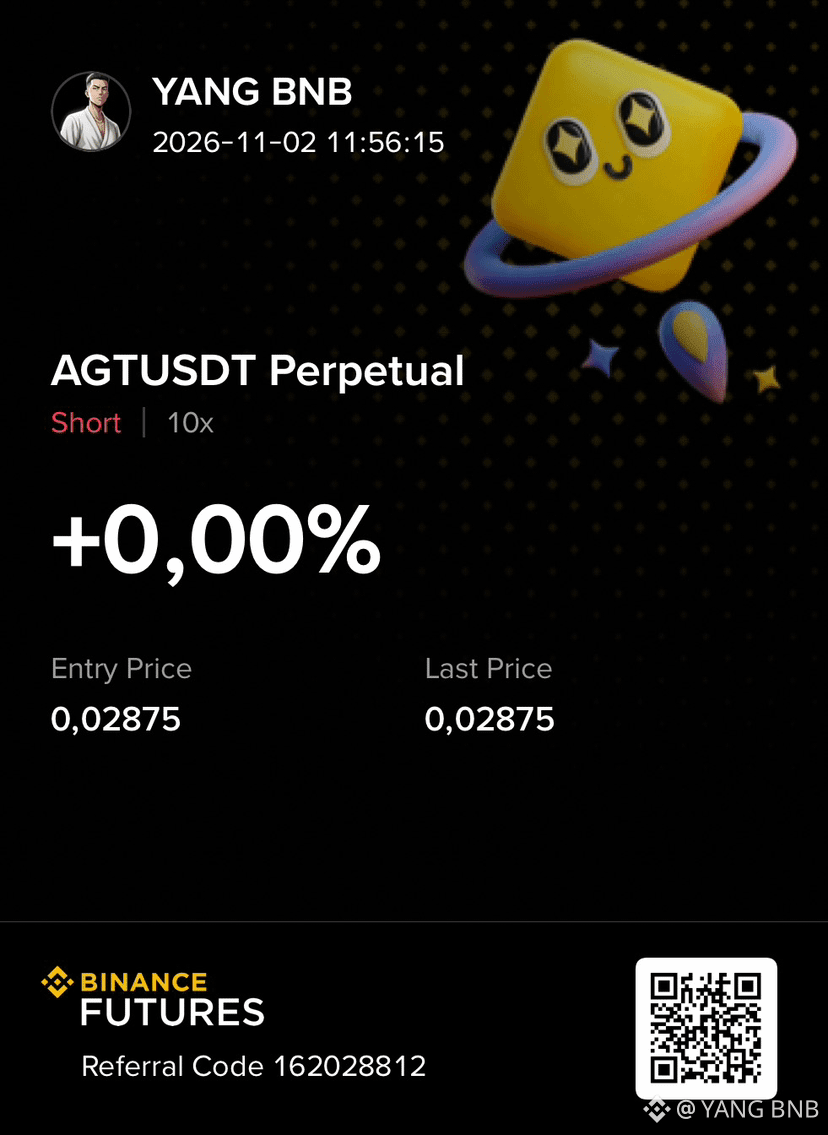
Trading Ideas Short $AGTUSDT
Entry: 0.02850 – 0.02950
TP1: 0.02500
TP2: 0.02000
SL: 0.03664
TP3: 0.00144
Short $AGT 👇
{future}(AGTUSDT)
🔥 $AGT BIG SHORT OPPORTUNITY :
AGT is showing continued bearish momentum after experiencing a significant breakdown from its previous resistance zones. The price is currently trading around 0.02867, down more than 6% in the last 24 hours. Sellers remain firmly in control, pushing the price lower after repeated failures to recover above previous resistance levels. 📉
Trading Ideas Short $AGTUSDT
Entry: 0.02850 – 0.02950
TP1: 0.02500
TP2: 0.02000
SL: 0.03664
TP3: 0.00144
Short $AGT 👇
AGT is showing continued bearish momentum after experiencing a significant breakdown from its previous resistance zones. The price is currently trading around 0.02867, down more than 6% in the last 24 hours. Sellers remain firmly in control, pushing the price lower after repeated failures to recover above previous resistance levels. 📉
Trading Ideas Short $AGTUSDT
Entry: 0.02850 – 0.02950
TP1: 0.02500
TP2: 0.02000
SL: 0.03664
TP3: 0.00144
Short $AGT 👇
255
·
--
Bearish
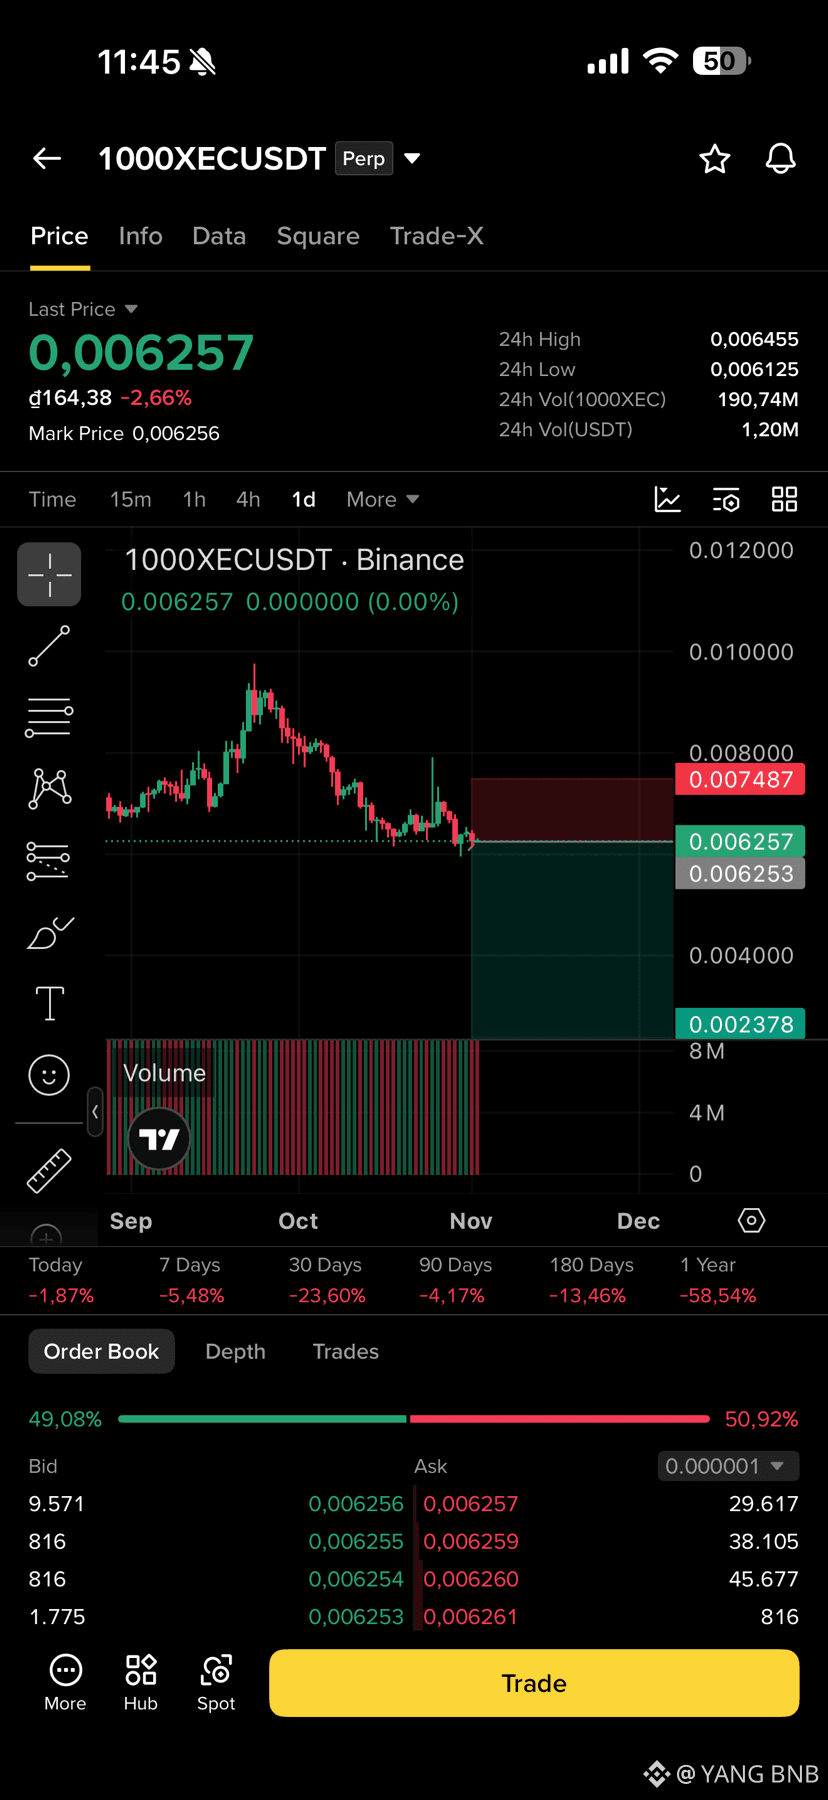
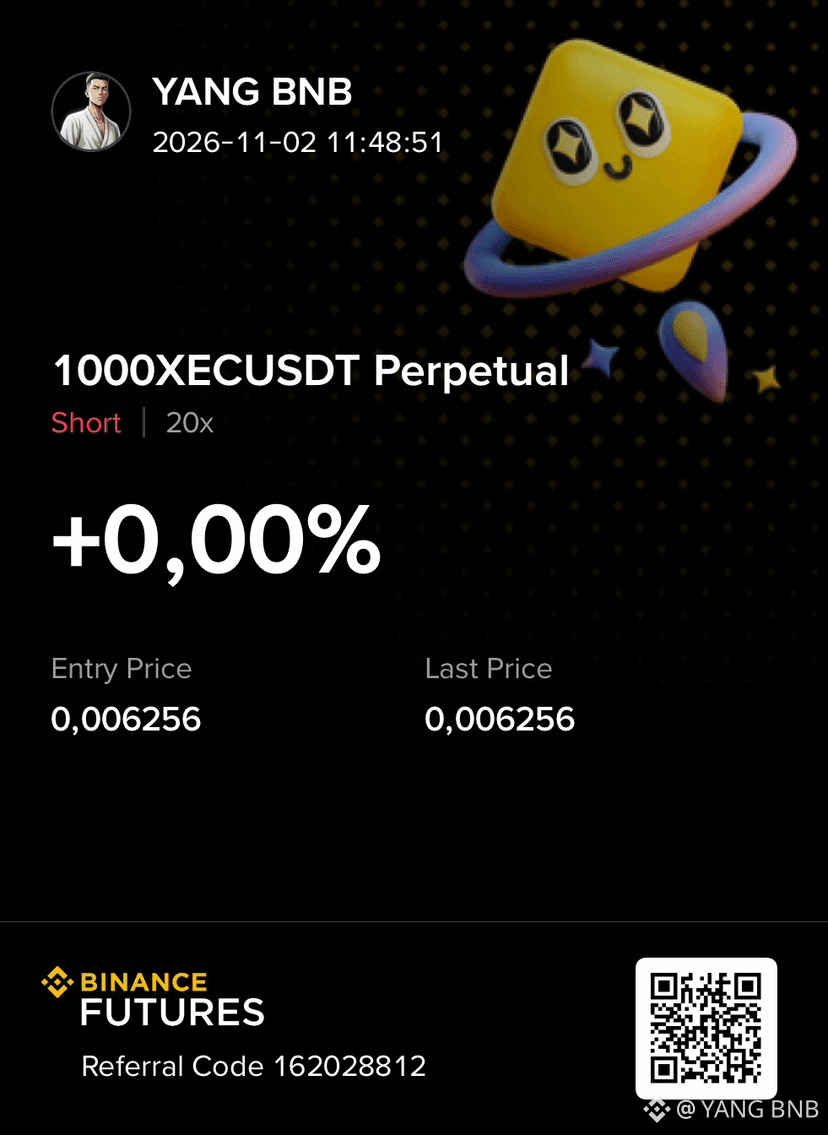
🔥 $1000XEC BIG SHORT OPPORTUNITY :
1000XEC is showing continued bearish momentum after facing repeated rejection from its previous resistance zones. The price is currently trading around 0.006257, with the daily chart showing a clear downward trend. Sellers are maintaining control, pushing the price toward its recent support levels after failing to recover above the 0.008000 resistance area. The overall market structure remains bearish, with lower highs and persistent selling pressure. If the current support zone breaks, further downside could follow as the price moves toward lower support levels. 📉
Trading Ideas Short $1000XECUSDT
Entry: 0.006250 – 0.006500
TP1: 0.005000
TP2: 0.004000
SL: 0.007487
TP3: 0.002378
Short $1000XEC 👇
{future}(1000XECUSDT)
🔥 $1000XEC BIG SHORT OPPORTUNITY :
1000XEC is showing continued bearish momentum after facing repeated rejection from its previous resistance zones. The price is currently trading around 0.006257, with the daily chart showing a clear downward trend. Sellers are maintaining control, pushing the price toward its recent support levels after failing to recover above the 0.008000 resistance area. The overall market structure remains bearish, with lower highs and persistent selling pressure. If the current support zone breaks, further downside could follow as the price moves toward lower support levels. 📉
Trading Ideas Short $1000XECUSDT
Entry: 0.006250 – 0.006500
TP1: 0.005000
TP2: 0.004000
SL: 0.007487
TP3: 0.002378
Short $1000XEC 👇
1000XEC is showing continued bearish momentum after facing repeated rejection from its previous resistance zones. The price is currently trading around 0.006257, with the daily chart showing a clear downward trend. Sellers are maintaining control, pushing the price toward its recent support levels after failing to recover above the 0.008000 resistance area. The overall market structure remains bearish, with lower highs and persistent selling pressure. If the current support zone breaks, further downside could follow as the price moves toward lower support levels. 📉
Trading Ideas Short $1000XECUSDT
Entry: 0.006250 – 0.006500
TP1: 0.005000
TP2: 0.004000
SL: 0.007487
TP3: 0.002378
Short $1000XEC 👇
214
·
--
Bullish
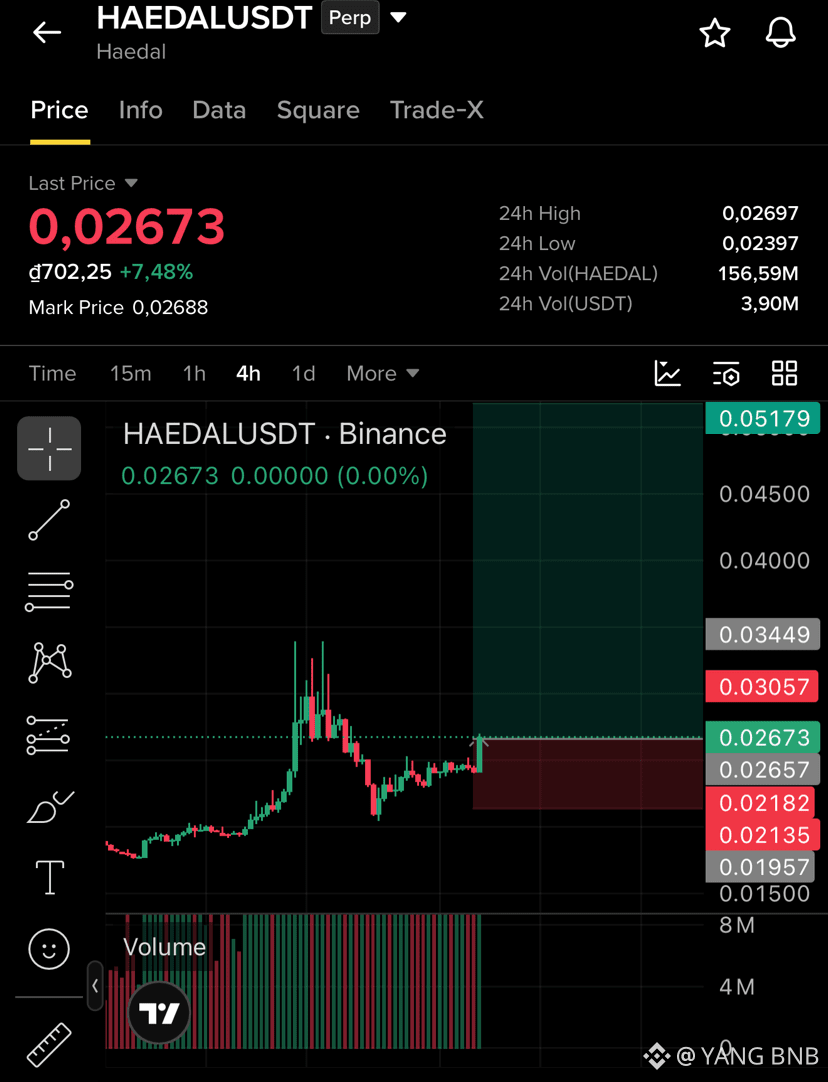
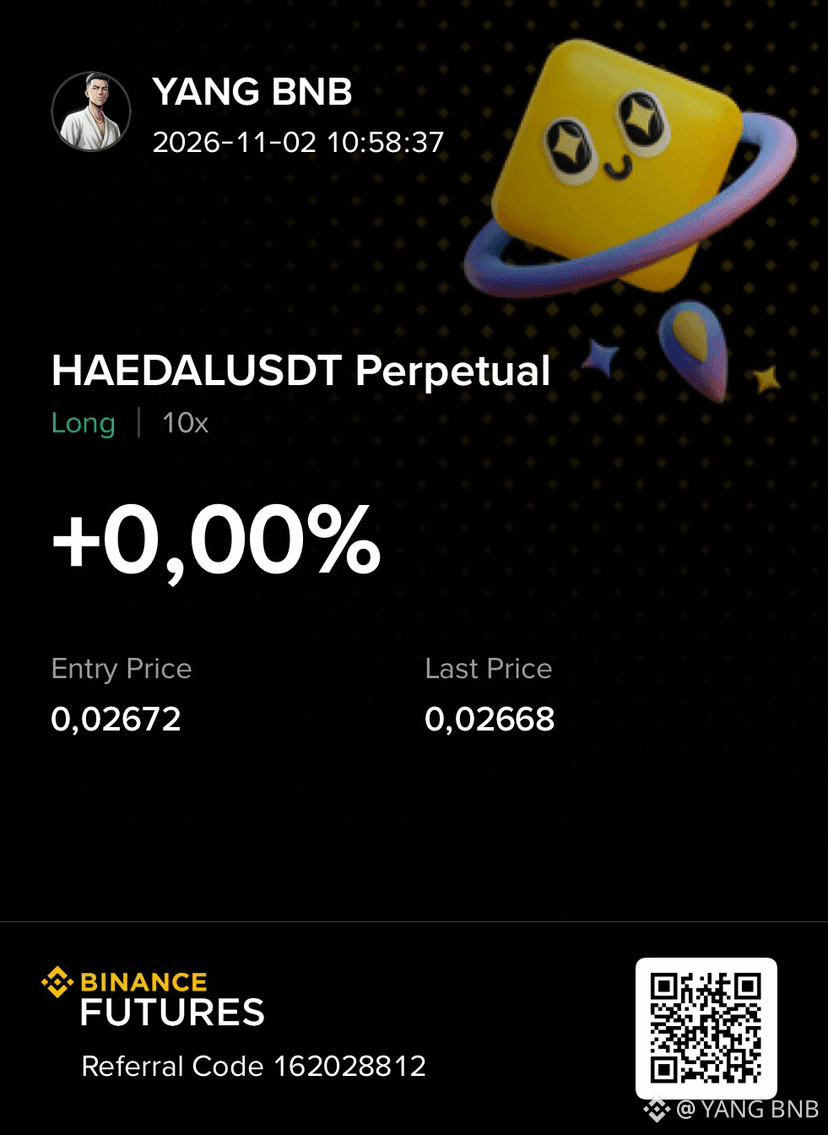
🔥 $HAEDAL BIG LONG OPPORTUNITY :
HAEDAL is showing signs of a potential bullish continuation after recovering strongly from its previous support zone. The price is currently trading around 0.02673, gaining more than 7% in the last 24 hours. Buyers are gradually regaining control after the recent correction, with the 4H chart showing signs of consolidation and renewed upward momentum.
Trading Ideas Long $HAEDALUSDT
Entry: 0.02650 – 0.02700
TP1: 0.03057
TP2: 0.03449
SL: 0.02182
TP3: 0.05179
Long $HAEDAL 👇
{future}(HAEDALUSDT)
🔥 $HAEDAL BIG LONG OPPORTUNITY :
HAEDAL is showing signs of a potential bullish continuation after recovering strongly from its previous support zone. The price is currently trading around 0.02673, gaining more than 7% in the last 24 hours. Buyers are gradually regaining control after the recent correction, with the 4H chart showing signs of consolidation and renewed upward momentum.
Trading Ideas Long $HAEDALUSDT
Entry: 0.02650 – 0.02700
TP1: 0.03057
TP2: 0.03449
SL: 0.02182
TP3: 0.05179
Long $HAEDAL 👇
HAEDAL is showing signs of a potential bullish continuation after recovering strongly from its previous support zone. The price is currently trading around 0.02673, gaining more than 7% in the last 24 hours. Buyers are gradually regaining control after the recent correction, with the 4H chart showing signs of consolidation and renewed upward momentum.
Trading Ideas Long $HAEDALUSDT
Entry: 0.02650 – 0.02700
TP1: 0.03057
TP2: 0.03449
SL: 0.02182
TP3: 0.05179
Long $HAEDAL 👇
362
·
--
Bearish
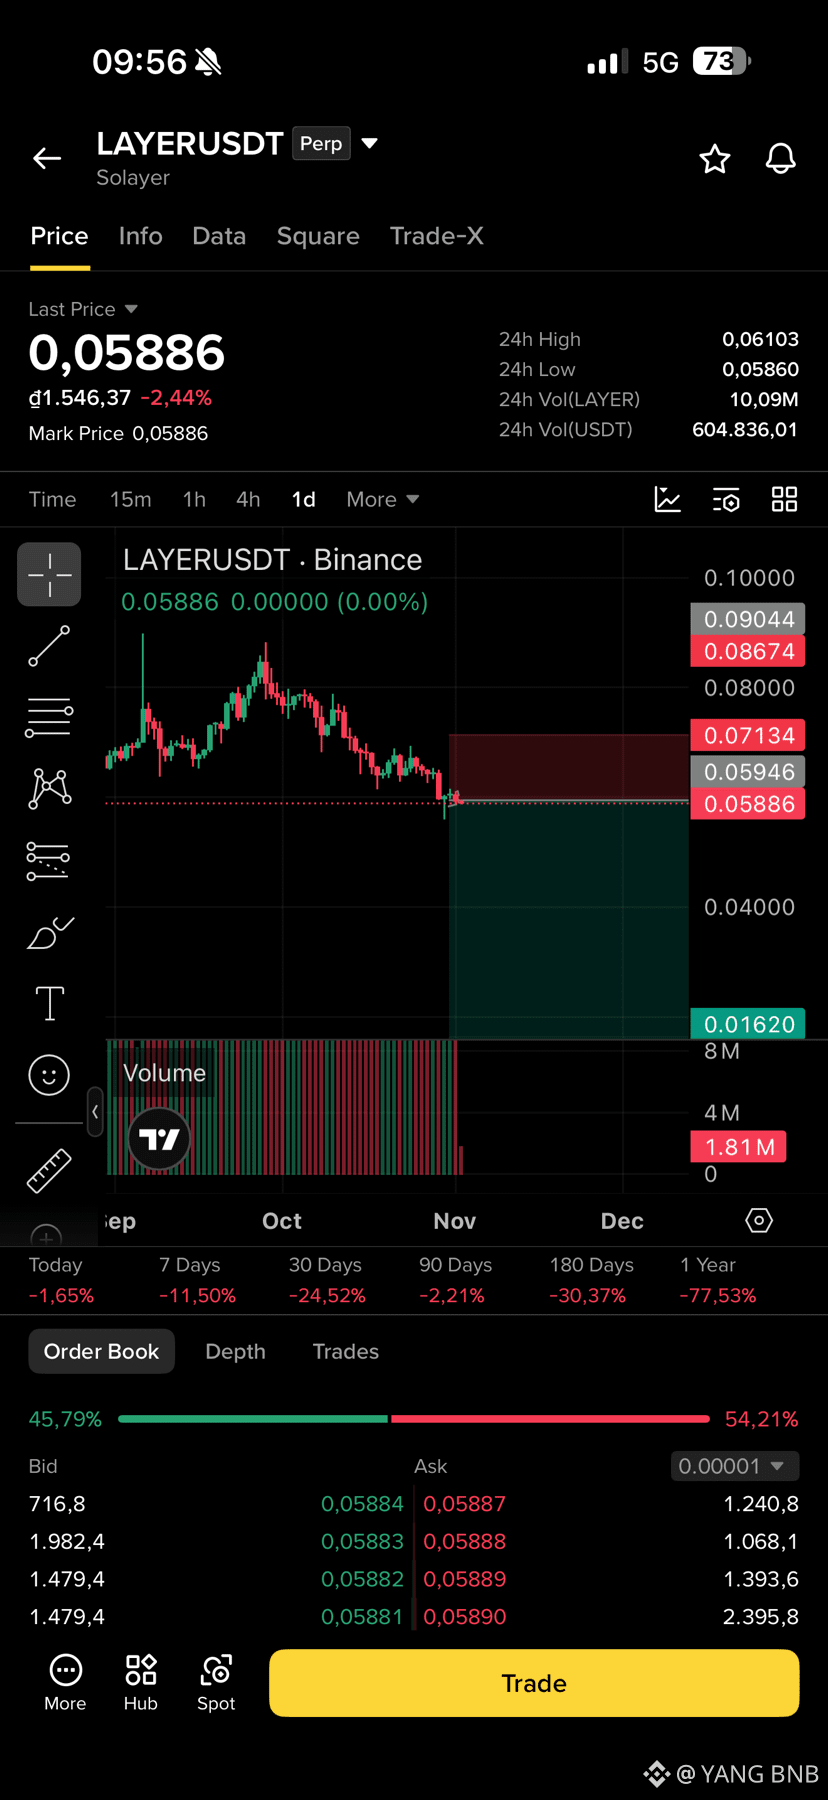
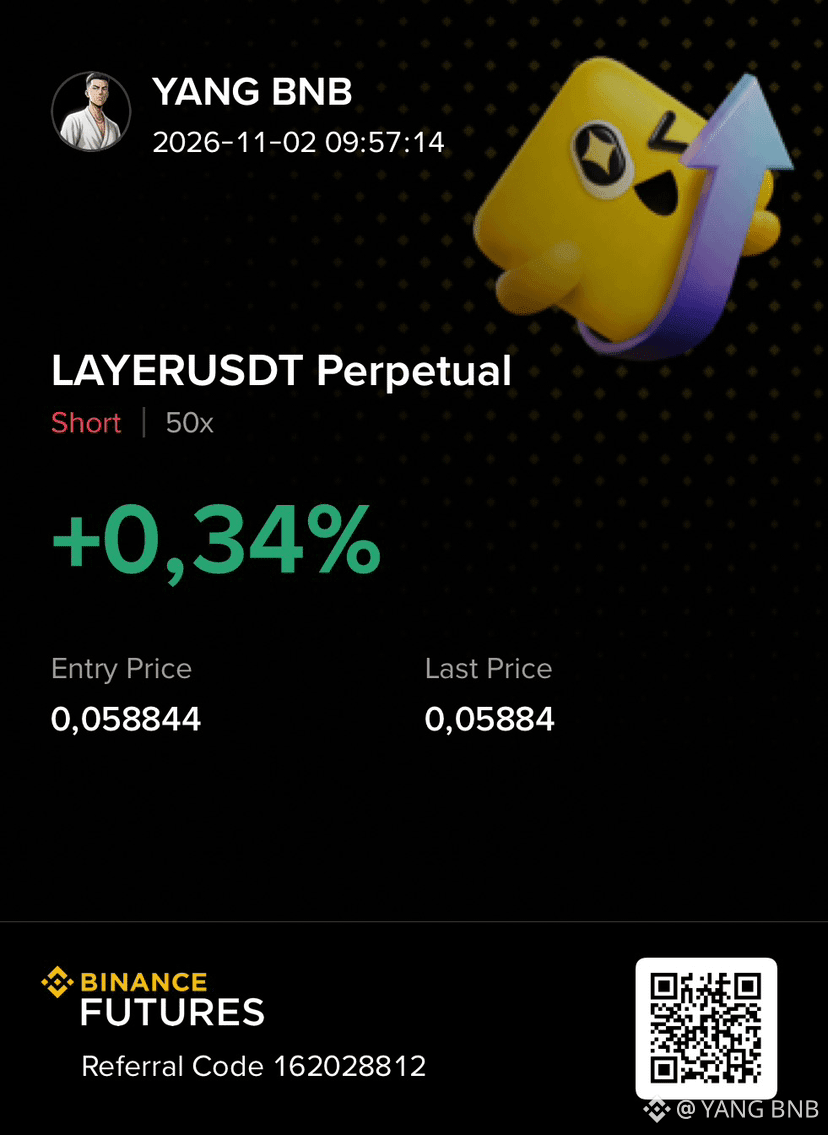
🔥 $LAYER BIG SHORT OPPORTUNITY :
LAYER is showing continued bearish momentum after facing repeated rejection from its previous resistance zones. The price is currently trading around 0.05886, with the daily chart showing a clear downward trend. Sellers are maintaining control, pushing the price toward new local lows after failing to recover above the 0.07000 resistance area.
Trading Ideas Short $LAYERUSDT
Entry: 0.05880 – 0.06000
TP1: 0.05000
TP2: 0.04000
SL: 0.07134
TP3: 0.01620
{future}(LAYERUSDT)
🔥 $LAYER BIG SHORT OPPORTUNITY :
LAYER is showing continued bearish momentum after facing repeated rejection from its previous resistance zones. The price is currently trading around 0.05886, with the daily chart showing a clear downward trend. Sellers are maintaining control, pushing the price toward new local lows after failing to recover above the 0.07000 resistance area.
Trading Ideas Short $LAYERUSDT
Entry: 0.05880 – 0.06000
TP1: 0.05000
TP2: 0.04000
SL: 0.07134
TP3: 0.01620
LAYER is showing continued bearish momentum after facing repeated rejection from its previous resistance zones. The price is currently trading around 0.05886, with the daily chart showing a clear downward trend. Sellers are maintaining control, pushing the price toward new local lows after failing to recover above the 0.07000 resistance area.
Trading Ideas Short $LAYERUSDT
Entry: 0.05880 – 0.06000
TP1: 0.05000
TP2: 0.04000
SL: 0.07134
TP3: 0.01620
368
·
--
Bearish
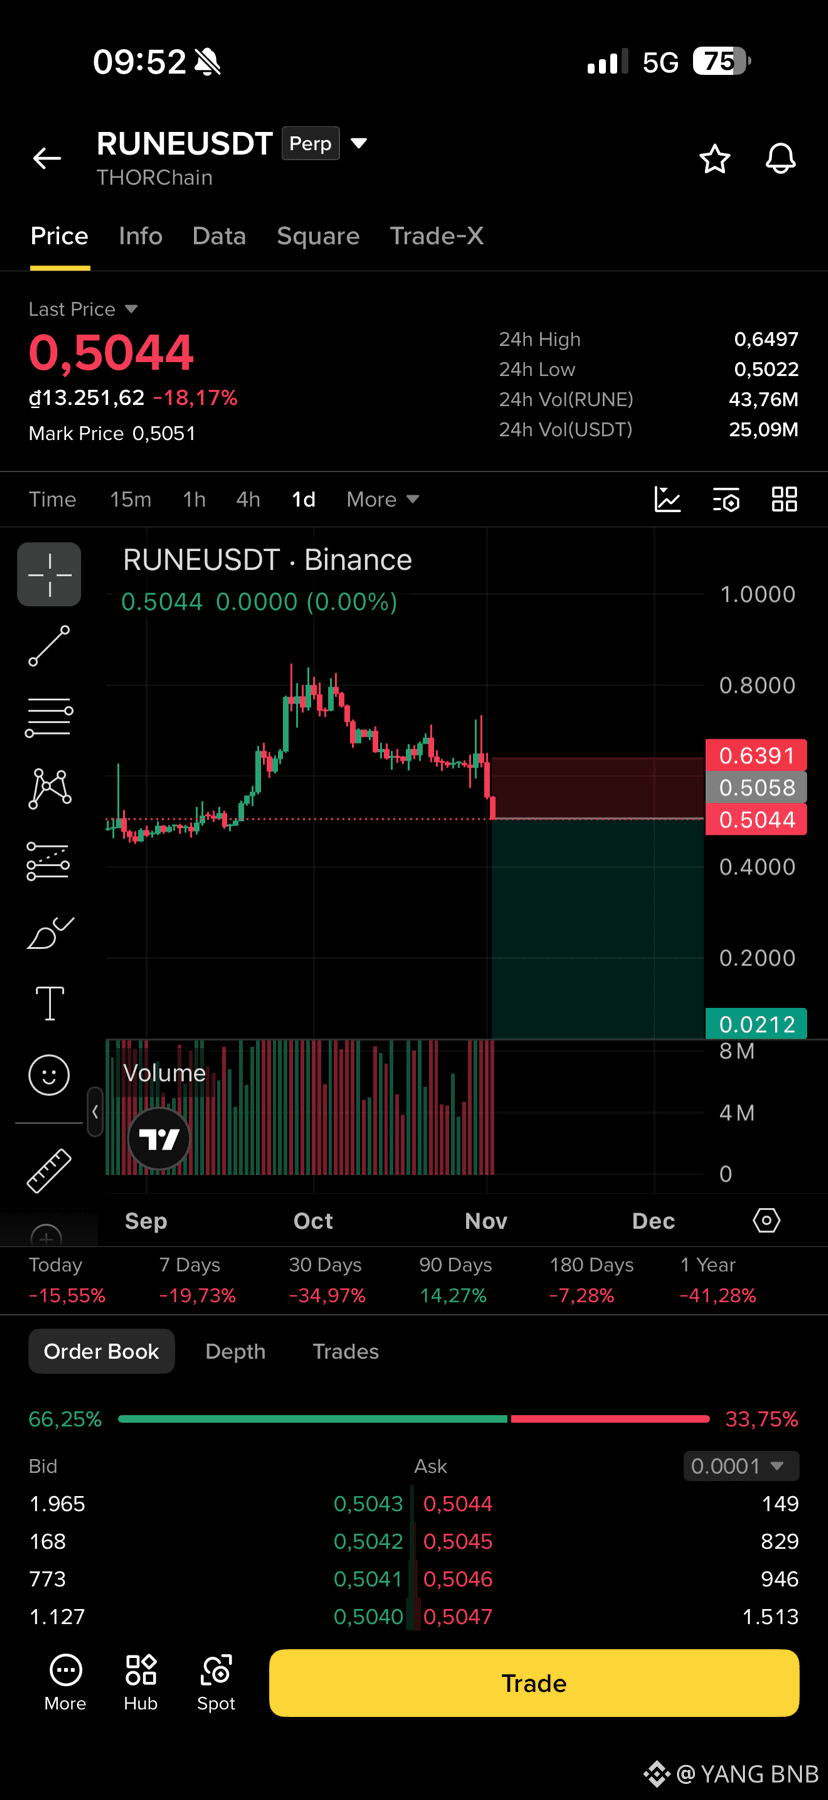
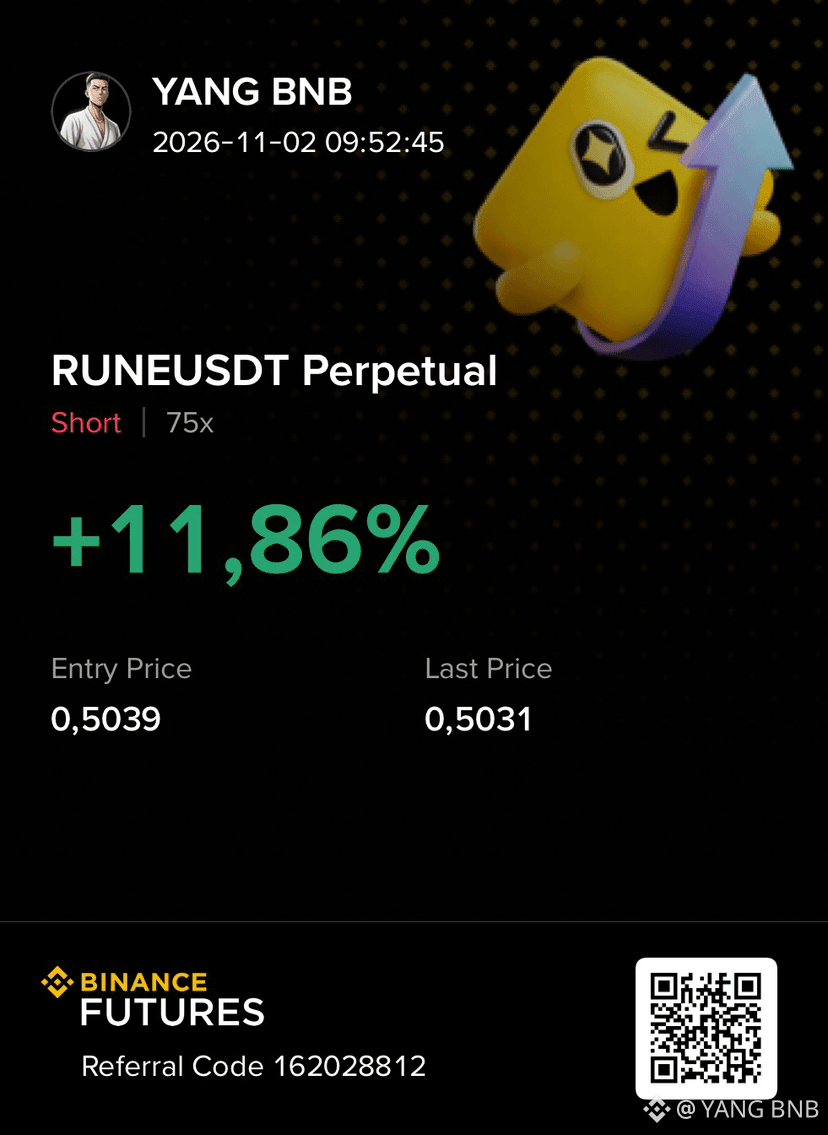
🔥 $RUNE BIG SHORT OPPORTUNITY :
RUNE is showing strong bearish momentum after suffering a sharp breakdown from its previous consolidation zone. The price is currently trading around 0.5044, down more than 18% in the last 24 hours. Sellers have taken control, pushing the price below important support levels with significant selling pressure. The daily chart shows a clear bearish reversal after failing to maintain its previous highs around 0.8000.
Trading Ideas Short $RUNEUSDT
Entry: 0.5050 – 0.5250
TP1: 0.4500
TP2: 0.4000
SL: 0.6391
TP3: 0.3500
Short $RUNE 👇
{future}(RUNEUSDT)
🔥 $RUNE BIG SHORT OPPORTUNITY :
RUNE is showing strong bearish momentum after suffering a sharp breakdown from its previous consolidation zone. The price is currently trading around 0.5044, down more than 18% in the last 24 hours. Sellers have taken control, pushing the price below important support levels with significant selling pressure. The daily chart shows a clear bearish reversal after failing to maintain its previous highs around 0.8000.
Trading Ideas Short $RUNEUSDT
Entry: 0.5050 – 0.5250
TP1: 0.4500
TP2: 0.4000
SL: 0.6391
TP3: 0.3500
Short $RUNE 👇
RUNE is showing strong bearish momentum after suffering a sharp breakdown from its previous consolidation zone. The price is currently trading around 0.5044, down more than 18% in the last 24 hours. Sellers have taken control, pushing the price below important support levels with significant selling pressure. The daily chart shows a clear bearish reversal after failing to maintain its previous highs around 0.8000.
Trading Ideas Short $RUNEUSDT
Entry: 0.5050 – 0.5250
TP1: 0.4500
TP2: 0.4000
SL: 0.6391
TP3: 0.3500
Short $RUNE 👇
259
·
--
Bullish
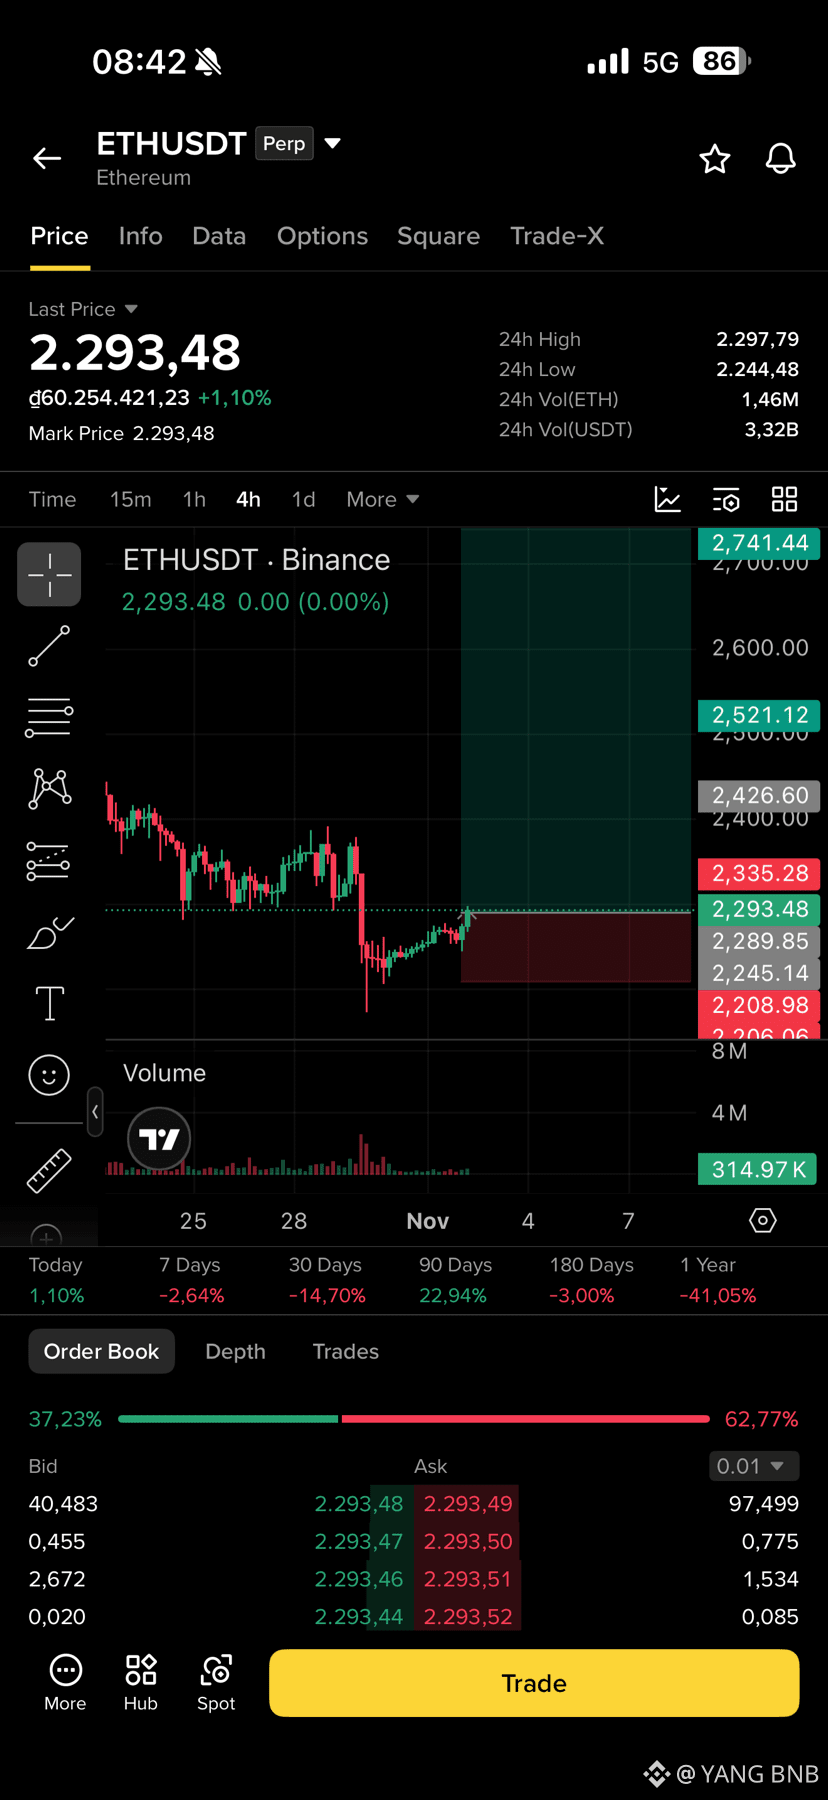
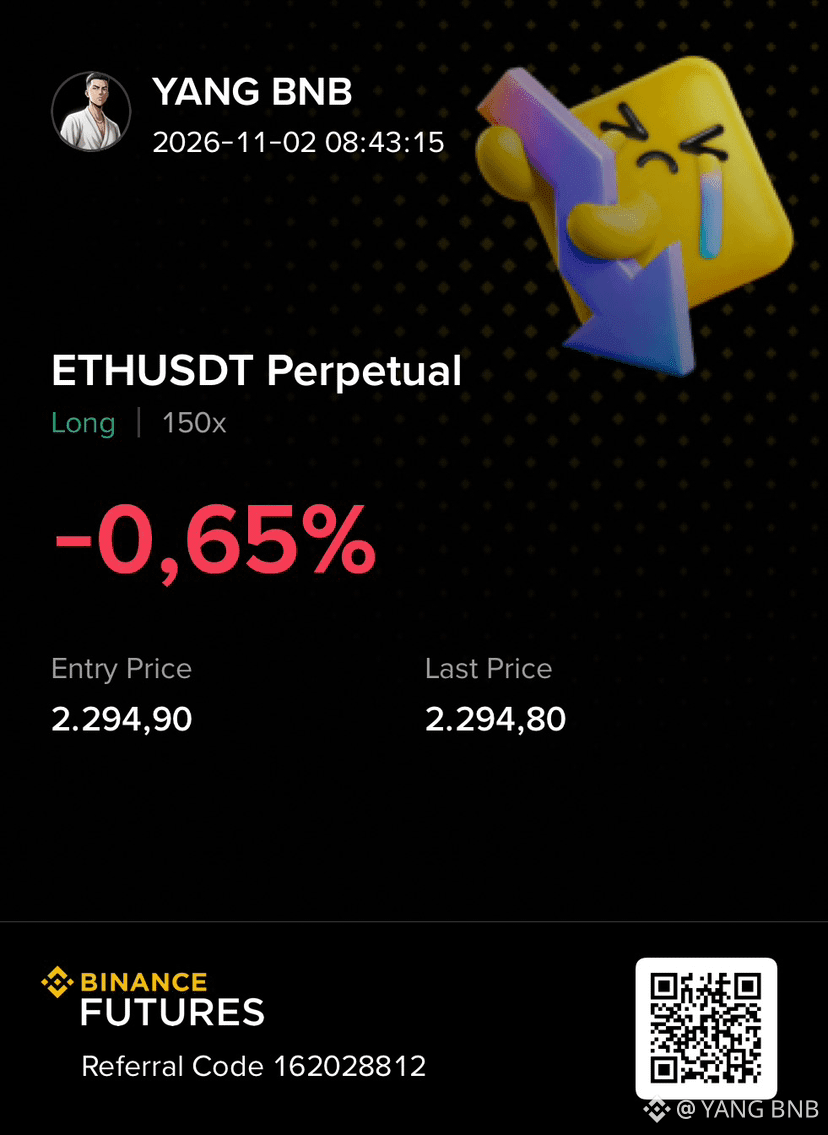
🔥 $ETH BIG LONG OPPORTUNITY :
ETH is showing signs of a potential bullish recovery after experiencing a strong sell-off from its previous resistance zone. The price is currently trading around 2,293, attempting to stabilize above the recent support area near 2,245–2,250. Buyers are gradually stepping in, pushing the price higher after the sharp downward move. The 4H chart shows early signs of a possible bullish reversal as ETH begins recovering from its recent lows. If buying pressure continues and the price maintains its current support, further upside toward the next resistance levels could follow. 📈
Trading Ideas Long $ETHUSDT
Entry: 2,285 – 2,300
TP1: 2,426
TP2: 2,521
SL: 2,208
TP3: 2,741
Long $ETH 👇
{future}(ETHUSDT)
🔥 $ETH BIG LONG OPPORTUNITY :
ETH is showing signs of a potential bullish recovery after experiencing a strong sell-off from its previous resistance zone. The price is currently trading around 2,293, attempting to stabilize above the recent support area near 2,245–2,250. Buyers are gradually stepping in, pushing the price higher after the sharp downward move. The 4H chart shows early signs of a possible bullish reversal as ETH begins recovering from its recent lows. If buying pressure continues and the price maintains its current support, further upside toward the next resistance levels could follow. 📈
Trading Ideas Long $ETHUSDT
Entry: 2,285 – 2,300
TP1: 2,426
TP2: 2,521
SL: 2,208
TP3: 2,741
Long $ETH 👇
ETH is showing signs of a potential bullish recovery after experiencing a strong sell-off from its previous resistance zone. The price is currently trading around 2,293, attempting to stabilize above the recent support area near 2,245–2,250. Buyers are gradually stepping in, pushing the price higher after the sharp downward move. The 4H chart shows early signs of a possible bullish reversal as ETH begins recovering from its recent lows. If buying pressure continues and the price maintains its current support, further upside toward the next resistance levels could follow. 📈
Trading Ideas Long $ETHUSDT
Entry: 2,285 – 2,300
TP1: 2,426
TP2: 2,521
SL: 2,208
TP3: 2,741
Long $ETH 👇
410
·
--
Bullish
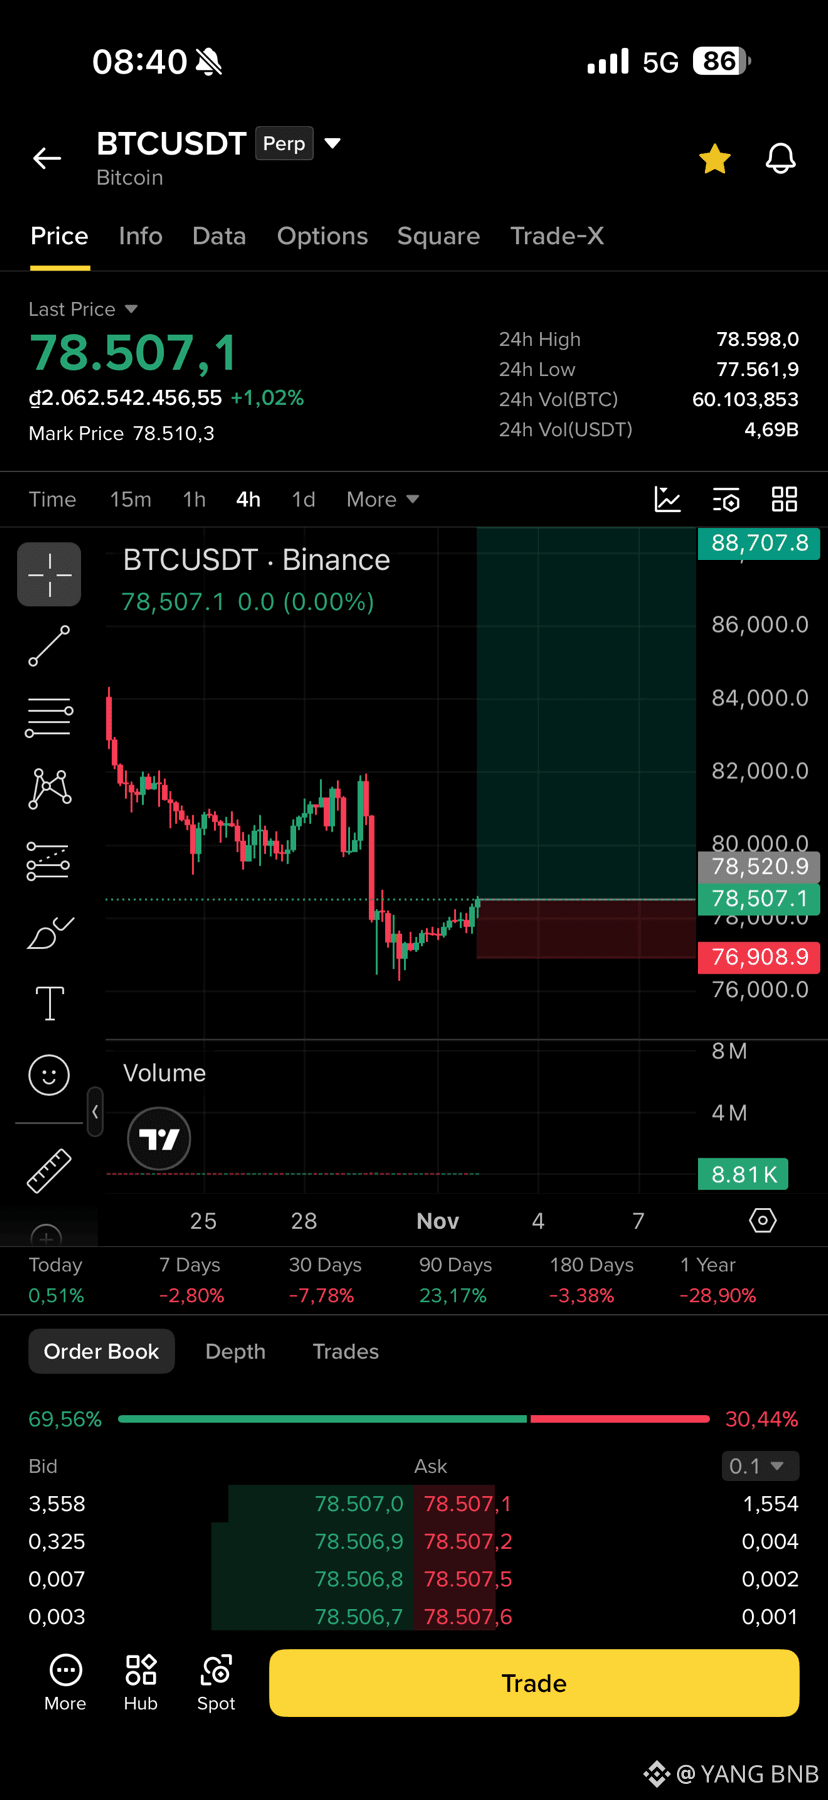
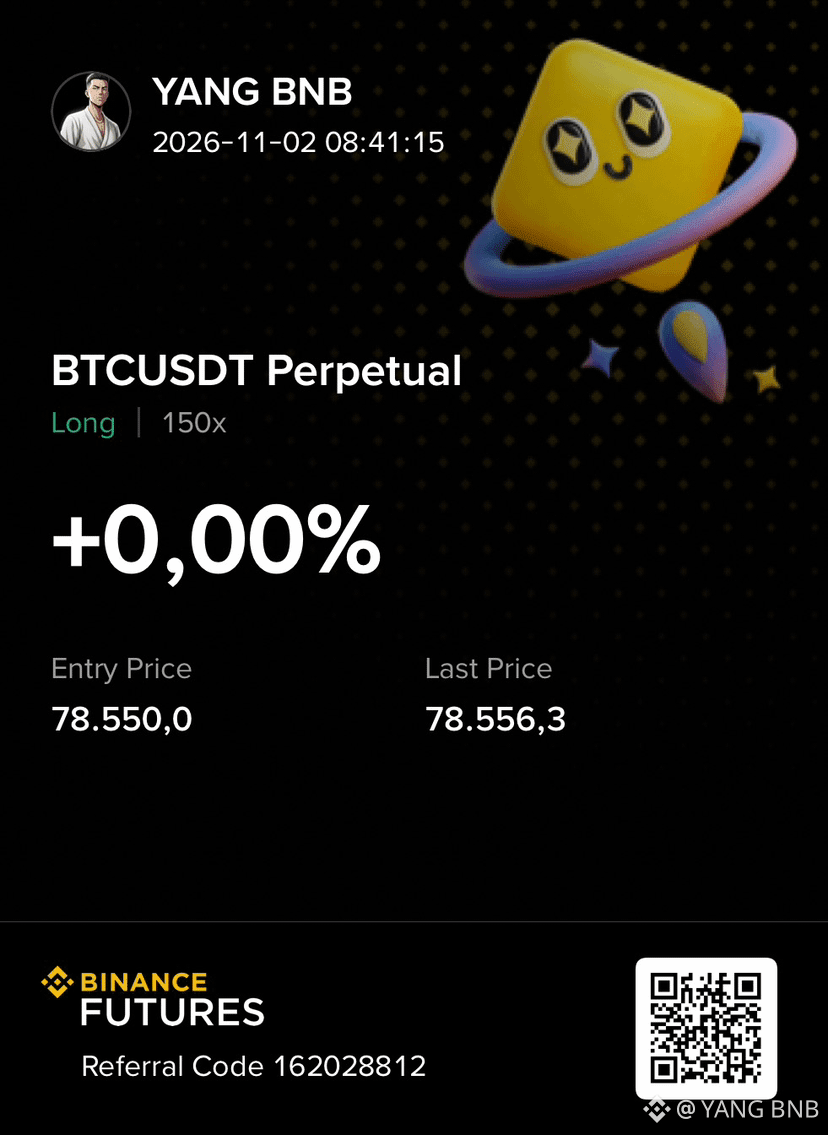
🔥 $BTC BIG LONG OPPORTUNITY :
BTC is showing signs of a potential bullish recovery after experiencing a strong correction from its previous highs. The price is currently trading around 78,507, attempting to stabilize above the recent support zone near 76,500–77,000. Buyers are gradually stepping in, pushing the price higher after the sharp sell-off. The 4H chart shows early signs of a possible bullish reversal as BTC starts building momentum around its current levels. If buying pressure continues and the price maintains support, a stronger recovery toward higher resistance levels could follow. 📈
Trading Ideas Long $BTC
Entry: 78,000 – 78,600
TP1: 82,000
TP2: 85,000
SL: 76,908.9
TP3: 88,707.8
Long $BTC 👇
{future}(BTCUSDT)
🔥 $BTC BIG LONG OPPORTUNITY :
BTC is showing signs of a potential bullish recovery after experiencing a strong correction from its previous highs. The price is currently trading around 78,507, attempting to stabilize above the recent support zone near 76,500–77,000. Buyers are gradually stepping in, pushing the price higher after the sharp sell-off. The 4H chart shows early signs of a possible bullish reversal as BTC starts building momentum around its current levels. If buying pressure continues and the price maintains support, a stronger recovery toward higher resistance levels could follow. 📈
Trading Ideas Long $BTC
Entry: 78,000 – 78,600
TP1: 82,000
TP2: 85,000
SL: 76,908.9
TP3: 88,707.8
Long $BTC 👇
BTC is showing signs of a potential bullish recovery after experiencing a strong correction from its previous highs. The price is currently trading around 78,507, attempting to stabilize above the recent support zone near 76,500–77,000. Buyers are gradually stepping in, pushing the price higher after the sharp sell-off. The 4H chart shows early signs of a possible bullish reversal as BTC starts building momentum around its current levels. If buying pressure continues and the price maintains support, a stronger recovery toward higher resistance levels could follow. 📈
Trading Ideas Long $BTC
Entry: 78,000 – 78,600
TP1: 82,000
TP2: 85,000
SL: 76,908.9
TP3: 88,707.8
Long $BTC 👇
272
·
--
Bearish
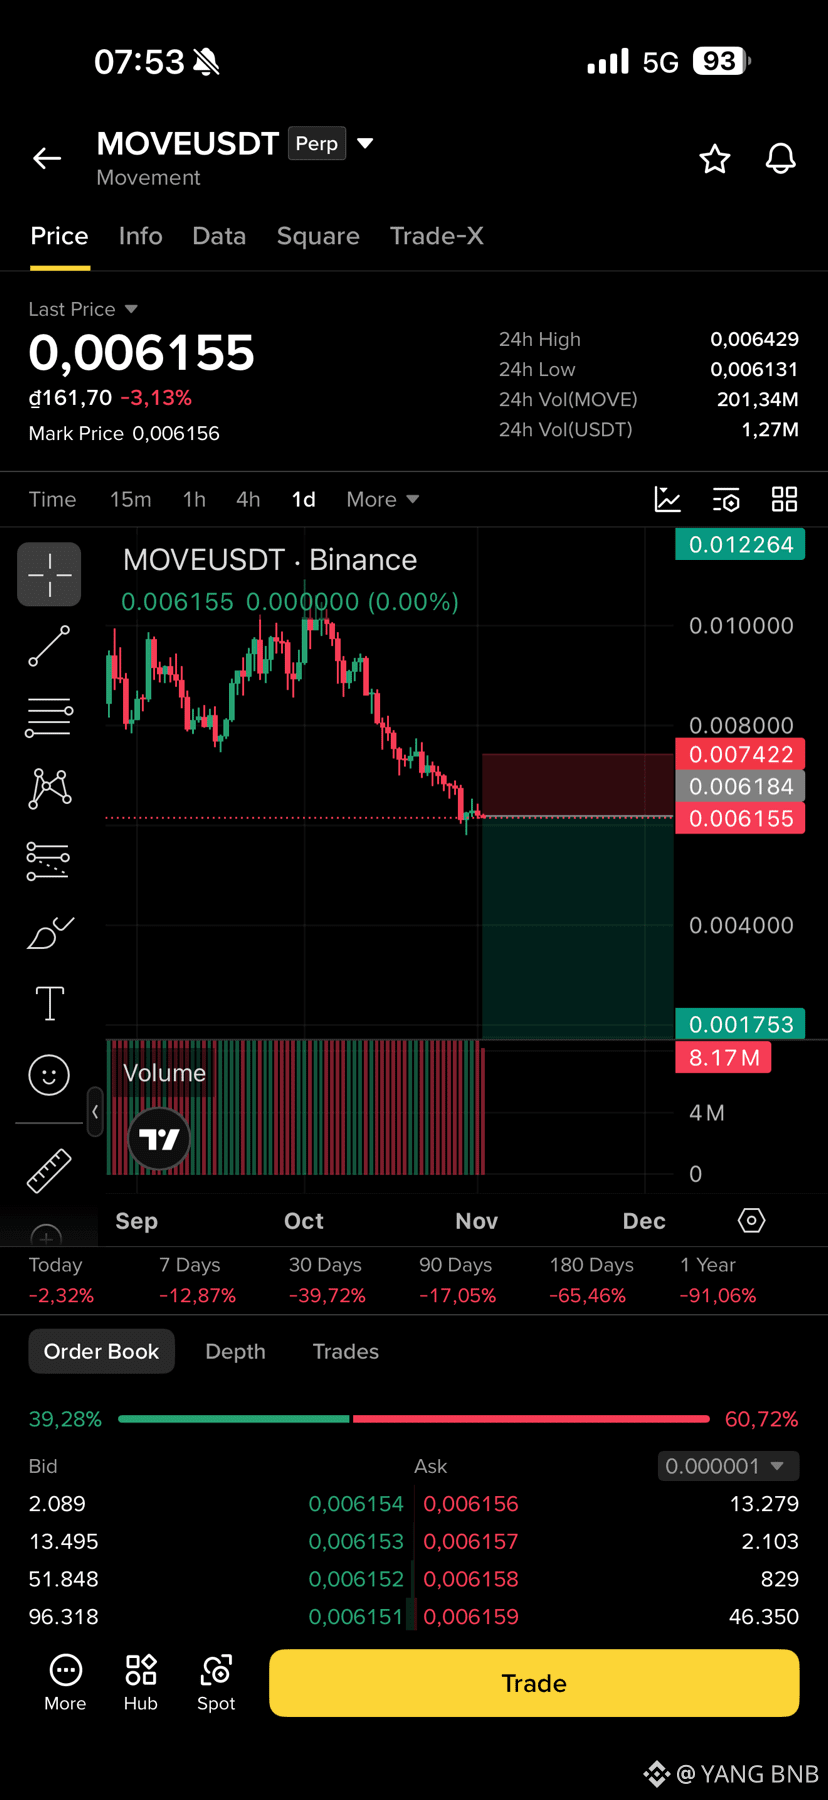
🔥 $MOVE BEARISH MOMENTUM CONTINUES! : Movement is showing persistent selling pressure, with the daily chart forming a clear sequence of lower highs and lower lows. The price has dropped toward the 0.00615 support area, and the overall trend remains strongly bearish. 📉
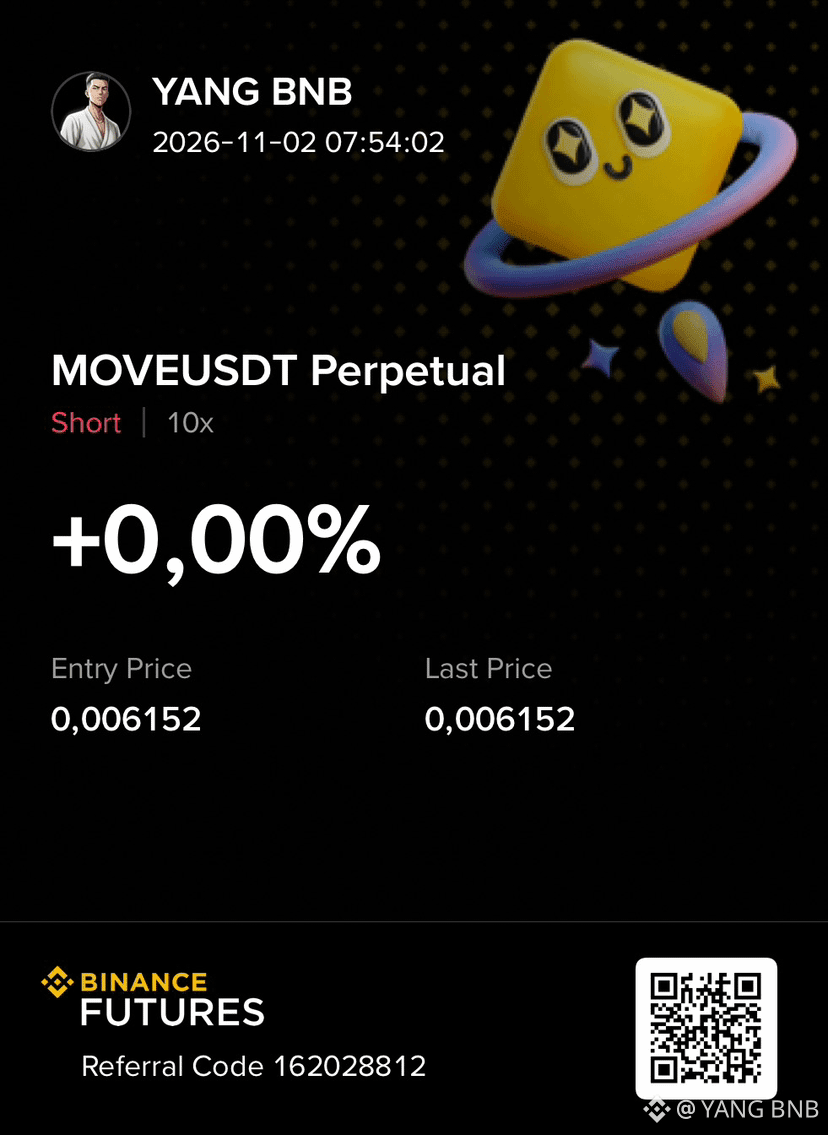
Trading Ideas Short $MOVEUSDT
Entry: 0.00615 – 0.00640
TP1: 0.00580
SL: 0.00742
TP2: 0.00500
TP3: 0.00400
Trade $MOVE here: 👇
{future}(MOVEUSDT)
🔥 $MOVE BEARISH MOMENTUM CONTINUES! : Movement is showing persistent selling pressure, with the daily chart forming a clear sequence of lower highs and lower lows. The price has dropped toward the 0.00615 support area, and the overall trend remains strongly bearish. 📉
Trading Ideas Short $MOVEUSDT
Entry: 0.00615 – 0.00640
TP1: 0.00580
SL: 0.00742
TP2: 0.00500
TP3: 0.00400
Trade $MOVE here: 👇
Trading Ideas Short $MOVEUSDT
Entry: 0.00615 – 0.00640
TP1: 0.00580
SL: 0.00742
TP2: 0.00500
TP3: 0.00400
Trade $MOVE here: 👇
396
·
--
Bearish
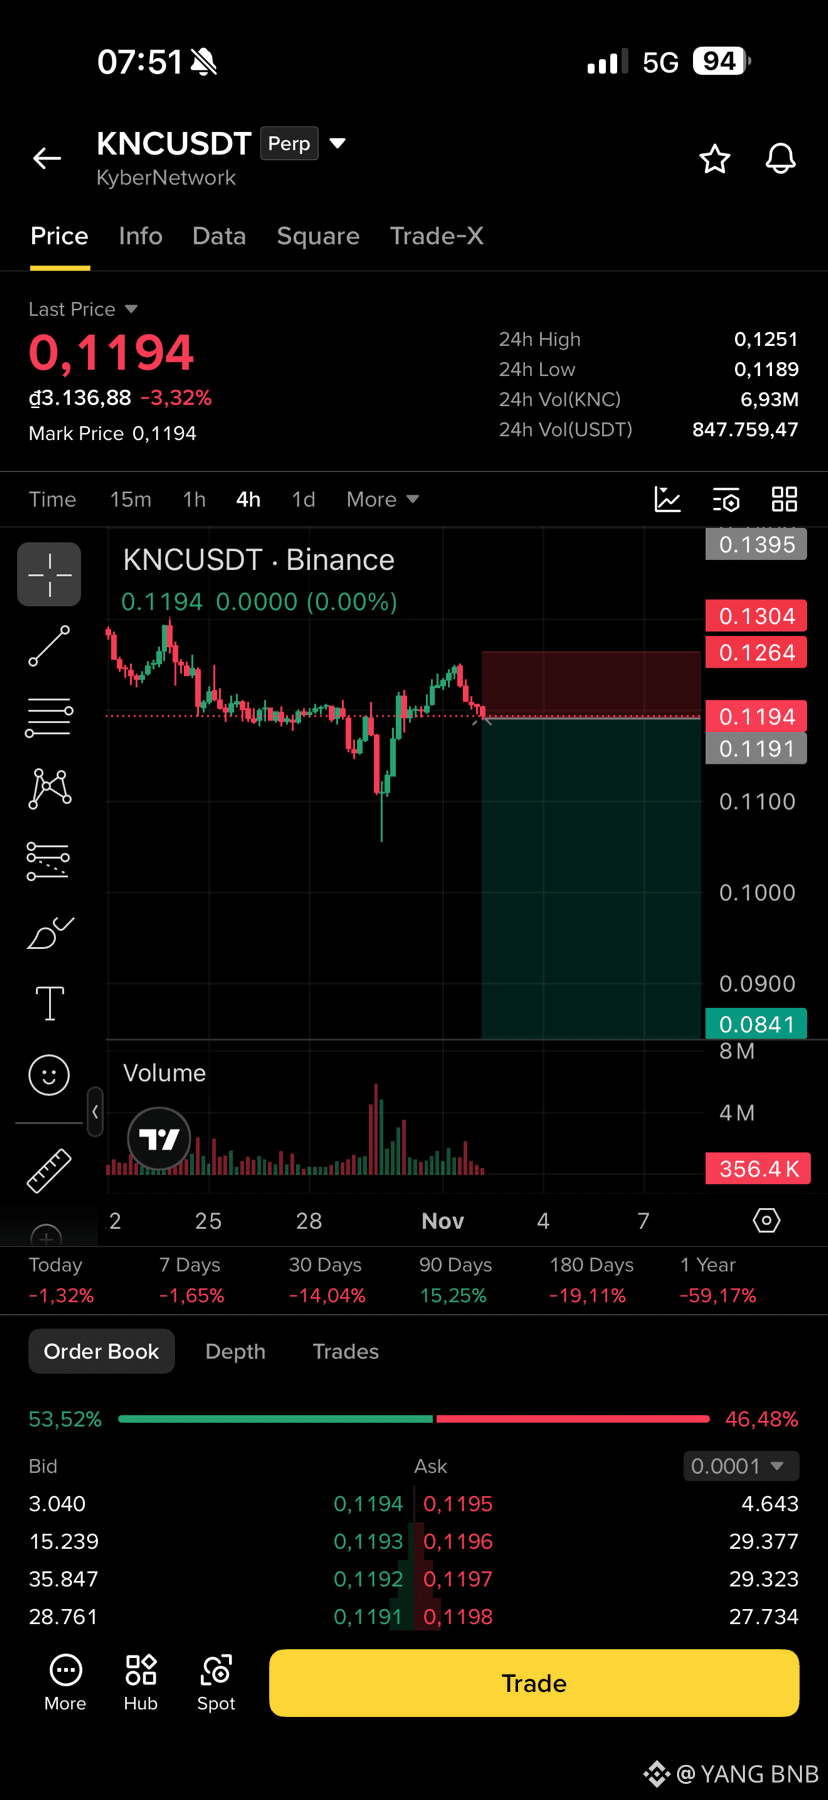
🔥 $KNC BEARISH MOMENTUM IS BUILDING! : Kyber Network is showing weakness after failing to maintain its recent recovery. The price has pulled back from the 0.1250 resistance area, while the 4H chart suggests sellers are gradually regaining control. Another downside move could be coming. 📉
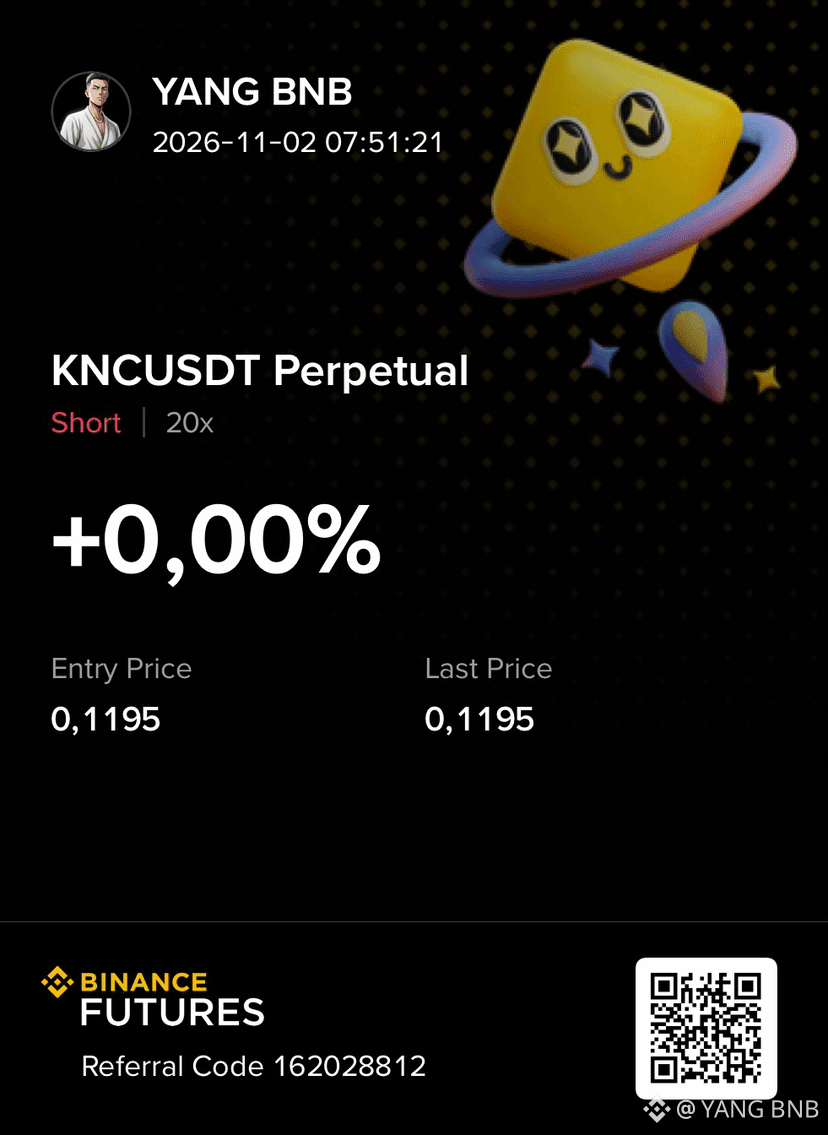
Trading Ideas Short $KNCUSDT
Entry: 0.1190 – 0.1220
TP1: 0.1150
SL: 0.1305
TP2: 0.1100
TP3: 0.1000
Trade $KNC here: 👇
{future}(KNCUSDT)
🔥 $KNC BEARISH MOMENTUM IS BUILDING! : Kyber Network is showing weakness after failing to maintain its recent recovery. The price has pulled back from the 0.1250 resistance area, while the 4H chart suggests sellers are gradually regaining control. Another downside move could be coming. 📉
Trading Ideas Short $KNCUSDT
Entry: 0.1190 – 0.1220
TP1: 0.1150
SL: 0.1305
TP2: 0.1100
TP3: 0.1000
Trade $KNC here: 👇
Trading Ideas Short $KNCUSDT
Entry: 0.1190 – 0.1220
TP1: 0.1150
SL: 0.1305
TP2: 0.1100
TP3: 0.1000
Trade $KNC here: 👇
254
·
--
Bearish
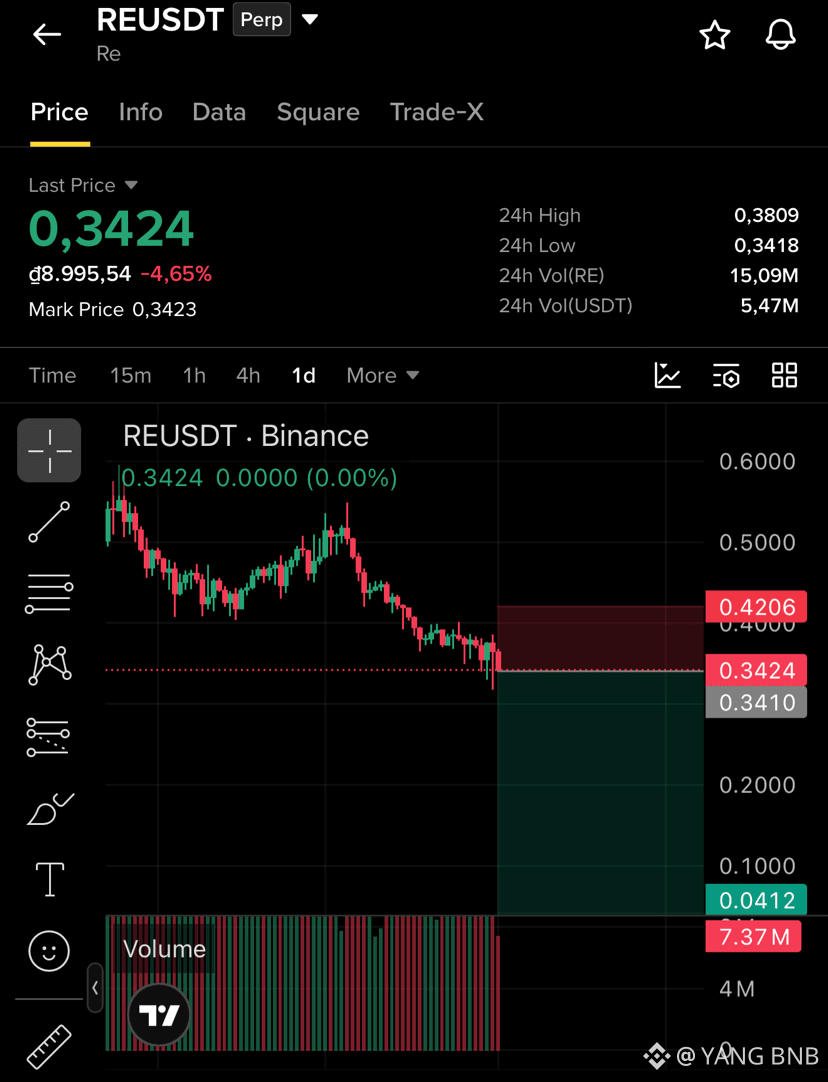
🔥 $RE BEARISH MOMENTUM CONTINUES! : RE is showing a clear bearish structure on the daily chart, with lower highs and lower lows forming consistently. The price is struggling around the 0.34 support area, and another breakdown could open the door for further downside. 📉
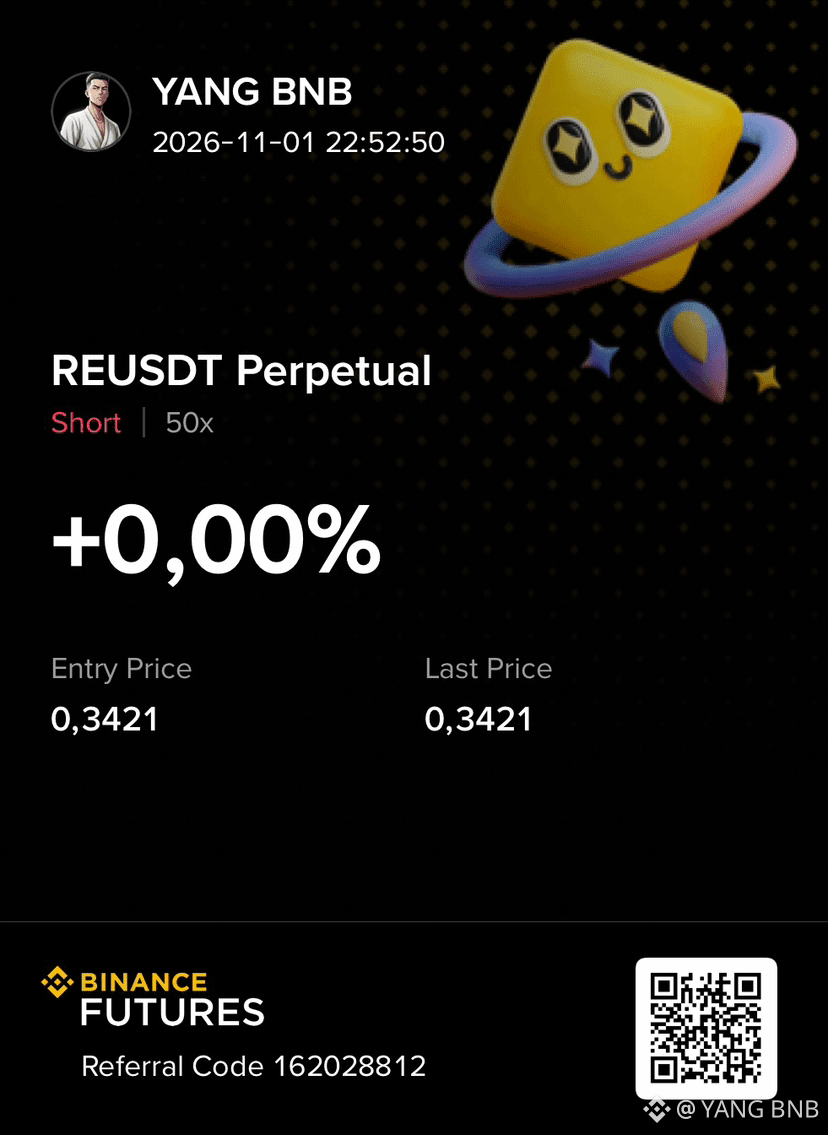
Trading Ideas Short $REUSDT
Entry: 0.3420 – 0.3550
TP1: 0.3000
SL: 0.3800
TP2: 0.2500
TP3: 0.2000
Trade $RE here: 👇
{future}(REUSDT)
🔥 $RE BEARISH MOMENTUM CONTINUES! : RE is showing a clear bearish structure on the daily chart, with lower highs and lower lows forming consistently. The price is struggling around the 0.34 support area, and another breakdown could open the door for further downside. 📉
Trading Ideas Short $REUSDT
Entry: 0.3420 – 0.3550
TP1: 0.3000
SL: 0.3800
TP2: 0.2500
TP3: 0.2000
Trade $RE here: 👇
Trading Ideas Short $REUSDT
Entry: 0.3420 – 0.3550
TP1: 0.3000
SL: 0.3800
TP2: 0.2500
TP3: 0.2000
Trade $RE here: 👇
459
·
--
Bullish
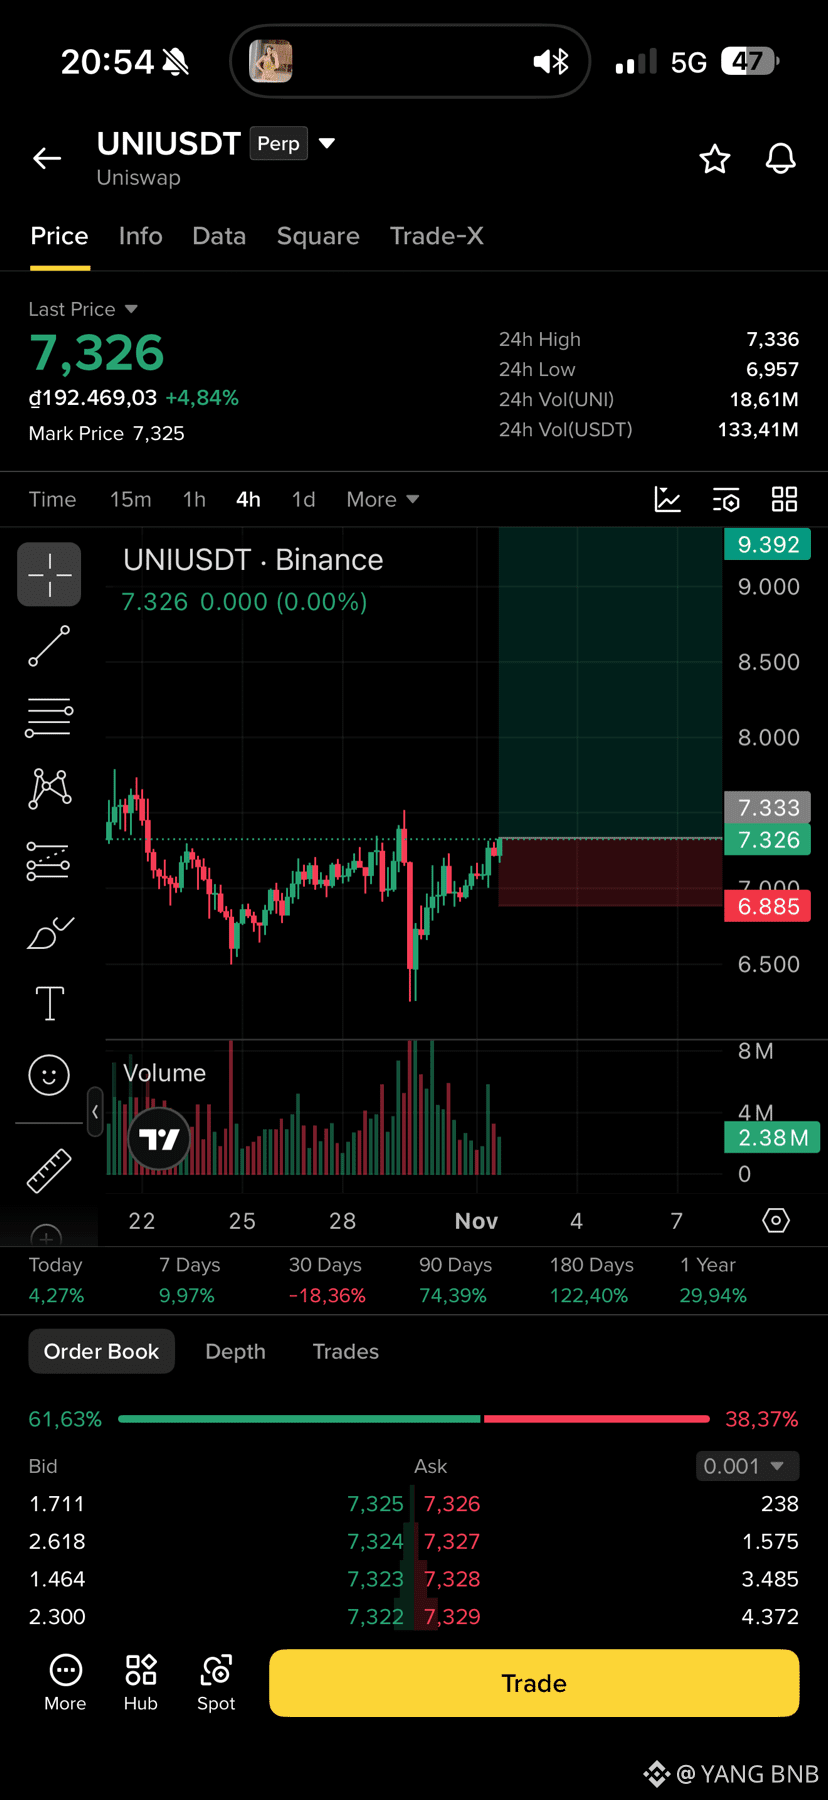
🔥 $UNI BEARISH SETUP IS FORMING! : Uniswap is approaching a key resistance zone after recovering from its recent lows. Despite the latest 4.84% rebound, the price is still facing selling pressure around the 7.30–7.50 area. A rejection here could create another downside opportunity. 📉
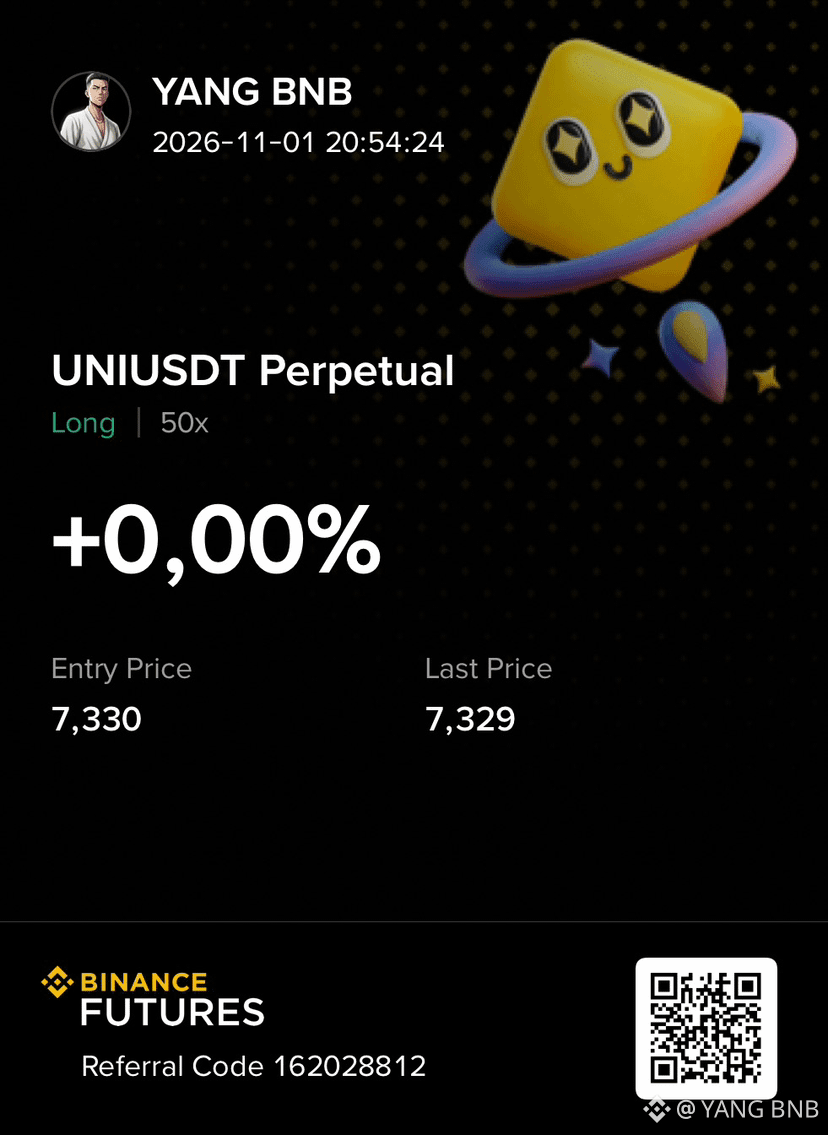
Trading Ideas Short $UNIUSDT
Entry: 7.300 – 7.500
TP1: 7.100
SL: 7.800
TP2: 7.000
TP3: 6.885
Trade $UNI here: 👇
{future}(UNIUSDT)
🔥 $UNI BEARISH SETUP IS FORMING! : Uniswap is approaching a key resistance zone after recovering from its recent lows. Despite the latest 4.84% rebound, the price is still facing selling pressure around the 7.30–7.50 area. A rejection here could create another downside opportunity. 📉
Trading Ideas Short $UNIUSDT
Entry: 7.300 – 7.500
TP1: 7.100
SL: 7.800
TP2: 7.000
TP3: 6.885
Trade $UNI here: 👇
Trading Ideas Short $UNIUSDT
Entry: 7.300 – 7.500
TP1: 7.100
SL: 7.800
TP2: 7.000
TP3: 6.885
Trade $UNI here: 👇
578
Log in to explore more content
Join global crypto users on Binance Square
⚡️ Get latest and useful information about crypto.
💬 Trusted by the world’s largest crypto exchange.
👍 Discover real insights from verified creators.
Email / Phone number
Trending Topics
BinanceRestores28FiatWithdrawals
27,668 views
524 Discussing
Binance Restores Fiat Withdrawals for USD, AED and Three Asian Currencies, Bringing the Total to 28
Binance News
·17 Likes
·7.9k views
BinanceProcesses$4.65BWithdrawals
72,799 views
314 Discussing
HKMALaunchesSAGEAgenticFinanceProject
138 views
27 Discussing